Embed Size (px)
Citation preview

Urban Transportation, Land Use, and Urban Transportation, Land Use, and the Environment in Latin America: the Environment in Latin America:
A Case Study ApproachA Case Study Approach
Lecture 11:Lecture 11:
The Santiago Metropolitan AreaThe Santiago Metropolitan Area

2
Transport System: Brief HistoryTransport System: Brief History z Horse trams and steam trains (to San Bernardo and
Puente Alto) by turn of Century z By 1930s, city has one of most extensive electric
tram networks in South America – 220 kms, 210 passengers/year – Dismantling begun in 1945
z By 1960s (first land regulatory plan) – Plans also laid for Metro system – Construction begun on ring road (Vespucio), Avenida
Kennedy (East to Las Condes) and the PanAmerican Highway

3
Policy ContextPolicy Context z Urban Policy
– Strongly influenced at national level z Specific policy interests fluctuating in time with politics
– 1993 policy-formulation process recs: z Goals: decentralization; environment and quality of life; equity in
access to goods and services; economic growth and modernization; more a balanced distribution of population and economic activity across the country (CED, et al., 1994).
z Measures: capacity building; institutional improvement; strengthened role of local governments (Municipalities); improvement in regional planning instruments and processes; improvements in urban information systems; internalization of external costs, promoting the use of non-motorized transportation and shorter trips, densification and mixing of land uses, “sub-centers”)
z “Ideal” rhetoric, but, nothing formal still written…policy vacuum prevails

4
Policy ContextPolicy Context z Urban Transport Policy
– Strongly influenced at national level z For long time, an ad hoc amalgam of activities at different
government levels – Santiago reaches crisis by the 1970s, early 1980s SECTU,
later SECTRA, is born z Develops, formalizes evaluation techniques, data collection, etc. z Technical, demand- and system-management perspective
(engineering approach); little consideration to land use alternatives as management option
– No formal “policy” exists, “rational” rhetoric disarticulated by different apparent “schools of thought” prevailing among institutions z The “infrastructure camp” v/s the “management camp” z Ultimately determined by who has the money?

5
Today’s Transport Modes & Today’s Transport Modes & InfrastructureInfrastructure
z Cars, Buses (Micros), Trucks Taxis, fixed route taxis (colectivos), Metro, Suburban Rail, Walk, Bike
z Approx. 4,700 kms of roadways – Plus, Vespucio Ring Road and the Pan American Highway
z Two Segregated Busways – 5 km segment and ~10 km stretch
z Differentiated and (in city center) segregated bus stops
z 3 Metro Lines: 40 kms, 51 stations, 68 trains, built at $1.6 billion (US$1999)
z Suburban Rail: 9 stations, 85 kms south to Rancagua

6
NMT FacilitiesNMT Facilities z Wide sidewalks and well-signaled pedestrian facilities increasingly common (especially in heavy commercial areas) z Few bicycle facilities

7
Major Recent Projects in Major Recent Projects in Greater SantiagoGreater Santiago
z Upgrade of Ring Road (Vespucio) in North, Northwest
z Overpass/underpass on Kennedy Highway to the East (Las Condes)
z Major Road upgrades in Southeastern suburbs
z Completion of Metro Line 5 to city center

9
Major Recent Projects in RMMajor Recent Projects in RM z Completion of Route
78 (Autopista del Sol) to Port of San Antonio
z upgrade of Route 57 north to Los Andes (road to Argentina)
z upgrade of Route 68 west to Valparaiso

10
System ManagementSystem Management z UOCT (Operative Traffic Control Unit)
– Traffic Light Operations (1600 intersections) z 80% on pre-established timing (traffic-count based); 16% dynamic
control (SCOOT); 4% sensor-activated
z One-way streets during peak periods z La Restriccion – vehicle restriction, similar to Hoy no
Circula, in place since late 1980s. – Odd-even scheme implemented during pollution months – Initially, aimed to reduce on-street fleet by 20% – In 1993, cars with catalysts exempted – Currently in force 4 March to 31 December
z Includes private cars, trucks, school buses, taxis, buses & trucks (during off peak periods) w/out advanced pollution control techs.
z Currently reduces approx. 8% of cars on any given day z With higher pollution days, can be expanded.

11
System ManagementSystem Management z Using pollution as a force for
“immediate actions” March – December:
– 9 “vias exclusivas” for public transport z During AM Peak (7:30 – 10:00) z Three additional lanes and PM
Peak added during pollution episodes
– “Reversible Lanes” for Private Transport
z Primarily during AM peak

12
Bus System HistoryBus System History z 1970s: Strong state intervention
– Private operators, but all key variables (frequency, routes, fares) under government control
z 1979-1982: Complete deregulation – Part of government neo-liberal reforms – Fares, routes, operations – Problems already evidenced
z 1982-1988: Partial re-regulation – Over routes (particularly in the center city) and vehicle age
z 1988: Complete deregulation, again – Only controls over vehicle quality via inspections

13
Bus System by 1990Bus System by 1990 z Results are in
– Positives: Supply and service area expansion, frequency increase z 1978-1985: Bus and Minibus fleet grew 50% and 75%
(respectively) – Negatives: Decline in occupancy rates (50%), cartel
control of fares and entry (self-regulating “mafia”), old vehicles, poor maintenance, devastating public image (in face of motorization) z By 1991: 13,500 vehicles, average age of 14 years z Bus oversupply estimated at 4,000 vehicles, consuming $24.4
million per year in excess fuel, 10% excess of PM emissions z 10-fold increase in bus fare relative to minimum family wage (77-
87)

14
Early 1990s: The Process of Bus Early 1990s: The Process of Bus System ReformSystem Reform
The Early 1990s – process of reform z Purchase of oldest vehicles on street
– 2,600 vehicles at cost of $14 million
z 18-year old age limit established – Implying further retirement of 2,000 vehicles (91-94)
z Emissions standards – From 1990 to 94: Permitted exhaust opacity levels, 32% ⇒ 9% – 1993: all new engines, EPA-91 – 1996: EPA-94

15
1990 1990 –– The Legal FoundationThe Legal Foundationz Concessioning (public bidding) of routes
where congestion, pollution, and/or safety concerns exist
O-1 D-1
D-2 O-2
Regulated Area
Concessioned Services
Non-Concessioned Services
– Service Terminals (Os and Ds) established
– Routes outside “regulated area” are flexible
– Route and frequency criteria must be met within the “regulated area”
Source: Dourthe et al., 2000.

16
Concession BasisConcession Basis z Routes and Frequencies – Bid must present a fleet
consistent with these requirements z Vehicle Age – lower average age, greater points
– 10-year limit for traditional buses; 14-year-old limit for buses meeting EPA standard
z Vehicle Capacity – higher avg. capacity, more points z Formalization of the operators – with clearly
defined legal representative z Fares – in bid, operator chooses from four possible
fares, lower far, greater points – A formula for fare increases set: a weighted sum that
includes the variation in fuel, tire, labor, US & Brazilian exchange rate & other costs (adjustment indices come from independent agency – INE)

17
Concession StagesConcession Stages z 1992 – 36 month term
– Automatically extendable if certain conditions met, re: vehicle technology and driver remuneration
z 1998 – 60 month term – With automatic 6 month extension by Ministry possible – Additional incentives to improve quality of service
z Operators meeting a minimum percentage of fleet with EPA technology, with automatic transmission, A/C, and minimum fleet % using CNG had right to:
– increase fare by 10% after 1st year, – in the fourth year, extend by an additional five years the term of the
concession
– Due to the variation in demand (peak, off-peak, holidays, vacation periods) – allow predetermined frequency adjustments
– Authority maintains right to alter service requirements based on demand changes over time

18
ResultsResults z “Regulated Area” now 270 km2
z Reduction and modernization of the fleet – 1992: 13,550 vehicles, avg. age 14 – 2000: 9,000 vehicles, avg. age 4 – Investment of US$ 500 million by private sector
z Improved Service Quality – Travel times (despite slightly increased wait time),
comfort, cleanliness, safety, uniformity of service and information
z Pollution. > one-half buses comply with EPA-91/94 z Modernization of buses operators z Fare Stabilization and De-politicization
– Fares remained roughly constant since 1991 (~US$0.30)

19
Evolution in Bus FaresEvolution in Bus Fares
Note: Concessioned buses entered into service at the end of 1991. For the years, 1993, 94, 95, 96 the values are annual average (f are varied during the year)
0
50
100
150
200
250
1978
1980
1982
1984
1986
1988
1990
1992
1994
1996
Fare
(199
7 Pe
sos)
Bus Taxibus Concessioned Bus
Source: Dourthe et al., 2000.

21
Bus Concessions: Some CommentsBus Concessions: Some Comments z Fare Reductions: Actually began before concession
contracts in place (10/92) z Current & Future competition?
– Higher technical requirements (vehicles) imply fewer potential operators z 1998, 97% (280 routes) bid maximum fare: CH$190 z 76% bid for just one route (return of collusion?)
– Competition or price setting by Ministry? z Despite reduced bus fleet size, still apparent excess
capacity – particularly during certain times of day, on certain routes
z Safety, Security – Battle to implement new charging techniques (still unresolved) – Unable to change driver remuneration method – Still competition on the street

22
Passenger Travel DemandPassenger Travel Demand
Trips by Purpose z Work: 36% z School: 32% z Other: 32% z Work and school predominate during
peak periods; others constant across day
Bus Auto Metro Walk Others 0
10
20
30
40
50
60
70
Bus Auto Metro Walk Others
1977 1991
Mode Share: % of All Trips
Not e: M et ro includes all combinat ions
0%
10%
20%
30%
40%
50%
60%
70%
Work Trips School Others
Auto Bus Walk Metro
Modes by Trip Purpose
1991 (last O-D survey) z 8.4 million trips/day z 2.12 trips/person
– 1.91 in poorest HHs – 2.65 in wealthiest HHs
Source: Sectra, 1991.
Source: Sectra, 1991.

23
Vehicle FleetVehicle Fleet
0
10,000
20,000
30,000
40,000
50,000
60,000
1986
19
87
1988
19
89
1990
19
91
1992
19
93
1994
19
95
1996
19
98
2000
Taxi
s, B
uses
, Tru
cks
0
100,000
200,000
300,000
400,000
500,000
600,000
700,000
800,000
900,000
Priv
ate
Vehi
cles
Taxis Buses Trucks Private Vehicles
Fleet Growth Rates: 1986-1996 z Private Vehicles: 6% z Taxis: 7.8% z Buses: 1% z Trucks 6%
Motorization Rate z 1952: 14 private vehicles per 1000 z 1977: 60 private vehicles per 1000 z 2000: 129 private vehicles per 1000 z A.A. Growth 86-96: 4%

24
Wealth, Motorization, Mode ShareWealth, Motorization, Mode Share
0%
10%
20%
30%
40%
50%
60%
Aut
o M
ode
Shar
e
0 50 100 150 200 250 300 350 400
Ve h
icle
s p
er 1
000
Pop.
Auto Mode Share Veh/1000
Motorization Rate & Income z Kain & Liu (1994)
z Income explains >90% of HH vehicle ownership
z Income Elasticity: 1.06-1.16 z Zegras & Gakenheimer (2000) - using
1998 data for entire RM z % HH private vehicle ownership
increases with Avg. HH income at elasticity of 0.82 (r2=70)
Motorization Rate & Mode Share z Kain & Liu (1994)
z Auto ownership explains 96% of auto use z Elasticity of auto mode share to ownership of nearly 1.
z Zegras & Gakenheimer (2000) estimates suggest a short term elasticity of 0.80 and long term of 1.22 z Suggesting that today’s auto mode share roughly 22%-24% of all trips

25
Motorization Rate, Mode Motorization Rate, Mode Share, Trips Share, Trips –– Growth in TimeGrowth in Time
4.2%1.70.95Motorized Trips/Capita
4.4%2.131.14Trips/Capita
3.4%15.8%9.8%Auto Mode share
3%9060Autos/ 1000 Population
Annual Growth
19911977
Source: SECTRA, 1991.

26
Income, Motorization, Mode Share Income, Motorization, Mode Share –– What Future the Bus?What Future the Bus?
0
10
20
30
40
50
60
70
80
< $117
$117
- $208
$208
- 316
$316
- $494
$494
- $750
$750
- $116
0
$116
0 - $ 286
5
> $286
5
Monthly Incom e (US$ 1991)
% o
f All
Trip
s
Walking
Auto
Public Transport
Source: Farah, et al, 1993.

27
Bus System Bus System –– Ongoing ChallengesOngoing Challenges Specific to Private Sector Ownership-Operations z On-Street competition for passengers z Service and fare integration
– Nearly all services run periphery to periphery z Often long, torturous routes, with duplication on dense corridors
z “Formalization” of the companies – Many traits of informal roots remain
Challenges to the System in General z Service & fare differentiation
– Marginal cost pricing possible? – Higher quality service for higher paying patrons?
z Travel & wait time – Bus trip times on average 70% longer than auto
z Overall public perception & status – what role public policy? **For how much longer will the private operators be viable?**

28
Bus System, Suburbanization, EquityBus System, Suburbanization, Equity

29
The Metro: A Public Transport The Metro: A Public Transport “Success Story”?“Success Story”?
0
10
20
30
40
50
60
70
80
0
100
200
300
400
500
600
700
800
KM s o f Track Trains A vg. Daily P assengers (,000s)
z Generally increasing ridership with supply expansion z Does it offer “alternative to the car”?
z Metro’s data shows that within “areas of influence” public transport mode share goes up to 76% (Metro 52%, bus 24%) (Metro, 2000)
z At aggregate comuna level – controlling for auto ownership – public transport mode share positively correlates with Metro presence z R2 = 60% (Zegras & Gakenheimer, 2000)
30
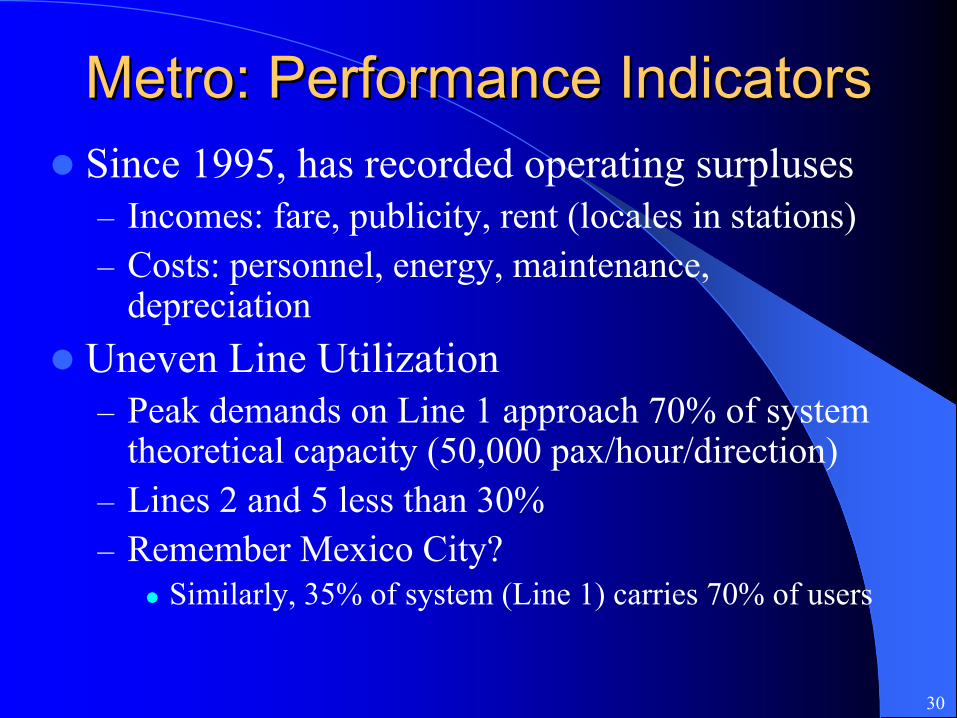
Metro: Performance IndicatorsMetro: Performance Indicators z Since 1995, has recorded operating surpluses
– Incomes: fare, publicity, rent (locales in stations) – Costs: personnel, energy, maintenance,
depreciation z Uneven Line Utilization
– Peak demands on Line 1 approach 70% of system theoretical capacity (50,000 pax/hour/direction)
– Lines 2 and 5 less than 30% – Remember Mexico City?
z Similarly, 35% of system (Line 1) carries 70% of users

31
Line 1 “Success” Line 1 “Success” –– Land UseLand Use z Seven stations with >25,000 entering pass./day
– Line 2 reaches this level only at terminal stations – Line 5 only at southern terminal station
0
10
20
30
40
50
60
70
1
Pass
enge
rs (,
000s
)
Line 1 Line 2 Line 5
U. de Chile (CBD) Esc. Militar (Eastern Terminus)
La Florida (Southern Terminus)
Lo Ovalle (Southern Terminus)Cal y Canto
(CBD Terminus)
z Line’s 2 and 5 – cost savings measures (initial construction costs) reduce integration with urban fabric
z Great majority of Metro trips start and end as pedestrian trips (generally >65%)

33
Metro: Service IntegrationMetro: Service Integration z Despite minimal service integration, buses and
colectivos provide important peak feeder service – 8-9 AM: 26% and 13%, respectively – 6:30 – 10 PM: 23% and 16%, respectively
z Integration terminals figure prominently in future expansion plans (so-called mini-extensions) – Hope, in part, to attract private capital
z As in case of Line 5 Terminal – Bellavista de la Florida

34
BellavistaBellavista de La Floridade La Florida
Metro expropriated land for a Metrobus transfer station and then, via a concession, granted development rights to a supermarket chain.
z Company invested ~ US$3.7 million to develop the underground transfer station in return for the rights to use the surface above for 40
•

35
Other Travel ModesOther Travel Modes z ~3% (& growing) of trips are school bus trips z Colectivos have increased from <2% in 1991 to 6%
today – Distance-based fare, important services to lower density
suburbs z Walking accounts for 20% of trips
– 33% of school trips; 20% of “other” trips – Average time: 16-19 minutes
z Average distance ~1.5 kms z Implies lower total accessibility for the poor
z Despite favorable topography, climate bike use low (1.6% all trips) – A recent study (Ortuzar et al 1999) suggests a bike network of
3.2 km bikeways/km2 would increase bike share to 6% z Primarily replacing bus trips

36
Transport, Land Use, Urban Form Transport, Land Use, Urban Form -- RoadsRoads
z Anecdotally, road investments have played/ important role in development – in east, southeast suburbs – Industries on west, northwest Ring Road
z Highways “cause” expansion? – Lo Barnechea (in East) began developing before major
road infrastructure expansion z Developers lobbied for expansion, development subsequently
accelerated – La Florida suburbanized before radial road upgrades – Chacabuco (Province directly to North) development
currently constrained by lack of road infrastructure

37
Transport, Land Use, Urban Form Transport, Land Use, Urban Form -- MetroMetro z Eastern portion of Line 1 coincided with urban
transformation and densification (Providencia, Las Condes corridor) – But, no comparable results on poorer, western segment in east,
southeast suburbs z Line 2 criticized for not generating land effects z Line 5 – too soon to judge?
– Bellavista de La Florida mall already existed z Kain & Liu (1994): Metro encourages suburbanization
– But, only if Metro investments did not substitute for other urban transport investments z Seems that, actually, Metro did take away from other investments
– Did Line 1 “plant the seeds of its own destruction” by reducing importance of CBD? z Ridership profile suggests opposite effects

38
Transport, Land Use, Urban FormTransport, Land Use, Urban Form
z What role externalities? – Air pollution, noise, accidents
z Major traffic corridors, particularly running through the intermediate comunas – Does the increased accessibility implied by this
traffic more than offset than negative effects? – Or, is it further fueling urban outgrowth?

39
Land Use, Urban Form, TransportationLand Use, Urban Form, Transportation z Predominant urban form of Greater Santiago (remember
last week’s slides on land uses) – historical concentration of trip attractions in city center; – socio-economic segregation, which produces long work,
school, and shopping trips from lower income neighborhoods to upper income neighborhoods
• Better concentration of employment, shopping, education opportunities – functional segregation, which results in many, often long, trips
– from less-equipped zones to those with greater diversity of land uses
z Jobs/Housing Balance (1991) (Kain & Liu, 1994) – 13 comunas 0.8-1.8; 19 comunas 0.2-0.7
z School/Housing Balance – Relative imbalance: school trips have been important transport
policy focus z Linked to prestige, long-run social contact “externalities”

40
Land Use, Urban Form, TransportationLand Use, Urban Form, Transportation Recent Trends (as seen last week) z The migration of the CBD
– Providencia, Las Condes, Vitacura (East) – Huechuraba, Quilicura (North) and Pudahuel
(West, near airport) z The emergence of the “edge city”
– Potential to reduce suburb-center city travel – Potential to increase suburb-suburb travel

41
Land Use, Urban Form, TransportationLand Use, Urban Form, Transportation z The Local factors (3 D’s)
– Kain & Liu (1994) find little evidence of effects z Aggregate comuna-level data of density and mode share
– Similar analysis at aggregate comuna level (Zegras & Gakenheimer, 2000) z Negative correlation between relative mix of land uses and
walking – Implies that the poorer comunas (walking-dependent) have lower
levels of overall accessibility
z More detailed, micro-level data required for more conclusive analysis – Rich area for future research….

43
T, LT, L--U & EnvironmentU & Environment Air Pollution z RM in violation of standards
– TSP, PM10, Ozone, CO z Risk of violation for NO2 z Transport is principal source of PM10, CO
and – virtually – Ozone – Especially since ozone is apparently NOx
constrained

44
Transport and Air Pollution in RMTransport and Air Pollution in RM
1546719286*All Vehicle Types
0.40.30Motorcycles
521323Buses
642082Trucks
.55411.1Taxis
33434721.5Cars and Light Trucks
SO2VOCsNOxCOPM10Vehicle Type
* Includes Road Dust. Source: CONAMA, 1998

45
AQ Management AQ Management –– HistoryHistory z 1978 – first AQ norms z 1988 – first monitoring stations z 1990 – Special Commission for AQ established z 1992 – first catalyst vehicles introduced z 1994 – CONAMA created
– national environment legislation passed z 1996 – RM pollution violations “declared” z 1997 – AQ management plan published z 1997 – expansion of monitoring stations z 1997 – development of first AQ prediction model z 1998 – massive industrial conversion from diesel to natural gas z 1998 – “emergency” levels revised, MC standards set z 1998 – use of AQ model for formally anticipating episodes z 2001 – introduction of “city diesel” (0.03% sulfur)

46
RM Air Pollution in an RM Air Pollution in an International ContextInternational Context
0
50
100
150
200
250
300
350
Ozono CO PM10
Sao Paulo Los Angeles Santiago
Cd. de México
Note: Various years b/w 1995-98 Source: Lents, et al, 1999.
Number of Times Norm Exceeded in One Year

47
RM Air Pollution in an RM Air Pollution in an International ContextInternational Context
Note: Various years b/w 1995-98 Source: Lents, et al, 1999.
Maximum Pollution Levels Reached
0
100
200
300
400
500
600
700
Ozon (ug/m3) CO (ppdm) PM10 (ug/m3)
Sao Paulo Los Angeles Santiago Cd. de México

48
RM Air Pollution in an RM Air Pollution in an International ContextInternational Context
Source: Lents, et al, 1999.
US Cities & Santiago: Maximum CO Levels Reached
0
2
4
6
8
10
12
14
16
18
20
ppm
Santiago Los Angeles Denver Houston Atlanta
1994 1995 1996 1997 1998 1999

49
RM Air Pollution in an RM Air Pollution in an International ContextInternational Context
Source: Lents, et al, 1999.
US Cities & Santiago: Maximum Ozone Levels Reached
0
0.05
0.1
0.15
0.2
0.25
ppm
Santiago Los Angeles Houston Atlanta Denver
1994 1995 1996 1997 1998 1999

50
RM Air Pollution in an RM Air Pollution in an International ContextInternational Context
Source: Lents, et al, 1999.
US Cities & Santiago: Average PM10 Levels: 1997-99
0
20
40
60
80
100
120
ugm/m 3
Santiago Los Angeles Houston Denver Atlanta

51
RM Air Pollution in an RM Air Pollution in an International ContextInternational Context
Source: Lents, et al, 1999.
Percentage Contribution of Mobile Sources
0
10
20
30
40
50
60
70
80
90
100
Porcentaje del Total de emisiones
CO VOC NOx PM10 SOx
Sao Paulo Los Angeles Santiago Cd. de México
52
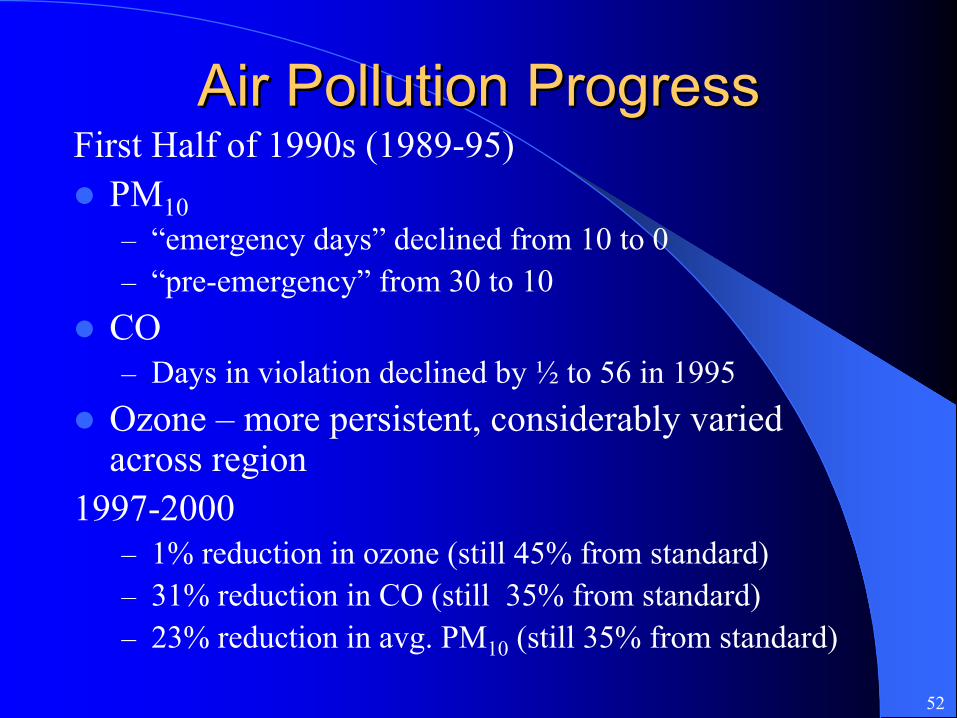
Air Pollution ProgressAir Pollution Progress First Half of 1990s (1989-95) z PM10
– “emergency days” declined from 10 to 0 – “pre-emergency” from 30 to 10
z CO – Days in violation declined by ½ to 56 in 1995
z Ozone – more persistent, considerably varied across region
1997-2000 – 1% reduction in ozone (still 45% from standard) – 31% reduction in CO (still – 23% reduction in avg. PM10 (still 35% from standard)
35% from standard)

53
Episode DefinitionEpisode Definition
ICAP Category ICAP
PM10 ug/m3 (24 hrs.)
Level Episode
0-100 Good
0 0 0 -
101-200 Regular
100 150 0 -
201-300 Bad
200 195 1 Alert
301-400 Critical
300 240 2 Pre-Emergency
401-500 Dangerous
400 285 2 Pre-Emergency
>501 Excede 400 330 3 Emergency
Based on PM Concentration: Index of Air Quality for Particulate Matter (ICAP)
55
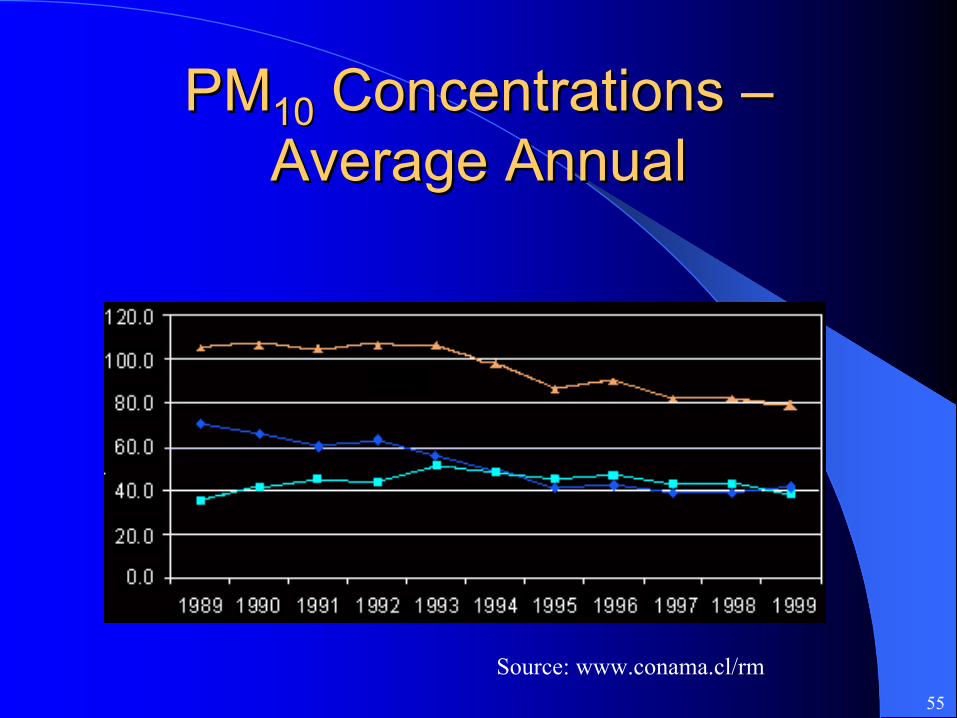
PMPM1010 Concentrations Concentrations –– Average AnnualAverage Annual
Source: www.conama.cl/rm

56
Recent Recent History: History:
EpisodesEpisodes
Annual Episodes
Monthly Distribution
Source: www.conama.cl/rm

57
T, LT, L--U, Environment U, Environment –– Other ConcernsOther Concerns z Land conversion – loss of agricultural land, pressures on
wetlands, loss of fragile foothills – Implications for erosion, flood control, species loss, micro-climate
z Water pollution, depletion – untreated residential and industrial sewage, nitrate deposition, groundwater depletion (esp. Chacabuco)
z Noise pollution – 80% of population living or working on principal arterials at risk of hearing loss (as of 1989) – 70% of residential, mixed use land inadequate for these uses due to
noise z Solid waste disposal – 80% of domestic waste makes it to
landfills, but most industrial waste disposed illegally, waste growing 2% year
z Open spaces – less than 2.5% of urbanized area dedicated to open space (40% less than international norms)

58
The Public Intervention SpaceThe Public Intervention Space z Finance
– Taxes, transfers, subsidies, impact fees z Planning Interventions
– Urban and Regional Plans, Sectoral Plans z Impact Studies
– Transport System Impact Studies, Environmental Impact Studies, Urban Impact Studies.

59
Public FinancePublic Finance Central Government
– Still most important government level z 95% of all taxes collected z Major investor, redistributive role, rule-setting role for
Municipal government revenue-raising – Revenues: 60% from VAT and other consumption
taxes; 30% through income taxes; 12% through customs duties
– Essentially neutral spatial effects – Apparent RM subsidy to other regions (via transfers to
Regional, Municipal governments

60
Public FinancePublic FinanceRegional Government z No revenue-raising capacity z Fully dependent on transfers from Central Government
– FNDR (Fondo de Desarrollo Regional) z Redistributional
– ISAR (Inversion Sectorial de Asignacion Regional) z Assigned to Ministry and Region, GoRe determines where to spend
from Ministry-approved projects in roads, housing – IRAL (Inversion Sectorial de Asignacion Local)
z To be funneled through regional governments to Municipalities
z In RM, 1993-97: FNDR+ISAR+IRAL = $140 million – FNDR(44%), ISAR (44%), IRAL (14%) – Heavier relative focus outside of Greater Santiago
z Ongoing plans to decentralize investment decision-making – But, as of 1998 regional funds account for just 8% of total public
investments in RM – Furthermore, who really controls the ISAR?

61
Public FinancePublic Finance Municipal Government z Property Tax
– Absent transfers, single largest source of local revenues (76%) – Collected by Central Government – Despite law, very infrequent re-appraisals – Slightly progressive structure
z Vehicle Registration Fees (permiso de circulacion) – Buoyant – 1% to 4.5% of vehicle value – Even after transfers to FCM, important source of Municipal revenues –
i.e., 20% in Providencia z Business Licenses
– Santiago, Providencia, Vitacura, Las Condes must contribute 55%-65% of fees to FCM
z FCM (Fondo Comun Municipal) – redistributive mechanism – 60% property taxes, 50% vehicle registrations, other fees – Even after redistribution, riches comunas 8x income/capita than poorest

62
Public FinancePublic Finance Transport Finance z Road user revenues (Gas tax, registration fees) apparently more
than cover expenditures – Apparent subsidy to Metro – Does not take into account external costs
z Much rhetoric, little movement on road-pricing – Legislation stalled in Congress
z Infrastructure concessions – PanAmerican Highway, Costanera Norte, Radial Nor-Oriente
z Metro – Infrastructure financed by Central Government – Operations covered by revenues – Some minimum private sector participation (Bellavista de La Florida),
possibly increasing in future

63
PlansPlans z PRDU (Regional Plan for Urban Development
– A guiding instrument, created by Seremi-MINVU – Non-existent in practice
z Inter-Comunal (PRMS), 1960, 1994, Modifications – Created by Seremi-MINVU – General land use zoning, growth boundaries, densities, major
infrastructure rights of way – 1994 Plan
z Sets UGB, raises densities (city-wide to 150/hectare), specifies land use zones, establishes greenspaces, preservation zones, “sub” centers
z Modified in 1997 to open up the Province of Chacabuco

65
Regional Plans Regional Plans -- CommentsComments z Chacabuco Province
– Plan adds 35% (19,000 has) to metro area’s current urban area
– Province actually contains 190,000 has….. z Do financial pressures/interests over-ride all
plans? – Expose inherent conflicts/contradictions
z What about coordination with other plans (i.e., various transport plans, environment plans)
z What about the PRI being developed for the South of the RM?

66
The Growth BoundaryThe Growth Boundary z In 1994 PRMS, modified in 1997 with Chacabuco
– Enforced through provision of public infrastructure z Existence too short to gauge true impacts on land
markets z Probably slowed growth that otherwise might have
occurred – “bought time” for creation of other instruments – Lessened impact of the Law of Agricultural Parcels
z Future role: depends on future modifications….