Embed Size (px)
DESCRIPTION
Santos Brito - Administração. Inglês.
Citation preview

Available online at
http://www.anpad.org.br/bar
BAR, Rio de Janeiro, v. 9, Special Issue, art. 6, pp. 95-117, May 2012
Toward a Subjective Measurement Model for Firm Performance
Juliana Bonomi Santos *
E-mail address: [email protected]
Lancaster University Management School
Lancaster, UK.
Luiz Artur Ledur Brito
E-mail address: [email protected] Fundação Getúlio Vargas – EAESP/FGV
São Paulo, SP, Brazil.
* Corresponding author: Juliana Bonomi Santos
Management Science Department, Lancaster University Management School, Lancaster University, Lancaster,
LA1 4YX, UK.
Copyright © 2012 Brazilian Administration Review. All rights reserved, including rights for
translation. Parts of this work may be quoted without prior knowledge on the condition that
the source is identified.
J. B. Santos, L. A. L. Brito 96
BAR, Rio de Janeiro, v. 9, Special Issue, art. 6, pp. 95-117, May 2012 www.anpad.org.br/bar
Abstract
Firm performance is a relevant construct in strategic management research and frequently used as a dependent
variable. Despite this relevance, there is hardly a consensus about its definition, dimensionality and
measurement, what limits advances in research and understanding of the concept. This article proposes and tests
a measurement model for firm performance, based on subjective indicators. The model is grounded in
stakeholder theory and a review of empirical articles. Confirmatory Factor Analyses, using data from 116
Brazilian senior managers, were used to test its fit and psychometric properties. The final model had six first-
order dimensions: profitability, growth, customer satisfaction, employee satisfaction, social performance, and
environmental performance. A second-order financial performance construct, influencing growth and
profitability, correlated with the first-order intercorrelated, non-financial dimensions. Results suggest dimensions
cannot be used interchangeably, since they represent different aspects of firm performance, and corroborate the idea that stakeholders have different demands that need to be managed independently. Researchers and
practitioners may use the model to fully treat performance in empirical studies and to understand the impact of
strategies on multiple performance facets.
Key words: firm performance; confirmatory factor analysis; measurement model; subjective indicators.

Toward a Subjective Measurement Model 97
BAR, Rio de Janeiro, v. 9, Special Issue, art. 6, pp. 95-117, May 2012 www.anpad.org.br/bar
Introduction
Rigorous construct measurement is critical for the advance of science, particularly when the
variables of interest are complex or not observable. Paradoxically, strategic management has been criticized for not giving this topic a high priority (Boyd, Gove, & Hitt, 2005). The lack of
measurement accuracy affects quantitative research quality and masks true relationships (Venkatraman
& Grant, 1986).
This is particularly critical in the case of firm performance, one of the most relevant constructs
in the field (Rumelt, Schendel, & Teece, 1994), and a construct commonly used as the final dependent variable (Richard, Devinney, Yip, & Johnson, 2009) in various fields (Cho & Pucik, 2005; Sila &
Ebrahimpuor, 2005; Wiklund & Shepherd, 2003). Despite its relevance, research into firm
performance suffers from problems such as lack of consensus, selection of indicators based on
convenience and little consideration of its dimensionality (Combs, Crook, & Shook, 2005; Crook, Ketchen, Combs, & Todd, 2008; Richard et al., 2009). Many studies measure firm performance with a
single indicator and represent this concept as unidimensional, even while admitting its
multidimensionality (Glick, Washburn, & Miller, 2005). If several dimensions exist, a researcher should choose the dimensions most relevant to his or her research and judge the outcomes of this
choice (Richard et al., 2009). Ray, Barney and Muhanna (2004) stress this, warning against the
difficulties of testing the resource based theory (RBT) using aggregated measures of performance and suggesting the use of indicators directly connected to the resources under analysis. As such, the
strategic management field clearly needs a clearer conceptualization of firm performance, discussions
about its dimensions and better measurement efforts. To make a contribution to these issues, we
propose and test a multidimensional measurement model of firm performance in this paper.
We grounded our model in the stakeholder theory (Freeman, 1984) and carefully selected a list
of indicators to represent the concept of firm performance. We designed the measurement model to allow comparison across firms in the medium-term and tested it in a sample of senior managers and
board members of Brazilian companies. We used subjective measures, but not for convenience. These
measures are preferable when the focus is on inter-firm comparison (Ketokivi & Schroeder, 2004), since recording standards of objective indicators vary across firms and industries. They also allow for
the assessment of non-financial criteria (Richard et al., 2009). Their use is warranted since they have
been proven to be positively associated with objective measures (Dawes, 1999; Forker, Vickery, &
Droge, 1996; Venkatraman & Ramanujam, 1987; Wall et al., 2004). We identified six different dimensions of performance with good psychometric properties and further explored alternative second
order constructs.
Our results may be useful for research and practice. The scales can be used by researchers interested in measuring firm performance across industries with subjective indicators, addressing the
Boyd, Gove, and Hitt (2005) call for rigor. They may be particularly useful when other subjective measures are already being collected. The dimensional structure could also help scholars select
performance indicators for specific research problems that comprehensively cover the relevant
dimensions of performance related to their investigation. The model can contribute to closing the gap
between academia and management practice. As Richard, Devinney, Yip, and Johnson (2009, p. 722) put it: “we may not be measuring the performance to which managers are managing”. Practitioners
may also use this understanding of performance dimensionality to judge the broader impact of their
decisions and actions. They too could use the measures to control a company’s position in the competitive environment.
This paper is organized as follows. We start the literature review by defining the firm performance domain, differentiating it from a related construct – organizational effectiveness. Next,
we develop the stakeholder approach to firm performance and propose seven dimensions of firm
performance based on this approach. This section ends with a discussion of alternative ways of
combining these seven dimensions in a multidimensional structure of performance. The selection of

J. B. Santos, L. A. L. Brito 98
BAR, Rio de Janeiro, v. 9, Special Issue, art. 6, pp. 95-117, May 2012 www.anpad.org.br/bar
indicators for each dimension and the assessment of validity and reliability follow in the methods and
results sections. Finally, we summarize the findings and implications of the mapped structure and
suggest further research opportunities.
Literature Review
Firm performance domain and definitional challenges
The concept of firm performance needs to be distinguished from the broader construct of
organizational effectiveness. Venkatraman and Ramanujan (1986) offered an enlightening figure of three overlapping concentric circles with the largest representing organizational effectiveness. This
broadest domain of organizational effectiveness includes the medium circle representing business
performance, which includes the inner circle representing financial performance. Organizational effectiveness covers other aspects related to the functioning of the organization as absence of internal
strain and faults, engagement in legitimate activities, resource acquisition and accomplishment of
stated goals (Cameron, 1986a). Business performance, or firm performance as we refer to it in this
article, is a subset of organizational effectiveness that covers operational and financial outcomes.
Although this conceptual proposal of Venkatraman and Ramanujan (1986) is widely referred to
by strategic management scholars (Carton & Hofer; 2006; Richard et al., 2009), the analysis of operationalizations of firm performance used in empirical studies shows a wide variety of approaches
covering this domain partially and in an unbalanced way. Combs, Crook, and Shook (2005) analyzed
all articles published in the Strategic Management Journal between 1980 and 2004 and identified 238 empirical studies that used 56 different indicators. In most cases, financial performance was used
(82%) with accounting measures of profitability being the most common choice (52%). Carton and
Hofer (2006) and Richard et al. (2009) reported a similar picture, analyzing different journals in other
time periods. Both studies reported a rate of indicator per article of close to one. Our own research, which additionally included Brazilian journals and reported in the methods section of this paper,
shows a similar situation.
Another source of confusion is the use of antecedents of performance as performance indicators (Cameron, 1986b). Combs et al. (2005) argue that the operational performance as described by
Venkatraman and Ramanujan (1986) is best viewed as an antecedent of financial performance, mediating the effect of resources. The argument has merit and is quite clear in some cases, like
production efficiency. But in other aspects, like customer satisfaction, the situation is less clear. While
customer satisfaction may be an antecedent of financial performance, is it not a performance outcome,
in itself as well? This depends on how one defines firm performance. Defining performance as the satisfaction of stakeholders (Connolly, Conlon, & Deustch, 1980; Hitt, 1988; Zammuto, 1984) helps to
differentiate between antecedents and performance outcomes. In this case, customer satisfaction is
clearly also an outcome (using the customer – a stakeholder – perspective) and thus part of firm performance.
Two other aspects must be considered when attempting to define performance: its time frame and its reference point. It is possible to differentiate between past and future performance; past
superior performance does not guarantee that it will remain superior in the future (Carneiro, 2005).
Another issue related to time is the duration of the interval (short, medium or long term) considered.
The reference against which performance is being measured, e.g. the industry average, the results of main competitors, an established target, or past performance (Carneiro, Silva, Rocha, & Dib, 2007), is
also important. Comparisons in relation to targets and past performance indicate the efficiency and
evolution of the company. However, they are not suitable for comparing companies from different sizes and industries. Using the average value of the industry or of the main competitors as the baseline
indicates companies’ competitive position and may be more useful for strategic analyses.

Toward a Subjective Measurement Model 99
BAR, Rio de Janeiro, v. 9, Special Issue, art. 6, pp. 95-117, May 2012 www.anpad.org.br/bar
The definition of firm performance and its measurement continues to challenge scholars due to its complexity. In this paper, we attempt to contribute to this effort by creating and testing a subjective
scale of performance that covers the domain of business performance in the words of Venkatraman and Ramanujam (1986). We base our work in the stakeholder theory, which allows distinguishing
between performance antecedents and outcomes. It also provides a conceptual structure to define
performance indicators and dimensions. We also made choices in relation to time and reference point.
Our scale measures past, medium-term performance, and compares the firm to the average competitors in the industry.
A stakeholder approach to firm performance
The fact that profit and growth are relevant motifs for the existence of a business firm and must
be included in any attempt to measure performance is indisputable. The question is: what else is
relevant and should be considered as well? In this case, stakeholder theory (Freeman, 1984) can help.
Measuring performance under this conceptualization involves identifying the stakeholders and defining the set of performance outcomes that measure their satisfaction (Connolly et al., 1980; Hitt,
1988; Zammuto, 1984).
The stakeholder theory offers a social perspective to the objectives of the firm and, to an extent, conflicts with the economic view of value maximization. Such ontological discussion is outside the
scope of this paper; yet the stakeholder theory has found its way into the corporate and academic world. It is possible to see its influence in corporate annual reports. The use of stakeholders’
satisfaction as firm performance was also adopted by a large number of different authors (Agle,
Mitchell, & Sonnenfield, 1999; Clarkson, 1995; Kaplan & Norton, 1992; Richard et al., 2009;
Venkatraman & Ramanujam, 1986; Waddock & Graves, 1997a). Besides offering a way to decide what performance is in a comprehensive way, the use of this theory allows one to resolve the issue of
differentiating between performance antecedents and outcomes. Performance measures assess the
satisfaction of at least one group of stakeholders. This conceptualization of firm performance is applicable across different companies, as remarked by Carneiro, Silva, Rocha, and Dib (2007),
allowing one to differentiate between high and low performers in the eyes of each stakeholder.
Freeman (1984, p. 46) defines a stakeholder as “any group or individual who can affect or is affected by the achievement of the organization’s objectives”. Taken literally, this definition can
include an unmanageable number of constituencies. Clarkson (1995) suggests some important groups.
Shareholders and employees, for example, should always be present in any analysis. Other primary stakeholders are suppliers and customers, since they have a direct exchange relationship with the firm.
Secondary stakeholders have indirect relationships with the firm, but are clearly affected by its actions,
mainly in terms of the social or environmental consequences. Donaldson and Preston (1995) list several classes: governments, trade associations, communities and political groups. In addition, it can
be argued that each stakeholder has its own agenda in relation to the company and values a particular
set of goals (Fitzgerald & Storbeck, 2003). Pleasing all parties equally may be an unachievable task,
so managers need to prioritize. Mitchell, Agle and Wood (1997) offered a method to identify and judge the salience of the stakeholders relevant to a firm. They used three concepts to do this: the power
the stakeholder has over the firm; the legitimacy of the stakeholders’ claims; and the urgency of
stakeholders’ demands. Their final model identifies seven classes of stakeholders depending on combinations of these concepts.
One of the most important conclusions is that stakeholder identification and salience are dependent on the firm in question, on its context and time. Stakeholder selection challenges any
measurement and indicates a limitation of the approach; yet some stakeholders are common across
firms. We addressed this issue selecting only stakeholders cited in the 2008 annual reports of 15
leading Brazilian companies: shareholders, customers, employees, government and society. Next, we discuss possible measures of stakeholders’ satisfaction.

J. B. Santos, L. A. L. Brito 100
BAR, Rio de Janeiro, v. 9, Special Issue, art. 6, pp. 95-117, May 2012 www.anpad.org.br/bar
Possible facets of firm performance
Superior financial performance is a way to satisfy investors (Chakravarthy, 1986) and can be
represented by profitability, growth and market value (Cho & Pucik, 2005; Venkatraman &
Ramanujam, 1986). These three aspects complement each other. Profitability measures a firm’s past ability to generate returns (Glick et al., 2005). Growth demonstrates a firm’s past ability to increase its
size (Whetten, 1987). Increasing size, even at the same profitability level, will increase its absolute
profit and cash generation. Larger size also can bring economies of scale and market power, leading to
enhanced future profitability. Market value represents the external assessment and expectation of firms’ future performance. It should have a correlation with historical profitability and growth levels,
but also incorporate future expectations of market changes and competitive moves.
Customer and employee satisfaction are two further aspects to consider. Customers want companies to provide them with goods and services that match their expectations (Fornell, Johnson,
Anderson, Cha, & Bryant, 1996). To do that, companies must understand their needs, avoid defects and improve the perceived quality and value added by their offerings. Customer satisfaction increases
the willingness-to-pay and thus the value created by a company (Barney & Clark, 2007). Employees’
satisfaction is related to investments in human resources practices. This group tends to value clearly
defined job descriptions, investment in training, career plans and good bonus policies (Harter, Schmidt, & Hayes, 2002). The satisfaction of these stakeholders, according to Chakravarthy (1986),
translates itself into a firm’s ability to attract and retain employees and lower turnover rates.
Indirect stakeholders, like governments and communities, are affected by a number of firm’s actions, especially social and environmental ones. Social and environmental performance can be
considered a way to satisfy communities (Chakravarthy, 1986) and governments (Waddock & Graves 1997a). Some activities associated with the satisfaction of these groups are safe environmental
practices, increased product quality and safety, ethical advertising, minority employment and
development of social projects (Agle et al., 1999; Johnson & Greening, 1999; Waddock & Graves,
1997a, 1997b).
Acknowledging the limitations discussed before, conceptualization of firm performance, as
based on satisfying the stakeholders, can be thought of as having at least seven facets: growth, profitability, market value, customer satisfaction, employee satisfaction, social performance and
environmental performance.
Dimensional models for firm performance
Constructs can be unidimensional or multidimensional. Figure 1 presents two models to
elucidate these possible representations of firm performance (only a few dimensions were used for
simplicity purpose).

Toward a Subjective Measurement Model 101
BAR, Rio de Janeiro, v. 9, Special Issue, art. 6, pp. 95-117, May 2012 www.anpad.org.br/bar
Figure 1. Unidimensional and Multidimensional Representation.
Unidimensionality, the left-side model, implies that all the indicators illustrate the performance
of the firm in an almost interchangeable way. Indicators in this case should be highly correlated. Multidimensionality suggests that each dimension symbolizes one facet of the overall result of the
company, and is represented by a particular group of indicators. Observed indicators of the same
domain should cluster together in one dimension, having higher correlations among themselves than
with indicators of different dimensions. Theoretical perspectives and empirical studies point toward multidimensionality, with multiple dimensions that make up the complex and complete notion of
performance.
Based on the stakeholder theory, unidimensionality would mean that all the stakeholders have similar demands and needs, but this is unlikely (Simerly & Li, 2000). Unidimensionality would be a
simplistic representation for such a complex construct (Cameron, 1986b; Chakravarthy, 1986; Combs et al., 2005; Murphy, Trailer, & Hill, 1996; Seashore & Yuchtman, 1967; Steers, 1975). Additionally,
indicators used to measure different aspects of performance have already been submitted to factor
analysis by several authors who found multidimensional structures (Baum & Wally, 2003; Cho &
Pucik, 2005; Combs et al., 2005; Fornell et al., 1996; Johnson & Greening, 1999; Rowe & Morrow, 1999; Sila & Ebrahimpour, 2005; Sila, 2007; Silverman, Nickerson, & Freeman, 1997).
A complete analysis of multidimensional constructs needs to explore the existence of second-order structures that can group first-order dimensions. Glick, Washburn, and Miller (2005) suggest
that firm performance could be conceptually represented by one second-order construct reflecting
itself on its first-order dimensions (Figure 2, model on the left). These first-order dimensions, although different from each other, would be symptoms of a more general, higher order: performance (Glick et
al., 2005). This would require all dimensions to have positive and strong correlations. The
Venkatraman and Ramanujam (1986) conceptual model suggests an alternative representation, in
which performance would have two second-order dimensions: the financial one, represented by profitability, growth and market value; and the operational domain, that includes non-financial
competitive aspects, like customer satisfaction, quality, innovation, employee satisfaction and
reputation (Figure 2, model on the right). We, however, prefer the name strategic performance to operational performance.
Latent Variable Observed Variable Error term
Profitability
Growth
Market Value
Firm
Performance
e1
e2
e3
e4
X1
X2
X3
X4
X5 e5 1
1
1
1
1 e1
e2
e3
X2
X3
X1
e1
e2
e3
X2
X3
X1
e1
e2
e3
X2
X3
X1
1
1
1
1
1
1
1
1
1
Unidimensional Model Multidimensional Model

J. B. Santos, L. A. L. Brito 102
BAR, Rio de Janeiro, v. 9, Special Issue, art. 6, pp. 95-117, May 2012 www.anpad.org.br/bar
Figure 2. Second Order Models.
Rowe and Morrow (1999) found evidence of a financial second-order construct composed of
financial reputation, market value and profitability. Our review failed to find studies that tested
second-order non-financial constructs. As second order constructs are always multidimensional models defined according to theoretical assumptions or underlying correlations, several alternative
second-order structures are possible with different groupings of the first-order dimensions. In this
paper, we test these two theoretical models and proceed in an exploratory way to identify other grouping alternatives.
Methods
Operational definition of constructs
To identify potential indicators for each presumed performance aspect (growth, profitability,
market value, customer and employees’ satisfaction, and social and environmental performance) we
investigated related academic journals and Brazilian companies’ annual reports. We selected ten
journals (Academy of Management Journal, Academy of Management Review, Administrative Science Quarterly, Strategic Management Journal, International Journal of Operations & Production
Management, Journal of Operations Management, Production and Operations Management, Revista
de Administração de Empresas, Revista de Administração Contemporânea, Revista de Administração da Universidade de São Paulo) and identified 177 empirical articles from 1995 to 2006 that used some
form of performance operationalization. Four of these journals are from the strategic management
field where firm performance is frequently the dependent variable of empirical studies. Three journals
are from the operations management field that has a line of research about business performance measurement (Neely, 2007). The remaining three journals are leading Brazilian academic journals.
These articles used 122 different indicators of performance. We chose the 65 indicators used by at
least two papers.
To ensure a selection of indicators consistent with the Brazilian environment, we examined the
2008 annual reports of 15 leading Brazilian companies and created another list of performance indicators. After comparing these two sets of indicators, we ended up with 35 performance indicators
Firm
Performance
Environmental
Performance
Social
Performance
Employees’
Satisfaction
Customers’
Satisfaction
Profitability
Market
Value
Growth Financial
Performance
Strategic
Performance
Profitability
Growth
Market
Value
Customers’
Satisfaction
Employees’
Satisfaction
Environmental
Performance
Social
Performance

Toward a Subjective Measurement Model 103
BAR, Rio de Janeiro, v. 9, Special Issue, art. 6, pp. 95-117, May 2012 www.anpad.org.br/bar
used at least twice in the academic papers and mentioned by at least one Brazilian leading company.
We added two additional indicators present in several annual reports and not investigated by the
empirical studies, reaching 37 performance indicators (Table 1) to represent the seven presumed performance constructs.
Table 1
Performance Dimensions and Indicators Selected
Dimensions Selected Indicators
Profitability Return on Assets, EBTIDA margin, Return on investment, Net income/Revenues, Return on equity, Economic value added
Market Value Earnings per share, Stock price improvement, Dividend yield, Stock price volatility, Market value added (market value / equity), Tobin’s q (market value / replacement
value of assets)
Growth Market-share growth, Asset growth, Net revenue growth, Net income growth, Number of employees growth
Employee Satisfaction Turn-over, Investments in employees development and training, Wages and rewards policies, Career plans, Organizational climate, General employees’ satisfaction
Customer Satisfaction Mix of products and services, Number of complaints, Repurchase rate, New customer retention, General customers’ satisfaction, Number of new
products/services launched
Environmental
Performance
Number of projects to improve / recover the environment, Level of pollutants
emission, Use of recyclable materials, Recycling level and reuse of residuals,
Number of environmental lawsuits
Social Performance Employment of minorities, Number of social and cultural projects, Number of lawsuits filed by employees, customers and regulatory agencies
These indicators were items of a questionnaire asking respondents to judge their company’s
performance as compared to the competition for each indicator. Depending on the context,
performance measurement may require indicators that are difficult to access (Ketokivi & Schroeder, 2004). The same authors suggest that objective performance measures are less convenient for non-
financial performance measurement and for inter-firm comparison when firms have different ways of
registering information. In these cases, researchers (Forker et al., 1996; Slater & Olson, 2000; Wiklund & Shepherd, 2003) should adopt subjective measures and request informants to compare
performance criteria in relation to a benchmark. The critique over subjective performance indicators is
that they depend on human cognition and knowledge. Resultant data may be over- or underestimated, may suffer from halo effects or may just be a guess (Ketokivi & Schroeder, 2004; Richard et al.,
2009).
Nevertheless, subjective and objective performance indicators proved to be positively correlated (Dawes, 1999; Dess & Robinson, 1984; Forker et al., 1996; Venkatraman & Ramanujam, 1987; Wall
et al., 2004). These studies tested mainly financial measures and found statistically significant
correlations (p<0.05) ranging from 0.44 to 0.69. Correlations are not particularly high, but they are significant and positive, indicating that subjective and objective measures point in the same direction.
Additionally, Venkatraman and Ramanujam (1987) found strong convergence between the two types
of measures using a confirmatory factor analysis. When objective and subjective performance measures were correlated to other constructs, similar results in terms of significance and magnitude
were found for both types of measure (Wall et al., 2004).
These results suggest subjective measures can be used to assess firm performance and probably lead to convergent results of different magnitudes. In this case, Ketokivi and Schroeder (2004)

J. B. Santos, L. A. L. Brito 104
BAR, Rio de Janeiro, v. 9, Special Issue, art. 6, pp. 95-117, May 2012 www.anpad.org.br/bar
advocate in favor of practices intended to improve validity and reliability, such as collecting data from
multiple respondents, and using different methods and indicators.
Data collection instrument
Two sections composed the questionnaire. Part one contained one question about respondents’
position within the organization and three questions about firms’ profile: size in terms of annual
revenue, sector responsible for the main stream of revenue, and experience within the sector. These questions were designed to estimate sample demographics and evaluate eventual sample bias
(presented later). The second section was subdivided into seven topics, each named after one of the
seven proposed aspects of firm performance. The topic was followed by the question: How was the
firm performance, in the last 3 years, when compared to the average competitors of the sector in
terms of. Underneath, we displayed the respective set of indicators and a five-point scale ranging from
below average to above average. We did not ask for objective performance measures due to their
sensitive nature.
A similar subjective question to assess firm performance was used in the work of Wiklund and
Shepherd (2003) and produced valid and reliable results. We adopted this question for two reasons. Comparing the firm to the industry’s average allowed controlling for different economic activities in
the sample (Dawes, 1999). Other researchers also relied on respondents to minimize the sector
influence on the data set (Forker et al., 1996; Slater & Olson, 2000). Additionally, the use of a period of time (three years) instead of a single year smooths eventual fluctuations in the results of the
companies (Kim, Hoskisson, Won, 2004).
The first version of the questionnaire was examined by experts (financial analysts, professors, and doctoral students of a leading Brazilian business school) to judge face validity, questionnaire
physical appeal, word ordering, time demand, and clearness. After adjustments, we performed a pre-
test with 25 subjects for an initial assessment of reliability and validity, introducing few modifications. The final instrument was later used in the field research.
Sample and data collection
Our target population was high-level executives within Brazilian organizations, such as board
members, presidents, vice-presidents, and directors, as suggested by Venkatraman and Ramanujan
(1987). These high-level executives were presumed to know organizational performance goals and to
be responsible for defining or helping to define organizations’ strategies. They certainly do not fully represent all stakeholders. Yet they should be in a position to make a balanced judgment of the
different demands of each stakeholder group.
Respondents came from two databases. The first one was from the Brazilian Institute of Corporate Governance and the other was a selected stratum of the alumni of a leading business school.
Our final database had 2443 potential respondents. The data collection instrument was sent to all and
the initial response rate was 3% (74). After two weeks, e-mails were sent to respondents that had not answered and 42 people filled the questionnaire in this time. Our final sample had 116 respondents
and the response rate was 4.7%. The low response rate and the database composition are threats to
generalizability and the final sample is better treated as a convenience sample (Krosnick, 1999). Data was collected on-line and I.P. control was used to avoid more than one respondent per firm. To check
for differences between the two databases and response waves, we conducted a two-population means
test for independent samples for each variable and found no evidence of bias (P<5%).
Data treatment and analysis
We eliminated four questionnaires with less than 40% of answered questions and dropped one
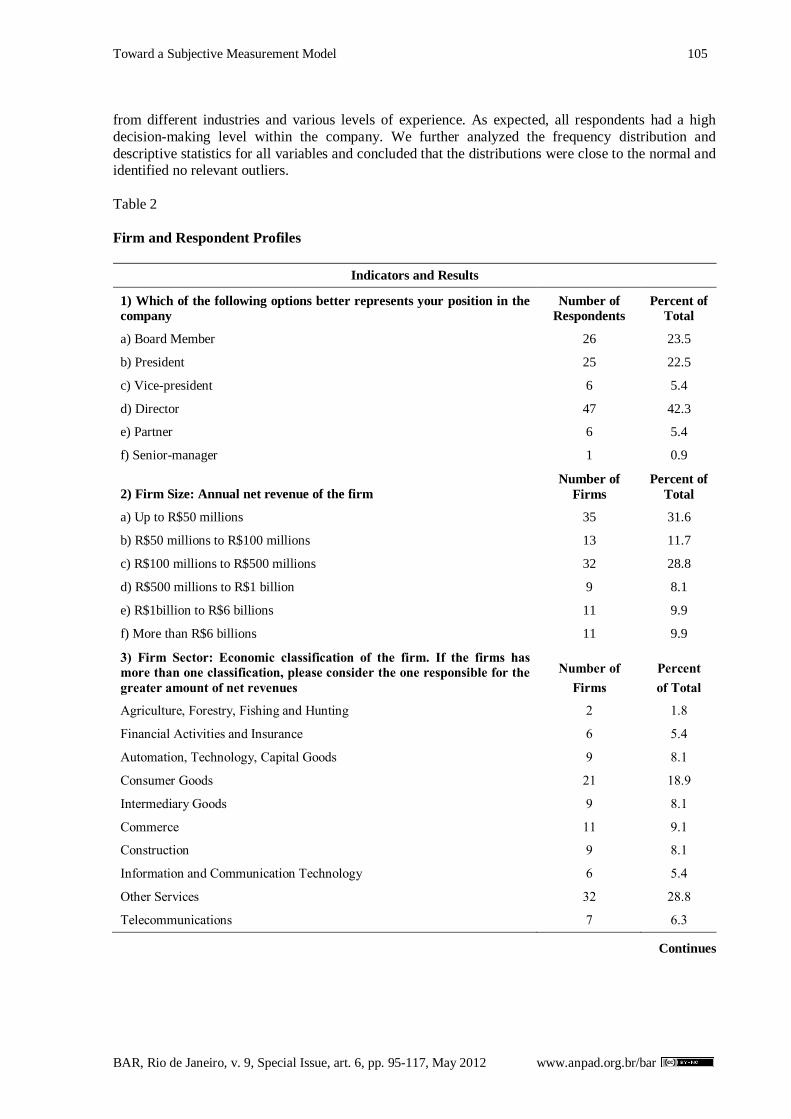
questionnaire with standard deviation within answers below 0.3. In our final analyses, we used 111 respondents. Our sample was fairly heterogeneous (Table 2), with small, medium and large companies
Toward a Subjective Measurement Model 105
BAR, Rio de Janeiro, v. 9, Special Issue, art. 6, pp. 95-117, May 2012 www.anpad.org.br/bar
from different industries and various levels of experience. As expected, all respondents had a high
decision-making level within the company. We further analyzed the frequency distribution and
descriptive statistics for all variables and concluded that the distributions were close to the normal and identified no relevant outliers.
Table 2
Firm and Respondent Profiles
Indicators and Results
1) Which of the following options better represents your position in the
company
Number of
Respondents
Percent of
Total
a) Board Member 26 23.5
b) President 25 22.5
c) Vice-president 6 5.4
d) Director 47 42.3
e) Partner 6 5.4
f) Senior-manager 1 0.9
2) Firm Size: Annual net revenue of the firm
Number of
Firms
Percent of
Total
a) Up to R$50 millions 35 31.6
b) R$50 millions to R$100 millions 13 11.7
c) R$100 millions to R$500 millions 32 28.8
d) R$500 millions to R$1 billion 9 8.1
e) R$1billion to R$6 billions 11 9.9
f) More than R$6 billions 11 9.9
3) Firm Sector: Economic classification of the firm. If the firms has
more than one classification, please consider the one responsible for the
greater amount of net revenues
Number of
Firms
Percent
of Total
Agriculture, Forestry, Fishing and Hunting 2 1.8
Financial Activities and Insurance 6 5.4
Automation, Technology, Capital Goods 9 8.1
Consumer Goods 21 18.9
Intermediary Goods 9 8.1
Commerce 11 9.1
Construction 9 8.1
Information and Communication Technology 6 5.4
Other Services 32 28.8
Telecommunications 7 6.3
Continues

J. B. Santos, L. A. L. Brito 106
BAR, Rio de Janeiro, v. 9, Special Issue, art. 6, pp. 95-117, May 2012 www.anpad.org.br/bar
Table 2 (continued)
Indicators and Results
4) Firm Experience: For how many years the firm operates in this
sector
Number of
Firms
Percent of
Total
a) 0 to 5 years 5 4.5
b) 5 to 10 years 14 12.6
c) 10 to 40 years 42 37.9
d) 40 to 70 years 34 30.6
e) 70 to 100 years 11 9.9
f) More than 100 years 5 4.5
Note. Sample size of 111.
Next we evaluated the reliability of the measures. Given our limitation of subjects, we used a common method of internal consistency: the Cronbach’s alpha (Pedhazur & Schelkin, 1991). Six of
the seven dimensions presented alphas well above 0.8; only the social performance dimension scored lower, at 0.67. We associated this issue with the small number of indicators used to measure social
performance, since the alpha is a function of the number of items in the scale (Netemeyer, Bearden, &
Sharma, 2003). We kept social performance items because of their nomological validity. Unfortunately, we were not able to compare our data to objective performance measures to check for
alternative-forms reliability. Given the sensitive nature of performance data, we assured respondent
data confidentiality by not asking their personal data and by not requiring company identification.
After initial data treatment, we used Confirmatory Factor Analysis to test the dimensional structure of performance using AMOS 16 software. The number of missing data for the market value
items forced us to eliminate this dimension. Since we used a discrete five-point scale, we compared the polychoric correlations to the traditional Spearman correlations, but no significant differences were
found. Close to normal distributions and a sample size of 111 observations allowed the use of
maximum likelihood estimation, recommended for samples between 100 and 150 cases (Hair, Anderson, Tatham, & Black, 2005), and small deviations from normality (Shah & Goldstein, 2006).
The first step of the analysis was to confirm the multidimensionality of the firm performance
construct. We compared a multidimensional model with six first-order freely correlated dimensions (growth, profitability, customer satisfaction, employee satisfaction, social performance and
environmental performance) with a unidimensional model having all items loading into a single
construct. In a second step, we explored alternatives of second-order constructs to understand further the structure of the performance construct. Two models were proposed based on the literature review
(represented in Figure 2) and an additional second-order model emerged during the data analysis.
These models are explained later.
Models were assessed in terms of fit, validity and reliability. Model fit was evaluated using
several indexes. The chi-square test indicates whether the difference between the data correlation
matrix and the implied calculated matrix is significant. If the difference is significant one cannot say the model fits the data and, therefore, it should be rejected (Mueller, 1996). This test is sensitive to the
sample size and to the number of variables in the model (Hair et al., 2005) sometimes leading to an
inappropriate model rejection. Other indexes need to be considered. The Root Mean Square Error of Approximation (RMSEA) is a relevant overall fit index. RMSEA should be below 0.08 and preferably
below 0.05 (Kline, 2005). Incremental fit was assessed with the Tucker-Lewis index (TLI), the
Comparative Fit Index (CFI), and the Incremental Fit Index (IFI), given we used less than 250 observations (Shah & Goldstein, 2006). Values above 0.90 indicate a good fit (Hair et al., 2005).

Toward a Subjective Measurement Model 107
BAR, Rio de Janeiro, v. 9, Special Issue, art. 6, pp. 95-117, May 2012 www.anpad.org.br/bar
Convergent validity was judged based on the factors loading and on the extracted variances. High significant loading and extracted variances above 50% indicate that the measurement error is less
than the explained variance suggesting convergent validity (Shook, Ketchen, Hult, & Kacmar, 2004). Discriminant validity was assessed comparing the squared interconstruct correlations (SIC) to the
extracted variance. SIC values indicate the variance shared by two constructs. If they are higher than
the extracted variance, it is highly likely that only one construct exists (Fornell & Larcker, 1981).
Composite reliability was calculated in addition to the Cronbach’s alpha, because the number of variables used influence this reliability index less (Pedhazur & Schmelkin, 1991). Composite
reliability should be at least 0.7 (Hair et al., 2005). Finally, we tested for the significance in the
models’ chi-square differences given the different degrees of freedom. In case of statistically significant differences, models with lower chi-squares are preferred (Chen, Paulrauj, & Lado, 2004).
Results and Discussion
Multidimensionality assessment
The unidimensional first-order model had a poor fit: chi-square was significant 1302 (p<0.001),
RMSEA was 0.175, well above the limit, and TFI, CFI, and IFI were 0.48, 0.56, and 0.57, far from the
0.90 limit. The normed chi-square (chi-squared divided by the degrees of freedom) was 4.35 when a
value of less than 3 is desirable. The multidimensional model with six first-order dimensions had a fair
fit. The chi-square test was still significant, 458 (p < 0.001), but the other indexes suggest a reasonable fit. The normed chi-square was 1.62, RMSEA was 0.07 and CFI, TLI, and IFI were all above 0.9.
Results are shown in Table 3.
Table 3
Fit Indexes for First-Order Models
Indexes Unidimensional Multidimensional Recommended Values
Chi-Square 1302 (p<0.01) 458 (p<0.01) p>0,05 (not significant)
Degrees of Freedom 299 285 -
RMSEA 0.18 0.07 <0.08
CFI 0.56 0.92 >0.9
TLI 0.49 0.91 >0.9
IFI 0.57 0.93 >0.9
Normed Chi-Squared 4.35 1.62 <2.0
Note. Recommended values based on Kline, R. B. (2005). Principles and practice of structural equation modeling (2nd ed., pp. 137 and 139-141). New York: Guilford Press.
Since both models can be considered nested, it is possible to test the significance of their difference with the chi-square test. The chi-square difference was 844 and the difference in degrees of
freedom was 15. The chi-square difference was statistically significant (p < 0.001), and the lower chi-
square value confirmed the superiority of the multidimensional model. Validity and reliability
analyses also indicate the multidimensional model as preferred. The unidimensional model showed poor convergent validity. Items related to social and environmental performance had loads not
statistically significant (p>0.10) and the extracted variance was only 34.54%, explaining just a third of
the variability. The multidimensional model proved to be valid and reliable (table 4). All loads were positive, higher than 0.55 and statistically different from zero (p<0.001) and the variance extracted by

J. B. Santos, L. A. L. Brito 108
BAR, Rio de Janeiro, v. 9, Special Issue, art. 6, pp. 95-117, May 2012 www.anpad.org.br/bar
each of the six constructs was above 50%. Only social performance had a composite reliability of
0.69, close to the reference of 0.70 (Hair et al., 2005). All other dimensions had values above 0.85.
Table 4
Standardized Loads and Error Terms for the Multidimensional Model
Construct
Comp.
Reliabi
lity A.V.E Items a
Stand.
Factor
Loads
Error
Term b
Critical
Ratio b,c
Growth 0.9 0.70 Market Share Growth 0.79 - -
Asset Growth 0.79 0.11 9.05
Revenue Growth 0.86 0.11 10.06
Net Profit Growth 0.91 0.12 10.75
Profitability 0.97 0.84 EVA 0.91 - -
ROA 0.91 0.06 15.68
EBTIDA Margin 0.91 0.06 15.44
ROI 0.96 0.05 18.74
ROS 0.88 0.06 14.25
ROE 0.94 0.06 17.48
Environmental
Performance
0.93 0.75 Environmental Projects 0.86 - -
Recycling 0.88 - -
Use of Recyclables 0.91 0.07 15.29
Pollutants Emissions 0.81 0.08 11.55
Social Performance
0.67 0.54 Minority Employment 0.56 - -
Social Projects 0.88 0.39 4.17
Customer Satisfaction
0.85 0.53 Value Added 0.70 - -
Cust. Retention 0.77 0.18 7.16
Cust. Loyalty 0.77 0.17 7.17
No. Complains 0.57 0.18 5.40
Overall Customer
Satisfaction 0.80 0.14 7.36
Employee
Satisfaction
0.88 0.59 Investment in Employees 0.72 - -
Payment of Benefits 0.70 0.11 6.97
Career Opportunities 0.79 0.10 7.78
Organizational Climate 0.77 0.11 7.60
Overall Employee Satisfaction 0.86 0.10 8.46
Note. a Indicators eliminated due to low reliability: turnover, number of employees growth, number of environmental
lawsuits, number of new products/services launched, number of lawsuits filed by employees, customers and regulatory agencies. b “-“ indicates variables loadings fixed to the value of one. c Estimates of all indicators significant at the level p<0.001.
The multidimensional model also presented discriminant validity. The six dimensions presented
squared interconstruct correlations (SIC) lower than the extracted variance (Fornell & Larcker, 1981).

Toward a Subjective Measurement Model 109
BAR, Rio de Janeiro, v. 9, Special Issue, art. 6, pp. 95-117, May 2012 www.anpad.org.br/bar
Table 5 shows the SIC values on the upper right side, the extracted variances on the main diagonal and
correlations between constructs on the bottom left side.
Table 5
Correlation and Squared Interconstruct Correlations Matrix
Constructs 1 2 3 4 5 6
1. Growth 0.70 0.66 0.34 0.15 0.00 0.01
2. Profitability 0.81** 0.84 0.36 0.22 0.02 0.02
3. Customer Satisfaction 0.58** 0.60** 0.53 0.28 0.04 0.02
4. Employee Satisfaction 0.39** 0.47** 0.53** 0.59 0.34 0.31
5. Social Performance 0.00 0.13 0.21 0.58* 0.54 0.30
6. Environmental Performance 0.06 0.13 0.14 0.56** 0.55** 0.75
Note. for N=111, ** p < 0.001; * p < 0.050.
After confirming that the multidimensional model fits the data better, we evaluated the correlations between the six performance dimensions (Table 5). The strongest correlation was between
growth and profitability, suggesting the existence of a second-order construct of financial
performance. Social and environmental performance showed weak correlations with growth,
profitability, and customer satisfaction, but moderate and significant correlation with employee satisfaction. Given this pattern of correlations, the existence of second-order constructs is possible and
is explored in the next section.
The inadequacy of the unidimensional model has serious implications for research and practice. This seriousness is augmented by the fact that 8 of the 15 correlations between dimensions were below
0.5 indicating they truly cover different aspects of performance. These results join, extend and support findings of previous studies. Research design needs to consider multidimensionality. For example, if
one intends to test the relationship between specific resources and performance, the choice of
performance dimensions is critical. The multidimensional model suggests a structure of how to
approach this disaggregation. Practitioners also need to be aware of these multiple dimensions. Some of their actions targeted at specific performance outputs need to be judged on how they might affect
others. Since the model was based on stakeholder theory, this supports the argument of balancing the
different stakeholders’ demands (Mitchell, Agle, & Wood, 1997).
Second-order models
We started this step of the analysis by adopting the multidimensional first-order model as our
baseline and comparing the second-order models to it. The first of the second-order models, Model A, has only one second-order dimension. This model suggests the existence of an overarching second-
order construct that represents firm performance and influences growth, profitability, customer
satisfaction, employee satisfaction, and social and environmental performance. The second model, Model B, has two second-order dimensions: financial and strategic performance. Financial
performance influences growth and profitability while strategic performance is an overarching
performance conceptualization covering all non-financial aspects. After testing these two models we continued in an exploratory way to identify alternatives for grouping the six constructs. This effort led
us to propose model C.
The statistical testing of second-order constructs followed Brown’s (2006) recommendations. The first step is to have a good first-order model. Second-order models can never present a better fit
than first-order models since they are more restrictive, given that constructs can freely correlate in the
first-order model. The inclusion of a second-order construct restrains this correlation that now must be

J. B. Santos, L. A. L. Brito 110
BAR, Rio de Janeiro, v. 9, Special Issue, art. 6, pp. 95-117, May 2012 www.anpad.org.br/bar
caused by a common second-order construct. When the difference between a second-order model and
a first-order is not statistically significant, the existence of the second-order alternative cannot be
rejected statistically. This test can be done with the chi-square difference because models are nested. The second-order model should also be analyzed in relation to convergent and discriminant validity.
The extracted variance must be above 50% and the loads on the first-order dimensions must be high
and statistically significant. The conceptual justification for the second-order model combined with its
non-rejection allows us to accept it.
Model A, with only one second-order common dimension, had a poor fit with a RMSEA of
0.086 and CFI, TFI, and IFI indexes below 0.9. The extracted variance by the second-order factor was only 39% and no first-order construct presented a statistically significant loading. The chi-square
difference test when comparing this model with the multidimensional first-order model was highly
significant (p < 0.001). We could confidently reject model A. Model B had a marginal fit with RMSEA of 0.080 and CFI, TFI, and IFI indexes close to 0.9. The strategic performance, second-order
construct, had low, although statistically significant (p<0.001), loads and extracted variance was 48%.
The second-order, financial performance construct had significant loads on growth (0.81) and
profitability (0.99) and was able to extract 81% of the variance from these factors. Reliability was also high (0.9). Correlation between the two second-order constructs was 0.47 (p < 0.05). The chi-square
difference test, however, was highly significant (p < 0.001) indicating that Model B was significantly
inferior to the first-order model with six dimensions freely correlated. Given these considerations we also reject Model B. Results are in Table 6.
In an exploratory manner, we tried to identify alternative second-order constructs. We could not reach any viable alternative beyond the second-order financial performance, which combined the first-
order dimensions of profitability and growth. So our final proposed measurement model of firm
performance, Model C, has a second-order dimension for financial performance and maintains the
customer satisfaction, employee satisfaction, social and environmental performance dimensions as independent, freely correlated constructs.
Table 6
Fit Indexes for Second-Order Models
Fit Indexes First Order
Model Baseline Model A Model B Model C
Recommended
Values
Chi-Square
458
(P<0.001)
534
(P<0.001)
497
(P<0.001)
460
(P<0.001)
p>0,05
(not signif.)
Degrees of Freedom 285 294 293 288 -
Chi-Square
Dif. to Baseline -
76
(P<0.001)
39
(P<0.001)
2
(P=0.57)
p>0,05
(not signif.)
RMSEA 0.074 0.086 0.080 0.074 <0.080
CFI 0.92 0.89 0.91 0.93 >0.90
TLI 0.91 0.87 0.89 0.91 >0.90
IFI 0.93 0.89 0.91 0.93 >0.90
Normed Chi-Squared 1.62 1.81 1.69 1.59 <2.0
Note. Recommended values based on Kline, R. B. (2005). Principles and practice of structural equation modeling (2nd ed., pp. 137 and 139-141). New York: Guilford Press.
Model C (Figure 3) had a good fit and the chi-square test did not show a significant difference
from the baseline model (Table 6). It was also valid and reliable. Composite reliability of the second-
order construct was high (0.9), loads were all statistically significant (p<0.001), and extracted variance

Toward a Subjective Measurement Model 111
BAR, Rio de Janeiro, v. 9, Special Issue, art. 6, pp. 95-117, May 2012 www.anpad.org.br/bar
was 81%. Squared interconstruct correlations were lower than extracted variances, indicating
discriminant validity between the second- and first-order constructs. Composite reliabilities of first-
order dimensions were above 0.7. Correlations between dimensions above 0.15 were significant; overall they were moderate and positive.
Figure 3. Model C: One Second Order Construct, Financial Performance, and Four Independent First
Order Dimensions with Free Correlations.
Our results do not support the notion of a general second-order performance construct that
manifests itself in first-order dimensions (poor fit of model A), as suggested by Glick et al. (2005).
0.94
0.88
Profitability
ROA
ROS
ROE
EVA
MKT_SHARE_GTH
ASSETS_GTH
REVENUES_GTH
OVERALL_CUST_SATI
SF
CUST_RETENTION
CUST_LOYALTY
N_COMPLAINS
ADDED_VALUE
NET_PROFIT_GTH
MG_EBTIDA
SOCIAL_PROJECT
S
ROI
RECYCLING
USE_RECICLAB
POLUTTANTS_EMISS
ORG_CLIMA
CAREER_OPPORT
PAYMENT_BENEFITS
INVEST_EMPLOYEE
Growth
Customers’
Satisfaction
Social Performance
Environmental
Performance
Employees’
Satisfaction
0.92
0.88
Financial
Performance
0.53
0.48
0.12
0.08
0.56
0.53
0.21
0.55
0.14
0.58
0.91
0.91
0.96
0.72
0.8
0.77
0.77
0.57
0.7
0.91
0.8
0.8
0.91
0.7
0.79
0.77 0.86
0.81
0.86
0.91
0.88
0.58
0.85
ENVIRONM_PROJECTS
OVERALL_EMPL._SATISF
MINORITY_EMPLOYM

J. B. Santos, L. A. L. Brito 112
BAR, Rio de Janeiro, v. 9, Special Issue, art. 6, pp. 95-117, May 2012 www.anpad.org.br/bar
The lack of statistical support for Model B and the good fit of model C (Figure 3) offer a deeper
insight into the much cited Venkatraman and Ramanujan (1986) conceptual model of a core financial
performance domain, within a broader domain of operational performance. Our results corroborate the existence of the financial performance domain. Yet, the absence of a non-financial second-order
construct indicates the operational performance domain may not exist. Non-financial aspects are
actually independent and do not vary in a similar ways. These findings reinforce the
multidimensionality argument explored earlier.
Conclusions
Despite its relevance to strategic management, firm performance suffers from limited
conceptualization, selection of indicators based on convenience, and no proper consideration of its
dimensionality. This paper makes a contribution to the joint effort of finding proper conceptualizations
of performance and related measurements. Two major contributions can be identified: one is
instrumental, another conceptual. The instrumental contribution relates to the scale itself, which can be used in other empirical studies. Very often, a comprehensive set of performance data is not available
and subjective measures can complement limited objective data (Ketokivi & Schroeder, 2004). The
scale can be used in full or in parts (selected dimensions) depending on the nature of each investigation. However, the selection of dimensions should carefully evaluate the most likely affected
dimensions, as suggested by Ray et al. (2004). The scale can also be taken as a model for future
expansion and refining with additional dimensions and indicators.
The conceptual contribution relates to the discussion of performance dimensionality. Our model clearly identifies at least five dimensions: financial performance, customer satisfaction, employee
satisfaction, social performance and environmental performance. Multidimensionality implies indicators of different dimensions cannot be used interchangeably, since they represent different
aspects of firm performance. Strategies may also have different impacts on each dimension.
The financial performance dimension as a second-order one, loading on profitability and growth, deserves further attention. This structure shows that using only profitability measures, as often
happens, is an inadequate representation of financial performance, and can represent a serious flaw in empirical studies. Recent research defines competitive advantage as the ability to create more
economic value than the marginal (break even) competitor in its product market (Peteraf & Barney,
2003). Economic value is the wedge between the willingness to pay and the economic cost. If price is
set below competitors’ price, competitive advantage may manifest itself primarily in growth and not in profit. If price is set above competition the opposite would occur. Thus, measuring growth and
profitability simultaneously seems conceptually justified.
The absence of a second-order construct affecting the non-financial dimensions is equally interesting. It suggests there is no common factor influencing the satisfaction of customers, employees,
governments and communities. Indirectly, this result corroborates the remark of Fitzgerald and Storbeck (2003) that each stakeholder has its own agenda in relation to the company, since their
satisfaction is associated to different firm actions. Prioritizing becomes an issue. Adopting the
resource-dependence view, Frooman (1999) suggests a higher dependence on the stakeholders makes
the relationship between stakeholder welfare and the company’s outcomes stronger. As such, companies may need to focus on each group according to their relative importance and define specific
strategies to please each group. Jensen (2001), reconciling the social and economic theories of the
firm, puts the satisfaction of the different constituencies as a means to achieving market value maximization, the actual final goal of the company. This proposition implies managers can, and
should, use this ultimate target to prioritize different stakeholders’ needs and select appropriate
strategies. It also adds a time perspective to the model by placing market value as the dependent
variable in the long run, which could be explored in future research.

Toward a Subjective Measurement Model 113
BAR, Rio de Janeiro, v. 9, Special Issue, art. 6, pp. 95-117, May 2012 www.anpad.org.br/bar
This research certainly has limitations that could be explored in the future. The use of subjective indicators could have implications for the dimensional structure found. Rowe and Morrow (1999)
however found a similar second-order financial construct using objective data, supporting our findings. The positive correlation between objective and subjective performance measures suggests
this dimensional structure may hold for data collected with objective indicators. Secondly, the
convenience and geographic characteristics of the sample do not allow generalization. In addition, the
stakeholders that were considered to delimit the scope of the measurement model were the ones commonly mentioned by Brazilian companies, limiting the model to this country. The different
constituencies’ satisfaction was assessed in the view of high-level executives. They have access to
objective data on firms’ performance and are in a position to make a balanced judgment of the different demands of each stakeholder group. Yet they certainly do not fully represent all stakeholders.
Another limitation links to reliability. Our results were valid and reliable, but reliability could be
increased with the adoption of objective measures or multiple respondents, as suggest by Ketokivi and
Schroeder (2004). Finally, market value was not tested as a possible dimension. Since market value is conceptually linked to financial performance (Combs et al., 2005) this is a point for future
investigation.
Received 28 June 2010; received in revised form 4 April 2011.
References
Agle, B. R., Mitchell, R. K., & Sonnenfeld, J. A. (1999). Who matter to CEOs? An investigation of
stakeholder attributes and salience corporate performance, and CEO values. Academy of
Management Journal, 42(5), 507-525. doi: 10.2307/256973
Barney, J., & Clark, D. N. (2007). Resource-based theory. New York: Oxford.
Baum, J. R., & Wally, S. (2003). Strategic decision speed and firm performance. Strategic
Management Journal, 24(11), 1107-1129. doi: 10.1002/smj.343
Boyd, B. K., Gove, S., & Hitt, M. A. (2005). Construct measurement in strategic management research: illusion or reality? Strategic Management Journal, 26(3), 239-257. doi:
10.1002/smj.444
Brown, T. A. (2006). Confirmatory factor analysis for applied research. New York: The Guilford
Press.
Cameron, K. (1986a). A study of organizational effectiveness and its predictors. Management Science,
32(1), 87-112. doi: 10.1287/mnsc.32.1.87
Cameron, K. (1986b). Effectivineness as paradox: consensus and conflict in conceptions of
organizational effectiveness. Management Science, 32(5), 539-553. doi: 10.1287/mnsc.32.5.539
Carneiro, J. (2005). Mensuração do desempenho organizacional: questões conceituais e metodológicas. In M. Gutierrez & H. Bertrand (Eds.), Estudos em negócios IV (pp. 145-175).
Rio de Janeiro: Mauad.
Carneiro, J. M. T., Silva, J. F., Rocha, A., & Dib, L. A. R. (2007). Building a better measure of
business performance. RAC-Eletrônica, 1(2), 114-135. Retrieved from
http://www.anpad.org.br/periodicos/arq_pdf/a_639.pdf
Carton, R. B., & Hofer, C. W. (2006). Measuring organizational performance: metrics for
entrepreneurship and strategic management research. Cheltenham, UK; Northampton, MA:
Edward Elgar.
J. B. Santos, L. A. L. Brito 114
BAR, Rio de Janeiro, v. 9, Special Issue, art. 6, pp. 95-117, May 2012 www.anpad.org.br/bar
Chakravarthy, B. S. (1986). Measuring strategic performance. Strategic Management Journal, 7(5),
437-458. doi: 10.1002/smj.4250070505
Chen, I. J., Paulraj, A., & Lado, A. A. (2004). Strategic purchasing, supply management, and firm
performance. Journal of Operations Management, 22(5), 505-523. doi:
10.1016/j.jom.2004.06.002
Cho, H., & Pucik, V. (2005). Relationship between innovativeness, quality, growth, profitability, and
market value. Strategic Management Journal, 26(6), 555-575. doi: 10.1002/smj.461
Clarkson, M. B. E. (1995). A stakeholder framework for analyzing and evaluating corporate social
performance. The Academy of Management Review, 20(1), 92-117. doi: 10.2307/258888
Combs, J. G., Crook, T. R., & Shook, C. L. (2005). The dimension of organizational performance and
its implications for strategic management research. In D. J. Ketchen & D. D. Bergh (Eds.),
Research methodology in strategy and management (pp. 259-286). San Diego: Elsevier.
Connolly, T., Conlon, E. J., & Deutsch, S. J. (1980). Organizational effectiveness: a multiple-
constituencies approach. Academy of Management Review, 5(2), 211-217. doi: 10.2307/257430
Crook, T. R., Ketchen, D. J., Jr., Combs, J. G., & Todd, S. J. (2008). Strategic resources and
performance: a meta-analysis. Strategic Management Journal, 29(11), 1141-1154. doi:
10.1002/smj.703
Dawes, J. (1999). The relationship between subjective and objective company performance measures
in market orientation research: further empirical evidence. Marketing Bulletin, 10(3), 65-75.
Dess, G. G., & Robinson, R. B., Jr. (1984). Measuring organizational performance in the absence of
objective measures: the case of the privately-held firm and conglomerate business unit. Strategic Management Journal, 5(3), 265-273. doi: 10.1002/smj.4250050306
Donaldson, T., & Preston, L. E. (1995). The stakeholder theory of the corporation: concepts, evidence
and implications. Academy of Management Review, 20(1), 65-91. doi:10.2307/258887
Fitzgerald, L., & Storbeck, J. E. (2003). Pluralistic views of performance. Management Decision,
41(8), 741-750. doi: 10.1108/00251740310496251
Forker, L. B., Vickeky, S. K., & Droge, C. L. M. (1996). The contribution of quality to business
performance. International Journal of Operations and Production Management, 16(8), 44-62. doi: 10.1108/01443579610125778
Fornell, C., Johnson, M. D., Anderson, E. W., Cha, J., & Bryant, B. E. (1996). The American customer satisfaction index: nature, purpose and findings. Journal of Marketing, 60(4), 7-18.
doi: 10.2307/1251898
Fornell, C., & Larcker, D. F. (1981). Evaluating structural equations models with unobservable variables and measurement error. Journal of Marketing Research, 18(1), 39-50. doi:
10.2307/3151312
Freeman, R. E. (1984). Strategic management: a stakeholders approach. Boston: Pitman.
Frooman, J. (1999). Stakeholder influence strategies. The Academy of Management Review, 24(2), 191-205. doi: 10.2307/259074
Glick, W. H., Washburn, N. T., & Miller, C. C. (2005, August). The myth of firm performance. Proceedings of the Annual Meeting of American Academy of Management. Honolulu, Hawaii.

Toward a Subjective Measurement Model 115
BAR, Rio de Janeiro, v. 9, Special Issue, art. 6, pp. 95-117, May 2012 www.anpad.org.br/bar
Hair, J. F., Anderson, R. E., Tatham, R. L., & Black, W. C. (2005). Multivariate data analysis. New
Jersey: Prentice-Hall.
Harter, J. K., Schmidt, F. L., & Hayes, T. (2002). Business-unit-level relationship between employee
satisfaction: a meta-analysis. Journal of Applied Psychology, 87(2), 268-279. doi:
10.1037//0021-9010.87.2.268
Hitt, M. A. (1988). The measuring of organizational effectiveness: multiple domains and
constituencies. Management International Review, 28(2), 28-40.
Jensen, M. C. (2001). Value maximization, stakeholder theory, and the corporate objective function.
Journal of Applied Corporate Finance, 14(3), 8-21. doi: 10.1111/j.1745-6622.2001.tb00434.x
Johnson, R. D. A., & Greening, D. W. (1999). The effects of corporate governance and institutional
ownership types on corporate social performance. Academy of Management Journal, 42(5),
564-576. doi:10.2307/256977
Kaplan, R. S., & Norton, D. P. (1992). The balanced scorecard: measures that drive performance.
Harvard Business Review, 70(1), 71-79.
Ketokivi, M. A., & Schroeder, R. G. (2004). Perceptual measures of performance: fact or fiction?
Journal of Operations Management, 22(3), 247-264. doi: 10.1016/j.jom.2002.07.001
Kim, H., Hoskisson, R. E., & Wan, W. P. (2004). Power dependence, diversification strategy, and
performance in keiretsu member firms. Strategic Management Journal, 25(7), 613-634. doi:
10.1002/smj.395
Kline, R. B. (2005). Principles and practice of structural equation modeling (2nd ed.). New York:
Guilford Press.
Krosnick, J. A. (1999). Survey research. Annual Review of Psychology, 50(1), 537-567. doi:
10.1146/annurev.psych.50.1.537
Mitchell, R. K., Agle, B. R., & Wood, D. J. (1997). Toward a theory of stakeholder identification and
salience: defining the principle of who and what really counts. Academy of Management
Review, 22(4), 853-886. doi: 10.2307/259247
Mueller, R. O. (1996). Basic principles of structural equation modeling: an introduction to LISREL
and EQS. New York: Springer.
Murphy, G. B., Trailer, J. W., & Hill, R. C. (1996). Measuring performance in entrepreneurship
research: an empirical review of the literature. Journal of Business Research, 36(1), 15-23. doi: 10.1016/0148-2963(95)00159-X
Neely, A. (2007). Business performance measurement (2nd ed.). Cambridge: Cambridge University
Press.
Netemeyer, R. G., Bearden, W. O., & Sharma, S. (2003). Scaling procedures: issues and applications.
London: Sage Publications.
Pedhazur, E. J., & Schmelkim, L. (1991). Design and analysis: an integrated approach. Hillsdale:
Lawrence Erlbaum Associates Publishers.
Peteraf, M. A., & Barney, J. B. (2003). Unraveling the resource-based tangle. Managerial and
Decision Economics, 24(4), 309-323. doi: 10.1002/mde.1126

J. B. Santos, L. A. L. Brito 116
BAR, Rio de Janeiro, v. 9, Special Issue, art. 6, pp. 95-117, May 2012 www.anpad.org.br/bar
Ray, G., Barney, J. B., & Muhanna, W. A. (2004). Capabilities, business processes, and competitive
advantage: choosing the dependent variable in empirical tests of the resource-based view.
Strategic Management Journal, 25(1), 23-37. doi: 10.1002/smj.366
Richard, P. J., Devinney, T. M., Yip, G. S., & Johnson, G. (2009). Measuring organizational
performance: towards methodological best practice. Journal of Management, 35(3), 718-804.
doi: 10.1177/0149206308330560
Rowe, W. G., & Morrow, J. L., Jr. (1999). A note on the dimensionality of the firm financial
performance construct using accounting, market, and subjective measures. Canadian Journal of Administrative Sciences, 16(1), 58-70. doi: 10.1111/j.1936-4490.1999.tb00188.x
Rumelt, R. P., Schendel, D. E., & Teece, D. J. (1994). Fundamental issues in strategy. In R. P. Rumelt, D. E. Schendel, & D. J. Teece (Eds.), Fundamental issues in strategy (pp. 9-54). Boston:
Harvard Business School Press.
Seashore, S. E., & Yuchtman, E. (1967). Factorial analysis of organizational performance.
Administrative Science Quarterly, 12(3), 377-395. doi: 10.2307/2391311
Shah, R., & Goldstein, S. M. (2006). Use of structural equations modeling in operations management research: looking back and forward. Journal of Operations Management, 24(2), 148-169. doi:
10.1016/j.jom.2005.05.001
Shook, C. L., Ketchen, D. J., Hult, T. G., & Kacmar, K. M. (2004). An assessment of the use of
structural equation modeling in strategic management research. Strategic Management Journal,
25(4), 397-404. doi: 10.1002/smj.385
Sila, I. (2007). Examining the effects of contextual factor on TQM and performance through the lens
of organizational theories: an empirical study. Journal of Operations Management, 25(1), 83-
109. doi: 10.1016/j.jom.2006.02.003
Sila, I., & Ebrahimpour, M. (2005). Critical linkages among TQM factors and business results.
International Journal of Operations and Production Management, 25(11), 1123-1155. doi: 10.1108/01443570510626925
Silverman, B. S., Nickerson, J. A., & Freeman, J. (1997). Profitability, transactional alignment, and organizational mortality in the U.S. trucking industry [Special Issue]. Strategic Management
Journal, 18, 31-52. doi: 10.1002/(SICI)1097-0266(199707)18:1+<31::AID-SMJ920>3.0.CO;2-S
Simerly, R. L., & Li, M. (2000). Environmental dynamism, capital structure and performance: a
theoretical integration and an empirical test. Strategic Management Journal, 21(1), 31-49. doi:
10.1002/(SICI)1097-0266(200001)21:1<31::AID-SMJ76>3.0.CO;2-T
Slater, S. F., & Olson, E. M. (2000). Strategy type and performance: the influence of sales force
management. Strategic Management Journal, 21(8), 813-829. doi: 10.1002/1097-
0266(200008)21:8<813::AID-SMJ122>3.0.CO;2-G
Steers, R. M. (1975). Problems in the measuring of organizational effectiveness. Administrative
Science Quarterly, 20(4), 546-558. doi: 10.2307/2392022
Venkatraman, N., & Grant, J. (1986). Construct measurement in organizational strategy research: a
critique and proposal. Academy of Management Review, 11(1), 71-87. doi: 10.2307/258332
Venkatraman, N., & Ramanujam, V. (1986). Measurement of business performance in strategy
research: a comparison of approaches. Academy of Management Review, 1(4), 801-814. doi:
10.2307/258398

Toward a Subjective Measurement Model 117
BAR, Rio de Janeiro, v. 9, Special Issue, art. 6, pp. 95-117, May 2012 www.anpad.org.br/bar
Venkatraman, N., & Ramanujam, V. (1987). Measurement of business economic performance: an
examination of method convergent. Journal of Management, 13(1), 109-122. doi:
10.1177/014920638701300109
Waddock, S. A., & Graves, S. B. (1997a). Quality of management and quality of stakeholder relations.
Business and Society, 36(3), 250-279. doi: 10.1177/000765039703600303
Waddock, S. A., & Graves, S. B. (1997b). The corporate social performance-financial performance
link. Strategic Management Journal, 18(4), 303-319. doi: 10.1002/(SICI)1097-
0266(199704)18:4<303::AID-SMJ869>3.0.CO;2-G
Wall, T. D., Michie, J., Patterson, M., Wood, S. J., Sheeran, M., Clegg, C. H., & West, M. (2004). On
the validity of subjective measures of company performance. Personnel Psychology, 57(1), 95-118. doi: 10.1111/j.1744-6570.2004.tb02485.x
Whetten, D. A. (1987). Organizational growth and decline process. Annual Review of Sociology, 13(1), 335-358. doi: 10.1146/annurev.so.13.080187.002003
Wiklund, J., & Shepherd, D. (2003). Knowledge-based resources, entrepreneurial orientation, and the
performance of small and medium-sized businesses. Strategic Management Journal, 24(13), 1307-1314. doi: 10.1002/smj.360
Zammuto, R. F. (1984). A comparison of multiple constituency models of organizational effectiveness. Academy of Management Review, 9(4), 606-616. doi:10.2307/258484