Embed Size (px)
Citation preview

Comentário de Desempenho 1T14
0
São Paulo, 23 de abril de 2014 – A Natura
Cosméticos S.A. (BM&FBOVESPA: NATU3)
anuncia hoje os resultados do primeiro
trimestre de 2014 (1T14). As informações
financeiras e operacionais a seguir,
exceto onde indicado o contrário, são
apresentadas em base consolidada, de
acordo com as normas internacionais de
relatório financeiro IFRS.

Comentário de Desempenho 1T14
1
Crescimento consistente da receita e continuidade dos investimentos estruturantes
No primeiro trimestre de 2014, a receita líquida consolidada da Natura cresceu 15,2% frente ao 1T13
(9,1% no Brasil e 53% nas Operações Internacionais), o EBITDA totalizou R$ 283,6 milhões e o lucro
líquido R$ 117,2 milhões.
No Brasil, a continuidade de um ambiente competitivo mais desafiador está alinhada com a decisão
de intensificarmos os investimentos em marketing e inovação com o objetivo de aumentarmos a
produtividade de nossas consultoras, sempre comprometidos a financiarmos essas iniciativas com
ganhos de eficiência em nossa operação atual.
Seguindo a tendência observada no 2S13, nesse trimestre, os investimentos em marketing, os
lançamentos de produtos, com destaque para o relançamento da linha Tododia, e a ampliação das
opções de meios de pagamentos contribuíram para o aumento de 8,2% da produtividade de nossas
consultoras frente ao ano anterior (4,2% nos últimos 12 meses) e para o crescimento de 9,1% da
receita líquida.
Já na América Latina (excluindo o Brasil), as operações cresceram 37,4% em moeda local, destaque
para o México, onde desde o 2T13 o modelo multínivel (Rede de Relações Sustentáveis) mostra vigor
e consistência de resultados. A totalidade das operações internacionais (incluindo Aesop), que
representaram 18,4% da receita consolidada, cresceu 53% frente ao 1T13. A marca Aesop, adquirida
em março de 2013, conta hoje com 82 lojas conceito em 10 países (58 lojas no 1T13).
O EBITDA consolidado cresceu 8,2% no período, com margem de 18,2% (19,4% de margem no
1T13). Enquanto nas Operações
Internacionais1 passamos de um
resultado deficitário de R$ 7,5 milhões
(margem -4%) para um resultado
positivo de R$ 17,3 milhões2 (margem
6%), no Brasil alguns fatores foram
determinantes para a retração do
EBITDA de 1,2% frente ao 1T13: a
intensificação dos investimentos em
marketing; a margem bruta ainda
impactada pela desvalorização do real (o
ajuste de preço foi feito em março); e
custos não recorrentes de R$ 21 milhões
referentes a ajustes no critério de
reconhecimento de recuperação de
títulos já baixados e otimização da
estrutura organizacional.
Os investimentos realizados são
adequados para elevar nossa
competitividade no mercado local, ao
mesmo tempo que temos iniciativas de
ganhos de produtividade para
1 Operações internacionais considera em Operação em Consolidação, Operações em Implantação e outros Investimentos Internacionais (França, Aesop e estrutura corporativa baseada em Buenos Aires). 2 Inclui R$ 6,2 milhões de ganho em função do ajuste no preço de aquisição dos distribuidores da AESOP.
Valores em R$ milhões 1T14 1T13
Receita Bruta Brasil 1.734,7 1.596,7 8,6
Receita Bruta Internacionais 350,5 235,7 48,7
Receita Bruta Consolidada 2.085,2 1.832,4 13,8
Receita Líquida Brasil 1.270,5 1.164,5 9,1
Receita Líquida Internacionais* 285,7 186,7 53,0
Receita Líquida Consolidada 1.556,2 1.351,3 15,2
% Participação Receita Líquida Internacionais 18,4% 13,8% 4,5 pp
EBITDA Brasil pró-forma 266,4 269,5 (1,2)
% Margem EBITDA Brasil 21,0% 23,1% (2,2) pp
EBITDA Internacionais pró-forma 17,3 (7,5) n/d
% Margem EBITDA Internacionais 6,0% (4,0)% 10,0 pp
EBITDA Consolidado 283,6 262,1 8,2
% Margem EBITDA Consolidada 18,2% 19,4% (1,2) pp
Lucro Líquido Consolidado 117,2 124,6 (6,0)
% Margem Líquida Consolidada 7,5% 9,2% (1,7) pp
Geração Interna de Caixa 138,6 184,1 (24,7)
Geração de Caixa Livre (223,8) (118,8) 88,3
Dívida Líquida / EBITDA 0,86 0,53
*Crescimento em Moeda Local ex Aesop: 37,4% em 1T14 vs. 1T13

Comentário de Desempenho 1T14
2
equilibrarmos a lucratividade em patamares similares aos dos anos anteriores. Listamos abaixo
algumas iniciativas relevantes:
_ajustes nos preços para recompor as margens, diante de um ambiente cambial mais desafiador e
de uma maior pressão inflacionária, sendo que parte importante já foi realizada em março;
_utilização da capacidade logística construída, com destaque para o novo centro de distribuição em
São Paulo, permitindo maior diluição dos custos fixos de logística e eficiência na operação;
_evolução do processo de cobrança com métodos e ferramentas adequadas às diferentes etapas
dos títulos vencidos;
_maior assertividade e eficiência operacional nos investimentos de marketing;
_ganhos de produtividade nas despesas administrativas e maior eficiência nas despesas com a
força de vendas.
Apesar de um crescimento de 8,2% no Ebitda consolidado, o lucro líquido retraiu 6,0% frente ao
1T13, fruto dos investimentos em capex realizados nos anos anteriores, impactando as despesas com
depreciação, e do crescimento do resultado financeiro por um maior nível de endividamento,
conforme planejado, e pelo aumento da taxa de juros.
No período, os R$ 134,5 milhões investidos em capex (R$ 60,7 milhões no 1T13) foram destinados à
conclusão do Ecoparque (Benevides, PA), ao estagio final da nova fábrica em Cajamar e aos
investimentos em tecnologia da informação. Para o ano, mantemos a projeção de R$ 500 milhões,
inferior aos R$ 553,9 milhões de 2013, com uma distribuição mais linear ao longo dos trimestres em
comparação com os anos anteriores. Frente ao 1T13, esta diferença de faseamento dos investimentos
em capex contribuiu para a redução de R$ 104,9 milhões na geração de caixa livre.
Estamos confiantes com nossos planos para 2014, com destaque para o crescimento acelerado com
lucratividade nas Operações Internacionais e para as iniciativas que darão continuidade ao
crescimento da produtividade de nossas Consultoras no Brasil. Seguimos também executando as
ações que serão relevantes para nossa estratégia de médio prazo, como a expansão do Rede Natura e
o desenvolvimento de novas marcas e categorias. Além disso, uma organização mais eficiente e
focada na execução da estratégia de curto e médio prazo contribuirá para que os ganhos de
produtividade sejam capturados a fim de garantir nossa competitividade e o equilíbrio em nossa
lucratividade.

Comentário de Desempenho 1T14
3
1. mercado de higiene pessoal, perfumaria
e cosméticos (HPPC)
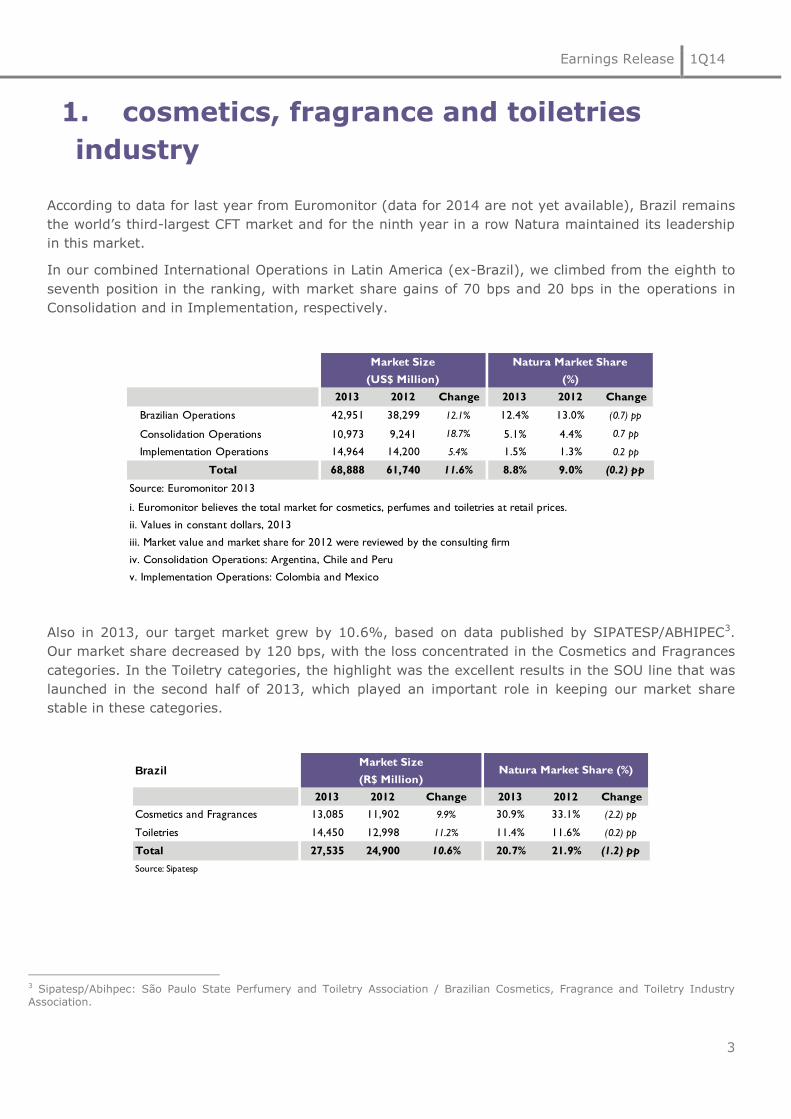
Segundo os dados divulgados pela consultoria Euromonitor referentes a 2013 (dados referentes ao
ano 2014 ainda não estão disponíveis), o Brasil segue como o terceiro maior mercado de HPPC e pelo
nono ano consecutivo mantivemos a liderança.
Nesse período, no conjunto de nossas Operações Internacionais na América Latina (ex-Brasil)
passamos da oitava para a sétima posição, com expansão de 0,7pp e 0,2pp, respectivamente, nas
Operações em Consolidação e Implantação.
Ainda para 2013, a partir dos resultados publicados pela SIPATESP/ABHIPEC3, nosso mercado alvo
apresentou crescimento de 10,6%. Nossa participação de mercado retraiu em 1,2pp, com
concentração nas categorias de Cosméticos e Fragrâncias. Nas categorias de Higiene Pessoal,
destacamos os excelentes resultados da linha SOU, lançada ao longo do segundo semestre de 2013,
importante para a estabilidade da participação de mercado nessas categorias.
3 Sipatesp/Abihpec: Sindicato da Indústria de Perfumarias de Artigos de Toucador no Estado de São Paulo / Associação Brasileira da Indústria de Higiene Pessoal, Perfumaria e Cosméticos.
2013 2012 Var. 2013 2012 Var.
Operação Brasil 42.951 38.299 12,1% 12,4% 13,0% (0,7) pp
Operações em Consolidação 10.973 9.241 18,7% 5,1% 4,4% 0,7 pp
Operações em Implantação 14.964 14.200 5,4% 1,5% 1,3% 0,2 pp
Total 68.888 61.740 11,6% 8,8% 9,0% (0,2) pp
Fonte: Euromonitor 2013
i. Euromonitor considera mercado total de cosméticos, perfumes e higiene pessoal a preços de varejo
ii. Vendas em dólares constantes 2013
iii. Valor do mercado e market share de 2012 foram revisados
iv. Operação em Consolidação considera Argentina, Chile e Peru
v. Operação em Implantação considera Colômbia e México
Mercado Total
(US$ Milhões)
Market Share Natura
(%)
2013 2012 Var. 2013 2012 Var.
Cosméticos e Fragrâncias 13.085 11.902 9,9% 30,9% 33,1% (2,2) pp
Higiene Pessoal 14.450 12.998 11,2% 11,4% 11,6% (0,2) pp
Total 27.535 24.900 10,6% 20,7% 21,9% (1,2) pp
Fonte: Sipatesp
* Valores de 2012 recalculados pela Associação
BrasilMercado Alvo
(R$ Milhões)
Market Share Natura
(%)

Comentário de Desempenho 1T14
4
2. destaques socioambientais
Concluímos a nova Visão de Sustentabilidade da Natura, que explicita a vontade da companhia de ir
além de simplesmente reduzir ou compensar os efeitos de suas atividades e passar a ser geradora de
impacto positivo no meio ambiente e na sociedade. A visão foi construída a partir de análises internas
e tendências mundiais em sustentabilidade e inspirada por uma série de diálogos com os públicos de
relacionamento da Natura. Estruturada em três pilares (Nossas Marcas e Produtos, Nossa Rede e
Nossa Gestão e Organização), a visão estabelece diretrizes e ambições públicas para 2020.
Outro destaque do trimestre foi a inauguração do Ecoparque, um complexo industrial que funcionará
em modelo de simbiose, conectando empresas diferentes e com necessidades complementares. O
intuito é formar uma rede de cooperação que possa compartilhar recursos e articular alternativas
conjuntas para fomentar a geração de negócios sustentáveis na Amazônia. A nova fábrica de
sabonetes da Natura, instalada no Ecoparque, passa a ser responsável pelo processo completo de
fabricação, com o objetivo de triplicar a produção desse item até 2015, ampliar o uso de insumos e
reduzir custos pela concentração do processo industrial próximo à cadeia de fornecimento.
O Ecoparque traz importantes inovações sustentáveis como, por exemplo: jardins filtrantes para
tratamento de efluentes, ventilação e iluminação natural dos edifícios e utilização das águas da chuva
para manutenção dos edifícios. Além disso, irá gerar 240 empregos diretos e terá 98% da mão de
obra e 70% dos serviços contratados localmente.
Em 11 de abril, durante o Encontro com Acionistas, lançamos o Relatório Anual 2013, tendo a internet
como principal mídia de divulgação, tanto por seu alcance e acessibilidade como pela redução de
impacto ambiental. Adotamos as novas diretrizes G4 da GRI (Global Reporting Initiative), assim como
as de Relatório Integrado, proposto pelo IIRC (International Integrated Reporting Council), ampliando
a correlação entre resultados financeiros e não financeiros, com uma visão de longo prazo.
Ao lado, apresentamos os
resultados socioambientais
acumulados do primeiro
trimestre de 2014. Para
alinharmos as metas de
2014 com a nova visão de
sustentabilidade, as
mesmas serão
disponibilizadas no 2T14.
* Resultado a ser disponibilizado
no próximo trimestre
** Indicador composto
principalmente por repartição de
benefícios e valores pagos pela
compra de matéria-prima.
*** Considera a Natura e outros
parceiros
Indicador
Gases de efeito estufa
(Mudanças Climáticas)
Consumo de Água
Geração de Resíduos
Arrecadação Crer para Ver
(Educação)
Recursos Destinados às
Comunidades Fornecedoras **
R$ 17,1 milhões
R$ 11,2 milhões
Resultado 2013
Redução de
33,2% vs 2006
Resultado 1T14
Não Disponível*
R$ 4,3 milhões
Volume de negócios na região amazônica*** R$ 201,5 milhões R$ 46,3 milhões
R$ 1,3 milhões
0,40 litro / unidade
produzida
21,7 gramas /
unidade produzida
0,36 litro / unidade
produzida
22,1 gramas/unid
produzida

Comentário de Desempenho 1T14
5
3. desempenho econômico-financeiro45
Nos resultados pró-formas, a margem de lucro alcançada nas exportações do Brasil para as Operações
Internacionais foi subtraída do CPV das respectivas operações, demonstrando o real impacto dessas subsidiárias no
resultado consolidado da empresa. Desta forma, a Demonstração de Resultados pró-forma Brasil apresenta somente
o resultado das vendas realizadas no mercado interno.
O Demonstrativo de Resultados pró-forma do 1T13 acima contempla três reclassificações no Brasil, e
consequentemente no Consolidado, para uma melhor comparação com o 1T14. Estes ajustes não impactam os
valores de EBITDA e Lucro Líquido anteriormente divulgados. Estas reclassificações entre linhas são: (1)
reclassificação para o “Custo de Mercadoria Vendida” das despesas de provisão de participação nos lucros de
colaboradores que estavam alocadas em “despesas administrativas, P&D, TI e projetos”; (2) reclassificação de parte
das “despesas com vendas, marketing e logística” para “despesas administrativas, P&D, TI e projetos” para melhor
refletir a nossa nova organização alinhada ao plano estratégico; e (3) “Despesas Administrativas, P&D, TI e
Projetos” consolidando a antiga linha de “Remuneração dos Administradores”, cujos detalhes estão disponíveis na
nota explicativa número 28.2 das Demonstrações de Resultados Financeiros. Nos próximos trimestres, esses
mesmos ajustes serão feitos nos valores de 2013.
4 Consolidado inclui Brasil, Operação em Consolidação, Operações em Implantação e outros Investimentos Internacionais, incluindo impacto de aquisições. 5 Posição ao final do Ciclo 4 no Brasil, Argentina, México e França e Ciclo 3 no Chile, Peru e Colômbia.
Trimestre Pró-Forma Pró-Forma
(R$ milhões) Consolidado4 Brasil Consolidação Implantação Novos Negócios
1T14 1T13 Var% 1T14 1T13 Var% 1T14 1T13 Var% 1T14 1T13 Var%
Consultoras - final do período ('000)5 1.650,5 1.556,8 6,0 1.276,4 1.257,6 1,5 230,4 188,8 22,1 142,2 108,2 31,4
Consultoras Média do período ('000) 1.636,6 1.557,2 5,1 1.261,1 1.256,2 0,4 228,7 189,7 20,6 145,3 108,8 33,4
Unidades de produtos para revenda (milhões) 128,4 111,6 15,1 110,2 98,2 12,2 11,6 9,1 27,6 5,9 4,2 42,0
Receita Bruta 2.085,2 1.832,4 13,8 1.734,7 1.596,7 8,6 195,1 155,1 25,8 103,6 65,2 58,9
Receita Líquida 1.556,2 1.351,3 15,2 1.270,5 1.164,5 9,1 145,1 115,8 25,3 89,3 56,0 59,5
Lucro Bruto 1.089,7 947,3 15,0 877,4 816,5 7,5 103,6 81,2 27,6 64,2 38,4 66,9
Despesas com Vendas, Marketing e Logística (602,7) (503,5) 19,7 (471,2) (414,6) 13,7 (70,4) (55,9) 25,9 (50,4) (28,6) 75,9
Despesas Adm., P&D, TI e Projetos (271,1) (223,8) 21,1 (196,5) (171,4) 14,6 (10,4) (10,4) (0,4) (10,4) (7,2) 44,8
Outras Receitas / (Despesas) Operacionais, líquidas 11,3 (0,3) n/d 5,6 (0,3) n/d (0,5) 0,2 n/d (0,1) 0,5 n/d
Receitas / (Despesas) Financeiras, líquidas (51,9) (37,8) n/d (51,9) (37,3) n/d 0,8 (0,4) n/d (0,7) (0,0) n/d
Imposto de Renda e Contribuição Social (57,1) (57,4) (0,5) (52,2) (55,8) (6,5) (4,4) (1,4) n/d (0,3) (0,1) 474,3
Participação dos minoritários (0,9) 0,0 0,0 0,0 0,0 0,0 0,0 0,0 0,0 0,0 0,0 0,0
Lucro Líquido 117,2 124,6 (6,0) 111,2 137,0 (18,8) 18,8 13,2 43,0 2,3 3,0 (24,5)
EBITDA* 283,6 262,1 8,2 266,4 269,5 (1,2) 23,5 16,2 45,5 4,4 3,8 15,2
Margem Bruta 70,0% 70,1% (0,1) pp 69,1% 70,1% (1,1) pp 71,4% 70,1% 1,3 pp 71,8% 68,6% 3,2 pp
Despesas Vendas, Marketing e Logística/Receita Líquida 38,7% 37,3% 1,5 pp 37,1% 35,6% 1,5 pp 48,5% 48,3% 0,2 pp 56,4% 51,1% 5,2 pp
Despesas Adm., P&D, TI e Projetos/Receita Líquida 17,4% 16,6% 0,9 pp 15,5% 14,7% 0,7 pp 7,2% 9,0% (1,8) pp 11,7% 12,9% (1,2) pp
Margem Líquida 7,5% 9,2% (1,7) pp 8,8% 11,8% (3,0) pp 13,0% 11,4% 1,6 pp 2,5% 5,4% (2,8) pp
Margem EBITDA 18,2% 19,4% (1,2) pp 21,0% 23,1% (2,2) pp 16,2% 14,0% 2,3 pp 4,9% 6,8% (1,9) pp
(*) EBITDA = Lucro operacional antes dos efeitos financeiros, impostos, depreciação e amortização.

Comentário de Desempenho 1T14
6
5,9% 6,7%12,0%
15,5% 15,2%
2,1% 1,1%5,4%
9,3% 9,1%
31,3%36,7%
40,4%
34,6%
36,4%
1T13 2T13 3T13 4T13 1T14
Crescimento Receita Líquida (R$ - % vs ano anterior)
Consolidado Brasil Operações em Consolidação e Implantação
3.1. receita líquida
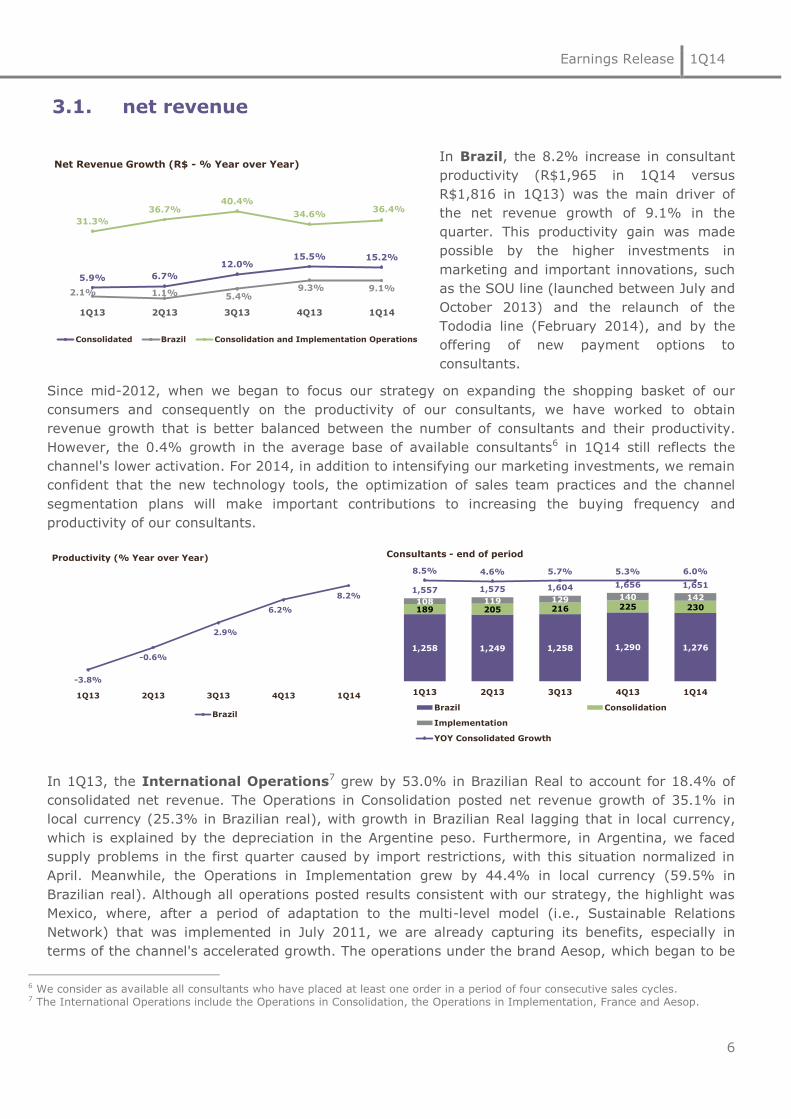
No Brasil, o aumento de 8,2% de
produtividade das consultoras (R$1.965 no
1T14 vs R$1.816 no 1T13) foi o principal
fator que contribuiu para o crescimento de
9,1% da receita líquida no trimestre. A
intensificação dos investimentos em
marketing e inovações relevantes como a
linha SOU (lançada entre julho e outubro de
2013) e o relançamento da linha Tododia
(fevereiro de 2014), bem como a oferta de
novas opções de pagamentos às consultoras
permitiram esse aumento de produtividade.
Desde meados de 2012, quando direcionamos nossa estratégia para aumentar a cesta de compra de
nossos consumidores e, consequentemente, a produtividade das consultoras, já planejávamos um
crescimento de receita com melhor equilíbrio entre número de consultoras e produtividade. No
entanto, o crescimento no 1T14 de 0,4% da base média de consultoras disponíveis6 ainda reflete uma
menor ativação do canal. Para 2014, além da intensificação dos investimentos em marketing,
seguimos confiantes que as novas ferramentas de tecnologia, o aprimoramento das práticas de nossa
força de vendas e iniciativas de segmentação do canal serão elementos importantes para a ativação e
produtividade das consultoras.
No 1T13, as Operações Internacionais7 cresceram 53,0% em Reais, representando 18,4% da
receita líquida consolidada. As Operações em Consolidação cresceram 35,1% em moeda local (25,3%
em Reais), sendo que o crescimento em Reais abaixo do crescimento em moeda local explica-se pela
desvalorização do Peso Argentino. Além disso, na Argentina durante o primeiro trimestre enfrentamos
problemas no abastecimento por restrições de importação, situação já regularizada durante o mês
abril. Já as Operações em Implantação cresceram 44,4% em moeda local (59,5% em Reais). Todas
as operações apresentaram resultados coerentes com a nossa estratégia, com destaque para o
México, onde após um período de adaptação e ajustes no modelo multinível “Rede de Relações
Sustentáveis”, implantado em julho de 2011, já estamos capturando os benefícios desse modelo,
6 Consideramos como disponíveis todas as consultoras que fazem ao menos um pedido num período de 4 ciclos de vendas consecutivos. 7 Operações Internacionais inclui Operações em Consolidação, Operações em Implantação, França e Aesop.
-3,8%
-0,6%
2,9%
6,2%
8,2%
1T13 2T13 3T13 4T13 1T14
Produtividade (% vs ano anterior)
Brasil
1.258 1.249 1.258 1.290 1.276
189 205 216 225 230108 119 129 140 142
1.557 1.575 1.604 1.656 1.651
8,5% 4,6% 5,7% 5,3% 6,0%
1T13 2T13 3T13 4T13 1T14
Consultoras - posição final do período
Brasil em Consolidação
em Implantação
Cresc. Consolidado YOY

Comentário de Desempenho 1T14
7
principalmente com relação ao crescimento acelerado do canal. A operação sob a marca Aesop, que
foi consolidada nos resultados da Natura desde março de 2013, manteve um crescimento acelerado e
em linha seu plano de expansão, encerrando o trimestre com 82 lojas conceito em 10 países8.
3.2. inovação & produtos
O índice de inovação9, com base nos
últimos 12 meses findos em março de 2014,
foi de 62,4% frente a 65,0% do mesmo
período do ano anterior, dentro do patamar
esperado.
Os lançamentos recentes, como a linha SOU
(entre julho e outubro de 2013) e o
relançamento da linha Tododia (fevereiro de
2014), além de o plano de inovação para os
próximos meses, contribuirão para o aumento da produtividade das consultoras e consequente
manutenção do índice de inovação entre o patamar esperado de 60 e 70%.
3.3. margem bruta
No 1T14, a margem bruta consolidada se manteve no mesmo patamar do ano anterior, resultado da
expansão das margens nas operações internacionais e da retração no Brasil. Nas operações
internacionais, mantivemos a tendência de expansão observada nos trimestres anteriores em função
de uma situação cambial ainda favorável em alguns países e também da incorporação da elevada
margem bruta da AESOP. No Brasil, como planejado e já observado desde o 3T13, a retração da
margem foi resultado do aumento do esforço promocional para reativar nossa base de consultoras,
bem como pelo impacto de uma situação cambial que ainda não foi plenamente compensada pelo
reajuste de preços realizado em março de 2014.
O quadro abaixo exibe o custo aberto em seus principais componentes:
8 Austrália, Hong Kong, Japão, Malásia, Cingapura, França, Alemanha, Suíça, Reino Unido e Estados Unidos. 9 Índice de Inovação: participação nos últimos 12 meses da venda dos produtos lançados nos últimos 24 meses.
65,0% 65,3% 63,8% 63,4% 62,4%
1T13 2T13 3T13 4T13 1T14
Inovação (%RL)
1T14 1T13
78,4 79,5
10,4 11,7
3,7 2,9
7,6 5,9
Total 100,0 100,0
*Matéria - Prima, Material de Embalagem e Produto Acabado
MP / ME / PA*
Mão de Obra
Depreciação
Outros
70,1%
70,7%70,8%
68,5% 70,0%70,1%
70,3% 70,4%
67,5%
69,1%69,6%
71,5%
70,5% 70,9%71,6%
1T13 2T13 3T13 4T13 1T14
Margem Bruta (%RL)
Consolidado Brasil Operações em Consolidação e Implantação

Comentário de Desempenho 1T14
8
3.4. despesas operacionais
No Brasil, o aumento das despesas com
vendas, marketing e logística foi resultado
principalmente dos maiores investimentos em
marketing para a ativação do canal e
relançamento de uma das nossas principais
submarcas (linha Tododia) e pelo
reconhecimento de uma perda não recorrente
relacionada às negociações do processo de
cobrança, demonstrando uma menor
expectativa de recebimento dos acordos
provenientes dos títulos que já foram
baixados. Nas operações internacionais também intensificamos os investimentos em marketing para
alavancar o bom momento de crescimento de canal advindo do modelo Rede de Relações
Sustentáveis no México.
As despesas administrativas, P&D, TI e
Projetos no Brasil apresentaram aumento
do percentual relativo à receita líquida pelo
aumento das despesas de depreciação, pela
continuidade dos investimentos em projetos
estratégicos e tecnologia da informação e
custos não recorrentes de indenização
referentes à otimização de nossa estrutura.
As ações em curso já descritas
anteriormente visam à captura de eficiência
neste grupo de despesas que virá ao longo
dos próximos trimestres. Já nas Operações
Internacionais, houve diluição de despesas nas Operações em Consolidação, enquanto que nas
Operações em Implantação o preenchimento de posições em aberto no primeiro trimestre de 2013
contribuiu para o crescimento desta despesa.
3.5. outras despesas e receitas operacionais
No 1T14, no resultado consolidado, tivemos receita de R$ 11,3 milhões frente à despesa de R$ 0,3
milhão no 1T13. A receita de 2014 é fruto em especial de R$ 6,2 milhões de créditos extemporâneos
de ICMS sobre devoluções e de R$ 6,2 milhões do ajuste no preço de aquisição referente aos
distribuidores da Aesop, conforme nota explicativa número 26 das demonstrações financeiras.
3.6. outros investimentos internacionais
Os outros investimentos internacionais, que dizem respeito à operação na França, à estrutura
corporativa internacional baseada em Buenos Aires e à AESOP, registraram prejuízo (EBITDA) de R$
10,7 milhões no 1T14 (prejuízo de R$ 27,5 milhões no 1T13). A redução do prejuízo deve-se ao
35,6%
49,2%
37,1%
51,5%
Despesas com Vendas, Marketing e Logística (%RL)
1T13 1T14
BrasilOperações em Consolidação e
Implatação
14,7%
10,3%
15,5%
8,9%
Despesas Administrativas, P&D, TI, Projetos (%RL)
1T13 1T14
BrasilOperações em Consolidação e
Implatação

Comentário de Desempenho 1T14
9
resultado positivo da AESOP10 e ao reconhecimento do ajuste de preço de aquisição já comentado no
item 3.5. Adicionalmente, a desvalorização do Peso Argentino frente ao Real contribuiu positivamente
para a manutenção das despesas corporativas em termos nominais.
3.7. EBITDA
No 1T14, o EBITDA consolidado totalizou R$ 283,6 milhões e cresceu 8,2% frente ao mesmo período
de 2013 (margem EBITDA de 18,2% no 1T14 versus 19,4% no 1T13). No Brasil a retração do EBITDA
se comparado com o mesmo período do ano anterior foi causada por uma redução da margem bruta
pelo impacto cambial anterior ao reajuste de preço e pelas promoções para as consultoras, pelos
maiores investimentos em marketing e em projetos estratégicos e TI, bem como por efeitos não
recorrentes referentes a ajustes no critério de reconhecimento de recuperação de acordos e
adequação da estrutura organizacional. Nas Operações em Consolidação tivemos uma expansão de
230 pontos base na margem EBITDA em relação ao 1T13, devido principalmente aos ganhos em
margem bruta e alavancagem das despesas operacionais. Já nas Operações em Implantação, como
planejado, tivemos uma retração de 190 pontos base na margem em função da intensificação dos
investimentos em marketing, especialmente em nossa Operação no México.
EBITDA (R$ milhões) Dados contemplam operação e custo de transação da AESOP
O aumento de despesas com depreciação e amortização (34,3% no trimestre) é resultado dos
investimentos realizados em infraestrutura (logística e manufatura) e tecnologia da informação.
EBITDA pró-forma por bloco de operações (R$ milhões) Dados contemplam operação e custo de transação da AESOP
10 No 1T13 registramos apenas o resultado de março de 2013, já que a conclusão da aquisição ocorreu em 28 de fevereiro de 2013. Adicionalmente, naquele mesmo trimestre também incorremos em custos de aquisição que contribuíram negativamente para o resultado dos “outros investimentos internacionais”.
1T14 1T13 Var %
Receita Líquida 1.556,2 1.351,3 15,2
(-) Custos e Despesas 1.329,1 1.131,4 17,5
EBIT 227,1 219,8 3,3
Ajustes de Participação dos minoritários 0,0 0,2 n/d
(+) Depreciação / amortização 56,5 42,1 34,3
EBITDA 283,6 262,1 8,2
1T14 1T13 Var %
Brasil 266,4 269,5 (1,2)
Argentina, Chile e Peru 23,5 16,2 45,5
México, Colômbia 4,4 3,8 15,2
Outros Investimentos (10,7) (27,5) n/d
EBITDA 283,6 262,1 8,2

Comentário de Desempenho 1T14
10
3.8. lucro líquido
No 1T14, o lucro líquido consolidado
retraiu em 6% frente ao mesmo período
do ano passado. Três fatores explicam a
retração do lucro: a) o aumento de 34,3%
das despesas com depreciação e
amortização, resultado dos investimentos
em logística, capacidade produtiva e
tecnologia da informação realizados nos
últimos anos; b) o aumento de 37,3% do
resultado financeiro em função do maior
nível de endividamento e do aumento da taxa básica de juros no Brasil, conforme o planejado; e c)
efeito de linearização11 da alíquota de imposto de renda de 2013, pois durante os primeiros trimestres
do ano anterior, a alíquota se manteve em torno de 31,5% e somente no quarto trimestre esta
alíquota foi ajustada para refletir 32,5% no ano, alíquota esta em linha com o 1T14.
Esses três impactos, por se tratarem da linearização de imposto de renda e de despesas não
relacionadas ao crescimento do negócio no curto prazo, serão balanceados ao longo do ano
resultando em um melhor equilíbrio entre o crescimento do negócio e o crescimento do lucro líquido.
Excluindo o impacto da marcação a mercado de derivativos atrelados a dívida em moeda estrangeira,
a despesa financeira líquida aumentou 55,9% frente ao mesmo período do ano anterior, contribuindo
para uma retração de 9,2% do lucro líquido ajustado.
3.9. fluxo de caixa12
No 1T14, a geração interna de caixa foi de R$ 138,6 milhões, com retração de 24,7% frente ao 1T13,
resultado principalmente da retração do lucro líquido e do impacto negativo do IR diferido nos itens
não caixa.
No período, os R$ 134,5 milhões investidos em capex (R$ 60,7 milhões no 1T13) foram destinados à
conclusão do Ecoparque (Benevides, PA), ao estagio final da nova fábrica em Cajamar e aos
investimentos em tecnologia da informação. Para o ano, mantemos a projeção de R$ 500 milhões,
inferior as R$ 553,9 milhões do ano anterior, com uma distribuição mais linear ao longo dos
11 Efetuamos a linearização da taxa efetiva do imposto de renda e contribuição social com base na projeção de resultados tributáveis do ano. Os períodos trimestrais são ajustados para esta estimativa através do reconhecimento de um imposto de renda diferido, conforme demonstrado na nota explicativa 10 das demonstrações financeiras intermediárias. 12 No fluxo de caixa pró-forma alguns valores de 2013 foram reclassificados para itens não caixa para uma melhor comparação com 1T14. Além disso, com a reclassificação de alguns saldos do balanço de 2012 (conforme notas explicativas número 4.3 das Demonstrações Financeiras de 4T13) a variação de capital de giro até mar/13 foi recalculada e reapresentada.
Valores em R$ milhões 1T14 1T13 Var. R$
Receitas / (Despesas) Financeiras, líquidas (51,9) (37,8) (14,1)
Ajuste de Marcação ao Mercado (0,3) (4,7) 4,4
Receitas / (Despesas) Financeiras ex. Marcação a Mercado, líquidas (51,6) (33,1) (18,5)
9,2%
14,0%
10,3%
13,6%
7,5%
1T13 2T13 3T13 4T13 1T14
Margem Líquida (%RL)

Comentário de Desempenho 1T14
11
trimestres em comparação com os anos anteriores. Frente ao 1T13, esta diferença de faseamento dos
investimentos em capex contribuiu para a redução de R$ 104,9 milhões na geração de caixa livre.
O capital de giro médio do período melhorou 0,3pp como percentual da receita líquida, refletindo por
um lado uma estabilidade na cobertura de estoques e um aumento esperado do prazo médio de
pagamento, e, por outro, o aumento de prazo de recebimento das nossas consultoras no Brasil em
linha com a inclusão dos novos meios de pagamento. Impostos a recuperar e redução da cobertura de
estoques seguem sendo oportunidades a serem capturadas nos próximos trimestres.
3.10. endividamento
O aumento do endividamento total e da dívida líquida reflete principalmente os investimentos em
CAPEX e maior necessidade de capital de giro, permanecendo dentro dos patamares esperados para o
final do primeiro trimestre de 2014.
R$ milhões 1T14 1T13 Var. R$ Var. %
Lucro líquido do período 117,2 124,6 (7,5) (6,0)
Depreciações e amortizações 56,5 42,1 14,4 34,3
Itens não caixa / Outros* (35,1) 17,4 (52,5) n/d
Geração interna de caixa 138,6 184,1 (45,5) (24,7)
(Aumento) / Redução do Capital de Giro (227,8) (242,2) 14,4 n/d
Geração operacional de caixa (89,3) (58,1) (31,1) 53,6
Adições do imobilizado e intangível (134,5) (60,7) (73,8) 121,6
Geração de caixa livre** (223,8) (118,8) (104,9) 88,3
Favorável / (desfavorável)
(*) Para efeito de melhor divulgação e comparação, alguns saldos de 2013 foram reclassificados
(**) (Geração interna de caixa) +/- (variações no capital de giro e realizável a longo prazo) - (aquisições de ativo imobilizado).
Endividamento R$ Mil mar-14 Part (%) mar-13 Part (%) Var. (%)
Curto Prazo 759,7 23,9 968,3 41,6 (21,5)
Longo Prazo 2.821,9 88,8 1.648,3 70,9 71,2
Instrumentos financeiros derivativos (85,8) (2,7) (54,3) (2,3) 58,0
Arrendamentos Mercantis - Financeiros (319,2) (10,1) (236,6) (10,2) 34,9
Total da Dívida 3.176,5 100,0 2.325,6 100,0 36,6
(-) Caixa e Aplicações Financeiras 1.781,4 1.536,0 16,0
(=) Endividamento Líquido - Caixa Líquido 1.395,1 789,6 76,7
Dívida Líquida / Ebitda 0,86 0,53
Total Dívida / Ebitda 1,95 1,55

Comentário de Desempenho 1T14
12
4. desempenho NATU3
No 1T14, as ações da Natura tiveram uma desvalorização de 6,3% frente a 31 de dezembro de 2013,
enquanto o Ibovespa desvalorizou-se 2,9%. O volume médio diário negociado no 1T14 foi de R$ 57,6
milhões frente a R$ 78,6 milhões no mesmo período do ano anterior.
No mesmo período, nossa posição média no Índice de Negociabilidade da BOVESPA foi 38º.
O gráfico abaixo demonstra o desempenho das ações Natura desde o seu lançamento (IPO):
+603,0%
0
200
400
600
800
1000
1200
1400
Base 100 = 26/05/2004
Bovespa Index
NATU3
NATU3: +87,3%
Ibov: +38,9%+38,0%
+27,7%+51,2%
+32,9%-41,4%
+43,7%+18,0%
- 41,2%+101,9%
+82,6%
NATU3
26/05/2004
R$ 5,42
2004 2005 2006 2007 2008 2009 2010
NATU3
31/03/2014
R$ 38,12
+164,5%
Follow On
31/07/2009
R$ 21,74
2011
-20,4%
-18,1%
2012
+69,0%
+7,3%
2013
+36,7%
+1,1%-26,6%
-15,5%
Todos os preços apresentados ex-dividendos.

Comentário de Desempenho 1T14
13
teleconferência
& webcast
PORTUGUÊS: Sexta-feira, 25 de abril de 2014
10h00 – horário de Brasília
INGLÊS: Sexta-feira, 25 de abril de 2014
12h00 – horário de Brasília
Participantes do Brasil: +55 11 3193 1001 /+55 11 2820 4001
Participantes dos EUA: Toll Free + 1 888 700 0802
Participantes de outros países: +1 786 924 6977
Senha para os participantes: Natura
Transmissão ao vivo pela internet:
www.natura.net/investidor
relações
com investidores
Telefone: (11) 4196-1421
Fabio Cefaly, [email protected]
Tatiana Bravin, [email protected]
Francisco Petroni, [email protected]
Julia Villas Bôas, [email protected]

Comentário de Desempenho 1T14
14
balanços
patrimoniais em março de 2014 e dezembro de 2013 (em milhões de reais - R$)
ATIVO mar-14 dez-13 PASSIVO mar-14 dez-13
CIRCULANTE CIRCULANTE
Caixa e equivalentes de caixa 1.379,6 1.016,3 Empréstimos e financiamentos 759,7 693,1
Títulos e valores mobiliários 401,8 293,0 Fornecedores e outras contas a pagar 666,8 706,6
Contas a receber de clientes 753,0 807,0 Salários, participações nos resultados e encargos sociais 151,6 177,6
Estoques 912,8 799,5 Obrigações tributárias 596,1 659,3
Impostos a recuperar 183,0 181,1 Outras obrigações 62,4 90,2
Instrumentos financeiros derivativos 85,8 153,6 Total do passivo circulante 2.236,6 2.326,8
Outros ativos circulantes 261,0 262,4
Total do ativo circulante 3.977,1 3.512,9
NÃO CIRCULANTE NÃO CIRCULANTE
Realizável a longo prazo: Empréstimos e financiamentos 2.821,9 2.200,8
Impostos a recuperar 187,1 175,1 Obrigações tributárias 225,6 215,6
Imposto de renda e contribuição social diferidos 220,5 193,8 Provisão para riscos tributários, cíveis e trabalhistas 77,1 73,8
Depósitos judiciais 426,5 412,4 Outras provisões 258,9 263,0
Outros ativos não circulantes 29,1 37,2 Total do passivo não circulante 3.383,5 2.753,2
Imobilizado 1.539,2 1.439,7
Intangível 514,7 477,3 PATRIMÔNIO LÍQUIDO
Total do ativo não circulante 2.917,1 2.735,4 Capital social 427,1 427,1
Reservas de capital 148,3 150,4
Reservas de lucros 280,4 162,6
Ações em tesouraria (71,0) (84,0)
Dividendo adicional proposto 496,4 496,4
Outros resultados abrangentes (31,6) (6,9)
Total do patrimônio líquido - acionistas controladores 1.249,5 1.145,6
Participação dos acionistas não controladores no patrimônio
líquido das controladas
Total do patrimônio líquido 1.274,0 1.168,3
TOTAL DO ATIVO 6.894,2 6.248,3 TOTAL DO PASSIVO E PATRIMÔNIO LÍQUIDO 6.894,2 6.248,3
24,5 22,6

Comentário de Desempenho 1T14
15
demonstrações
dos resultados para os exercícios findos em 31 de março de 2014 e de 2013
(R$ milhões) 1T14 1T13
RECEITA LÍQUIDA 1.556,2 1.351,3
Custo dos produtos vendidos (466,5) (403,9)
LUCRO BRUTO 1.089,7 947,3
(DESPESAS) RECEITAS OPERACIONAIS
Despesas com Vendas, Marketing e Logística (602,7) (503,5)
Despesas Administrativas, P&D, TI e Projetos (271,1) (223,8)
Outras receitas (despesas) operacionais, líquidas 11,3 (0,3)
Receitas financeiras 124,0 66,2
Despesas financeiras (175,9) (104,0)
Imposto de renda e contribuição social (57,1) (57,4)
ATRIBUÍVEL A
Acionistas da Sociedade 117,2 124,8
Não controladores 0,9 (0,2)
118,1 124,6
LUCRO ANTES DO IMPOSTO DE RENDA E DA
CONTRIBUIÇÃO SOCIAL182,0175,2
LUCRO ANTES DA PARTICIPAÇÃO
DE NÃO CONTROLADORES118,1 124,6
LUCRO OPERACIONAL ANTES DO
RESULTADO FINANCEIRO
227,1 219,8

Comentário de Desempenho 1T14
16
demonstrações
dos fluxos de caixa para os exercícios findos em 31 de março de 2014 e de 2013
(R$ milhões) 1T14 1T13
FLUXO DE CAIXA DAS ATIVIDADES OPERACIONAIS
Lucro líquido do período 117,2 124,6
Depreciações e amortizações 56,5 42,1
Reversão decorrente dos contratos de operações com derivativos "swap" e "forward" 40,0 50,6
Provisões para riscos tributários, cíveis e trabalhistas 3,3 (2,0)
Atualização monetária de depósitos judiciais (8,2) (3,8)
Imposto de renda e contribuição social 57,1 57,0
Resultado na venda e baixa de ativo imobilizado e intangível 19,4 7,1
Juros e variação cambial sobre empréstimos e financiamentos (41,3) (5,3)
Variação cambial sobre outros ativos e passivos (25,0) 1,2
Despesas com planos de outorga de opções de compra de ações 2,5 3,4
Provisão para créditos de liquidação duvidosa 6,1 (7,8)
Provisão (Reversão) para perdas nos estoques (7,5) 3,4
Lucro líquido do período atribuível a não controladores 1,9 0,0
Provisão com plano de assistência médica e créditos carbono 0,8 (1,0)
Reconhecimento de crédito tributário extemporâneo (6,2) 0,0
Provisão para aquisição de participação de não controladores 3,2 0,0
219,6 269,4
(AUMENTO) REDUÇÃO DOS ATIVOS
Contas a receber de clientes 48,0 55,0
Estoques (105,8) (107,8)
Impostos a recuperar (7,7) (32,4)
Outros ativos 9,5 (72,1)
Subtotal (56,0) (157,3)
AUMENTO (REDUÇÃO) DOS PASSIVOS
Fornecedores nacionais e estrangeiros (41,0) (25,9)
Salários, participações nos resultados e encargos sociais, líquidos (26,0) (60,7)
Obrigações tributárias (19,5) (11,5)
Outros passivos (28,5) 40,6
Provisão para riscos tributários, cíveis e trabalhistas 0,0 (1,0)
Subtotal (115,0) (58,5)
CAIXA GERADO PELAS ATIVIDADES OPERACIONAIS 48,6 53,7
Ajustes para reconciliar o lucro líquido do exercício com o caixa líquido gerado pelas atividades
operacionais:

Comentário de Desempenho 1T14
17
OUTROS FLUXOS DE CAIXA DAS ATIVIDADES OPERACIONAIS
Pagamentos de imposto de renda e contribuição social (117,7) (89,0)
Levantamento (pagamento) de depósitos judiciais (5,9) (14,2)
Pagamentos de recursos por liquidação de operações com derivativos 27,8 (24,0)
Pagamento de juros sobre empréstimos e financiamentos (26,5) (14,1)
CAIXA LÍQUIDO GERADO PELAS ATIVIDADES OPERACIONAIS (73,7) (87,6)
FLUXO DE CAIXA DAS ATIVIDADES DE INVESTIMENTO
Adições de imobilizado e intangível (134,6) (60,7)
Imobilizado incorporado pela Compra AESOP 0,0 (129,1)
Recebimento pela venda de ativo imobilizado e intangível 0,0 1,1
Aplicação em títulos e valores mobiliários (1.524,7) 962,3
Resgate de títulos e valores mobiliários 1.415,9 (770,1)
Caixa adquirido na combinação de negócios 0,0 18,7
CAIXA LÍQUIDO UTILIZADO NAS ATIVIDADES DE INVESTIMENTO (243,3) 22,2
FLUXO DE CAIXA DAS ATIVIDADES DE FINANCIAMENTO
Amortização de empréstimos e financiamentos - principal (59,8) (56,4)
Captações de empréstimos e financiamentos 729,6 196,1
Utilização de ações em tesouraria pelo exercício de opções de compra de ações 8,9 10,9
CAIXA LÍQUIDO GERADO (UTILIZADO) NAS ATIVIDADES DE FINANCIAMENTO 678,7 150,6
Efeito de variação cambial sobre o caixa e equivalentes de caixa 1,6 0,0
AUMENTO (REDUÇÃO) NO CAIXA E EQUIVALENTES DE CAIXA 363,2 85,2
Saldo inicial do caixa e equivalentes de caixa 1.016,3 1.144,4
Saldo final do caixa e equivalentes de caixa 1.379,6 1.229,6
AUMENTO (REDUÇÃO) NO CAIXA E EQUIVALENTES DE CAIXA 363,3 85,2
Informações adicionais às demonstrações dos fluxos de caixa:
Limites de contas garantidas sem utilização 117,9 117,9
Itens não caixa
Reserva para aquisição de não controladores 83,2 0,0
Capitalização de leasing financeiro 78,2 171,8

Comentário de Desempenho 1T14
18
glossário
_CDI: Certificado de depósito interbancário.
_CN: Revendedoras autônomas, que não têm relação de emprego com a Natura, também chamadas Consultoras Natura.
_CNO: Revendedoras autônomas, que não têm relação de emprego conosco, e apoiam as Gerentes de Relacionamento em
suas atividades, também chamadas de Consultoras Natura Orientadoras.
_Comunidades Fornecedoras: Comunidades de agricultores familiares e extrativistas de diversas localidades do Brasil –
majoritariamente da Região Amazônica que extraem de forma sustentável insumos da sociobiodiversidade utilizados em nossos
produtos. Estabelecemos com essas comunidades cadeias produtivas que se pautam pelo preço justo, repartição de benefícios
pelo acesso ao patrimônio genético e aos conhecimentos tradicionais associados e apoio a projetos de desenvolvimento
sustentável local. Esse modelo de negócio tem se mostrado efetivo na geração de valor social, econômico e ambiental para a
Natura e para as comunidades.
_GEE: Gases de Efeito Estufa.
_Índice de Inovação: Participação nos últimos 12 meses da venda dos produtos lançados nos últimos 24 meses.
_Instituto Natura: é uma organização sem fins lucrativos criada em 2010 para fortalecer e ampliar nossas iniciativas de
Investimento Social Privado. Sua criação nos permitiu potencializar os esforços e investimentos em ações que contribuam para
a melhoria da qualidade do ensino público.
_Mercado Alvo: Referente aos dados de mercado alvo da SIPATESP/Abihpec. Considera somente os segmentos nos quais a
Natura opera. Exclui fraldas, itens de higiene oral, tintura para cabelo, esmaltes, absorventes dentre outros.
_Operações em Consolidação: Agrupamento das operações: Argentina, Chile e Peru.
_Operações em Implantação: Agrupamento das Operações: Colômbia e México.
_PLR: Participação nos Lucros e Resultados.
_Programa Natura Crer Para Ver: Linha especial de produtos não cosméticos, cujo lucro é revertido para o Instituto Natura,
no Brasil, e investido pela Natura em ações sociais nos demais países onde operamos. Nossas consultoras e consultores se
engajam nas vendas em prol de seu benefício social, sem obter ganhos.
_Rede de Relações Sustentáveis: Modelo Comercial adotado no México que contempla oito etapas de avanço da consultora:
Consultora Natura, Consultora Natura Empreendedora, Formadora Natura 1 e 2, Transformadora Natura 1 e 2, Inspiradora
Natura e Associada Natura. Para ascender na atividade, é preciso atender a critérios de volume de vendas, atração de novas
consultoras e – como diferencial dos demais modelos existentes no país – desenvolvimento pessoal e de relações
socioambientais na comunidade.
_Repartição de Benefícios: Com base na Política Natura de Uso Sustentável da Biodiversidade e do Conhecimento
Tradicional Associado, é utilizada a premissa de repartir benefícios sempre que percebermos diferentes formas de valor nos
acessos que realizamos. Sendo assim, uma das práticas que definem a forma como esses recursos serão divididos é associar
pagamentos ao número de matérias-primas produzidas a partir de cada planta e ao sucesso comercial dos produtos para os
quais essas matérias-primas servem de insumo.
_Sipatesp/Abihpec: Sindicato da Indústria de Perfumarias de Artigos de Toucador do Estado de São Paulo / Associação
Brasileira da Indústria de Higiene Pessoal, Perfumaria e Cosméticos.
reapresentações
_Demonstrativo de Resultados pró-forma do 1T13 contempla três reclassificações no Brasil, e consequentemente no Consolidado, para uma melhor comparação com o 1T14. Estes ajustes não impactam os valores de EBITDA e Lucro Líquido anteriormente divulgados. Estas reclassificações entre linhas são: (1) reclassificação para o “Custo de Mercadoria Vendida” das despesas de provisão de participação nos lucros de colaboradores que estavam alocadas em “despesas administrativas, P&D, TI e projetos”; (2) reclassificação de parte das “despesas com vendas, marketing e logística” para “despesas administrativas, P&D, TI e projetos” para melhor refletir a nossa nova organização alinhada ao plano estratégico; e (3) “Despesas Administrativas, P&D, TI e Projetos” consolidando a antiga linha de “Remuneração dos Administradores”, cujos detalhes estão disponíveis na nota explicativa número 28.2 das Demonstrações de Resultados Financeiros. Nos próximos trimestres, esses mesmos ajustes serão feitos nos valores de 2013.
_Composição do Custo 1T13: Reapresentação dos valores do quadro entre as linhas para refletir o ajuste (1) descrito acima.
_Itens não caixa: reapresentação dos valores do 1T13 para melhor comparação.
_Capital de Giro 1T13: Com a reclassificação de alguns saldos do balanço de 2012 (conforme notas explicativas número 4.3 das Demonstrações Financeiras de 4T13), a variação do capital de giro do 1T13 foi recalculada e reapresentada.

Comentário de Desempenho 1T14
19
O EBITDA não é uma medida utilizada nas práticas contábeis adotadas no Brasil, não representando o
fluxo de caixa para os períodos apresentados. Também não deve ser considerado como uma
alternativa ao lucro líquido na qualidade de indicador do desempenho operacional ou uma alternativa
ao fluxo de caixa na qualidade de indicador de liquidez. O EBITDA não tem um significado
padronizado e sua definição na Sociedade, eventualmente, pode não ser comparável ao LAJIDA ou
EBITDA definido por outras companhias. Ainda que o EBITDA não forneça, de acordo com as práticas
contábeis adotadas no Brasil, uma medida do fluxo de caixa, a Administração o utiliza para mensurar
o desempenho operacional da Sociedade. Adicionalmente, entendemos que determinados investidores
e analistas financeiros utilizam o EBITDA como indicador do desempenho operacional de uma
companhia e/ou de seu fluxo de caixa.
Este relatório contém informações futuras. Tais informações não são apenas fatos históricos, mas
refletem os desejos e as expectativas da direção da Natura. As palavras “antecipa”, “deseja”,
“espera”, “prevê”, “pretende”, “planeja”, “prediz”, “projeta”, “almeja” e similares, pretendem
identificar afirmações que, necessariamente, envolvem riscos conhecidos e desconhecidos. Riscos
conhecidos incluem incertezas, que não são limitadas ao impacto da competitividade dos preços e
produtos, aceitação dos produtos no mercado, transições de produto da Companhia e seus
competidores, aprovação regulamentar, moeda, flutuação da moeda, dificuldades de fornecimento e
produção e mudanças na venda de produtos, dentre outros riscos. Este relatório também contém
algumas informações “pró-forma”, elaboradas pela Companhia a título exclusivo de informação e
referência, portanto, são grandezas não auditadas. Este relatório está atualizado até a presente data
e a Natura não se obriga a atualizá-lo mediante novas informações e/ou acontecimentos futuros.
Earnings Release 1Q14
0
São Paulo, April 23, 2014 – Natura
Cosméticos S.A. (BM&FBovespa: NATU3)
announces today its results for the first
quarter of 2014 (1Q14). Except where
stated otherwise, the financial and
operating information in this release is
presented on a consolidated basis, in
accordance with International Financial
Reporting Standards (IFRS).

Earnings Release 1Q14
1
Consistent revenue growth and continued investment in structural projects
In the first quarter of 2014, Natura's consolidated net revenue grew by 15.2% compared to 1Q13
(9.1% in Brazil and 53% in International Operations), EBITDA amounted to R$283.6 million and net
income came to R$117.2 million.
In Brazil, the persistence of the more challenging competitive environment is aligned with the decision
to increase investments in marketing and innovation aimed at boosting the productivity of our
consultants, always committed to finance these initiatives through the capture of efficiency gains in
our current operations.
Following the trend observed in the last two quarters of 2013, in 1Q14, the marketing investments,
product launches (with the highlight the relaunch of the Tododia line) and expansion in payment
options supported an increase in our consultant productivity of 8.2% from last year (or 4.2% in the
last 12 months) and net revenue growth of 9.1%.
Meanwhile, in Latin America (excluding Brazil), where the operations grew by 37.4% in local currency,
the highlight was Mexico, where the multi-level model (Sustainable Relations Network) has supported
strong and consistent results since 2Q13. The entire International Operations (including Aesop), which
accounted for 18.4% of consolidated net revenue in the period, grew by 53% compared to 1Q13. The
Aesop brand, which was acquired in March 2013, now has 82 concept stores in 10 countries,
compared to 58 stores in 1Q13.
Consolidated EBITDA grew 8.2% in the period,
with EBITDA margin of 18.2% (19.4% margin
in 1Q13). While the International Operations1
improved from the EBITDA loss of R$7.5
million (EBITDA margin of -4%) to positive
EBITDA of R$17.3 million2 (EBITDA margin of
6%), in Brazil certain factors proved decisive
in the 1.2% decrease in EBITDA from 1Q13:
the intensification of marketing investments;
the continued impacts on gross margin from
local-currency depreciation (the price
increases were implemented in March); and
the nonrecurring costs of R$21 million related
to the adjustments to the criteria for
recognizing the recoverability of written-off
receivables from Consultants and the
optimization of the company's organizational
structure.
The investments made are appropriate to
boost our competitiveness in the local market,
and we are also implementing initiatives to
capture productivity and maintain profitability
at levels similar to those of prior years. Some
1 International Operations includes Operations in Consolidation, Operations in Implementation and other International Investments (France, Aesop and corporate structure based in Buenos Aires). 2 Includes a R$6.2 million gain from the adjustment to the acquisition price of AESOP distributors.
(R$ million) 1Q14 1Q13
Brazil Gross Revenue 1,734.7 1,596.7 8.6
International Gross Revenue 350.5 235.7 48.7
Consolidated Gross Revenue 2,085.2 1,832.4 13.8
Brazil Net Revenue 1,270.5 1,164.5 9.1
International Net Revenue* 285.7 186.7 53.0
Consolidated Net Revenue 1,556.2 1,351.3 15.2
% Share International Net Revenue 18.4% 13.8% 4.5 pp
Brazil pro-forma EBITDA 266.4 269.5 (1.2)
% Brazil pro-forma EBITDA Margin 21.0% 23.1% (2.2) pp
International pro-forma EBITDA 17.3 (7.5) n/d
% International pro-forma EBITDA Margin 6.0% (4.0)% 10.0 pp
EBITDA Consolidado 283.6 262.1 8.2
% Margem EBITDA Consolidada 18.2% 19.4% (1.2) pp
Consolidated Net Income 117.2 124.6 (6.0)
% Consolidated Net Margin 7.5% 9.2% (1.7) pp
Internal cash generation 138.6 184.1 (24.7)
Free cash flow (223.8) (118.8) 88.3
Net Debt / EBITDA 0.86 0.53
*Local currency growth ex. Acquisition: 37.4% em 1Q14 vs. 1Q13

Earnings Release 1Q14
2
of the most relevant initiatives of these are:
_price increases to rebuild margins given the more challenging foreign exchange environment and
higher inflationary pressures, with the most important price increases implemented already in
March;
_the use of the newly built logistics capacity, with the highlight the new distribution center in São
Paulo, which will support higher dilution of logistics fixed costs and operating efficiency gains;
_advances in the collections process, with the adoption of methods and tools better suited to the
different stages of overdue receivables;
_more effective and efficient marketing investments;
_productivity gains in administrative expenses and efficiency gains in expenses with the sales
team.
Despite the 8.2% growth in consolidated EBITDA, net income contracted by 6.0% from 1Q13, which
is explained by the capital expenditure disbursed in prior years, which impacted depreciation
expenses, and by the increase in the net financial expense caused by the growth in debt (in line with
our planning) and higher interest rates.
The capital expenditure of R$134.5 million in the period (R$60.7 million in 1Q13) was allocated to
concluding the Ecoparque complex located in Benevides, Pará, the final stage of the new plant in
Cajamar and to information technology projects. For the year, we maintain our guidance of R$500
million, which is below the level of R$553.9 million disbursed last year, with expenditures distributed
more evenly over the quarters than in previous years. Compared to 1Q13, this difference in the
distribution of capital expenditure contributed to the reduction of R$104.9 million in free cash
generation.
We are confident in our plans for 2014, with the highlight the accelerated growth accompanied by
profitability in the International Operations and the initiatives to continue improving the productivity
of our Consultants in Brazil. We also continue to implement initiatives that will be important for our
medium-term strategy, such as the expansion of the Natura Network and the development of new
brands and categories. Furthermore, a more efficient organization focused on executing the short-
and medium-term strategy will help capture productivity gains to ensure our competitiveness and a
better balance in our profitability.
Earnings Release 1Q14
3
1. cosmetics, fragrance and toiletries
industry
According to data for last year from Euromonitor (data for 2014 are not yet available), Brazil remains
the world’s third-largest CFT market and for the ninth year in a row Natura maintained its leadership
in this market.
In our combined International Operations in Latin America (ex-Brazil), we climbed from the eighth to
seventh position in the ranking, with market share gains of 70 bps and 20 bps in the operations in
Consolidation and in Implementation, respectively.
Also in 2013, our target market grew by 10.6%, based on data published by SIPATESP/ABHIPEC3.
Our market share decreased by 120 bps, with the loss concentrated in the Cosmetics and Fragrances
categories. In the Toiletry categories, the highlight was the excellent results in the SOU line that was
launched in the second half of 2013, which played an important role in keeping our market share
stable in these categories.
3 Sipatesp/Abihpec: São Paulo State Perfumery and Toiletry Association / Brazilian Cosmetics, Fragrance and Toiletry Industry Association.
2013 2012 Change 2013 2012 Change
Brazilian Operations 42,951 38,299 12.1% 12.4% 13.0% (0.7) pp
Consolidation Operations 10,973 9,241 18.7% 5.1% 4.4% 0.7 pp
Implementation Operations 14,964 14,200 5.4% 1.5% 1.3% 0.2 pp
Total 68,888 61,740 11.6% 8.8% 9.0% (0.2) pp
Source: Euromonitor 2013
i. Euromonitor believes the total market for cosmetics, perfumes and toiletries at retail prices.
ii. Values in constant dollars, 2013
iii. Market value and market share for 2012 were reviewed by the consulting firm
iv. Consolidation Operations: Argentina, Chile and Peru
v. Implementation Operations: Colombia and Mexico
Market Size
(US$ Million)
Natura Market Share
(%)
2013 2012 Change 2013 2012 Change
Cosmetics and Fragrances 13,085 11,902 9.9% 30.9% 33.1% (2.2) pp
Toiletries 14,450 12,998 11.2% 11.4% 11.6% (0.2) pp
Total 27,535 24,900 10.6% 20.7% 21.9% (1.2) pp
Source: Sipatesp
BrazilMarket Size
(R$ Million)Natura Market Share (%)

Earnings Release 1Q14
4
2. social and environmental highlights
We concluded Natura's new Sustainability Vision, which outlines the company’s aspiration to go
beyond simply reducing or offsetting the effects of its activities to become a generator of positive
impacts on society and the environment. The vision was drafted based on international analyses and
global trends in sustainability and was inspired by a series of dialogues conducted with Natura’s
stakeholders. Structured on three pillars (Our Brands and Products, Our Network and Our
Management and Organization), the vision establishes guidelines and public ambitions for 2020.
Another highlight this quarter was the inauguration of Ecoparque, which is an industrial complex that
will operate under a symbiotic model based on connecting various companies with complementary
needs. The goal is to form a cooperative network that can share resources and coordinate joint
alternatives to encourage the development of sustainable businesses in the Amazon region. Natura’s
new soap plant installed in the Ecoparque will be responsible for the entire manufacturing process and
aims to triple the production of this product by 2015, expand the use of raw materials and reduce
costs by concentrating industrial processes close to the supply chain.
Ecoparque brings important innovations in sustainability, such as: filtering gardens to treat effluents,
natural ventilation and lighting in buildings and the use of rainwater for building maintenance. It will
also create 240 direct jobs, employ 98% local labor and source 70% of its services locally.
On April 11, during our Shareholders’ Meeting, we launched the 2013 Annual Report, with the
Internet used as the main publication vehicle due to its reach and accessibility as well as its lower
environmental impact. We adopted the new G4 guidelines of the Global Reporting Initiative (GRI) and
the Integrated Reporting guidelines proposed by the International Integrated Reporting Council
(IIRC), which increases the correlation between financial and non-financial results and adopts a long-
term vision.
The table below presents the cumulative social and environmental results of the first quarter of 2014.
In order to align the targets for 2014 with our new sustainability vision, they will be made available
only in 2Q14.
* Result to be made
available next quarter.
** Indicator formed
primarily by the sharing
of benefits and the
amounts paid for the
acquisition of raw
materials.
*** Includes Natura
and other partners.
Indicator 2013 Results 1Q14 Results
Greenhouse gas (GHG) emissionsReduction of 33.2%
over 2006Not available*
Water consumption0.40 liter/ unit
produced
0.36 liter / unit
produced
Solid Waste21.7 grams / unit
produced
22.1 grams/unit
produced
Collections Crer para Ver* R$ 17.1 million R$ 4.3 million
Funding to Supplier Communities ** R$ 11.2 million R$ 1.3 million
Business volume in the Amazon region*** R$ 201.5 million R$ 46.3 million

Earnings Release 1Q14
5
3. economic performance45
In the pro-forma results, the profit margin obtained on exports from Brazil to the International Operations was
subtracted from the COGS of the respective operations in order to show the actual impact of these subsidiaries
on the company’s consolidated results. Accordingly, the pro-forma income statement for the Brazilian operations
considers only the sales made in the domestic market.
The pro-forma Income Statement for 1Q13 above includes three reclassifications in Brazil and consequently in
the Consolidated figures in order to improve comparisons with 1Q14. These adjustments do not impact the
figures for EBITDA and Net Income previously reported. These reclassifications between lines are as follows: (1)
the reclassification to “Cost of Goods Sold” of the expenses with the provision for employee profit sharing, which
were allocated to “Administrative, R&D, IT and Project Expenses;” (2) the reclassification of a portion of “Selling,
Marketing and Logistics Expenses” to “Administrative, R&D, IT and Project Expenses;” and (3) the consolidation
by “Administrative R&D, IT and Project Expenses” of the former line “Management compensation,” the details of
which are available in Note 28.2 to the Financial Statements. These same adjustments will be made in
subsequent quarters for amounts referring to 2013.
4 Consolidated figures include the Brazil Operations, the Operations in Consolidation, the Operations in Implementation and other International Investments and consider the impact from acquisitions. 5 Position at the end of Cycle 5 in Brazil, Argentina, Mexico and France; and Cycle 3 in Chile, Peru and Colombia.
Quarter Pro-Forma Pro-Forma
(R$ million) Consolidated4
Brazil Consolidation Implementation Novos Negócios
1Q14 1Q13 Change% 1Q14 1Q13 Change% 1Q14 1Q13 Change% 1Q14 1Q13 Change%
Total Consultants - end of period ('000)5 1,650.5 1,556.8 6.0 1,276.4 1,257.6 1.5 230.4 188.8 22.1 142.2 108.2 31.4
Total Consultants - average of period ('000) 1,636.6 1,557.2 5.1 1,261.1 1,256.2 0.4 228.7 189.7 20.6 145.3 108.8 33.4
Units sold – items for resale 128.4 111.6 15.1 110.2 98.2 12.2 11.6 9.1 27.6 5.9 4.2 42.0
Gross Revenue 2,085.2 1,832.4 13.8 1,734.7 1,596.7 8.6 195.1 155.1 25.8 103.6 65.2 58.9
Net Revenue 1,556.2 1,351.3 15.2 1,270.5 1,164.5 9.1 145.1 115.8 25.3 89.3 56.0 59.5
Gross Profit 1,089.7 947.3 15.0 877.4 816.5 7.5 103.6 81.2 27.6 64.2 38.4 66.9
Selling, Marketing and Logistics Expenses (602.7) (503.5) 19.7 (471.2) (414.6) 13.7 (70.4) (55.9) 25.9 (50.4) (28.6) 75.9
General and Administrative Expenses (271.1) (223.8) 21.1 (196.5) (171.4) 14.6 (10.4) (10.4) (0.4) (10.4) (7.2) 44.8
Other Operating Income / (Expenses), net 11.3 (0.3) n/a 5.6 (0.3) n/a (0.5) 0.2 n/a (0.1) 0.5 n/a
Financial Income / (Expenses), net (51.9) (37.8) n/a (51.9) (37.3) n/a 0.8 (0.4) n/a (0.7) (0.0) n/a
Income Tax and Social Contribution (57.1) (57.4) (0.5) (52.2) (55.8) (6.5) (4.4) (1.4) n/a (0.3) (0.1) 474.3
Noncontrolling (0.9) 0.0 0.0 0.0 0.0 0.0 0.0 0.0 0.0 0.0 0.0 0.0
Net Income 117.2 124.6 (6.0) 111.2 137.0 (18.8) 18.8 13.2 43.0 2.3 3.0 (24.5)
EBITDA* 283.6 262.1 8.2 266.4 269.5 (1.2) 23.5 16.2 45.5 4.4 3.8 15.2
Gross Margin 70.0% 70.1% (0.1) pp 69.1% 70.1% (1.1) pp 71.4% 70.1% 1.3 pp 71.8% 68.6% 3.2 pp
Sales Expenses/Net Revenue 38.7% 37.3% 1.5 pp 37.1% 35.6% 1.5 pp 48.5% 48.3% 0.2 pp 56.4% 51.1% 5.2 pp
General and Admin. Expenses/Net Revenue 17.4% 16.6% 0.9 pp 15.5% 14.7% 0.7 pp 7.2% 9.0% (1.8) pp 11.7% 12.9% (1.2) pp
Net Margin 7.5% 9.2% (1.7) pp 8.8% 11.8% (3.0) pp 13.0% 11.4% 1.6 pp 2.5% 5.4% (2.8) pp
EBITDA Margin 18.2% 19.4% (1.2) pp 21.0% 23.1% (2.2) pp 16.2% 14.0% 2.3 pp 4.9% 6.8% (1.9) pp
(*) EBITDA = Income from operations before financial effects + depreciation & amortization.
Earnings Release 1Q14
6
3.1. net revenue
In Brazil, the 8.2% increase in consultant
productivity (R$1,965 in 1Q14 versus
R$1,816 in 1Q13) was the main driver of
the net revenue growth of 9.1% in the
quarter. This productivity gain was made
possible by the higher investments in
marketing and important innovations, such
as the SOU line (launched between July and
October 2013) and the relaunch of the
Tododia line (February 2014), and by the
offering of new payment options to
consultants.
Since mid-2012, when we began to focus our strategy on expanding the shopping basket of our
consumers and consequently on the productivity of our consultants, we have worked to obtain
revenue growth that is better balanced between the number of consultants and their productivity.
However, the 0.4% growth in the average base of available consultants6 in 1Q14 still reflects the
channel's lower activation. For 2014, in addition to intensifying our marketing investments, we remain
confident that the new technology tools, the optimization of sales team practices and the channel
segmentation plans will make important contributions to increasing the buying frequency and
productivity of our consultants.
In 1Q13, the International Operations7 grew by 53.0% in Brazilian Real to account for 18.4% of
consolidated net revenue. The Operations in Consolidation posted net revenue growth of 35.1% in
local currency (25.3% in Brazilian real), with growth in Brazilian Real lagging that in local currency,
which is explained by the depreciation in the Argentine peso. Furthermore, in Argentina, we faced
supply problems in the first quarter caused by import restrictions, with this situation normalized in
April. Meanwhile, the Operations in Implementation grew by 44.4% in local currency (59.5% in
Brazilian real). Although all operations posted results consistent with our strategy, the highlight was
Mexico, where, after a period of adaptation to the multi-level model (i.e., Sustainable Relations
Network) that was implemented in July 2011, we are already capturing its benefits, especially in
terms of the channel's accelerated growth. The operations under the brand Aesop, which began to be
6 We consider as available all consultants who have placed at least one order in a period of four consecutive sales cycles. 7 The International Operations include the Operations in Consolidation, the Operations in Implementation, France and Aesop.
5.9% 6.7%
12.0%15.5% 15.2%
2.1% 1.1% 5.4%9.3% 9.1%
31.3%
36.7%40.4%
34.6%36.4%
1Q13 2Q13 3Q13 4Q13 1Q14
Net Revenue Growth (R$ - % Year over Year)
Consolidated Brazil Consolidation and Implementation Operations
1,258 1,249 1,258 1,290 1,276
189 205 216 225 230108 119 129 140 142
1,557 1,575 1,604 1,656 1,651
8.5% 4.6% 5.7% 5.3% 6.0%
1Q13 2Q13 3Q13 4Q13 1Q14
Consultants - end of period
Brazil Consolidation
Implementation
YOY Consolidated Growth
-3.8%
-0.6%
2.9%
6.2%
8.2%
1Q13 2Q13 3Q13 4Q13 1Q14
Productivity (% Year over Year)
Brazil

Earnings Release 1Q14
7
consolidated into Natura’s results in March 2013, continued to grow at an accelerated pace and in line
with the expansion plan, closing the quarter with 82 concept stores in 10 countries8.
3.2. innovation & products
In the 12 months ended March 2014, the
innovation index9 stood at 62.4% (65.0% in
the prior-year period), which is within the
expected range.
Recent launches, such as the SOU line (July to
October 2013) and the relaunch of the Tododia
line (February 2014), as well as the innovation
plan for the coming months, will help to
improve consultant productivity and
consequently to keep the innovation index within the expected range of 60% to 70%.
3.3. gross margin
In 1Q14, consolidated gross margin remained stable compared to the previous year, which is
explained by the margin expansion in the International Operations and the margin compression in
Brazil. In the International Operations, we maintained the trend of gross margin expansion observed
in prior quarters, due to the still-favorable foreign exchange scenario in certain countries and the
incorporation of the high gross margin of AESOP. In Brazil, as planned and already observed since
3Q13, the margin compression reflected the increased promotional efforts to reactivate our consultant
base and the impact from the more adverse currency exchange scenario that had not yet been fully
offset by price increases, which were implemented in March 2014.
The following table presents the main components of COGS:
8 Australia, Hong Kong, Japan, Malaysia, Singapore, France, Germany, Switzerland, United Kingdom and United States. 9 Innovation Index: share in the last 12 months of the sale of products launched in the last 24 months.
65.0% 65.3% 63.8% 63.4% 62.4%
1Q13 2Q13 3Q13 4Q13 1Q14
Innovation (%NV)
70.1%
70.7% 70.8%
68.5% 70.0%
70.1%
70.3% 70.4%
67.5%69.1%69.6%
71.5% 70.5% 70.9% 71.6%
1Q13 2Q13 3Q13 4Q13 1Q14
Gross Margin (%NR)
Consolidated
Brazil
Consolidation and Implementation Operations
1Q14 1Q13
78.4 79.5
10.4 11.7
3.7 2.9
7.6 5.9
Total 100.0 100.0
*Raw materials, packaging materials and finished products.
RM / PM / FP*
Labor
Depreciation
Other

Earnings Release 1Q14
8
3.4. operating expenses
In Brazil, the increase in selling, marketing and
logistics expenses is mainly explained by the
higher marketing investments to activate the
channel and relaunch one of our main sub-brands
(Tododia), and by the recognition of a nonrecurring
losses related to negotiations in the collections
process, which reflects the lower likelihood of
receiving funds from agreements for written-off
receivables from consultants. In the International
Operations, we also intensified our marketing
investments to leverage the good growth
momentum in the channel resulting from the Sustainable Relations Network model in Mexico.
Administrative, R&D, IT and Project expenses
in Brazil increased as a ratio of net revenue driven
by the higher depreciation expenses, the continued
investments in strategic and information technology
projects and nonrecurring severance costs related
to the structure streamlining. These ongoing
initiatives that were described above seek efficiency
gains in this group of expenses, which should be
captured over the coming quarters. In the
International Operations, these expenses were
diluted in the Operations in Consolidation, while in the Operations in Implementation this expense
was augmented by the filling of positions that had been vacant in the first quarter of 2013.
3.5. other operating income and expenses
In 1Q14, on a consolidated basis, this line registered income of R$11.3 million, compared to the
expense of R$0.3 million in 1Q13. The income recorded in 2014 is explained primarily by the R$6.2
million in ICMS tax credits from prior periods related to returns and by the R$6.2 million generated by
the adjustment in the sales price for the acquisition of the distributors of Aesop, as per Note 26 to our
financial statements.
3.6. other international investments
The other international investments, namely the operation in France, the international corporate
structure based in Buenos Aires and the AESOP operation, recorded an EBITDA loss of R$10.7 million
in 1Q14, compared to the loss of R$27.5 million in 1Q13. The lower loss is explained by positive result
posted by AESOP10 and by the recognition of the adjustment in the acquisition price mentioned in
10 In 1Q13, we recorded only the result for March 2013, since the acquisition was concluded only on February 28, 2013. In addition, in the same quarter, we incurred acquisition costs that had an adverse impact on the result of “other international investments.”
35.6%
49.2%
37.1%
51.5%
Selling, Marketing and Logistics Expenses (%NR)
1Q13 1Q14
BrazilConsolidation and
Implementation Operations
14.7%
10.3%
15.5%
8.9%
Administrative, R&D, IT and Projects Expenses,
Employee profit sharing and Management compensation (%NR)
1Q13 1Q14
BrazilConsolidation and
Implementation Operations

Earnings Release 1Q14
9
item 3.5. Furthermore, the depreciation in the Argentine peso against the Brazilian Real had a
positive impact on keeping the level of corporate expenses stable in nominal terms.
3.7. EBITDA
In 1Q14, consolidated EBITDA amounted to R$283.6 million, growing 8.2% from the same period of
2013, with EBITDA margin of 18.2%, compared to 19.4% in 1Q13. In Brazil, the contraction in
EBITDA from the year-ago period was due to the contraction in gross margin, which was caused by
the currency translation impacts that occurred before the price increases were implemented and by
the promotions targeting consultants, to the higher investments in marketing and in strategic and IT
projects, as well as to the nonrecurring effects from the adjustment to the criteria used for
recognizing the recoverability of receivables and the adjustments to the company structure. In the
Operations in Consolidation, EBITDA margin expanded by 230 basis points from 1Q13, which is
mainly explained by the gross margin expansion and by the leveraging of operating expenses.
Meanwhile, in the Operations in Implementation, in line with our planning, EBITDA margin contracted
by 190 basis points due to the higher marketing investments, especially in our Mexico operation.
EBITDA (R$ million) Figures include the operating result and transaction costs associated with Aesop
The higher expenses with depreciation and amortization (34.3% in the quarter) reflect the
investments in infrastructure (logistics and manufacturing) and in information technology.
Pro-forma EBITDA by operational bloc (R$ million) Figures include the operating result and transaction costs associated with Aesop
1Q14 1Q13 Change %
Net Revenue 1,556.2 1,351.3 15.2
(-) Cost of Sales and Expenses 1,329.1 1,131.4 17.5
EBIT 227.1 219.8 3.3
Adjust Non-controlling interest 0.0 0.2 n/a
(+) Depreciation/Amortization 56.5 42.1 34.3
EBITDA 283.6 262.1 8.2
1Q14 1Q13 Change %
Brazil 266.4 269.5 (1.2)
Argentina, Chile and Peru 23.5 16.2 45.5
Mexico and Colombia 4.4 3.8 15.2
Other Investments (10.7) (27.5) n/a
EBITDA 283.6 262.1 8.2

Earnings Release 1Q14
10
3.8. net income
In 1Q14, consolidated net income contracted
by 6% from the same period last year. This
reduction is explained by three factors: a) the
34.3% increase in expenses with depreciation
and amortization due to the investments in
logistics, production capacity and information
technology made over the last few years; b)
the 37.3% increase in the financial expense
due to the growth in debt, as planned, and the
higher interest rates in the Brazilian market; and c) the effect from adopting the straight-line
method11 for income tax in 2013, since the first quarters of the previous year the rate remained at
around 31.5% and only in the fourth quarter was this rate adjusted to reflect the rate in the year of
32.5%, which is in line with the rate in 1Q14.
Because they involve the straight lining of income tax and of expenses not related to the short-term
growth of the business, these three impacts will be better balanced over the course of the year and in
turn increase the correlation between the growth of the business and the growth in net income.
Excluding the impact from the marking to market of derivatives pegged to foreign-denominated debt,
the net financial expense increased by 55.9% from 1Q13, which contributed to the 9.2% decrease in
adjusted net income.
3.9. cash flow12
In 1Q14, internal cash generation amounted to R$138.6 million, down 24.7% from 1Q13, reflecting
mainly the reduction in net income and the negative impact from deferred income tax on non-cash
items.
The capital expenditure of R$134.5 million in the period (R$60.7 million in 1Q13) was allocated to
concluding the Ecoparque complex located in Benevides, Pará, the final stage of the new plant in
Cajamar and to information technology projects. For the year, we maintain our guidance of R$500
million, which is below the level of R$553.9 million disbursed last year, with expenditures distributed
more evenly over the quarters than in previous years. Compared to 1Q13, this difference in the
11 We straight line of the effective rate of our income tax and social contribution based on a projection of our taxable income in the year. The quarterly periods are adjusted for this projection through the recognition of deferred income tax, as described in Note 10 to the interim financial statements. 12 In pro-forma cash flow, certain amounts in 2013 were reclassified to noncash items in order to improve comparability with 1Q14. Furthermore, with the reclassification of certain lines on the balance sheet for 2012 (see Note 4.3 to the 4Q13 Financial Statements), the variation in working capital in March 2013 was recalculated and restated.
(R$ million) 1Q14 1Q13 Change
Financial Income/ (Expenses), net (51.9) (37.8) (14.1)
Mark-to-Market adjustment (0.3) (4.7) 4.4
Financial Income/ (Expenses) ex. Mark-to-Market, net (51.6) (33.1) (18.5)
9.2%
14.0%
10.3%
13.6%
7.5%
1Q13 2Q13 3Q13 4Q13 1Q14
Net Margin (%NR)

Earnings Release 1Q14
11
distribution of capital expenditure contributed to the reduction of R$104.9 million in free cash
generation.
Average working capital as a ratio of net revenue improved by 30 basis points in the period, reflecting
on the one hand the stability in inventory coverage and the expected increase in the average
payables term, and on the other hand the increase in the receivables term of our consultants in
Brazil, which reflects the offering of new payment options. Recoverable taxes and reducing inventory
coverage continue to represent opportunities to be captured over the coming quarters.
3.10. indebtedness
The increases in total debt and net debt mainly reflect the capital expenditure disbursed in the period
and the higher working capital needs, which remained within the levels expected for the end of the
first quarter of 2014.
R$ million 1Q14 1Q13Change
R$
Change
%
Net Income 117.2 124.6 (7.5) (6.0)
Depreciation and amortization 56.5 42.1 14.4 34.3
Non-cash / Other* (35.1) 17.4 (52.5) n/a
Internal cash generation 138.6 184.1 (45.5) (24.7)
Working Capital (Increase)/Decrease (227.8) (242.2) 14.4 n/a
Operating cash generation (89.3) (58.1) (31.1) 53.6
CAPEX (134.5) (60.7) (73.8) 121.6
Free cash flow** (223.8) (118.8) (104.9) 88.3
Favorable/ (unfavorable)
(**) (Internal cash generation) +/- (changes in working capital and long-term assets and liabilities) –
(acquisitions of property, plant, and equipment).
(*) Some 2012 figures were adjusted for proper disclosure
Debt (R$ million) Mar/14 Share (%) Mar/13 Share (%)Change
(%)}
Short-Term 759.7 23.9 968.3 41.6 (21.5)
Long-Term 2,821.9 88.8 1,648.3 70.9 71.2
Derivatives (85.8) (2.7) (54.3) (2.3) 58.0
Finance Leases (319.2) (10.1) (236.6) (10.2) 34.9
Total Debt 3,176.5 100.0 2,325.6 100.0 36.6
(-) Cash, cash equivalents and short-term investment 1,781.4 1,536.0 16.0
(=) Net Debt - Net Cash 1,395.1 789.6 76.7
Net Debt / Ebitda 0.86 0.53
Total Debt / Ebitda 1.95 1.55

Earnings Release 1Q14
12
4. stock
performance
In 1Q14, the price of Natura stock declined by 6.3% from December 31, 2013, while the Bovespa
Index fell by 2.9%. Average daily trading volume in 1Q14 was R$57.6 million, compared to R$78.6
million in the prior-year period.
Our average ranking in the Bovespa Liquidity Index in the period was 38th.
The following chart shows the performance of Natura stock since its IPO:
+603.0%
0
200
400
600
800
1000
1200
1400
Base 100 = 05/26/2004
Bovespa Index
NATU3
NATU3: +87.3%
Ibov: +38.9%+38.0%
+27.7%+51.2%
+32.9%-41.4%
+43.7%+18.0%
- 41.2%+101.9%
+82.6%
NATU3
26/05/2004
R$ 5.42
2004 2005 2006 2007 2008 2009 2010
NATU3
31/03/2014
R$ 38.12
+164.5%
Follow On
31/07/2009
R$ 21.74
2011
-20.4%
-18.1%
2012
+69.0%
+7.3%
2013
+36.7%
+1.1%-26.6%
-15.5%
All prices expressed in ex dividend terms.

Earnings Release 1Q14
13
conference call
& webcast
PORTUGUESE: Friday, April 25, 2014
10:00 a.m. (Brasília time)
ENGLISH: Friday, April 25, 2014
12:00 p.m. (Brasília time)
From Brazil: +55 11 3193 1001 /+55 11 2820 4001
From the USA: Toll free +1 888 700 0802
From other countries: +1 786 924 6977
Code: Natura
Live webcast:
www.natura.net/investidor
investor
relations
Tel: +55 (11) 4196-1421
Fabio Cefaly, [email protected]
Tatiana Bravin, [email protected]
Francisco Petroni, [email protected]
Julia Villas Bôas, [email protected]

Earnings Release 1Q14
14
balance
sheets at March 2014 and December 2013 (in millions of Brazilian real - R$)
ASSETS Mar/14 Dec/13 LIABILITIES AND SHAREHOLDERS' EQUITY Mar/14 Dec/13
CURRENT ASSETS CURRENT LIABILITIES
Cash and cash equivalents 1,379.6 1,016.3 Borrowings and financing 759.7 693.1
Short-term investments 401.8 293.0 Trade and other payables 666.8 706.6
Trade receivables 753.0 807.0 Payroll, profit sharing and related taxes 151.6 177.6
Inventories 912.8 799.5 Taxes payable 596.1 659.3
Recoverable taxes 183.0 181.1 Other payables 62.4 90.2
Derivatives 85.8 153.6 Total current liabilities 2,236.6 2,326.8
Other receivables 261.0 262.4
Total current assets 3,977.1 3,512.9
NONCURRENT ASSETS NONCURRENT LIABILITIES
Long-term assets: Borrowings and financing 2,821.9 2,200.8
Recoverable taxes 187.1 175.1 Taxes payable 225.6 215.6
Deferred income tax and social contribution 220.5 193.8 Provision for tax, civil and labor risks 77.1 73.8
Escrow deposits 426.5 412.4 Others provisions 258.9 263.0
Other noncurrent assets 29.1 37.2 Total noncurrent liabilities 3,383.5 2,753.2
Property, plant and equipment 1,539.2 1,439.7
Intangible assets 514.7 477.3 SHAREHOLDERS' EQUITY
Total noncurrent assets 2,917.1 2,735.4 Capital 427.1 427.1
Capital reserves 148.3 150.4
Earnings reserves 280.4 162.6
Treasury shares (71.0) (84.0)
Proposed additional dividend 496.4 496.4
Other comprehensive losses (31.6) (6.9)
Total equity attributable to owners of the Company 1,249.5 1,145.6
Non- controlling interests 24.5 22.6
Total equity 1,274.0 1,168.3
TOTAL ASSETS 6,894.2 6,248.3 TOTAL LIABILITIES AND SHAREHOLDERS' EQUITY 6,894.2 6,248.3

Earnings Release 1Q14
15
statements
of income for the periods ended March 31, 2014 and 2013
(R$ million) 1Q14 1Q13
NET REVENUE 1,556.2 1,351.3
Cost of sales (466.5) (403.9)
GROSS PROFIT 1,089.7 947.3
OPERATING (EXPENSES) INCOME
Selling expenses (602.7) (503.5)
General and administrative expenses (271.1) (223.8)
Other operating (expenses) income, net 11.3 (0.3)
Financial income 124.0 66.2
Financial expenses (175.9) (104.0)
Income tax and social contribution (57.1) (57.4)
Owners of the Company 117.2 124.8
Noncontrolling 0.9 (0.2)
118.1 124.6
227.1 219.8
INCOME BEFORE NON-CONTROLLING
INTEREST118.1 124.6
175.2 182.0INCOME BEFORE INCOME TAX AND
SOCIAL CONTRIBUTION
ATTRIBUTABLE TO
INCOME FROM OPERATIONS BEFORE
FINANCIAL INCOME (EXPENSES)

Earnings Release 1Q14
16
statements
of cash flow for the periods ended March 31, 2014 and 2013
(R$ million) 1T14 1T13
CASH FLOW FROM OPERATING ACTIVITIES
Net income 117.2 124.6
Depreciation and amortization 56.5 42.1
Provision for losses on swap and forward transactions 40.0 50.6
Provision (reversal) for tax, civil and labor contingencies 3.3 (2.0)
Interest and inflation adjustment of escrow deposits (8.2) (3.8)
Income tax and social contribution 57.1 57.0
(Gain) loss on sale on property, plant and equipment and intangible assets 19.4 7.1
Interest and exchange rate changes on borrowings and financing and other liabilities (41.3) (5.3)
Exchange rate changes on other assets and other liabilities (25.0) 1.2
Expenses with stock options plans 2.5 3.4
Allowance for doubtful accounts 6.1 (7.8)
Allowance for inventory losses (7.5) 3.4
Net income attributable to non-controlling shareholders 1.9 0.0
Provision for healthcare plan and carbon credits 0.8 (1.0)
Recognition of untimely used tax credits (6.2) 0.0
Provision for acquisition of non-controlling interest 3.2 0.0
219.6 269.4
(INCREASE) DECREASE IN ASSETS
Trade receivables 48.0 55.0
Inventories (105.8) (107.8)
Recoverable taxes (7.7) (32.4)
Other receivables 9.5 (72.1)
Subtotal (56.0) (157.3)
INCREASE (DECREASE) IN LIABILITIES
Domestic and foreign suppliers (41.0) (25.9)
Payroll, profit sharing and related taxes, net (26.0) (60.7)
Taxes payable (19.5) (11.5)
Other payables (28.5) 40.6
Provision for tax, civil and labor contingencies 0.0 (1.0)
Subtotal (115.0) (58.5)
CASH GENERATED BY OPERATING ACTIVITIES 48.6 53.7
Adjustments to reconcile net income to net cash provided by
operating activities:

Earnings Release 1Q14
17
OTHER CASH FLOWS FROM OPERATING ACTIVITIES
Payments of income tax and social contribution (117.7) (89.0)
Withdrawal (payment) of escrow deposits (5.9) (14.2)
Payments of derivatives 27.8 (24.0)
Payment of interest on borrowings and financing (26.5) (14.1)
NET CASH GENERATED BY OPERATING ACTIVITIES (73.7) (87.6)
CASH FLOW FROM INVESTING ACTIVITIES
Acquisition of property, plant and equipment and intangible assets (134.6) (60.7)
Property, plant and equipment incorporated by acquisition AESOP 0.0 (129.1)
Proceeds from sale of property, plant and equipment and intangible assets 0.0 1.1
Short-term investments (1,524.7) 962.3
Redemption of short-term investments 1,415.9 (770.1)
Noncontrolling interest 0.0 18.7
NET CASH USED IN INVESTING ACTIVITIES (243.3) 22.2
CASH FLOW FROM INVESTING ACTIVITIES
Repayments of borrowings and financing - principal (59.8) (56.4)
Proceeds from borrowings and financing 729.6 196.1
Sale of treasury shares due to exercise of stock options 8.9 10.9
NET CASH GENERATED (USED) IN FINANCING ACTIVITIES 678.7 150.6
Gains (losses) arising on translating foreign currency cash and cash equivalents 1.6 0.0
INCREASE (DECREASE) IN CASH AND CASH EQUIVALENTS 363.2 85.1
Cash and cash equivalents at the beginning of the year/period 1,016.3 1,144.4
Cash and cash equivalents at the end of the year/period 1,379.6 1,229.6
DECREASE IN CASH AND CASH EQUIVALENTS 363.3 85.2
Additional Statements of Cash Flows Information:
Bank overdrafts - unused 117.9 117.9
Non-cash items
Reserve for acquisition of non-controlling shareholders 83.2 0.0
Capitalization of financial leasing 78.2 171.8
Earnings Release 1Q14
18
glossary
_CDI: the overnight rate for interbank deposits.
_Natura Consultants (CN): self-employed resellers who do not have a formal labor relationship with Natura.
_Natura Super Consultants (CNO): self-employed resellers who do not have a formal labor relationship with Natura and
support the Relationship Managers in their activities, also called Super Consultants.
_Supplier Communities: the communities of people involved in small–scale farming and extraction activities in a variety of
locations in Brazil, especially in the Amazon Region, who extract the inputs used in our products from the social and
biodiversity. We form production chains with these communities that are based on fair prices, the sharing of benefits gained
from access to the genetic heritage and associated traditional knowledge and support for local sustainable development
projects. This business model has proven effective in generating social, economic and environmental value for Natura and for
the communities.
_GHG: Greenhouse gases.
_Innovation Index: Share in the last 12 months of the sale of products launched in the last 24 months.
_Natura Institute: is a non-profit organization created in 2010 to strengthen and expand our Private Social Investment
initiatives. The institute has enabled us to leverage our efforts and investments in actions that contribute to the quality of
public education.
_Target Market: refers to the market share data published by SIPATESP/Abihpec. Considers only the segments in which
Natura operates. Excludes diapers, oral hygiene products, hair dyes, nail polish, feminine hygiene products as well as other
products.
_Operations in Consolidation: Grouping of operations: Argentina, Chile and Peru
_Operations in Implementation: Grouping of operations: Colombia and Mexico
_Profit Sharing: the share of profit allocated to employees under the profit-sharing program.
_Natura Believing is Seeing Program: special line of non-cosmetic products whose profits are transferred to the Natura
Institute, in Brazil, and invested by Natura in social initiatives in the other countries where we operate. Our consultants
promote these sales to benefit society and do not obtain any gains.
_Sustainable Relations Network: sales model adopted in Mexico that features eight stages in a consultant’s development:
Natura Consultant, Entrepreneurial Natura Consultant, Natura Developer 1 and 2, Natura Transformer 1 and 2, Natura Inspirer
and Natura Associate. To rise up through the various stages, consultants must fulfill certain criteria based on sales volume,
attracting new consultants and (unlike the models adopted in other countries) personal development and social and
environmental relationships in the community.
_Benefit Sharing: in accordance with Natura’s Policy for the Sustainable Use of Biodiversity and Associated Traditional
Knowledge, benefits are shared whenever we perceive various forms of value in the access gained. Therefore, one of the
practices that define the way in which these resources are divided is to associate payments with the number of raw materials
produced from each plant as well as the commercial success of the products in which these raw materials are used.
_Sipatesp/Abihpec: São Paulo State Perfumery and Toiletries Association / Brazilian Cosmetics, Fragrances and Toiletries
Industry Association (Abihpec).
restated figures
_Pro-forma Income Statement for 1Q13: includes three reclassifications in Brazil and consequently in the Consolidated figures in order to improve comparisons with 1Q14. These adjustments do not impact the figures for EBITDA and Net Income previously reported. These reclassifications between lines are as follows: (1) the reclassification to “Cost of Goods Sold” of the expenses with the provision for employee profit sharing, which were allocated to “Administrative, R&D, IT and Project Expenses;” (2) the reclassification of a portion of “Selling, Marketing and Logistics Expenses” to “Administrative, R&D, IT and Project Expenses;” and (3) the consolidation by “Administrative R&D, IT and Project Expenses” of the former line “Management compensation,” the details of which are available in Note 28.2 to the Financial Statements. These same adjustments will be made in subsequent quarters for amounts referring to 2013.
_Cost Breakdown 1Q13: Restated figures in the chart between the lines to reflect the adjustment (1) described above.
_Non-cash items: restated figures for 1Q13 for comparison purposes.
_Working Capital 1Q13: With the reclassification of certain lines on the balance sheet for 2012 (see Note 4.3 to the 4Q13 Financial Statements), the variation in working capital in 1Q13 was recalculated and restated.

Earnings Release 1Q14
19
EBITDA is not a measure under BR GAAP and does not represent cash flow for the periods presented.
EBITDA should not be considered an alternative to net income as an indicator of operating
performance or an alternative to cash flow as an indicator of liquidity. EBITDA does not have a
standardized meaning and the definition of EBITDA used by Natura may not be comparable with that
used by other companies. Although EBITDA does not provide under BR GAAP a measure of cash flow,
Management has adopted its use to measure the Company’s operating performance. Natura also
believes that certain investors and financial analysts use EBITDA as an indicator of performance of its
operations and/or its cash flow.
This report contains forward-looking statements. These forward-looking statements are not historical
fact, but rather reflect the wishes and expectations of Natura’s management. Words such as
"anticipate", "wish", "expect", "foresee", "intend", "plan", "predict", "project", "desire" and similar
terms identify statements that necessarily involve known and unknown risks. Known risks include
uncertainties that are not limited to the impact of price and product competitiveness, the acceptance
of products by the market, the transitions of the Company’s products and those of its competitors,
regulatory approval, currency fluctuations, supply and production difficulties and changes in product
sales, among other risks. This report also contains certain pro forma data, which are prepared by the
Company exclusively for informational and reference purposes and as such are unaudited. This report
is updated up to the present date and Natura does not undertake to update it in the event of new
information and/or future events.