Embed Size (px)
Citation preview
January–June 2018
Half-Year Report
Half-Year Report January – June 2018 2
Table of Contents
Introductory Notes 3
Consolidated Half-Year Management Report 4
Consolidated Half-Year Financial Statements – IFRS 21
Notes to the Consolidated Half-Year Financial Statements 26
Supplementary Financial Information 46
General Information 52
Additional Information 53
Half-Year Report January – June 2018 3
Introductory Notes
This half-year group report meets the requirements of German Accounting Standard No. 16 “Half-yearly Financial Reporting” (GAS
16). We prepared the financial data in the Half-Year Report section for SAP SE and its subsidiaries in accordance with International
Financial Reporting Standards (IFRS). In doing so, we observed the IFRS both as issued by the International Accounting Standards
Board (IASB) and as endorsed by the European Union (EU). This does not apply to numbers expressly identified as non-IFRS. For
additional IFRS and non-IFRS information, see the Supplementary Financial Information section.
This half-year group report complies with the legal requirements in accordance with the German Securities Trading Act
(Wertpapierhandelsgesetz, WpHG) for a half-year financial report, and comprises the consolidated half-year management report,
consolidated half-year financial statements, and the responsibility statement in accordance with the German Securities Trading Act,
section 37w (2).
This half-year financial report updates our consolidated financial statements 2017, presents significant events and transactions of
the first half of 2018, and updates the forward-looking information contained in our Management Report 2017. This half-year
financial report only includes half-year numbers, our quarterly numbers are available in the Quarterly Statement. Both the 2017
consolidated financial statements and the 2017 management report are part of our Integrated Report 2017, which is available at
www.sapintegratedreport.com.
All of the information in this half-year group report is unaudited. This means the information has been subject neither to any audit
nor to any review by an independent auditor.
Half-Year Report January – June 2018 4
Consolidated Half-Year Management Report
Strategy and Business Model We did not change our strategy or our business model in the
first half of 2018. For a detailed description, see our
Integrated Report 2017.
Products, Research and
Development, and Services
SAP made several acquisitions in the first half of 2018 to
focus on opportunities in the customer relationship
management (CRM) market. We continued to innovate,
simplifying product and services portfolios and delivering
best-in-class solutions to lead customers on their journey to
the intelligent enterprise. We launched SAP C/4HANA, a
fourth-generation CRM system designed to completely
reimagine customer service software. SAP C/4HANA
consolidates existing CRM cloud solutions, enriching them
with newly-acquired Callidus Software Inc. and Coresystems
applications in an offering to help businesses win lifetime
customers.
SAP Customer Experience
Reinvents CRM SAP C/4HANA, a unified suite of cloud solutions to manage
the customer experience, was announced in June 2018 at our
customer conference SAPPHIRE NOW. It brings together
cloud offerings previously on the market under the SAP
Hybris brand, as well as offerings from Gigya, Callidus, and
Coresystems. This is available in a simplified portfolio with
consistent naming, a common user experience, integration
model (through SAP Cloud Platform), and with embedded
intelligence (through SAP Leonardo). With these changes,
the portfolio and people behind SAP Hybris, Gigya, and
Callidus became part of SAP Customer Experience. SAP
C/4HANA consists of the following cloud solutions:
– SAP Commerce Cloud evolved from the SAP Hybris
flagship on-premise offering to its recent launch on
Microsoft Azure. The solution allows customers to
personalize the buying experience across all touchpoints.
– SAP Customer Data Cloud from Gigya consists of three
tightly integrated products – SAP Customer Consent, SAP
Customer Profile, and SAP Customer Identity. With these
solutions, businesses can turn unknown visitors into
known, loyal customers by securely identifying consumers
across devices and channels, managing their permissions
and consent, and turning data into unified customer
profiles that are governed and analyzed from a central and
secure environment. These solutions enable businesses to
address many aspects of General Data Protection
Regulation (GDPR) compliance without breaking the
customer experience.
– SAP Marketing Cloud now integrates with SAP Commerce
Cloud and allows marketers to quickly address the needs of
each individual customer.
– SAP Sales Cloud combines the former SAP Hybris Cloud
for Customer with SAP Hybris Revenue Cloud, and the
recently-acquired Callidus solutions for configure-price-
quote and sales performance management.
– SAP Service Cloud focuses on field service and sales
automation, bolstered by the SAP Customer Engagement
Center solution and Service Core option (in SAP
S/4HANA) and further strengthened by SAP's acquisition
of Coresystems in June 2018.
SAP SuccessFactors SAP continues to drive the role of HR in digital transformation
with solutions such as SAP SuccessFactors Visa and
Permits Management, simplifying the complex ways in
which HR managers source international talent. Meanwhile,
candidate relationship management capabilities of the SAP
SuccessFactors Recruiting solution have been enhanced, to
further enable organizations to nurture, attract, and hire top
talent. In parallel, new advanced data protection and
privacy capabilities have been added to the SAP
SuccessFactors HCM suite, making it easier to comply with
data protection and privacy laws – including the European
Union’s General Data Protection Regulation (GDPR).
SAP Fieldglass SAP Fieldglass launched SAP Fieldglass Digital Network, a
new ecosystem network to help customers transform how
they engage and manage an external workforce of
freelancers, contingent workers, independent contractors,
and other service providers. Additionally, machine learning-
powered resume matching automatically reads and ranks
candidate resumes based on role requirements, identifying
the best-fit candidates and increasing efficiency and speed to
hire.
Half-Year Report January – June 2018 5
SAP Ariba SAP Ariba remains focused on providing customers with a
deeper, more intelligent and ethical view into their spend and
extending the value that its solutions can deliver into new
markets and industries.
The SAP Ariba Spend Analysis solution includes new
microservices that use artificial intelligence (AI) and machine
learning to reduce the time it takes to classify invoice data.
The SAP Ariba Snap program provides scalable options for
fast-growing midsize companies to implement SAP Ariba’s
enterprise-class sourcing solutions. Manufacturing Network
is delivered as part of the SAP Digital Manufacturing Cloud
solution to help manufacturers and service providers
collaborate across the manufacturing process. The SAP
Sourcing Simulation and Optimization for Industries
solution helps optimize direct material price re-negotiations
with existing suppliers. SAP Ariba Strategic Sourcing Suite
is a solution that delivers new retail industry capabilities.
The SAP Ariba Supplier Risk solution provides new insights,
in partnership with leading providers of sustainability and risk
analytics and research – EcoVadis and Verisk Maplecroft – to
help customers track more than 200 risk types.
SAP Concur
Further supporting the intelligent enterprise, new innovations
from SAP Concur help businesses to leverage travel,
expense, and invoice data to give instant, real-time, and
actionable insights. SAP Concur travel, expense, and invoice
technologies use machine learning, AI, and analytics so that
customers can automate tasks and use intelligence to
increase visibility, efficiency, control, and savings, and
improve compliance, employee satisfaction, and user
experience.
The Concur Detect service works with the Concur Expense
solution to uncover potential policy compliance violations. In
conjunction with the Audit service from SAP Concur, it uses
SAP Concur partner AppZen’s AI technology to analyze
receipts, credit card transactions, and bookings. The Budget
Web service from SAP Concur provides a holistic view of
employee spend, making budgets across the organization
visible. Concur Drive is a Web service that automatically
captures distance and offers an alternative to self-reported
mileage. Additionally, ExpenseIt from SAP Concur is a fully
integrated value-added service for the SAP Concur mobile
app – previously a separate mobile application called
ExpenseIt Pro – that turns receipts into expense line items
and sends them directly to Concur Expense.
SAP Cloud Platform Our new consumption-based commercial model simplifies
the configuration and use of SAP Cloud Platform services. A
single provisioning cockpit enables customers to buy credits
and activate services. Detailed analytics give a clear overview
of cloud credit consumption, making it easier for customers
to identify, procure, and monitor services for their
applications.
At SAPPHIRE NOW, we announced the general availability of
blockchain as a service, which allows partners, customers,
and developers to build business applications across
different underlying blockchain technologies. Blockchain-
extended solutions for IoT and digital supply chain are also
now available.
We also announced the general availability of SAP
Conversational AI, our first bot development environment.
This enables customers to develop enterprise chatbot
solutions, such as for customer service or to address younger
target audiences.
SAP HANA Data Management Suite Launched during SAPPHIRE NOW as the foundation for the
intelligent enterprise, SAP HANA Data Management Suite
combines our SAP HANA and SAP Data Hub offerings in a
seamless cloud service, offering a modern and open
framework for data integration and data management. The
suite will foster the development of data-driven applications
for multi-cloud and hybrid environments.
IoT and Digital Supply Chain In April, we introduced the SAP Digital Manufacturing Cloud
solution. Through the industrial Internet of Things, the
offering tightly integrates manufacturing with business
operations, across the extended digital supply chain, serving
manufacturers of varying sizes in discrete and process
industries.
The SAP S/4HANA Cloud solution for intelligent product
design provides shared views of digital twin information (a
digital twin is a digital model created to represent an asset or
device) giving customers live insights on new products. This
offering makes it possible to store, share, and review
engineering documents with internal and external
participants.
Our SAP Predictive Engineering Insights solution replaces
the need for physical inspections with ongoing, live digital
inspection and analysis. It combines a standard engineering
methodology for calculating forces, stresses, and fatigue
based on sensor data, using a high-performance 3D engine to
provide visualized engineering insights.
SAP Analytics Cloud In May, we released Search-to-Insight natural-language query
capabilities, making it easier for business users to extract
Half-Year Report January – June 2018 6
answers from data by using conversational phrases. We also
released more than 130 new cloud data connectors.
SAP Digital Business Services SAP Digital Business Services continues to help customers
realize the intelligent enterprise and become best-run
businesses. During 2018, we further simplified the portfolio
services by producing a framework that groups SAP Digital
Business Services offerings into three categories – premium
success, project success, and continuous success.
Premium Success
SAP MaxAttention has been redesigned, with a holistic
engagement model and comprehensive services portfolio to
help turn customer ideas and concepts into value-based
predictable outcomes. The new SAP MaxAttention offering
delivers precise business and technical guidance and now
features the following:
– One service portfolio – provides coverage for all SAP
solutions and deployments
– One team – delivers a holistic engagement model and
team with clear accountabilities
– One commercial framework – offers services with
predictable outcomes and flexible consumption
Project Success
Our Project Success services portfolio helps companies reap
the benefits of SAP solutions faster and with lower risk.
During implementation, customers can choose from an array
of services that have been newly extended. While the SAP
Integrated Report 2017 describes existing offerings – SAP
Value Assurance and SAP Model Company – we have added
even more services in this portfolio category, as follows:
– SAP Innovation and Advisory Services enable us to guide
customers through the innovation process, focusing on
economic, social, and environmental impacts, and on
creating new opportunities. With simplified SAP Leonardo
Services offerings, we provide a fast path from idea to
prototype, helping customers redesign their business
models and processes.
– SAP Advanced Deployment allows SAP to fully invest in a
customer’s success by serving as primary implementation
partner. Delivered through the proven SAP Activate
innovation adoption framework and tailored to the
customer’s specific transition scenario, SAP Advanced
Deployment streamlines the implementation of a high-
performing, sustainable digital core.
Continuous Success
Our support and success plans, embedded in all SAP cloud
offerings and available for all on-premise installations, enable
us to help customers succeed. Two of these plans – SAP
Enterprise Support and SAP Preferred Success – have
already been presented in the SAP Integrated Report 2017,
and we have now added Next-Generation Support services.
Next-Generation Support services bring more real-time
support channels, automatic translation, a newly-piloted ‘ask
an expert peer’ service, and our first machine learning pilot –
‘incident/solution matching’.
Intelligent Tools and Platforms We also use intelligent tools and platforms to help customers
implement SAP solutions faster and simpler. While several
have already been described in the SAP Integrated Report
2017 – SAP Transformation Navigator, SAP Readiness
Check, SAP Solution Manager, and SAP Innovation and
Optimization Pathfinder, for example – we recently added the
integration content advisor for the SAP Cloud Platform
Integration service. This feature allows users to define,
maintain, share, and deploy business-to-business (B2B)
integration content and interfaces using machine-learning
algorithms to significantly reduce build time and effort.
Half-Year Report January – June 2018 7
Acquisitions In the second quarter of 2018, SAP acquired Callidus Software
Inc. and Coresystems AG – cloud-based customer relationship
management (CRM) vendors. The acquisitions of Callidus and
Coresystems complete SAP’s design of a new front office that
extends beyond legacy CRM to an intelligent customer
experience suite. For more information, see the Products,
Research and Development section and Note (4).
Employees and Social Performance Our people are key in supporting our customers to successfully
drive their digital transformation. Therefore, we are fully
committed to enabling our employees to grow their skills at
every stage of their career at SAP. We are evolving our Human
Resources (HR) Strategy to continuously drive great HR
experiences for our people. The framework as outlined in the
Employees and Social Investments section of our Integrated
Report 2017 has not materially changed in the first half of 2018.
An important factor in our long-term success is the creation of a
workplace that attracts and retains the best talent in the market.
At the end of the first half of 2018, the employee retention rate
was still on a high level of 94.3% (compared to 94.7% at the end
of the first half of 2017). The retention rate is calculated as per
the new definition (see the Employees and Social Investments
section in our Integrated Report 2017) and the prior-period
number has been adjusted to align with this definition. We define
retention as the ratio of the average number of employees
minus the employees who voluntarily departed, to the average
number of employees (all in full-time equivalents).
Besides the aim to keep a high Employee Engagement Index for
2018, one of SAP’s overall non-financial goals is to foster a
diverse workforce, specifically to increase the number of women
in management. At the end of 2017, the Executive Board
extended its commitment to further increase the percentage of
women in management positions by 1pp each year with a target
of 30% by the end of 2022. At the end of the first half of 2018,
25.8% of all management positions at SAP were held by women,
compared to 25.0% at the end of June 2017 and 25.4% at the
end of December 2017.
On June 30, 2018, we had 93,846 full-time equivalent (FTE)
employees worldwide (June 30, 2017: 87,114; December 31,
2017: 88,543). The increase in headcount of 5,303 FTEs
comprises 3,279 coming from organic growth and 2,024
employees from acquisitions. The overall headcount numbers
included 20,391 FTEs based in Germany (June 30, 2017: 19,375;
December 31, 2017: 19,845), and 20,138 FTEs based in the
United States (June 30, 2017: 18,368; December 31, 2017:
18,673).
Environmental Performance: Energy and Emissions Over the past several years, we have worked to better
understand the connections between our energy consumption,
its related cost, and the resulting environmental impact. Today
we measure and address our energy usage throughout SAP, as
well as our greenhouse gas (GHG) emissions across our entire
value chain. We have calculated that over the last three years,
energy efficiency initiatives have contributed to a cumulative
cost avoidance of €212 million compared to a business-as-usual
extrapolation, €45.4 million of which were avoided this year.
Our goal is to become carbon neutral by 2025. SAP’s GHG
emissions for the first half of 2018 totaled 175 kilotons of CO2
compared to 155 kilotons in the first half of 2017. This increase is
primarily due to an increase in our business flights in Q2 2018
compared to Q2 in 2017.
To gain insight into our efficiency as we grow, we also measure
our emissions per employee and per euro of revenue. At the end
of the first half of 2018, our GHG emissions (in tons) per
employee was 3.7 (compared to 3.6 at the end of the first half of
2017) and our GHG emissions (in grams) per euro revenue was
14.7 (compared to 13.5 at the end of the first half of 2017)
(rolling four quarters).
In recognition of the exemplary actions SAP has taken to embed
sustainability across its business worldwide, SAP was included
in various ratings and rankings. In the first half of 2018, SAP was
once again granted the best environmental, social, and
governance (ESG) rating “AAA” by MSCI (Morgan Stanley
Capital International).
Financial Performance: Review and Analysis
Economy and the Market
Global Economic Trends
During the first half of 2018, the global economy expanded due
to supportive financial conditions. That is what the European
Central Bank (ECB) reports in its June 2018 Economic Bulletin.1
However, according to the ECB, conditions tightened in some
emerging countries, which is why last year’s ECB projections as
described in our Integrated Report 2017 might not be entirely
achievable.
In the Europe, Middle East, and Africa (EMEA) region, the ECB
finds a solid and broad-based economic expansion across
countries and sectors in the euro area in the first half of 2018.
According to the ECB, favorable financing conditions, rising
corporate profitability, and solid demand fostered business
investment in the euro area since the beginning of 2018.
Half-Year Report January – June 2018 8
However, increasing uncertainty and some temporary and
supply-side factors at both the domestic and the global level
caused a slight moderation, reflecting a pull-back from the very
high levels of growth in 2017, says the ECB.
As for the Americas region, economic growth in the United
States slowed during the first months of 2018, states the ECB,
as predicted in our Integrated Report 2017. This deceleration
was due to a slow-down in consumer spending. At the same
time, according to the ECB, labor market improvements and
continuing monetary accommodation supported the economy in
Brazil.
According to the ECB, the Asia Pacific Japan (APJ) region in
2018 saw Japan’s gross domestic product (GDP) register the
first quarter-on-quarter fall in two years, which was earlier than
anticipated in our Integrated Report 2017. By contrast, China’s
economy expanded at the same time at a robust pace, due to
strong consumption, government support, and solid export
performance.
The IT Market
In 2018, digital transformation is no longer an option, but a
requirement for companies determined to remain relevant, says
IDC (International Data Corporation), a U.S.-based market
research firm.2 Thus, digital technologies and services such as
cloud, Internet of Things (IoT), and cognitive technology have
recently transformed entire organizations2 as had been
predicted in our Integrated Report 2017.
IDC reports that since the beginning of 2018, the number of
enterprises solely using SaaS and cloud-enabled software has
grown once more.2 By exiting the world of traditional on-
premises software completely, these enterprises hope for faster
innovation from technologies such as blockchain and new
generations of artificial intelligence and analytics.2 Hence,
according to IDC and in line with our Integrated Report 2017,
software vendors in 2018 so far have scaled back their
commitment to developing new functionality for their traditional
on-premises software suites.2 Instead, they have focused on
building consistent single-technology platforms for multiple
cloud products or end-to-end cloud suites with common look
and feel and other common features,2 says IDC.
In particular, the adoption of IoT strategies, as described in the
Integrated Report 2017, has continued in 2018: organizations
around the world have striven for operational efficiencies or new
offerings with the help of IoT, evolving from a product-based to a
service-based business model3, states IDC. IoT platform
vendors at the same time have created more value for their core
products by adding complementary IoT products and services.3
IDC reports that since the beginning of 2018, ERP and enterprise
application vendors have also made great strides with intelligent
applications, utilizing curated data sets, advanced analytics, and
machine learning4. IDC now calls this process the “evolution of
intelligence” within ERP and enterprise applications.4
Sources: 1) European Central Bank, Economic Bulletin, Issue 4/2018, Publication Date: June 28, 2018 (http://www.ecb.europa.eu/pub/pdf/ecbu/eb201804.en.pdf) (http://www.ecb.europa.eu/pub/pdf/ecbu/eb201708.en.pdf) 2) IDC Perspective: The DX World: SaaS and Cloud-Enabled Technology Bring Business Impact, Doc #US43759218, May 2018 3) IDC Market Forecast: Worldwide Internet of Things Software Platform Forecast, 2018–2022, Doc #US42635618, May 2018 4) IDC Market Perspective: Intelligent ERP and Intelligent Enterprise Applications Are Growing in Significance, Doc #US43704418, March 2018
Impact on SAP
SAP continues to benefit from the consistent strategy enabling
customers to become intelligent enterprises. On top of a solid
first quarter in 2018, SAP had a very strong performance in Q2
in the EMEA region, with cloud and software revenue increasing
10% (IFRS) and 12% (non-IFRS at constant currencies). Cloud
subscriptions and support revenue was very strong and grew by
40% (IFRS) and 46% (non-IFRS at constant currencies), with
Germany and the UK being highlights. In addition, SAP had
strong double-digit software revenue growth in the UK and the
Middle East, and Germany had another strong quarter with solid
single-digit growth.
The Company had a solid performance in the Americas region
with a significant currency headwind. Cloud and software
revenue decreased by 3% (IFRS) and increased by 8% (non-
IFRS at constant currencies). Cloud subscriptions and support
revenue increased by 24% (IFRS) and 35% (non-IFRS at
constant currencies), with Brazil being a highlight.
In the APJ region, SAP had a strong performance. Cloud and
software revenue was up by 4% (IFRS) and grew by 11% (non-
IFRS at constant currencies). Cloud subscriptions and support
revenue was exceptional and grew by 42% (IFRS) and 52%
(non-IFRS at constant currencies), with China and Japan being
highlights. Australia, China, and India had impressive quarters in
terms of software revenue and grew double-digit.
Half-Year Report January – June 2018 9
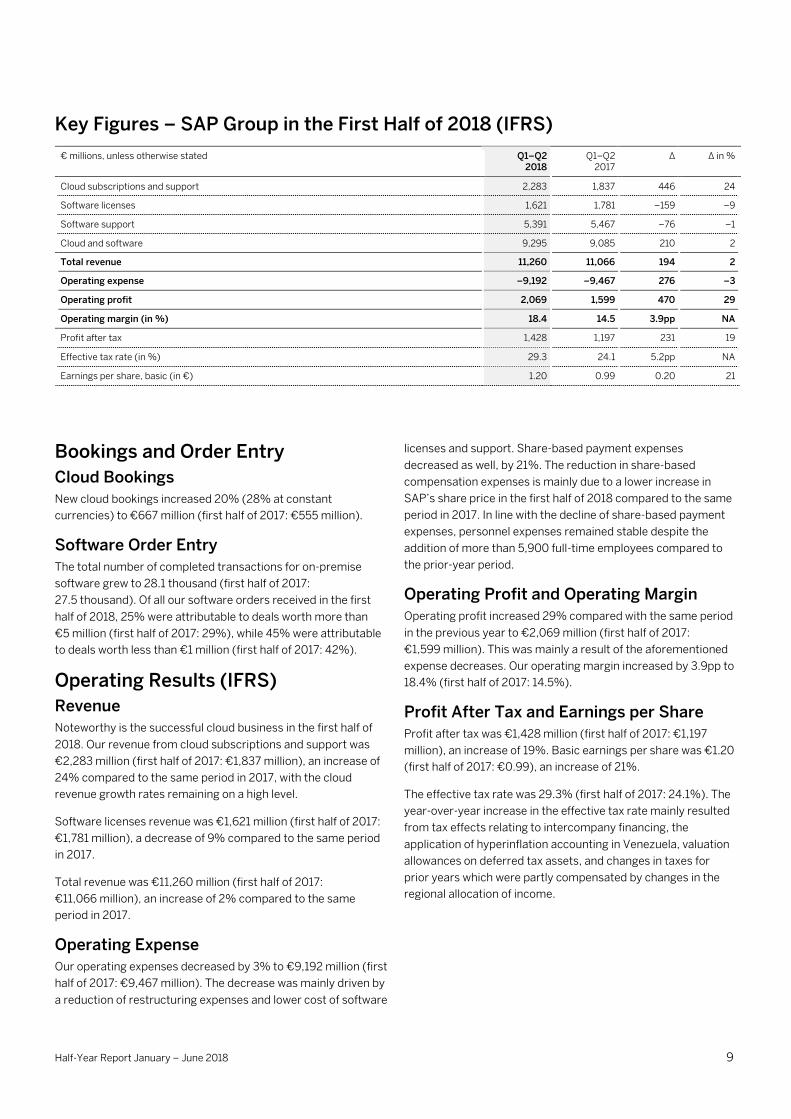
Key Figures – SAP Group in the First Half of 2018 (IFRS)
€ millions, unless otherwise stated Q1–Q2 2018
Q1–Q2 2017
∆ ∆ in %
Cloud subscriptions and support 2,283 1,837 446 24
Software licenses 1,621 1,781 –159 –9
Software support 5,391 5,467 –76 –1
Cloud and software 9,295 9,085 210 2
Total revenue 11,260 11,066 194 2
Operating expense –9,192 –9,467 276 –3
Operating profit 2,069 1,599 470 29
Operating margin (in %) 18.4 14.5 3.9pp NA
Profit after tax 1,428 1,197 231 19
Effective tax rate (in %) 29.3 24.1 5.2pp NA
Earnings per share, basic (in €) 1.20 0.99 0.20 21
Bookings and Order Entry
Cloud Bookings
New cloud bookings increased 20% (28% at constant
currencies) to €667 million (first half of 2017: €555 million).
Software Order Entry
The total number of completed transactions for on-premise
software grew to 28.1 thousand (first half of 2017:
27.5 thousand). Of all our software orders received in the first
half of 2018, 25% were attributable to deals worth more than
€5 million (first half of 2017: 29%), while 45% were attributable
to deals worth less than €1 million (first half of 2017: 42%).
Operating Results (IFRS)
Revenue
Noteworthy is the successful cloud business in the first half of
2018. Our revenue from cloud subscriptions and support was
€2,283 million (first half of 2017: €1,837 million), an increase of
24% compared to the same period in 2017, with the cloud
revenue growth rates remaining on a high level.
Software licenses revenue was €1,621 million (first half of 2017:
€1,781 million), a decrease of 9% compared to the same period
in 2017.
Total revenue was €11,260 million (first half of 2017:
€11,066 million), an increase of 2% compared to the same
period in 2017.
Operating Expense
Our operating expenses decreased by 3% to €9,192 million (first
half of 2017: €9,467 million). The decrease was mainly driven by
a reduction of restructuring expenses and lower cost of software
licenses and support. Share-based payment expenses
decreased as well, by 21%. The reduction in share-based
compensation expenses is mainly due to a lower increase in
SAP’s share price in the first half of 2018 compared to the same
period in 2017. In line with the decline of share-based payment
expenses, personnel expenses remained stable despite the
addition of more than 5,900 full-time employees compared to
the prior-year period.
Operating Profit and Operating Margin
Operating profit increased 29% compared with the same period
in the previous year to €2,069 million (first half of 2017:
€1,599 million). This was mainly a result of the aforementioned
expense decreases. Our operating margin increased by 3.9pp to
18.4% (first half of 2017: 14.5%).
Profit After Tax and Earnings per Share
Profit after tax was €1,428 million (first half of 2017: €1,197
million), an increase of 19%. Basic earnings per share was €1.20
(first half of 2017: €0.99), an increase of 21%.
The effective tax rate was 29.3% (first half of 2017: 24.1%). The
year-over-year increase in the effective tax rate mainly resulted
from tax effects relating to intercompany financing, the
application of hyperinflation accounting in Venezuela, valuation
allowances on deferred tax assets, and changes in taxes for
prior years which were partly compensated by changes in the
regional allocation of income.
Half-Year Report January – June 2018 10
Performance Against Outlook (Non-IFRS) In this section, all discussion of the contribution to target
achievement is based exclusively on non-IFRS measures. In
contrast, the discussion of operating results in the previous
section refers to IFRS figures only, so those figures are not
expressly identified as IFRS figures.
We present, discuss, and explain the reconciliation from IFRS
measures to non-IFRS measures in the Supplementary
Financial Information section.
Guidance for 2018 (Non-IFRS) For our guidance based on non-IFRS numbers, see the
Operational Targets for 2018 (Non-IFRS) section in this
consolidated half-year management report.
.
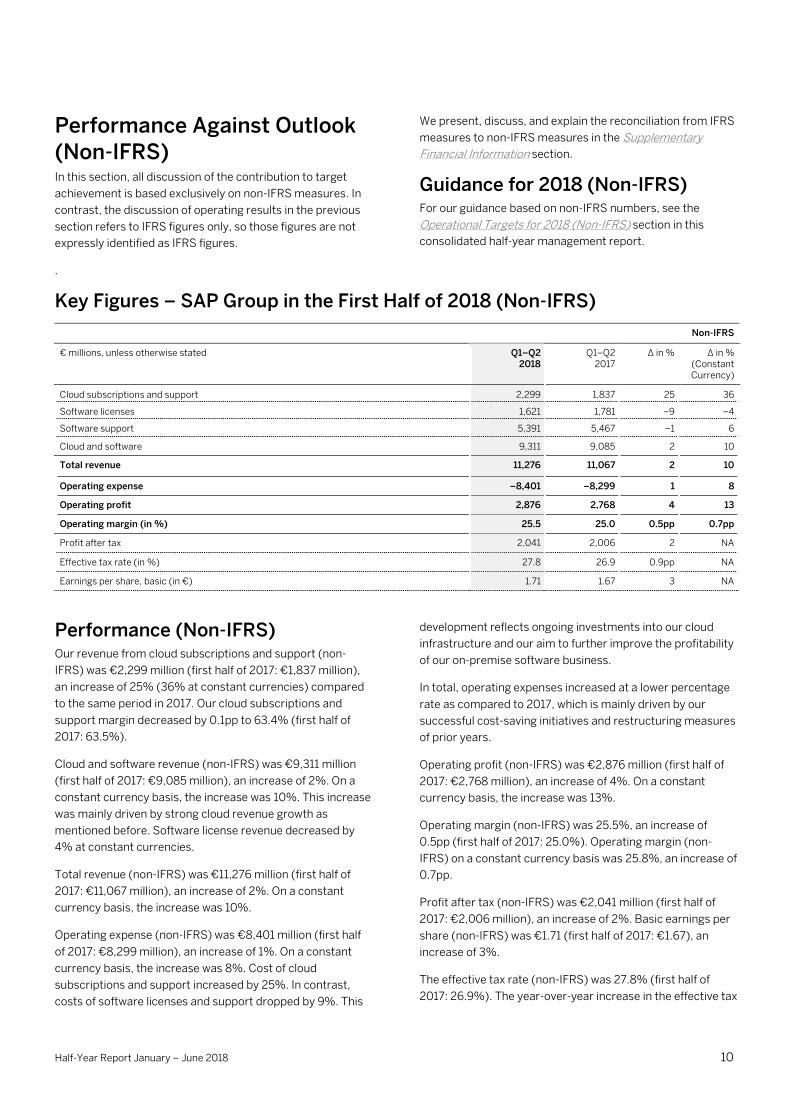
Key Figures – SAP Group in the First Half of 2018 (Non-IFRS)
Non-IFRS
€ millions, unless otherwise stated Q1–Q2 2018
Q1–Q2 2017
∆ in % ∆ in % (Constant Currency)
Cloud subscriptions and support 2,299 1,837 25 36
Software licenses 1,621 1,781 –9 –4
Software support 5,391 5,467 –1 6
Cloud and software 9,311 9,085 2 10
Total revenue 11,276 11,067 2 10
Operating expense –8,401 –8,299 1 8
Operating profit 2,876 2,768 4 13
Operating margin (in %) 25.5 25.0 0.5pp 0.7pp
Profit after tax 2,041 2,006 2 NA
Effective tax rate (in %) 27.8 26.9 0.9pp NA
Earnings per share, basic (in €) 1.71 1.67 3 NA
Performance (Non-IFRS) Our revenue from cloud subscriptions and support (non-
IFRS) was €2,299 million (first half of 2017: €1,837 million),
an increase of 25% (36% at constant currencies) compared
to the same period in 2017. Our cloud subscriptions and
support margin decreased by 0.1pp to 63.4% (first half of
2017: 63.5%).
Cloud and software revenue (non-IFRS) was €9,311 million
(first half of 2017: €9,085 million), an increase of 2%. On a
constant currency basis, the increase was 10%. This increase
was mainly driven by strong cloud revenue growth as
mentioned before. Software license revenue decreased by
4% at constant currencies.
Total revenue (non-IFRS) was €11,276 million (first half of
2017: €11,067 million), an increase of 2%. On a constant
currency basis, the increase was 10%.
Operating expense (non-IFRS) was €8,401 million (first half
of 2017: €8,299 million), an increase of 1%. On a constant
currency basis, the increase was 8%. Cost of cloud
subscriptions and support increased by 25%. In contrast,
costs of software licenses and support dropped by 9%. This
development reflects ongoing investments into our cloud
infrastructure and our aim to further improve the profitability
of our on-premise software business.
In total, operating expenses increased at a lower percentage
rate as compared to 2017, which is mainly driven by our
successful cost-saving initiatives and restructuring measures
of prior years.
Operating profit (non-IFRS) was €2,876 million (first half of
2017: €2,768 million), an increase of 4%. On a constant
currency basis, the increase was 13%.
Operating margin (non-IFRS) was 25.5%, an increase of
0.5pp (first half of 2017: 25.0%). Operating margin (non-
IFRS) on a constant currency basis was 25.8%, an increase of
0.7pp.
Profit after tax (non-IFRS) was €2,041 million (first half of
2017: €2,006 million), an increase of 2%. Basic earnings per
share (non-IFRS) was €1.71 (first half of 2017: €1.67), an
increase of 3%.
The effective tax rate (non-IFRS) was 27.8% (first half of
2017: 26.9%). The year-over-year increase in the effective tax
Half-Year Report January – June 2018 11
rate mainly resulted from tax effects relating to intercompany
financing, the application of hyperinflation accounting in
Venezuela, valuation allowances on deferred tax assets, and
changes in taxes for prior years which were partly
compensated by changes in the regional allocation of income.
Segment Performance
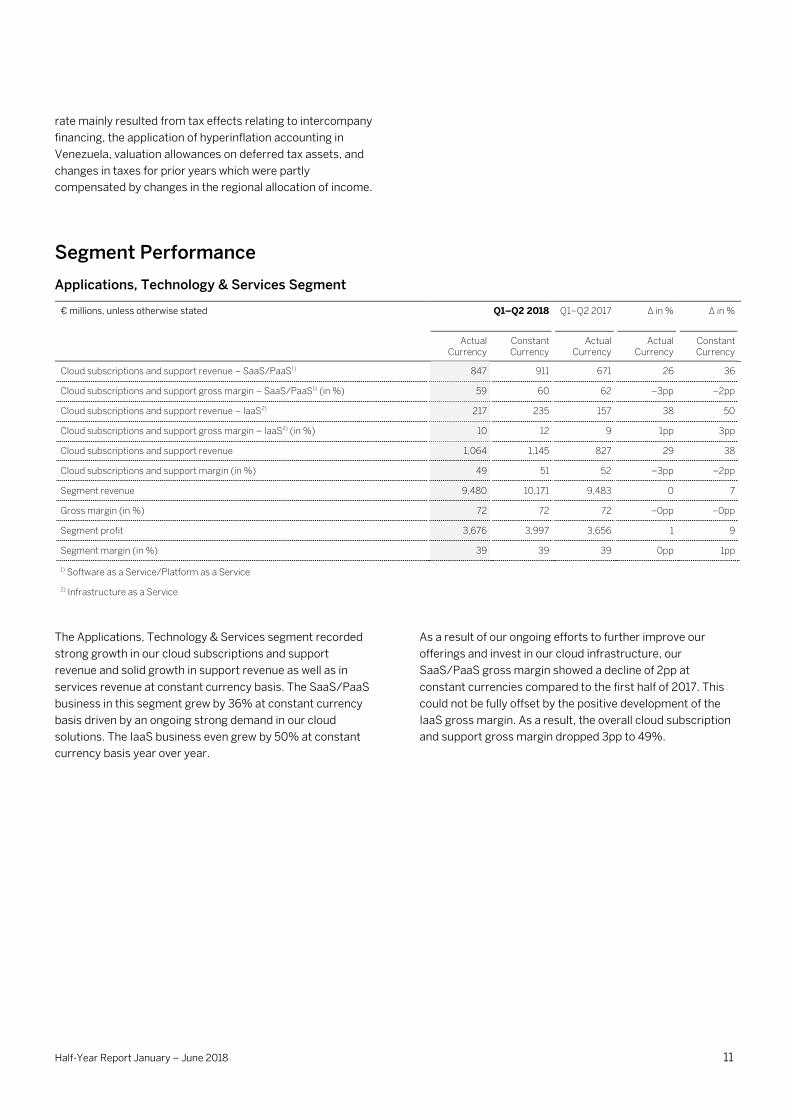
Applications, Technology & Services Segment
€ millions, unless otherwise stated Q1–Q2 2018 Q1–Q2 2017 ∆ in % ∆ in %
Actual Currency
Constant Currency
Actual Currency
Actual Currency
Constant Currency
Cloud subscriptions and support revenue – SaaS/PaaS1) 847 911 671 26 36
Cloud subscriptions and support gross margin – SaaS/PaaS1) (in %) 59 60 62 –3pp –2pp
Cloud subscriptions and support revenue – IaaS2) 217 235 157 38 50
Cloud subscriptions and support gross margin – IaaS2) (in %) 10 12 9 1pp 3pp
Cloud subscriptions and support revenue 1,064 1,145 827 29 38
Cloud subscriptions and support margin (in %) 49 51 52 –3pp –2pp
Segment revenue 9,480 10,171 9,483 0 7
Gross margin (in %) 72 72 72 –0pp –0pp
Segment profit 3,676 3,997 3,656 1 9
Segment margin (in %) 39 39 39 0pp 1pp
1) Software as a Service/Platform as a Service
2) Infrastructure as a Service
The Applications, Technology & Services segment recorded
strong growth in our cloud subscriptions and support
revenue and solid growth in support revenue as well as in
services revenue at constant currency basis. The SaaS/PaaS
business in this segment grew by 36% at constant currency
basis driven by an ongoing strong demand in our cloud
solutions. The IaaS business even grew by 50% at constant
currency basis year over year.
As a result of our ongoing efforts to further improve our
offerings and invest in our cloud infrastructure, our
SaaS/PaaS gross margin showed a decline of 2pp at
constant currencies compared to the first half of 2017. This
could not be fully offset by the positive development of the
IaaS gross margin. As a result, the overall cloud subscription
and support gross margin dropped 3pp to 49%.
Half-Year Report January – June 2018 12
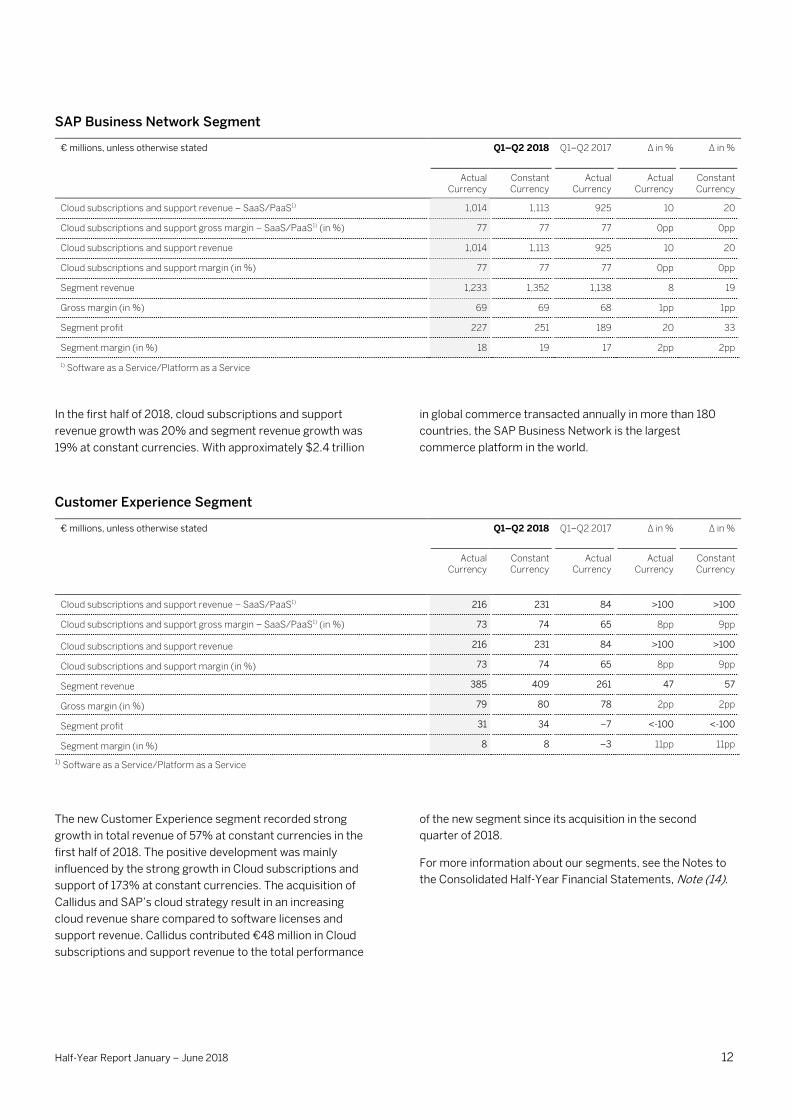
SAP Business Network Segment
€ millions, unless otherwise stated Q1–Q2 2018 Q1–Q2 2017 ∆ in % ∆ in %
Actual Currency
Constant Currency
Actual Currency
Actual Currency
Constant Currency
Cloud subscriptions and support revenue – SaaS/PaaS1) 1,014 1,113 925 10 20
Cloud subscriptions and support gross margin – SaaS/PaaS1) (in %) 77 77 77 0pp 0pp
Cloud subscriptions and support revenue 1,014 1,113 925 10 20
Cloud subscriptions and support margin (in %) 77 77 77 0pp 0pp
Segment revenue 1,233 1,352 1,138 8 19
Gross margin (in %) 69 69 68 1pp 1pp
Segment profit 227 251 189 20 33
Segment margin (in %) 18 19 17 2pp 2pp
1) Software as a Service/Platform as a Service
In the first half of 2018, cloud subscriptions and support
revenue growth was 20% and segment revenue growth was
19% at constant currencies. With approximately $2.4 trillion
in global commerce transacted annually in more than 180
countries, the SAP Business Network is the largest
commerce platform in the world.
Customer Experience Segment
€ millions, unless otherwise stated Q1–Q2 2018 Q1–Q2 2017 ∆ in % ∆ in %
Actual Currency
Constant Currency
Actual Currency
Actual Currency
Constant Currency
Cloud subscriptions and support revenue – SaaS/PaaS1) 216 231 84 >100 >100
Cloud subscriptions and support gross margin – SaaS/PaaS1) (in %) 73 74 65 8pp 9pp
Cloud subscriptions and support revenue 216 231 84 >100 >100
Cloud subscriptions and support margin (in %) 73 74 65 8pp 9pp
Segment revenue 385 409 261 47 57
Gross margin (in %) 79 80 78 2pp 2pp
Segment profit 31 34 –7 <-100 <-100
Segment margin (in %) 8 8 –3 11pp 11pp
1) Software as a Service/Platform as a Service
The new Customer Experience segment recorded strong
growth in total revenue of 57% at constant currencies in the
first half of 2018. The positive development was mainly
influenced by the strong growth in Cloud subscriptions and
support of 173% at constant currencies. The acquisition of
Callidus and SAP’s cloud strategy result in an increasing
cloud revenue share compared to software licenses and
support revenue. Callidus contributed €48 million in Cloud
subscriptions and support revenue to the total performance
of the new segment since its acquisition in the second
quarter of 2018.
For more information about our segments, see the Notes to
the Consolidated Half-Year Financial Statements, Note (14).
Half-Year Report January – June 2018 13
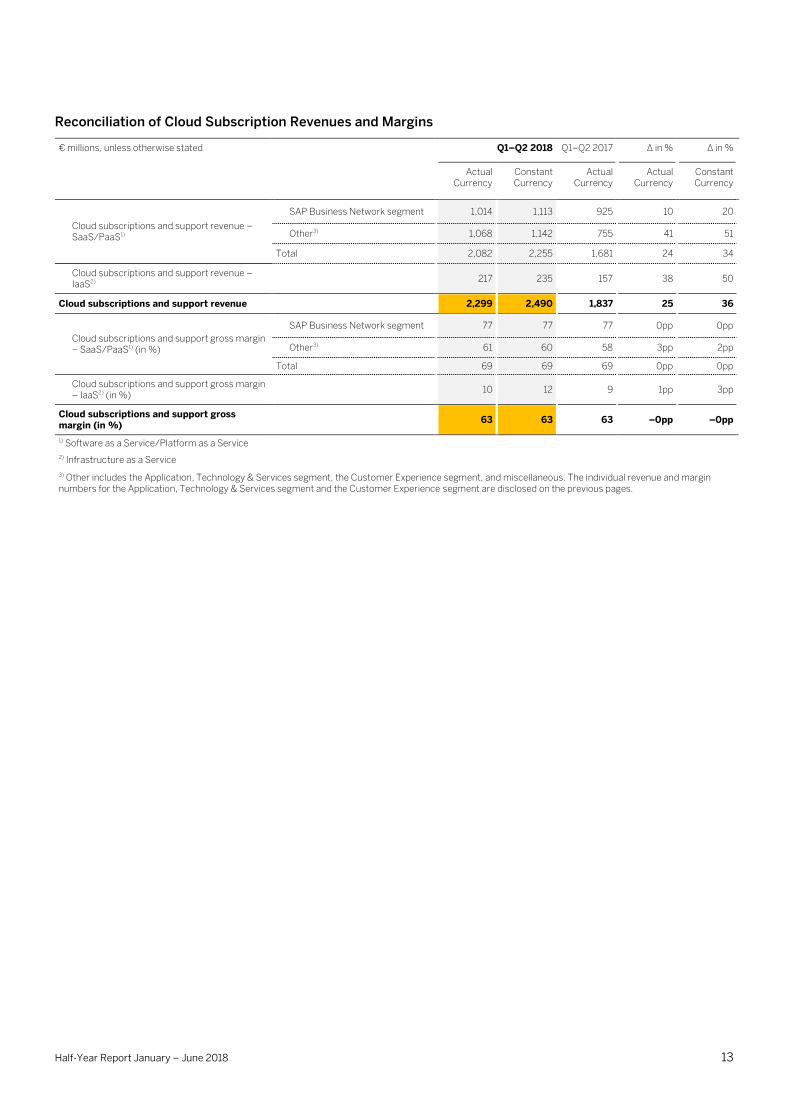
Reconciliation of Cloud Subscription Revenues and Margins
€ millions, unless otherwise stated Q1–Q2 2018 Q1–Q2 2017 ∆ in % ∆ in %
Actual Currency
Constant Currency
Actual Currency
Actual Currency
Constant Currency
Cloud subscriptions and support revenue – SaaS/PaaS1)
SAP Business Network segment 1,014 1,113 925 10 20
Other3) 1,068 1,142 755 41 51
Total 2,082 2,255 1,681 24 34
Cloud subscriptions and support revenue – IaaS2)
217 235 157 38 50
Cloud subscriptions and support revenue 2,299 2,490 1,837 25 36
Cloud subscriptions and support gross margin – SaaS/PaaS1) (in %)
SAP Business Network segment 77 77 77 0pp 0pp
Other3) 61 60 58 3pp 2pp
Total 69 69 69 0pp 0pp
Cloud subscriptions and support gross margin – IaaS2) (in %)
10 12 9 1pp 3pp
Cloud subscriptions and support gross margin (in %)
63 63 63 –0pp –0pp
1) Software as a Service/Platform as a Service 2) Infrastructure as a Service 3) Other includes the Application, Technology & Services segment, the Customer Experience segment, and miscellaneous. The individual revenue and margin numbers for the Application, Technology & Services segment and the Customer Experience segment are disclosed on the previous pages.
Half-Year Report January – June 2018 14
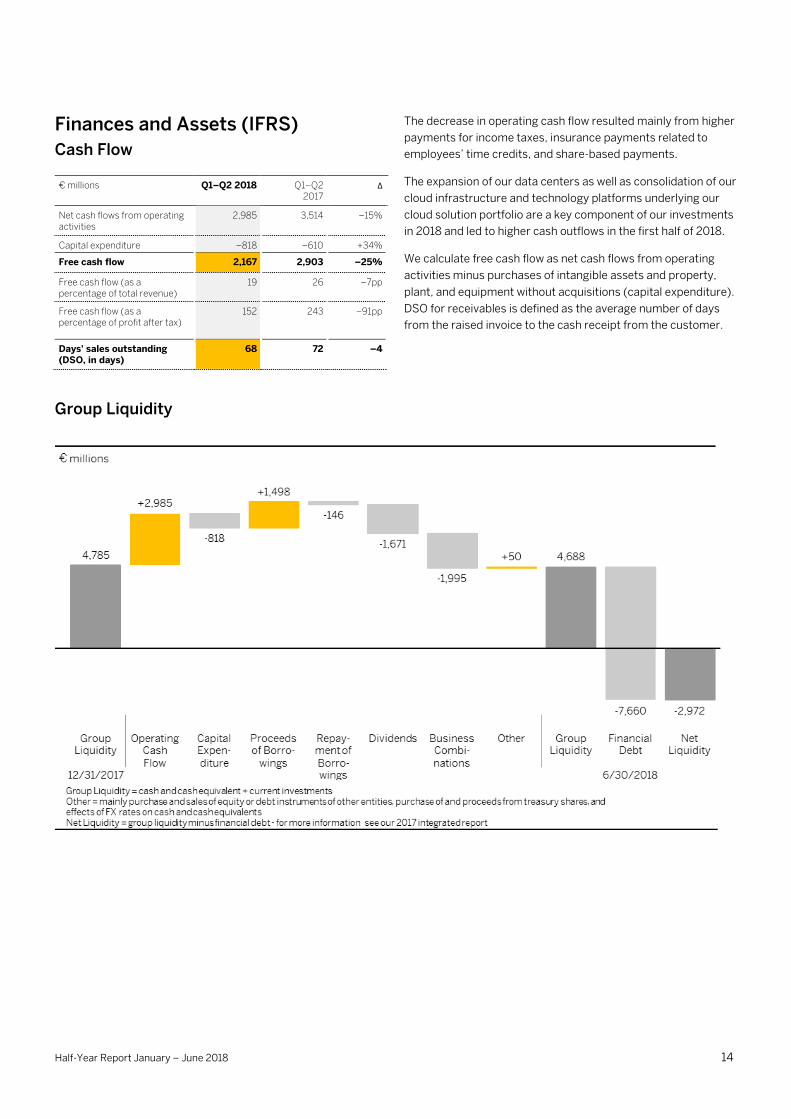
Finances and Assets (IFRS)
Cash Flow
€ millions Q1–Q2 2018 Q1–Q2 2017
∆
Net cash flows from operating activities
2,985 3,514 –15%
Capital expenditure –818 –610 +34%
Free cash flow 2,167 2,903 –25%
Free cash flow (as a percentage of total revenue)
19 26 –7pp
Free cash flow (as a percentage of profit after tax)
152 243 –91pp
Days' sales outstanding (DSO, in days)
68 72 –4
The decrease in operating cash flow resulted mainly from higher
payments for income taxes, insurance payments related to
employees’ time credits, and share-based payments.
The expansion of our data centers as well as consolidation of our
cloud infrastructure and technology platforms underlying our
cloud solution portfolio are a key component of our investments
in 2018 and led to higher cash outflows in the first half of 2018.
We calculate free cash flow as net cash flows from operating
activities minus purchases of intangible assets and property,
plant, and equipment without acquisitions (capital expenditure).
DSO for receivables is defined as the average number of days
from the raised invoice to the cash receipt from the customer.
Group Liquidity
Half-Year Report January – June 2018 15
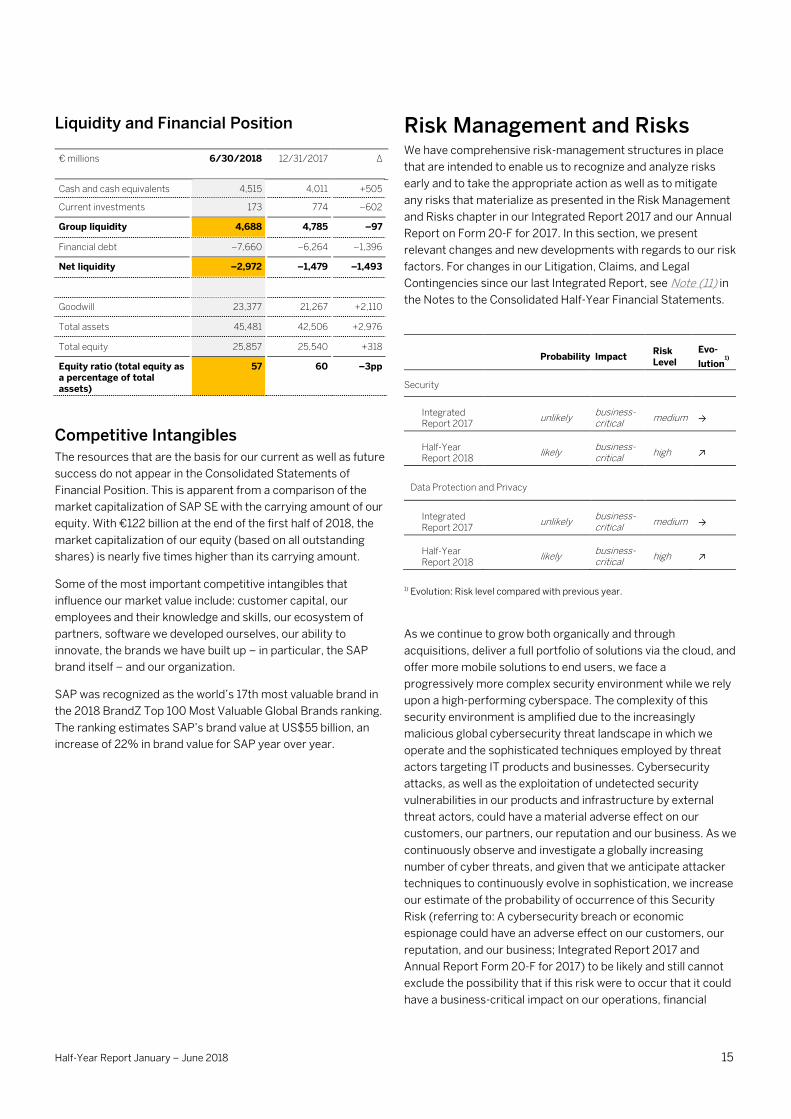
Liquidity and Financial Position
€ millions 6/30/2018 12/31/2017 ∆
Cash and cash equivalents 4,515 4,011 +505
Current investments 173 774 –602
Group liquidity 4,688 4,785 –97
Financial debt –7,660 –6,264 –1,396
Net liquidity –2,972 –1,479 –1,493
Goodwill 23,377 21,267 +2,110
Total assets 45,481 42,506 +2,976
Total equity 25,857 25,540 +318
Equity ratio (total equity as a percentage of total assets)
57 60 –3pp
Competitive Intangibles
The resources that are the basis for our current as well as future
success do not appear in the Consolidated Statements of
Financial Position. This is apparent from a comparison of the
market capitalization of SAP SE with the carrying amount of our
equity. With €122 billion at the end of the first half of 2018, the
market capitalization of our equity (based on all outstanding
shares) is nearly five times higher than its carrying amount.
Some of the most important competitive intangibles that
influence our market value include: customer capital, our
employees and their knowledge and skills, our ecosystem of
partners, software we developed ourselves, our ability to
innovate, the brands we have built up – in particular, the SAP
brand itself – and our organization.
SAP was recognized as the world’s 17th most valuable brand in
the 2018 BrandZ Top 100 Most Valuable Global Brands ranking.
The ranking estimates SAP’s brand value at US$55 billion, an
increase of 22% in brand value for SAP year over year.
Risk Management and Risks We have comprehensive risk-management structures in place
that are intended to enable us to recognize and analyze risks
early and to take the appropriate action as well as to mitigate
any risks that materialize as presented in the Risk Management
and Risks chapter in our Integrated Report 2017 and our Annual
Report on Form 20-F for 2017. In this section, we present
relevant changes and new developments with regards to our risk
factors. For changes in our Litigation, Claims, and Legal
Contingencies since our last Integrated Report, see Note (11) in
the Notes to the Consolidated Half-Year Financial Statements.
Probability Impact Risk Level
Evo-
lution1)
Security
Integrated Report 2017
unlikely business-critical
medium →
Half-Year Report 2018
likely business-critical
high ↗
Data Protection and Privacy
Integrated Report 2017
unlikely business-critical
medium →
Half-Year Report 2018
likely business-critical
high ↗
1) Evolution: Risk level compared with previous year.
As we continue to grow both organically and through
acquisitions, deliver a full portfolio of solutions via the cloud, and
offer more mobile solutions to end users, we face a
progressively more complex security environment while we rely
upon a high-performing cyberspace. The complexity of this
security environment is amplified due to the increasingly
malicious global cybersecurity threat landscape in which we
operate and the sophisticated techniques employed by threat
actors targeting IT products and businesses. Cybersecurity
attacks, as well as the exploitation of undetected security
vulnerabilities in our products and infrastructure by external
threat actors, could have a material adverse effect on our
customers, our partners, our reputation and our business. As we
continuously observe and investigate a globally increasing
number of cyber threats, and given that we anticipate attacker
techniques to continuously evolve in sophistication, we increase
our estimate of the probability of occurrence of this Security
Risk (referring to: A cybersecurity breach or economic
espionage could have an adverse effect on our customers, our
reputation, and our business; Integrated Report 2017 and
Annual Report Form 20-F for 2017) to be likely and still cannot
exclude the possibility that if this risk were to occur that it could
have a business-critical impact on our operations, financial
Half-Year Report January – June 2018 16
position, profit and cash flows. We now classify this increased
risk as a high risk.
Both the German Federal Office for the Protection of the
Constitution and security industry experts warn against a
globally growing number of cybersecurity attacks aimed at
obtaining or violating company data including personal data.
Considering these warnings and the increasingly complex and
stringent data protection and privacy regulatory environment in
a progressive digitalization in which we operate, we updated the
Data Protection and Privacy Risk (referring to: Non-compliance
with applicable data protection and privacy laws or failure to
adequately meet the requirements of SAP’s customers with
respect to our products and services; Integrated Report 2017
and Annual Report Form 20-F for 2017). Specifically, we are
subject to evolving regulations and new laws (such as the
recently effective EU General Data Protection Regulation
(GDPR), the China Cybersecurity Law, and the European Union’s
proposed e-Privacy Regulation) globally regarding data
protection and privacy. These regulations and other standards
increasingly aimed at the use of personal information, such as
for marketing purposes and the tracking of individuals’ online
activities. Non-compliance with these increasingly complex and
evolving regulations could lead to civil liabilities and significant
fines as well as a loss of customers and damage to SAP’s
reputation.
As a result of this progressively more complex and stringent
regulatory environment and the globally increasing number of
hacker attacks we estimate the increased probability of
occurrence of this risk to be likely and can still not exclude the
possibility that if the risk were to occur, it could have a business-
critical impact on our operations, financial position, profit, and
cash flows. We now classify this increased risk as a high risk.
We closely monitor the corresponding mitigations, as per the
Risk Management and Risks chapter in our Integrated Report
2017 and Annual Report on Form 20-F for 2017, addressing the
aforementioned Security Risk and Data Protection and Privacy
Risk, and continuously enhance as required.
Based on our aggregation approach, we subsequently see
changes in the consolidated risk profile related to the
percentages of all reported risks categorized as “high” or
“medium” in our risk level matrix. The number of risks
categorized as “high” now account for 26% (previously 17%) of
all reported risks, while the risks categorized as “medium” now
account for 43% (previously 52%).
We do not believe that any of the risks we have identified in our
Integrated Report 2017 and Annual Report on Form 20-F for
2017, and as outlined in the update above, jeopardize our ability
to continue as a going concern.
Other than as reflected in the update above, we do not see any
relevant changes to our assessment of the risk factors since the
issuing of the Integrated Report 2017 and Annual Report on
Form 20-F for 2017.
Expected Developments and Opportunities
Future Trends in the Global Economy The near-term global economic outlook remains essentially solid
and broad-based. This is what the European Central Bank (ECB)
reports in its June 2018 Economic Bulletin1, corresponding with
our Integrated Report 2017. However, over the medium term, it
expects the positive momentum to slow down to below pre-
crisis rates. In addition, the implementation of higher trade
tariffs and the possibility of wider protectionism represent a key
risk to global growth, says the ECB.
Regarding the Europe, Middle East, and Africa (EMEA) region,
the ECB confirms the projections cited in our Integrated Report
2017: It expects more moderate but still solid growth
momentum in the euro area. In central and eastern Europe, it
counts on a robust economic activity, supported by strong
investment. According to the ECB, Russia is facing supportive
factors such as rising oil prices, declining inflation, and
improving business and consumer confidence.
As for the Americas region, the ECB expects economic activity
in the United States to rebound this year, due to improvement in
investment and favorable financial conditions. In Brazil, the
stabilization in commodity prices and terms of trade should be
supportive while political uncertainty and financial conditions
might weigh on demand, projects the ECB.
In the Asia Pacific Japan (APJ) region, the EBC believes the
effects of the Japanese fiscal stimulus might already fade this
year, earlier than anticipated in our Integrated Report 2017. At
the same time, China and other export-oriented Asian
economies will benefit from the predicted global trade revival.
However, the ECB expects China’s transition to a lower growth
path to continue.
Half-Year Report January – June 2018 17
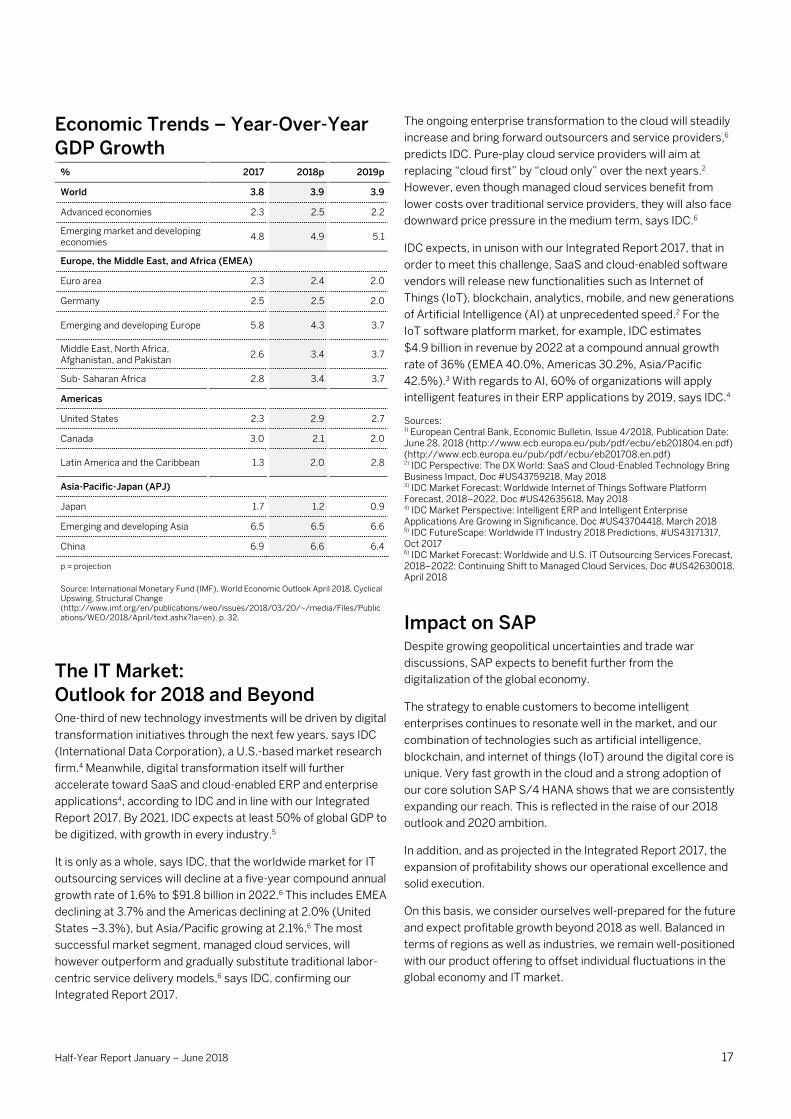
Economic Trends – Year-Over-Year
GDP Growth % 2017 2018p 2019p
World 3.8 3.9 3.9
Advanced economies 2.3 2.5 2.2
Emerging market and developing economies
4.8 4.9 5.1
Europe, the Middle East, and Africa (EMEA)
Euro area 2.3 2.4 2.0
Germany 2.5 2.5 2.0
Emerging and developing Europe 5.8 4.3 3.7
Middle East, North Africa, Afghanistan, and Pakistan
2.6 3.4 3.7
Sub- Saharan Africa 2.8 3.4 3.7
Americas
United States 2.3 2.9 2.7
Canada 3.0 2.1 2.0
Latin America and the Caribbean 1.3 2.0 2.8
Asia-Pacific-Japan (APJ)
Japan 1.7 1.2 0.9
Emerging and developing Asia 6.5 6.5 6.6
China 6.9 6.6 6.4
p = projection
Source: International Monetary Fund (IMF), World Economic Outlook April 2018, Cyclical Upswing, Structural Change (http://www.imf.org/en/publications/weo/issues/2018/03/20/~/media/Files/Publications/WEO/2018/April/text.ashx?la=en), p. 32.
The IT Market:
Outlook for 2018 and Beyond One-third of new technology investments will be driven by digital
transformation initiatives through the next few years, says IDC
(International Data Corporation), a U.S.-based market research
firm.4 Meanwhile, digital transformation itself will further
accelerate toward SaaS and cloud-enabled ERP and enterprise
applications4, according to IDC and in line with our Integrated
Report 2017. By 2021, IDC expects at least 50% of global GDP to
be digitized, with growth in every industry.5
It is only as a whole, says IDC, that the worldwide market for IT
outsourcing services will decline at a five-year compound annual
growth rate of 1.6% to $91.8 billion in 2022.6 This includes EMEA
declining at 3.7% and the Americas declining at 2.0% (United
States –3.3%), but Asia/Pacific growing at 2.1%.6 The most
successful market segment, managed cloud services, will
however outperform and gradually substitute traditional labor-
centric service delivery models,6 says IDC, confirming our
Integrated Report 2017.
The ongoing enterprise transformation to the cloud will steadily
increase and bring forward outsourcers and service providers,6
predicts IDC. Pure-play cloud service providers will aim at
replacing “cloud first” by “cloud only” over the next years.2
However, even though managed cloud services benefit from
lower costs over traditional service providers, they will also face
downward price pressure in the medium term, says IDC.6
IDC expects, in unison with our Integrated Report 2017, that in
order to meet this challenge, SaaS and cloud-enabled software
vendors will release new functionalities such as Internet of
Things (IoT), blockchain, analytics, mobile, and new generations
of Artificial Intelligence (AI) at unprecedented speed.2 For the
IoT software platform market, for example, IDC estimates
$4.9 billion in revenue by 2022 at a compound annual growth
rate of 36% (EMEA 40.0%, Americas 30.2%, Asia/Pacific
42.5%).3 With regards to AI, 60% of organizations will apply
intelligent features in their ERP applications by 2019, says IDC.4
Sources: 1) European Central Bank, Economic Bulletin, Issue 4/2018, Publication Date: June 28, 2018 (http://www.ecb.europa.eu/pub/pdf/ecbu/eb201804.en.pdf) (http://www.ecb.europa.eu/pub/pdf/ecbu/eb201708.en.pdf) 2) IDC Perspective: The DX World: SaaS and Cloud-Enabled Technology Bring Business Impact, Doc #US43759218, May 2018 3) IDC Market Forecast: Worldwide Internet of Things Software Platform Forecast, 2018–2022, Doc #US42635618, May 2018 4) IDC Market Perspective: Intelligent ERP and Intelligent Enterprise Applications Are Growing in Significance, Doc #US43704418, March 2018 5) IDC FutureScape: Worldwide IT Industry 2018 Predictions, #US43171317, Oct 2017 6) IDC Market Forecast: Worldwide and U.S. IT Outsourcing Services Forecast, 2018–2022: Continuing Shift to Managed Cloud Services, Doc #US42630018, April 2018
Impact on SAP Despite growing geopolitical uncertainties and trade war
discussions, SAP expects to benefit further from the
digitalization of the global economy.
The strategy to enable customers to become intelligent
enterprises continues to resonate well in the market, and our
combination of technologies such as artificial intelligence,
blockchain, and internet of things (IoT) around the digital core is
unique. Very fast growth in the cloud and a strong adoption of
our core solution SAP S/4 HANA shows that we are consistently
expanding our reach. This is reflected in the raise of our 2018
outlook and 2020 ambition.
In addition, and as projected in the Integrated Report 2017, the
expansion of profitability shows our operational excellence and
solid execution.
On this basis, we consider ourselves well-prepared for the future
and expect profitable growth beyond 2018 as well. Balanced in
terms of regions as well as industries, we remain well-positioned
with our product offering to offset individual fluctuations in the
global economy and IT market.
Half-Year Report January – June 2018 18
SAP expects to outperform the global economy and the IT
industry again in 2018 in terms of revenue growth.
Operational Targets for 2018
(Non-IFRS)
Revenue and Operating Profit Outlook
Due to the strong momentum in SAP’s cloud business, the
Company is raising its outlook for the full year 2018 as follows:
– Non-IFRS cloud subscriptions and support revenue is now
expected to be in a range of €5.050 billion to €5.200 billion
at constant currencies (2017: €3.77 billion), up 34.0% to
38.0% at constant currencies. The previous range was
€4.95 billion to €5.15 billion at constant currencies.
– Non-IFRS cloud and software revenue is now expected to be
in a range of €21.025 to €21.250 billion at constant
currencies (2017: €19.55 billion), up 7.5% to 8.5% at
constant currencies. The previous range was €20.85 billion
to €21.25 billion at constant currencies.
– Non-IFRS total revenue is now expected to be in a range of
€24.975 billion to €25.300 billion at constant currencies
(2017: €23.46 billion), up 6.0% to 7.5% at constant
currencies. The previous range was €24.80 billion to
€25.30 billion at constant currencies.
– Non-IFRS operating profit is now expected to be in a range of
€7.400 billion to €7.500 billion at constant currencies (2017:
€6.77 billion), up 9.0% to 11.0% at constant currencies. The
previous range was €7.35 billion to €7.50 billion at constant
currencies.
While SAP’s full-year 2018 business outlook is at constant
currencies, actual currency reported figures are expected to be
impacted by currency exchange rate fluctuations as the
Company progresses through the year. See the table below for
the currency impacts expected in Q3 and FY 2018.
Expected Currency Impact Based on June 2018 Level for the Rest of the Year
In percentage points Q3 FY
Cloud subscriptions and support 1 to –1pp –4 to –6pp
Cloud and software 1 to –1pp –2 to –4pp
Operating profit 1 to –1pp –2 to –4pp
We expect that non-IFRS total revenue will continue to depend
largely on the revenue from both cloud and software. However,
we expect cloud revenue to overtake software license revenue in
2018 and beyond. In 2018, we expect an increase in our
operating margin.
In 2018, we expect our organic headcount to increase at a
similar pace as in 2017. Including acquisitions we expect to add
headcount at a faster pace than in 2017.
We continuously strive for profit expansion in all of our operating
segments.
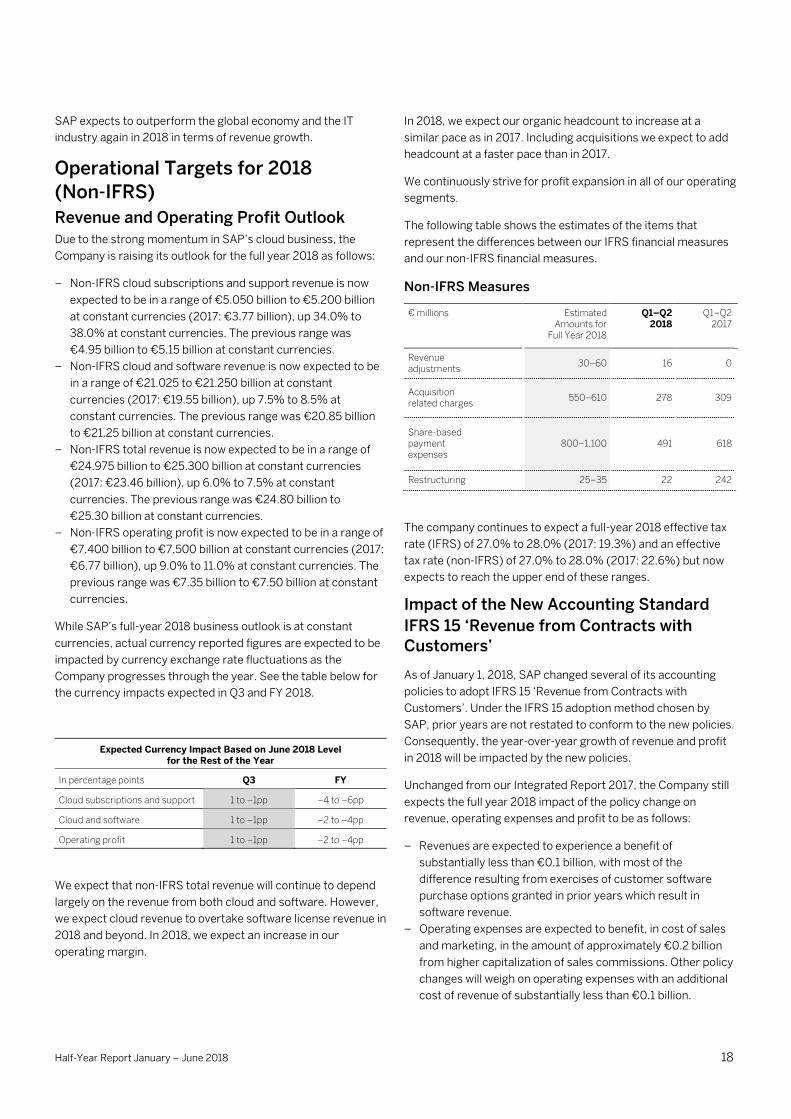
The following table shows the estimates of the items that
represent the differences between our IFRS financial measures
and our non-IFRS financial measures.
Non-IFRS Measures
€ millions Estimated Amounts for
Full Year 2018
Q1–Q2 2018
Q1–Q2 2017
Revenue adjustments
30–60 16 0
Acquisition related charges
550–610 278 309
Share-based payment expenses
800–1,100 491 618
Restructuring 25–35 22 242
The company continues to expect a full-year 2018 effective tax
rate (IFRS) of 27.0% to 28.0% (2017: 19.3%) and an effective
tax rate (non-IFRS) of 27.0% to 28.0% (2017: 22.6%) but now
expects to reach the upper end of these ranges.
Impact of the New Accounting Standard
IFRS 15 ‘Revenue from Contracts with
Customers’
As of January 1, 2018, SAP changed several of its accounting
policies to adopt IFRS 15 ‘Revenue from Contracts with
Customers’. Under the IFRS 15 adoption method chosen by
SAP, prior years are not restated to conform to the new policies.
Consequently, the year-over-year growth of revenue and profit
in 2018 will be impacted by the new policies.
Unchanged from our Integrated Report 2017, the Company still
expects the full year 2018 impact of the policy change on
revenue, operating expenses and profit to be as follows:
– Revenues are expected to experience a benefit of
substantially less than €0.1 billion, with most of the
difference resulting from exercises of customer software
purchase options granted in prior years which result in
software revenue.
– Operating expenses are expected to benefit, in cost of sales
and marketing, in the amount of approximately €0.2 billion
from higher capitalization of sales commissions. Other policy
changes will weigh on operating expenses with an additional
cost of revenue of substantially less than €0.1 billion.
Half-Year Report January – June 2018 19
– The above-mentioned effects will result in a net positive
impact on operating profit of approximately €0.2 billion.
For more information about the adoption of IFRS 15, see
Note (3) of the Notes to the Consolidated Half-Year Financial
Statements.
Goals for Liquidity, Finance, and
Investments On June 30, 2018, we had negative net liquidity. We believe that
our liquid assets combined with our undrawn credit facilities are
sufficient to meet our operating financing needs in the second
half of 2018 as well and, together with expected cash flows from
operations, will support debt repayments and our currently
planned capital expenditure requirements over the near term
and medium term.
In 2018, we anticipate operating cash flow to reach a level
similar to 2017. Furthermore, we repaid U.S. private placements
totaling US$150 million in June 2018 and intend to repay
€400 million and €750 million in Eurobonds in August and
November 2018, respectively.
Our planned capital expenditures for 2018 and 2019, other than
from business combinations, consist primarily of the
construction activities described in the Assets (IFRS) section of
our Integrated Report 2017. We expect investments from these
activities of approximately €376 million in 2018 (an increase of
approximately 16% compared to the previous year). The
expansion of our data centers is an important aspect of our
planned investments again for 2018 and 2019. In addition, we
aim to extend our office space to cover currently anticipated
future growth. In 2019, we expect investments of approximately
€380 million.
Premises on Which Our Outlook Is
Based In preparing our outlook, we have taken into account all events
known to us at the time we prepared this report that could
influence SAP’s business going forward.
Among the premises on which this outlook is based are those
presented concerning economic development and the
assumption that there will be no further major acquisitions in
2018 and 2019.
Medium-Term Prospects In this section, all numbers are based exclusively on non-IFRS
measures.
We expect to grow our more predictable revenue while steadily
increasing operating profit. Our strategic objectives are focused
primarily on our main financial and non-financial objectives:
growth, profitability, customer loyalty, and employee
engagement.
SAP’s 2020 ambition reflects our consistent fast growth in the
cloud, solid software momentum, and operating profit
expansion. Our 2020 targets, last published at the beginning of
2018, have been updated, primarily to reflect the acquisition of
Callidus Software Inc. and the changed currency environment.
SAP now aims to achieve the following targets by 2020:
– €8.2 billion to €8.7 billion in non-IFRS cloud subscriptions
and support revenue (previously: €8.0 billion to €8.5 billion;
2017: €3.77 billion)
– €28 billion to €29 billion in non-IFRS total revenue
(unchanged; 2017: €23.46 billion)
– €8.5 billion to €9.0 billion in non-IFRS operating profit
(unchanged; 2017: €6.77 billion)
The updated ambition is based on estimated average 2018
currencies, assuming the current foreign exchange environment
prevails until year-end. The previous ambition was based on
average 2017 currencies. Approximately, the change in currency
assumptions negatively impacts the cloud subscriptions and
support revenue ambition by -€0.35 billion, the total revenue
ambition by -€1.0 billion and the operating profit ambition by
-€0.4 billion.
The midpoints of the updated 2020 total revenue and operating
profit ranges imply an operating margin of 30.7%. Beyond 2020,
SAP currently expects further increases of its operating margin.
We continue to expect the share of more predictable revenue
(defined as the total of cloud subscriptions and support revenue
and software support revenue) to reach 70% to 75% in 2020
(2017: 63%).
We continue to expect that, by 2020, our public cloud offerings
will contribute approximately half of cloud subscription and
support revenue, followed by our business network offerings.
Both of these offerings we continue to expect to each generate,
in 2020, cloud subscriptions and support revenues that are
significantly higher than the cloud subscriptions and support
revenue generated from our private cloud offerings.
We continue to expect our revenue growth trajectory through
2020 to be driven by continued strong growth in the cloud and
continued growth in our software support revenue. We continue
to expect low to mid-single-digit declines in software revenue.
This is all expected to result in high single-digit growth in cloud
and software revenue through 2020.
We also continue to strive to significantly improve, over the next
few years, the profitability of our cloud business. Starting in
2018, we continue to expect to see the benefits from previous
efficiency-based investments, and thus an increasing cloud
gross margin. We continue to expect these profitability
improvements to accelerate in the following years till 2020.
Half-Year Report January – June 2018 20
We expect that the individual gross margins of our different
cloud operating models will increase at different rates over the
next years to reach the following mid-term targets:
– We continue to expect that, in 2020, the gross margin from
our business network business will be higher than 80%
(2017: 77%).
– We continue to expect that, in 2020, the gross margin from
our public cloud offerings to reach about 70% (2017: 57%),
and to expand to about 80% over the course of the two years
thereafter.
– We continue to expect the gross margin for our private cloud
offerings to reach about 40% by 2020 (2017: 6%).
Therefore, we continue to expect our overall cloud gross margin
to be approximately 71% by 2020 (2017: 62.2%).
We also aim to further improve the profitability of our on-
premise software business. We continue to expect the 2020
gross margin for our software licenses and support to be slightly
higher than in 2017 (2017: 87.0%).
In addition, we continue to expect our 2020 services gross
margin to be slightly higher than in 2017 (2017: 23.5%).
As we look to increase our profitability through 2020, we
continue to expect our cost ratios (cost as a % of total revenue)
to develop as follows through 2020, relative to 2017: Research
and development is expected to remain stable. Sales and
marketing as well as general and administration are expected to
decline slightly.
With regards to cash flow, starting in 2019 we continue to expect
growth rates of our capital expenditures to massively decline
from the 2017 and 2018 levels. We also continue to expect
significant growth of free cashflow in 2019 and 2020, reflecting
the increasing profitability of our business.
Non-Financial Goals 2018 and
Ambitions for 2020 In addition to our financial goals, we also focus on two non-
financial 2020 targets: customer loyalty and employee
engagement. These targets remain unchanged compared to
what we disclosed in our Integrated Report 2017. For a detailed
description of our Non-Financial Goals 2018 and ambitions for
2020, please see our Integrated Report 2017.
Opportunities We have comprehensive opportunity-management structures in
place that are intended to enable us to recognize and analyze
opportunities early and to take the appropriate action. The
opportunities remain largely unchanged compared to what we
disclosed in our Integrated Report 2017.
Half-Year Report January – June 2018 21
Consolidated Half-Year Financial Statements – IFRS
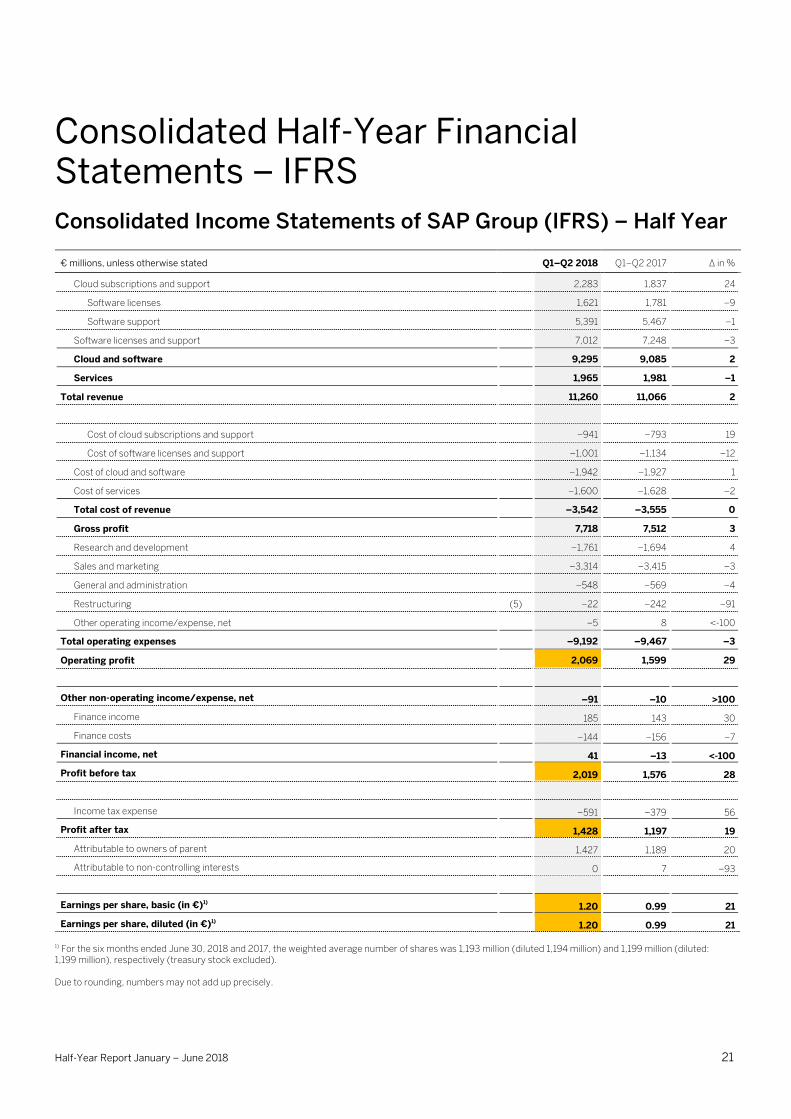
Consolidated Income Statements of SAP Group (IFRS) – Half Year
€ millions, unless otherwise stated Q1–Q2 2018 Q1–Q2 2017 ∆ in %
Cloud subscriptions and support 2,283 1,837 24
Software licenses 1,621 1,781 –9
Software support 5,391 5,467 –1
Software licenses and support 7,012 7,248 –3
Cloud and software 9,295 9,085 2
Services 1,965 1,981 –1
Total revenue 11,260 11,066 2
Cost of cloud subscriptions and support –941 –793 19
Cost of software licenses and support –1,001 –1,134 –12
Cost of cloud and software –1,942 –1,927 1
Cost of services –1,600 –1,628 –2
Total cost of revenue –3,542 –3,555 0
Gross profit 7,718 7,512 3
Research and development –1,761 –1,694 4
Sales and marketing –3,314 –3,415 –3
General and administration –548 –569 –4
Restructuring (5) –22 –242 –91
Other operating income/expense, net –5 8 <-100
Total operating expenses –9,192 –9,467 –3
Operating profit 2,069 1,599 29
Other non-operating income/expense, net –91 –10 >100
Finance income 185 143 30
Finance costs –144 –156 –7
Financial income, net 41 –13 <-100
Profit before tax 2,019 1,576 28
Income tax expense –591 –379 56
Profit after tax 1,428 1,197 19
Attributable to owners of parent 1,427 1,189 20
Attributable to non-controlling interests 0 7 –93
Earnings per share, basic (in €)1) 1.20 0.99 21
Earnings per share, diluted (in €)1) 1.20 0.99 21
1) For the six months ended June 30, 2018 and 2017, the weighted average number of shares was 1,193 million (diluted 1,194 million) and 1,199 million (diluted: 1,199 million), respectively (treasury stock excluded). Due to rounding, numbers may not add up precisely.
Half-Year Report January – June 2018 22
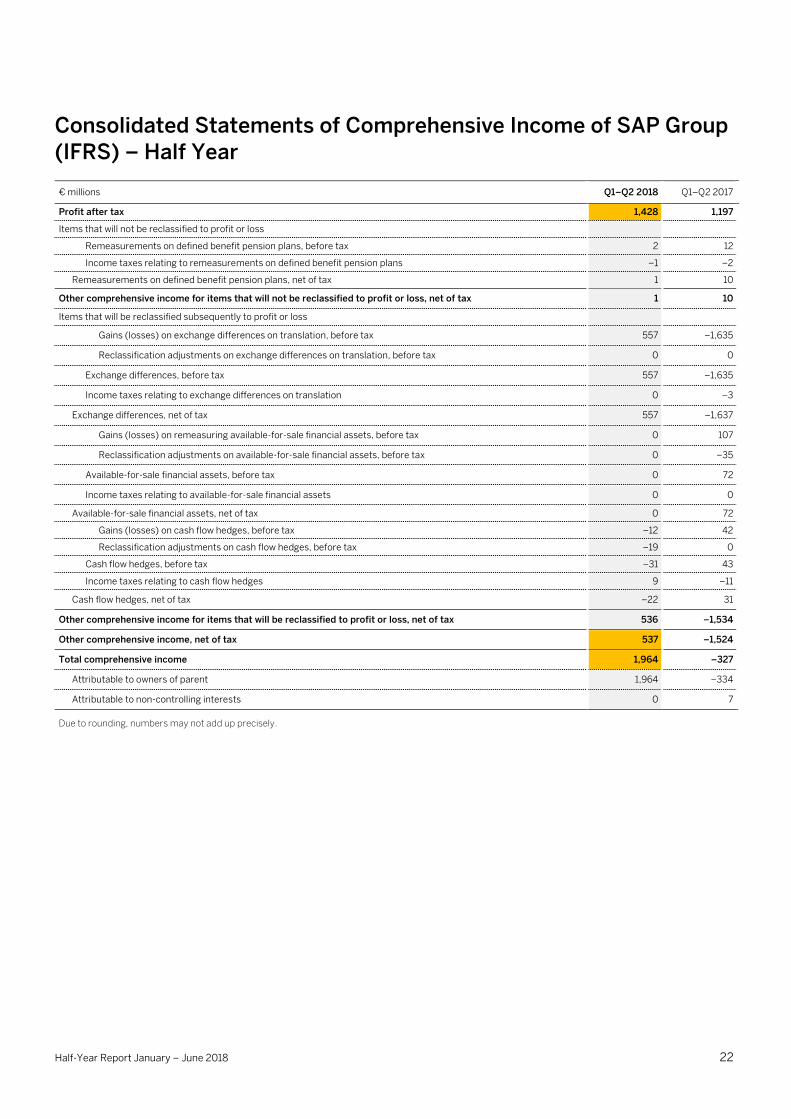
Consolidated Statements of Comprehensive Income of SAP Group (IFRS) – Half Year
€ millions Q1–Q2 2018 Q1–Q2 2017
Profit after tax 1,428 1,197
Items that will not be reclassified to profit or loss
Remeasurements on defined benefit pension plans, before tax 2 12
Income taxes relating to remeasurements on defined benefit pension plans –1 –2
Remeasurements on defined benefit pension plans, net of tax 1 10
Other comprehensive income for items that will not be reclassified to profit or loss, net of tax 1 10
Items that will be reclassified subsequently to profit or loss
Gains (losses) on exchange differences on translation, before tax 557 –1,635
Reclassification adjustments on exchange differences on translation, before tax 0 0
Exchange differences, before tax 557 –1,635
Income taxes relating to exchange differences on translation 0 –3
Exchange differences, net of tax 557 –1,637
Gains (losses) on remeasuring available-for-sale financial assets, before tax 0 107
Reclassification adjustments on available-for-sale financial assets, before tax 0 –35
Available-for-sale financial assets, before tax 0 72
Income taxes relating to available-for-sale financial assets 0 0
Available-for-sale financial assets, net of tax 0 72
Gains (losses) on cash flow hedges, before tax –12 42
Reclassification adjustments on cash flow hedges, before tax –19 0
Cash flow hedges, before tax –31 43
Income taxes relating to cash flow hedges 9 –11
Cash flow hedges, net of tax –22 31
Other comprehensive income for items that will be reclassified to profit or loss, net of tax 536 –1,534
Other comprehensive income, net of tax 537 –1,524
Total comprehensive income 1,964 –327
Attributable to owners of parent 1,964 –334
Attributable to non-controlling interests 0 7
Due to rounding, numbers may not add up precisely.
Half-Year Report January – June 2018 23
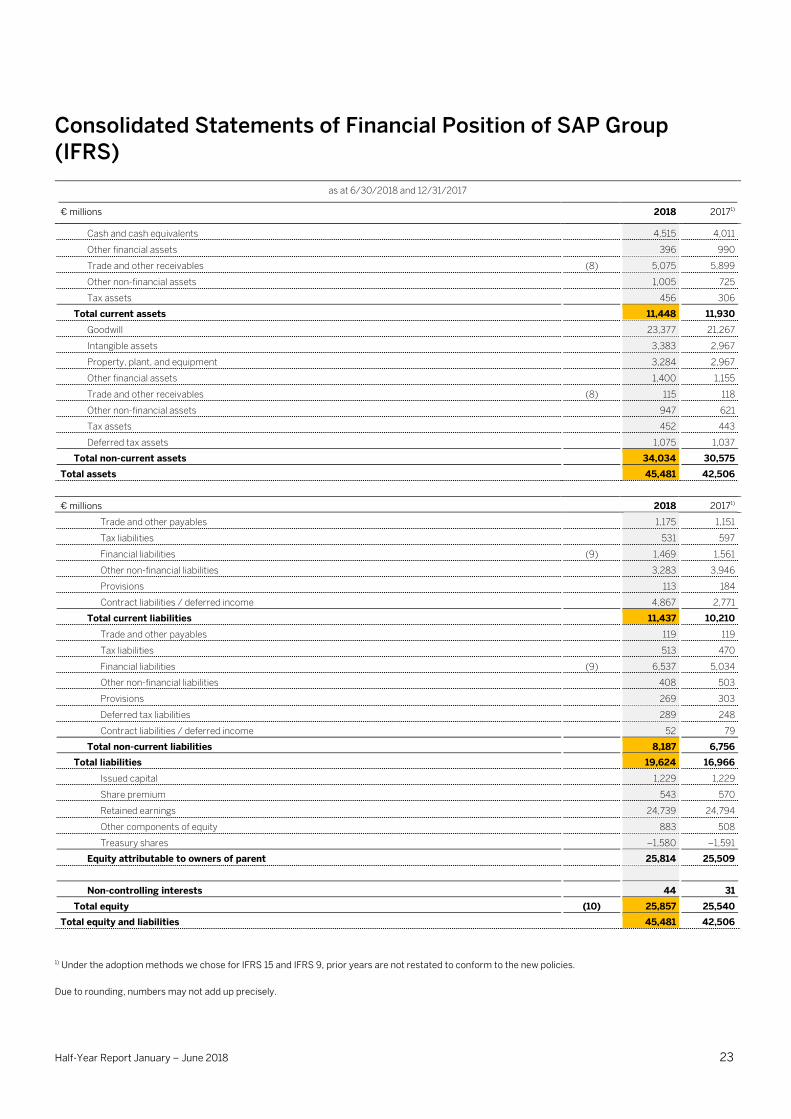
Consolidated Statements of Financial Position of SAP Group (IFRS)
as at 6/30/2018 and 12/31/2017
€ millions 2018 20171)
Cash and cash equivalents 4,515 4,011
Other financial assets 396 990
Trade and other receivables (8) 5,075 5,899
Other non-financial assets 1,005 725
Tax assets 456 306
Total current assets 11,448 11,930
Goodwill 23,377 21,267
Intangible assets 3,383 2,967
Property, plant, and equipment 3,284 2,967
Other financial assets 1,400 1,155
Trade and other receivables (8) 115 118
Other non-financial assets 947 621
Tax assets 452 443
Deferred tax assets 1,075 1,037
Total non-current assets 34,034 30,575
Total assets 45,481 42,506
€ millions 2018 20171)
Trade and other payables 1,175 1,151
Tax liabilities 531 597
Financial liabilities (9) 1,469 1,561
Other non-financial liabilities 3,283 3,946
Provisions 113 184
Contract liabilities / deferred income 4,867 2,771
Total current liabilities 11,437 10,210
Trade and other payables 119 119
Tax liabilities 513 470
Financial liabilities (9) 6,537 5,034
Other non-financial liabilities 408 503
Provisions 269 303
Deferred tax liabilities 289 248
Contract liabilities / deferred income 52 79
Total non-current liabilities 8,187 6,756
Total liabilities 19,624 16,966
Issued capital 1,229 1,229
Share premium 543 570
Retained earnings 24,739 24,794
Other components of equity 883 508
Treasury shares –1,580 –1,591
Equity attributable to owners of parent 25,814 25,509
Non-controlling interests 44 31
Total equity (10) 25,857 25,540
Total equity and liabilities 45,481 42,506
1) Under the adoption methods we chose for IFRS 15 and IFRS 9, prior years are not restated to conform to the new policies.
Due to rounding, numbers may not add up precisely.
Half-Year Report January – June 2018 24
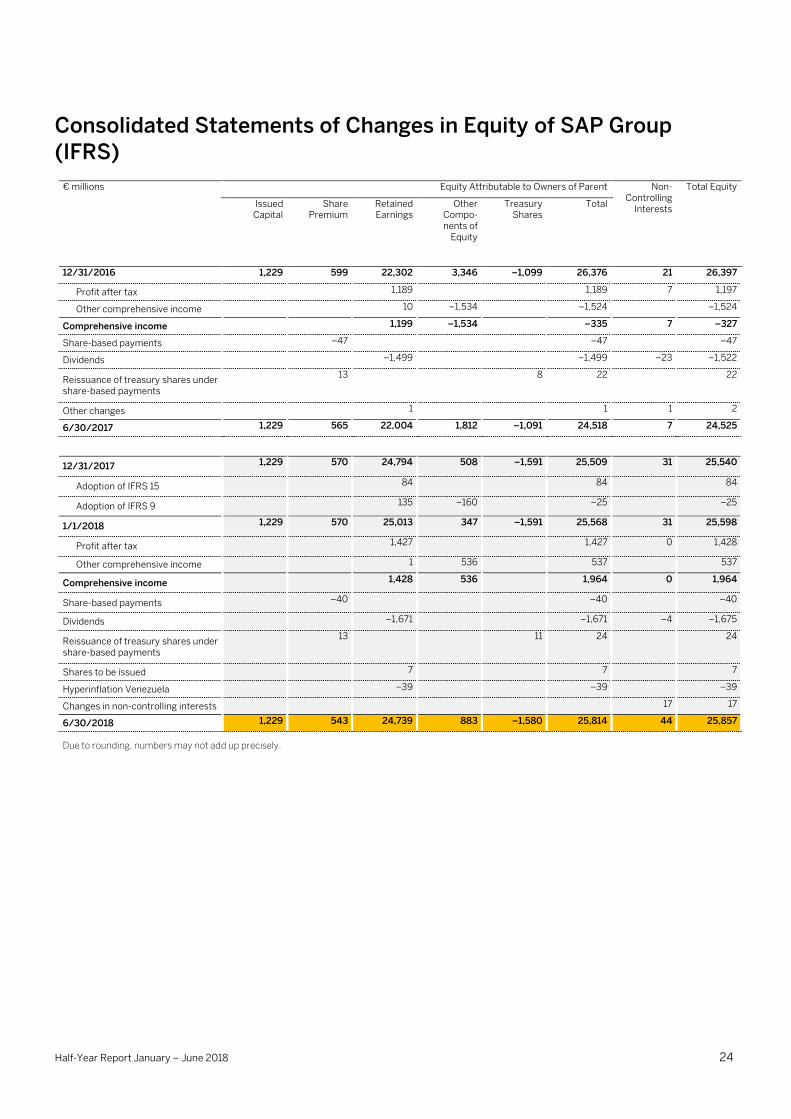
Consolidated Statements of Changes in Equity of SAP Group (IFRS)
€ millions Equity Attributable to Owners of Parent Non-Controlling
Interests
Total Equity
Issued Capital
Share Premium
Retained Earnings
Other Compo-nents of
Equity
Treasury Shares
Total
12/31/2016 1,229 599 22,302 3,346 –1,099 26,376 21 26,397
Profit after tax 1,189 1,189 7 1,197
Other comprehensive income 10 –1,534 –1,524 –1,524
Comprehensive income 1,199 –1,534 –335 7 –327
Share-based payments –47 –47 –47
Dividends –1,499 –1,499 –23 –1,522
Reissuance of treasury shares under share-based payments
13 8 22 22
Other changes 1 1 1 2
6/30/2017 1,229 565 22,004 1,812 –1,091 24,518 7 24,525
12/31/2017 1,229 570 24,794 508 –1,591 25,509 31 25,540
Adoption of IFRS 15 84 84 84
Adoption of IFRS 9 135 –160 –25 –25
1/1/2018 1,229 570 25,013 347 –1,591 25,568 31 25,598
Profit after tax 1,427 1,427 0 1,428
Other comprehensive income 1 536 537 537
Comprehensive income 1,428 536 1,964 0 1,964
Share-based payments –40 –40 –40
Dividends –1,671 –1,671 –4 –1,675
Reissuance of treasury shares under share-based payments
13 11 24 24
Shares to be issued 7 7 7
Hyperinflation Venezuela –39 –39 –39
Changes in non-controlling interests 17 17
6/30/2018 1,229 543 24,739 883 –1,580 25,814 44 25,857
Due to rounding, numbers may not add up precisely.
Half-Year Report January – June 2018 25
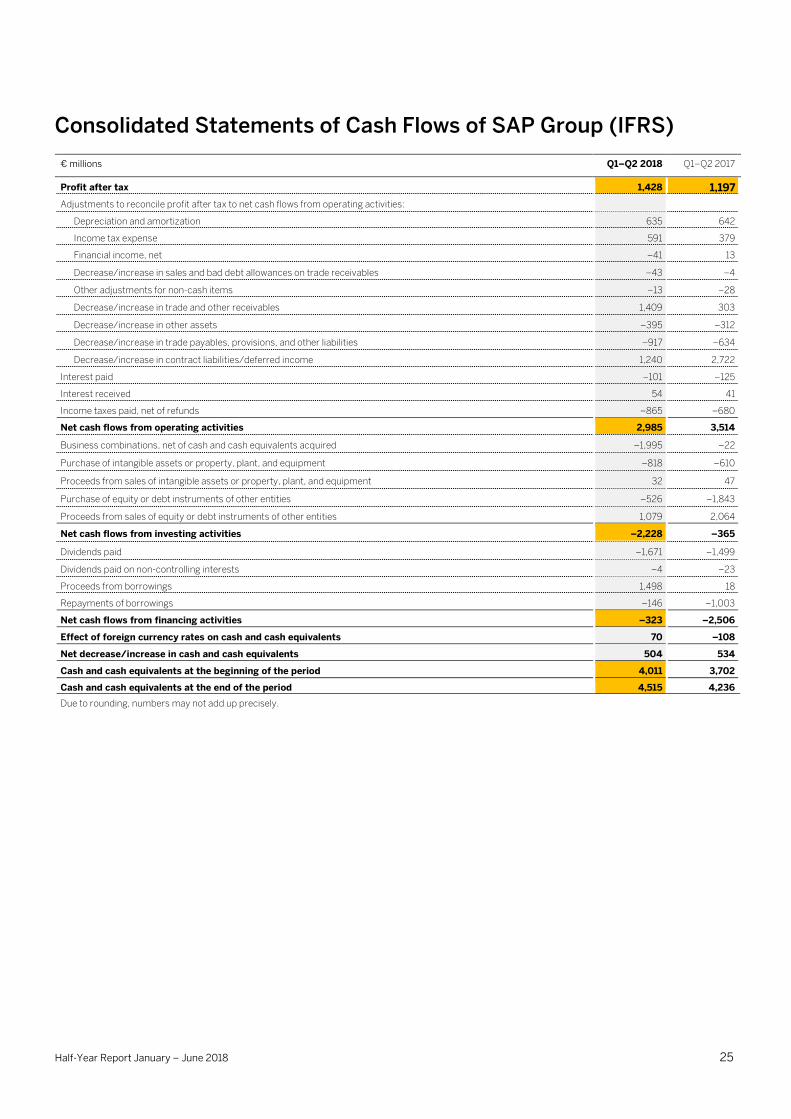
Consolidated Statements of Cash Flows of SAP Group (IFRS)
€ millions Q1–Q2 2018 Q1–Q2 2017
Profit after tax 1,428 1,197
Adjustments to reconcile profit after tax to net cash flows from operating activities:
Depreciation and amortization 635 642
Income tax expense 591 379
Financial income, net –41 13
Decrease/increase in sales and bad debt allowances on trade receivables –43 –4
Other adjustments for non-cash items –13 –28
Decrease/increase in trade and other receivables 1,409 303
Decrease/increase in other assets –395 –312
Decrease/increase in trade payables, provisions, and other liabilities –917 –634
Decrease/increase in contract liabilities/deferred income 1,240 2,722
Interest paid –101 –125
Interest received 54 41
Income taxes paid, net of refunds –865 –680
Net cash flows from operating activities 2,985 3,514
Business combinations, net of cash and cash equivalents acquired –1,995 –22
Purchase of intangible assets or property, plant, and equipment –818 –610
Proceeds from sales of intangible assets or property, plant, and equipment 32 47
Purchase of equity or debt instruments of other entities –526 –1,843
Proceeds from sales of equity or debt instruments of other entities 1,079 2,064
Net cash flows from investing activities –2,228 –365
Dividends paid –1,671 –1,499
Dividends paid on non-controlling interests –4 –23
Proceeds from borrowings 1,498 18
Repayments of borrowings –146 –1,003
Net cash flows from financing activities –323 –2,506
Effect of foreign currency rates on cash and cash equivalents 70 –108
Net decrease/increase in cash and cash equivalents 504 534
Cash and cash equivalents at the beginning of the period 4,011 3,702
Cash and cash equivalents at the end of the period 4,515 4,236
Due to rounding, numbers may not add up precisely.
Half-Year Report January – June 2018 26
Notes to the Consolidated Half-Year Financial Statements
(1) General Information About
Consolidated Half-Year Financial
Statements The accompanying condensed Consolidated Half-Year Financial
Statements of SAP SE and its subsidiaries (collectively, “we,”
“us,” “our,” “SAP,” “Group,” and “Company”) have been
prepared in accordance with the International Financial
Reporting Standards (IFRS) and in particular in compliance with
International Accounting Standard (IAS) 34. The designation
IFRS includes all standards issued by the International
Accounting Standards Board (IASB) and related interpretations
issued by the IFRS Interpretations Committee (IFRS IC). The
variances between the applicable IFRS standards as issued by
the IASB and the standards as used by the European Union are
not relevant to these financial statements.
Certain information and disclosures normally included in the
notes to annual financial statements prepared in accordance
with IFRS have been condensed or omitted. We believe that the
disclosures made are adequate and that the information gives a
true and fair view.
Our business activities are influenced by certain seasonal
effects. Historically, our overall revenue tends to be highest in
the fourth quarter. Interim results are therefore not necessarily
indicative of results for a full year.
Amounts reported in previous years have been reclassified if
appropriate to conform to the presentation in this half-year
report.
These unaudited condensed Consolidated Half-Year Financial
Statements should be read in conjunction with SAP’s audited
Consolidated IFRS Financial Statements for the Year Ended
December 31, 2017, included in our Integrated Report 2017 and
our Annual Report on Form 20-F for 2017.
Due to rounding, numbers presented throughout these
Consolidated Half-Year Financial Statements may not add up
precisely to the totals we provide and percentages may not
precisely reflect the absolute figures.
(2) Scope of Consolidation The additions in the first half of 2018 relate to more than fifty
entities added in connection with acquisitions and foundations.
The disposals are mainly due to liquidations of legal entities.
For more information about our business combinations and the
effect on our Consolidated Financial Statements, see Note (4)
and our Integrated Report 2017.
(3) Summary of Significant
Accounting Policies
(3a) New Accounting Standards Adopted in
the Current Period
As of January 1, 2018, SAP changed several of its accounting
policies to adopt IFRS 15 ‘Revenue from Contracts with
Customers’ and IFRS 9 ‘Financial Instruments’.
IFRS 15 ‘Revenue from Contracts with Customers‘
Classes of Revenue
We derive our revenue from fees charged to our customers for
(a) the use of our hosted cloud offerings, (b) licenses to our on-
premise software products, and (c) standardized and premium
support services, consulting, customer-specific software
development agreements, training, and other services.
Cloud and software revenue, as presented in our Consolidated
Income Statements, is the sum of our cloud subscriptions and
support revenue, our software licenses revenue, and our
software support revenue.
– Revenue from cloud subscriptions and support represents
fees earned from providing customers with any of the
following:
Software as a Service (SaaS), that is, a right to use
software functionality (including standard functionalities
and customer-specific developed cloud applications and
extensions) in a cloud-based infrastructure hosted by SAP
or third parties engaged by SAP, where the customer does
not have the right to terminate the hosting contract and
take possession of the software to either run it on the
customer’s own IT infrastructure or to engage a third-
party provider unrelated to SAP for hosting and managing
the software; the item also includes transaction and agent
Half-Year Report January – June 2018 27
fees for transactions that customers of our network-
business execute on our cloud-based transaction
platforms
Platform as a Service (PaaS), that is, access to a cloud-
based infrastructure to develop, run, and manage
applications
Infrastructure as a Service (IaaS), that is, hosting and
related application management services for software
hosted by SAP or third parties engaged by SAP, where the
customer has the right to take possession of the software
Additional premium cloud subscription support beyond
the regular support that is embedded in the basic cloud
subscription fees.
– Software licenses revenue represents fees earned from the
sale or license of software to customers for use on the
customer’s premises, in other words, where the customer
has the right to take possession of the software for
installation on the customer’s premises or on hardware of
third-party hosting providers unrelated to SAP (on-premise
software). Software licenses revenue includes revenue from
both the sale of our standard software products and
customer-specific on-premise-software development
agreements.
– Software support revenue represents fees earned from
providing customers with standardized support services
which comprise unspecified future software updates,
upgrades, and enhancements as well as technical product
support services for on-premise software products.
Services revenue primarily represents fees earned from
professional consulting services, premium support services,
training services, messaging services, and payment services in
connection with our travel and expense management offerings.
Policies and Judgment
Identification of Contract
We frequently enter into multiple contracts with the same
customer that we treat, for accounting purposes, as one
contract if the contracts are entered into at or near the same
time and are economically interrelated. We do not combine
contracts with closing days more than three months apart
because we do not consider them being entered into near the
same time. Judgment is required in evaluating whether two or
more contracts are interrelated, which includes considerations
as to whether they were negotiated as a package with a single
commercial objective, whether the amount of consideration on
one contract is dependent on the performance of the other
contract, or if some or all goods in the contracts are a single
performance obligation.
New arrangements with existing customers can be either a new
contract or the modification of prior contracts with the
customer. Our respective judgment in making this
determination considers whether there is a connection between
the new arrangement and the pre-existing contracts, whether
the goods and services under the new arrangement are highly
interrelated with the goods and services sold under prior
contracts, and how the goods and services under the new
arrangement are priced. In determining whether a change in
transaction price represents a contract modification or a change
in variable consideration, we examine whether the change in
price results from changing the contract or from applying
unchanged existing contract provisions.
Identification of Performance Obligations
Our customer contracts often include various products and
services. Typically, the products and services outlined in the
“Classes of Revenue” section qualify as separate performance
obligations and the portion of the contractual fee allocated to
them is recognized separately. Judgement is required, however,
in determining whether a good or service is considered a
separate performance obligation. In particular for our
professional services and implementation activities, judgement
is required to evaluate if such services significantly integrate,
customize, or modify the on-premise software or cloud service
to which they relate. In this context we consider the nature of
the services and their volume relative to the volume of the on-
premise software or cloud service to which they relate. In
general, the implementation services for our cloud services go
beyond pure setup activities and qualify as separate
performance obligations. Similarly, our on-premise
implementation services and our custom development services
typically qualify as separate performance obligations. Non-
distinct goods and services are combined into one distinct
bundle of goods and services (combined performance
obligation).
When selling goods or services, we frequently grant customers
options to acquire additional goods or services (for example,
renewals of renewable offerings, or additional volumes of
purchased software). We apply judgment in determining
whether such options provide a material right to the customer
that it would not receive without entering into that contract
(material right options). In this judgment, we consider whether
the options entitle the customer to a discount that exceeds the
discount granted for the respective goods or services sold
together with the option.
Determination of Transaction Price
We apply judgement in determining the amount to which we
expect to be entitled in exchange for transferring promised
goods or services to a customer. This includes estimates as to
whether and to what extent subsequent concessions or
payments may be granted to customers and whether the
customer is expected to pay the contractual fees. In this
judgment, we consider our history both with the respective
customer and more broadly.
Half-Year Report January – June 2018 28
Our typical cloud services do not provide the customer with a
software license because the customer does not have the right
to terminate the hosting contract and take possession of the
software. Consequently, cloud fees that are based on
transaction volumes are considered in the transaction price
based on estimates rather than being accounted for as sales-
based license royalties.
Only very rarely do our contracts include significant financing
components. We do not account for financing components if the
period between when SAP transfers the promised goods or
services to the customer and when the customer pays for those
goods or services is one year or less.
Allocation of Transaction Price
We have established a hierarchy to identify the standalone
selling prices (SSPs) that we use to allocate the transaction
price of a customer contract to the performance obligations in
the contract.
– Where standalone selling prices for an offering are
observable and reasonably consistent across customers
(that is, not highly variable), our SSP estimates are derived
from our respective pricing history. Typically, our
standardized support offerings and our professional service
offerings follow this approach.
– Where sales prices for an offering are not directly observable
or highly variable across customers, we use estimation
techniques. For renewable offerings with highly variable
pricing, these techniques consider the individual contract’s
expected renewal price as far as this price is substantive.
Typically, our cloud subscription offerings follow this
approach. For non-renewable offerings, these estimations
follow a cost-plus-margin approach.
– For offerings that lack renewals and have highly variable
pricing, we allocate the transaction price by applying a
residual approach. We use this technique in particular for our
standard on-premise software offerings.
Judgment is required when estimating SSPs. To judge whether
the historical pricing of our goods and services is highly variable,
we have established thresholds of pricing variability. In judging
whether contractual renewal prices are substantive, we have
established floor prices that we use as SSPs whenever the
contractual renewal prices are below these floor prices. In
judging whether contracts are expected to renew at their
contractual renewal prices, we rely on our respective renewal
history. The SSPs of material right options depend on the
probability of option exercise. In estimating these probabilities,
we apply judgment considering historical exercise patterns.
We review the stand-alone selling prices periodically or
whenever facts and circumstances change to ensure the most
objective input parameters available are used.
Recognition of Revenue
Cloud subscriptions and support revenue is recognized over
time as the services are performed. Where our performance
obligation is the grant of a right to continuously access and use a
cloud offering for a certain term, revenue is recognized based on
time elapsed and thus ratably over this term.
Software revenue is recognized at a point in time or over time
depending on whether we deliver standard software or
customer-specific software:
– Licenses of our standard on-premise software products are
typically delivered by providing the customer with access to
download the software, and the license period starts upon
such grant of access. We recognize revenue for such on
premise licenses at the point in time when the customer has
access to and thus control over the software. In judging that
our on-premise software offerings grant the customers a
right to use rather than a right to access our intellectual
property, we have considered the usefulness of our software
without subsequent updates.
– Our customer-specific on-premise-software development
agreements typically
Are for software developed for specific needs of individual
customers and thus the developed software does not have
an alternative use to us, and
Provide us with an enforceable right to payment for
performance completed to date
For such development agreements, we recognize revenue
over time as the software development progresses.
Judgment is required in identifying an appropriate method to
measure the progress towards complete satisfaction of such
performance obligations. We typically measure progress of
our development agreements based on the direct costs
incurred to date in developing the software as a percentage
of the total reasonably estimated direct costs to fully
complete the development work. This method of measuring
progress faithfully depicts the transfer of the development
services to the customer, as substantially all of these costs
are cost of the staff or third parties performing the
development work. In estimating the total cost to fully
complete the development work, we consider our history with
similar projects.
Support revenue is typically recognized based on time elapsed
and thus ratably over the term of the support arrangement.
Under our standardized support services, our performance
obligation is to stand ready to provide technical product support
and unspecified updates, upgrades, and enhancements on a
when-and-if-available basis. Our customers simultaneously
receive and consume the benefits of these support services as
we perform.
Half-Year Report January – June 2018 29
Service revenue is typically recognized over time. Where we
stand ready to provide the service (such as access to learning
content), we recognize revenue based on time elapsed and thus
ratably over the service period. Consumption-based services
(such as separately identifiable consulting services and
premium support services, messaging services, and class room
training services) are recognized over time when the services
are utilized, typically based on a percentage of completion-
based method or ratably. When using the percentage-of-
completion method, we typically measure the progress towards
complete satisfaction in the same way and with the same
reasoning and judgment as we do for customer-specific on-
premise-software development agreements. We apply judgment
in determining whether a service qualifies as a stand-ready
service or as a consumption-based service.
Revenue for combined performance obligations is recognized
over the longest period of all promises in the combined
performance obligation.
Judgement is also required to determine whether revenue is to
be recognized at a point in time or over time. For performance
obligations satisfied over time, we need to measure the progress
using the method that best reflects SAP’s performance. When
using cost incurred as a measure of progress for recognizing
revenue over time, we apply judgement in estimating the total
cost to satisfy the performance obligation.
All of the above mentioned judgments and estimates can
significantly impact the timing and amount of revenue to be
recognized.
Contract Balances
We recognize receivables for performance obligations satisfied
over time gradually as the performance obligation is satisfied
and in full once the invoice is due. Judgement is required in
determining whether a right to consideration is unconditional
and thus qualifies as a receivable. Contract liabilities primarily
reflect invoices due or payments received in advance of revenue
recognition. They are recognized as revenue upon transfer of
control to the customers of the promised goods and services.
Typically, we invoice fees for on-premise standard software
upon contract closure and software delivery. Periodic fixed fees
for cloud subscription services, software support services, and
other multi-period agreements are typically invoiced yearly or
quarterly in advance. Such fee prepayments account for the
majority of our contract liability balance. Fees based on actual
transaction volumes for cloud subscriptions and fees charged
for non-periodical services are invoiced as the services are
delivered. While payment terms and conditions vary by contract
1 “Impact of the policy change” means the difference between a measure determined under SAP’s new IFRS 15-based policies and the respective measure as it would stand had our previous accounting policies continued to apply.
type and region, our terms typically include a requirement of
payment within 30 to 60 days.
Incremental Costs of Obtaining Customer Contracts
The assets we recognize for the incremental costs of obtaining a
customer contract primarily consist of sales commissions
earned by our sales force. Typically, we either do not pay sales
commissions for customer contract renewals or such
commissions are not commensurate with the commissions paid
for new contracts. Consequently, we amortize sales
commissions paid for new contracts on a straight-line basis over
the expected contract life including probable contract renewals.
Judgement is required in estimating the contract lives. In this
judgement, we consider our respective renewal history adjusted
for indications that the renewal history is not fully indicative for
future renewals. The amortization periods range from two to
eight years depending on the type of the offering. Amortization
of capitalized costs of obtaining customer contracts is included
in sales and marketing expense.
We expense incremental costs of obtaining a customer contract
as incurred if we expect an amortization period of one year or
less.
Costs to Fulfill Customer Contracts
Capitalized costs incurred to fulfill customer contracts mainly
consist of direct costs for customer-specific cloud development
contracts that are not in scope of other IFRSs. These costs are
amortized after completion of the development on a straight-
line basis over the expected life of the cloud subscription
contract including expected renewals. Judgment is required in
evaluating whether costs are direct or indirect and in estimating
the contract lives. Based on our respective history, the
amortization period is typically six years.
Amortization of capitalized costs to fulfill customer-specific
developed cloud applications and extensions contracts is
included in cost of cloud subscription and support.
Adoption of IFRS 15
Under the IFRS 15 adoption method chosen by SAP, prior years
(including the prior-period numbers presented in the primary
financial statements in this half-year report) are not restated to
conform to the new policies.
The impact of the policy change1 in the first half of 2018 was as
follows:
– Software licenses and support revenues experienced a
benefit of €23 million, with most of the difference resulting
from exercises of customer software purchase options
granted in prior years which result in software revenue.
Half-Year Report January – June 2018 30
– Operating expenses benefitted, in cost of sales and
marketing, in the amount of €83 million from higher
capitalization of sales commissions net of higher
amortization of amounts capitalized.
– The abovementioned effects together with other insignificant
effects resulted in a net positive impact on operating profit of
approximately €98 million.
– As at June 30, 2018, balance sheet items are affected by the
application of IFRS 15 as compared to our pre-IFRS 15
accounting policies as follows:
Non-current and current other non-financial assets were
higher by €203 million and €40 million, respectively
(January 1, 2018: higher by €132 million and €26 million,
respectively) due to the higher capitalization of sales
commissions.
Trade and other receivables and contract liabilities were
lower by €768 million and €684 million, respectively
(January 1, 2018: higher by €560 million and €648 million,
respectively), resulting from changes in the timing of and
amounts recognized as contract balances.
Provisions were lower by €17 million (January 1, 2018:
lower by €25 million), reflecting lower provisions for
onerous customer contracts.
Intangible Assets were higher by €22 million (January 1,
2018: higher by €14 million), due to capitalization of costs
for certain customer-specific on-premise software
development arrangements.
Please also refer to Note (3e) of our Integrated Report 2017 for
further qualitative explanations of the changes in accounting
policies as a result of the adoption of IFRS 15.
IFRS 9 ‘Financial Instruments’
Policies and Judgment
Trade Receivables and Contract Assets
We apply the simplified impairment approach using a provision
matrix for all trade receivables and contract assets to take into
account any lifetime expected credit losses already at initial
recognition. For the purpose of the provision matrix, customers
are clustered into different risk classes, mainly based on market
information such as the country risk assessment of their
country of origin. Determining our expected credit loss
allowance involves significant judgement. In this judgement, we
primarily consider our historical experience with credit losses in
the respective provision matrix risk class and current data on
overdue receivables. Based on our analyses, historical default
rates generally represent a reasonable approximation for future
expected defaults. Besides historical data, our judgement
considers reasonable and supportable forward-looking
information (for example, changes in country risk ratings, or
fluctuations in credit default swaps of countries of customers we
do business with) for the development of the provision matrix.
Outstanding receivables are continuously monitored locally to
assess whether there is objective evidence that our trade
receivables and contract assets are credit-impaired. Evidence
that trade receivables and contract assets are credit-impaired
include among others information about significant financial
difficulty of the customer or non-adherence to a payment plan.
In our Consolidated Income Statements, expenses from
expected credit loss allowances from applying the provision
matrix as well as from credit-impaired customer balances are
included in other operating income/expense, net.
Account balances are written off either partially or in full if we
judge that the likelihood of recovery is remote, which might be
evidenced, for example, when bankruptcy proceedings for a
customer are finalized or when all enforcement efforts have
been exhausted.
Financial Assets
Our financial assets comprise non-derivative financial assets
such as cash and cash equivalents (highly liquid investments
with original maturities of three months or less), loans and
receivables, acquired equity and debt investments, and
derivative financial instruments (derivatives) with positive fair
values.
As we do not designate financial assets as “at fair value through
profit or loss”, we generally classify financial assets into the
following categories: “at amortized cost (AC)”, “at fair value
through other comprehensive income (FVOCI)”, and “at fair
value through profit or loss (FVPL)”, depending on the
contractual cash flows of and our business model for holding the
respective asset.
Financial assets having cash flow characteristics other than
solely principal and interest such as derivatives not held within a
hedging relationship, embedded derivatives if the host is not a
financial asset, money-market and similar funds as well as
equity investments are generally classified as FVPL, except for
equity investments for which we take an investment-by-
investment decision whether to classify as FVPL or FVOCI.
Generally, all other financial assets with cash flows solely
consisting of principal and interest are classified as AC because
we follow a conservative investment approach, safeguarding our
liquidity by ensuring the safety of principal investment amounts.
For these financial assets, we apply considerable judgement by
employing the general impairment approach as follows:
– For bank balances and debt investments such as time
deposits or commercial paper, we apply the low credit risk
exception as it is our policy to only invest in high-quality
assets of issuers with a minimum rating of at least
investment grade to minimize the risk of credit losses. Thus,
these assets are always allocated to stage 1 of the three-
stage credit loss model and we record a loss allowance at an
Half-Year Report January – June 2018 31
amount equal to 12-month expected credit losses. This loss
allowance is calculated based on our exposure at the
respective reporting date, the loss given default for this
exposure, and the maturity-adjusted credit default swap
spread as a measure for the probability of default. Even
though we only invest in assets with at least investment-
grade rating, we also closely observe the development of
credit default swap spreads as a measure of market
participants’ assessments of the creditworthiness of a
debtor, to evaluate probable significant increases in credit
risk to timely react to changes should these manifest.
Among other, we consider bank balances and debt
investments to be in default when there is information about
a counterparty’s financial difficulties or in case of a drastic
increase of credit default swap spread of a counterparty for
a prolonged time period while the overall market
environment remains rather stable. Such financial assets are
written off either partially or in full if the likelihood of
recovery is considered remote, which might be evidenced,
for example, by the bankruptcy of a counterparty of such
financial assets.
– Loans and other financial receivables are monitored based
on borrower-specific internal and external information to
decide whether there has been a significant increase in
credit risk since initial recognition. We consider such assets
to be in default if they are significantly beyond their past due
date or when the borrower is unlikely to pay its obligation. A
write off occurs when the likelihood of recovery is considered
remote, for example when bankruptcy proceedings are
finalized or when all enforcement efforts have been
exhausted.
Financial Liabilities
Financial liabilities include trade and other payables, bank loans,
issued bonds, private placements, other financial liabilities,
derivatives, and embedded derivatives. Included in other
financial liabilities are customer funding liabilities which are
funds we draw from and make payments on behalf of our
customers for customers’ employee expense reimbursements,
related credit card payments, and vendor payments. We present
these funds in cash and cash equivalents and record our
obligation to make these expense reimbursements and
payments on behalf of our customers as customer funding
liabilities.
As we do not designate financial liabilities as FVPL, we generally
classify financial liabilities into the following categories: AC and
FVPL in line with IFRS 9.
Expenses and gains/losses on financial liabilities mainly consist
of interest expense, which is recognized based on the effective
interest method.
Hedge Accounting
We use derivatives to hedge foreign currency risk or interest
rate risk and designate them as cash flow or fair value hedges if
they qualify for hedge accounting under IFRS 9 which involves
judgement.
a) Cash Flow Hedge
In general, we apply cash flow hedge accounting to the foreign
currency risk of highly probable forecasted transactions and
interest rate risk on variable rate financial liabilities. With regard
to foreign currency risk, hedge accounting relates to the spot
price and the intrinsic values of the derivatives designated and
qualifying as cash flow hedges. Accordingly, the effective portion
of these components determined on a present value basis is
recorded in other comprehensive income. The forward and time
element as well as foreign currency basis spreads excluded from
the hedging relationship are recorded as cost of hedging in other
comprehensive income. All other components of the derivative
and the ineffective portion are immediately recognized in profit
and loss. Amounts accumulated in other comprehensive income
are reclassified to profit and loss in the same period when the
hedged item affects profit and loss.
b) Fair Value Hedge
We apply fair value hedge accounting for certain of our fixed rate
financial liabilities.
c) Valuation and Testing of Effectiveness
At inception of a designated hedge relationship, we document
our risk management strategy and the economic relationship
between the hedged item and hedging instrument.
The effectiveness of the hedging relationship is tested by
applying the critical terms match for our foreign currency
hedges, as currencies, maturities, and the amounts are largely
identical for the forecasted transactions and the spot element of
the forward exchange rate contract or intrinsic value of the
currency options, respectively. For interest rate swaps,
effectiveness is tested using statistical methods in the form of a
regression analysis, by which the validity and extent of the
relationship between the change in value of the hedged items as
the independent variable and the fair value change of the
derivatives as the dependent variable is determined.
Adoption of IFRS 9
As of January 1, 2018, SAP changed several of its accounting
policies to adopt IFRS 9 ‘Financial Instruments’. Under the IFRS
9 adoption method chosen by SAP, prior years are not restated
to conform to the new policies.
The main impact of the policy change as of January 1, 2018, was
as follows:
Half-Year Report January – June 2018 32
– Classification as FVPL of money-market and similar funds of
€1.1 billion
– Classification as FVPL of equity investments of €827 million
– Classification as AC of debt investments of €39 million
These policy changes resulted in the following main impacts on
retained earnings as of January 1, 2018:
– Trade receivables and opening retained earnings are lower by
€25 million, resulting from the application of the expected
credit loss model.
– Other comprehensive income is lower and retained earnings
higher by €157 million, resulting from the reclassification of
amounts attributable to available-for-sale financial assets
accumulated in other comprehensive income so far to
opening retained earnings.
(3b) New Accounting Standards Not Yet
Adopted
In the Notes to our Consolidated Financial Statements for 2017,
we disclosed, for new accounting standards that have been
issued but not yet been adopted by us, our expectations
regarding the timing of and our approaches to adopt these
standards and known or reasonably estimable information on
the possible impact that the adoption will have on our financial
statements. The following provides updates to these disclosures
and should be read in conjunction with these disclosures:
– On January 13, 2016, the IASB issued IFRS 16 ‘Leases’. We
will adopt IFRS 16 as per its effective date of January 1, 2019,
using the modified retrospective approach. Under this
approach, the cumulative effect of initially applying the
standard will be recognized as an adjustment to the opening
balance of retained earnings on the date of initial application.
The new standard will significantly impact especially the lease
accounting by lessees as, in general, all leases need to be
recognized on a company’s balance sheet (represented by
right-of-use assets and lease liabilities). We plan to use
practical expedients offered by the standard (such as short-
term leases, low-value leases, and no separation of non-lease
components of a contract).
– We are in the process of developing our future IFRS 16
policies and adjusting the relevant business processes to
adopt these new policies. We have established a project
across SAP’s finance and business functions. This project
covers the implementation of a new SAP-based lease
accounting and reporting solution as well as the development
of new lease accounting policies. In addition to this, we have
established a global roll-out and training approach for the
relevant stakeholders within the organization.
– Due to the adoption of IFRS 16, we expect the total assets and
total liabilities to increase, as right-of-use assets/lease
liabilities will have to be recorded for those items that were
previously “off balance sheet”; operating profit is also
expected to increase, as a portion of the costs that were
treated as rental expenses in the past will have to be
presented as interest expense going forward. As the effects
of applying IFRS 16 will depend on the lease agreements in
effect at the time of adoption, the impact of IFRS 16 on our
Consolidated Financial Statements cannot be estimated
reliably.
(3c) Foreign Currencies
We apply hyperinflation accounting for our subsidiary in
Venezuela, by restating the financial statements of this
subsidiary for the current period to account for changes in the
general purchasing power of the local currency based on
relevant price indices at the reporting date. Most significantly
impacted by this accounting are other non-operating
income/expense (loss of €51 million), equity (retained earnings
and other comprehensive income) (decrease of €26 million),
and contract liabilities (increase of €70 million). The impact on
our revenues and operating profit is immaterial.
(4) Business Combinations
In the first half of 2018, we concluded several business
combinations, with the Callidus Software Inc. (“Callidus”)
acquisition being the only material transaction.
We acquire businesses in specific areas of strategic interest to
us, particularly to broaden our product and service portfolio.
The initial accounting for all of our business combinations in the
first half of 2018 is incomplete because we are still obtaining the
information necessary to identify and measure, for example,
intangibles and tax-related assets and liabilities of the acquired
businesses. Accordingly, the amounts recognized in our
financial statements for these items are regarded as provisional
as of June 30, 2018.
The acquisition-related costs incurred for our business
combinations in the first half of 2018 were recognized in general
and administration expense.
Prior-year acquisitions are described in the Consolidated
Financial Statements in the Integrated Report 2017.
Acquisition of Callidus
We announced on January 30, 2018, that SAP and Callidus
(NSDQ: CALD), a leading provider of customer relationship
management (CRM) solutions, had entered into an agreement
under which SAP would acquire Callidus.
On April 5, 2018, following satisfaction of applicable regulatory
and other approvals, we acquired 100% of the shares of
Callidus. SAP paid US$36 per share, representing consideration
transferred in cash of approximately US$2.4 billion.
Half-Year Report January – June 2018 33
Financial Impact as of the Acquisition Date € millions Callidus
Consideration Transferred
Cash paid 1,957
Liabilities incurred 47
Total consideration transferred 2,004
The liabilities incurred relate to the earned portion of unvested
share-based payment awards. These liabilities were incurred by
replacing, upon acquisition, equity-settled share-based payment
awards held by employees of Callidus with cash-settled share-
based payment awards, which are subject to forfeiture. The
respective liabilities represent the portion of the replacement
awards that relates to pre-acquisition services provided by the
acquiree’s employees and were measured at the fair value
determined under IFRS 2 as required by IFRS 3.
The following table summarizes the preliminary values of
identifiable assets acquired and liabilities assumed in
connection with the acquisition of Callidus, as of the acquisition
date.
Recognized Amounts of Identifiable Assets Acquired and Liabilities Assumed
€ millions Callidus Contribution
Cash and cash equivalents 63
Other financial assets 64
Trade and other receivables 32
Other non-financial assets 12
Property, plant, and equipment 26
Intangible assets 515
Thereof acquired technology 122
Thereof customer relationship and other intangibles 391
Thereof software and database licenses 4
Total identifiable assets 712
Trade and other payables 55
Current and deferred tax liabilities 50
Provisions and other non-financial liabilities 14
Contract liabilities/deferred income 56
Total identifiable liabilities 175
Total identifiable net assets 537
Goodwill 1,467
Total consideration transferred 2,004
In general, the goodwill arising from the acquisitions consists
largely of the synergies and the know-how and technical skills of
the acquired businesses’ workforces.
Callidus goodwill is attributed to expected synergies from the
acquisition, particularly in the following areas:
– Cross-selling opportunities to existing SAP customers across
all regions, using SAP’s sales organization
– Combining Callidus products and SAP products to
strengthen SAP’s intelligent customer experience suite of
solutions
– Improved profitability in Callidus sales and operations
We intend to allocate the Callidus goodwill and intangibles to the
newly established Customer Experience segment; additionally,
we are in the process of completing the identification of the
portion of goodwill previously assigned to the Applications,
Technology & Services segment that is to be re-allocated to this
new segment.
For more information about our segments and about the
changes in our segment structure, see Note (14).
Impact of the Business Combination on Our
Financial Statements
The amounts of revenue and profit or loss of the Callidus
business acquired in 2018 since the acquisition date included in
the consolidated income statements for the reporting period are
as follows:
Impact on SAP’s Financials
€ millions Q1–Q2 2018 as
Reported
Contribution of Callidus
Revenue 11,260 53
Profit after tax 1,428 –21
Had Callidus been consolidated as of January 1, 2018, our
estimated pro forma revenue for the reporting period would
have been €11,307 million, and pro forma profit after tax would
have been €1,404 million.
These amounts were calculated after applying the Company’s
accounting policies and after adjusting the results for Callidus to
reflect significant effects from, for example:
– Additional depreciation and amortization that would have
been charged assuming the fair value adjustment to
property, plant, and equipment, and to intangible assets had
been applied from January 1, 2018
– The impact of fair value adjustments on deferred revenue on
a cumulative basis
– The borrowing costs on the funding levels and debt/equity
position of the Company after the business combination
– Employee benefits, such as share-based compensation
– Transaction expenses incurred as part of the acquisition
– Related tax effects
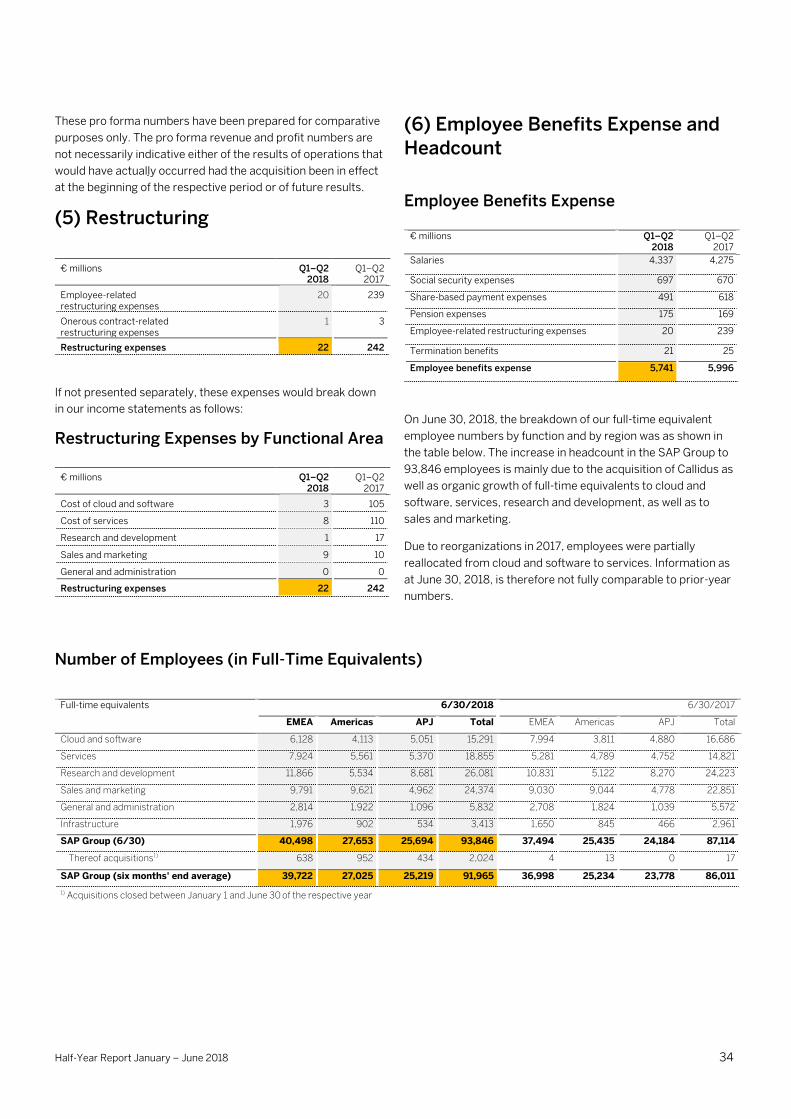
Half-Year Report January – June 2018 34
These pro forma numbers have been prepared for comparative
purposes only. The pro forma revenue and profit numbers are
not necessarily indicative either of the results of operations that
would have actually occurred had the acquisition been in effect
at the beginning of the respective period or of future results.
(5) Restructuring
€ millions Q1–Q2
2018 Q1–Q2
2017
Employee-related restructuring expenses
20 239
Onerous contract-related restructuring expenses
1 3
Restructuring expenses 22 242
If not presented separately, these expenses would break down
in our income statements as follows:
Restructuring Expenses by Functional Area
€ millions Q1–Q2 2018
Q1–Q2 2017
Cost of cloud and software 3 105
Cost of services 8 110
Research and development 1 17
Sales and marketing 9 10
General and administration 0 0
Restructuring expenses 22 242
(6) Employee Benefits Expense and
Headcount
Employee Benefits Expense
€ millions Q1–Q2
2018 Q1–Q2
2017
Salaries 4,337 4,275
Social security expenses 697 670
Share-based payment expenses 491 618
Pension expenses 175 169
Employee-related restructuring expenses 20 239
Termination benefits 21 25
Employee benefits expense 5,741 5,996
On June 30, 2018, the breakdown of our full-time equivalent
employee numbers by function and by region was as shown in
the table below. The increase in headcount in the SAP Group to
93,846 employees is mainly due to the acquisition of Callidus as
well as organic growth of full-time equivalents to cloud and
software, services, research and development, as well as to
sales and marketing.
Due to reorganizations in 2017, employees were partially
reallocated from cloud and software to services. Information as
at June 30, 2018, is therefore not fully comparable to prior-year
numbers.
Number of Employees (in Full-Time Equivalents)
Full-time equivalents 6/30/2018 6/30/2017
EMEA Americas APJ Total EMEA Americas APJ Total
Cloud and software 6,128 4,113 5,051 15,291 7,994 3,811 4,880 16,686
Services 7,924 5,561 5,370 18,855 5,281 4,789 4,752 14,821
Research and development 11,866 5,534 8,681 26,081 10,831 5,122 8,270 24,223
Sales and marketing 9,791 9,621 4,962 24,374 9,030 9,044 4,778 22,851
General and administration 2,814 1,922 1,096 5,832 2,708 1,824 1,039 5,572
Infrastructure 1,976 902 534 3,413 1,650 845 466 2,961
SAP Group (6/30) 40,498 27,653 25,694 93,846 37,494 25,435 24,184 87,114
Thereof acquisitions1) 638 952 434 2,024 4 13 0 17
SAP Group (six months' end average) 39,722 27,025 25,219 91,965 36,998 25,234 23,778 86,011
1) Acquisitions closed between January 1 and June 30 of the respective year
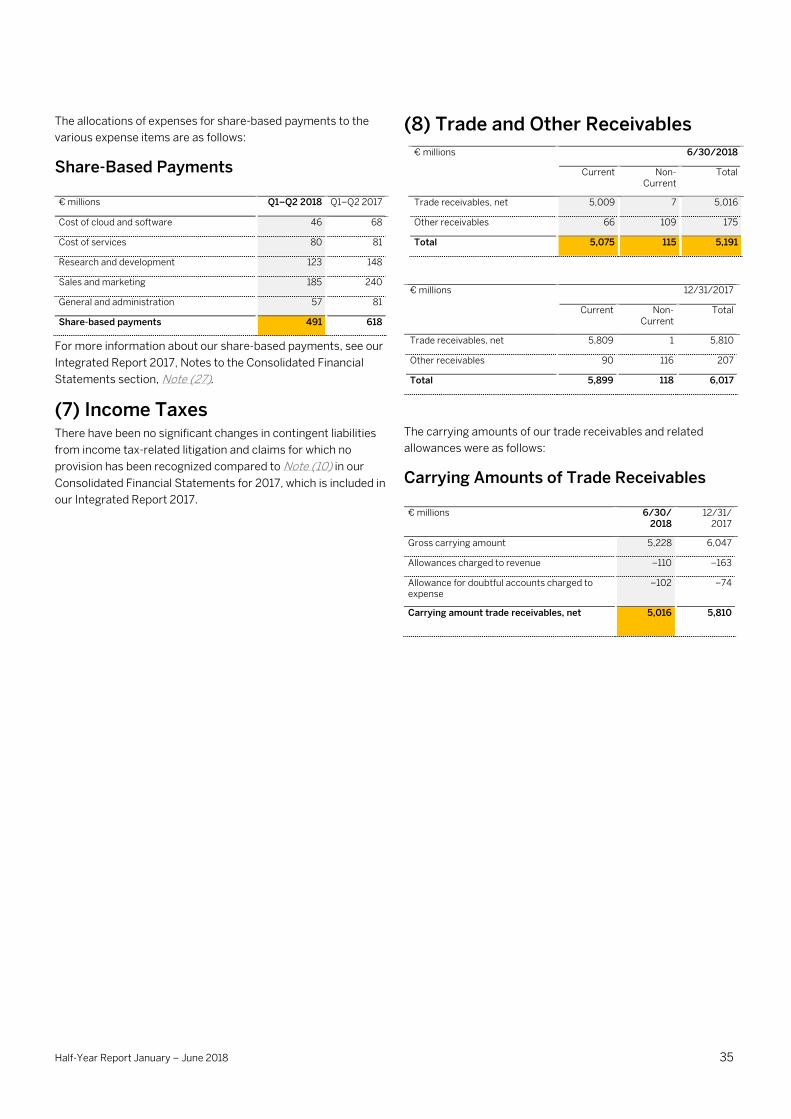
Half-Year Report January – June 2018 35
The allocations of expenses for share-based payments to the
various expense items are as follows:
Share-Based Payments
€ millions Q1–Q2 2018 Q1–Q2 2017
Cost of cloud and software 46 68
Cost of services 80 81
Research and development 123 148
Sales and marketing 185 240
General and administration 57 81
Share-based payments 491 618
For more information about our share-based payments, see our
Integrated Report 2017, Notes to the Consolidated Financial
Statements section, Note (27).
(7) Income Taxes There have been no significant changes in contingent liabilities
from income tax-related litigation and claims for which no
provision has been recognized compared to Note (10) in our
Consolidated Financial Statements for 2017, which is included in
our Integrated Report 2017.
(8) Trade and Other Receivables
€ millions 6/30/2018
Current Non-Current
Total
Trade receivables, net 5,009 7 5,016
Other receivables 66 109 175
Total 5,075 115 5,191
€ millions 12/31/2017
Current Non-Current
Total
Trade receivables, net 5,809 1 5,810
Other receivables 90 116 207
Total 5,899 118 6,017
The carrying amounts of our trade receivables and related
allowances were as follows:
Carrying Amounts of Trade Receivables
€ millions 6/30/
2018 12/31/
2017
Gross carrying amount 5,228 6,047
Allowances charged to revenue –110 –163
Allowance for doubtful accounts charged to expense
–102 –74
Carrying amount trade receivables, net 5,016 5,810
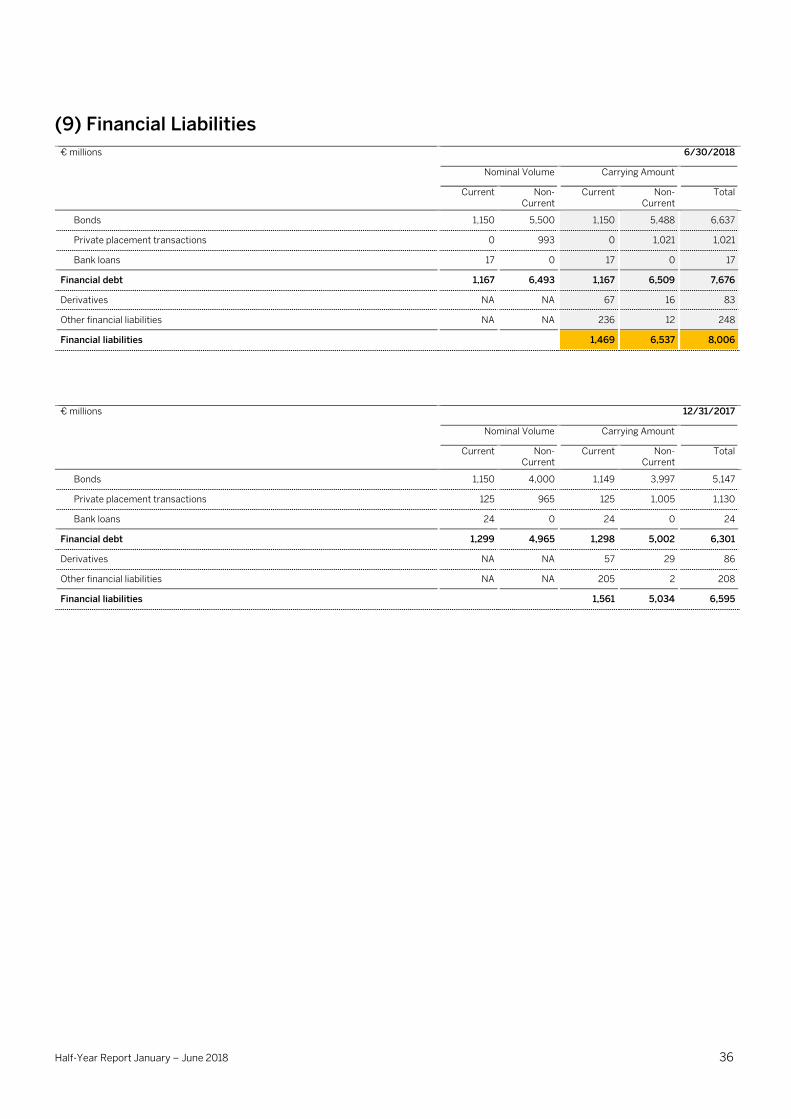
Half-Year Report January – June 2018 36
(9) Financial Liabilities
€ millions 6/30/2018
Nominal Volume Carrying Amount
Current Non-Current
Current Non-Current
Total
Bonds 1,150 5,500 1,150 5,488 6,637
Private placement transactions 0 993 0 1,021 1,021
Bank loans 17 0 17 0 17
Financial debt 1,167 6,493 1,167 6,509 7,676
Derivatives NA NA 67 16 83
Other financial liabilities NA NA 236 12 248
Financial liabilities 1,469 6,537 8,006
€ millions 12/31/2017
Nominal Volume Carrying Amount
Current Non-Current
Current Non-Current
Total
Bonds 1,150 4,000 1,149 3,997 5,147
Private placement transactions 125 965 125 1,005 1,130
Bank loans 24 0 24 0 24
Financial debt 1,299 4,965 1,298 5,002 6,301
Derivatives NA NA 57 29 86
Other financial liabilities NA NA 205 2 208
Financial liabilities 1,561 5,034 6,595
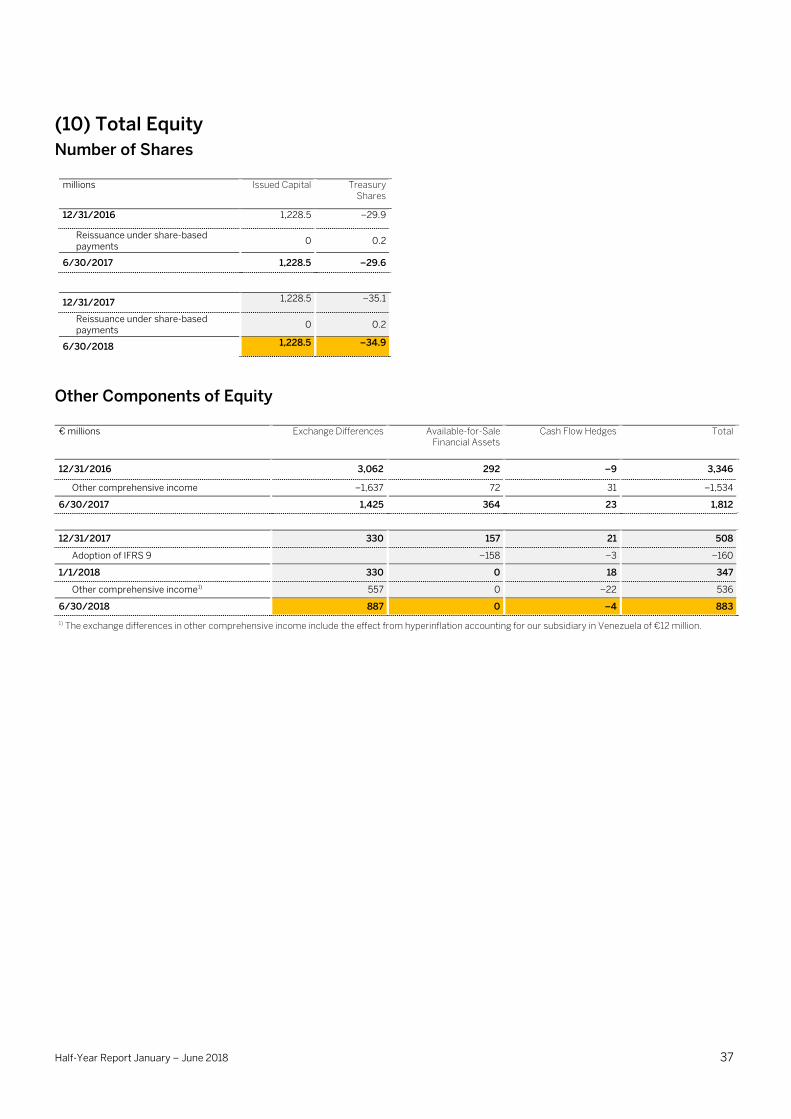
Half-Year Report January – June 2018 37
(10) Total Equity
Number of Shares
millions Issued Capital Treasury
Shares
12/31/2016 1,228.5 –29.9
Reissuance under share-based payments
0 0.2
6/30/2017 1,228.5 –29.6
12/31/2017 1,228.5 –35.1
Reissuance under share-based payments
0 0.2
6/30/2018 1,228.5 –34.9
Other Components of Equity
€ millions Exchange Differences Available-for-Sale
Financial Assets Cash Flow Hedges Total
12/31/2016 3,062 292 –9 3,346
Other comprehensive income –1,637 72 31 –1,534
6/30/2017 1,425 364 23 1,812
12/31/2017 330 157 21 508
Adoption of IFRS 9 –158 –3 –160
1/1/2018 330 0 18 347
Other comprehensive income1) 557 0 –22 536
6/30/2018 887 0 –4 883
1) The exchange differences in other comprehensive income include the effect from hyperinflation accounting for our subsidiary in Venezuela of €12 million.
Half-Year Report January – June 2018 38
(11) Litigation, Claims, and Legal
Contingencies We are subject to a variety of claims and lawsuits that arise from
time to time in the ordinary course of our business, including
proceedings and claims that relate to companies we have
acquired, claims that relate to customers demanding
indemnification for proceedings initiated against them based on
their use of SAP software, and claims that relate to customers
being dissatisfied with the products and services that we have
delivered to them. We will continue to vigorously defend against
all claims and lawsuits against us. We currently believe that
resolving the claims and lawsuits pending as of June 30, 2018,
will neither individually nor in the aggregate have a material
adverse effect on our business, financial position, profit, or cash
flows. Consequently, the provisions recorded for these claims
and lawsuits as of June 30, 2018, are neither individually nor in
the aggregate material to SAP.
However, the outcome of litigation and claims is intrinsically
subject to considerable uncertainty. Management’s view of the
litigation may also change in the future. Actual outcomes of
litigation and claims may differ from the assessments made by
management in prior periods, which could result in a material
impact on our business, financial position, profit, cash flows, or
reputation. Most of the lawsuits and claims are of a very
individual nature and claims are either not quantified by the
claimants or claim amounts quantified are, based on historical
evidence, not expected to be a good proxy for the expenditure
that would be required to settle the case concerned. The
specifics of the jurisdictions where most of the claims are
located further impair the predictability of the outcome of the
cases. Therefore, it is not practicable to reliably estimate the
financial effect that these lawsuits and claims would have if SAP
were to incur expenditure for these cases.
Among the claims and lawsuits are the following classes (please
refer to our Integrated Report 2017, Notes to the Consolidated
Financial Statements section, Note (18b) for further detail on
these classes).
Intellectual Property-Related Litigation and
Claims
There have been no significant changes to the amount of
provisions recorded for intellectual property-related litigation
and claims compared to the amounts disclosed in our Integrated
Report 2017, Notes to the Consolidated Financial Statements
section, Note (18b). There have also been no significant changes
in contingent liabilities from intellectual property-related
litigation and claims for which no provision has been recognized.
For the individual cases of intellectual property-related litigation
and claims disclosed in our Integrated Report 2017, there is no
significant development.
Customer-Related Litigation and Claims
There have been no significant changes to the amount of
provisions recorded for customer-related litigation and claims
compared to the amounts disclosed in our Integrated Report
2017, Notes to the Consolidated Financial Statements section,
Note (18b). There have also been no significant changes in
contingent liabilities from customer-related litigation and claims
for which no provision has been recognized.
Tax-Related Litigation and Claims
There have been no significant changes in contingent liabilities
from non-income tax-related litigation and claims for which no
provision has been recognized compared to Note (23) in our
Consolidated Financial Statements for 2017, which is included in
our Integrated Report 2017.
For information about income tax-related litigation, see Note (7).
Legal Contingencies
In 2017, SAP received communications alleging conduct that
may violate anti-bribery laws (including the U.S. Foreign Corrupt
Practices Act (FCPA)). Further, we voluntarily self-disclosed
potential export controls and economic sanctions violations. The
investigations are ongoing and neither the outcome of the
investigations nor the date when substantiated findings will be
available is predictable at this point in time. SAP enhanced its
anti-corruption compliance program as well as its export control
compliance program throughout the last months. We continue
to be fully committed to anti-bribery laws and export restriction
controls and will continue full cooperation with all parties
involved.
As at June 30, 2018, no provisions have been recognized for
these potential violations in our consolidated financial
statements. It is currently also not practicable to estimate the
financial effect of any contingent liabilities that may result from
these potential violations.
For a detailed description, please refer to our Integrated Report
2017, Notes to the Consolidated Financial Statements section,
Note (23).
Half-Year Report January – June 2018 39
(12) Other Financial Instruments A detailed overview of our other financial instruments, financial
risk factors, the management of financial risks, and the
determination of fair value as well as the classification of our
other financial instruments into the fair value hierarchy of IFRS
13 are presented in Notes (24) to (26) to our Consolidated
Financial Statements for 2017, which are included in our
Integrated Report 2017.
We do not disclose the fair value of our financial instruments as
of June 30, 2018, for the following reasons:
– For a large number of our financial instruments, their
carrying amounts are a reasonable approximation of their
fair values, and
– For those financial instruments where the carrying amount
differs from fair value, there was no material change in the
relation between carrying amount and fair value since
December 31, 2017.
The implementation of IFRS 9 led to the following main changes
in the classification of financial assets in the first half year 2018
compared to December 31, 2017:
– Change in classification of money-market and similar funds
from amortized cost to FVPL (€1.0 billion)
– Change in classification of equity investments from
available-for-sale to FVPL (€1.0 million)
– Change in classification of debt investments from available-
for-sale to AC (€130 million)
However, these classification changes did not have a material
impact on the relation between carrying amounts and fair values
since December 31, 2017.
Transfers between levels of the fair value
hierarchy
During the first half year 2018, we transferred equity
investments from Level 3 to Level 2 in the amount of €12 million
(December 31, 2017: €100 million) due to initial public offerings
of the respective investee. Transfers of equity investments from
Level 2 to Level 1, which occurred because disposal restrictions
lapsed and deducting a discount for such restriction was no
longer necessary, were €9 million in the first half year 2018
(December 31, 2017: €360 million).
(13) Share-Based Payments For a detailed description of our share-based payment plans,
see Note (27) to our Consolidated Financial Statements for
2017, included in our Integrated Report 2017.
Restricted Stock Unit Plan Including Move
SAP Plan (RSU Plan)
In the first half of 2018, we granted 7.8 million (first half of 2017:
7.3 million) share units to retain and motivate global executives
and employees who make a significant sustained impact to our
business success.
Own SAP Plan (Own)
The number of shares purchased by our employees under this
plan was 2.6 million in the first half of 2018 (first half of 2017:
2.9 million). The plan enables employees to purchase shares
with preferred conditions and build value by becoming an SAP
shareholder.
Half-Year Report January – June 2018 40
(14) Segment and Geographic
Information
General Information
SAP has four operating segments that are regularly reviewed by
our Executive Board, which is responsible for assessing the
performance of our Company and for making resource
allocation decisions as our Chief Operating Decision Maker
(CODM). The operating segments are largely organized and
managed separately according to their product and service
offerings, notably whether the products and services relate to
our business network activities, our customer experience
solutions, or messaging services, or cover other areas of our
business.
The Applications, Technology & Services segment derives its
revenues primarily from the sale of software licenses,
subscriptions to cloud applications, and related services (mainly
support services and various professional services and premium
support services, as well as implementation services for our
software products and education services on the use of our
products).
The SAP Business Network segment derives its revenues mainly
from transaction fees charged for the use of SAP’s cloud-based
collaborative business networks and from services relating to
the SAP Business Network (including cloud applications,
professional services, and education services). Within the SAP
Business Network segment, we mainly market and sell the cloud
offerings developed by SAP Ariba, SAP Fieldglass, and SAP
Concur.
On April 5, 2018, we acquired Callidus Software Inc. and
changed the structure of the Applications, Technology &
Services segment. The Callidus business was combined with our
existing customer experience activities into a new business unit
called ‘SAP Customer Experience’. This new unit, which qualifies
as an operating segment (called ‘Customer Experience’),
comprises on premise and cloud-based products that run front
office functions across the customer experience. Support
revenues related to our on premise customer experience
solutions continue to be reported in the Applications,
Technology & Services segment since we cannot split the total
software support revenues into support services provided for
different solutions.
Further, the manner in which our mobile interconnection
activities ‘Digital Interconnect’ are reported to our CODM has
changed such that Digital Interconnect now qualifies as an
operating segment. Due to its size, ‘Digital Interconnect’ does
not qualify as a reportable segment.
We have retrospectively adjusted our revenue and results for the
Applications, Technology & Services segment to reflect these
changes. Revenues and expenses of our operating but non-
reportable segment are included in the reconciliation of segment
revenue and results.
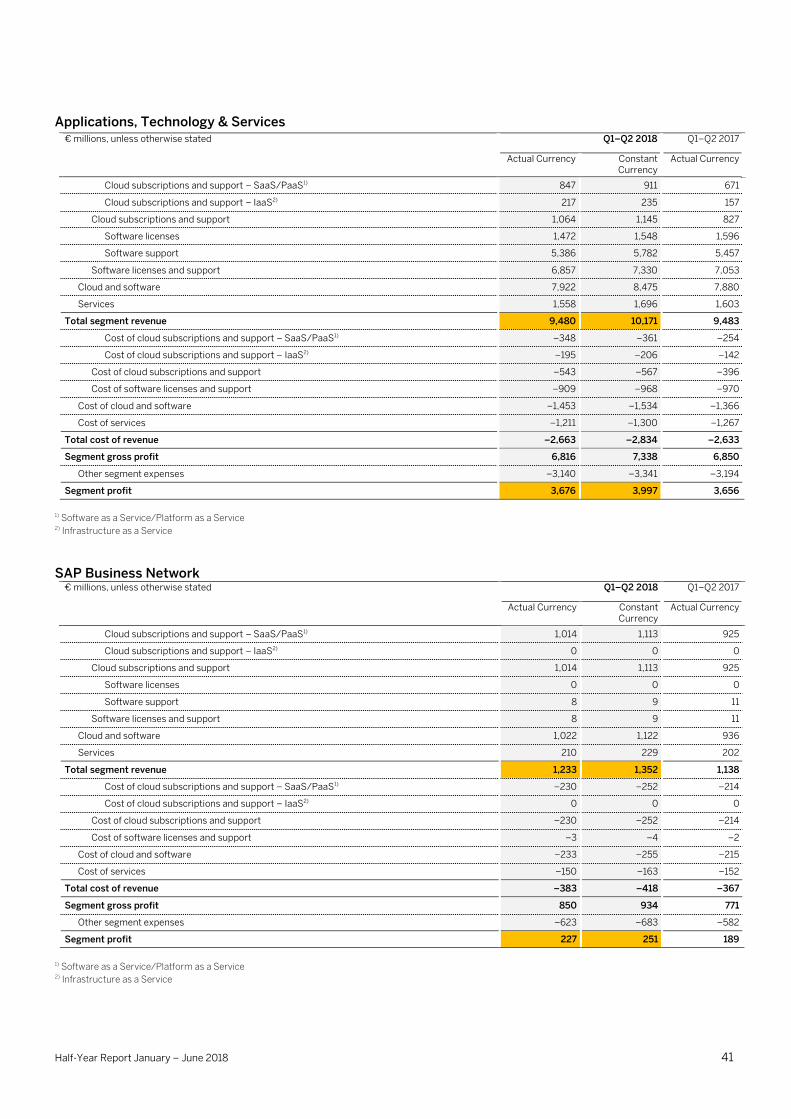
Half-Year Report January – June 2018 41
Applications, Technology & Services € millions, unless otherwise stated Q1–Q2 2018 Q1–Q2 2017
Actual Currency Constant Currency
Actual Currency
Cloud subscriptions and support – SaaS/PaaS1) 847 911 671
Cloud subscriptions and support – IaaS2) 217 235 157
Cloud subscriptions and support 1,064 1,145 827
Software licenses 1,472 1,548 1,596
Software support 5,386 5,782 5,457
Software licenses and support 6,857 7,330 7,053
Cloud and software 7,922 8,475 7,880
Services 1,558 1,696 1,603
Total segment revenue 9,480 10,171 9,483
Cost of cloud subscriptions and support – SaaS/PaaS1) –348 –361 –254
Cost of cloud subscriptions and support – IaaS2) –195 –206 –142
Cost of cloud subscriptions and support –543 –567 –396
Cost of software licenses and support –909 –968 –970
Cost of cloud and software –1,453 –1,534 –1,366
Cost of services –1,211 –1,300 –1,267
Total cost of revenue –2,663 –2,834 –2,633
Segment gross profit 6,816 7,338 6,850
Other segment expenses –3,140 –3,341 –3,194
Segment profit 3,676 3,997 3,656
1) Software as a Service/Platform as a Service 2) Infrastructure as a Service
SAP Business Network € millions, unless otherwise stated Q1–Q2 2018 Q1–Q2 2017
Actual Currency Constant Currency
Actual Currency
Cloud subscriptions and support – SaaS/PaaS1) 1,014 1,113 925
Cloud subscriptions and support – IaaS2) 0 0 0
Cloud subscriptions and support 1,014 1,113 925
Software licenses 0 0 0
Software support 8 9 11
Software licenses and support 8 9 11
Cloud and software 1,022 1,122 936
Services 210 229 202
Total segment revenue 1,233 1,352 1,138
Cost of cloud subscriptions and support – SaaS/PaaS1) –230 –252 –214
Cost of cloud subscriptions and support – IaaS2) 0 0 0
Cost of cloud subscriptions and support –230 –252 –214
Cost of software licenses and support –3 –4 –2
Cost of cloud and software –233 –255 –215
Cost of services –150 –163 –152
Total cost of revenue –383 –418 –367
Segment gross profit 850 934 771
Other segment expenses –623 –683 –582
Segment profit 227 251 189
1) Software as a Service/Platform as a Service 2) Infrastructure as a Service
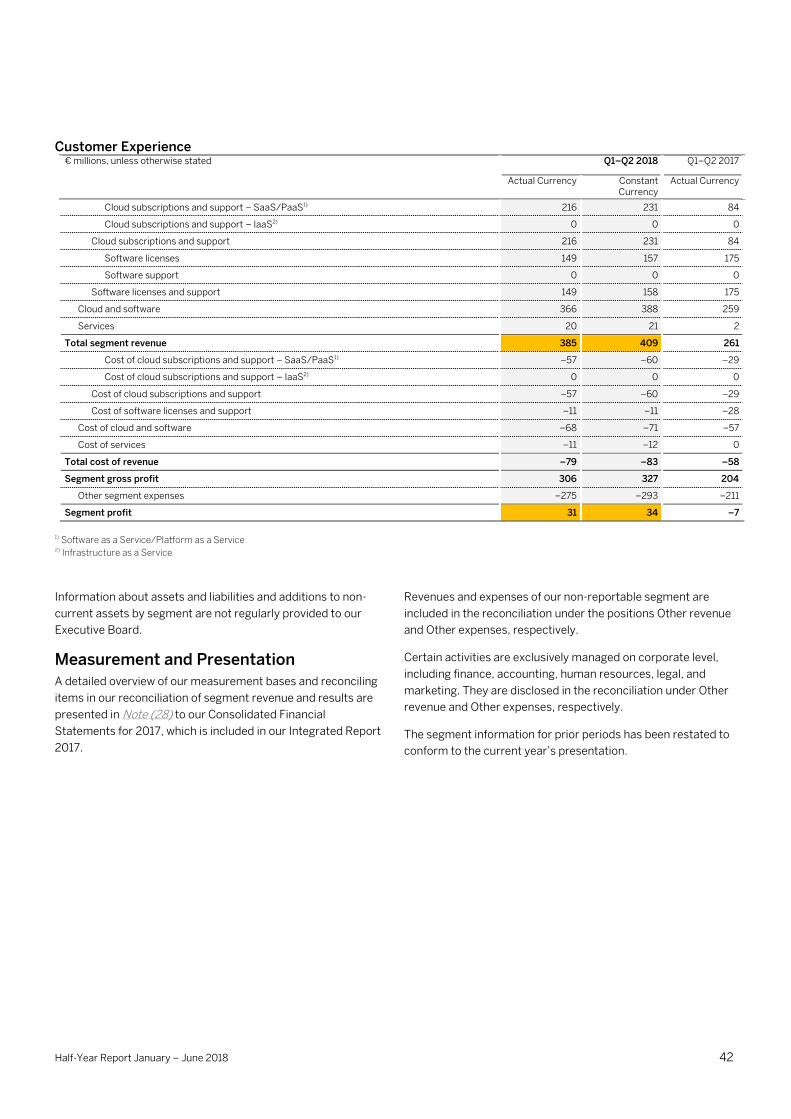
Half-Year Report January – June 2018 42
Customer Experience € millions, unless otherwise stated Q1–Q2 2018 Q1–Q2 2017
Actual Currency Constant Currency
Actual Currency
Cloud subscriptions and support – SaaS/PaaS1) 216 231 84
Cloud subscriptions and support – IaaS2) 0 0 0
Cloud subscriptions and support 216 231 84
Software licenses 149 157 175
Software support 0 0 0
Software licenses and support 149 158 175
Cloud and software 366 388 259
Services 20 21 2
Total segment revenue 385 409 261
Cost of cloud subscriptions and support – SaaS/PaaS1) –57 –60 –29
Cost of cloud subscriptions and support – IaaS2) 0 0 0
Cost of cloud subscriptions and support –57 –60 –29
Cost of software licenses and support –11 –11 –28
Cost of cloud and software –68 –71 –57
Cost of services –11 –12 0
Total cost of revenue –79 –83 –58
Segment gross profit 306 327 204
Other segment expenses –275 –293 –211
Segment profit 31 34 –7
1) Software as a Service/Platform as a Service 2) Infrastructure as a Service
Information about assets and liabilities and additions to non-
current assets by segment are not regularly provided to our
Executive Board.
Measurement and Presentation
A detailed overview of our measurement bases and reconciling
items in our reconciliation of segment revenue and results are
presented in Note (28) to our Consolidated Financial
Statements for 2017, which is included in our Integrated Report
2017.
Revenues and expenses of our non-reportable segment are
included in the reconciliation under the positions Other revenue
and Other expenses, respectively.
Certain activities are exclusively managed on corporate level,
including finance, accounting, human resources, legal, and
marketing. They are disclosed in the reconciliation under Other
revenue and Other expenses, respectively.
The segment information for prior periods has been restated to
conform to the current year’s presentation.
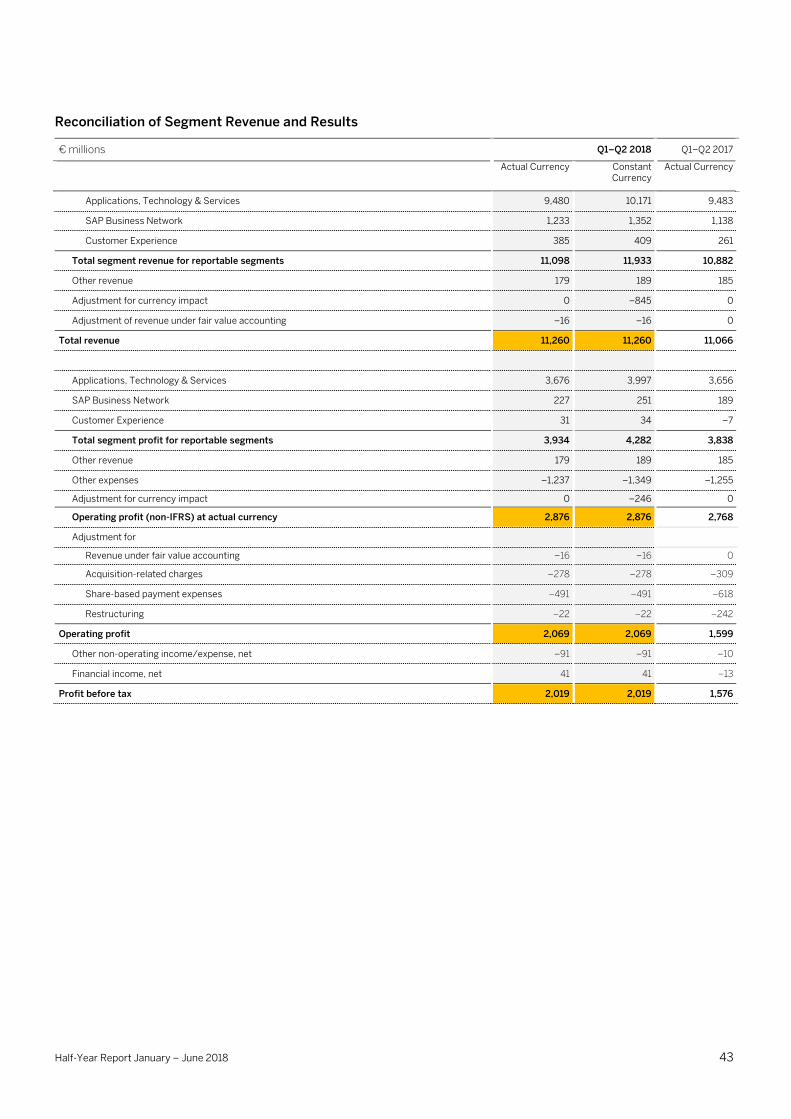
Half-Year Report January – June 2018 43
Reconciliation of Segment Revenue and Results
€ millions Q1–Q2 2018 Q1–Q2 2017
Actual Currency Constant Currency
Actual Currency
Applications, Technology & Services 9,480 10,171 9,483
SAP Business Network 1,233 1,352 1,138
Customer Experience 385 409 261
Total segment revenue for reportable segments 11,098 11,933 10,882
Other revenue 179 189 185
Adjustment for currency impact 0 –845 0
Adjustment of revenue under fair value accounting –16 –16 0
Total revenue 11,260 11,260 11,066
Applications, Technology & Services 3,676 3,997 3,656
SAP Business Network 227 251 189
Customer Experience 31 34 –7
Total segment profit for reportable segments 3,934 4,282 3,838
Other revenue 179 189 185
Other expenses –1,237 –1,349 –1,255
Adjustment for currency impact 0 –246 0
Operating profit (non-IFRS) at actual currency 2,876 2,876 2,768
Adjustment for
Revenue under fair value accounting –16 –16 0
Acquisition-related charges –278 –278 –309
Share-based payment expenses –491 –491 –618
Restructuring –22 –22 –242
Operating profit 2,069 2,069 1,599
Other non-operating income/expense, net –91 –91 –10
Financial income, net 41 41 –13
Profit before tax 2,019 2,019 1,576
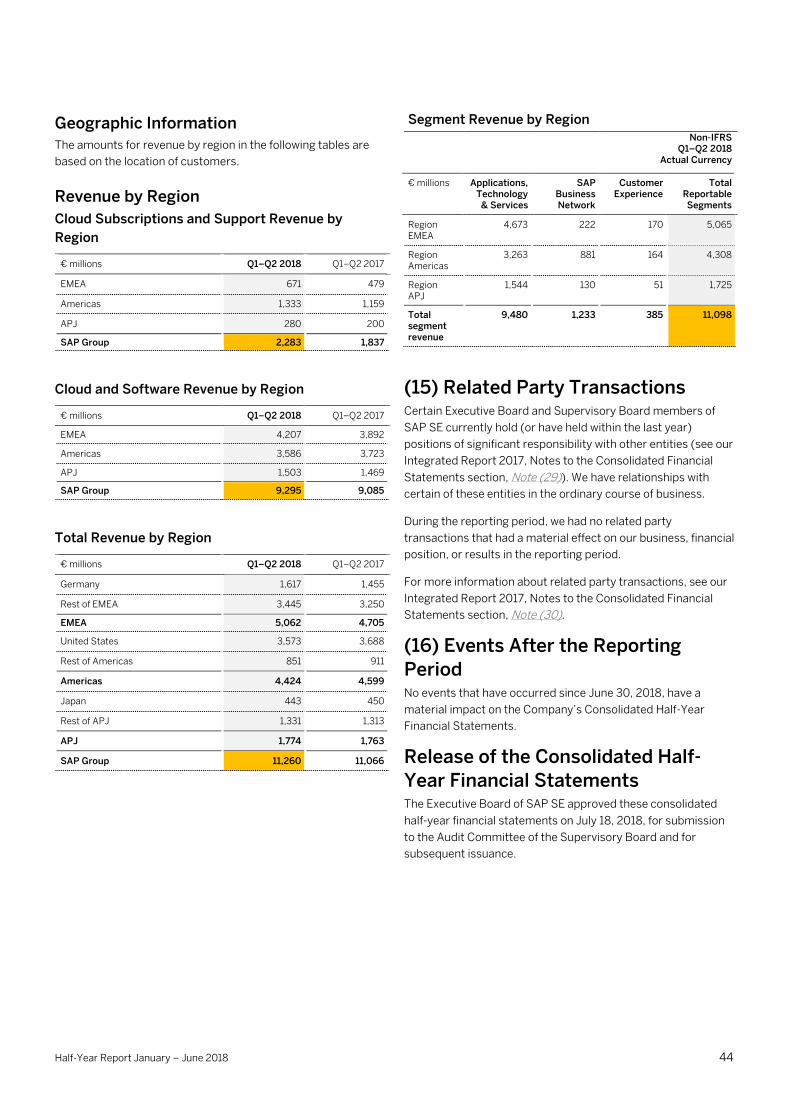
Half-Year Report January – June 2018 44
Geographic Information
The amounts for revenue by region in the following tables are
based on the location of customers.
Revenue by Region
Cloud Subscriptions and Support Revenue by
Region
€ millions Q1–Q2 2018 Q1–Q2 2017
EMEA 671 479
Americas 1,333 1,159
APJ 280 200
SAP Group 2,283 1,837
Cloud and Software Revenue by Region
€ millions Q1–Q2 2018 Q1–Q2 2017
EMEA 4,207 3,892
Americas 3,586 3,723
APJ 1,503 1,469
SAP Group 9,295 9,085
Total Revenue by Region
€ millions Q1–Q2 2018 Q1–Q2 2017
Germany 1,617 1,455
Rest of EMEA 3,445 3,250
EMEA 5,062 4,705
United States 3,573 3,688
Rest of Americas 851 911
Americas 4,424 4,599
Japan 443 450
Rest of APJ 1,331 1,313
APJ 1,774 1,763
SAP Group 11,260 11,066
Segment Revenue by Region
Non-IFRS Q1–Q2 2018
Actual Currency
€ millions Applications, Technology & Services
SAP Business Network
Customer Experience
Total Reportable Segments
Region EMEA
4,673 222 170 5,065
Region Americas
3,263 881 164 4,308
Region APJ
1,544 130 51 1,725
Total segment revenue
9,480 1,233 385 11,098
(15) Related Party Transactions Certain Executive Board and Supervisory Board members of
SAP SE currently hold (or have held within the last year)
positions of significant responsibility with other entities (see our
Integrated Report 2017, Notes to the Consolidated Financial
Statements section, Note (29)). We have relationships with
certain of these entities in the ordinary course of business.
During the reporting period, we had no related party
transactions that had a material effect on our business, financial
position, or results in the reporting period.
For more information about related party transactions, see our
Integrated Report 2017, Notes to the Consolidated Financial
Statements section, Note (30).
(16) Events After the Reporting
Period No events that have occurred since June 30, 2018, have a
material impact on the Company’s Consolidated Half-Year
Financial Statements.
Release of the Consolidated Half-
Year Financial Statements The Executive Board of SAP SE approved these consolidated
half-year financial statements on July 18, 2018, for submission
to the Audit Committee of the Supervisory Board and for
subsequent issuance.
Half-Year Report January – June 2018 45
Responsibility Statement To the best of our knowledge, and in accordance with the applicable reporting principles for half-year financial reporting, the
Consolidated Half-Year Financial Statements give a true and fair view of the assets, liabilities, financial position, and profit or loss of
the SAP Group, and the Consolidated Half-Year Management Report of the SAP Group includes a fair review of the development and
performance of the business and the position of the SAP Group, together with a description of the material opportunities and risks
associated with the expected development of the SAP Group for the remaining months of the financial year.
Walldorf, July 18, 2018
SAP SE
Walldorf, Baden
The Executive Board
Bill McDermott Robert Enslin
Adaire Fox-Martin Christian Klein
Michael Kleinemeier Bernd Leukert
Jennifer Morgan Luka Mucic
Stefan Ries
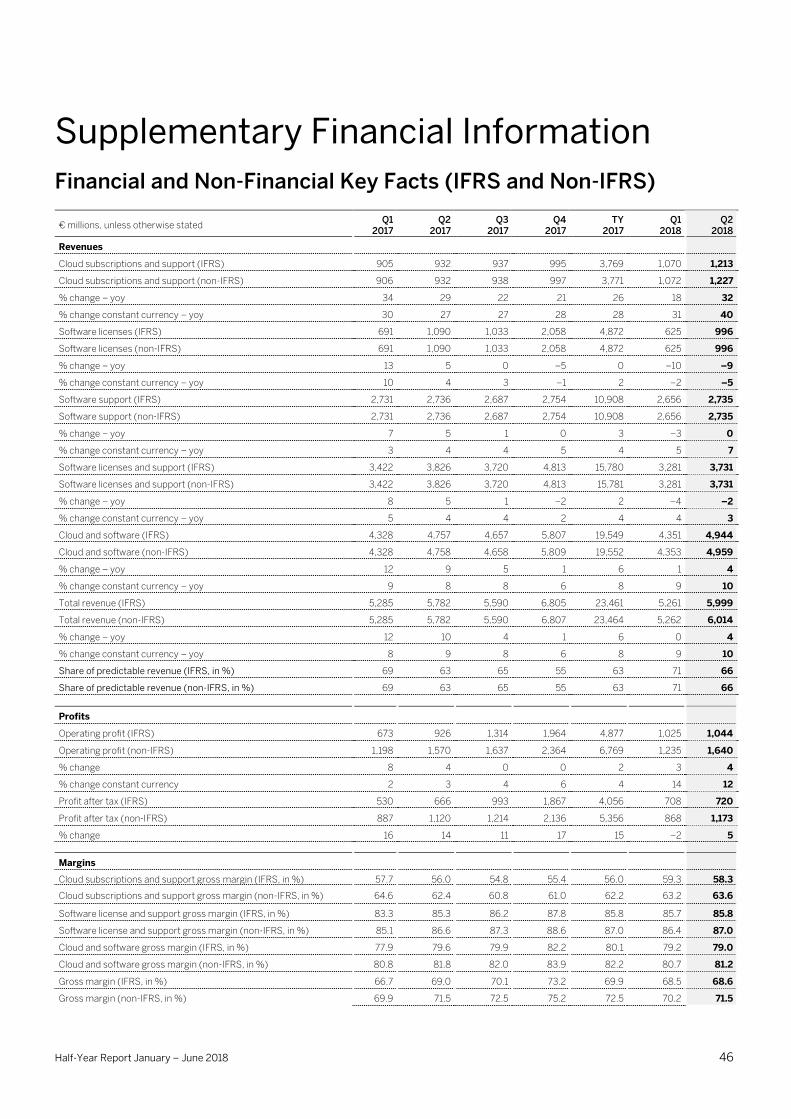
Half-Year Report January – June 2018 46
Supplementary Financial Information
Financial and Non-Financial Key Facts (IFRS and Non-IFRS)
€ millions, unless otherwise stated Q1
2017 Q2
2017 Q3
2017 Q4
2017 TY
2017 Q1
2018 Q2
2018
Revenues
Cloud subscriptions and support (IFRS) 905 932 937 995 3,769 1,070 1,213
Cloud subscriptions and support (non-IFRS) 906 932 938 997 3,771 1,072 1,227
% change – yoy 34 29 22 21 26 18 32
% change constant currency – yoy 30 27 27 28 28 31 40
Software licenses (IFRS) 691 1,090 1,033 2,058 4,872 625 996
Software licenses (non-IFRS) 691 1,090 1,033 2,058 4,872 625 996
% change – yoy 13 5 0 –5 0 –10 –9
% change constant currency – yoy 10 4 3 –1 2 –2 –5
Software support (IFRS) 2,731 2,736 2,687 2,754 10,908 2,656 2,735
Software support (non-IFRS) 2,731 2,736 2,687 2,754 10,908 2,656 2,735
% change – yoy 7 5 1 0 3 –3 0
% change constant currency – yoy 3 4 4 5 4 5 7
Software licenses and support (IFRS) 3,422 3,826 3,720 4,813 15,780 3,281 3,731
Software licenses and support (non-IFRS) 3,422 3,826 3,720 4,813 15,781 3,281 3,731
% change – yoy 8 5 1 –2 2 –4 –2
% change constant currency – yoy 5 4 4 2 4 4 3
Cloud and software (IFRS) 4,328 4,757 4,657 5,807 19,549 4,351 4,944
Cloud and software (non-IFRS) 4,328 4,758 4,658 5,809 19,552 4,353 4,959
% change – yoy 12 9 5 1 6 1 4
% change constant currency – yoy 9 8 8 6 8 9 10
Total revenue (IFRS) 5,285 5,782 5,590 6,805 23,461 5,261 5,999
Total revenue (non-IFRS) 5,285 5,782 5,590 6,807 23,464 5,262 6,014
% change – yoy 12 10 4 1 6 0 4
% change constant currency – yoy 8 9 8 6 8 9 10
Share of predictable revenue (IFRS, in %) 69 63 65 55 63 71 66
Share of predictable revenue (non-IFRS, in %) 69 63 65 55 63 71 66
Profits
Operating profit (IFRS) 673 926 1,314 1,964 4,877 1,025 1,044
Operating profit (non-IFRS) 1,198 1,570 1,637 2,364 6,769 1,235 1,640
% change 8 4 0 0 2 3 4
% change constant currency 2 3 4 6 4 14 12
Profit after tax (IFRS) 530 666 993 1,867 4,056 708 720
Profit after tax (non-IFRS) 887 1,120 1,214 2,136 5,356 868 1,173
% change 16 14 11 17 15 –2 5
Margins
Cloud subscriptions and support gross margin (IFRS, in %) 57.7 56.0 54.8 55.4 56.0 59.3 58.3
Cloud subscriptions and support gross margin (non-IFRS, in %) 64.6 62.4 60.8 61.0 62.2 63.2 63.6
Software license and support gross margin (IFRS, in %) 83.3 85.3 86.2 87.8 85.8 85.7 85.8
Software license and support gross margin (non-IFRS, in %) 85.1 86.6 87.3 88.6 87.0 86.4 87.0
Cloud and software gross margin (IFRS, in %) 77.9 79.6 79.9 82.2 80.1 79.2 79.0
Cloud and software gross margin (non-IFRS, in %) 80.8 81.8 82.0 83.9 82.2 80.7 81.2
Gross margin (IFRS, in %) 66.7 69.0 70.1 73.2 69.9 68.5 68.6
Gross margin (non-IFRS, in %) 69.9 71.5 72.5 75.2 72.5 70.2 71.5
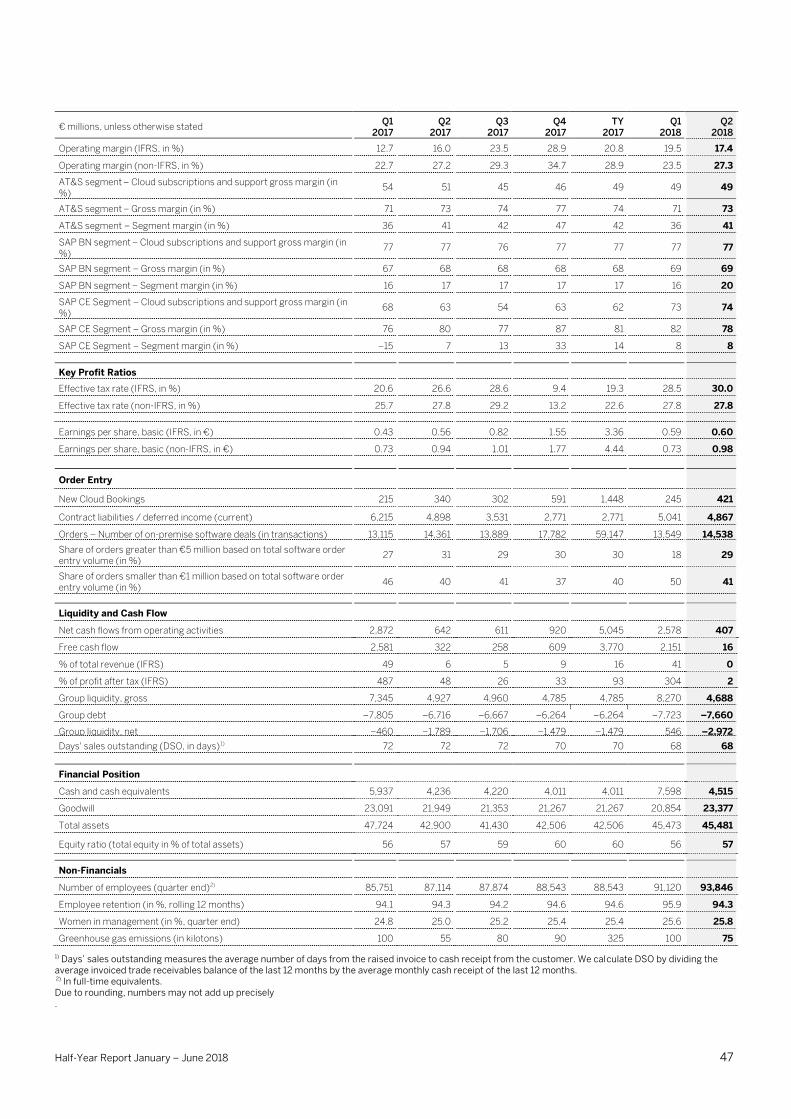
Half-Year Report January – June 2018 47
€ millions, unless otherwise stated Q1
2017 Q2
2017 Q3
2017 Q4
2017 TY
2017 Q1
2018 Q2
2018
Operating margin (IFRS, in %) 12.7 16.0 23.5 28.9 20.8 19.5 17.4
Operating margin (non-IFRS, in %) 22.7 27.2 29.3 34.7 28.9 23.5 27.3
AT&S segment – Cloud subscriptions and support gross margin (in %)
54 51 45 46 49 49 49
AT&S segment – Gross margin (in %) 71 73 74 77 74 71 73
AT&S segment – Segment margin (in %) 36 41 42 47 42 36 41
SAP BN segment – Cloud subscriptions and support gross margin (in %)
77 77 76 77 77 77 77
SAP BN segment – Gross margin (in %) 67 68 68 68 68 69 69
SAP BN segment – Segment margin (in %) 16 17 17 17 17 16 20
SAP CE Segment – Cloud subscriptions and support gross margin (in %)
68 63 54 63 62 73 74
SAP CE Segment – Gross margin (in %) 76 80 77 87 81 82 78
SAP CE Segment – Segment margin (in %) –15 7 13 33 14 8 8
Key Profit Ratios
Effective tax rate (IFRS, in %) 20.6 26.6 28.6 9.4 19.3 28.5 30.0
Effective tax rate (non-IFRS, in %) 25.7 27.8 29.2 13.2 22.6 27.8 27.8
Earnings per share, basic (IFRS, in €) 0.43 0.56 0.82 1.55 3.36 0.59 0.60
Earnings per share, basic (non-IFRS, in €) 0.73 0.94 1.01 1.77 4.44 0.73 0.98
Order Entry
New Cloud Bookings 215 340 302 591 1,448 245 421
Contract liabilities / deferred income (current) 6,215 4,898 3,531 2,771 2,771 5,041 4,867
Orders – Number of on-premise software deals (in transactions) 13,115 14,361 13,889 17,782 59,147 13,549 14,538
Share of orders greater than €5 million based on total software order entry volume (in %)
27 31 29 30 30 18 29
Share of orders smaller than €1 million based on total software order entry volume (in %)
46 40 41 37 40 50 41
Liquidity and Cash Flow
Net cash flows from operating activities 2,872 642 611 920 5,045 2,578 407
Free cash flow 2,581 322 258 609 3,770 2,151 16
% of total revenue (IFRS) 49 6 5 9 16 41 0
% of profit after tax (IFRS) 487 48 26 33 93 304 2
Group liquidity, gross 7,345 4,927 4,960 4,785 4,785 8,270 4,688
Group debt –7,805 –6,716 –6,667 –6,264 –6,264 –7,723 –7,660
Group liquidity, net –460 –1,789 –1,706 –1,479 –1,479 546 –2,972
Days' sales outstanding (DSO, in days)1) 72 72 72 70 70 68 68
Financial Position
Cash and cash equivalents 5,937 4,236 4,220 4,011 4,011 7,598 4,515
Goodwill 23,091 21,949 21,353 21,267 21,267 20,854 23,377
Total assets 47,724 42,900 41,430 42,506 42,506 45,473 45,481
Equity ratio (total equity in % of total assets) 56 57 59 60 60 56 57
Non-Financials
Number of employees (quarter end)2) 85,751 87,114 87,874 88,543 88,543 91,120 93,846
Employee retention (in %, rolling 12 months) 94.1 94.3 94.2 94.6 94.6 95.9 94.3
Women in management (in %, quarter end) 24.8 25.0 25.2 25.4 25.4 25.6 25.8
Greenhouse gas emissions (in kilotons) 100 55 80 90 325 100 75
1) Days’ sales outstanding measures the average number of days from the raised invoice to cash receipt from the customer. We calculate DSO by dividing the average invoiced trade receivables balance of the last 12 months by the average monthly cash receipt of the last 12 months. 2) In full-time equivalents. Due to rounding, numbers may not add up precisely .
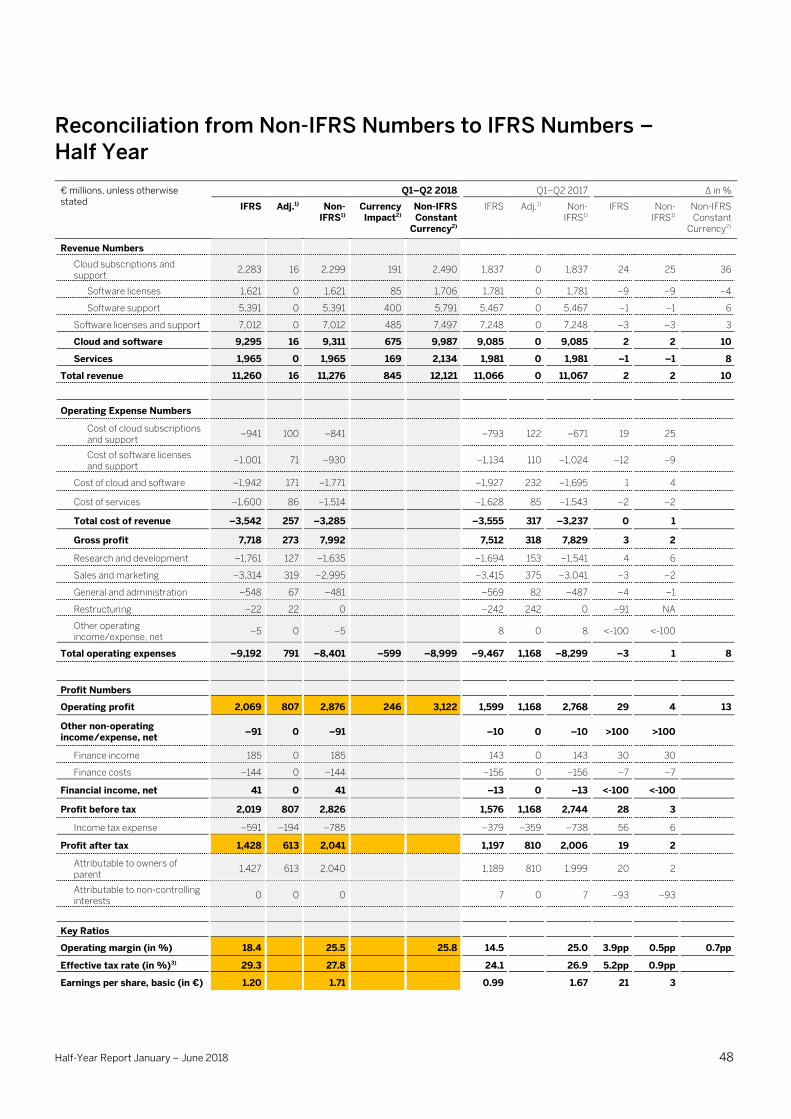
Half-Year Report January – June 2018 48
Reconciliation from Non-IFRS Numbers to IFRS Numbers – Half Year
€ millions, unless otherwise stated
Q1–Q2 2018 Q1–Q2 2017 ∆ in %
IFRS Adj.1) Non-IFRS1)
Currency Impact2)
Non-IFRS Constant
Currency2)
IFRS Adj.1) Non-IFRS1)
IFRS Non-IFRS1)
Non-IFRS Constant
Currency2)
Revenue Numbers
Cloud subscriptions and support
2,283 16 2,299 191 2,490 1,837 0 1,837 24 25 36
Software licenses 1,621 0 1,621 85 1,706 1,781 0 1,781 –9 –9 –4
Software support 5,391 0 5,391 400 5,791 5,467 0 5,467 –1 –1 6
Software licenses and support 7,012 0 7,012 485 7,497 7,248 0 7,248 –3 –3 3
Cloud and software 9,295 16 9,311 675 9,987 9,085 0 9,085 2 2 10
Services 1,965 0 1,965 169 2,134 1,981 0 1,981 –1 –1 8
Total revenue 11,260 16 11,276 845 12,121 11,066 0 11,067 2 2 10
Operating Expense Numbers
Cost of cloud subscriptions and support
–941 100 –841 –793 122 –671 19 25
Cost of software licenses and support
–1,001 71 –930 –1,134 110 –1,024 –12 –9
Cost of cloud and software –1,942 171 –1,771 –1,927 232 –1,695 1 4
Cost of services –1,600 86 –1,514 –1,628 85 –1,543 –2 –2
Total cost of revenue –3,542 257 –3,285 –3,555 317 –3,237 0 1
Gross profit 7,718 273 7,992 7,512 318 7,829 3 2
Research and development –1,761 127 –1,635 –1,694 153 –1,541 4 6
Sales and marketing –3,314 319 –2,995 –3,415 375 –3,041 –3 –2
General and administration –548 67 –481 –569 82 –487 –4 –1
Restructuring –22 22 0 –242 242 0 –91 NA
Other operating income/expense, net
–5 0 –5 8 0 8 <-100 <-100
Total operating expenses –9,192 791 –8,401 –599 –8,999 –9,467 1,168 –8,299 –3 1 8
Profit Numbers
Operating profit 2,069 807 2,876 246 3,122 1,599 1,168 2,768 29 4 13
Other non-operating income/expense, net
–91 0 –91 –10 0 –10 >100 >100
Finance income 185 0 185 143 0 143 30 30
Finance costs –144 0 –144 –156 0 –156 –7 –7
Financial income, net 41 0 41 –13 0 –13 <-100 <-100
Profit before tax 2,019 807 2,826 1,576 1,168 2,744 28 3
Income tax expense –591 –194 –785 –379 –359 –738 56 6
Profit after tax 1,428 613 2,041 1,197 810 2,006 19 2
Attributable to owners of parent
1,427 613 2,040 1,189 810 1,999 20 2
Attributable to non-controlling interests
0 0 0 7 0 7 –93 –93
Key Ratios
Operating margin (in %) 18.4 25.5 25.8 14.5 25.0 3.9pp 0.5pp 0.7pp
Effective tax rate (in %)3) 29.3 27.8 24.1 26.9 5.2pp 0.9pp
Earnings per share, basic (in €) 1.20 1.71 0.99 1.67 21 3
Half-Year Report January – June 2018 49
1) Adjustments in the revenue line items are for software support revenue, cloud subscriptions and support revenue, and other similarly recurring revenues that entities acquired by SAP would have recognized had they remained stand-alone entities but that SAP is not permitted to recognize as revenue under IFRS as a result of business combination accounting rules. Adjustments in the operating expense line items are for acquisition-related charges, share-based payment expenses, as well as restructuring expenses.
2) Constant currency revenue and operating income figures are calculated by translating revenue and operating income of the current period using the average exchange rates from the previous year's respective period instead of the current period. Constant currency period-over-period changes are calculated by comparing the current year's non-IFRS constant currency numbers with the non-IFRS number of the previous year's respective period.
For a more detailed description of these adjustments and their limitations as well as our constant currency figures, see Explanation of Non-IFRS Measures.
3) The difference between our effective tax rate (IFRS) and effective tax rate (non-IFRS) in the first half of 2018 and 2017 mainly results from tax effects of acquisition-related charges and share-based payment expenses.
Due to rounding, numbers may not add up precisely.
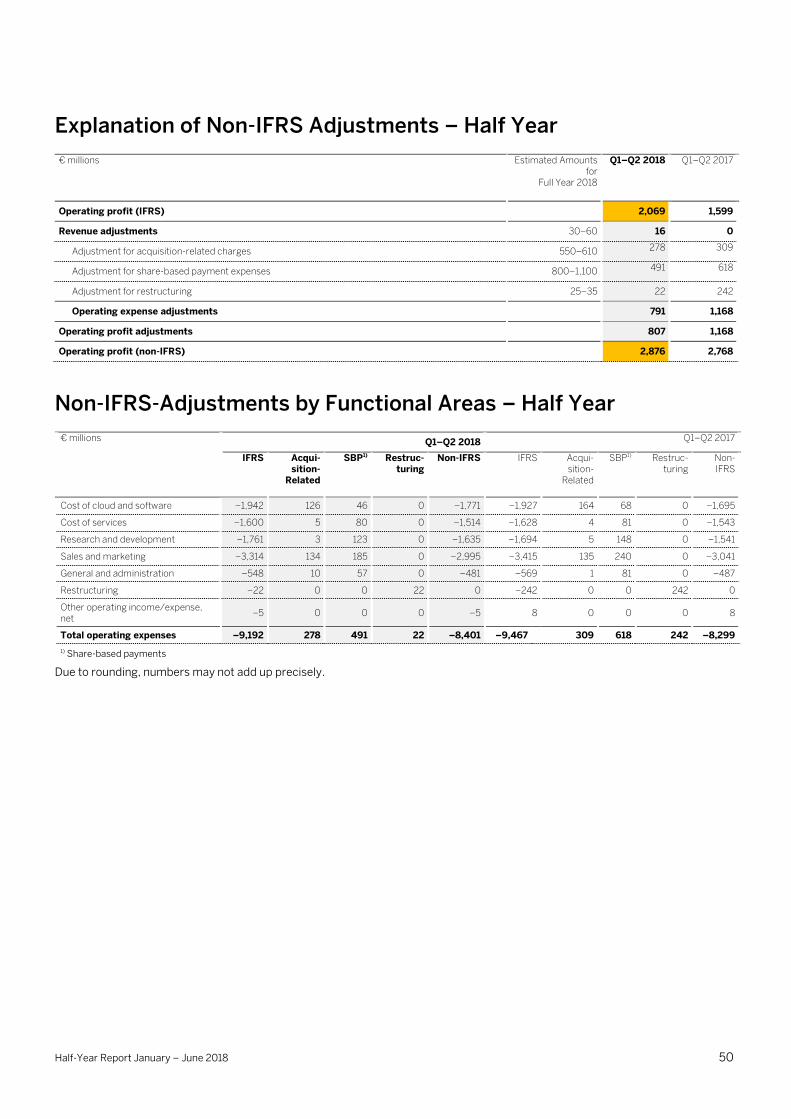
Half-Year Report January – June 2018 50
Explanation of Non-IFRS Adjustments – Half Year
€ millions Estimated Amounts for
Full Year 2018
Q1–Q2 2018 Q1–Q2 2017
Operating profit (IFRS) 2,069 1,599
Revenue adjustments 30–60 16 0
Adjustment for acquisition-related charges 550–610 278 309
Adjustment for share-based payment expenses 800–1,100 491 618
Adjustment for restructuring 25–35 22 242
Operating expense adjustments 791 1,168
Operating profit adjustments 807 1,168
Operating profit (non-IFRS) 2,876 2,768
Non-IFRS-Adjustments by Functional Areas – Half Year
€ millions Q1–Q2 2018 Q1–Q2 2017
IFRS Acqui- sition-
Related
SBP1) Restruc-turing
Non-IFRS IFRS Acqui- sition-
Related
SBP1) Restruc-turing
Non-IFRS
Cost of cloud and software –1,942 126 46 0 –1,771 –1,927 164 68 0 –1,695
Cost of services –1,600 5 80 0 –1,514 –1,628 4 81 0 –1,543
Research and development –1,761 3 123 0 –1,635 –1,694 5 148 0 –1,541
Sales and marketing –3,314 134 185 0 –2,995 –3,415 135 240 0 –3,041
General and administration –548 10 57 0 –481 –569 1 81 0 –487
Restructuring –22 0 0 22 0 –242 0 0 242 0
Other operating income/expense, net
–5 0 0 0 –5 8 0 0 0 8
Total operating expenses –9,192 278 491 22 –8,401 –9,467 309 618 242 –8,299
1) Share-based payments
Due to rounding, numbers may not add up precisely.
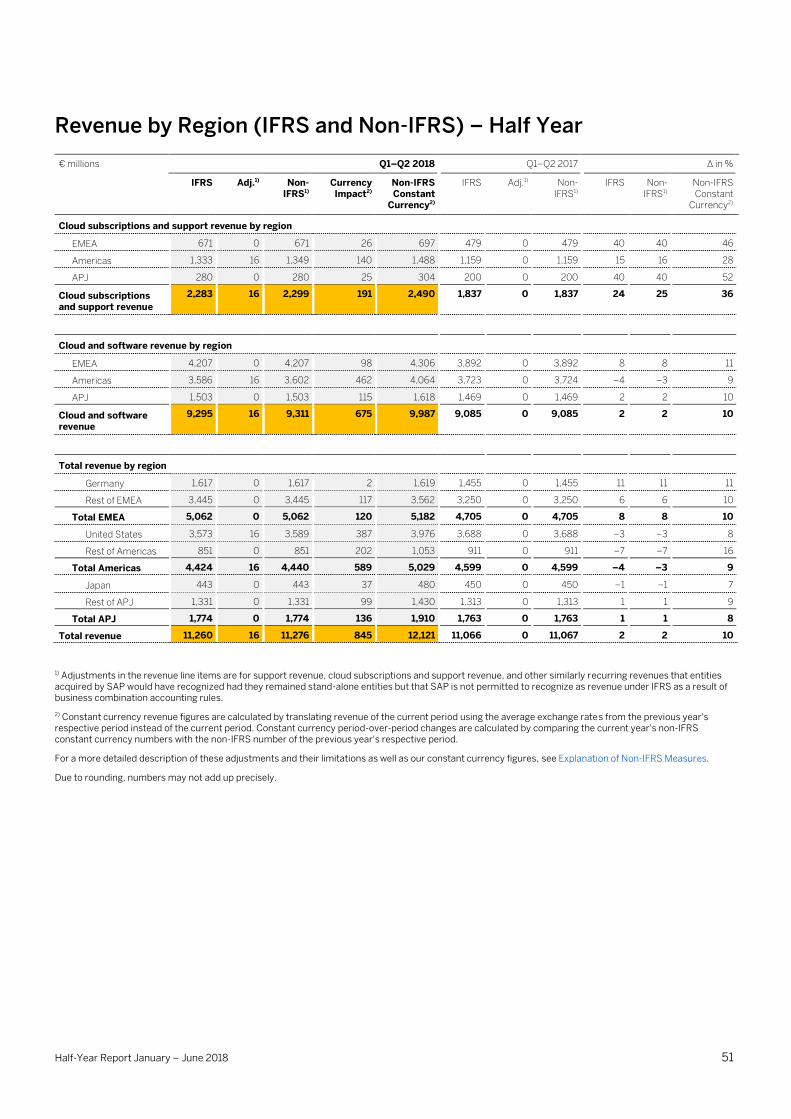
Half-Year Report January – June 2018 51
Revenue by Region (IFRS and Non-IFRS) – Half Year
€ millions Q1–Q2 2018 Q1–Q2 2017 ∆ in %
IFRS Adj.1) Non-IFRS1)
Currency Impact2)
Non-IFRS Constant
Currency2)
IFRS Adj.1) Non-IFRS1)
IFRS Non-IFRS1)
Non-IFRS Constant
Currency2)
Cloud subscriptions and support revenue by region
EMEA 671 0 671 26 697 479 0 479 40 40 46
Americas 1,333 16 1,349 140 1,488 1,159 0 1,159 15 16 28
APJ 280 0 280 25 304 200 0 200 40 40 52
Cloud subscriptions and support revenue
2,283 16 2,299 191 2,490 1,837 0 1,837 24 25 36
Cloud and software revenue by region
EMEA 4,207 0 4,207 98 4,306 3,892 0 3,892 8 8 11
Americas 3,586 16 3,602 462 4,064 3,723 0 3,724 –4 –3 9
APJ 1,503 0 1,503 115 1,618 1,469 0 1,469 2 2 10
Cloud and software revenue
9,295 16 9,311 675 9,987 9,085 0 9,085 2 2 10
Total revenue by region
Germany 1,617 0 1,617 2 1,619 1,455 0 1,455 11 11 11
Rest of EMEA 3,445 0 3,445 117 3,562 3,250 0 3,250 6 6 10
Total EMEA 5,062 0 5,062 120 5,182 4,705 0 4,705 8 8 10
United States 3,573 16 3,589 387 3,976 3,688 0 3,688 –3 –3 8
Rest of Americas 851 0 851 202 1,053 911 0 911 –7 –7 16
Total Americas 4,424 16 4,440 589 5,029 4,599 0 4,599 –4 –3 9
Japan 443 0 443 37 480 450 0 450 –1 –1 7
Rest of APJ 1,331 0 1,331 99 1,430 1,313 0 1,313 1 1 9
Total APJ 1,774 0 1,774 136 1,910 1,763 0 1,763 1 1 8
Total revenue 11,260 16 11,276 845 12,121 11,066 0 11,067 2 2 10
1) Adjustments in the revenue line items are for support revenue, cloud subscriptions and support revenue, and other similarly recurring revenues that entities acquired by SAP would have recognized had they remained stand-alone entities but that SAP is not permitted to recognize as revenue under IFRS as a result of business combination accounting rules.
2) Constant currency revenue figures are calculated by translating revenue of the current period using the average exchange rates from the previous year's respective period instead of the current period. Constant currency period-over-period changes are calculated by comparing the current year's non-IFRS constant currency numbers with the non-IFRS number of the previous year's respective period.
For a more detailed description of these adjustments and their limitations as well as our constant currency figures, see Explanation of Non-IFRS Measures.
Due to rounding, numbers may not add up precisely.
Half-Year Report January – June 2018 52
General Information
Forward-Looking Statements
This half-year report contains forward-looking statements and
information based on the beliefs of, and assumptions made by,
our management using information currently available to them.
Any statements contained in this report that are not historical
facts are forward-looking statements as defined in the U.S.
Private Securities Litigation Reform Act of 1995. We have based
these forward-looking statements on our current expectations,
assumptions, and projections about future conditions and
events. As a result, our forward-looking statements and
information are subject to uncertainties and risks, many of
which are beyond our control. If one or more of these
uncertainties or risks materializes, or if management’s
underlying assumptions prove incorrect, our actual results could
differ materially from those described in or inferred from our
forward-looking statements and information. We describe these
risks and uncertainties in the Risk Management and Risks
section, respectively in the there-mentioned sources.
The words “aim,” “anticipate,” “assume,” “believe,” “continue,”
“could,” “counting on,” “is confident,” “development,”
“estimate,” “expect,” “forecast,” ”future trends,” “guidance,”
“intend,” “may,” ”might,” “outlook,” “plan,” “project,” “predict,”
“seek,” “should,” “strategy,” “want,” “will,” “would,” and similar
expressions as they relate to us are intended to identify such
forward-looking statements. Such statements include, for
example, those made in the Operating Results section, the Risk
Management and Risks section, the Expected Developments
and Opportunities section, and other forward-looking
information appearing in other parts of this half-year financial
report. To fully consider the factors that could affect our future
financial results, both our Integrated Report 2017 and our
Annual Report on Form 20-F for December 31, 2017, should be
considered, as well as all of our other filings with the Securities
and Exchange Commission (SEC). Readers are cautioned not to
place undue reliance on these forward-looking statements,
which speak only as of the date specified or the date of this
report. We undertake no obligation to publicly update or revise
any forward-looking statements as a result of new information
that we receive about conditions that existed upon issuance of
this report, future events, or otherwise unless we are required to
do so by law.
This report includes statistical data about the IT industry and
global economic trends that comes from information published
by sources including International Data Corporation (IDC), the
European Central Bank (ECB), and the International Monetary
Fund (IMF). This type of data represents only the estimates of
IDC, ECB, IMF, and other sources of industry data. SAP does not
adopt or endorse any of the statistical information provided by
sources such as IDC, ECB, IMF, or other similar sources that is
contained in this report. The data from these sources is subject
to risks and uncertainties, and subject to change based on
various factors, including those described above, in the Risk
Management and Risks section, and elsewhere in this report.
These and other factors could cause our results to differ
materially from those expressed in the estimates made by third
parties and SAP. We caution readers not to place undue reliance
on this data.
All of the information in this report relates to the situation on
June 30, 2018, or the half year ended on that date unless
otherwise stated.
Non-IFRS Financial Information
This half-year report contains non-IFRS measures as well as
financial data prepared in accordance with IFRS. We present and
discuss the reconciliation of these non-IFRS measures to the
respective IFRS measures in the Supplementary Financial
Information section. For more information about non-IFRS
measures, see our Web site www.sap.com/investors/sap-non-
ifrs-measures.
Half-Year Report January – June 2018 53
Additional Information
Financial Calendar
October 18, 2018
Third-quarter 2018 earnings release, telephone conference
January 29, 2019
Fourth-quarter and full-year 2018 preliminary earnings release,
telephone conference
May 15, 2019
Annual General Meeting of Shareholders, Mannheim, Germany
Investor Services
Additional information about this half-year report is available
online at www.sap.com/investors, including the official quarterly
statement, a presentation about the quarterly results, and a
recording of the conference call for financial analysts.
The tab “Financial Reports” contains the following publications:
– SAP Integrated Report (IFRS, PDF,
www.sapintegratedreport.com)
– SAP Annual Report on Form 20-F (IFRS, PDF)
– SAP SE Statutory Financial Statements and Review of
Operations (HGB, German only, PDF)
– Half-Year Report (IFRS, PDF)
– XBRL version of the Consolidated Financial Statements
and Notes
– Quarterly Statements (IFRS, PDF)
www.sap.com/investors is also the place to look for in-depth
information about stock, debt, and corporate governance;
financial and event news; and various services designed to help
investors find the information they need fast (see "Investor
Services”). These include an e-mail and text message news
service, and a Twitter feed.
For sustainability reasons and faster distribution, SAP decided
to refrain from printing reports.
You can reach us by phone at +49 6227 7-67336, send a fax to
+49 6227 7-40805, or e-mail us at [email protected].
Addresses
SAP SE
Dietmar-Hopp-Allee 16
69190 Walldorf
Germany
Tel. +49 6227 7-47474
Fax +49 6227 7-57575
Internet www.sap.com
E-mail [email protected]
The addresses of all our international subsidiaries and sales
partners are available on our public Web site at
www.sap.com/directory/main.html.
Information About Content Investor Relations
Tel. +49 6227 7-67336
Fax +49 6227 7-40805
E-mail [email protected]
Twitter @SAPinvestor
Internet www.sap.com/investor
Imprint
Overall responsibility:
SAP SE
Corporate Financial Reporting
Published on July 19, 2018
Copyright Usage in Collateral © 2018 SAP SE or an SAP affiliate company. All rights reserved.
No part of this publication may be reproduced or transmitted in
any form or for any purpose without the express permission of
SAP SE or an SAP affiliate company.
SAP and other SAP products and services mentioned herein as
well as their respective logos are trademarks or registered
trademarks of SAP SE (or an SAP affiliate company) in Germany
and other countries. Please see www.sap.com/corporate-
en/legal/copyright for additional trademark information and
notices.