Embed Size (px)
Citation preview

SAP Business Analytics Platform Vision and Demo
SAP BeLUX – October 2016
Philippe Nemery – Filip Steurs
nemeryphilippe@nemeryp

© 2016 SAP AG. All rights reserved. 2
WHO
WRAP UP
WHAT
WHY
MEETIN
G M
AP
(Audience)
(Expected Outcome)
(Agenda)
- Introduction- Today’s challenges in Business Analytics- SAP’s vision- High Level Architecture- Teaser of different Front-Ends- Conclusions
Presentation of the Business Analytics Suite

Massive amounts of data lead to new challenges and opportunities
TransactionsMachines Conversations

Massive amounts of data lead to new challenges and opportunities
Insight into
numbers, KPIs
and regions
Discover new
trends and
make forecasts. Choose the right
campaign or
policy & assess
its impacts.
Evaluate Risks
and drill-down
into root causes.

Agility and
choice for users
Simple
Architecture
Faster
innovation
Creativity and agility for business users
SAP Lumira | SAP Predictive Analytics
Across the enterprise with trust
BI and PA Platform
Innovate with data, across the organization

RawData
CleanedData
Standard Reports
Ad Hoc Reports &
OLAP
AgileVisualization
What happened?
Why did it happen?
Use
r E
ng
ag
em
en
t
Maturity of Analytics Capabilities
Self Service BI
The Analytics Continuum: From sense and response to predict and act
Understand the past, drive execution

RawData
CleanedData
Standard Reports
Ad Hoc Reports &
OLAP
AgileVisualization
What happened?
Why did it happen?
Use
r E
ng
ag
em
en
t
Maturity of Analytics Capabilities
Self Service BI
The Analytics Continuum: From sense and response to predict and act
PredictiveAnalytics
PrescriptiveAnalytics
What will happen?
What should I do?
Understand the past, predict the future and drive execution
Monitor, simulate and drive change in real-time
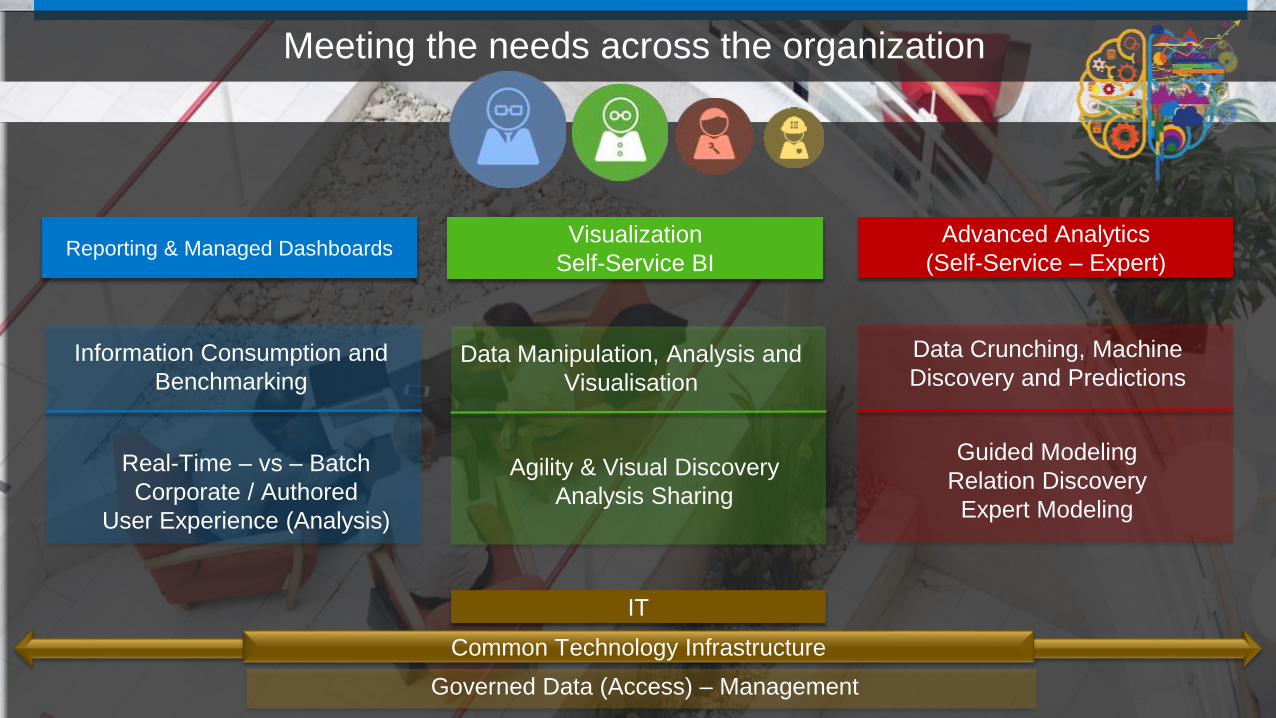
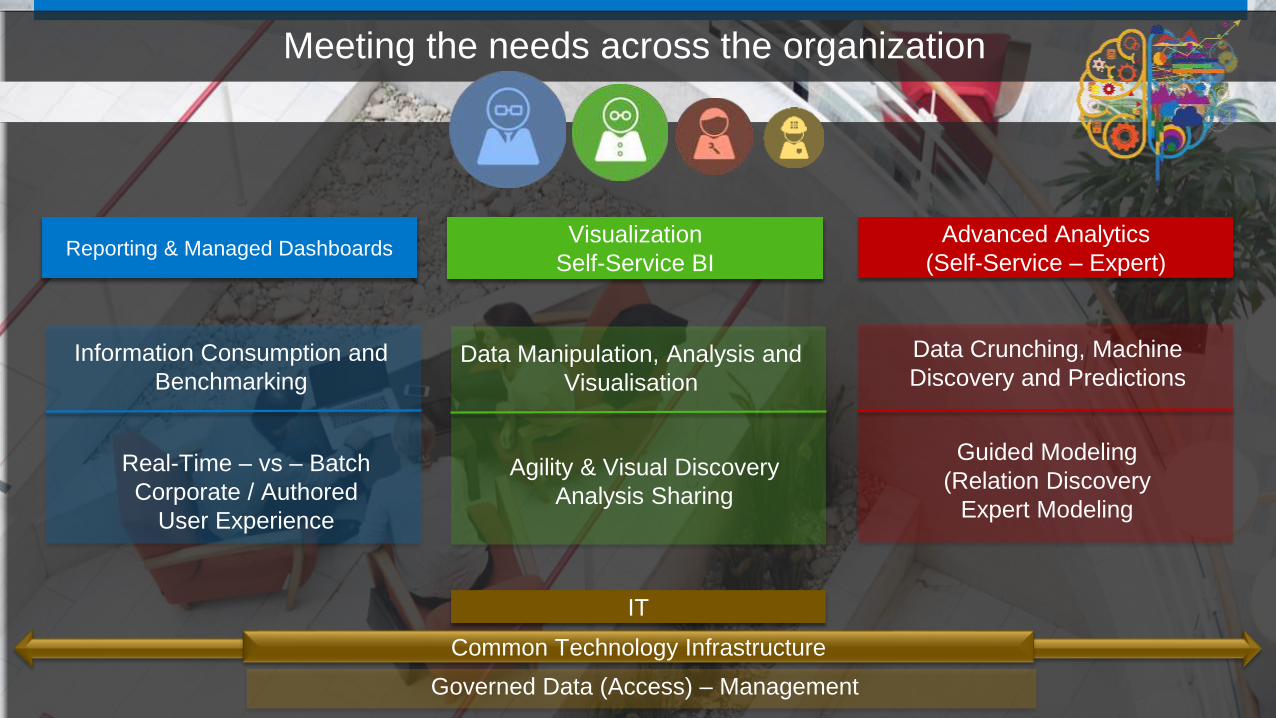
Meeting the needs across the organization
Common Technology Infrastructure
Advanced Analytics
(Self-Service – Expert)Reporting & Managed Dashboards
Visualization
Self-Service BI
IT
Information Consumption and
BenchmarkingData Manipulation, Analysis and
Visualisation
Data Crunching, Machine
Discovery and Predictions
Real-Time – vs – Batch
Corporate / Authored
User Experience (Analysis)
Agility & Visual Discovery
Analysis Sharing
Guided Modeling
Relation Discovery
Expert Modeling
Governed Data (Access) – Management

IT Business UsersMS Excel
Data is scattered in different databases and often duplicated causing
performance challenges security challenges
Data inconsistencies
Scattered Data Landscape: Existence of Silos
Operational Risks(Process) Bottlenecks

© 2016 SAP SE . All rights reserved. 10
ERP: SAP
Business Suite and
other ERPs
Unstructured data in
Social MediaOLAP Cubes
MS Excel
Oracle, DB2, MS
SQL and many
other DBs
BW,TeraData,
other DWs
Machines,
sensors
One platform supporting your user profiles and maturity levels.
Business Analytics Platform | Data Access (Semantic Layer)
Meeting the needs across the organization

© 2016 SAP SE . All rights reserved. 11
Predictive AnalyticsReporting / Dashboarding Self-Service
ERP: SAP
Business Suite and
other ERPs
Unstructured data in
Social MediaOLAP Cubes
MS Excel
Oracle, DB2, MS
SQL and many
other DBs
BW,TeraData,
other DWs
Machines,
sensors
One platform supporting your user profiles and maturity levels.
Business Analytics Platform | Data Access (Semantic Layer)
Meeting the needs across the organization
Social &
CollaborationCloud

© 2016 SAP AG. All rights reserved. 12
Chief Policy Officer - Manager,
Monitor - Strategy
Expert Analyst,
Predict and Execute
Policy Analyst,
Discover and Analyze
Advanced AnalyticsReporting / Dashboarding Self-Service BI

© 2016 SAP AG. All rights reserved. 13
²Report - Dashboard
Isabelle, a manager,
interacts with a
dashboard / report and
has some questions that
he will send to Maria for
investigation.

BI Console and BI Launchpad

Pixel Perfect Reporting: High productivity design for report designers
Quickly build formatted
reports on any data source
Securely distribute reports
both internally and
externally
Minimize IT support costs
by empowering end users
to easily create and modify
their own reports
Enhance custom
applications with
embedded reports

Organization Reporting: High productivity design for report designers
Quickly build formatted
reports on any data source
Securely distribute reports
both internally and
externally
Minimize IT support costs
by empowering end users
to easily create and modify
their own reports
Enhance custom
applications with
embedded reports

Powerful environment to
develop interactive and
appealing visualizations
Track important KPI‘s
and Information
Alerting and traffic lights
Guided Analysis and Drill
down in any directions
Mobile BI Apps (iPad,
iPhone)
Collaborative !
Organization Dashboards with drill-down capabilities

Powerful environment to
develop interactive and
appealing visualizations
Track important KPI‘s
and Information
Alerting and traffic lights
Guided Analysis and Drill
down in any directions
Mobile BI Apps (iPad,
iPhone)
Collaborative !
Organization Dashboards with drill-down capabilities

© 2016 SAP AG. All rights reserved. 19
²(Ad-Hoc) Analysis
Maria, will analyse in an
autonomous manner, the
data by visual exploration
and share his findings
with an ad-hoc report.

Discover hidden patterns
in information
Increase understanding
and use of data for better
decisions
Analytics reach the fringes
of the organizations
Agile Visualisation and Self-Service
Intuitively prepare your data, explore and present it

Discover hidden patterns
in information
Increase understanding and
use of data for better decisions
Analytics reach the fringes of
the organizations
Agile Visualisation and Self-Service
Intuitively prepare your data, explore and present it

© 2016 SAP AG. All rights reserved. 22
²
Advanced
Analytics
Johan will use Maria’s
findings to further analyze
Isabelle’s questions
(correlations, rooutcause) &
even predict what could
happen in the future.

© 2016 SAP AG. All rights reserved. 23
SAPPredictiveAnalytics
No Black Box
Support for R; bring your own algorithm
Incredible Scale
Automatic replication of template models
Data Preparation
Create 1000’s of derived variables faster
Automated Modeling
Best performing model automatically chosen
Model Management
Refresh production data sets and models
Breadth of Connectivity
Access departmental and enterprise data
Expert and Self-Service Predictive Analytics
Exploration

© 2016 SAP AG. All rights reserved. 24
²(Ad-Hoc) Analysis
Advanced
AnalyticsReport - Dashboard
Maria, will analyse in an
autonomous manner, the
data by visual exploration
and share his findings
with an ad-hoc report.
Johan will use Maria’s
findings to further analyze
Isabelle’s questions and even
predict what could happen in
the future.
Isabelle, a manager,
interacts with a
dashboard / report and
has some questions that
he will send to Pierre for
investigation.

Conclusions
Meeting the needs across the organization
Common Technology Infrastructure
Advanced Analytics
(Self-Service – Expert)Reporting & Managed Dashboards
Visualization
Self-Service BI
IT
Information Consumption and
BenchmarkingData Manipulation, Analysis and
Visualisation
Data Crunching, Machine
Discovery and Predictions
Real-Time – vs – Batch
Corporate / Authored
User Experience
Agility & Visual Discovery
Analysis Sharing
Guided Modeling
(Relation Discovery
Expert Modeling
Governed Data (Access) – Management