Embed Size (px)
Citation preview

forests research
sappi
Final results from a trial to Final results from a trial to test the effect of plot size on test the effect of plot size on
EucalyptusEucalyptus hybrid clonal hybrid clonal ranking in coastal Zululand, ranking in coastal Zululand,
South AfricaSouth Africa
Terry StangerTerry Stanger11,, Geoff Galloway & Elize RetiefGeoff Galloway & Elize Retief
Sappi Forests Research, Shaw Research Centre,Howick, South Africa
1 1 ee--mail mail -- [email protected]@sappi.com
forests research
sappi
forests research
sappi
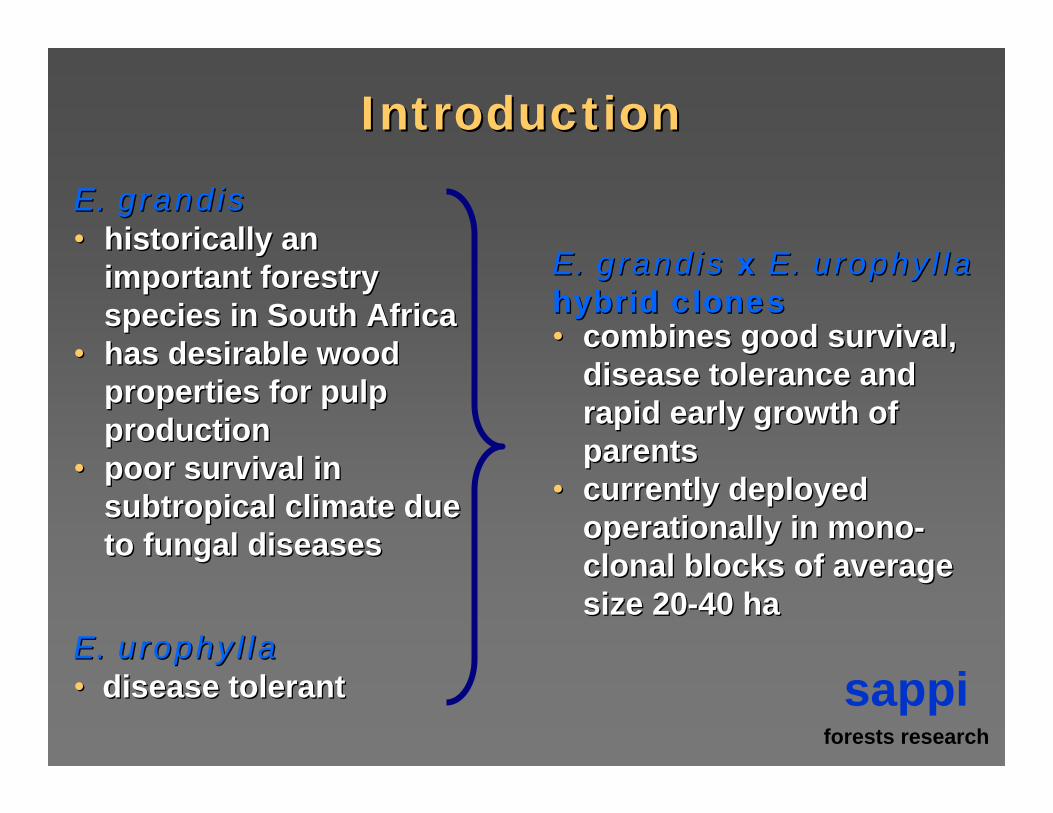
IntroductionIntroductionE. grandisE. grandis•• historically an historically an
important forestry important forestry species in South Africaspecies in South Africa
•• has desirable wood has desirable wood properties for pulp properties for pulp productionproduction
•• poor survival in poor survival in subtropical climate due subtropical climate due to fungal diseases to fungal diseases
E. urophyllaE. urophylla•• disease tolerantdisease tolerant
•• combines good survival, combines good survival, disease tolerance and disease tolerance and rapid early growth of rapid early growth of parentsparents
•• currently deployed currently deployed operationally in monooperationally in mono--clonal blocks of average clonal blocks of average size 20size 20--40 ha40 ha
E. grandisE. grandis x x E. urophyllaE. urophyllahybrid cloneshybrid clones

forests research
sappi
BackgroundBackgroundFasoula and Fasoula (1997) identified Fasoula and Fasoula (1997) identified ecosystems in which genotypes are ecosystems in which genotypes are
grown by plant breedersgrown by plant breeders
competition environmentcompetition environmentinteractions between interactions between genetically dissimilar genetically dissimilar
genotypesgenotypes
crop environmentcrop environmentinteractions between interactions between genetically identical genetically identical
genotypesgenotypes
poor negative correlation between the best yield poor negative correlation between the best yield producers in a competition environment and the producers in a competition environment and the
best yield producers in a crop environmentbest yield producers in a crop environment

forests research
sappi
Competition environmentCompetition environment CropCrop environmentenvironment
forests research
sappi
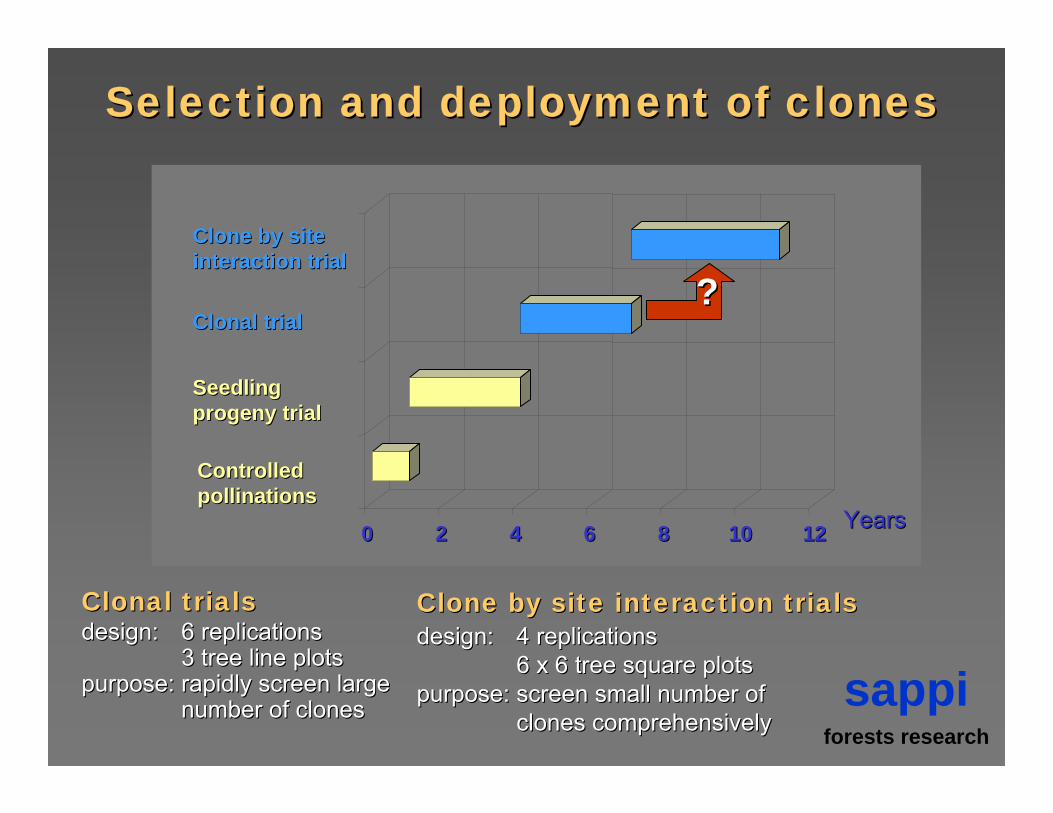
Selection and deployment of clonesSelection and deployment of clones
00 22 44 66 88 1010 1212 YearsYears
ControlledControlledpollinationspollinations
SeedlingSeedlingprogeny trialprogeny trial
Clonal trialClonal trial
Clone by site Clone by site interaction trialinteraction trial
Clonal trialsClonal trialsdesign: design: 6 replications6 replications
3 tree line plots3 tree line plotspurpose: rapidly screen large purpose: rapidly screen large
number of clonesnumber of clones
Clone by site interaction trialsClone by site interaction trialsdesign: design: 4 replications4 replications
6 x 6 tree square plots6 x 6 tree square plotspurpose: screen small number of purpose: screen small number of
clones comprehensivelyclones comprehensively
??

forests research
sappi
ObjectiveObjective
to evaluate the effect of to evaluate the effect of differentdifferent plot size/typeplot size/type
on clonal rankingon clonal ranking
forests research
sappi
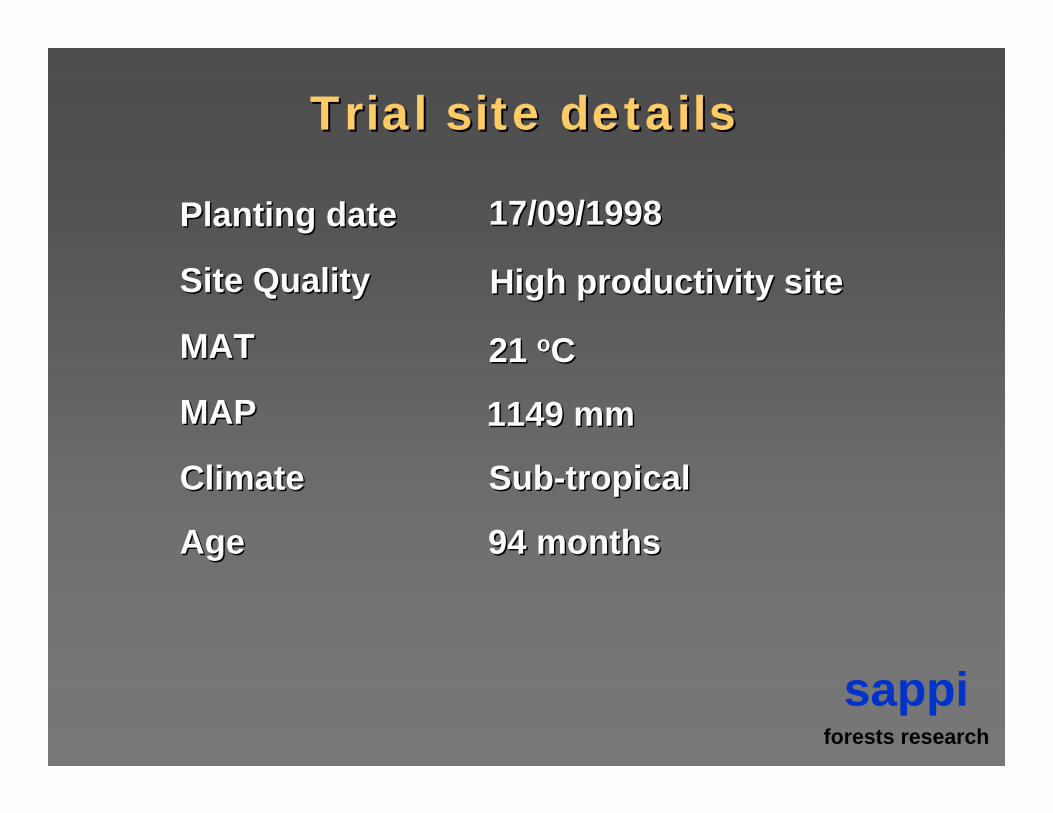
Trial site detailsTrial site details
Site QualitySite Quality
Planting datePlanting date
MAT MAT
MAPMAP
AgeAge
17/09/199817/09/1998
21 21 ooCC
1149 mm1149 mm
94 months94 months
High productivity siteHigh productivity site
ClimateClimate SubSub--tropicaltropical
forests research
sappi
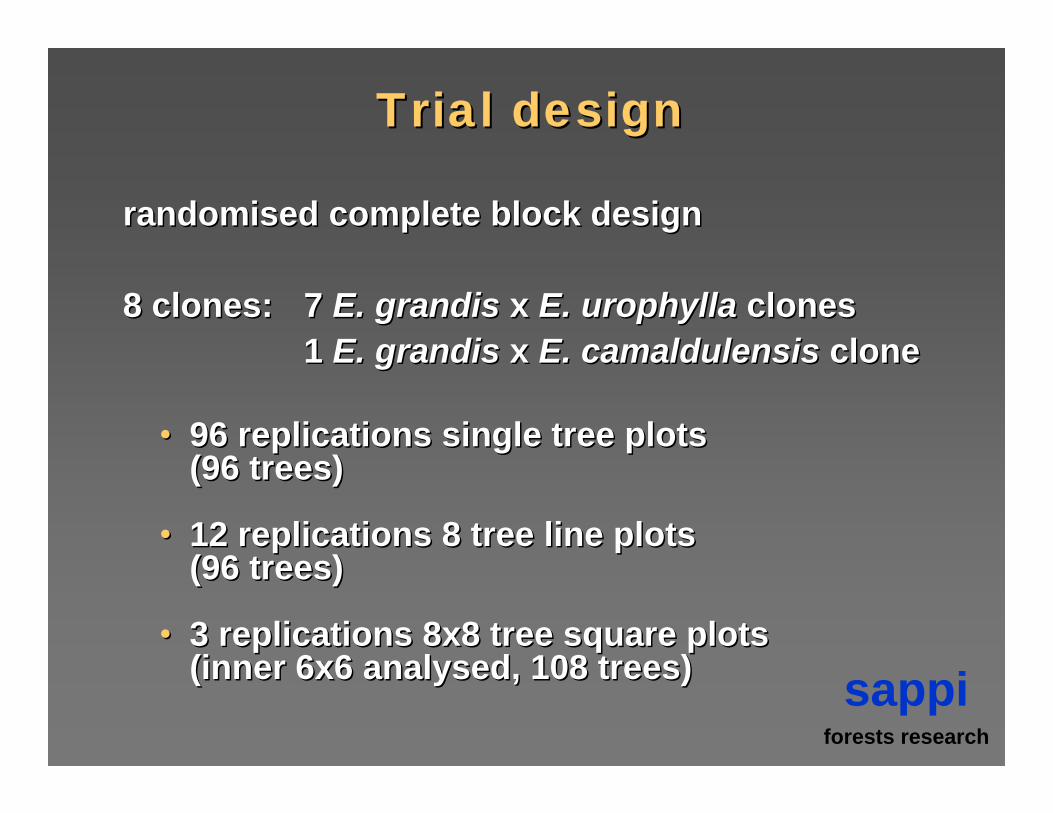
Trial designTrial design
randomised complete block design randomised complete block design
8 clones: 8 clones: 7 7 E. grandisE. grandis x x E. urophyllaE. urophylla clonesclones1 1 E. grandisE. grandis x x E. camaldulensisE. camaldulensis cloneclone
•• 96 replications single tree plots 96 replications single tree plots (96 trees)(96 trees)
•• 12 replications 8 tree line plots 12 replications 8 tree line plots (96 trees)(96 trees)
•• 3 replications 8x8 tree square plots3 replications 8x8 tree square plots(inner 6x6 analysed, 108 trees)(inner 6x6 analysed, 108 trees)
forests research
sappi
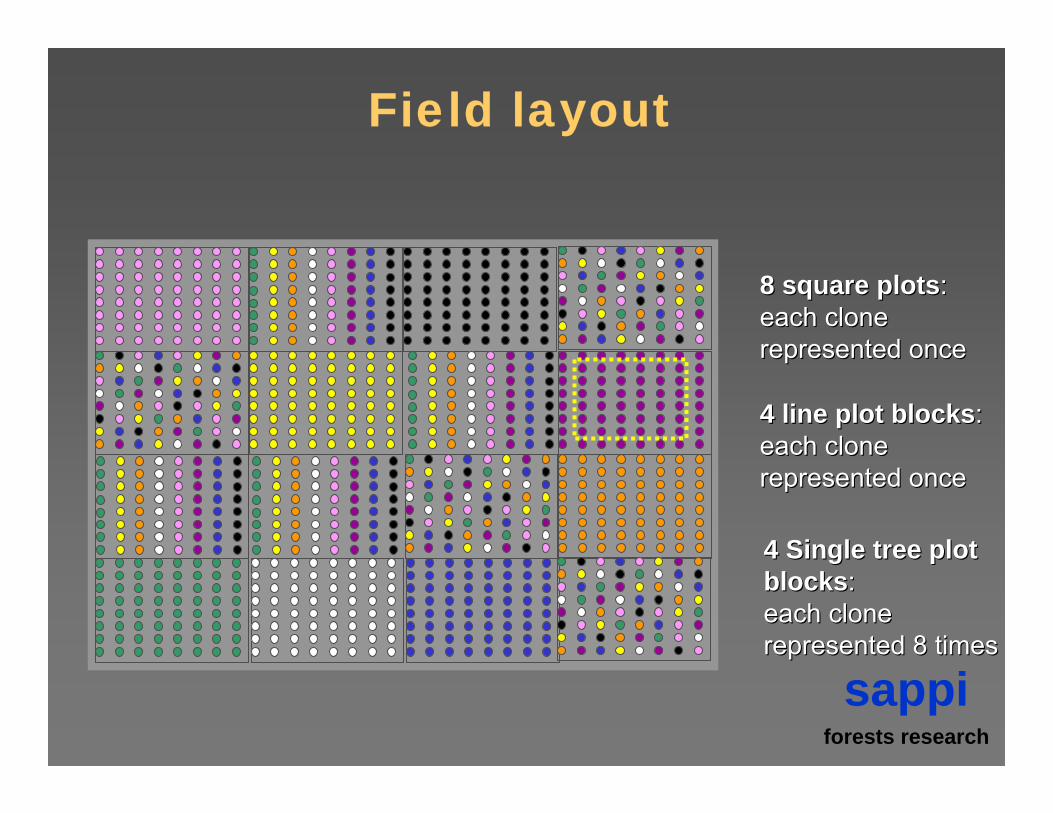
Field layout
8 square plots8 square plots: : each clone each clone represented oncerepresented once
4 line plot blocks4 line plot blocks: : each clone each clone represented once represented once
4 Single tree plot 4 Single tree plot blocksblocks: : each clone each clone represented 8 timesrepresented 8 times

forests research
sappi
Clonal heritabilityClonal heritability
HH22 = σ= σ22cloneclone /(σ/(σ22
cloneclone +σ+σ22plotplot /b + σ/b + σ22
ww/nb)/nb)
Environmental portion of the variance Environmental portion of the variance of a clonal meanof a clonal mean
EEcc meanmean = σ= σ22plotplot/b + σ/b + σ22
ww/nb/nb
Relative efficiency of a designRelative efficiency of a design
RE = RE = EEcc meanmean STP / STP / EEcc meanmean designdesign
where n = number of trees/plotwhere n = number of trees/plotb = number of repsb = number of reps
(Loo(Loo--Dinkins & Tauer, 1987)Dinkins & Tauer, 1987)
Parameters calculated
forests research
sappi
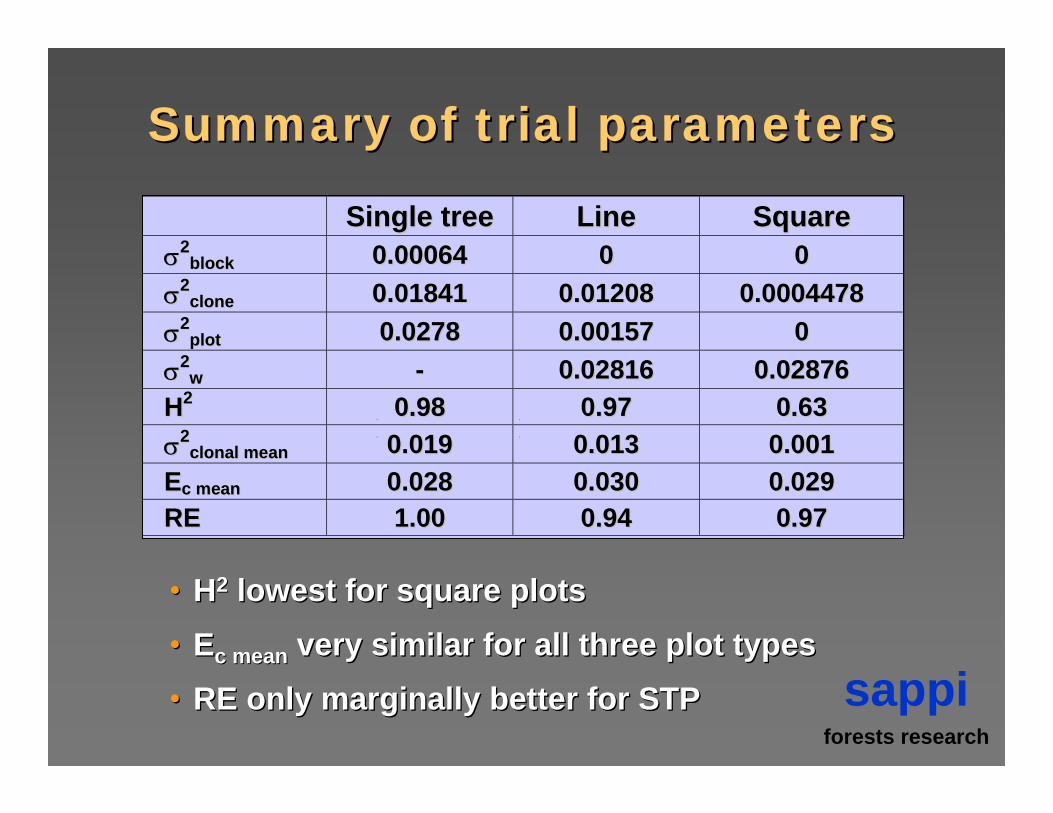
SSiinnggllee ttrreeee LLiinnee SSqquuaarree σσ22
bblloocckk 00..0000006644 00 00 σσ22
cclloonnee 00..0011884411 00..0011220088 00..00000044447788 σσ22
pplloott 00..00227788 00..0000115577 00 σσ22
ww -- 00..0022881166 00..0022887766 HH22 00..9988 00..9977 00..6633 σσ22
cclloonnaall mmeeaann 00..001199 00..001133 00..000011 EEcc mmeeaann 00..002288 00..003300 00..002299 RREE 11..0000 00..9944 00..9977
Summary of trial parametersSummary of trial parameters
•• HH22 lowest for square plotslowest for square plots
•• EEcc meanmean very similar for all three plot typesvery similar for all three plot types
•• RE only marginally better for STPRE only marginally better for STP

forests research
sappi
0.00
0.10
0.20
0.30
0.40
0.50
0.60
STP LP SQP
Plot Type
Mea
n Tr
ee V
olum
e (m
3 ) GU1GU2GU3GU4GU5GU6GU7GC1
Mean volume at 94 months for each Mean volume at 94 months for each clone for the three different plot typesclone for the three different plot types
rrss = 0.98= 0.98 rrss = 0.57= 0.57

forests research
sappi
Trial resultsTrial results
0.046920.046920.049260.049260.053710.05371LSDLSD0.050.05
0.28770.28770.29150.29150.30430.3043MeanMean770.24990.2499880.13660.1366880.12030.1203GC1GC1660.28740.2874770.14740.1474770.15990.1599GU7GU7440.29100.2910550.27230.2723660.22500.2250GU6GU6880.24690.2469660.23180.2318550.23710.2371GU5GU5220.31450.3145440.30170.3017440.31800.3180GU4GU4110.31780.3178330.37770.3777330.39190.3919GU3GU3550.28780.2878220.39430.3943220.41800.4180GU2GU2330.30810.3081110.43800.4380110.52450.5245GU1GU1
RankRankVol94Vol94RankRankVol94Vol94RankRankVol94Vol94CloneClone
Square PlotSquare PlotLine PlotLine PlotSingle Tree PlotSingle Tree Plot

forests research
sappi 0.28770.28770.29940.29940.30430.3043MeanMean
--13%13%0.24990.2499--59%59%0.12400.1240--0.1800.1800.12030.1203GC1GC10%0%0.28740.2874--46%46%0.16280.1628--0.1420.1420.15990.1599GU7GU71%1%0.29100.2910--24%24%0.22660.2266--0.0780.0780.22500.2250GU6GU6
--14%14%0.24690.2469--20%20%0.23840.2384--0.0660.0660.23710.2371GU5GU59%9%0.31450.31456%6%0.31770.31770.0130.0130.31800.3180GU4GU4
10%10%0.31780.317830%30%0.39010.39010.0860.0860.39190.3919GU3GU30%0%0.28780.287839%39%0.41570.41570.1110.1110.41800.4180GU2GU27%7%0.30810.308174%74%0.52010.52010.2160.2160.52450.5245GU1GU1
Realized Realized GainGain
Actual Actual YieldYield
Predict Predict GainGain
Predict Predict YieldYield
GainGainSTPSTPCloneClone
Predicted gain from single tree plots vs. Predicted gain from single tree plots vs. realized gain from square plotsrealized gain from square plots
•• Gains predicted using STP data were Gains predicted using STP data were overestimatesoverestimates

forests research
sappi
DiscussionDiscussion
The The rrss = 0.57 between the single tree and square = 0.57 between the single tree and square plots, suggests a genotype by plot type plots, suggests a genotype by plot type interaction.interaction.
competition environmentcompetition environment
•• genetically dissimilar genetically dissimilar genotypes genotypes
•• single tree and line plots single tree and line plots •• in the competition in the competition
environment the sharing of environment the sharing of resources can never be resources can never be equal, as the interacting equal, as the interacting plants are genetically plants are genetically differentdifferent
crop environmentcrop environment
•• genetically identical genetically identical genotypesgenotypes
•• square plotssquare plots•• in a crop environment in a crop environment
resources are shared resources are shared evenly by all plants, evenly by all plants, thus the yield of all thus the yield of all plants is evenly plants is evenly suppressedsuppressed

forests research
sappi
DiscussionDiscussion (continued)(continued)
Gains are overestimated in single tree and line Gains are overestimated in single tree and line plotsplots
The best performers in a competition environment The best performers in a competition environment are the strongest competitorsare the strongest competitors
Results have shown that they can be poorer yield Results have shown that they can be poorer yield producers in pure standsproducers in pure stands
A much younger follow up trial with 25 clones is A much younger follow up trial with 25 clones is showing similar trendsshowing similar trends

forests research
sappi
ConclusionsConclusionsFor clones in coastal Zululand, square/rectangular For clones in coastal Zululand, square/rectangular plots may be the most reliable and efficient way of plots may be the most reliable and efficient way of identifying suitable commercial clones.identifying suitable commercial clones.
Based on field experience, the arguments of Based on field experience, the arguments of Fasoula and Fasoula (1997) with regard to crop Fasoula and Fasoula (1997) with regard to crop breeding, warrant further investigation in forestry.breeding, warrant further investigation in forestry.
Clonal forestry with eucalypts offers an opportunity Clonal forestry with eucalypts offers an opportunity to further understand some of the mechanisms that to further understand some of the mechanisms that may be involved in “between genotype” may be involved in “between genotype” competition.competition.
forests research
sappi