Embed Size (px)
Citation preview

Mastertitelformat bearbeiten
CEOS 2010
SAR Performance of TerraSAR-X Mission with Two SatellitesBenjamin Bräutigam, Paola Rizzoli, Carolina González, Donata Polimeni, Dirk Schrank, Marco SchwerdtGerman Aerospace Center (DLR)Microwaves and Radar Institute
2CEOS 2010
StripMap Mode SpotLight Mode ScanSAR Mode
TerraSAR-X:• German Earth observation SAR satellite • X-band @ 9.65 GHz• 514 km dusk/dawn orbit• Multi-mode highly flexible operation• Public Private Partnership (PPP)• Launched on June 15 2007
Resolution: 1.5 m 1.5 mScene Size: 10 km x 5..10 km
Resolution: 3.3 m 3.3 mScene Size: 30 km x 50 km
Resolution: 17 m 18 mScene Size: 100 km x 150 km
3CEOS 2010
TerraSAR-X SAR System Parameters
Satellite TelemetryOrbit/attitude data (Doppler statistics)
Instrument temperatures
SAR Image ParametersRange of scene size and incidence angles
Resolution (geometric and radiometric)
Performance Parameters (PSLR/ISLR, NESZ)
4CEOS 2010
4.8 m
0.75
m
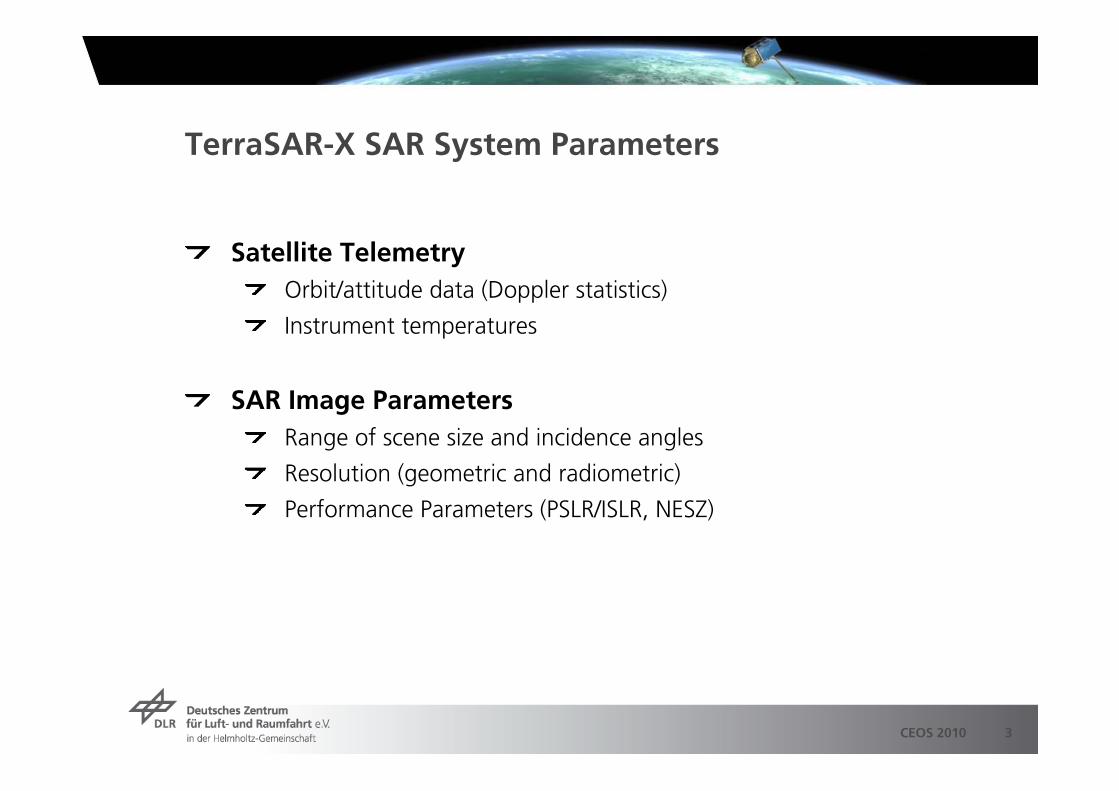
TerraSAR-X – Beam Specification
10 kmSingleDual
SpotlightHighRes
91 full perf122 total
Spotlight
15 km (15°-50°)13,5 km (50°-60°)
DualStripmap24 full perf54 total
Stripmap Near / Far
30 km (15°-50°)27 km (50°-60°)
SingleStripmapScanSAR
12 full perf27 total
Stripmap
Swath WidthPolarisationSAR Modes# of BeamsBeam Type
Over 1000 product variants -> Performance status over a sample!
Active phase antenna array
...1 2 3 12
12 panels in theazimuth direction
32 sub-arrayantennas per panel...
Electronic steering and shaping of acquisition beams (elevation and azimuth):
5CEOS 2010
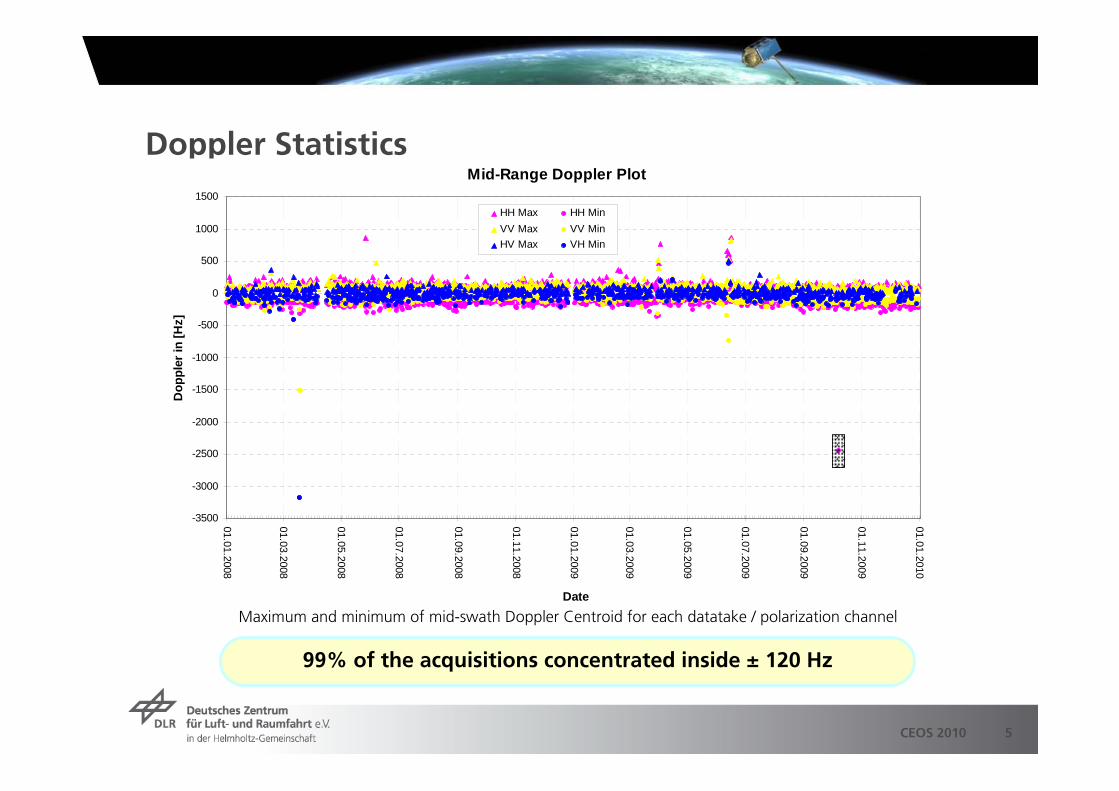
Doppler Statistics
99% of the acquisitions concentrated inside ± 120 Hz
Mid-Range Doppler Plot
-3500
-3000
-2500
-2000
-1500
-1000
-500
0
500
1000
1500
01.01.2008
01.03.2008
01.05.2008
01.07.2008
01.09.2008
01.11.2008
01.01.2009
01.03.2009
01.05.2009
01.07.2009
01.09.2009
01.11.2009
01.01.2010
Date
Dop
pler
in [H
z]
HH Max HH MinVV Max VV MinHV Max VH Min
Maximum and minimum of mid-swath Doppler Centroid for each datatake / polarization channel
6CEOS 2010
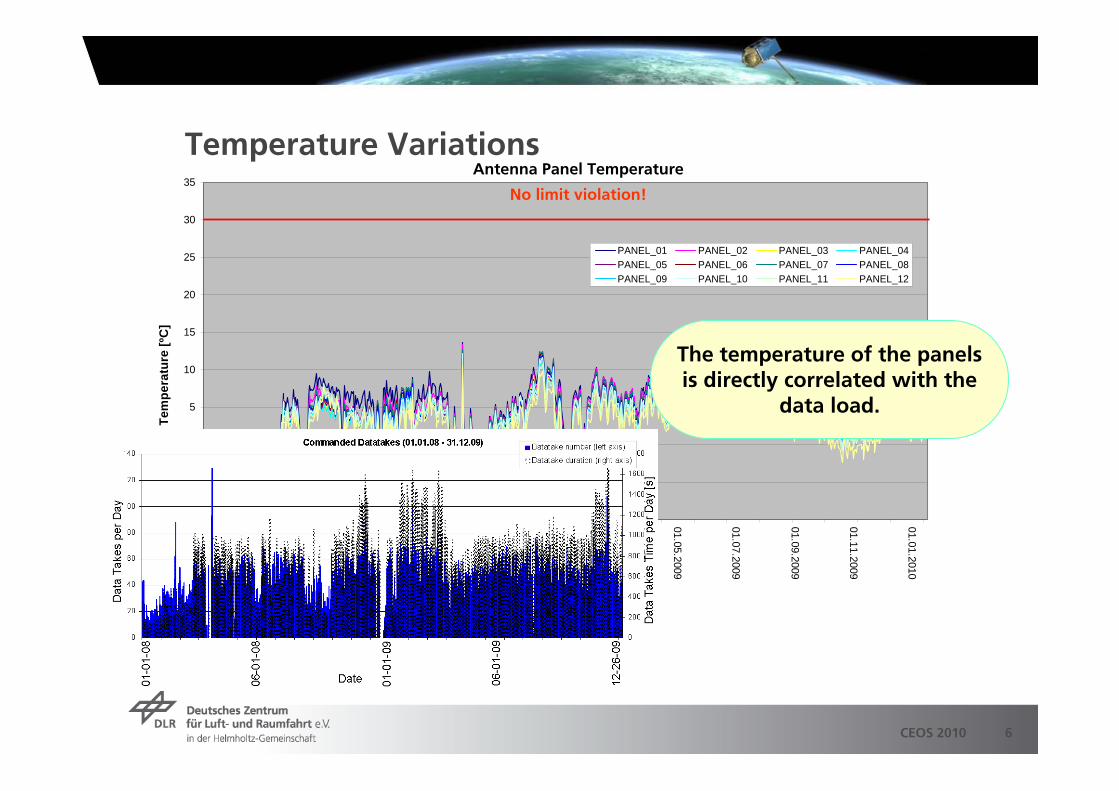
Temperature Variations
-10
-5
0
5
10
15
20
25
30
35
01-01-08
03-02-08
07-03-08
09-04-08
12-05-08
14-06-08
17-07-08
19-08-08
21-09-08
24-10-08
26-11-08
29-12-08
31-01-09
05-03-09
07-04-09
10-05-09
12-06-09
15-07-09
17-08-09
19-09-09
22-10-09
24-11-09
27-12-09
Date
Tem
pera
ture
[ºC
]
PANEL_01 PANEL_02 PANEL_03 PANEL_04PANEL_05 PANEL_06 PANEL_07 PANEL_08PANEL_09 PANEL_10 PANEL_11 PANEL_12
Antenna Panel Temperature
No limit violation!
01.01.2008
01.03.2008
01.05.2008
01.07.2008
01.09.2008
01.11.2008
01.01.2009
01.03.2009
01.05.2009
01.07.2009
01.09.2009
01.11.2009
01.01.2010
Date
The temperature of the panelsis directly correlated with the
data load.
7CEOS 2010
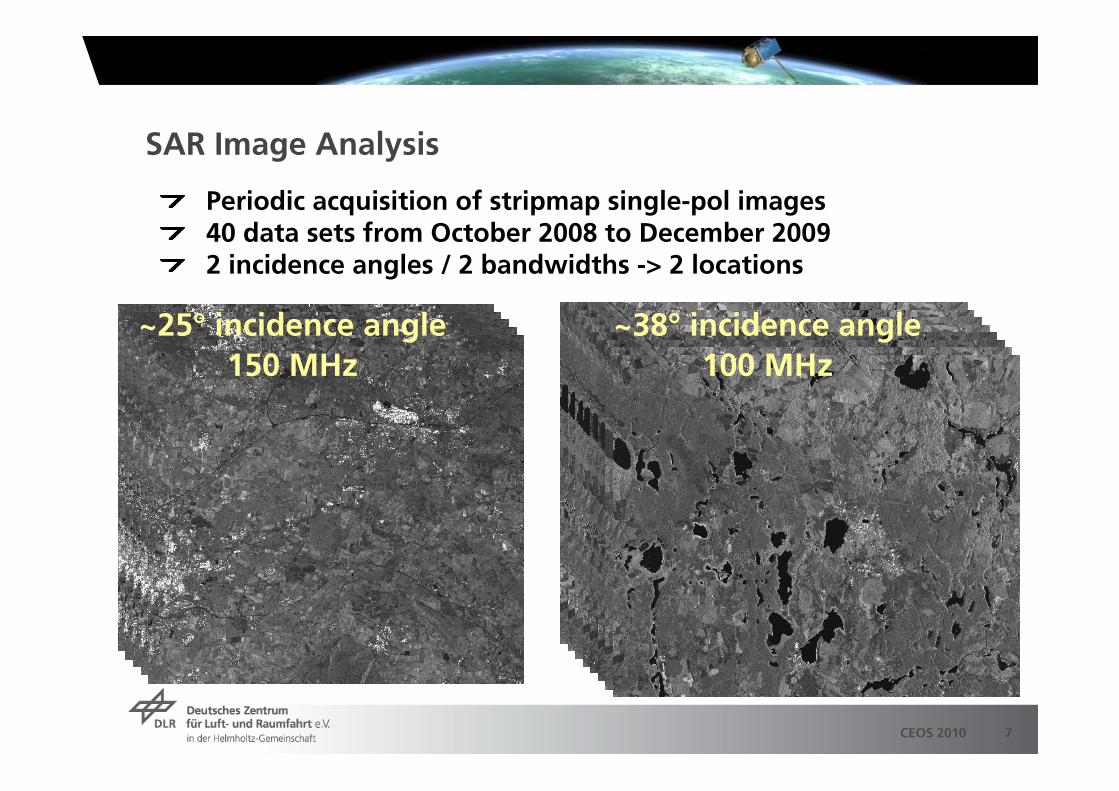
SAR Image Analysis
Periodic acquisition of stripmap single-pol images40 data sets from October 2008 to December 20092 incidence angles / 2 bandwidths -> 2 locations
~25° incidence angle150 MHz
~38° incidence angle100 MHz
8CEOS 2010
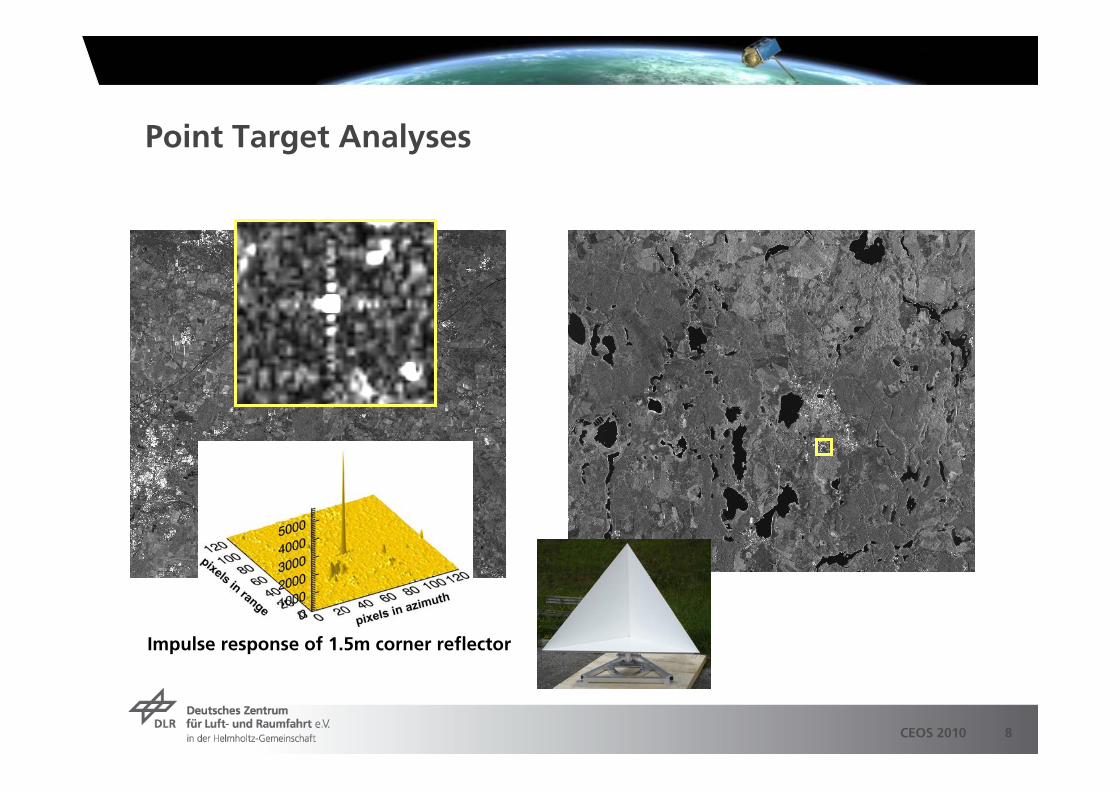
Point Target Analyses
Impulse response of 1.5m corner reflector
9CEOS 2010
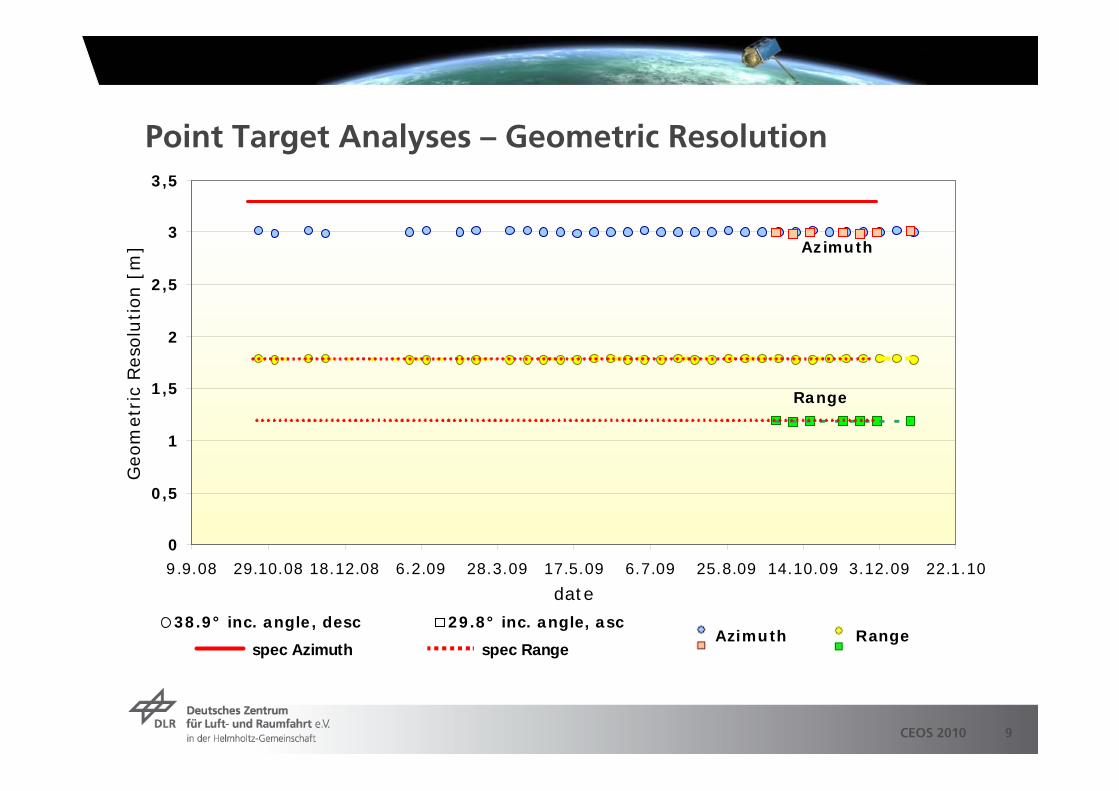
Point Target Analyses – Geometric Resolution
0
0,5
1
1,5
2
2,5
3
3,5
9.9.08 29.10.08 18.12.08 6.2.09 28.3.09 17.5.09 6.7.09 25.8.09 14.10.09 3.12.09 22.1.10
date
Geom
etr
ic R
eso
lution [
m]
38.9° inc. angle, desc 29.8° inc. angle, asc
Azimuth
Range
RangeAzimuthspec Azimuth spec Range
10CEOS 2010
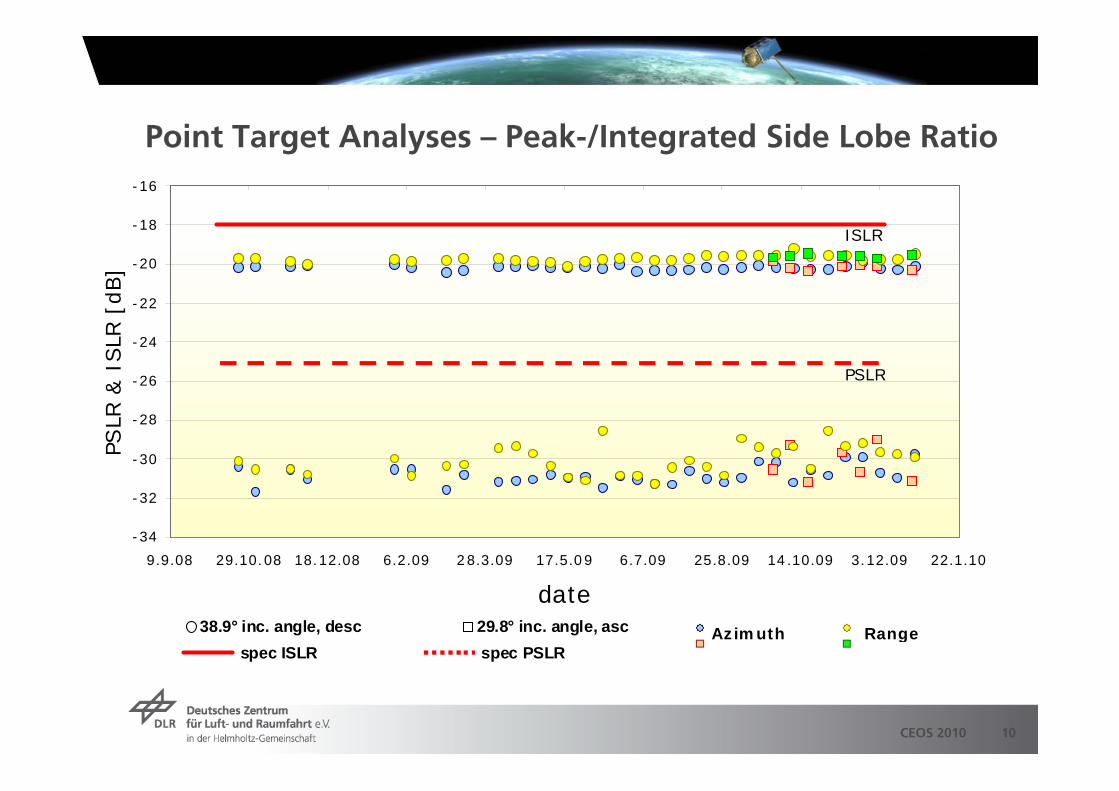
Point Target Analyses – Peak-/Integrated Side Lobe Ratiog
-34
-32
-30
-28
-26
-24
-22
-20
-18
-16
9.9.08 29.10.08 18.12.08 6.2.09 28.3.09 17.5.09 6.7.09 25.8.09 14.10.09 3.12.09 22.1.10
date
PSLR
& I
SLR
[dB]
38.9° inc. angle, desc 29.8° inc. angle, asc
ISLR
PSLR
RangeAzimuthspec ISLR spec PSLR
11CEOS 2010
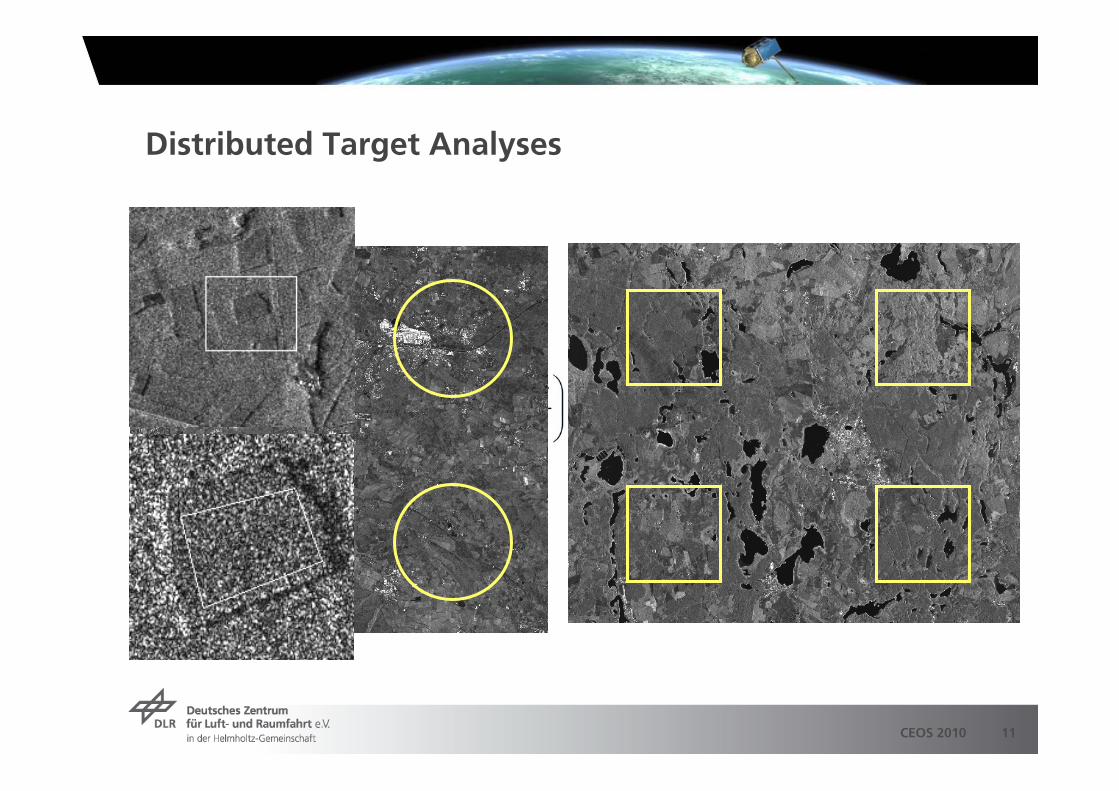
Distributed Target Analyses
12CEOS 2010
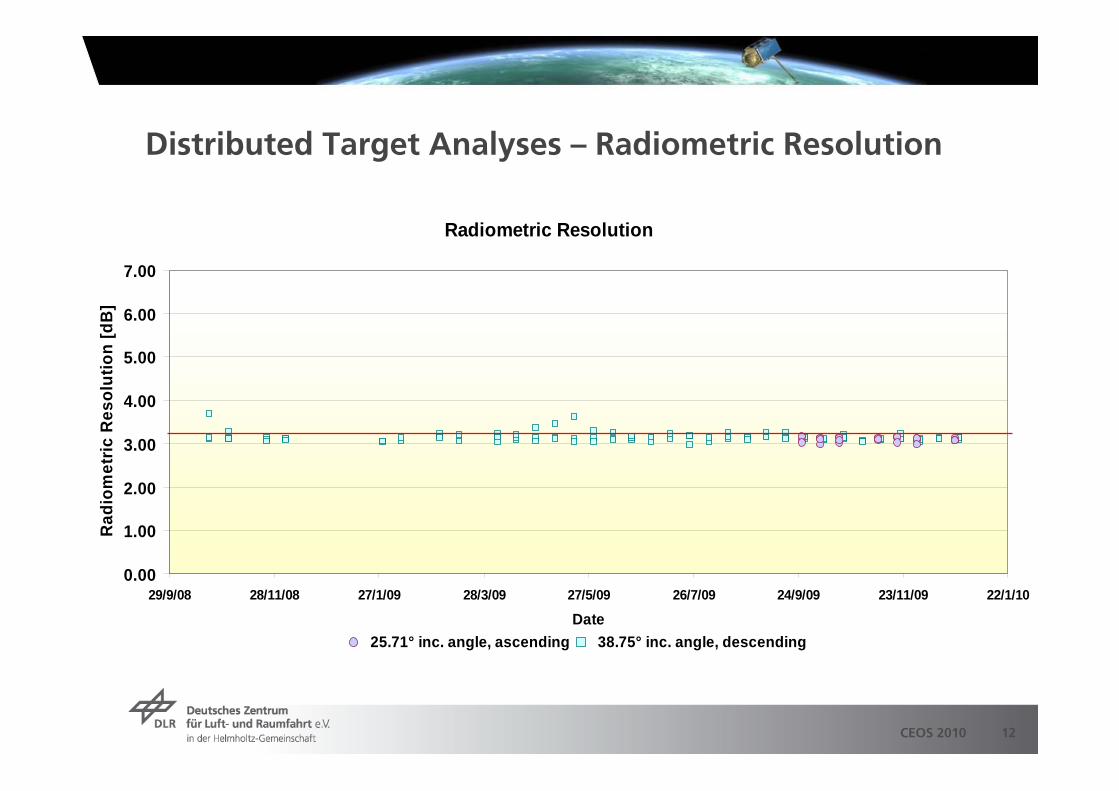
Distributed Target Analyses – Radiometric Resolution
Radiometric Resolution
0.00
1.00
2.00
3.00
4.00
5.00
6.00
7.00
29/9/08 28/11/08 27/1/09 28/3/09 27/5/09 26/7/09 24/9/09 23/11/09 22/1/10
Date
Rad
iom
etric
Res
olut
ion
[dB
]
25.71° inc. angle, ascending 38.75° inc. angle, descending
13CEOS 2010
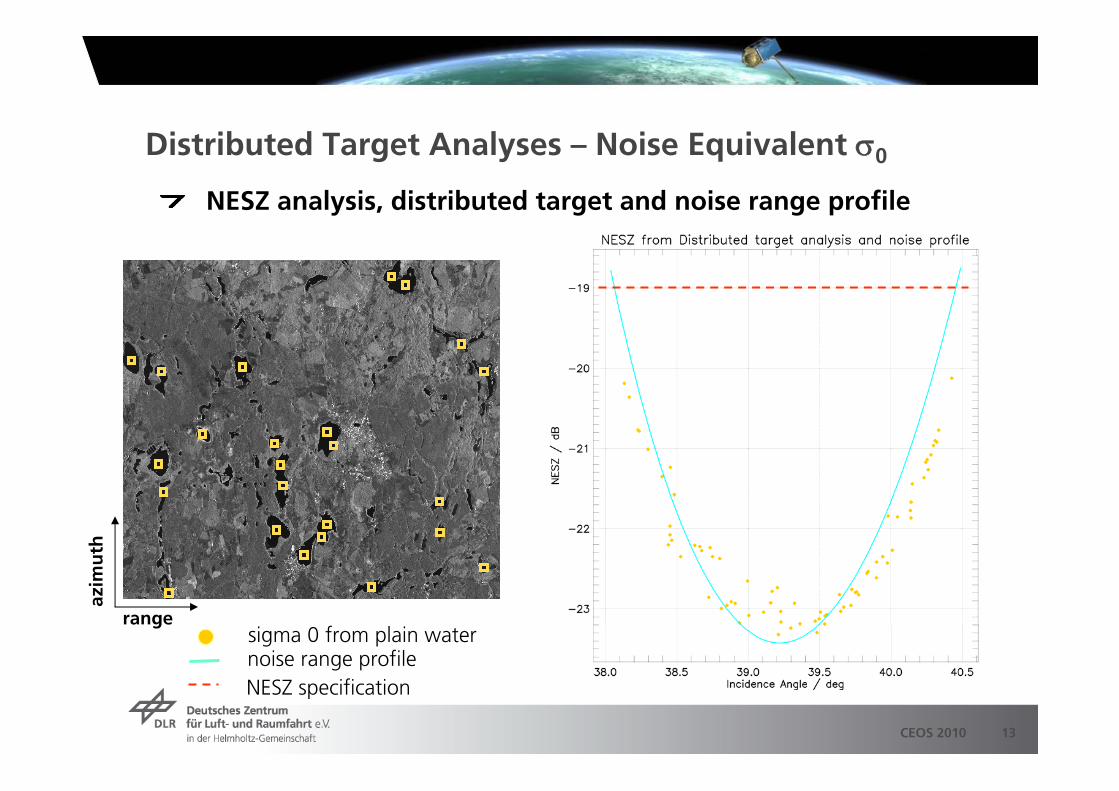
Distributed Target Analyses – Noise Equivalent 0
NESZ analysis, distributed target and noise range profile
range
azim
uth
noise range profilesigma 0 from plain water
NESZ specification
14CEOS 2010
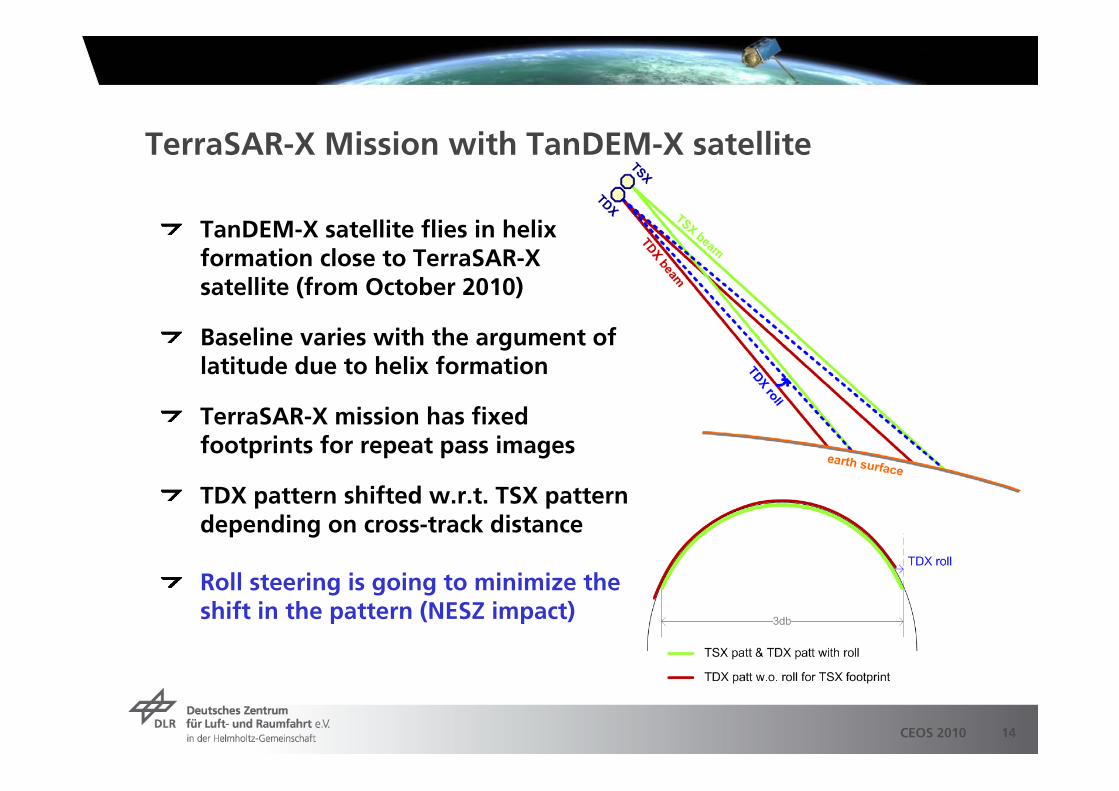
TerraSAR-X Mission with TanDEM-X satellite
TanDEM-X satellite flies in helixformation close to TerraSAR-X satellite (from October 2010)
Baseline varies with the argument of latitude due to helix formation
TerraSAR-X mission has fixedfootprints for repeat pass images
TDX pattern shifted w.r.t. TSX patterndepending on cross-track distance
Roll steering is going to minimize theshift in the pattern (NESZ impact)
15CEOS 2010
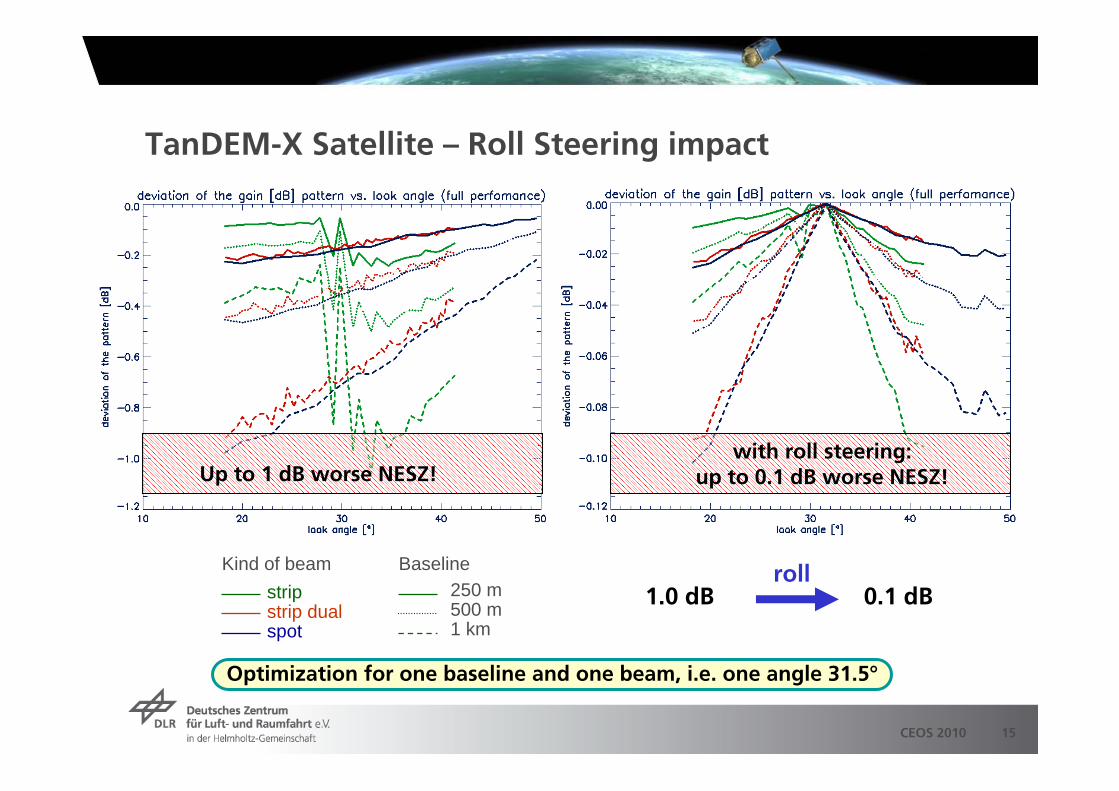
TanDEM-X Satellite – Roll Steering impact
Baseline250 m500 m1 km
Kind of beamstripstrip dualspot
Optimization for one baseline and one beam, i.e. one angle 31.5°
roll1.0 dB 0.1 dB
Up to 1 dB worse NESZ!with roll steering:
up to 0.1 dB worse NESZ!
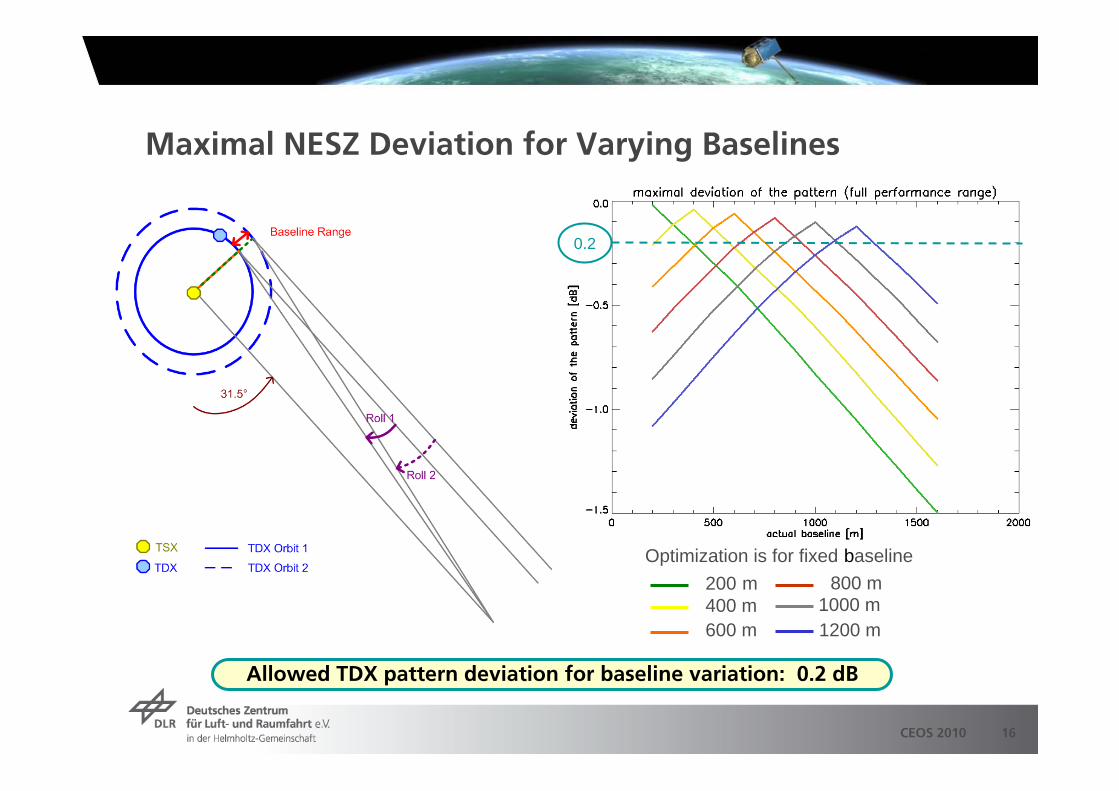
16CEOS 2010
Allowed TDX pattern deviation for baseline variation: 0.2 dB
Maximal NESZ Deviation for Varying Baselines
Optimization is for fixed baseline
400 m600 m
800 m1000 m1200 m
200 m
0.2

17CEOS 2010
Conclusions
TerraSAR-X is in orbit since 2007
Over 40000 images have been successfully commanded and aquired
SAR system is being monitored for its performance and instrumentstability:
Doppler and Temperature statistics
Point Target Analyses
Distributed Target Analyses
The system shows no trends or performance degradation
With the extension of the mission by the TanDEM-X satellite, the roll steering technique will keep the product performance.