Embed Size (px)
Citation preview
Portola-Butler Continuation High
By February 1 of each year, every school in California is required by state law to publish a School Accountability Report Card (SARC).The SARC contains information aboutthe condit ion and performance of each California public school. Under the Local Control Funding Formula (LCFF) all local educat ional agencies (LEAs) are required toprepare a Local Control Accountability Plan (LCAP), which describes how they intend to meet annual school-specific goals for all pupils, w ith specific act ivit ies to addressstate and local priorit ies. Addit ionally, data reported in an LCAP is to be consistent w ith data reported in the SARC.
For more information about SARC requirements, see the California Department of Educat ion (CDE) SARC Web page at http://www.cde.ca.gov/ta/ac/sa/.
For more information about the LCFF or LCAP, see the CDE LCFF Web page at http://www.cde.ca.gov/fg/aa/lc/.
For addit ional information about the school, parents/guardians, and community members should contact the school principal or the district office.
DataQuest
Internet Access
California Department of Education
School Accountability Report CardReported Using Data from the 2015-16 School Year
DataQuest is an online data tool located on the CDE DataQuest Web page that contains addit ional information about this school and comparisons of the school tothe district and the county. Specifically, DataQuest is a dynamic system that provides reports for accountability (e.g., test data, enrollment, high school graduates,dropouts, course enrollments, staffing, and data regarding English learners).
Internet access is available at public libraries and other locat ions that are publicly accessible (e.g., the California State Library). Access to the Internet at librariesand public locat ions is generally provided on a first-come, first-served basis. Other use restrict ions may include the hours of operat ion, the length of t ime that aworkstat ion may be used (depending on availability), the types of software programs available on a workstat ion, and the ability to print documents.
Dr. Steven James, DirectorPrincipal, Portola-Butler Continuation High
Portola-But ler is a place where students have a unique opportunity to be responsible for their success. Here they canachieve their goal of a high school diploma in a smaller sett ing w ith highly qualified, caring teachers and support staff. Thecurriculum is rigorous and relevant and prepares our students to be college and/or career ready. Every student hasenrolled at PBHS for his/her own reasons, yet each person has the desire to earn enough credits to graduate, receive adiploma and make a posit ive start toward a successful future. When you make responsible choices everyday, you w ill reachyour goals. We are eager to help you on your path of complet ing your educat ion and facing the new challenges thatawait you.
Portola-But ler Cont inuat ion High760 Broadway St.King City, CA 93930-3311
Phone: 831-385-4661E-mail: [email protected]
About Our SchoolAbout Our School
ContactContact
Last updated: 1/17/2017
Last updated: 1/17/2017
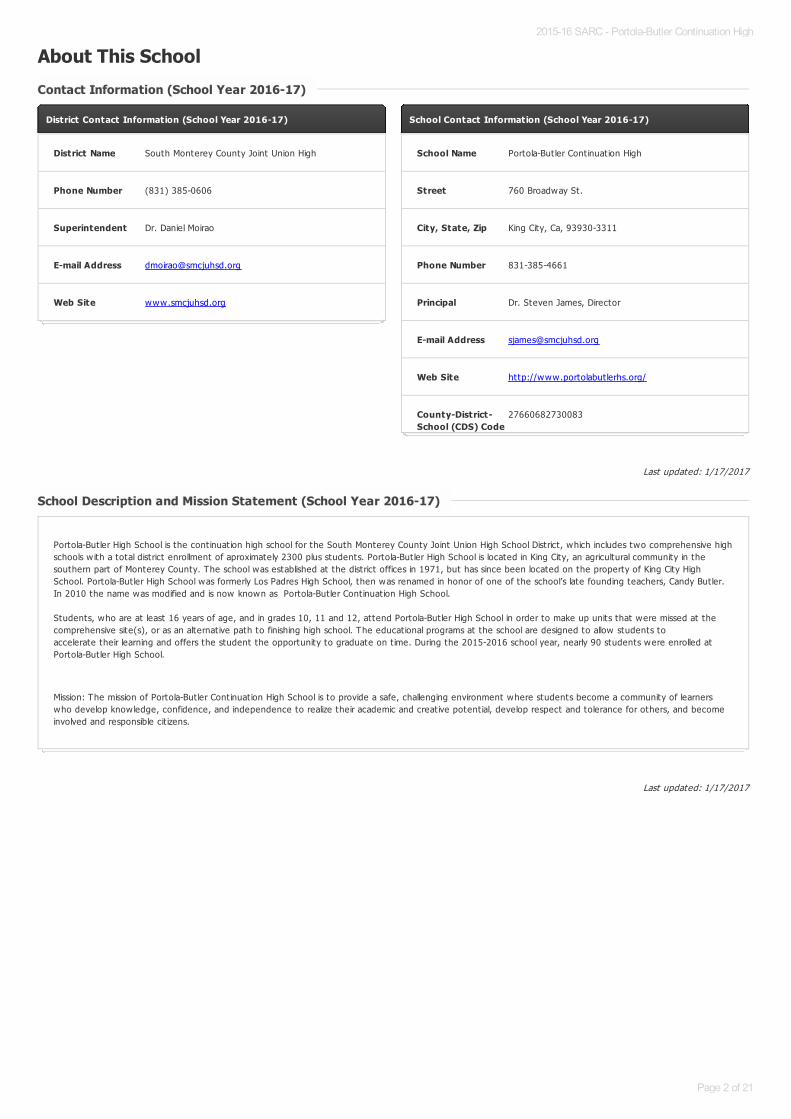
About This School
Contact Information (School Year 2016-17)Contact Information (School Year 2016-17)
District Contact Information (School Year 2016-17)
District Name South Monterey County Joint Union High
Phone Number (831) 385-0606
Superintendent Dr. Daniel Moirao
E-mail Address [email protected]
Web Site www.smcjuhsd.org
School Contact Information (School Year 2016-17)
School Name Portola-But ler Cont inuat ion High
Street 760 Broadway St.
City, State, Zip King City, Ca, 93930-3311
Phone Number 831-385-4661
Principal Dr. Steven James, Director
E-mail Address [email protected]
Web Site http://www.portolabut lerhs.org/
County-District-School (CDS) Code
27660682730083
School Description and Mission Statement (School Year 2016-17)School Description and Mission Statement (School Year 2016-17)
Portola-But ler High School is the cont inuat ion high school for the South Monterey County Joint Union High School District , which includes two comprehensive highschools w ith a total district enrollment of aproximately 2300 plus students. Portola-But ler High School is located in King City, an agricultural community in thesouthern part of Monterey County. The school was established at the district offices in 1971, but has since been located on the property of King City HighSchool. Portola-But ler High School was formerly Los Padres High School, then was renamed in honor of one of the school’s late founding teachers, Candy But ler.In 2010 the name was modified and is now known as Portola-But ler Cont inuat ion High School.
Students, who are at least 16 years of age, and in grades 10, 11 and 12, attend Portola-But ler High School in order to make up units that were missed at thecomprehensive site(s), or as an alternat ive path to finishing high school. The educat ional programs at the school are designed to allow students toaccelerate their learning and offers the student the opportunity to graduate on t ime. During the 2015-2016 school year, nearly 90 students were enrolled atPortola-But ler High School.
Mission: The mission of Portola-But ler Cont inuat ion High School is to provide a safe, challenging environment where students become a community of learnerswho develop knowledge, confidence, and independence to realize their academic and creat ive potent ial, develop respect and tolerance for others, and becomeinvolved and responsible cit izens.
2015-16 SARC - Portola-Butler Continuation High
Page 2 of 21
Last updated: 1/17/2017
Last updated: 1/18/2017
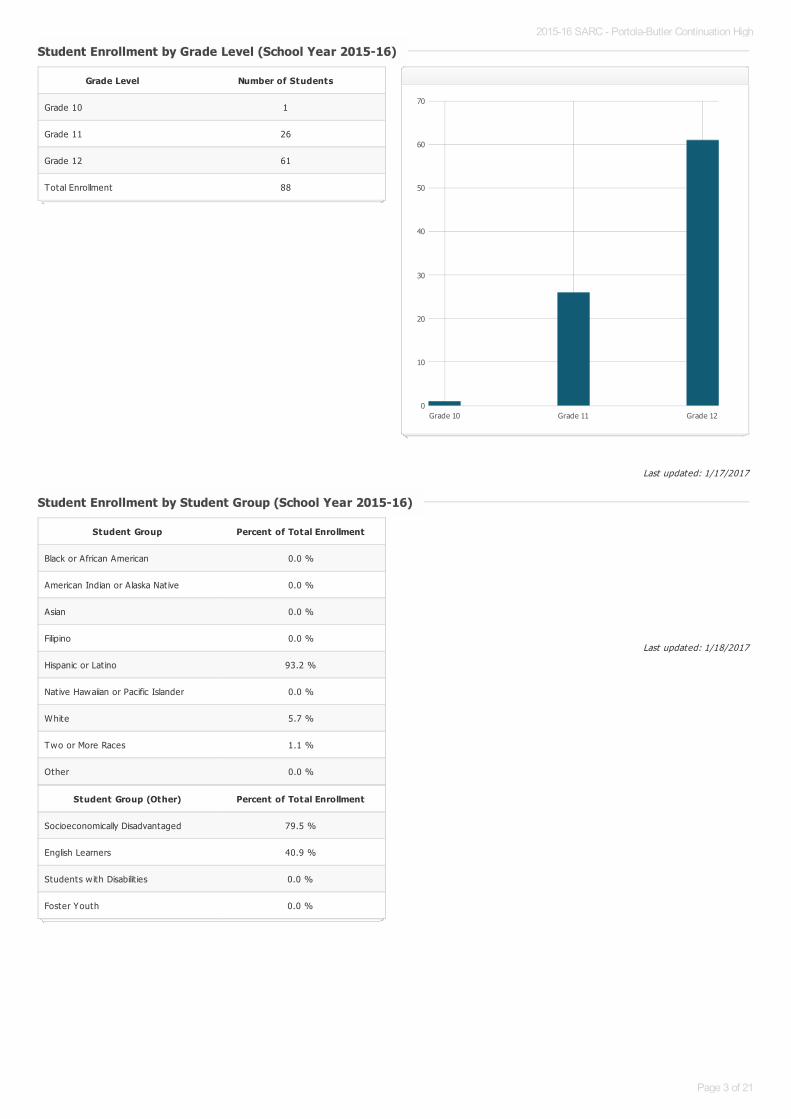
Student Enrollment by Grade Level (School Year 2015-16)Student Enrollment by Grade Level (School Year 2015-16)
Grade Level Number of Students
Grade 10 1
Grade 11 26
Grade 12 61
Total Enrollment 88
Grade 10 Grade 11 Grade 120
10
20
30
40
50
60
70
Student Enrollment by Student Group (School Year 2015-16)Student Enrollment by Student Group (School Year 2015-16)
Student Group Percent of Total Enrollment
Black or African American 0.0 %
American Indian or Alaska Nat ive 0.0 %
Asian 0.0 %
Filipino 0.0 %
Hispanic or Lat ino 93.2 %
Native Hawaiian or Pacific Islander 0.0 %
White 5.7 %
Two or More Races 1.1 %
Other 0.0 %
Student Group (Other) Percent of Total Enrollment
Socioeconomically Disadvantaged 79.5 %
English Learners 40.9 %
Students w ith Disabilit ies 0.0 %
Foster Youth 0.0 %
2015-16 SARC - Portola-Butler Continuation High
Page 3 of 21
Last updated: 1/18/2017
Last updated: 1/18/2017
A. Conditions of Learning
State Priority: Basic
The SARC provides the follow ing information relevant to the State priority: Basic (Priority 1):
Degree to which teachers are appropriately assigned and fully credent ialed in the subject area and for the pupils they are teaching;Pupils have access to standards-aligned instruct ional materials; andSchool facilit ies are maintained in good repair
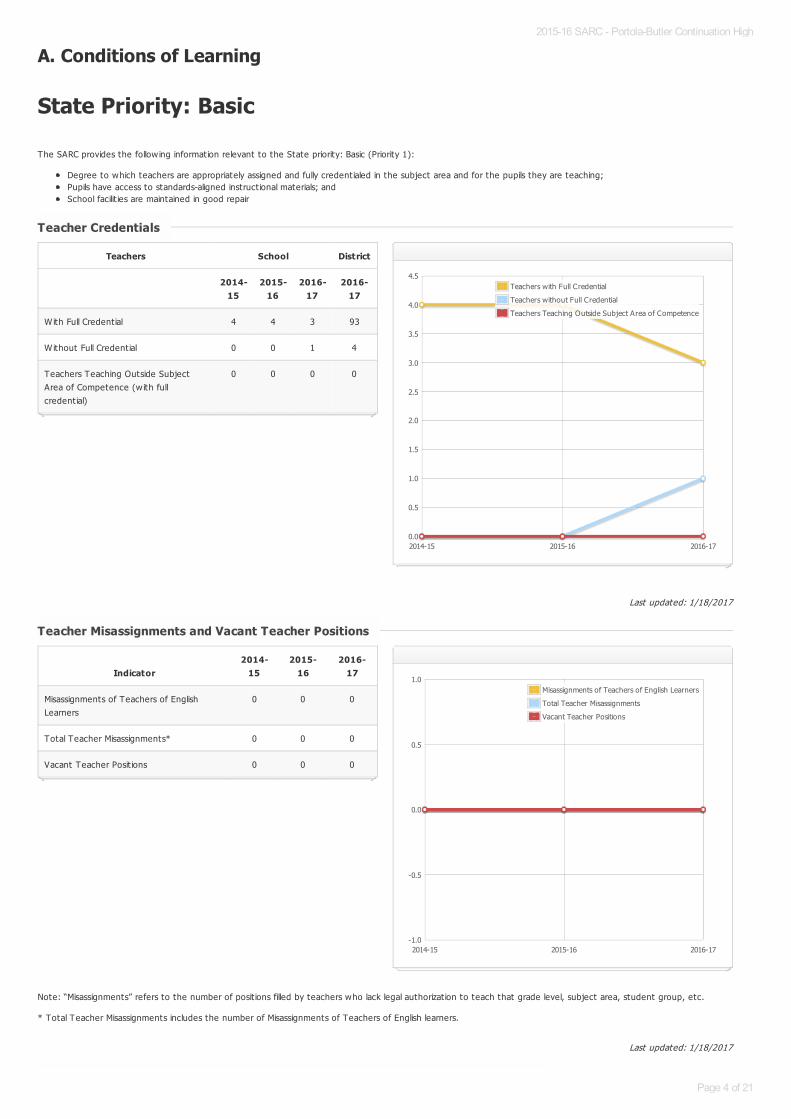
Note: “Misassignments” refers to the number of posit ions filled by teachers who lack legal authorizat ion to teach that grade level, subject area, student group, etc.
* Total Teacher Misassignments includes the number of Misassignments of Teachers of English learners.
Teacher CredentialsTeacher Credentials
Teachers School District
2014-15
2015-16
2016-17
2016-17
With Full Credent ial 4 4 3 93
Without Full Credent ial 0 0 1 4
Teachers Teaching Outside SubjectArea of Competence (w ith fullcredent ial)
0 0 0 0
2014-15 2015-16 2016-170.0
0.5
1.0
1.5
2.0
2.5
3.0
3.5
4.0
4.5Teachers with Full Credential
Teachers without Full Credential
Teachers Teaching Outside Subject Area of Competence
Teacher Misassignments and Vacant Teacher PositionsTeacher Misassignments and Vacant Teacher Positions
Indicator2014-
152015-
162016-
17
Misassignments of Teachers of EnglishLearners
0 0 0
Total Teacher Misassignments* 0 0 0
Vacant Teacher Posit ions 0 0 0
2014-15 2015-16 2016-17-1.0
-0.5
0.0
0.5
1.0Misassignments of Teachers of English Learners
Total Teacher Misassignments
Vacant Teacher Positions
2015-16 SARC - Portola-Butler Continuation High
Page 4 of 21
Last updated: 1/18/2017
Last updated: 1/18/2017
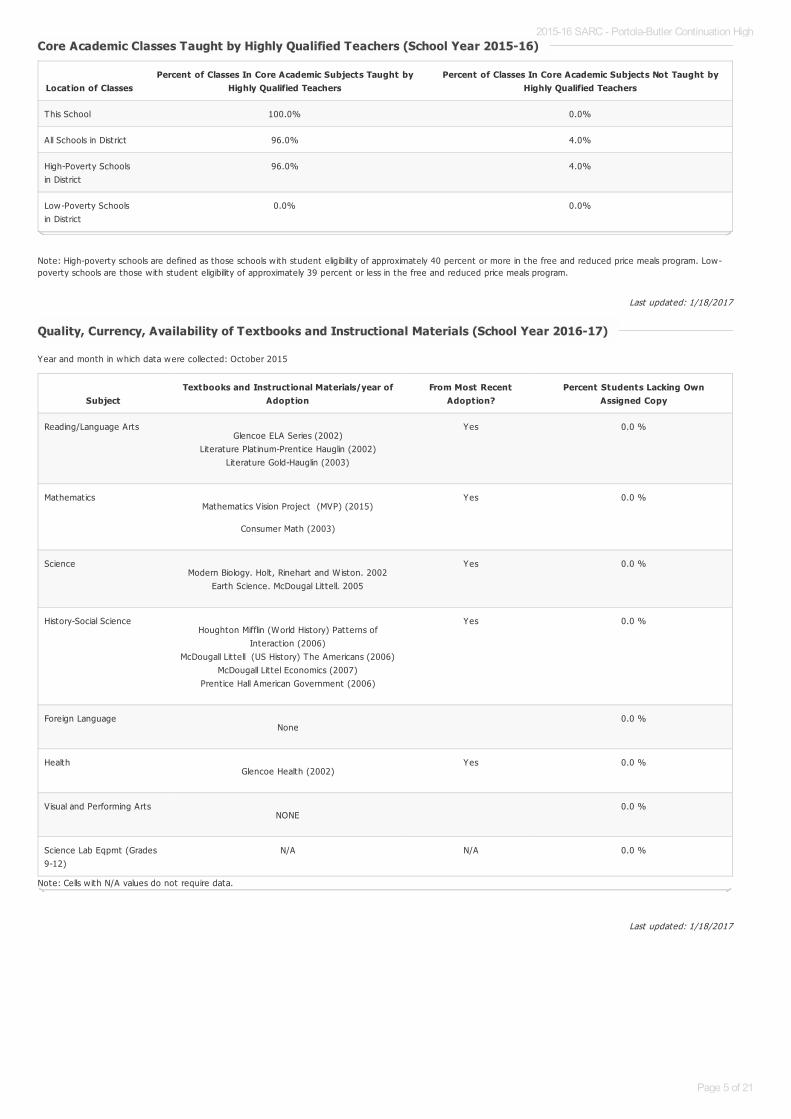
Note: High-poverty schools are defined as those schools w ith student eligibility of approximately 40 percent or more in the free and reduced price meals program. Low-poverty schools are those w ith student eligibility of approximately 39 percent or less in the free and reduced price meals program.
Year and month in which data were collected: October 2015
Core Academic Classes Taught by Highly Qualified Teachers (School Year 2015-16)Core Academic Classes Taught by Highly Qualified Teachers (School Year 2015-16)
Location of ClassesPercent of Classes In Core Academic Subjects Taught by
Highly Qualified TeachersPercent of Classes In Core Academic Subjects Not Taught by
Highly Qualified Teachers
This School 100.0% 0.0%
All Schools in District 96.0% 4.0%
High-Poverty Schoolsin District
96.0% 4.0%
Low-Poverty Schoolsin District
0.0% 0.0%
Quality, Currency, Availability of Textbooks and Instructional Materials (School Year 2016-17)Quality, Currency, Availability of Textbooks and Instructional Materials (School Year 2016-17)
Note: Cells w ith N/A values do not require data.
SubjectTextbooks and Instructional Materials/year of
AdoptionFrom Most Recent
Adoption?Percent Students Lacking Own
Assigned Copy
Reading/Language ArtsGlencoe ELA Series (2002)
Literature Plat inum-Prent ice Hauglin (2002)Literature Gold-Hauglin (2003)
Yes 0.0 %
MathematicsMathematics Vision Project (MVP) (2015)
Consumer Math (2003)
Yes 0.0 %
ScienceModern Biology. Holt , Rinehart and W iston. 2002
Earth Science. McDougal Lit tell. 2005
Yes 0.0 %
History-Social ScienceHoughton Mifflin (World History) Patterns of
Interact ion (2006)McDougall Lit tell (US History) The Americans (2006)
McDougall Lit tel Economics (2007)Prent ice Hall American Government (2006)
Yes 0.0 %
Foreign LanguageNone
0.0 %
HealthGlencoe Health (2002)
Yes 0.0 %
Visual and Performing ArtsNONE
0.0 %
Science Lab Eqpmt (Grades9-12)
N/A N/A 0.0 %
2015-16 SARC - Portola-Butler Continuation High
Page 5 of 21
Last updated: 1/18/2017
Last updated: 2/10/2017
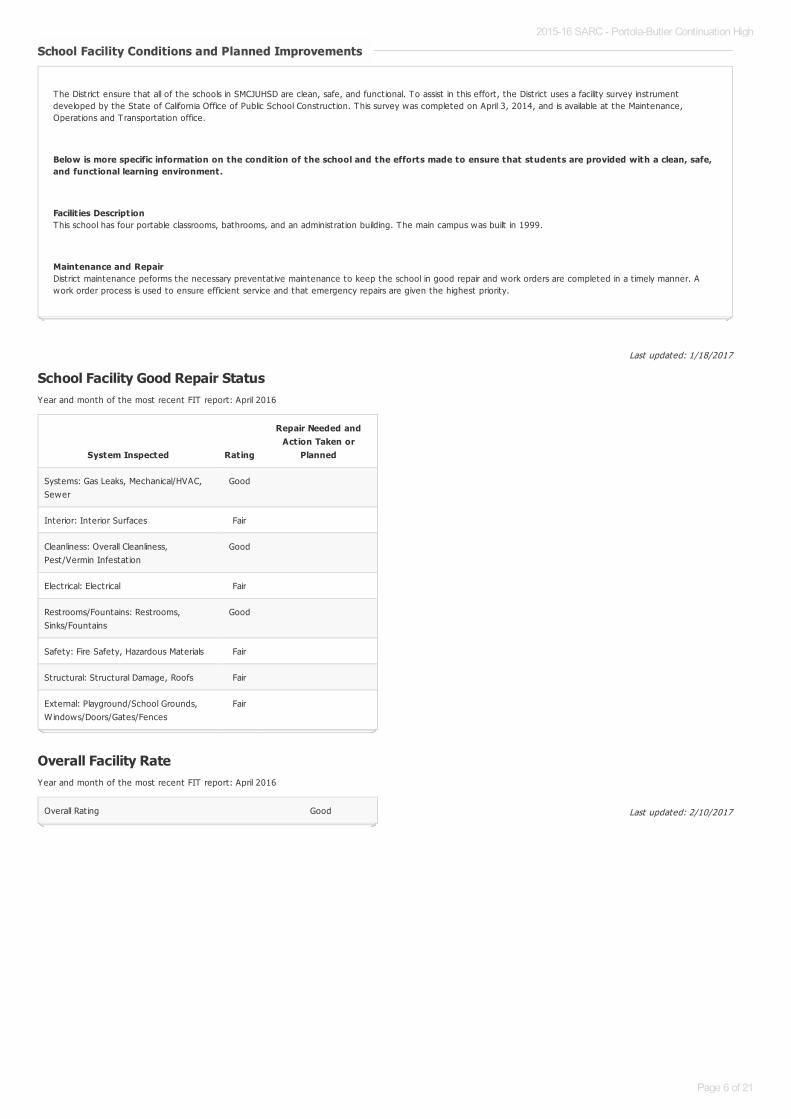
School Facility Good Repair StatusYear and month of the most recent FIT report: April 2016
Overall Facility RateYear and month of the most recent FIT report: April 2016
School Facility Conditions and Planned ImprovementsSchool Facility Conditions and Planned Improvements
The District ensure that all of the schools in SMCJUHSD are clean, safe, and funct ional. To assist in this effort, the District uses a facility survey instrumentdeveloped by the State of California Office of Public School Construct ion. This survey was completed on April 3, 2014, and is available at the Maintenance,Operat ions and Transportat ion office.
Below is more specific information on the condition of the school and the efforts made to ensure that students are provided with a clean, safe,and functional learning environment.
Facilit ies Description This school has four portable classrooms, bathrooms, and an administrat ion building. The main campus was built in 1999.
Maintenance and Repair District maintenance peforms the necessary preventat ive maintenance to keep the school in good repair and work orders are completed in a t imely manner. Awork order process is used to ensure efficient service and that emergency repairs are given the highest priority.
System Inspected Rating
Repair Needed andAction Taken or
Planned
Systems: Gas Leaks, Mechanical/HVAC,Sewer
Good
Interior: Interior Surfaces Fair
Cleanliness: Overall Cleanliness,Pest/Vermin Infestat ion
Good
Electrical: Electrical Fair
Restrooms/Fountains: Restrooms,Sinks/Fountains
Good
Safety: Fire Safety, Hazardous Materials Fair
Structural: Structural Damage, Roofs Fair
External: Playground/School Grounds,W indows/Doors/Gates/Fences
Fair
Overall Rat ing Good
2015-16 SARC - Portola-Butler Continuation High
Page 6 of 21
Last updated: 1/17/2017
B. Pupil Outcomes
State Priority: Pupil Achievement
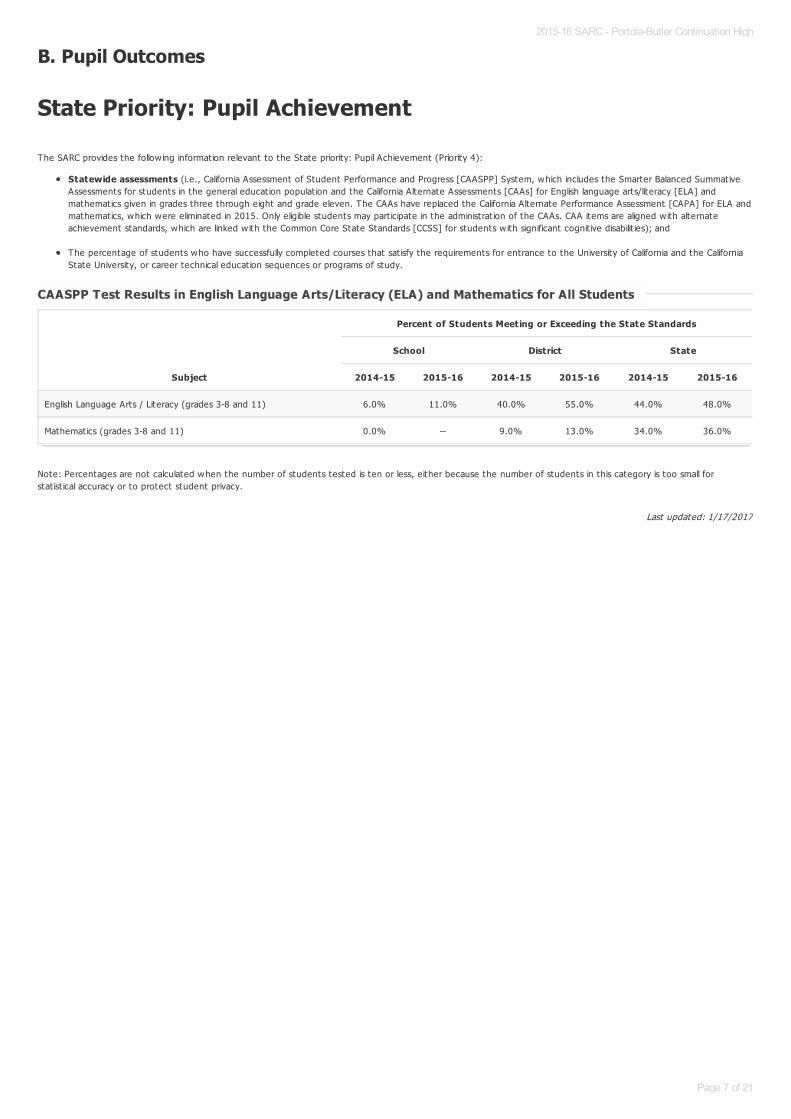
The SARC provides the follow ing information relevant to the State priority: Pupil Achievement (Priority 4):
Statewide assessments (i.e., California Assessment of Student Performance and Progress [CAASPP] System, which includes the Smarter Balanced SummativeAssessments for students in the general educat ion populat ion and the California Alternate Assessments [CAAs] for English language arts/literacy [ELA] andmathematics given in grades three through eight and grade eleven. The CAAs have replaced the California Alternate Performance Assessment [CAPA] for ELA andmathematics, which were eliminated in 2015. Only eligible students may part icipate in the administrat ion of the CAAs. CAA items are aligned w ith alternateachievement standards, which are linked w ith the Common Core State Standards [CCSS] for students w ith significant cognit ive disabilit ies); and
The percentage of students who have successfully completed courses that sat isfy the requirements for entrance to the University of California and the CaliforniaState University, or career technical educat ion sequences or programs of study.
Note: Percentages are not calculated when the number of students tested is ten or less, either because the number of students in this category is too small forstat ist ical accuracy or to protect student privacy.
CAASPP Test Results in English Language Arts/Literacy (ELA) and Mathematics for All StudentsCAASPP Test Results in English Language Arts/Literacy (ELA) and Mathematics for All Students
Subject
Percent of Students Meeting or Exceeding the State Standards
School District State
2014-15 2015-16 2014-15 2015-16 2014-15 2015-16
English Language Arts / Literacy (grades 3-8 and 11) 6.0% 11.0% 40.0% 55.0% 44.0% 48.0%
Mathematics (grades 3-8 and 11) 0.0% -- 9.0% 13.0% 34.0% 36.0%
2015-16 SARC - Portola-Butler Continuation High
Page 7 of 21
Last updated: 1/17/2017
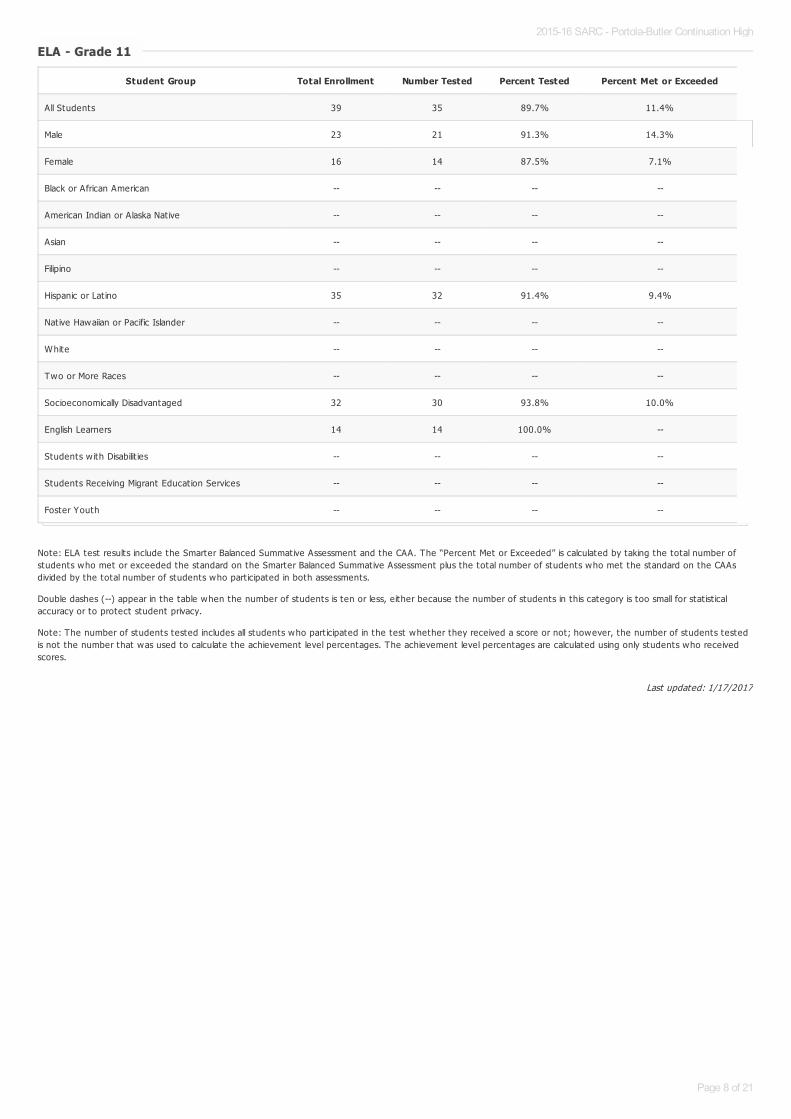
Note: ELA test results include the Smarter Balanced Summative Assessment and the CAA. The “Percent Met or Exceeded” is calculated by taking the total number ofstudents who met or exceeded the standard on the Smarter Balanced Summative Assessment plus the total number of students who met the standard on the CAAsdivided by the total number of students who part icipated in both assessments.
Double dashes (--) appear in the table when the number of students is ten or less, either because the number of students in this category is too small for stat ist icalaccuracy or to protect student privacy.
Note: The number of students tested includes all students who part icipated in the test whether they received a score or not; however, the number of students testedis not the number that was used to calculate the achievement level percentages. The achievement level percentages are calculated using only students who receivedscores.
ELA - Grade 11ELA - Grade 11
Student Group Total Enrollment Number Tested Percent Tested Percent Met or Exceeded
All Students 39 35 89.7% 11.4%
Male 23 21 91.3% 14.3%
Female 16 14 87.5% 7.1%
Black or African American -- -- -- --
American Indian or Alaska Nat ive -- -- -- --
Asian -- -- -- --
Filipino -- -- -- --
Hispanic or Lat ino 35 32 91.4% 9.4%
Native Hawaiian or Pacific Islander -- -- -- --
White -- -- -- --
Two or More Races -- -- -- --
Socioeconomically Disadvantaged 32 30 93.8% 10.0%
English Learners 14 14 100.0% --
Students w ith Disabilit ies -- -- -- --
Students Receiving Migrant Educat ion Services -- -- -- --
Foster Youth -- -- -- --
2015-16 SARC - Portola-Butler Continuation High
Page 8 of 21
Last updated: 1/17/2017
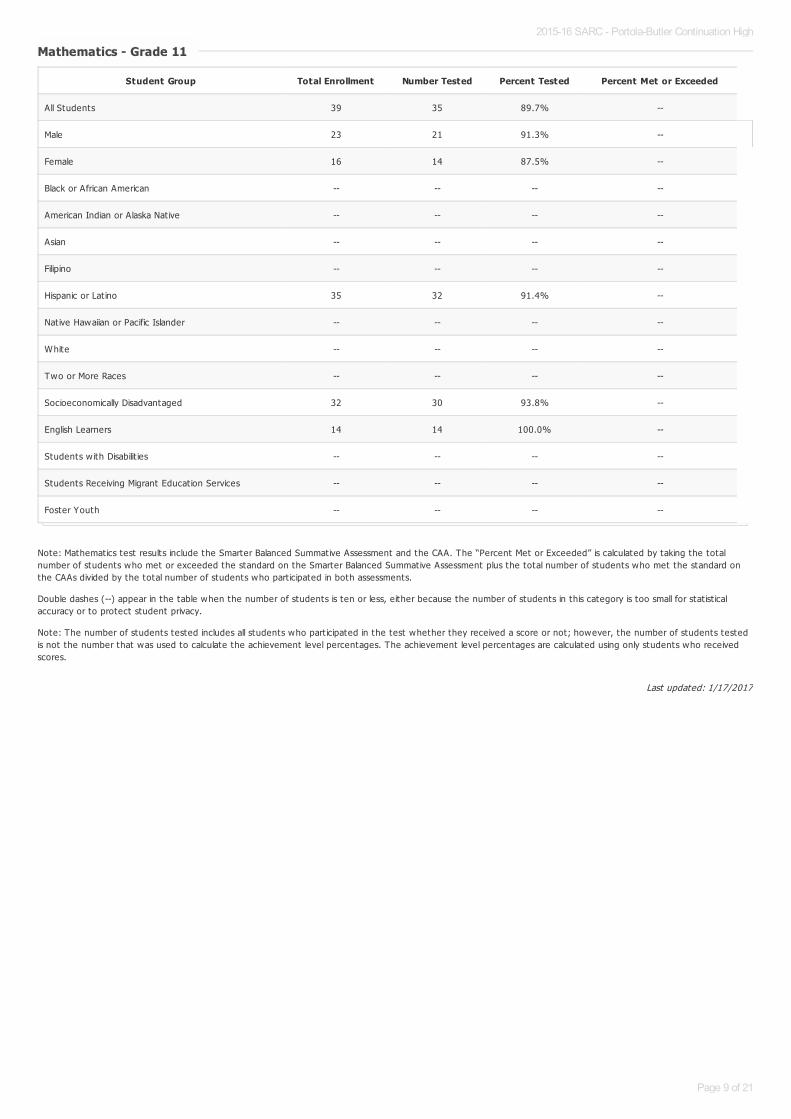
Note: Mathematics test results include the Smarter Balanced Summative Assessment and the CAA. The “Percent Met or Exceeded” is calculated by taking the totalnumber of students who met or exceeded the standard on the Smarter Balanced Summative Assessment plus the total number of students who met the standard onthe CAAs divided by the total number of students who part icipated in both assessments.
Double dashes (--) appear in the table when the number of students is ten or less, either because the number of students in this category is too small for stat ist icalaccuracy or to protect student privacy.
Note: The number of students tested includes all students who part icipated in the test whether they received a score or not; however, the number of students testedis not the number that was used to calculate the achievement level percentages. The achievement level percentages are calculated using only students who receivedscores.
Mathematics - Grade 11Mathematics - Grade 11
Student Group Total Enrollment Number Tested Percent Tested Percent Met or Exceeded
All Students 39 35 89.7% --
Male 23 21 91.3% --
Female 16 14 87.5% --
Black or African American -- -- -- --
American Indian or Alaska Nat ive -- -- -- --
Asian -- -- -- --
Filipino -- -- -- --
Hispanic or Lat ino 35 32 91.4% --
Native Hawaiian or Pacific Islander -- -- -- --
White -- -- -- --
Two or More Races -- -- -- --
Socioeconomically Disadvantaged 32 30 93.8% --
English Learners 14 14 100.0% --
Students w ith Disabilit ies -- -- -- --
Students Receiving Migrant Educat ion Services -- -- -- --
Foster Youth -- -- -- --
2015-16 SARC - Portola-Butler Continuation High
Page 9 of 21
Last updated: 1/17/2017
Last updated: 1/17/2017
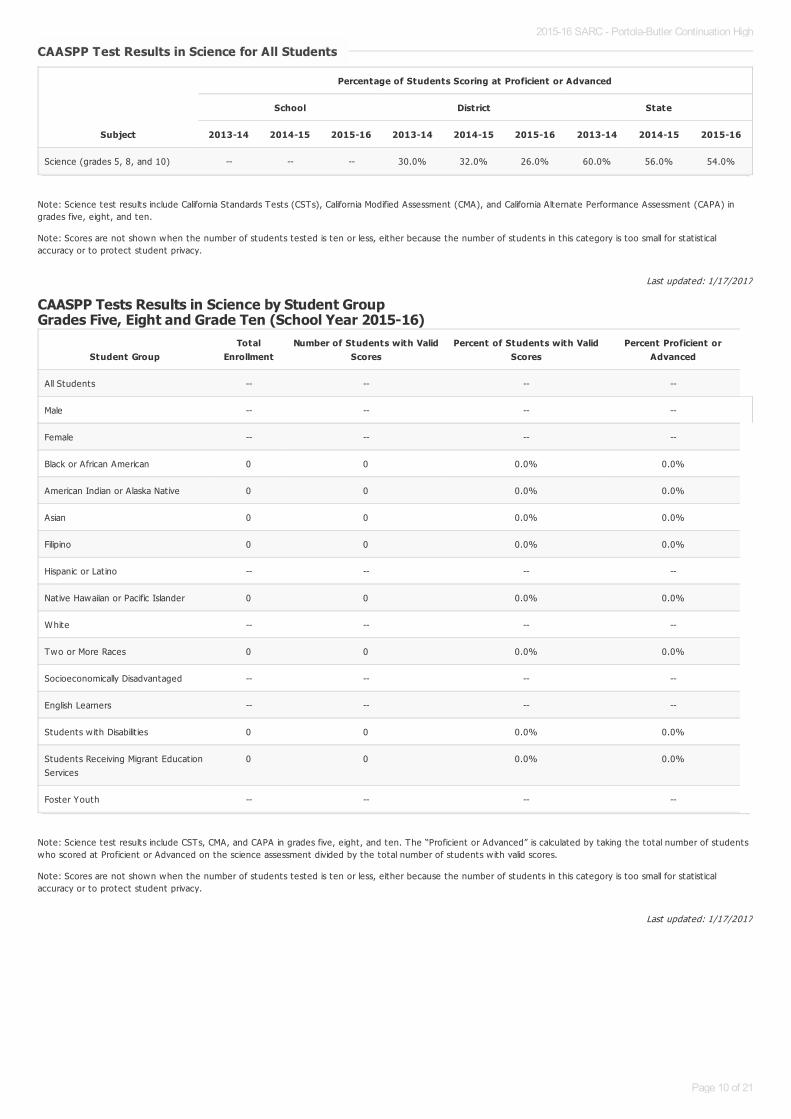
Note: Science test results include California Standards Tests (CSTs), California Modified Assessment (CMA), and California Alternate Performance Assessment (CAPA) ingrades five, eight, and ten.
Note: Scores are not shown when the number of students tested is ten or less, either because the number of students in this category is too small for stat ist icalaccuracy or to protect student privacy.
CAASPP Tests Results in Science by Student GroupGrades Five, Eight and Grade Ten (School Year 2015-16)
Note: Science test results include CSTs, CMA, and CAPA in grades five, eight, and ten. The “Proficient or Advanced” is calculated by taking the total number of studentswho scored at Proficient or Advanced on the science assessment divided by the total number of students w ith valid scores.
Note: Scores are not shown when the number of students tested is ten or less, either because the number of students in this category is too small for stat ist icalaccuracy or to protect student privacy.
CAASPP Test Results in Science for All StudentsCAASPP Test Results in Science for All Students
Subject
Percentage of Students Scoring at Proficient or Advanced
School District State
2013-14 2014-15 2015-16 2013-14 2014-15 2015-16 2013-14 2014-15 2015-16
Science (grades 5, 8, and 10) -- -- -- 30.0% 32.0% 26.0% 60.0% 56.0% 54.0%
Student GroupTotal
EnrollmentNumber of Students with Valid
ScoresPercent of Students with Valid
ScoresPercent Proficient or
Advanced
All Students -- -- -- --
Male -- -- -- --
Female -- -- -- --
Black or African American 0 0 0.0% 0.0%
American Indian or Alaska Nat ive 0 0 0.0% 0.0%
Asian 0 0 0.0% 0.0%
Filipino 0 0 0.0% 0.0%
Hispanic or Lat ino -- -- -- --
Nat ive Hawaiian or Pacific Islander 0 0 0.0% 0.0%
White -- -- -- --
Two or More Races 0 0 0.0% 0.0%
Socioeconomically Disadvantaged -- -- -- --
English Learners -- -- -- --
Students w ith Disabilit ies 0 0 0.0% 0.0%
Students Receiving Migrant Educat ionServices
0 0 0.0% 0.0%
Foster Youth -- -- -- --
2015-16 SARC - Portola-Butler Continuation High
Page 10 of 21
Last updated: 2/10/2017
Last updated: 1/17/2017
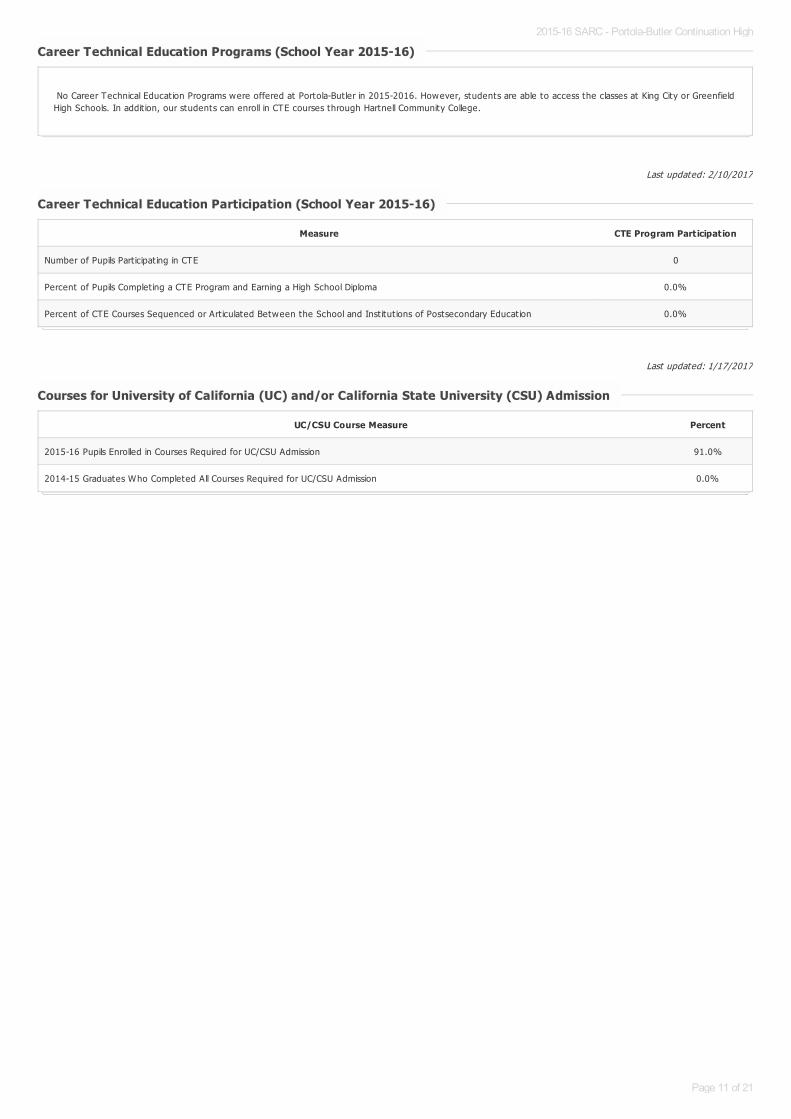
Career Technical Education Programs (School Year 2015-16)Career Technical Education Programs (School Year 2015-16)
No Career Technical Educat ion Programs were offered at Portola-But ler in 2015-2016. However, students are able to access the classes at King City or GreenfieldHigh Schools. In addit ion, our students can enroll in CTE courses through Hartnell Community College.
Career Technical Education Participation (School Year 2015-16)Career Technical Education Participation (School Year 2015-16)
Measure CTE Program Participation
Number of Pupils Part icipat ing in CTE 0
Percent of Pupils Complet ing a CTE Program and Earning a High School Diploma 0.0%
Percent of CTE Courses Sequenced or Art iculated Between the School and Inst itut ions of Postsecondary Educat ion 0.0%
Courses for University of California (UC) and/or California State University (CSU) AdmissionCourses for University of California (UC) and/or California State University (CSU) Admission
UC/CSU Course Measure Percent
2015-16 Pupils Enrolled in Courses Required for UC/CSU Admission 91.0%
2014-15 Graduates Who Completed All Courses Required for UC/CSU Admission 0.0%
2015-16 SARC - Portola-Butler Continuation High
Page 11 of 21
Last updated: 2/10/2017
Last updated: 1/18/2017
State Priority: Other Pupil Outcomes
The SARC provides the follow ing information relevant to the State priority: Other Pupil Outcomes (Priority 8):
Pupil outcomes in the subject area of physical educat ion
Note: Percentages are not calculated when the number of students tested is ten or less, either because the number of students in this category is too small forstat ist ical accuracy or to protect student privacy.
California Physical Fitness Test Results (School Year 2015-16)California Physical Fitness Test Results (School Year 2015-16)
Grade Level
Percentage of Students Meeting Fitness Standards
Four of Six Standards Five of Six Standards Six of Six Standards
2015-16 SARC - Portola-Butler Continuation High
Page 12 of 21
Last updated: 2/10/2017
C. Engagement
State Priority: Parental Involvement
The SARC provides the follow ing information relevant to the State priority: Parental Involvement (Priority 3):
Efforts the school district makes to seek parent input in making decisions for the school district and each schoolsite
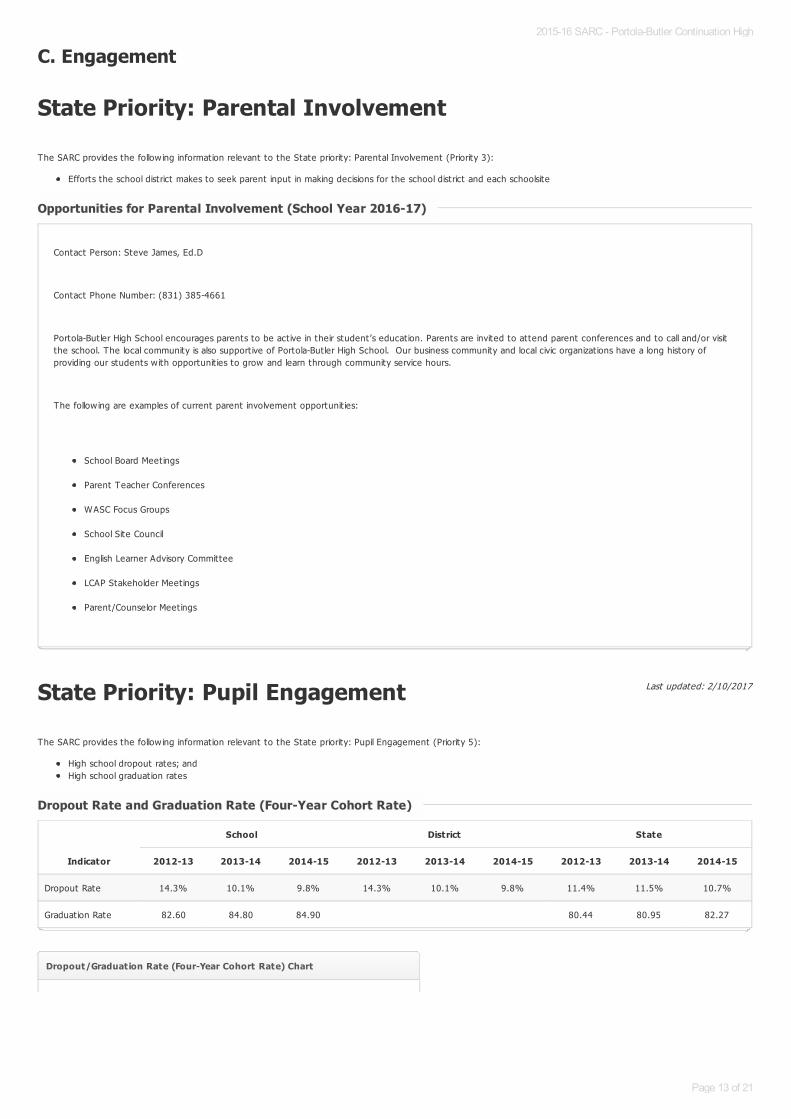
State Priority: Pupil Engagement
The SARC provides the follow ing information relevant to the State priority: Pupil Engagement (Priority 5):
High school dropout rates; andHigh school graduat ion rates
Opportunities for Parental Involvement (School Year 2016-17)Opportunities for Parental Involvement (School Year 2016-17)
Contact Person: Steve James, Ed.D
Contact Phone Number: (831) 385-4661
Portola-But ler High School encourages parents to be act ive in their student ’s educat ion. Parents are invited to attend parent conferences and to call and/or visitthe school. The local community is also support ive of Portola-But ler High School. Our business community and local civic organizat ions have a long history ofproviding our students w ith opportunit ies to grow and learn through community service hours.
The follow ing are examples of current parent involvement opportunit ies:
School Board Meetings
Parent Teacher Conferences
WASC Focus Groups
School Site Council
English Learner Advisory Committee
LCAP Stakeholder Meet ings
Parent/Counselor Meet ings
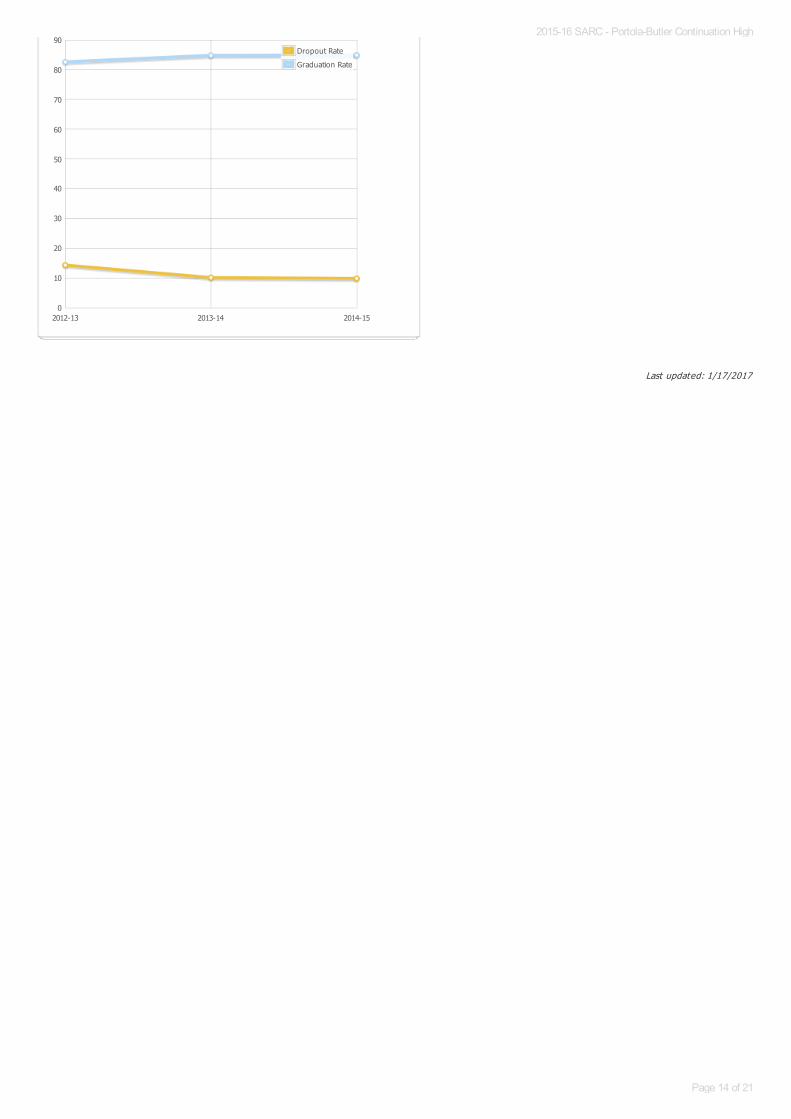
Dropout Rate and Graduation Rate (Four-Year Cohort Rate)Dropout Rate and Graduation Rate (Four-Year Cohort Rate)
Indicator
School District State
2012-13 2013-14 2014-15 2012-13 2013-14 2014-15 2012-13 2013-14 2014-15
Dropout Rate 14.3% 10.1% 9.8% 14.3% 10.1% 9.8% 11.4% 11.5% 10.7%
Graduat ion Rate 82.60 84.80 84.90 80.44 80.95 82.27
Dropout/Graduation Rate (Four-Year Cohort Rate) Chart
90
2015-16 SARC - Portola-Butler Continuation High
Page 13 of 21
Last updated: 1/17/2017
2012-13 2013-14 2014-150
10
20
30
40
50
60
70
80
90Dropout Rate
Graduation Rate
2015-16 SARC - Portola-Butler Continuation High
Page 14 of 21
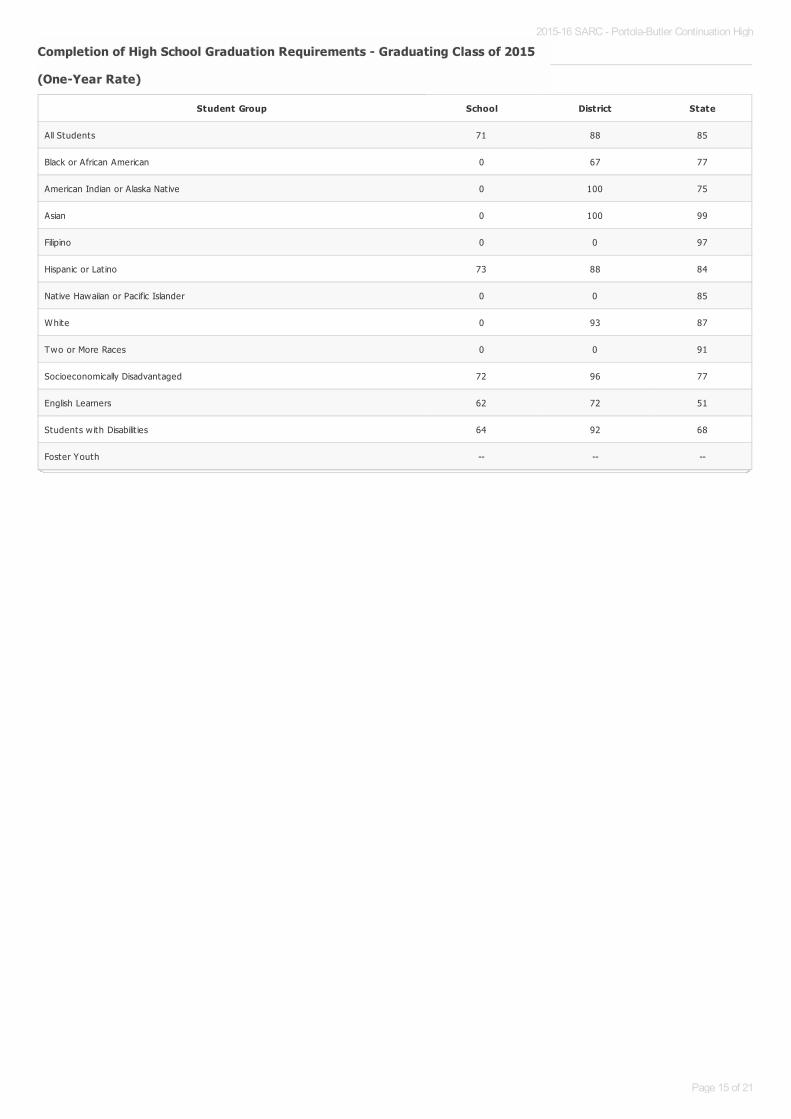
Completion of High School Graduation Requirements - Graduating Class of 2015 Completion of High School Graduation Requirements - Graduating Class of 2015
(One-Year Rate)(One-Year Rate)
Student Group School District State
All Students 71 88 85
Black or African American 0 67 77
American Indian or Alaska Nat ive 0 100 75
Asian 0 100 99
Filipino 0 0 97
Hispanic or Lat ino 73 88 84
Native Hawaiian or Pacific Islander 0 0 85
White 0 93 87
Two or More Races 0 0 91
Socioeconomically Disadvantaged 72 96 77
English Learners 62 72 51
Students w ith Disabilit ies 64 92 68
Foster Youth -- -- --
2015-16 SARC - Portola-Butler Continuation High
Page 15 of 21
Last updated: 1/17/2017
Last updated: 1/17/2017
Last updated: 2/10/2017
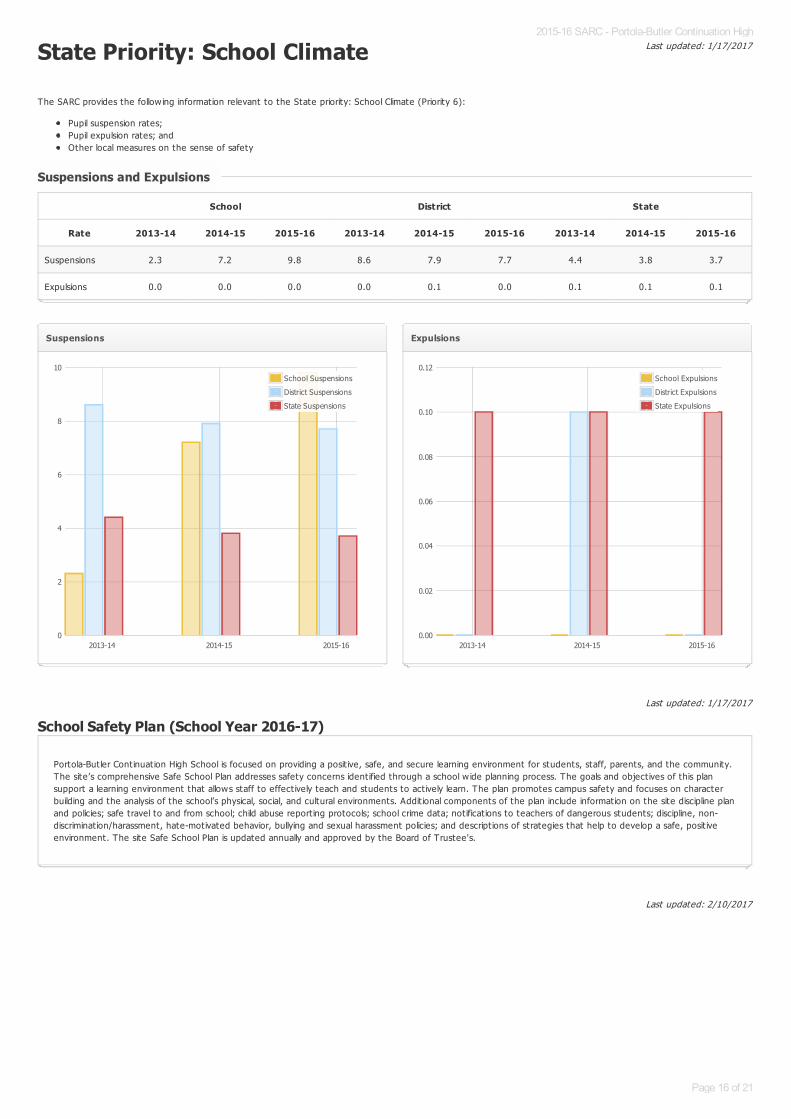
State Priority: School Climate
The SARC provides the follow ing information relevant to the State priority: School Climate (Priority 6):
Pupil suspension rates;Pupil expulsion rates; andOther local measures on the sense of safety
School Safety Plan (School Year 2016-17)
Suspensions and ExpulsionsSuspensions and Expulsions
School District State
Rate 2013-14 2014-15 2015-16 2013-14 2014-15 2015-16 2013-14 2014-15 2015-16
Suspensions 2.3 7.2 9.8 8.6 7.9 7.7 4.4 3.8 3.7
Expulsions 0.0 0.0 0.0 0.0 0.1 0.0 0.1 0.1 0.1
Suspensions
2013-14 2014-15 2015-160
2
4
6
8
10School Suspensions
District Suspensions
State Suspensions
Expulsions
2013-14 2014-15 2015-160.00
0.02
0.04
0.06
0.08
0.10
0.12School Expulsions
District Expulsions
State Expulsions
Portola-But ler Cont inuat ion High School is focused on providing a posit ive, safe, and secure learning environment for students, staff, parents, and the community.The site’s comprehensive Safe School Plan addresses safety concerns ident ified through a school w ide planning process. The goals and object ives of this plansupport a learning environment that allows staff to effect ively teach and students to act ively learn. The plan promotes campus safety and focuses on characterbuilding and the analysis of the school’s physical, social, and cultural environments. Addit ional components of the plan include information on the site discipline planand policies; safe travel to and from school; child abuse report ing protocols; school crime data; not ificat ions to teachers of dangerous students; discipline, non-discriminat ion/harassment, hate-motivated behavior, bullying and sexual harassment policies; and descript ions of strategies that help to develop a safe, posit iveenvironment. The site Safe School Plan is updated annually and approved by the Board of Trustee's.
2015-16 SARC - Portola-Butler Continuation High
Page 16 of 21
Last updated: 2/10/2017
Last updated: 1/17/2017
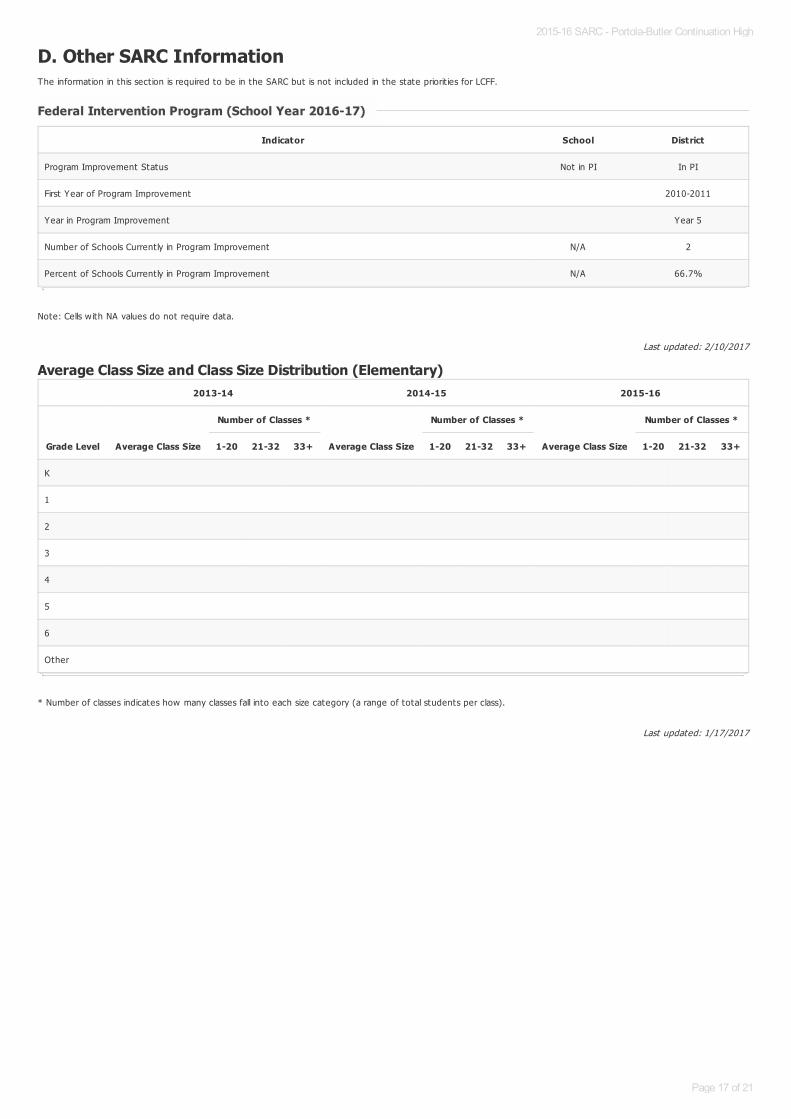
D. Other SARC InformationThe information in this sect ion is required to be in the SARC but is not included in the state priorit ies for LCFF.
Note: Cells w ith NA values do not require data.
Average Class Size and Class Size Distribution (Elementary)
* Number of classes indicates how many classes fall into each size category (a range of total students per class).
Federal Intervention Program (School Year 2016-17)Federal Intervention Program (School Year 2016-17)
Indicator School District
Program Improvement Status Not in PI In PI
First Year of Program Improvement 2010-2011
Year in Program Improvement Year 5
Number of Schools Current ly in Program Improvement N/A 2
Percent of Schools Current ly in Program Improvement N/A 66.7%
2013-14 2014-15 2015-16
Grade Level Average Class Size
Number of Classes *
Average Class Size
Number of Classes *
Average Class Size
Number of Classes *
1-20 21-32 33+ 1-20 21-32 33+ 1-20 21-32 33+
K
1
2
3
4
5
6
Other
2015-16 SARC - Portola-Butler Continuation High
Page 17 of 21
Last updated: 2/13/2017
Last updated: 1/17/2017
Last updated: 1/18/2017
* Number of classes indicates how many classrooms fall into each size category (a range of total students per classroom). At the secondary school level, this information isreported by subject area rather than grade level.
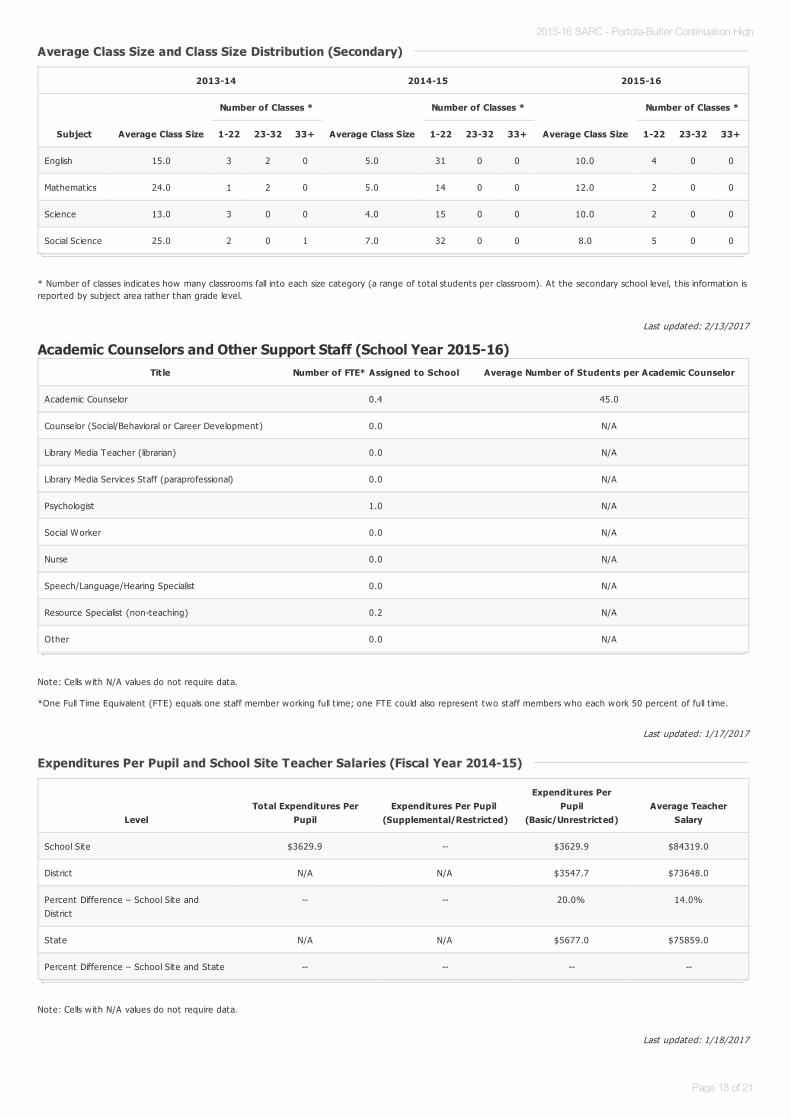
Academic Counselors and Other Support Staff (School Year 2015-16)
Note: Cells w ith N/A values do not require data.
*One Full T ime Equivalent (FTE) equals one staff member working full t ime; one FTE could also represent two staff members who each work 50 percent of full t ime.
Note: Cells w ith N/A values do not require data.
Average Class Size and Class Size Distribution (Secondary)Average Class Size and Class Size Distribution (Secondary)
2013-14 2014-15 2015-16
Subject Average Class Size
Number of Classes *
Average Class Size
Number of Classes *
Average Class Size
Number of Classes *
1-22 23-32 33+ 1-22 23-32 33+ 1-22 23-32 33+
English 15.0 3 2 0 5.0 31 0 0 10.0 4 0 0
Mathematics 24.0 1 2 0 5.0 14 0 0 12.0 2 0 0
Science 13.0 3 0 0 4.0 15 0 0 10.0 2 0 0
Social Science 25.0 2 0 1 7.0 32 0 0 8.0 5 0 0
Title Number of FTE* Assigned to School Average Number of Students per Academic Counselor
Academic Counselor 0.4 45.0
Counselor (Social/Behavioral or Career Development) 0.0 N/A
Library Media Teacher (librarian) 0.0 N/A
Library Media Services Staff (paraprofessional) 0.0 N/A
Psychologist 1.0 N/A
Social Worker 0.0 N/A
Nurse 0.0 N/A
Speech/Language/Hearing Specialist 0.0 N/A
Resource Specialist (non-teaching) 0.2 N/A
Other 0.0 N/A
Expenditures Per Pupil and School Site Teacher Salaries (Fiscal Year 2014-15)Expenditures Per Pupil and School Site Teacher Salaries (Fiscal Year 2014-15)
LevelTotal Expenditures Per
PupilExpenditures Per Pupil
(Supplemental/Restricted)
Expenditures PerPupil
(Basic/Unrestricted)Average Teacher
Salary
School Site $3629.9 -- $3629.9 $84319.0
District N/A N/A $3547.7 $73648.0
Percent Difference – School Site andDistrict
-- -- 20.0% 14.0%
State N/A N/A $5677.0 $75859.0
Percent Difference – School Site and State -- -- -- --
2015-16 SARC - Portola-Butler Continuation High
Page 18 of 21
Last updated: 2/13/2017
Last updated: 1/17/2017
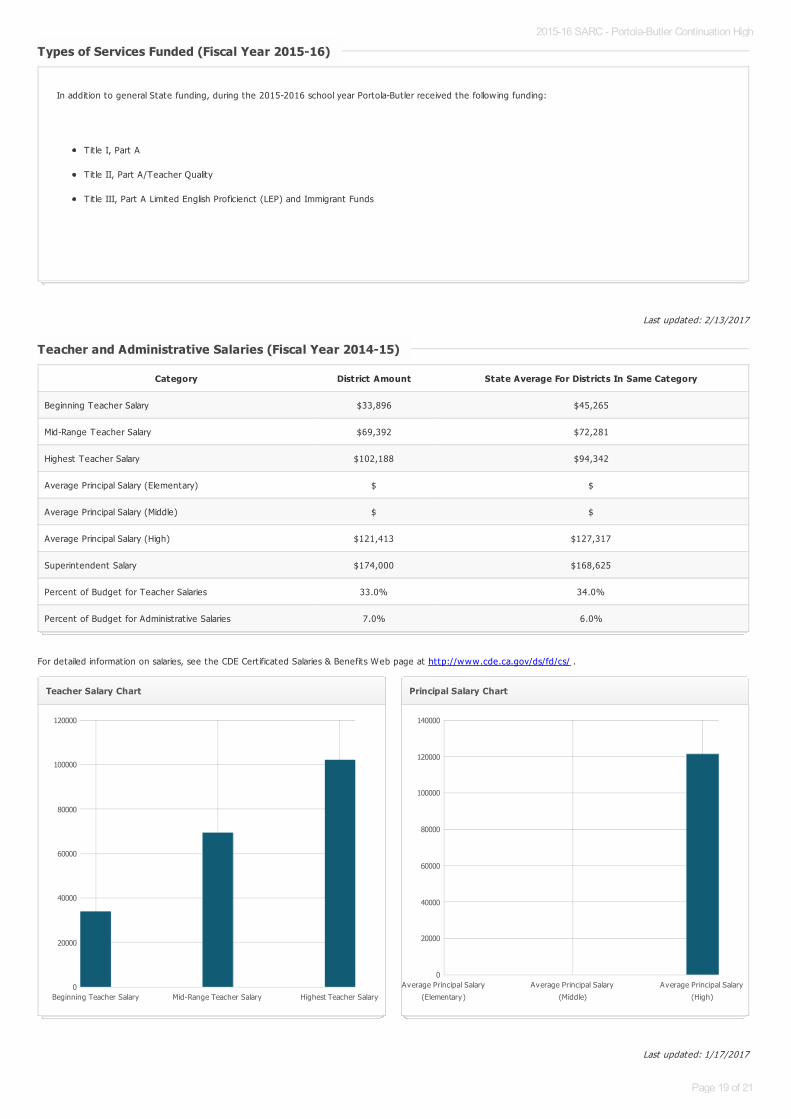
For detailed information on salaries, see the CDE Cert ificated Salaries & Benefits Web page at http://www.cde.ca.gov/ds/fd/cs/ .
Types of Services Funded (Fiscal Year 2015-16)Types of Services Funded (Fiscal Year 2015-16)
In addit ion to general State funding, during the 2015-2016 school year Portola-But ler received the follow ing funding:
T it le I, Part A
Tit le II, Part A/Teacher Quality
T it le III, Part A Limited English Proficienct (LEP) and Immigrant Funds
Teacher and Administrative Salaries (Fiscal Year 2014-15)Teacher and Administrative Salaries (Fiscal Year 2014-15)
Category District Amount State Average For Districts In Same Category
Beginning Teacher Salary $33,896 $45,265
Mid-Range Teacher Salary $69,392 $72,281
Highest Teacher Salary $102,188 $94,342
Average Principal Salary (Elementary) $ $
Average Principal Salary (Middle) $ $
Average Principal Salary (High) $121,413 $127,317
Superintendent Salary $174,000 $168,625
Percent of Budget for Teacher Salaries 33.0% 34.0%
Percent of Budget for Administrat ive Salaries 7.0% 6.0%
Teacher Salary Chart
Beginning Teacher Salary Mid-Range Teacher Salary Highest Teacher Salary0
20000
40000
60000
80000
100000
120000
Principal Salary Chart
Average Principal Salary
(Elementary)
Average Principal Salary
(Middle)
Average Principal Salary
(High)
0
20000
40000
60000
80000
100000
120000
140000
2015-16 SARC - Portola-Butler Continuation High
Page 19 of 21
Last updated: 1/17/2017
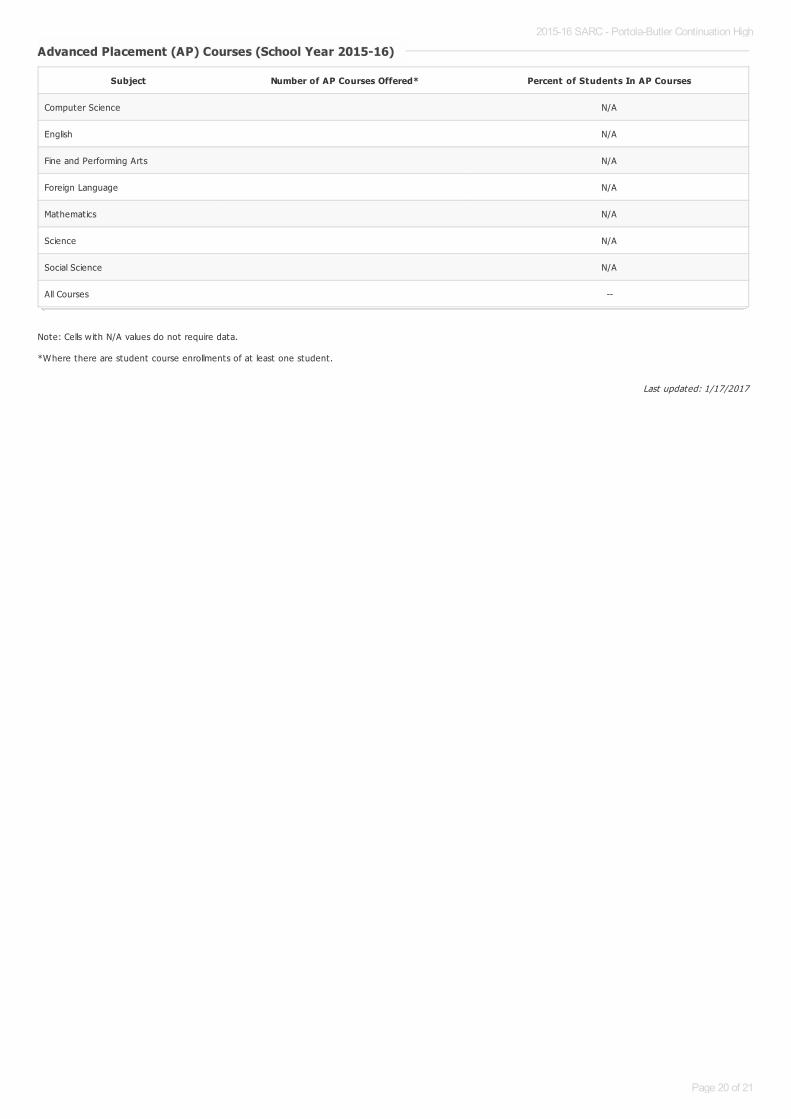
Note: Cells w ith N/A values do not require data.
*Where there are student course enrollments of at least one student.
Advanced Placement (AP) Courses (School Year 2015-16)Advanced Placement (AP) Courses (School Year 2015-16)
Subject Number of AP Courses Offered* Percent of Students In AP Courses
Computer Science N/A
English N/A
Fine and Performing Arts N/A
Foreign Language N/A
Mathematics N/A
Science N/A
Social Science N/A
All Courses --
2015-16 SARC - Portola-Butler Continuation High
Page 20 of 21

Last updated: 2/10/2017
Professional DevelopmentProfessional Development
Professional development opportunit ies were offered to all teachers w ithin the district , including Portola-But ler High School teachers. The professionaldevelopment specifically focused on the implementat ion of best pract ices as out lined in the Construct ing Meaning Professional Development. This PD ensures theacademic achievement of English learners and all learners w ith a focus on a comprehensive approach for developing English proficiency. Integral to such anapproach is explicit language instruct ion in every class, every day.Construct ing Meaning provides teachers w ith the process and tools for weaving explicit language instruct ion into content area teaching. Lesson planning is drivenby the content and academic language demands of discipline-specific learning. Based on backward design and a gradual release of responsibility model, theConstruct ing Meaning process prompts teachers to: *understand the role language plays in content learning *decide what language knowledge students need to access content and express understanding *provide appropriate, explicit oral and written language instruct ion and pract ice
Teachers have also part icipated in professional development related to implementat ion of the Common Core State Standards (CCSS), WASC planning anddevelopment and Professional Learning Communit ies. Our math teacher has also received professional development in the math Vision Project (MVP) curriculum.
2015-16 SARC - Portola-Butler Continuation High
Page 21 of 21