Embed Size (px)
Citation preview

STIGMA EXPERIENCED BY PARENTS OF ADULTS WITH
INTELLECTUAL DISABILITIES
by
AHANA SARKAR
A thesis submitted to the Department of Community Health & Epidemiology in
conformity with the requirements for the degree of Master of Science
Queen’s University
Kingston, Ontario, Canada
May, 2010
Copyright © Ahana Sarkar, 2010

i
ABSTRACT
Background:
Stigma can not only affect the stigmatized individual, but also those closely
associated with that individual, such as parents. Parents are often in the role of primary
caregivers for individuals with intellectual disabilities. However, few studies have looked
at the experiences of stigma in parents of adults with intellectual disabilities.
Objectives:
Three objectives of the current study were to test the internal consistencies of
three scales aimed to measure experiences of parents of adults with intellectual
disabilities (two stigma scales and one scale looking at positive personal, perspective on
life, and relational changes in parents), test the inter-correlation between the scales and
describe the parents’ experiences.
Methods:
A self-administered survey containing the three scales was mailed to parents of
adults with intellectual disabilities by agency staff on the investigators’ behalf. The
participants were identified through a database of anonymized information about
individuals with intellectual disabilities within the six counties of South Eastern Ontario.
A total of 97 participants (parents) were eligible for the study.
Results:
The scale measuring positive changes experienced by parents had significant item
non-response. However, all three scales achieved good to excellent internal consistencies
when tested in the current sample. The two stigma scales were moderately correlated with
one another in a positive direction, while the scale measuring positive changes in parents

ii
did not significantly correlate with either of the stigma scales. Mothers and younger
parents (less than 65 years) were more likely to report that stigma affected their ability to
interact with relatives than fathers and older parents. Parents of adults with dual diagnosis
(having both an intellectual disability and mental health problems) were more likely to
report that stigma affected their family’s quality of life than parents of adults with an
intellectual disability only.
Conclusion:
Both of the stigma scales are recommended with caution, with recommendations
ranging from rewording of items, change in item order within the survey, more
conservative item response categories, reconsideration of dichotomizing responses and a
mode of survey administration which lowers the potential for non-response. Certain
groups of parents of adults with intellectual disabilities experience stigma differently than
others.
iii
ACKNOWLEDGEMENTS
The journey of my master’s thesis has been a great learning lesson which tested
my capacity and ability to face significant challenges, external and internal. Now I look
back and see the support, encouragement, faith, knowledge and wisdom from others that
have been invaluable stepping stones enabling me to reach the end.
This project would not have been possible without the funding by South Eastern
Ontario Community-University Research Alliance in Intellectual Disabilities (SEO
CURA in ID) and the financial support by the Department of Community Health and
Epidemiology, Queen’s University.
I want to extend my gratitude to the agencies and their staff for their interest, time
and work in helping me recruit participants for my study. I am also thankful for the
feedback from the parents in The Family Advisory Committee, SEO CURA in ID, whose
comments greatly helped me in focusing the initial direction of my study.
To the parents of adults with intellectual disabilities, I am grateful for their
willingness to participate in my study and to share a part of their personal experiences.
Many times, these stories served as inspiration for my continued commitment to this
project.
To the individuals whose guidance helped me see the end:
• To my supervisors, Hélène Ouellette-Kuntz and Heather Stuart, I acknowledge my
deep debt of gratitude and take this opportunity to offer my heartfelt thanks. Without
both of your insights, encouragement, guidance, and knowledge, I would not have
been able to reach the end. Thank you for the invaluable lessons you taught me about
how to look deeper, more critically, and to uphold the integrity of scientific research.
iv
• To the staff and students at Ongwanada, Maureen, Aileen, Helen, Hilary and Iwona,
who were always open and willing to offer help, and because of whom, my work
environment fostered positivity and encouragement, your support is appreciated.
• To the individuals in the Department of Community Health and Epidemiology: to
Katherine Cook and Lee Watkins, thank you for your always-ready helping hands and
words, to Dr. Miu Lam, thank you for all your guidance with my statistical inquiries,
and to Michelle Koller, thank you for your assistance in familiarizing me with the
data from the original study involving the mental health sample.
• To Bert, who worked tirelessly alongside me, making hundreds of survey packages,
you made the work and time pass by effortlessly.
• To Thy Dinh, you were there at the inception of this journey. I could not have taken
the first steps without your faith and support. To Amandev Aulakh, who gladly bore
witness to the end of my journey, I could not have reached the finish line without all
that you did to make the last hurdle seem possible and reachable.
• To my friends who listened to my seemingly never-ending “thesis stories”, thank you
for your words of encouragement and for the patient ears. To the others who, without
words, offered me moments of levity, you were invaluable in my moments of stress.
• To Hélène, you were there from the very beginning until the very end. Your first act
of support in this journey started as my academic advisor and ended with being my
mentor. You championed for me when I lost my way. My deepest gratitude for
everything that you did to ensure that I had the confidence to face the end.
• To my parents, you taught me about sacrifice, integrity and the courage to fulfill my
goals. This journey was a testament to those lessons learned.

v
TABLE OF CONTENTS ABSTRACT i ACKNOWLEDGEMENTS iii TABLE OF CONTENTS v LIST OF TABLES viii LIST OF FIGURES x CHAPTER 1: INTRODUCTION 1 1.1 Purpose of study 1 1.2 Background 1 1.2.1 Classification of intellectual disabilities 1 1.2.2 History of intellectual disabilities 4 1.2.3 Epidemiology of intellectual disabilities 8 1.2.4 Relevance of stigma to intellectual disabilities 12 1.2.5 Stigma by association 12 1.3 Rationale 14 CHAPTER 2: LITERATURE REVIEW 16 2.1 The nature of stigma 16 2.2 Stigma related to mental health problems and intellectual disabilities 21 2.3 Family experiences of stigma 23 2.4 Availability of measurement tools 26 2.5 Implications 28 CHAPTER 3: GOALS AND OBJECTIVES 29 CHAPTER 4: STUDY DESIGN AND METHODS 30 4.1 Study design 30 4.2 Sampling strategy 30 4.3 Measures 33 4.3.1 Stigma Experience Scale 34 4.3.2 Stigma Impact Scale 35 4.3.3 Parental Changes Subscale 36 4.4 Data management 36 4.5 Data analysis 39
vi
CHAPTER 5: RESULTS 42 5.1 Demographic information 42 5.2 Psychometric testing of scales 46 5.2.1 Stigma Experience Scale 46 5.2.2 Stigma Impact Scale 49 5.2.3 Parental Changes Subscale 52 5.2.4 Inter-correlation between scales 56 5.3 Association between characteristics of respondents and 56 experiences of stigma 5.4 Summary of results 65 CHAPTER 6: DISCUSSION 68 6.1 Evaluation of the individual scales 68 6.1.1 The inter-correlation between the scales 76 6.2 Experiences of parents 77 6.3 Strengths and limitations 83 6.4 Future direction of study 87 CHAPTER 7: CONCLUSION 90 REFERENCES 91 APPENDIX A: ETHICS APPROVAL 103 APPENDIX B: INITIAL LETTER OF INVITATION TO AGENCIES 104 APPENDIX C: LETTER TO AGENCY CONTACT WITH LIST 106 APPENDIX D: LETTER TO AGENCY- MAILING INSTRUCTIONS 108 APPENDIX E: COVER LETTER FOR PARENT PARTICIPANTS 110 APPENDIX F: SURVEY 112 APPENDIX G: POSTCARD FOR PARTICIPANTS 131 APPENDIX H: COMPARISON OF RESPONDENTS WITH EITHER 132 SOME OR COMPLETED PUBLIC SCHOOL EDUCATION VERSUS RESPONDENTS WHO EITHER HAD SOME OR COMPLETED HIGH SCHOOL APPENDIX I: DISTRIBUTION OF THE FREQUENCY OF THE 134 TOTAL SCORES FOR EACH OF THE THREE SCALES APPENDIX J: GRAPHICAL REPRESENTATION OF CORRELATION 137 BETWEEN SCALES
vii
APPENDIX K: ASSOCIATION BETWEEN DESCRIPTIVE 140 CHARACTERISTICS AND ITEMS IN THE STIGMA EXPERIENCE SCALE APPENDIX L: SAMPLE SIZE CALCULATIONS FOR INTERNAL 166 CONSISTENCY APPENDIX M: COMPARISON OF RESPONDENTS AND 167 NON-RESPONDENTS FOR THE STIGMA EXPERIENCE SCALE APPENDIX N: COMPARISON OF RESPONDENTS AND 171 NON-RESPONDENTS FOR THE PARENTAL CHANGES SUBSCALE
viii
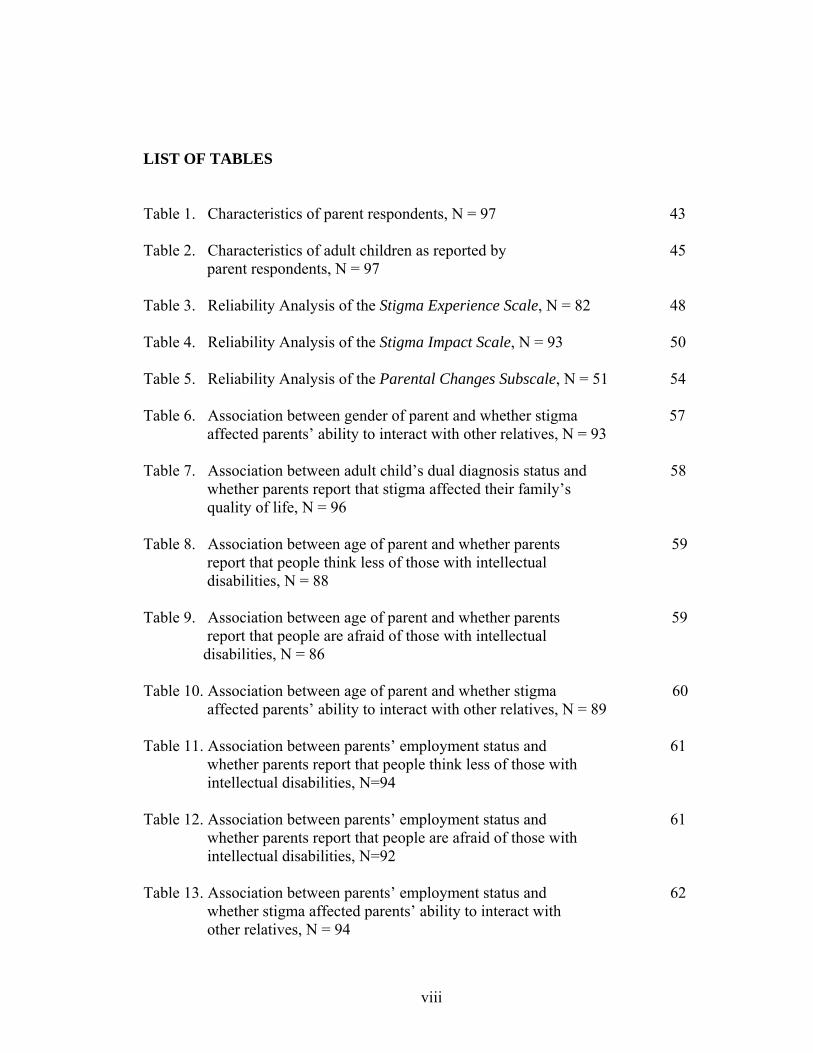
LIST OF TABLES Table 1. Characteristics of parent respondents, N = 97 43
Table 2. Characteristics of adult children as reported by 45 parent respondents, N = 97
Table 3. Reliability Analysis of the Stigma Experience Scale, N = 82 48
Table 4. Reliability Analysis of the Stigma Impact Scale, N = 93 50
Table 5. Reliability Analysis of the Parental Changes Subscale, N = 51 54
Table 6. Association between gender of parent and whether stigma 57 affected parents’ ability to interact with other relatives, N = 93 Table 7. Association between adult child’s dual diagnosis status and 58 whether parents report that stigma affected their family’s quality of life, N = 96 Table 8. Association between age of parent and whether parents 59 report that people think less of those with intellectual disabilities, N = 88 Table 9. Association between age of parent and whether parents 59 report that people are afraid of those with intellectual disabilities, N = 86 Table 10. Association between age of parent and whether stigma 60 affected parents’ ability to interact with other relatives, N = 89 Table 11. Association between parents’ employment status and 61 whether parents report that people think less of those with intellectual disabilities, N=94 Table 12. Association between parents’ employment status and 61 whether parents report that people are afraid of those with intellectual disabilities, N=92 Table 13. Association between parents’ employment status and 62 whether stigma affected parents’ ability to interact with other relatives, N = 94
ix
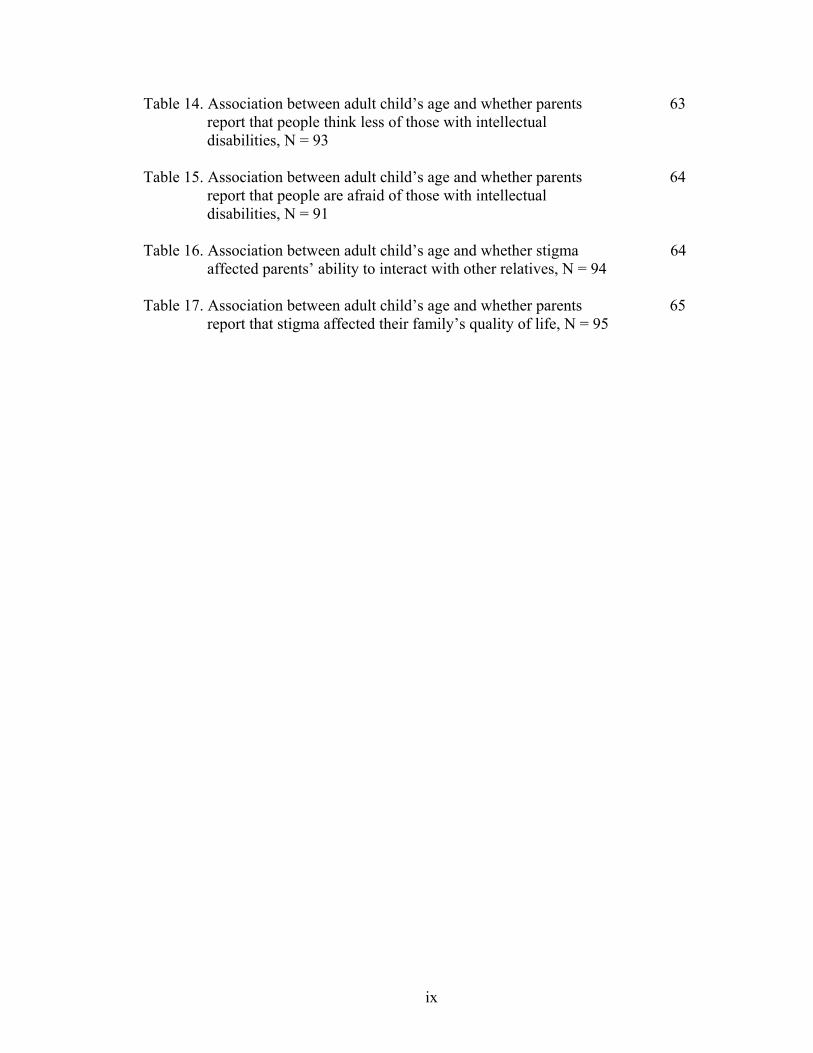
Table 14. Association between adult child’s age and whether parents 63 report that people think less of those with intellectual disabilities, N = 93 Table 15. Association between adult child’s age and whether parents 64 report that people are afraid of those with intellectual disabilities, N = 91 Table 16. Association between adult child’s age and whether stigma 64 affected parents’ ability to interact with other relatives, N = 94 Table 17. Association between adult child’s age and whether parents 65 report that stigma affected their family’s quality of life, N = 95
x
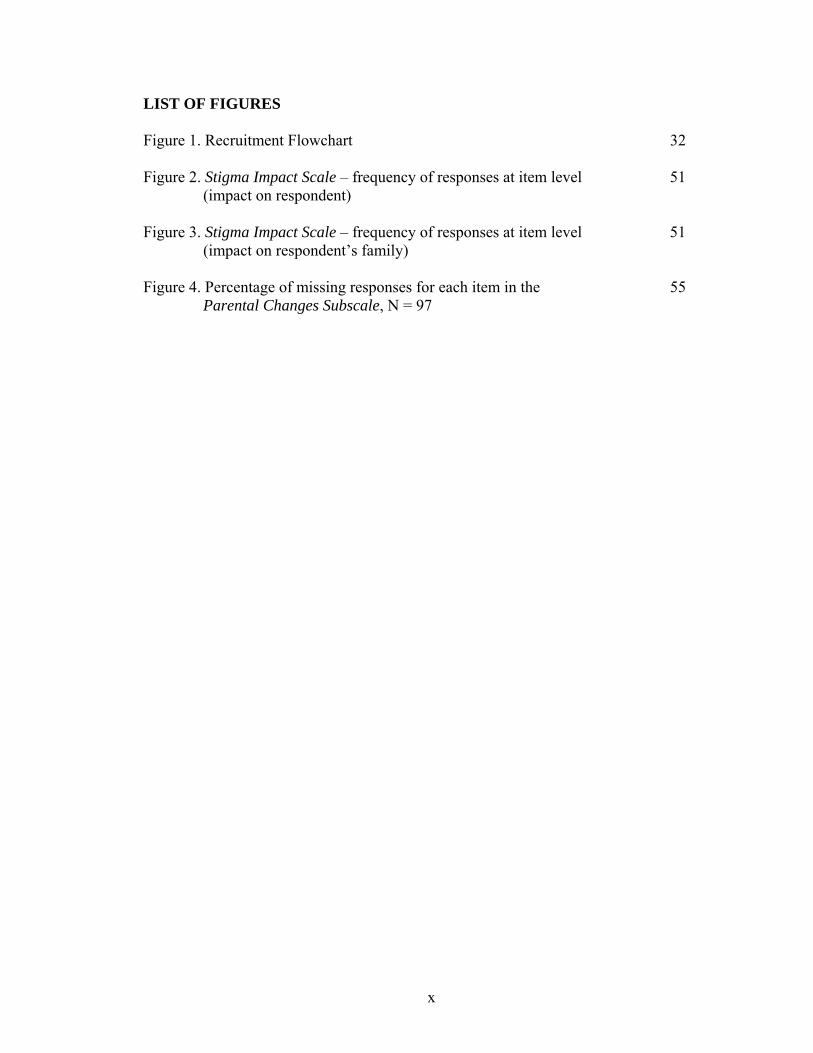
LIST OF FIGURES Figure 1. Recruitment Flowchart 32 Figure 2. Stigma Impact Scale – frequency of responses at item level 51 (impact on respondent) Figure 3. Stigma Impact Scale – frequency of responses at item level 51 (impact on respondent’s family) Figure 4. Percentage of missing responses for each item in the 55 Parental Changes Subscale, N = 97

1
CHAPTER 1: INTRODUCTION 1.1 Purpose of study
The purpose of the current study was to develop an understanding of the
experiences of parents of adults with intellectual disabilities residing in South Eastern
Ontario. Three scales that measured parents’ experiences were evaluated to achieve the
proposed aim of the study.
1.2 Background
In this section, background information about intellectual disabilities will be
presented to introduce the study’s population of interest. The primary lens used to focus
on the experiences of this population is stigma. As such, a background on stigma will be
presented. The effect of stigma related to intellectual disabilities will be further explored
as it pertains to those closely associated with such individuals, their parents.
1.2.1 Classification of intellectual disabilities
There are four main classification systems for intellectual disabilities: (1) the
Tenth Revision of the International Classification of Disease (ICD-10) (WHO, 1992), (2)
the current Diagnostic and Statistical Manual of Mental Disorders (DSM-IVTR)
(American Psychiatric Association, 2000), (3) the International Classification of
Functioning, Disability and Health (IFC) (WHO, 2001), and (4) the American
Association of Intellectual and Developmental Disabilities (formerly - American
Association of Mental Retardation) (Luckasson et al., 2002).
2
According to the Tenth Revision of the International Classification of Disease
(WHO, 1992), intellectual disability is defined as a condition of incomplete or arrested
development of the mind, characterized by impairment of skills (i.e., language, motor,
cognitive and social abilities) that are manifested during the developmental period such
that it contributes to the individual’s level of intelligence. Within the system there are five
categories used to classify the individual’s particular diagnosis: (1) severity of retardation
and problem behaviours, (2) associated medical conditions, (3) associated psychiatric
conditions, (4) global assessment of psycho-social disability, and (5) associated abnormal
psychosocial conditions.
Like the Tenth Revision of the International Classification of Disease (WHO,
1992), the Diagnostic and Statistical Manual of Mental Disorders-IVTR (2000) has
multiple criteria to classify intellectual disability. They are as follows: (1) an IQ of
approximately 70 or below, (2) concurrent deficits or impairments in present adaptive
functioning in at least two of the following areas: self-care, home living,
social/interpersonal skills, self-direction, use of community resources, functional
academic skills, health, work, leisure and safety, and (3) age of onset before 18 years.
The International Classification of Functioning, Disability and Health (WHO,
2001) shifts the focus from a medical model highlighting a disease, as in the Tenth
Revision of the International Classification of Disease (WHO, 1992), to a social model of
disability. As such, this system not only focuses on the individual and the body but also
the impact of society on the expression and degree of disability. In order to evaluate
intellectual disability, this system allows for the evaluation of the individual’s general
mental functions which are required to comprehend and usefully integrate various mental
capabilities, including all cognitive functions and their development over the life span.

3
The American Association of Intellectual and Developmental Disabilities defines
intellectual disability as having significant impairment in both “intellectual functioning
and conceptual, social and practical adaptive behaviour”, with onset prior to the age of 18
(American Association of Intellectual and Developmental Disabilities, 2009). The focus
of this system has been to place greater emphasis on the individual’s systems of support
and capability of adaptive functioning, more so than the intellectual deficit.
Of the four systems of classification, only two highlight the onset of intellectual
disability to be prior to the age of 18 (Diagnostic and Statistical Manual of Mental
Disorders-IVTR, 2000, and American Association of Intellectual and Developmental
Disabilities, 2009) with the Diagnostic and Statistical Manual of Mental Disorders-IVTR
(2000) being the only system that additionally outlines a criterion for IQ level. The Tenth
Revision of the International Classification of Disease (1992) and the Diagnostic and
Statistical Manual of Mental Disorders-IVTR (2000) both also place importance in
recognizing the disability by classifying severity. As well, both these classification
systems place intellectual disability within mental disorders, which is different from the
two classification systems developed by WHO. WHO recommends that the Tenth
Revision of the International Classification of Disease (1992) be used in conjunction with
International Classification of Functioning, Disability and Health (2001) to
comprehensively classify a disability. In this way, a medical model and a social model are
both applicable in understanding a disability. The International Classification of
Functioning, Disability and Health’s (2001) integration of a social model allows it to
focus on health years lost due to lack of positive medical, community and educational
support when classifying an individual’s intellectual disability.
4
In Canada, the classification system set forth by the American Association of
Intellectual and Developmental Disabilities (Luckasson et al., 2002) is accepted with
additional updates, as per the Developmental Services Act (2008). Specifically in Ontario,
eligibility for governmental support due to intellectual disability in children is mandated
by the Child and Family Services Act (2009) which recognizes intellectual disability as “a
condition of mental impairment, present or occurring during a person's formative years,
that is associated with limitations in adaptive behaviour.” Eligible services include respite
care, specialized community support to help integrate children with intellectual
disabilities into their communities, and residential services.
Terms such as ‘mental deficiency’, ‘mental handicap’, ‘feeblemindness’ and
‘mental retardation’ have historically been applied to this group (Griffiths, Stavrakaki &
Summers, 2002). The Diagnostic and Statistical Manual of Mental Disorders-IVTR, the
Tenth Revision of the International Classification of Disease and the International
Classification of Functioning, Disability and Health all still use the term ‘mental
retardation’, while the American Association of Intellectual and Developmental
Disabilities chose to revise its terminology by using the term ‘intellectual disability’. The
current paper will also use the term intellectual disability.
1.2.2 History of intellectual disabilities
Historically, the population defined by intellectual disabilities was first treated as
a homogeneous group where distinctions between etiologies of different types of
intellectual disabilities were not made. At present, the etiology of intellectual disability is
reported to be genetic or congenital in approximately half of the cases while the specific

5
causes for the rest of the cases may either be due to adverse events like trauma or the
cause is unknown (Arvio & Sillanpaa, 2003).
Within Western society, the history of intellectual disability leading to its current
status, as well as the strategies used for the care of such individuals, has shown marked
development. Available literature on the history of intellectual disability has mostly
profiled the United States of America and Britain. During the Middle Ages in England,
the term for such individuals was ‘idiot’ which was derived from the Latin word, idiota,
to mean an ignorant person, and the Greek word, idiotos, which meant unfit for public life
(Payne & Patton, 1981). These individuals were thought to have no understanding or
reason with regards to their own functioning (Payne & Patton, 1981). During the Middle
Ages, such individuals were seen as resulting from ‘sin’ (Syzmanski & Wilska, 1997),
while during the Reformation in Europe, Martin Luther claimed that individuals with
disabilities were the workings of the ‘devil’ (Miles, 2001). The use of the term ‘idiot’ to
refer to individuals with intellectual disabilities and the lack of understanding with
regards to causes of such disabilities carried over from the Middle Ages well into the 20th
century. Still today, the term ‘idiot’ is often used as a pejorative.
At the end of the 18th century, in France, Phillipe Pinel’s idea of “moral
management” allowed for a shift in the social perspective towards individuals with
intellectual disabilities by promoting humane care, education and recreation rather than
the previous approach of forcing obedience (Winzer, 1993). A student of his, Edouard
Seguin, built on Pinel’s work and further advocated educational systems as well as
physical therapies to improve the skills of such individuals (Winzer, 1993). By the mid-
19th century, Seguin’s influence reached the United States of America, and there, he
himself, along with some physicians, founded the first schools for individuals with
6
intellectual disabilities – American Institutions for the Feeble Minded (now an
interdisciplinary organization called American Association on Intellectual and
Developmental Disabilities) (Winzer, 1993). However, during the late 19th century and
early 20th century, the care of individuals with intellectual disabilities experienced another
shift in perspective to one of less humane care.
In 1905, Alfred Binet and Theodore Simone found a way to group children in
need of specialized education given their abilities; this was the application of the first
usable intelligence test (modern day, IQ test) (Scheerenberger, 1983). The eugenics
movement and Social Darwinism occurred around the same time, and they proposed that
intellectual disability was inherited and weakened the human species and burdened the
society (Scheerenberger, 1983). Custodial care and protection of the community from
such individuals, who were considered to be the “menace of the feeble-minded”, were
promoted (Brockley, 1999). They were considered to be a menace to society because
criminality, drug abuse and antisocial behaviour were associated with intellectual
disabilities. This perspective continued on until the 1920s when a growing emphasis on
community care and integrating such individuals into communities started to be
advocated and this is the perspective to this day (Brockley, 1999). The civil rights
movement also prompted parents to advocate for social integration for their children with
intellectual disabilities.
One notable influence on the modern history of intellectual disabilities in Canada
was the principle of normalization, introduced by Wolfensberger in the early 1970s
(Wolfensberger, 1972). Up until the 1970s, in Canada most of the care for those with
intellectual disabilities occurred in institutional settings (Radford & Park 2003).
Normalization advocated for the acceptance of the individuals’ disabilities and
7
subsequent availability of everyday living conditions and services that are afforded to
typically developing members within the same society (Wolfensberger, 1972). This
‘disability movement’ allowed intellectual disabilities to be seen not just as a medical
issue but a social one. The principle of normalization prompted the deinstitutionalization
movement in Canada.
When deinstitutionalization occurred in the 1970s and the 1980s, it meant that
intellectual disabilities were no longer under the directive of provincial health services as
they were de-medicalized and social inclusion was advocated (Lunsky et al., 2007). In
Ontario specifically, the introduction of the Developmental Services Act in 1974 meant
that individuals with intellectual disabilities living in psychiatric institutions regulated by
the Mental Health Act would be discharged and fall under the regulation of the new
Developmental Services Act. This movement created a separation of intellectual
disabilities from mental illness, as well as separating services and supports between these
two groups. Approximately 30,000 Canadians with intellectual disabilities were living in
institutions in 1999 (Kaiser, 1999). Those individuals living in institutions were likely to
be older, have behavioural problems and would have been more physically disabled than
those individuals with intellectual disabilities not living in institutions (McGuigan et al.,
1995). A review of studies researching the outcomes of deinstitutionalization in the USA
found that the movement of individuals with intellectual disabilities into community
settings showed a significant difference in challenging behaviours for those that moved
into the community versus those that continued to remain in institutions (Kim, Larson &
Lakin, 2001). Individuals with intellectual disabilities who continued to remain in
institutions were more likely to have challenging behaviours than those who moved into
the community.
8
In the USA, families of individuals with intellectual disabilities initially opposed
the deinstitutionalization movement, but after the resettlement of the individuals with
intellectual disabilities into community settings, the families tended to change their minds
(Tossebro, 2004). However, case managers and families were still the primary social
support for individuals with intellectual disabilities in transitioning from institutions to
community settings such as smaller residential homes or group homes, often with
supported living, or living with their families again. Presently, families no longer have the
option of having their young children with intellectual disabilities live in institutions.
1.2.3 Epidemiology of intellectual disabilities
Intellectual disabilities affect 1–3% of the population (Arvio & Sillanpaa, 2003).
Roeleveld et al. (1997) reviewed prevalence studies on intellectual disabilities and found
large gaps in knowledge about intellectual disabilities and issues with study designs
which affected accurate calculation of prevalence rates. They concluded that the
prevalence rate of intellectual disabilities in a given population is as follows: (1) for mild
intellectual disability (IQ range between 50-69), 2.5% of a given population, (2) for
moderate intellectual disability (IQ range between 35-49), 0.4% of the population, and,
(3) for severe and profound intellectual disability (IQ range below 35), 0.1% of the
population. Roeleveld et al. (1997) also noted that the prevalence rate for mild intellectual
disability was more difficult to estimate than for severe (or profound) intellectual
disability. McLaren and Bryson (1987) reviewed epidemiological studies looking at
prevalence rates, etiology and associated disorders in those with intellectual disabilities.
They reported that the prevalence of intellectual disability seemed to increase with age up
to about age 20 and that significantly more males were identified than females.
9
The etiology of intellectual disability has been subdivided into three general areas,
prenatal causes, perinatal causes and postnatal causes, by the American Association of
Intellectual and Developmental Disabilities. However, as McLaren and Bryson (1987)
stated, most causal relationships must be inferred. Down syndrome and other
chromosomal abnormalities can be identified with more certainty than some postnatal
infections (Biasini et. al., 1997). In many countries, Down syndrome is attributed as the
most common cause of mild and severe intellectual disabilities, with Fetal Alcohol
Syndrome as the second most common cause (Minns, 1997). Deficiency in iodine leading
to endemic cretinism is a common global cause of severe intellectual disabilities, and it is
preventable (Fryers, 1995).
McLaren and Bryson (1987) reviewed and reported approximate percentages from
epidemiological studies looking at causes (prenatal, perinatal, postnatal and unknown)
associated with levels of intellectual disabilities. For moderate to severe intellectual
disabilities, approximately 20 to 30% of those identified had prenatal causes such as
chromosomal abnormalities associated with their disabilities. Eleven percent of the cases
were associated with perinatal causes, such as perinatal hypoxia, while 3 to 12% were
associated with postnatal causes, such as brain injury, to account for their intellectual
disabilities. For 30 to 40% of the individuals, the cause of their moderate to severe
intellectual disabilities was unknown. It was also found that determining etiology of mild
intellectual disabilities was much less clear. For most of the cases (45 to 63%) the cause
of their mild intellectual disabilities was unknown.
Some risk factors for intellectual disabilities include low to extremely low birth
weight in newborns (Halsey, Collin & Anderson, 1996), maternal smoking during
pregnancy (Drews et. al., 1996), maternal age (especially relevant for Down syndrome),

10
and as reported by Camp et al. (1998), low socio-economic status, maternal IQ, multiple
births, low weight gain during pregnancy (<10 pounds), maternal anemia and maternal
urinary tract infection.
The financial costs of caring for individuals with intellectual disabilities demands
attention from various government-funded programs. These individuals have special
needs not only for their healthcare, but also for their housing, education and vocational
placements. In 2003, the Unites States spent $30 billion taking care of those with
intellectual disabilities (O’Grady, 2007). In the Netherlands, the intellectual disability
population made up 9% of the total disease-specific cost of care in 1994 (Polder et al.,
2002). Added to the cost of caring for such individuals is the fact that individuals with
intellectual disabilities have seen longer life expectancies (McCallion & McCarron,
2004). However, they experience more health problems compared to non-disabled
individuals paired by age and sex (van Schrojenstein Lantman-de Valk et al., 1997). Hand
(1994) found that in New Zealand for the ageing population of individuals with
intellectual disabilities (i.e., those born before 1940), epilepsy, cerebral palsy and
neurological impairment were the most common physical impairments. Forty-two percent
of the sample did not have any major or chronic physical impairment. Other common
physical impairments reported were hearing and visual impairments, heart disease,
mobility issues, diabetes, fractures and osteoporosis (Hand, 1994).
Individuals with intellectual disabilities are also at a greater risk for developing a
mental illness than non-disabled individuals (Borthwick-Duffy & Eyman, 1990). Those
who have an intellectual disability comorbid with mental illness and/or behavioural
problems [henceforth collectively termed, mental health problems] are considered to have
a ‘dual diagnosis’ (Yu & Atkinson, 1993). Although the prevalence for dual diagnosis
11
varies by sample, studies estimate that mental health problems affect 10 to 40% of adults
with intellectual disability (Reiss, 1990). Individuals with more severe intellectual
disabilities are less likely to be given a dual diagnosis than those with mild intellectual
disabilities (Borthwick-Duffy & Eyman, 1990). It may be that for those with severe
intellectual disabilities, evaluations of mental health problems are more challenging.
Mental health professionals have a tendency to ascribe behaviour problems, which may
be arising out of behaviour disorders, to being symptomatic of the individual’s
intellectual disability (Biasini et. al., 1997).
Along with morbidity issues that differ from the general population, those with
intellectual disabilities also have differing mortality rates than the general population. In a
study investigating the mortality rates of individuals with intellectual disabilities, the
mortality rates of those with Down syndrome were comparable to the typically
developing population until the age of 35 years (Strauss and Eyman, 1996). However, the
mortality rates doubled every 6.4 years for those with Down syndrome as compared to
every 9.6 years for those without Down syndrome (Strauss and Eyman, 1996). Frid et al.
(1999) reported that the common causes of death for those with Down syndrome were
congenital abnormalities, respiratory infections and neonatal complications. The age-
specific standardized mortality rates for individuals with intellectual disabilities were
found to be higher than in the general population, regardless of gender (McGuigan et al.,
1995).
12
1.2.4 Relevance of stigma to intellectual disabilities
From a sociological perspective, stigma is a social process that negatively labels
an individual. This labeling occurs due to an attribute that is perceived as a mark, such as
intellectual disabilities or mental health problems which subsequently devalues the
individual’s identity within their society (Goffman, 1963). Link and Phalen (2001) more
recently defined stigma as a process that allows not only for labeling, but also leads to
stereotyping, separation, status loss and discrimination within a power situation. Specific
to defining stigma, the setting of a power situation [i.e., imbalance] is the likely trigger
for a negative label. Thus, the conceptualization of stigma is not only contingent on the
label [i.e., identifying mark/disability] but the process of labeling as well [i.e., the
identified responding to actions of the identifier]. Additionally, the process of labeling
can be examined through two areas. One can either examine the group which partakes in
labeling (e.g., society), or the group which is identified/identifies with said label (attached
to disability).
1.2.5 Stigma by association
As well, stigma has far-reaching consequences that go beyond the stigmatized
individual, affecting those closely associated with them. This is known as ‘courtesy
stigma’ (Goffman, 1963) or ‘stigma by association’ (Mehta & Farina, 1988). Thus,
further entangling the matter is when stigma is indirectly identified, such as in stigma by
association, where the type of relation plays a role.
Social support most often comes from caregivers and family members who are
active participants in the lives of the individuals with intellectual disabilities. Parents are
often the primary social support for such individuals. Those who are parents of adults
13
with intellectual disabilities in Canada today, have had unique experiences. They have
dealt with their child’s condition since its early onset and have lived through a period of
significant changes in outlook with regards to care for individuals with intellectual
disabilities as their child has become an adult. Their experiences would reflect how they
coped with such changes and how stressors associated with parenting a child with
intellectual disability influenced their perceptions. Of particular interest, are parents’
perceptions of their own caregiving role, the impact on their family, their social contacts,
the impact on their child with special needs, and their perceptions of society.
Qualitative studies have shown that parents of individuals with intellectual
disabilities do experience stigma (Kearney & Griffin, 2001; Grey, 2002). Stigma
increases the perceived burden of caregiving tasks in parents (Green, 2003) and parents
sometimes blame themselves for their child’s condition (Mak & Kwok, 2010). Yet, far
less quantitative research has been done looking at the effects of stigma on these
individuals - the parents of individuals with intellectual disabilities.
14
1.3 Rationale:
For individuals with intellectual disabilities, the role of the primary caregiver falls
on the parents, and will likely continue on even as these individuals become adults. As
previously mentioned, parents were one of the key advocacy groups for recognition of
needs, in terms of support and services, for such individuals. As primary caregivers,
parents’ advocacy for better support and services for their children speaks to the gaps in
their own unmet needs in being able to provide sufficient care for their children. When
compared to parents of typically developing children, a predictor for morbidity of mental
health problems (depression and anxiety) in parents of individuals with intellectual
disabilities has been caregiver burden (Gallagher et al., 2008). As their children age and
become adults, new sets of caregiving challenges are likely to appear. Individuals with
intellectual disabilities are living longer, meaning their parents are taking on caregiving at
an even older age. Compounded with the fact that co-morbidities for physical ailments
and mental health disorders are higher in those with intellectual disabilities than in
typically developing individuals, these parents have to additionally provide for and
navigate such manifestations of added disabilities. It is thus necessary to understand the
parents’ experiences; especially possible barriers to their caregiving experiences, such as
stigma.
To understand this further, we undertook a literature review which is presented in
the next chapter. We reviewed the literature surrounding the nature of stigma, examples
of stigma via comparison of stigma in intellectual disabilities with the related, but more
prolific, stigma research on mental illness. We also looked at research evaluating stigma’s
effect on family members (stigma by association) along with a brief overview of the
availability of measurement tools to quantify such experiences. This provides insight into

15
the current state of research looking at stigma experiences of parents of adults with
intellectual disabilities.
16
CHAPTER 2: LITERATURE REVIEW
2.1 The Nature of Stigma
The term ‘stigma’ is used to refer to a mark of social disgrace. Its roots lie in ancient
Greece, where stizein was a physical mark placed on slaves in order for the public to
identify their position and social standing, as indicative of their lower social value. The
Latin word for it became instigare which means ‘to urge’, meaning that the marking
would lead to an action; an act of devaluation against the stigmatized individual (Lopez-
Ibor, 2002).
In modern society, Goffman (1963) first conceptualized stigma as a mark of social
disgrace in which the marked person was discredited or tainted on the basis of attributes
such as mental health problems, physical disability, intellectual disability, ethnicity, or
drug use. Those who bore a stigma were perceived as different from others and of a ‘less
desirable kind’. As such, the process of stigmatization starts with an acceptance of the
labeled difference by others, which leads to devaluation of the individual.
Of direct relevance to this thesis, stigma may also affect individuals, such as
family members or even health care providers, who are closely associated with the
stigmatized person (Ostman & Kjellin, 2002; Goffman, 1963).
Having a disability can become a two-fold challenge for an individual. Firstly, one
has to navigate in a primarily able-bodied society and face its accompanying struggles.
Additionally, society’s misconceptions about disability, rising from stereotypes and
prejudice, can lead to discrimination. Within this milieu, stigma becomes an important
topic of focus.

17
Sociologists have focused on stigma as a societal phenomenon rising from the
labeling of a person, which creates and maintains the disability or difference. Labeling
theory, first conceptualized by Howard Becker in his book Outsiders (1963), posits that
the behaviours and process of self-identification by an individual is dependent on the
influence of the terms used to label or classify the individual. Scheff (1968; 1984) first
applied labeling theory to mental health problems and suggested that a label could create
deviance as a consequence of society’s response to the labeled individuals. In the case of
mental illness, this meant that a diagnostic label could trigger negative social stereotypes
and stigmatizing responses which could, in turn, create a mental illness. Jones et al.
(1984) conceptualized stigma as occurring when a mark or label linked an individual, due
to his or her attributes, to undesirable characteristics. They outlined six dimensions of
stigma: concealability, course (whether the deviance was reversible with time),
disruptiveness, aesthetics (to what degree the perceived label elicited disgust), origin
(how the deviance came to be) and finally, peril (to what degree the mark elicited feelings
of fear and danger in others) (Jones et al., 1984).
Critics of labeling theory pointed out that diagnostic labels were not to blame. It was
the disorganized illness-related behaviour, rather than the diagnosis per se, that triggered
social stigma and discrimination. Modified labeling theory (Link et. al., 1989; Link &
Phelan, 2001) has since reconceptualized the labeling process and allows for both
possibilities. From this perspective, stigma is viewed as a complex social process in
which cognitive, emotional, and socio-structural elements converge within a power
situation, first to label, then to stereotype group differences; next to invoke prejudicial
reactions; then to create a separation between ‘us’ and ‘them’; and finally result in status
loss and discrimination. Internalization of stereotypes by the labeled individuals and the
18
resulting marginalization can exacerbate their existing conditions and increase their
vulnerability to additional disorders.
In comparison to sociologists, such as Goffman or Link, social psychologists are
interested in the cognitive and emotional processes that give rise to stigma, known as
stereotyping and prejudice, which may lead to discrimination (Dovidio, Major & Crocker,
2001). Stereotyping represents the collective concept of groups of persons, and
effectively allows people to make quick generalizations and expectations of individuals
belonging to the stereotyped group (Hamilton & Sherman, 1994). Prejudice, however,
occurs when people agree with stereotypes and, consequently, develop an emotional
reaction to the stereotype (Corrigan et. al., 2001). When people act on their prejudice,
they demonstrate discrimination (Corrigan et al., 2001). From this perspective, the term
stigma is often used to refer to negative and prejudicial attitudes, whereas discrimination
is reserved for the behavioural outcomes. Additionally, Corrigan and Watson (2002)
outline two major components to stigma: a public stigma, and self-stigma. The former is
when the general public has a reaction towards individuals with the deviance, and the
latter is when the individual applies the prejudice to self, leading to self-imposed
marginalization and withdrawal. It is important to note that in cases of self-stigma, the
individual not only applies the prejudice to self, but, also forms an identification with the
‘deviant group’ (Jacobsson, 2002). Thus, stigma begets stigma (Lopez-Ibor, 2002).
Self-stigma and fear of rejection by others can lead to an individual avoiding
social situations and failing to pursue opportunities such as employment and housing
(Corrigan & Watson, 2002b). Studies have also shown a negative correlation between
self-stigma and self-esteem such that higher levels of self-stigma were associated with
lower levels of self-esteem (Abraham et al., 2002; Holmes & River, 1998; Crocker &
19
Major, 1989). However, for some individuals, the effect of self-stigma may lead them to
become ‘righteously angry’ towards the perceived prejudicial treatment, which empowers
them to become advocates for fair treatment (Corrigan & Watson, 2002). Additionally,
the reaction to stigma for some others is neither one of hurt, nor one of empowerment,
but, general apathy and indifference to stigma (Corrigan & Watson, 2002).
Another approach to looking at stigma is by looking at ‘public stigma’. Public
stigma can have four types of consequences, as suggested by Corrigan and Watson
(2002): withholding help, coercive treatment, avoidance and segregated institutions. Such
process of stigmatization leading to discrimination towards individuals (for example,
those with mental illness) can create barriers in access to health care (Corrigan, 2000),
housing opportunities (Angermeyer et al., 2003), or even, employment (Corrigan & Penn,
1999).
In developing a public health oriented model of the process of stigma, Sartorius
(1999) suggests that stigma is a cycle of disadvantage. It begins with the condition which
manifests into a disability or impairment within society, such that stigma gets linked to
the condition as an impairment. This leads to discrimination which can reduce an
individual’s ability and opportunity for rehabilitation. In turn, such barriers can create a
malfunction in the individual’s social role such that the condition and its impairment are
more pronounced and the cycle starts again. Relevant to stigma by association, Sartorius
and Schulze (2005) also describe a ‘vicious cycle’ of stigma that reduces a family
member’s self-esteem, internal and external supports, and access to resources, which in
turn diminishes their capacity to resist further stigma and provide social support for their
relative with the condition.

20
The public health perspective on stigma is based on an ecological view that
includes both individual-level cognitive and emotional determinants, as well as the
broader psycho-social and political determinants of stigma. As such, public health
interventions may target actions at the legislative, economic, policy, research and public
awareness (education and communication) fronts (Stuart, 2008). For example, a report by
Senator Kirby, Out of the Shadows at Last (2006), calls for the need for a national
strategy to target mental illness in Canada, whereby he outlines the roadblocks towards
promoting mental health; stigma being a main hurdle. He outlines that stigma not only
affects community-based services and interventions, but that government also contributes
to stigma (Kirby, 2006). As employers of mental health care professionals, the provincial
government contributes to the stigma of mental illness by their treatment of the health
care professionals. As well, he states that the federal government had lacked initiative to
make mental health a national focus. This results in discrimination, as financial resources
for advocacy, research, prevention, and intervention programs are also lacking at all
levels of the government. In Canada, individuals with intellectual disabilities have health
disparities that prevent them from coping as well as the general population (Ouellette-
Kuntz et al., 2005). Some key health indicators which point to the disparities are issues
with mobility, lack of access to health and other services, as well as society’s perception
of intellectual disabilities. In 2007, a report to the Mental Health Commission of Canada
assessed stigma and discrimination and set forth recommendations to the government of
Canada to tackle the issue (Mental Health Commission of Canada, 2007).
Even though intellectual disabilities have historically been classified under the
category of mental health, specifically psychological disorders, initial interest in the study
of stigma as it related to psychological disorders arose mainly from mental illness
21
advocacy groups. Most of our understanding of stigma and mental health is based on such
mental illness research. As well, studies looking at stigma related to intellectual
disabilities have often focused on this group by comparing to stigma in those with mental
illness. The next section will review relevant literature dealing with stigma as broadly
relating to mental health, with specific comparisons between mental illness and
intellectual disabilities.
2.2 Stigma related to mental health problems and intellectual disabilities
Research has demonstrated that people with mental illness and intellectual
disabilities are among the most stigmatized of all social groups (Tringo, 1970; Thomas,
2000). It has been said that the consequences of stigma are more limiting, long-lasting
and devastating than the illness or disability itself (Schulze & Angermeyer, 2003).
The public perceives people with mental illness as potentially violent and
unpredictable (Royal College of Psychiatrists, 1999). Consequently, persons with mental
illness are feared and there is a clear desire to limit social interaction (Link et al., 1999).
While persons with an intellectual disability are frequently viewed as being more benign
and less fearsome than those with a mental illness (Hartlage & Roland, 1971; Rubin &
Roessler, 1983), they are less often perceived as stable (Corrigan et al., 2000), or as
potential friends (Gordon et al., 2004). Altman (1981), in reviewing findings of past
research, found that common stereotypes attributed to those with an intellectual disability
were dependency, sadness, and isolation which reduced role expectations and led to
restrictions on their behaviours and opportunities. In a study comparing the attribution
ascribed to persons with a physical disability, with a mental illness, and with an
intellectual disability, the latter were rated as least stable, while persons with a mental
22
illness were rated as least controllable (Corrigan et al., 2000). Some studies have found
that knowledge and experience with members of a group (Corrigan et al., 2001) is
inversely associated with prejudicial attitudes, both towards people with a mental illness
(Holmes et al., 1999) and those with an intellectual disability (Tak-fai Lau & Cheung,
1999). These studies highlight the complex interaction between cognitions, attitudes, and
socially discriminating behaviours.
A perspective less often taken by stigma researchers has been to look at the
experience of stigma from the viewpoint of the stigmatized individuals (e.g., Chung &
Wong, 2004; Dickerson et al., 2002; Stuart, et al., 2005; Stuart et al., 2008). To date, this
research has focused disproportionately on those with mental illness, perhaps because
persons with an intellectual disability often have serious communication impairments.
Persons with mental illness are aware of being stigmatized (Nuehring, 1979) and
often report feelings of demoralization, low self-esteem, and low self-confidence about
the future as a result of being negatively labeled (Holmes & River, 1998, Jones et al.,
1984; Link, 1987). Some persons with an intellectual disability are also aware that they
have a condition that is socially stigmatized. They report personal experiences of stigma
(Jahoda & Markova, 2004), and may suffer a loss of self-esteem as a result (Abraham et.
al., 2002). Research as old as thirty years has suggested that social interactions (Farina et.
al., 1971), job seeking (Farina & Felner, 1973), and house hunting (Page, 1977) are
among the many activities of daily life that are made more difficult for people with
mental health related disabilities.
23
2.3 Family experiences of stigma
Stigma is pervasive. It not only affects individuals who carry the stigmatizing
label, but also others who regularly associate with them (Ostman & Kjellin, 2002;
Goffman, 1963). For individuals with an intellectual disability, social support most often
comes from family members who are active participants in their lives and who may
themselves become targets for stigma (Lefley, 1987; Phelan et al., 1998; Struening et al.,
2001). Thus, as previously mentioned, this process whereby an individual is stigmatized
due to his or her association with a stigmatized individual is referred to as ‘courtesy
stigma’ (Goffman, 1963) or ‘stigma by association’ (Mehta & Farina, 1988). For
example, Mehta & Farina (1988) found that family members of individuals with mental
illness felt that they could not disassociate with the stigmatizing situation because they,
themselves, were not only the ‘marker’ but also the ‘marked’. By labeling their family
member’s disability, they became the ‘marker’, and by association to that family member,
they were also ‘marked’ by society.
Past family research in this area has generally been qualitative and focused on the
stigma experiences reported by families caring for someone with a mental illness.
Families have reported being avoided by others (Phelan et al., 1998) and feeling worried
they would be blamed for their relative’s mental illness (Shibre et al., 2001). Stigma
experiences were associated with feelings of hardship, psychological suffering, sleep
disturbances, relationship disturbances, poor quality of life (Kadri et al., 2004), and low
self-esteem (Wahl & Herman, 1989; Lefley, 1992; Shibre et al., 2001). Family members
have also reported strains on extended family relationships, along with distancing of other
relatives (Shibre et al, 2001; Struening et al., 2001). Especially for parents, guilt becomes
24
a manifestation of the internalization of stigma (Fink & Tasman, 1992; Turnbull &
Turnbull, 1978).
To date, only one study has looked at the stigma experiences of caregivers
(mothers, siblings, spouses and others) of individuals with a mental illness compared to
those of individuals with an intellectual disability (Mak & Cheung, 2008). They used a
22-items scale to measure respondents’ internalization of stigma with responses captured
using a 4-point Likert scale (strongly disagree to strongly agree). They found that
subjective burden, as perceived by the caregivers, was significantly related to levels of
stigma in both groups (mental illness and intellectual disability).
Though less often studied, parents, as primary caregivers of children with
intellectual disabilities, appear to report similar stigma experiences to those who have a
family member with mental health problems. For example, Gray (2002) looked at two
types of stigma experienced by parents of children diagnosed with high functioning
autism. Felt stigma was defined as the internalization of the stigmatizing ideas leading to
feelings of shame or fear of rejection (Gray, 2002). Enacted stigma was defined as
experiences of overt discrimination and rejection (Gray, 2002). The majority of the
parents reported feeling both types of stigma. Mothers were more likely to report stigma
than fathers, with aggressive behaviour in their child playing a role in the amount of
stigmatization that was felt (Gray, 2002). Birenbaum (1970) and Levinson and Starling
(1981) found that parents of children with intellectual disabilities reported feeling socially
excluded and having strained relationships. Sigelman et al. (1991) theorized that for
family members with blood ties to a stigmatized individual, it may be perceived that
family members share the gene responsible for the condition, thereby, tainting them.
25
Especially for parents, the perception may become that of self-blame for their child’s
stigmatizing condition (Mak & Kwok, 2010).
Other areas of research, though not directly looking at stigma, have evaluated the
negative outcomes that a parent might experience when raising a child with an intellectual
disability. Such negative outcomes include prolonged sorrow (Damrosh & Perry, 1989),
altered self-concept (Childs, 1985), decreased self-esteem (Cummings, 1976), depression
(Spangerberg & Theron, 2000), social isolation (Birenbaum, 1970), increased marital
problems (Bristol et al., 1988) and issues surrounding employment such as delayed entry
into the workforce or low employment rates (Seltzer et al., 2001).
However, parents of children with intellectual disabilities also report positive
experiences which may mitigate stigma. Parents who reported anguish and sorrow while
raising a child with an intellectual disability also spoke of positive impacts such as hope,
strength, joy and love (Kearney & Griffin, 2001). Abbott and Meredith (1986) found that
parents reported acquiring strength from raising a child with an intellectual disability in
the form of increased patience, increased compassion and greater appreciation for the
simple things in life. These studies suggest that in order to understand the impact of
having a child with an intellectual disability, we must look at negative (e.g., stigma), as
well as positive experiences of parents.
Finally, the impact of stigma on family members may vary (Gray, 2002; Sigelman
et. al., 1991) though the factors that might predict this have not been systematically
studied. Research into coping strategies has shown that family members may use different
tactics such as concealment to avoid shame and stigma (Phelan et al., 1998; Angermeyer
et al., 2003; Ohaeri & Fido, 2001; Shibre et al., 2001; Stengler-Wenzke et al., 2004).
26
These studies show that family members can experience considerable social isolation and
emotional distress because of stigma (Ablon, 1990; Blum, 1991; MacRae, 1999).
An area of research which incorporates the effects of stigma by association has
been research on the caregivers’ experiences (burden). Through such research, we have
seen initial attempts at measuring some aspects of stigma by association in parents of
individuals with mental health-related disabilities.
2.4 Availability of Measurement Tools
In most studies focusing on caregivers, stigma has been assumed to be a contributing
stressor in caregiver burden. This is illustrated mainly through research in caregiving of
individuals with mental illness. For example, Greenberg et al. (1993) asked mothers of
individuals with schizophrenia questions about stigma indirectly as part of a measurement
of caregiver burden, and found that lower levels of physical well-being in the mothers
were related to subjective burden of stigma and worrying. Szmukler et al. (1996) included
a 5-item stigma scale which was part of a larger inventory measuring the caregiving
experiences of family members of individuals with mental illness. They found that stigma
was one of the dimensions that made up the multidimensional construct of "caregiving
experiences".
Struening et al. (2001) developed a 7-item scale that looked at the extent to which
family members believed that society devalued families with a member who had a mental
illness. They found that 70% of the caregivers felt that most people devalued their family
member with a mental illness, while 43% felt that most people devalued them, the family
members of those with a mental illness. Green (2003) incorporated qualitative and
quantitative approaches to evaluate stigma by association in families of children (under
27
18) with disabilities. She found that maternal perceptions of stigmatization against
individuals with disabilities increased maternal distress (subjective burden). Children of
mothers who perceived high levels of stigma were found to be less interactive with peers
in informal social settings.
At the time of the present study, there were no measurement tools identified in the
literature aimed to directly measure experiences of stigma in caregivers of individuals
with an intellectual disability. Subsequently, one study has been published. Mak and
Cheung (2008) looked at stigma experiences in caregivers of individuals (children and
adults) with either an intellectual disability or a mental illness. They proposed that the
internalization of stigma by family members be known as affiliate stigma, distinguishing
it from stigma by association which may or may not be internalized psychologically at the
individual level, even if reported present. Within the cultural milieu of Chinese society,
caregivers, including mothers, siblings, spouses, and others, completed a self-
administered questionnaire comprised of scales measuring affiliate stigma, caregiving
stress, subjective burden and positive perceptions. They found that only in the intellectual
disability group of caregivers (i.e., mothers only), was there a significant negative
relationship between affiliate stigma and positive perception of caregiving, which failed
to be seen in the other group of caregivers (i.e., family members, such as parents, spouse,
siblings, children, and others, caring for those with a mental health problem).
28
2.5 Implications
In summary, tools aimed to measure stigma by association in caregivers of
individuals with mental health-related disabilities have mainly focused on mental illness
with only one recent tool focusing on intellectual disabilities (Mak & Cheung, 2008). As
well, no studies have looked specifically at parents of adults with intellectual disabilities.
Phases of caregiving bring significantly different stressors depending on whether the
individual being cared for is a child or an adult. With all the considerations of past
research and our direction of interest for a public health perspective of stigma in parents,
we looked to the field of research in stigma by association due to mental illness to offer
us a psychometric tool that could be adapted to capture stigma experiences in our current
study’s sample of parents of adults with intellectual disabilities (Stuart, et al., 2005; Stuart
et al., 2008).
29
CHAPTER 3: GOALS AND OBJECTIVES
There are two primary goals for this current study, with each containing objectives
for fulfilling those goals.
The two goals are:
(1) To test psychometric properties of three scales aimed to measure experiences of
parents of adults with intellectual disabilities.
Objectives:
(a) The first objective was to perform reliability testing; specifically, evaluating
the internal consistencies of three scales aimed to measure stigma and positive
changes experienced by parents.
(b) The second objective was to test the inter-correlation between all three scales.
(2) To describe the parents’ experience of having an adult child with an intellectual
disability.
Objective:
(a) Through sub-group analysis, possible associations between descriptive
characteristics of the sample and items measuring experiences of stigma were
evaluated.
30
CHAPTER 4: STUDY DESIGN AND METHODS 4.1 Study design
This cross-sectional study surveyed a sample of parents of adults with intellectual
disabilities in South Eastern Ontario, Canada. The survey was self-administered and took
approximately thirty minutes to complete. The Queen’s University Research Ethics Board
approved this study (see Appendix A for a copy of the certificate).
4.2 Sampling strategy
Potential parent participants were identified through information about their adult
child with an intellectual disability, contained within the Geographic Registry in
Intellectual Disability (GRID). GRID is a database of anonymized information about
individuals with intellectual disabilities within the six counties of South Eastern Ontario,
Canada, who are using, or waiting for, supports and services offered by 36 community-
based agencies. The information is updated annually and the database is maintained by
the South Eastern Ontario Community-University Research Alliance in Intellectual
Disabilities (SEO CURA in ID; www.seocura.org).
Although 36 agencies provide data for the GRID database, only 33 of those
agencies serve adults with intellectual disabilities, while the rest serve children only. The
33 agencies were sent an initial invitation (see Appendix B) to participate in the current
study. Agencies that agreed to participate (23 in total) were sent a letter along with a list
compiled through GRID of all adult clients served by them (see Appendix C). The list
identified the adult clients through an agency number, initial of last and first name,
residential setting, date of birth and gender. Staff from the agency indicated for which

31
adults the agency had contact information for a parent who was eligible for this study and
mailed the list back to the investigators. The investigators then sent a letter of instruction
(see Appendix D) and the appropriate number of packages to the agency contacts, who
mailed the packages, on the investigators’ behalf, to those potential parent participants
previously identified by the agency.
The survey package included a cover letter (see Appendix E), a response booklet, i.e.,
the survey questionnaire (see Appendix F), which consisted of two parts, and a postcard
(see Appendix G). The postcards were included to identify those participants who were
interested in the results of the study. The participants were instructed to mail the postcard
separately from the survey questionnaire so that their anonymity would be maintained.
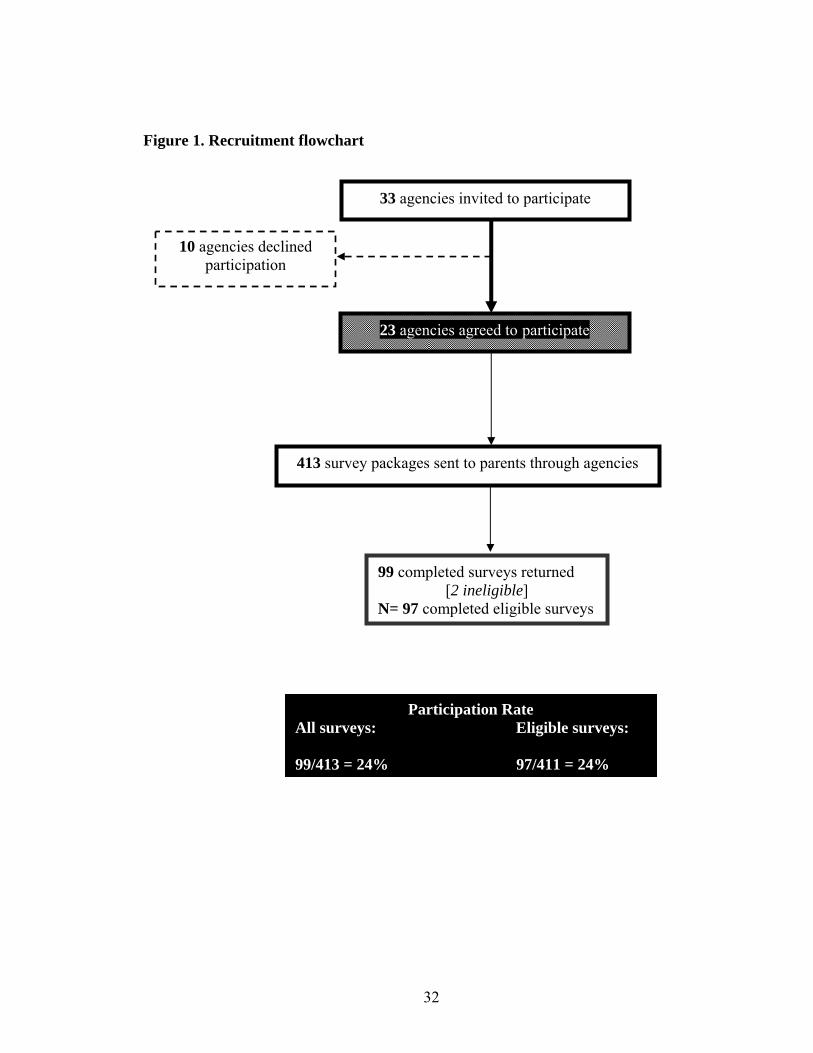
A total of 413 packages were sent to the 23 agencies. The parent participants filled
out and mailed back the completed surveys to the investigators using postage-paid
envelopes provided within their survey packages. A total of 99 packages were returned
between the recruitment times of November, 2008 to July, 2009. Of those 99 completed
surveys returned, two were ineligible as they were not filled out by parents but other
family members (grandparent, sister), giving a total of 97 usable surveys for the study.
Thus, the participation rate for the study was 24%. The recruitment of participants is
outlined in a flowchart (Figure 1).
32
Figure 1. Recruitment flowchart
33 agencies invited to participate
10 agencies declined participation
23 agencies agreed to participate
99 completed surveys returned [2 ineligible]
N= 97 completed eligible surveys
Participation Rate All surveys: Eligible surveys: 99/413 = 24% 97/411 = 24%
413 survey packages sent to parents through agencies
33
4.3 Measures
As mentioned, the survey questionnaire consisted of two parts. The first part asked
parents to provide information about their adult child with special needs including type of
relationship to parent respondent (biologic, adoptive, step parent or other), whether the
child lived with the parent, whether the child had ever lived or was currently living, in a
group home or institution, the child’s age, gender, specific type of disability and whether
the child had ever been in conflict with the law. It also asked for socio-demographic
information about the parent completing the survey, such as gender, year of birth, highest
level of education, living arrangement (alone, with a spouse, a relative, unrelated person,
or other), marital status, employment status and whether the parent had been the primary
caregiver of the adult child with special needs. The second part consisted of The
Inventory of Stigmatizing Experiences: Family Version (Stuart et al., 2008), containing
two stigma scales, reworded to be appropriate for the current study population, and the
Parental Changes Subscale (The Life Management Survey Part III-Parental Changes
Subscale, Scorgie & Sobsey, 2000).
The Inventory is comprised of 19 fixed-response items and 18 open-ended descriptive
questions to provide qualitative data to give further insight to the scale questions. It
consists of the Stigma Experience Scale and the Stigma Impact Scale. When tested in a
Canadian population of family members of adults with severe mental health problems
(n=61), 20% indicated that they had been personally stigmatized due to their relative’s
mental health problems while 52% reported that stigma had negatively affected their
family’s “quality of life” (Stuart et. al., 2008).
A pilot test of the Inventory was conducted once it was developed for the current
study’s population by asking a focus group of parents of adults with intellectual

34
disabilities for feedback on the scales. One comment was that the scales were ‘too
negative’ and that to truly understand the scope of parents’ experiences, a positive scale
should be included. Such recommendation is supported by research as well. For example,
Kearney and Griffin (2001) found that the parents, although reporting anguish and
sorrow, also reported positive impacts of having children with intellectual disabilities,
including hope, love, strength, and joy. Thus, it was considered important to investigate
the impact of stigma experienced by parents of adults with intellectual disabilities within
a broader context that includes positive changes that may have resulted from caring for a
child with a disability. Another study conducted in the same geographic region, which
looked at the experiences of preschoolers and their parents as the children transitioned to
school, applied a scale that captured positive experiences reported by parents (Clifford,
2007). The same scale, The Life Management Survey Part III-Parental Changes Subscale
(Scorgie & Sobsey, 2000), was included in the current study to capture positive changes
associated with having an adult child with a disability which was used to compare to
stigma experiences.
4.3.1 Stigma Experience Scale
As established by Stuart et al. (2008), the Stigma Experience Scale is a frequency
scale based on 7 items which was developed to be applied to people who have serious
mental health problems and are living in the community. Four items are scored on a 5-
point Likert-type scale, raging from ‘never’ to ‘always’. Items are then recoded into
binary variables to reflect the presence or absence of each specific stigma experience such
that ‘never’, ‘rarely’ and ‘sometimes’ are recoded as zero to reflect the absence of stigma,

35
and ‘often’ and ‘always’ are recoded as one to reflect the presence of stigma. The
remaining three items are scored using the response categories (yes, no, unsure) and
recoded to reflect the presence (yes) or absence (no and unsure) of stigma. Values are
then summed across the seven items for a scale score ranging from 0 to 7. The coefficient
of reliability for this scale was good (KR-20=0.76) when applied to family members of
adults with serious mental health problems meaning that the scale achieved an acceptable
level of internal consistency (acceptable being ≥0.70; Nunnally, 1978).
Dichotomizing the responses in the Stigma Experience Scale was done so that
parents’ responses of stigma experiences could first be evaluated as either present or
absent. The degree of their stigmatizing experiences would be subsequently captured
using the Stigma Impact Scale.
4.3.2 Stigma Impact Scale
The Stigma Impact Scale (Stuart et al., 2008) is an intensity scale based on 7
items. The items are rated on an 11-point scale ranging from 0 (no impact) to 10 (highest
impact). The values for the items are summed, giving a scale score that ranges from 0 to
70. The coefficient of reliability for this scale was excellent (α=0.93) when applied to
family members of adults with serious mental health problems which greatly surpasses
the acceptable level of internal consistency.
36
4.3.3 Parental Changes Subscale
The Parental Changes Subscale aims to measure the positive changes associated
with having a child with intellectual disabilities. This scale consists of 18 items. Each
item in the scale is rated on a 5-point Likert scale ranging from 1 (Strongly Disagree) to 5
(Strongly Agree), for a total score ranging from 18 to 90. For the current study, a
response choice of ‘not applicable’ was applied to a question related to marriage. No
reports of the internal consistency (reliability) for this subscale were found.
4.4 Data management
Responses to questions were double-entered into a database using SPSS Data
Entry Builder 4.0. Due to the sensitive nature of certain questions, all surveys were
anonymous. As such, there was no possibility of follow-up with respondents for resolving
missing data. A clean up of the database was initially performed by agreement between
two investigators who corrected for obvious missing information for scale questions as
inferred by answers to their related open-ended questions. For the rest of the scale
questions, missing values were left unaltered. The number of missing values per scale
item ranged from 1 to 7 for the stigma scales and from 1 to 18 for the Parental Changes
Subscale once the above-noted corrections were performed. The Stigma Experience Scale
had loss in sample size as, out of a total of 97 respondents, 82 responded to all items
pertinent to this scale. For the Stigma Impact Scale, 93 out of 97 respondents responded
to all items pertinent to this scale while for the Parental Changes Scale, only 51 out of 97
respondents answered all items within the scale. Two imputation techniques were applied

37
to the incomplete dataset: median imputation and hierarchical hot-deck imputation.
Median imputation is when the missing value is replaced with the median score of the
observed values for that item within the total sample of respondents. Hierarchical hot-
deck imputation (Aday & Cornelius, 2006) is a way of imputing data where sub-classes
are created for respondents and non-respondents based on cross-classification of broader
groups (e.g., age, gender, employment status). The non-respondent with the missing item
is matched to a respondent based on matching sub-class grouping. If a match fails to be
made, the more detailed subclass is collapsed to a broader grouping (e.g., age by gender
only) until a match is found. In our study, we used the 13 descriptive parent and adult
child characteristics to create sub-class groupings when performing hierarchical hot-deck
imputation. If more than one match was found, we used the nearest neighbour (closest in
dataset) to impute the missing value. The coefficients of reliability showed comparable
results for each of the three scales between the original database containing the missing
values and the databases with median imputation and hierarchical hot-deck imputation
applied. This indicated that missing values probably did not affect the reliabilities of the
three scales, and thus, the original data (i.e., without imputation) was used for analysis.
Certain demographic questions were recoded to either make the variable
categorical (age) or the set of responses within a category were collapsed to manageable
and meaningful subgroups, for analyses. Age of parent, which was a continuous variable,
was made into a categorical variable, representing three age categories that also logically
defined and divided our group of parents: 45-54, 55-64 and 65 years and up. The
respondent’s employment status was initially categorized as full-time, part-time, or not
employed with the last category further specifying to reflect whether the respondent was a
homemaker, a volunteer, retired, or other. This was recoded into a dichotomous variable
38
reflecting full-time and part-time employment as employed competitively while the rest
of the responses reflected unemployed. The respondent’s highest level of education was
initially categorized as public school or less, some high school, completed high school,
some college or technical training, completed college or technical training, some
university, completed university and graduate or professional degree. Those whose
highest education level was either some or completed public (n=8) did not differ
significantly from those whose highest level of education was some high school or
completed high school (n=40) for any of the seven items in the Stigma Experience Scale
(see Appendix H for all contingency tables and their accompanying Fisher’s exact test
statistic with p-values). Thus, given the small sample of respondents representing the
education category of “some or completed public school”, this category was collapsed
into a broader category including all respondents whose highest level of education ranged
from either public school or less, some high school or completed high school. As such the
eight categories representing the sample’s highest education level were collapsed into
three categories reflecting: (1) either some or completed public school or some or
completed high school, (2) some or completed college or technical training, and (3) some
or completed university or graduate/professional degree.
The parent’s living arrangement initially reflected five categories: alone, with
spouse or partner, with another relative, with an unrelated person and other. These five
categories were collapsed to reflect three categories: alone, with a spouse or partner, and
other. The parent’s relationship to the adult child was initially categorized as biological
parent, adoptive parent, step parent, or other, in which case the respondent was asked to
specify. These four categories were collapsed to reflect two categories: biological parent
or other. The adult child’s age was also a continuous variable which was recoded into a
39
categorical variable reflecting four groups of adult children: 18-24, 25-34, 35-44 and 45
years and older. Mental health problem (including behaviour problems) in the adult child
as reported by the parent was recoded as having a dual diagnosis.
4.5 Data analysis
Data were analyzed using SPSS 17.0. Descriptive statistics were performed
including frequency distributions of parent and child characteristics.
Objective 1a): “The first objective was to perform reliability testing; specifically,
evaluating the internal consistencies of three scales aimed to measure stigma and
positive changes experienced by parents.”
For the Stigma Experience Scale, frequency of endorsement of scale items was
presented where endorsement signified a recoded response corresponding to the
dichotomous category where 1 reflects a presence of stigma. The median of the total scale
score was calculated. The internal consistency of the scale was evaluated. First, the item-
rest correlation for each scale item was analyzed along with the coefficient of reliability if
the item was removed. Finally, Kuder-Richardson 20 statistic was computed for the
Stigma Experience Scale due to the binary nature of the adjusted responses.
For the Stigma Impact Scale, the median of the total scale score was calculated.
The median and range of responses were also evaluated at the item level. The item-rest
correlations, alpha if item was deleted and the overall Cronbach’s alpha for the scale were
also reported. The endorsement of a response, reflecting an impact (≥ 1), was calculated
40
per item. As well, the distributions of the responses (possible range of 0-10), for each of
the 7 items, were presented graphically.
The frequency of responses for each response category within an item in The
Parental Changes Subscale were calculated and presented, along with the median for
each item, the item-rest correlation and the alpha if an item was deleted. The overall
median and range for the total score were computed for this scale. The number of missing
responses, per item, was also noted and presented graphically. Finally, the Cronbach’s
alpha for the scale was calculated.
All analyses for the three scales were performed using only those respondents who
answered all relevant items pertaining to the scale. The distribution of the total scores for
each of the three scales was graphed to evaluate whether each appeared to be normally
distributed (see Appendix I). If the sample size dropped noticeably (>10), cross-
tabulations were performed between 13 descriptive characteristics of the respondent
group and the non-respondent group to see whether there were any significant differences
(p<0.05) between the respondents included in the scale analysis compared to the group of
non-respondents. The statistics performed were chi-square analysis and when individual
cell count was 5 or less, Fisher’s exact test was applied in its place.
Objective 1b): “The second objective was to test the inter-correlation between all
three scales.”
Spearman’s rank order correlation was performed between the total scores on the
Stigma Experience Scale and the Stigma Impact Scale, between the Stigma Impact Scale
and the Parental Changes Subscale and finally between the Stigma Experience Scale and
41
the Parental Changes Subscale to evaluate whether there was a significant correlation
between the scales. Graphical representations of the inter-correlations between the scales
are presented in Appendix J.
Objective 2a): “Through sub-group analysis, possible associations between
descriptive characteristics of the sample and items measuring experiences of
stigma were evaluated.”
For each of the seven scale items in the Stigma Experience Scale, a contingency
table analysis was performed against each of the thirteen categorical demographic
variables: gender of child, age of child, relationship of parent to child, whether the child
lived with parent respondent, whether the child ever lived or were currently living in a
group home or institution, whether the child ever had a conflict with the law, dual
diagnosis status of the child, age, gender, employment status, living arrangement, highest
level of education of the parent respondent and whether the parent was the primary
caregiver to the adult child. All chi-square analyses (or Fisher’s exact tests) that achieved
a p-value of less than 0.05 are presented in text while the remaining analyses are
presented in Appendix K.
Sample size calculations were performed before the study was undertaken. The
focus of our sample size calculations were aimed to be able to meet our primary objective
(1a) (see Appendix L). As such, power analysis was not conducted to determine the
minimum sample size required to fulfill our secondary objective (2a) which is exploratory
in nature.
42
CHAPTER 5: RESULTS
5.1 Demographic information
The total sample size was 97 but descriptive data for all respondents and their
adult children were not available resulting in missing data for some categories.
Table 1 presents the characteristics of the parent respondents and the number of
missing respondents for each category. For the parent respondent characteristics, most
were mothers (78%), biological parents (90%) and slightly more than half (52%) of the
respondents were seniors (i.e. 65 years or older), with respondent age ranging from 44
years to 89 years. Approximately three-fourths of the respondents were currently the
primary caregivers of their adult child (76%). Most respondents lived with a spouse or
partner (69%). The majority of respondents were not employed (72%), specifying that
they were either retired or a homemaker, and 50% of the respondents had either
undergone some or completed public school or some or completed high school for their
highest level of education.
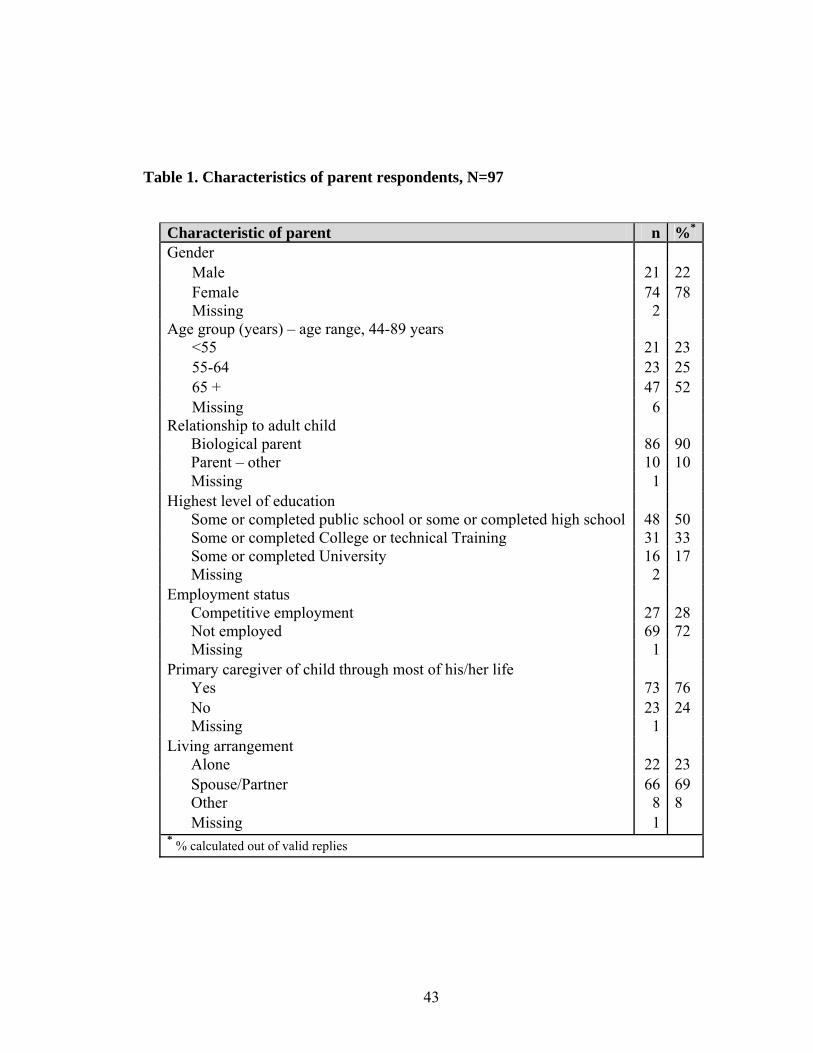
43
Table 1. Characteristics of parent respondents, N=97
Characteristic of parent n %*
Gender Male 21 22 Female 74 78 Missing 2
Age group (years) – age range, 44-89 years <55 21 23 55-64 23 25 65 + 47 52 Missing 6
Relationship to adult child Biological parent 86 90 Parent – other 10 10 Missing 1 Highest level of education Some or completed public school or some or completed high school 48 50 Some or completed College or technical Training 31 33 Some or completed University 16 17 Missing 2 Employment status Competitive employment 27 28 Not employed 69 72 Missing 1 Primary caregiver of child through most of his/her life Yes 73 76 No 23 24 Missing 1 Living arrangement Alone 22 23 Spouse/Partner 66 69 Other 8 8 Missing 1 * % calculated out of valid replies

44
Table 2 presents the characteristics of the adult children as reported by parents
along with the number of missing items for each category. Approximately 60% reported
that their child was male and the age of the adult children ranged from 18 to 67 years.
Forty-seven percent of the adult children currently lived with their parents, even though,
as seen in Table 1, 76% of the parents reported that they were the primary caregivers of
their adult children. Thus, although three-fourths of the parents listed themselves as the
primary legal caregivers to their adult children, not all of them had their children
currently living with them. Forty-eight percent of the total sample of parents reported that
their child was either currently living, or had lived, in a group home setting or institution.
We could not ascertain how many respondents’ children were currently living in those
settings at the time of the study because our survey did not ask them to specify. Eighteen
percent of the parents reported that their adult children had been in conflict with the law.
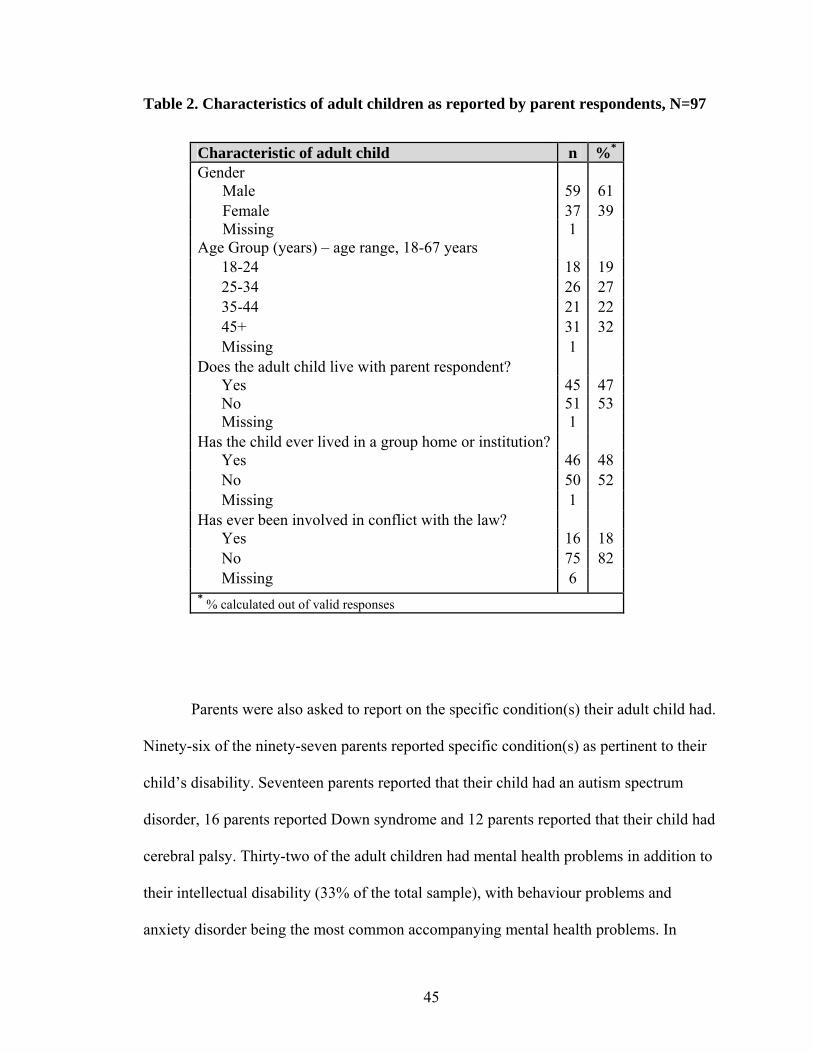
45
Table 2. Characteristics of adult children as reported by parent respondents, N=97
Parents were also asked to report on the specific condition(s) their adult child had.
Ninety-six of the ninety-seven parents reported specific condition(s) as pertinent to their
child’s disability. Seventeen parents reported that their child had an autism spectrum
disorder, 16 parents reported Down syndrome and 12 parents reported that their child had
cerebral palsy. Thirty-two of the adult children had mental health problems in addition to
their intellectual disability (33% of the total sample), with behaviour problems and
anxiety disorder being the most common accompanying mental health problems. In
Characteristic of adult child n %* Gender
Male 59 61 Female 37 39 Missing 1
Age Group (years) – age range, 18-67 years 18-24 18 19 25-34 26 27 35-44 21 22 45+ 31 32 Missing 1 Does the adult child live with parent respondent? Yes 45 47 No 51 53 Missing 1 Has the child ever lived in a group home or institution? Yes 46 48 No 50 52 Missing 1 Has ever been involved in conflict with the law? Yes 16 18 No 75 82 Missing 6 * % calculated out of valid responses
46
addition, some adult children lived with epilepsy or seizure disorder (n=23), vision
impairments (n=18), hearing impairments (n=13), and/or mobility issues (n=18).
5.2 Psychometric testing of scales
5.2.1 Stigma Experience Scale
Only those respondents who had a complete set of responses for all seven items
were included in determining the internal consistency of the Stigma Experience Scale.
Eighty-two of the 97 respondents met this criterion. This subgroup did not differ
significantly from the non-respondents in terms of respondent and child characteristics
(refer to Appendix M for all contingency tables and accompanying chi-square or Fisher’s
exact test statistics).
The overall scale scores (sum of all seven dichotomized items in the scale) ranged
from 0 to 6 (out of a possible maximum of 7), with a median scale score of 1.
Table 3 reports the number and percentage of endorsement for each item in the
scale, the item-rest correlation, the coefficients of reliability for the scale if each item is
removed and the overall Kuder-Richardson coefficient of reliability for the scale scores.
For the 82 respondents, endorsement for each of the seven items within the Stigma
Experience Scale ranged from 10% to 40%. Approximately a quarter of the parents
responded that they believe that the average person is afraid of individuals with
intellectual disabilities, that their son or daughter has been stigmatized due to his/her
condition, or felt that stigma by association had affected their family’s ability to interact
with relatives, or their family’s quality of life. In addition, forty percent of the parents
47
agreed that people think less of those with an intellectual disability, yet only 10% said
that they felt personally stigmatized due to their child’s condition. Three of the seven
items on the Stigma Experience Scale fell below the 0.40 recommended level for item-
rest correlation. Two of these items also had low endorsement: those querying whether
the parents felt stigmatized due to their child’s disability (endorsement: 10%, item-rest
correlation: 0.37), and whether stigma affected the parent’s ability to make or keep
friends (endorsement: 17%, item-rest correlation: 0.30). The Kuder-Richardson
coefficient of reliability (KR-20) for the Stigma Experience Scale was 0.70, which falls
within the minimal acceptable range for reliability (Nunnally, 1978). None of the
individual items significantly increased the overall KR-20 if they were to be deleted. The
KR-20, if individual item was deleted, ranged from 0.63-0.70, with only one coefficient
of reliability falling within the minimal acceptable range of 0.70 if the item was deleted
(item: whether stigma affected respondent’s ability to make or keep friends).
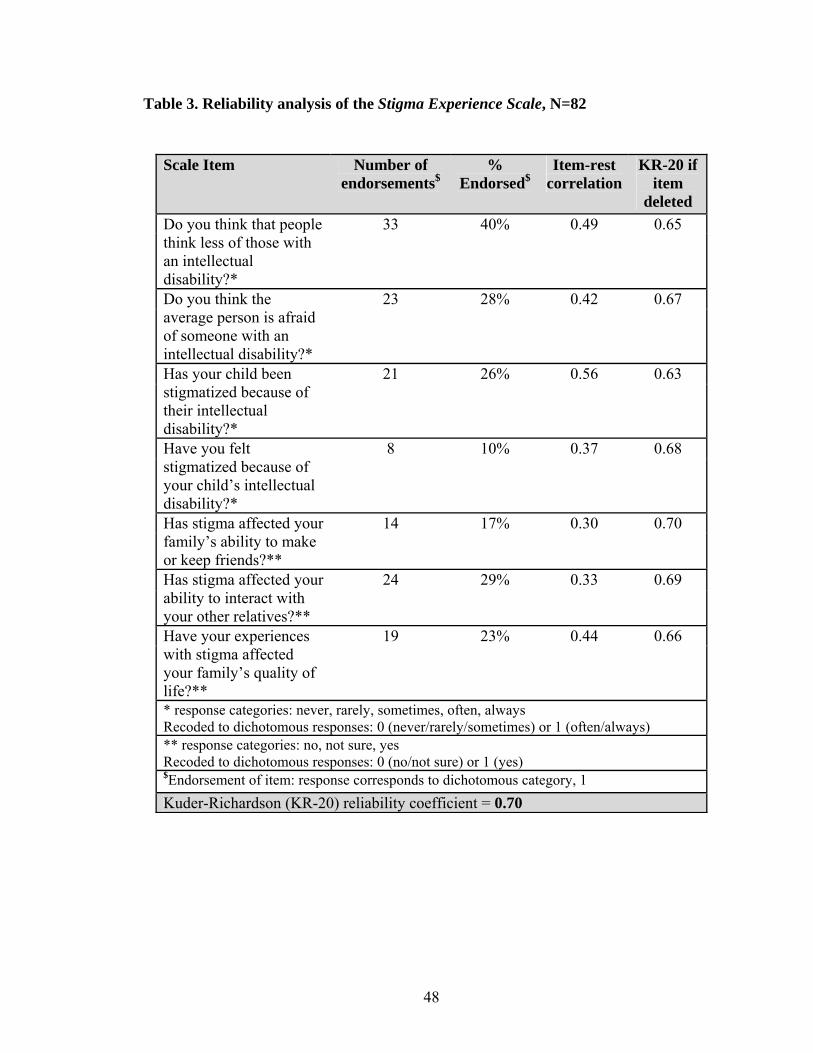
48
Table 3. Reliability analysis of the Stigma Experience Scale, N=82
Scale Item Number of endorsements$
% Endorsed$
Item-rest correlation
KR-20 if item
deleted Do you think that people think less of those with an intellectual disability?*
33 40% 0.49 0.65
Do you think the average person is afraid of someone with an intellectual disability?*
23 28% 0.42 0.67
Has your child been stigmatized because of their intellectual disability?*
21 26% 0.56 0.63
Have you felt stigmatized because of your child’s intellectual disability?*
8 10% 0.37 0.68
Has stigma affected your family’s ability to make or keep friends?**
14 17% 0.30 0.70
Has stigma affected your ability to interact with your other relatives?**
24 29% 0.33 0.69
Have your experiences with stigma affected your family’s quality of life?**
19 23% 0.44 0.66
* response categories: never, rarely, sometimes, often, always Recoded to dichotomous responses: 0 (never/rarely/sometimes) or 1 (often/always) ** response categories: no, not sure, yes Recoded to dichotomous responses: 0 (no/not sure) or 1 (yes) $Endorsement of item: response corresponds to dichotomous category, 1 Kuder-Richardson (KR-20) reliability coefficient = 0.70

49
5.2.2 Stigma Impact Scale
Only those respondents who had a complete set of responses for all seven items
were included in the analysis of reliability for the Stigma Impact Scale. Ninety-three of
the 97 respondents met this criterion. The range of possible responses for the sum of all
seven items in the scale was from 0 to 70, with the range of responses for each item
scaling from 0 to 10. The total median scale score was 13. At the item level, the median
scores for all items were 1 except for the item asking about the impact of stigma on the
respondent, personally, with regards to social contact, for which the median was 2.
Table 4 reports the item-rest correlation coefficients for each item, the alpha if the
item is removed, as well as, the reliability coefficient for the scale. Item-rest correlation
coefficients ranged from 0.74 to 0.91. The Cronbach’s alpha, coefficient of reliability, for
the Stigma Impact Scale was 0.95, indicating excellent internal consistency of the scale
scores. As reported in Table 4, removing any one of the seven items from the scale still
maintained an alpha within the range of 0.94-0.95.

50
Table 4. Reliability analysis of the Stigma Impact Scale, N=93
Scale Item
Item-rest correlation
Alpha if item deleted
On a 10-point scale, where 0 is the lowest possible amount, and 10 is the highest possible amount, how much has stigma affected you personally? Quality of life 0.87 0.94 Social contacts 0.85 0.95 Family relations 0.82 0.95 Self-esteem 0.74 0.95 On a ten-point scale where 0 is the lowest possible amount, and 10 is the highest possible amount, how much as stigma affected your family as a whole? Quality of life 0.91 0.94 Social contacts 0.87 0.94 Family relations 0.84 0.95 Cronbach’s alpha reliability coefficient = 0.95
Additionally, for the total sample of respondents, the percentages of people who
endorsed an impact score of ≥1 for individual items, ranged from 54% to 63% across the
seven items. This indicates that over half of the respondents reported some level of
impact of stigma (i.e., a score ranging from 1 to 10), for each individual item within the
Stigma Impact Scale (see Figures 2 and 3). However, as one response category out of a
possible eleven (range of responses, 0-10), a response of no impact (i.e., 0) was chosen by
over 30% of the respondents, for each item, with no other response categories achieving
such high endorsements.
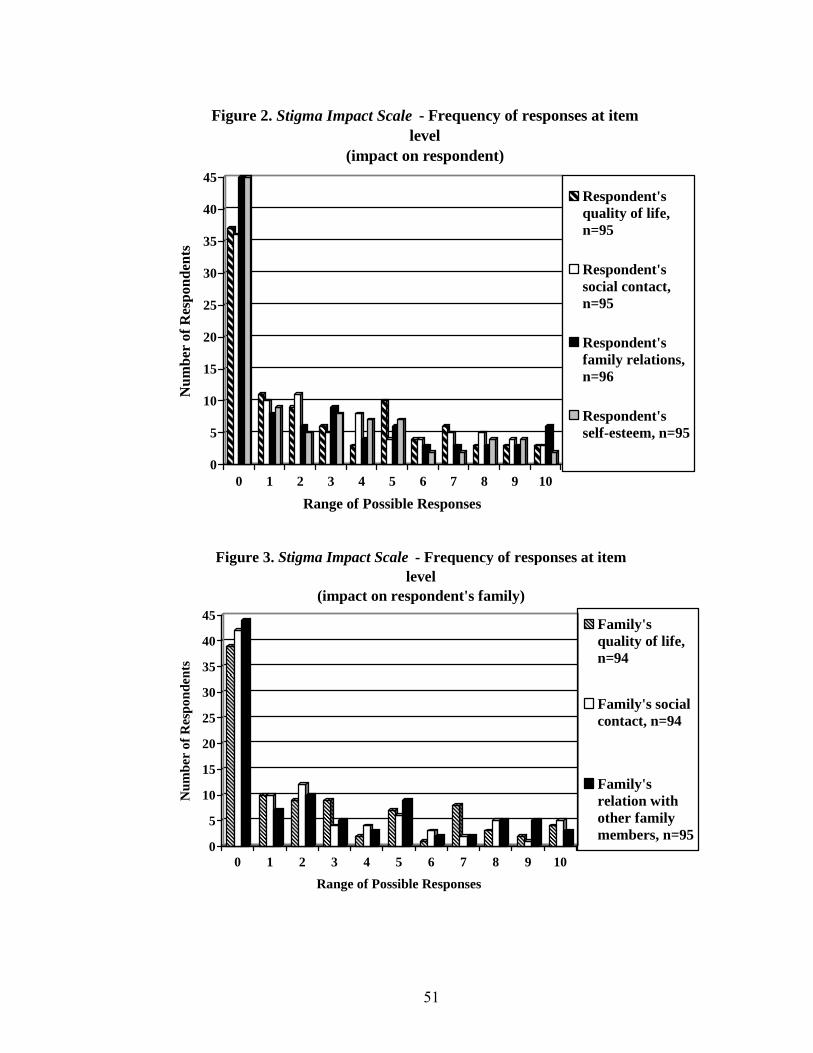
51
0
5
10
15
20
25
30
35
40
45N
umbe
r of
Res
pond
ents
0 1 2 3 4 5 6 7 8 9 10
Range of Possible Responses
Figure 2. Stigma Impact Scale - Frequency of responses at item level
(impact on respondent)
Respondent'squality of life,n=95
Respondent'ssocial contact,n=95
Respondent'sfamily relations,n=96
Respondent'sself-esteem, n=95
0
5
10
15
20
25
30
35
40
45
Num
ber
of R
espo
nden
ts
0 1 2 3 4 5 6 7 8 9 10
Range of Possible Responses
Figure 3. Stigma Impact Scale - Frequency of responses at item level
(impact on respondent's family)
Family'squality of life,n=94
Family's socialcontact, n=94
Family'srelation withother familymembers, n=95
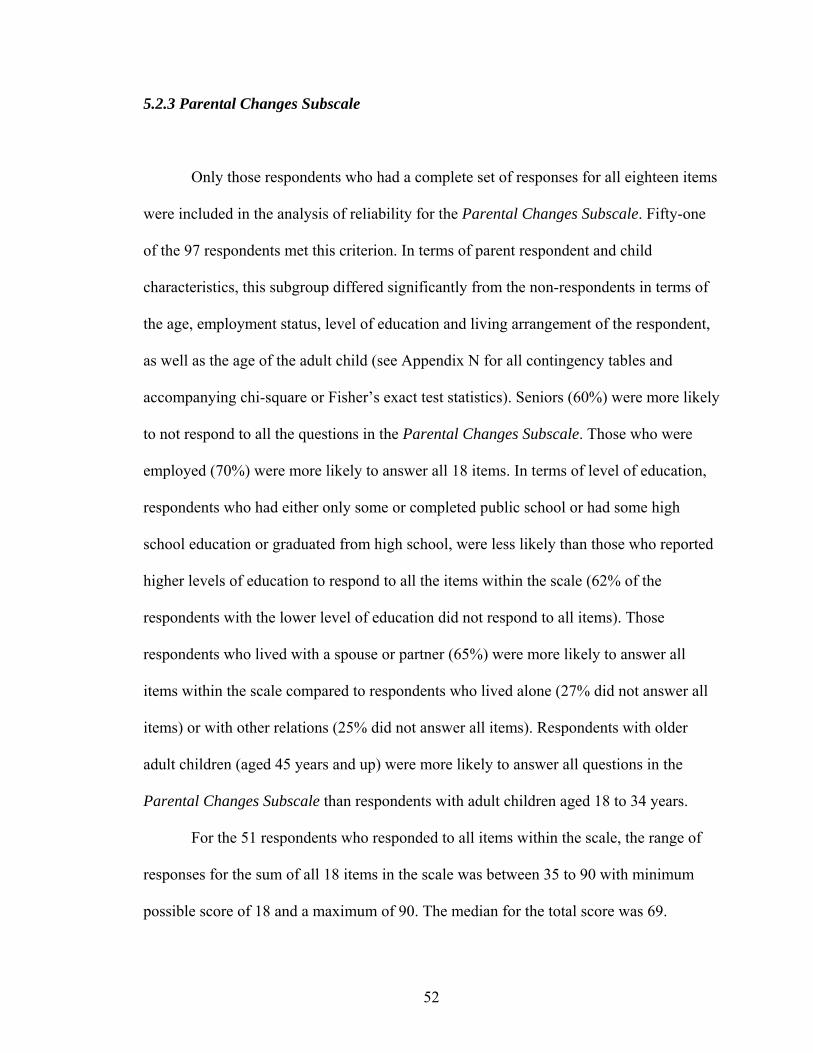
52
5.2.3 Parental Changes Subscale
Only those respondents who had a complete set of responses for all eighteen items
were included in the analysis of reliability for the Parental Changes Subscale. Fifty-one
of the 97 respondents met this criterion. In terms of parent respondent and child
characteristics, this subgroup differed significantly from the non-respondents in terms of
the age, employment status, level of education and living arrangement of the respondent,
as well as the age of the adult child (see Appendix N for all contingency tables and
accompanying chi-square or Fisher’s exact test statistics). Seniors (60%) were more likely
to not respond to all the questions in the Parental Changes Subscale. Those who were
employed (70%) were more likely to answer all 18 items. In terms of level of education,
respondents who had either only some or completed public school or had some high
school education or graduated from high school, were less likely than those who reported
higher levels of education to respond to all the items within the scale (62% of the
respondents with the lower level of education did not respond to all items). Those
respondents who lived with a spouse or partner (65%) were more likely to answer all
items within the scale compared to respondents who lived alone (27% did not answer all
items) or with other relations (25% did not answer all items). Respondents with older
adult children (aged 45 years and up) were more likely to answer all questions in the
Parental Changes Subscale than respondents with adult children aged 18 to 34 years.
For the 51 respondents who responded to all items within the scale, the range of
responses for the sum of all 18 items in the scale was between 35 to 90 with minimum
possible score of 18 and a maximum of 90. The median for the total score was 69.

53
Table 5 reports on all 51 respondents’ percentage endorsement for each of the five
response categories per item, the median score for each item, the item-rest correlation per
item, the coefficient of reliability if the item was removed and the Cronbach’s alpha for
the scale given all 18 items.
Median scores of 5 were achieved for four of the eighteen items when parents
reported positive changes in themselves, due to their child, in the following ways: (1)
learned to speak out for their child, (2) became a stronger person, (3) became more
compassionate towards others, and (4) learned to see life from a different perspective.
For only one item, the item-rest correlation dropped below the acceptable level of 0.40 to
0.31 (item: marriage emerged stronger due to child’s disability). Alpha if an item was
removed stayed within the range of 0.92-0.93 for all eighteen items in the scale. The
Cronbach’s alpha for the Parental Changes Subscale was 0.92.
Endorsement for each of the five response categories, at the item level, showed
that for the majority of the items, parents mostly agreed or strongly agreed with each of
the 18 items. However, 24% of the parents strongly disagreed that caring for their adult
child led to a vocational or career change. Responses from parents evenly ranged across
all response categories when asked if they made close friends due to their child’s
condition, if they felt a change towards stronger spiritual conviction and if they felt that
their marriage emerged stronger due to their child’s disability. Thus, there were no trends
in positive changes, for those domains, due to their child’s disability. Out of the three
scales, the Parental Changes Subscale experienced the largest number of missing items.
Questions which asked about the respondent’s marriage and vocation/career had over
20% missing for those items (see Figure 4).

54
Table 5. Reliability Analysis of the Parental Changes Subscale, N=51
% endorsement of response categories
Parental Changes Subscale Responses: 1- strongly disagree, 2- disagree, 3 – don’t know, 4- agree, 5 – strongly agree 1 2 3 4 5
Median Item-rest correlation
Alpha if item removed
1. I have learned to speak out for my child. 2 2 4 34 58 5 0.53 0.92 2. I have learned that I can achieve rather than feel powerless. 5 2 12 43 38 4 0.57 0.92 3. I am more compassionate toward others. 1 1 3 25 70 5 0.52 0.92 4. I have made a career change, which has led to greater vocational satisfaction.
24 22 24 16 14 3 0.69 0.92
5. I am a stronger person. 2 1 6 40 51 5 0.69 0.92 6. I am more confident. 5 5 19 41 30 4 0.73 0.92 7. I take better care of myself. 6 8 30 41 15 4 0.54 0.92 8. I have stronger spiritual convictions now. 11 22 15 25 27 4 0.64 0.92 9. I have made many close friends with people I would have never met otherwise.
9 22 20 22 27 3 0.50 0.92
10. I have learned to see life from a different perspective. 2 5 6 34 53 5 0.66 0.92 11. I have made a difference in the lives of other people. 6 16 26 28 24 4 0.77 0.92 12. I make the most of each day rather than living for the future.
2 4 21 43 30 4 0.58 0.92
13. I celebrate life more now. 4 11 24 34 27 4 0.71 0.92 14. I have a different and more authentic view of what it means to be successful in life.
1 9 21 46 23 4 0.68 0.92
15. I have learned what is really important and valuable in life. 1 1 7 51 40 4 0.70 0.92 16. I have developed new skills that have helped me do a better job in my career.
4 19 29 25 23 3 0.78 0.92
17. I have developed attitudes that have helped me do a better job in my chosen career.
4 14 24 34 24 4 0.74 0.92
18. My marriage has emerged stronger. 13 15 13 32 27 4 0.31 0.93 Cronbach’s alpha reliability coefficient = 0.92
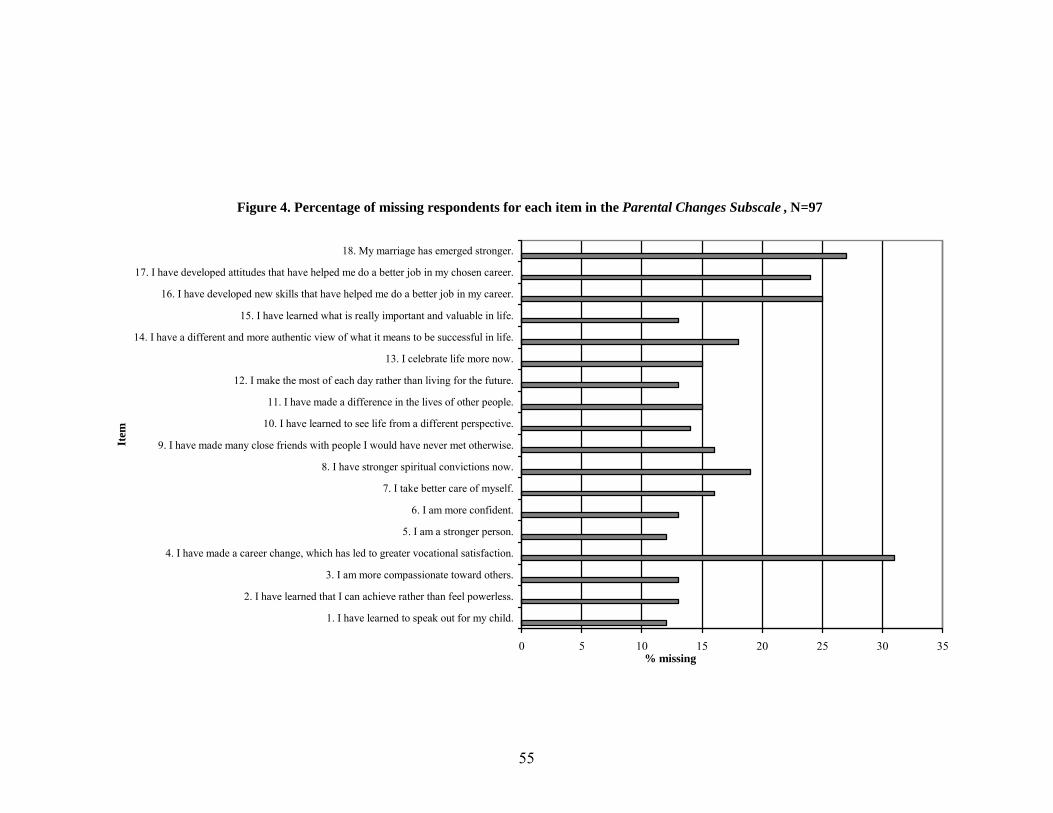
55
Figure 4. Percentage of missing respondents for each item in the Parental Changes Subscale , N=97
0 5 10 15 20 25 30 35
1. I have learned to speak out for my child.
2. I have learned that I can achieve rather than feel powerless.
3. I am more compassionate toward others.
4. I have made a career change, which has led to greater vocational satisfaction.
5. I am a stronger person.
6. I am more confident.
7. I take better care of myself.
8. I have stronger spiritual convictions now.
9. I have made many close friends with people I would have never met otherwise.
10. I have learned to see life from a different perspective.
11. I have made a difference in the lives of other people.
12. I make the most of each day rather than living for the future.
13. I celebrate life more now.
14. I have a different and more authentic view of what it means to be successful in life.
15. I have learned what is really important and valuable in life.
16. I have developed new skills that have helped me do a better job in my career.
17. I have developed attitudes that have helped me do a better job in my chosen career.
18. My marriage has emerged stronger.
Item
% missing

56
5.2.4 Inter-correlation between scales
The total scores from the two scales, Stigma Experience Scale and Stigma Impact
Scale, were positively moderately correlated. Spearman’s rank order correlation was 0.67
(p=0.01, n=79) showing the scales share a degree of common variance but measure
slightly different constructs. However, the score from the Stigma Experience Scale was
not correlated with the score from the Parental Changes Subscale since the Spearman’s
rank order correlation was -0.009 (p=0.95, n=46). The Parental Changes Subscale score
was not correlated with the Stigma Impact Scale score as its Spearman’s rank order
correlation was -0.03 (p=0.84, n=49). Although neither of the stigma scales achieved
significant correlations with the Parental Changes Subscale, which measures positive
changes undergone by parents of those with a disability, the direction of correlations
hinted at a negative association. For a graphical representation of three inter-correlations,
see Appendix J.
5.3 Association between characteristics of respondents and experiences of stigma
The association between each of the thirteen descriptive variables of parent and
child characteristics and each of the seven items in the Stigma Experience Scale were
evaluated using a chi-square analysis or Fisher’s exact test when individual expected cell
count was 5 or less. Out of all 91 analyses, only those that reached statistical significance
at p-values <0.05 are presented in Tables 6 to 17 (see Appendix K for the rest of the
contingency tables and their chi-square or Fisher’s exact test statistics).
Seven descriptive variables were found to be associated with one or more scale
items: gender, age and employment status of the parent; and the age and dual diagnosis
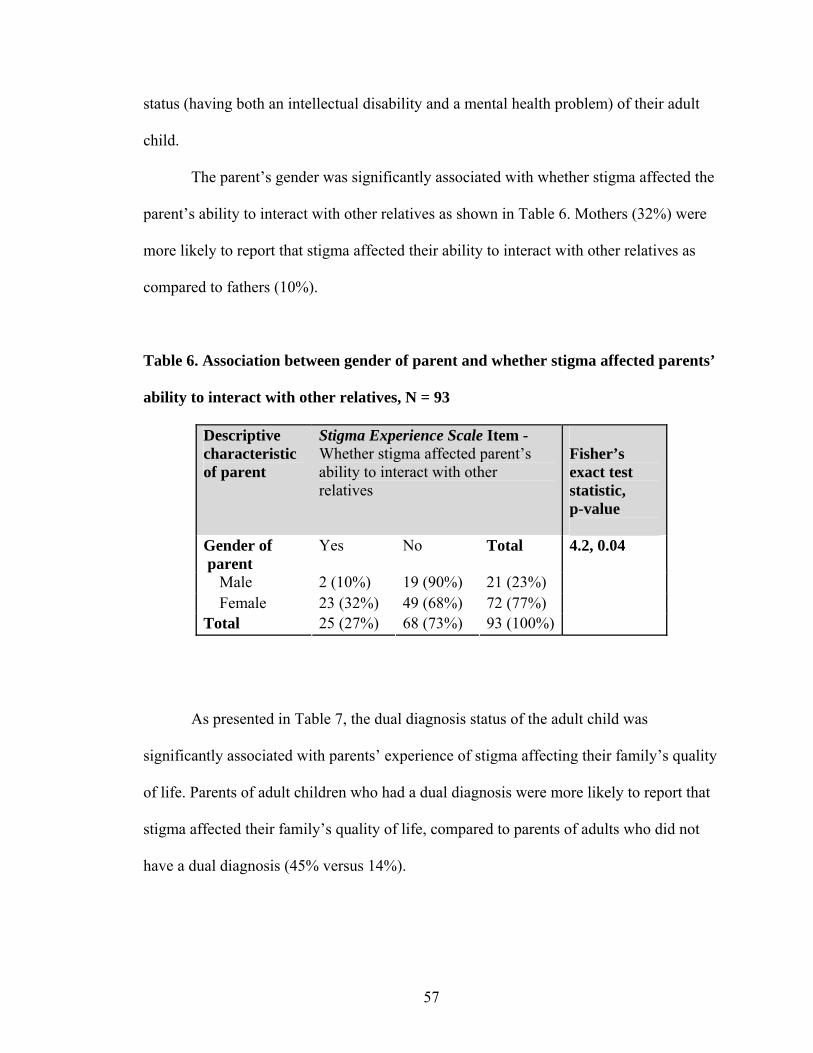
57
status (having both an intellectual disability and a mental health problem) of their adult
child.
The parent’s gender was significantly associated with whether stigma affected the
parent’s ability to interact with other relatives as shown in Table 6. Mothers (32%) were
more likely to report that stigma affected their ability to interact with other relatives as
compared to fathers (10%).
Table 6. Association between gender of parent and whether stigma affected parents’
ability to interact with other relatives, N = 93
Descriptive characteristic of parent
Stigma Experience Scale Item - Whether stigma affected parent’s ability to interact with other relatives
Fisher’s exact test statistic, p-value
Gender of parent
Yes No Total
Male 2 (10%) 19 (90%) 21 (23%) Female 23 (32%) 49 (68%) 72 (77%) Total 25 (27%) 68 (73%) 93 (100%)
4.2, 0.04
As presented in Table 7, the dual diagnosis status of the adult child was
significantly associated with parents’ experience of stigma affecting their family’s quality
of life. Parents of adult children who had a dual diagnosis were more likely to report that
stigma affected their family’s quality of life, compared to parents of adults who did not
have a dual diagnosis (45% versus 14%).
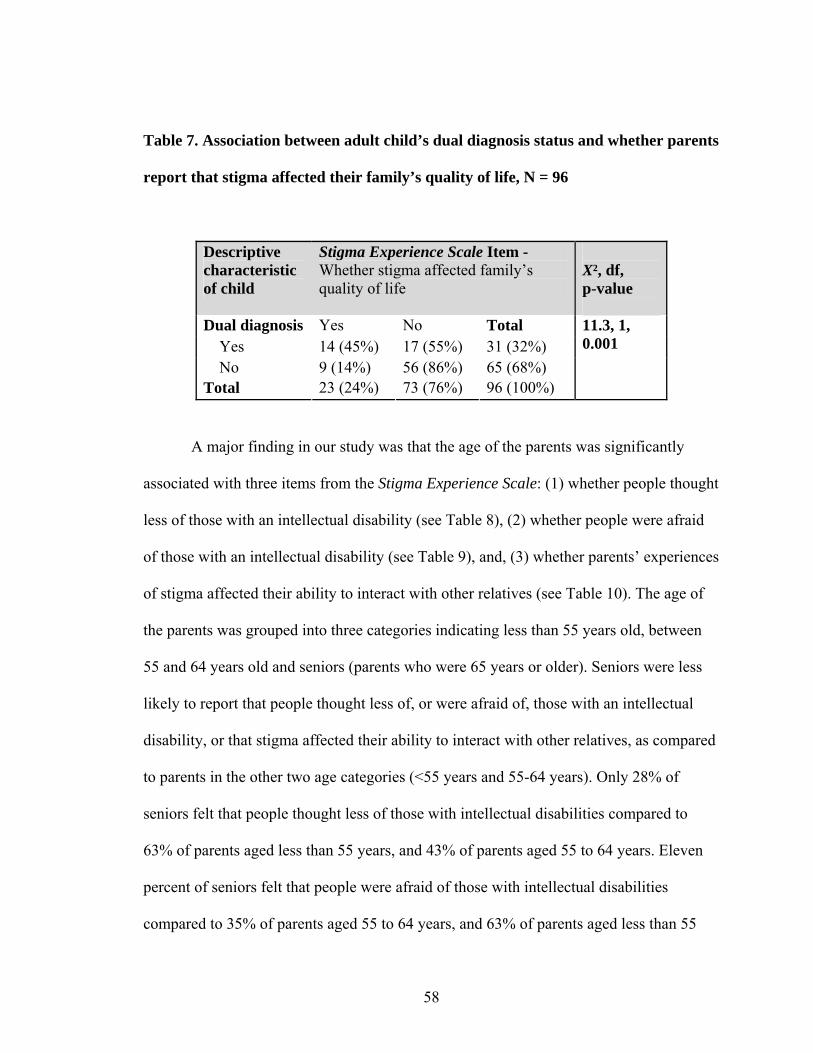
58
Table 7. Association between adult child’s dual diagnosis status and whether parents
report that stigma affected their family’s quality of life, N = 96
Descriptive characteristic of child
Stigma Experience Scale Item - Whether stigma affected family’s quality of life
X², df, p-value
Dual diagnosis Yes No Total Yes 14 (45%) 17 (55%) 31 (32%) No 9 (14%) 56 (86%) 65 (68%) Total 23 (24%) 73 (76%) 96 (100%)
11.3, 1, 0.001
A major finding in our study was that the age of the parents was significantly
associated with three items from the Stigma Experience Scale: (1) whether people thought
less of those with an intellectual disability (see Table 8), (2) whether people were afraid
of those with an intellectual disability (see Table 9), and, (3) whether parents’ experiences
of stigma affected their ability to interact with other relatives (see Table 10). The age of
the parents was grouped into three categories indicating less than 55 years old, between
55 and 64 years old and seniors (parents who were 65 years or older). Seniors were less
likely to report that people thought less of, or were afraid of, those with an intellectual
disability, or that stigma affected their ability to interact with other relatives, as compared
to parents in the other two age categories (<55 years and 55-64 years). Only 28% of
seniors felt that people thought less of those with intellectual disabilities compared to
63% of parents aged less than 55 years, and 43% of parents aged 55 to 64 years. Eleven
percent of seniors felt that people were afraid of those with intellectual disabilities
compared to 35% of parents aged 55 to 64 years, and 63% of parents aged less than 55

59
years. Fifteen percent of seniors felt that stigma affected their ability to interact with other
relatives, compared to 32% of parents aged 55 to 64 years and 48% of parents aged less
than 55 years.
Table 8. Association between age of parent and whether parents report that people
think less of those with intellectual disabilities, N = 88
Descriptive characteristic of parent
Stigma Experience Scale Item - Whether people think less of those with an intellectual disability
X², df, p-value
Age (years) Yes No Total <55 12 (63%) 7 (37%) 19 (22%) 55-64 10 (43%) 13 (57%) 23 (26%) 65+ 13 (28%) 33 (72%) 46 (52%) Total 35 (40%) 53 (60%) 88 (100%)
7.0, 2, 0.03
Table 9. Association between age of parent and whether parents report that people
are afraid of those with intellectual disabilities, N = 86
Descriptive characteristic of parent
Stigma Experience Scale Item - Whether people are afraid of those with an intellectual disability
X², df, p-value
Age (years) Yes No Total <55 12 (63%) 7 (37%) 19 (22%) 55-64 8 (35%) 15 (65%) 23 (27%) 65+ 5 (11%) 39 (89%) 44 (51%) Total 25 (29%) 61 (71%) 86 (100%)
17.8, 2, 0.0001
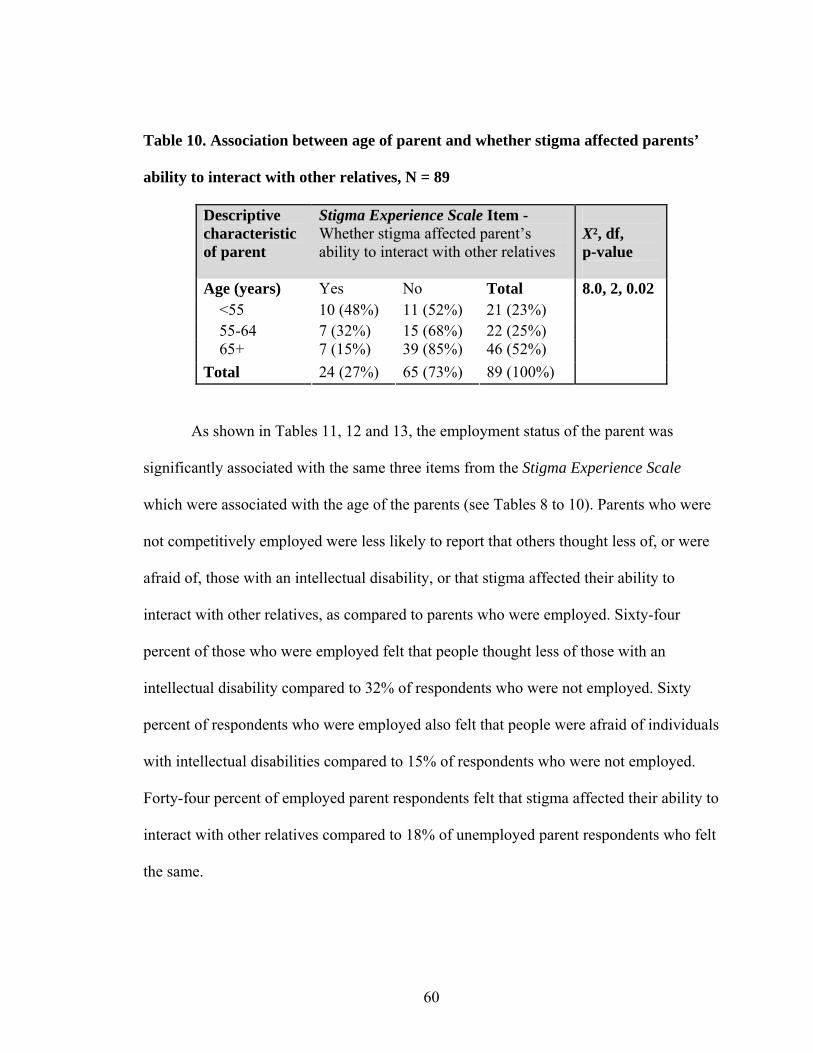
60
Table 10. Association between age of parent and whether stigma affected parents’
ability to interact with other relatives, N = 89
Descriptive characteristic of parent
Stigma Experience Scale Item - Whether stigma affected parent’s ability to interact with other relatives
X², df, p-value
Age (years) Yes No Total <55 10 (48%) 11 (52%) 21 (23%) 55-64 7 (32%) 15 (68%) 22 (25%) 65+ 7 (15%) 39 (85%) 46 (52%) Total 24 (27%) 65 (73%) 89 (100%)
8.0, 2, 0.02
As shown in Tables 11, 12 and 13, the employment status of the parent was
significantly associated with the same three items from the Stigma Experience Scale
which were associated with the age of the parents (see Tables 8 to 10). Parents who were
not competitively employed were less likely to report that others thought less of, or were
afraid of, those with an intellectual disability, or that stigma affected their ability to
interact with other relatives, as compared to parents who were employed. Sixty-four
percent of those who were employed felt that people thought less of those with an
intellectual disability compared to 32% of respondents who were not employed. Sixty
percent of respondents who were employed also felt that people were afraid of individuals
with intellectual disabilities compared to 15% of respondents who were not employed.
Forty-four percent of employed parent respondents felt that stigma affected their ability to
interact with other relatives compared to 18% of unemployed parent respondents who felt
the same.
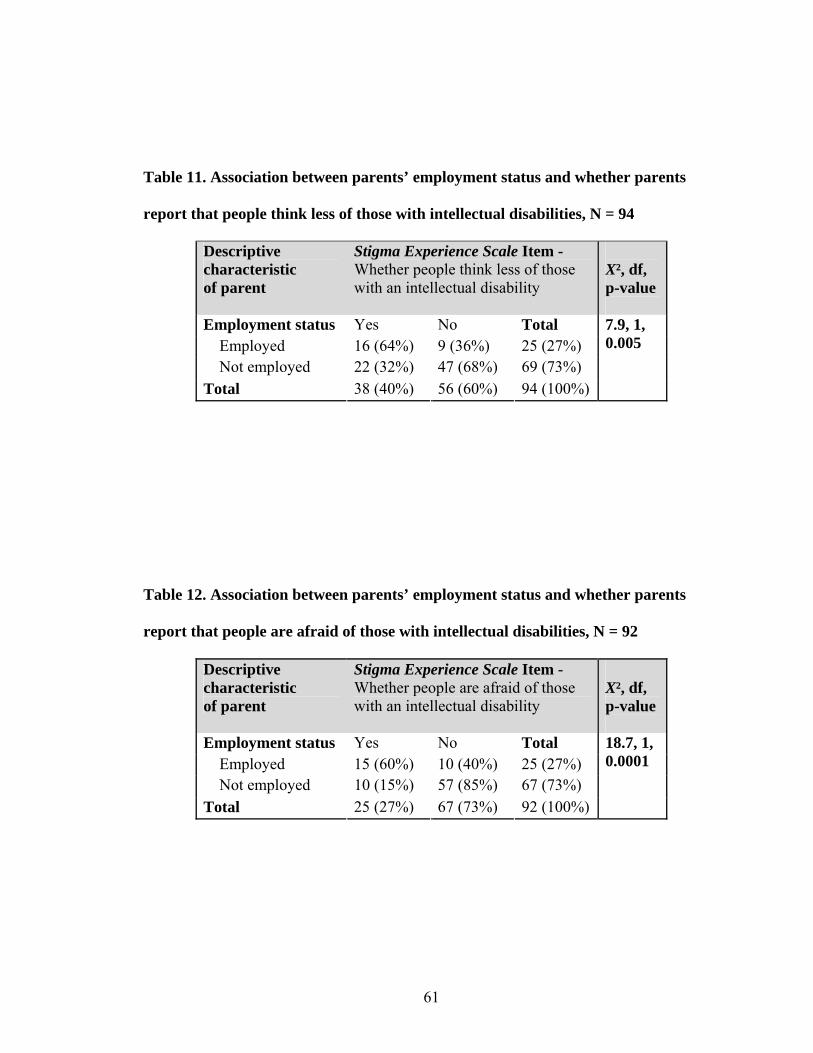
61
Table 11. Association between parents’ employment status and whether parents
report that people think less of those with intellectual disabilities, N = 94
Descriptive characteristic of parent
Stigma Experience Scale Item - Whether people think less of those with an intellectual disability
X², df, p-value
Employment status Yes No Total Employed 16 (64%) 9 (36%) 25 (27%) Not employed 22 (32%) 47 (68%) 69 (73%) Total 38 (40%) 56 (60%) 94 (100%)
7.9, 1, 0.005
Table 12. Association between parents’ employment status and whether parents
report that people are afraid of those with intellectual disabilities, N = 92
Descriptive characteristic of parent
Stigma Experience Scale Item - Whether people are afraid of those with an intellectual disability
X², df, p-value
Employment status Yes No Total Employed 15 (60%) 10 (40%) 25 (27%) Not employed 10 (15%) 57 (85%) 67 (73%) Total 25 (27%) 67 (73%) 92 (100%)
18.7, 1, 0.0001

62
Table 13. Association between parents’ employment status and whether stigma
affected parents’ ability to interact with other relatives, N = 94
Descriptive characteristic of parent
Stigma Experience Scale Item - Whether stigma affected parent’s ability to interact with other relatives
X², df, p-value
Employment status Yes No Total Employed 13 (44%) 14 (56%) 27 (29%) Not employed 12 (18%) 55 (82%) 67 (71%) Total 25 (27%) 69 (73%) 94 (100%)
9.0, 1, 0.003
Another major finding was that the age of the adult children showed significant
associations with four items in the Stigma Experience Scale, two of which asked parent
respondents about their perception of people’s view about those with intellectual
disabilities, one item asking about stigma affecting their ability to interact with other
relatives and another item asking parents if stigma affected their family’s quality of life.
The majority of the parents with older adult children (45 and over) did not believe that
people thought less of those with intellectual disabilities compared to parents with
younger adult children (see Table 14). Seventeen percent of parents with adult children
aged 45 and older believed that people thought less of those with intellectual disabilities
compared to 48% to 56% of parents whose adult children ranged in age from 18 to 44
years. Parents with adult children aged 35 or older were also less likely to report that
people are afraid of those with intellectual disabilities compared to younger parents with
adult children aged 18 to 34 years (see Table 15). Parents with adult children aged 35
years and older who believed that people were afraid of those with intellectual disabilities
ranged from 8% to 21% compared to 35% of the parents whose adult children were 25-34
years old, and 57% of the parents whose children were 18 to 24 years old.

63
Parents with younger adult children (aged 18 to 34 years) were more likely to
report that stigma affected their ability to interact with other relatives compared to parents
of adults with intellectual disabilities aged 35 years and older (see Table 16). Parents with
children aged 18 to 34 years who felt that stigma affected their ability to interact with
other relatives ranged from 33% to 38% compared to 17% of parents with adult children
aged 35-44 years and 12% of parents with adult children aged 45 years and older who
reported the same. Parents whose children were younger (between the ages of 18 to 44)
years were more likely to report that stigma affected their family’s quality of life than
those parents who had older adult children (aged 45 years and up) (see Table 17).
Twenty-six percent of those parents whose children were aged 18 to 24 years, 30% of
those parents whose children were aged 25-34 years and 35% of parents whose children
were aged 35-44 years felt that stigma affected their family’s quality of life compared to
9% of parents whose children were older (aged 45 years and up) who reported the same.
Table 14. Association between adult child’s age and whether parents report that
people think less of those with intellectual disabilities, N = 93
Descriptive characteristic of child
Stigma Experience Scale Item - Whether people think less of those with an intellectual disability
Fisher’s exact test statistic, p-value
Age (years) Yes No Total 18-24 9 (56%) 7 (44%) 16 (17%) 25-34 13 (50%) 13 (50%) 26 (28%) 35-44 10 (48%) 11 (52%) 21 (23%) 45 + 5 (17%) 25 (83%) 30 (32%) Total 37 (40%) 56 (60%) 93 (100%)
10.7, 0.025
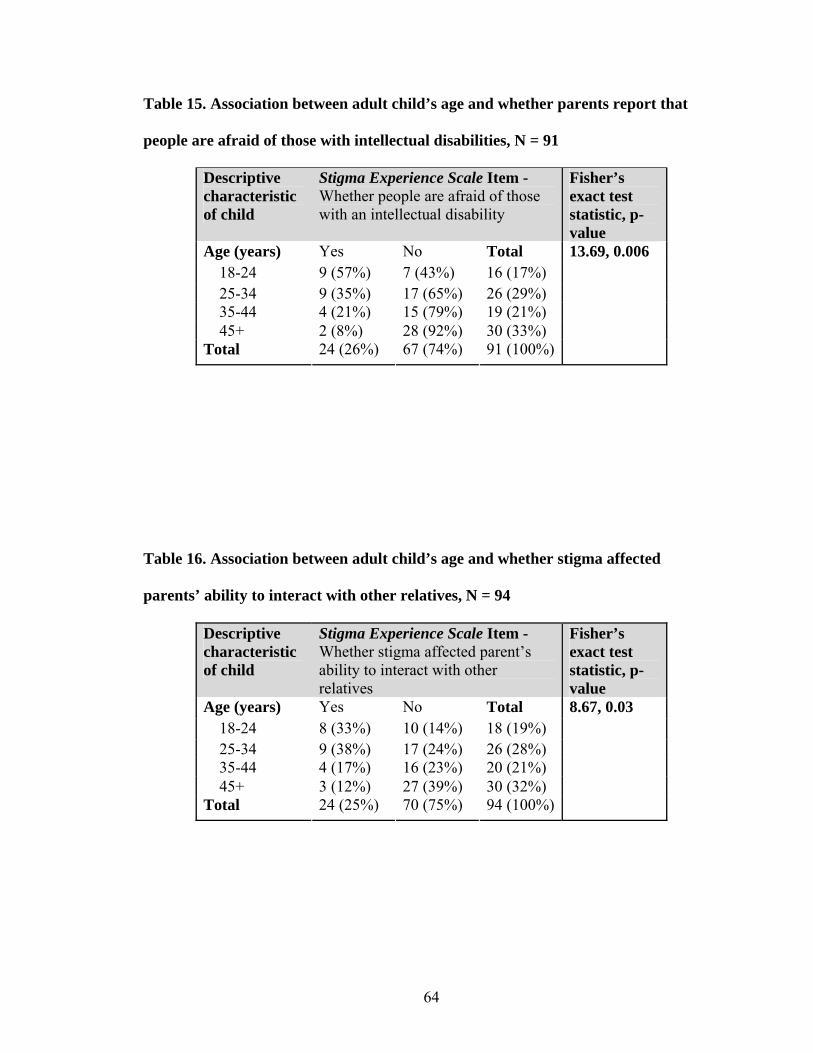
64
Table 15. Association between adult child’s age and whether parents report that
people are afraid of those with intellectual disabilities, N = 91
Descriptive characteristic of child
Stigma Experience Scale Item - Whether people are afraid of those with an intellectual disability
Fisher’s exact test statistic, p-value
Age (years) Yes No Total 18-24 9 (57%) 7 (43%) 16 (17%) 25-34 9 (35%) 17 (65%) 26 (29%) 35-44 4 (21%) 15 (79%) 19 (21%) 45+ 2 (8%) 28 (92%) 30 (33%) Total 24 (26%) 67 (74%) 91 (100%)
13.69, 0.006
Table 16. Association between adult child’s age and whether stigma affected
parents’ ability to interact with other relatives, N = 94
Descriptive characteristic of child
Stigma Experience Scale Item - Whether stigma affected parent’s ability to interact with other relatives
Fisher’s exact test statistic, p-value
Age (years) Yes No Total 18-24 8 (33%) 10 (14%) 18 (19%) 25-34 9 (38%) 17 (24%) 26 (28%) 35-44 4 (17%) 16 (23%) 20 (21%) 45+ 3 (12%) 27 (39%) 30 (32%) Total 24 (25%) 70 (75%) 94 (100%)
8.67, 0.03
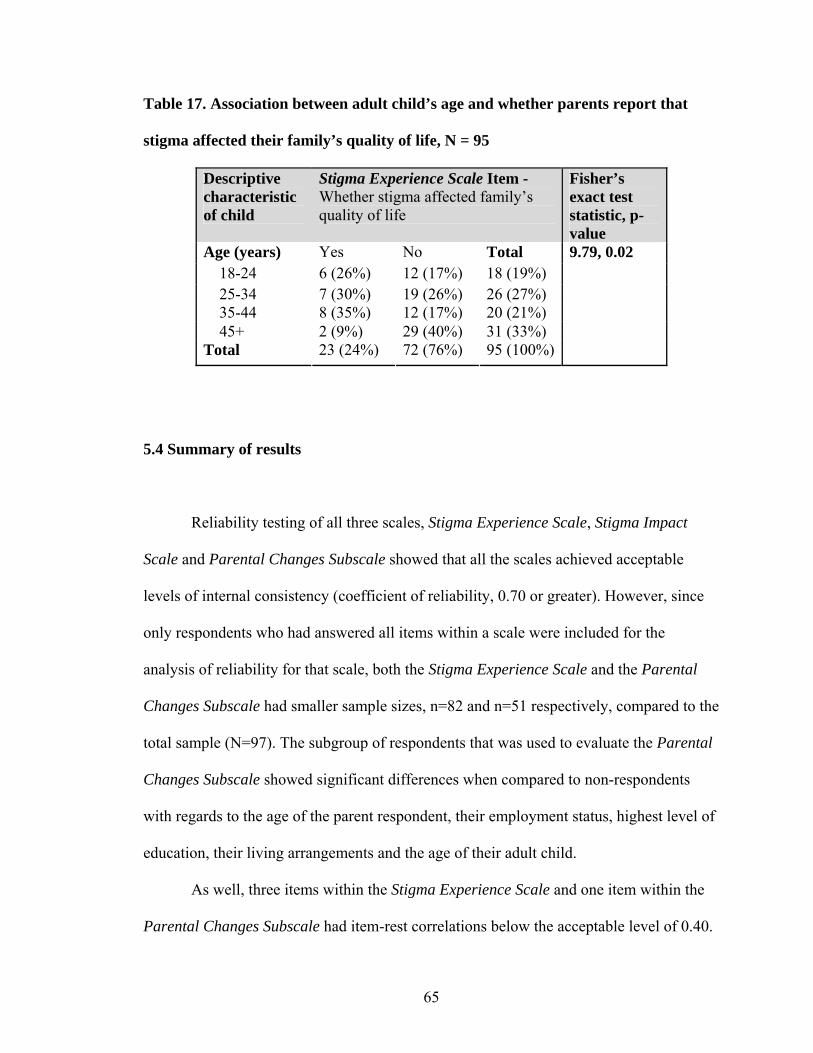
65
Table 17. Association between adult child’s age and whether parents report that
stigma affected their family’s quality of life, N = 95
Descriptive characteristic of child
Stigma Experience Scale Item - Whether stigma affected family’s quality of life
Fisher’s exact test statistic, p-value
Age (years) Yes No Total 18-24 6 (26%) 12 (17%) 18 (19%) 25-34 7 (30%) 19 (26%) 26 (27%) 35-44 8 (35%) 12 (17%) 20 (21%) 45+ 2 (9%) 29 (40%) 31 (33%) Total 23 (24%) 72 (76%) 95 (100%)
9.79, 0.02
5.4 Summary of results
Reliability testing of all three scales, Stigma Experience Scale, Stigma Impact
Scale and Parental Changes Subscale showed that all the scales achieved acceptable
levels of internal consistency (coefficient of reliability, 0.70 or greater). However, since
only respondents who had answered all items within a scale were included for the
analysis of reliability for that scale, both the Stigma Experience Scale and the Parental
Changes Subscale had smaller sample sizes, n=82 and n=51 respectively, compared to the
total sample (N=97). The subgroup of respondents that was used to evaluate the Parental
Changes Subscale showed significant differences when compared to non-respondents
with regards to the age of the parent respondent, their employment status, highest level of
education, their living arrangements and the age of their adult child.
As well, three items within the Stigma Experience Scale and one item within the
Parental Changes Subscale had item-rest correlations below the acceptable level of 0.40.
66
Conversely, the Stigma Impact Scale not only achieved excellent internal consistency,
but, at the item-level, the item-rest correlations were high.
With regards to the correlation between each of the three scales, the score from
the Stigma Experience Scale and the Stigma Impact Scale score were moderately
correlated in a positive direction. However, the Parental Changes Subscale did not
correlate with either of the stigma scales.
Some parent and child characteristics were significantly related to a few items
from the Stigma Experience Scale indicating that these key parent or child characteristics
may be influencing their responses to the scale’s items. The characteristics which showed
significant association with scale items were age, employment status, and gender of
parent; and age and dual diagnosis status of the adult child. The scale items that were
found to be associated with the above characteristics were whether parents felt that people
thought less of, or were afraid of, those with an intellectual disability, whether stigma
affected the parent’s ability to interact with other relatives and whether stigma affected
the respondent’s family’s quality of life.
Given the results, the reliability testing of the three scales should be discussed.
Recommendations for future development of each of the scales should also be explored.
Additionally, commentary on the inter-relationship between the three scales can add to
the evaluation of whether future applications of the scales should consider all three scales.
Evaluation of respondent and child characteristics and their associations with items in a
scale measuring the presence or absence of stigma can shed light on possible factors that
influence certain experiences of stigma in parents of adults with an intellectual disability.
Thus, the next section aims to present an in-depth discussion of such points for
consideration, with an additional comparison of results of the current sample of parents

67
with a different sample of family members (of those with severe mental health problems)
who were given the same two stigma scales to measure stigma by association.

68
CHAPTER 6: DISCUSSION
In this next section, each of the three scales will be discussed with regards to
future recommendations. The inter-correlation between the scales will be then addressed,
followed by the experiences of the parent respondents. Finally, the strengths and
limitations of the current study will be presented along with suggestions for future
research directions and concluding remarks.
6.1 Evaluation of the individual scales
In the literature for scale development, a reliability coefficient greater or equal to
0.70 (Nunnally, 1978) is considered suitable to describe the distribution of the construct
of interest and comment on groups of individuals based on high and low scores (i.e.
discriminant validity). This study demonstrated acceptable coefficients of reliability for
the three scales, Stigma Experience Scale (KR-20=0.70), Stigma Impact Scale (α=0.95)
and Parental Changes Subscale (α=0.92), which aimed to measure the experiences of
parents of adults with intellectual disabilities. However, the exceptionally high
coefficients of reliability for the Stigma Impact Scale and the Parental Changes Subscale
may suggest that individual items within the scales may be redundant. Although it is
necessary for there to be a certain level of redundancy and similarity between items
aiming to measure an underlying construct, a high degree of redundancy is not exemplary
(Hulin, Netemeyer & Cudeck, 2001). For example, in the Stigma Impact Scale, the alpha
once an item was deleted remained within the range of 0.94-0.95.
69
This scale had previously been tested in a sample of family members of adults
with severe mental health problems (Stuart et al., 2008). The internal consistencies of the
Stigma Impact Scale were comparable between both samples (i.e. mental health sample,
α=0.93, current sample, α=0.95). The item-rest correlation in the mental health sample
ranged from 0.69 to 0.87, while in the current sample, the item-rest correlation ranged
from 0.74 to 0.91 (acceptable range: 0.40-0.50 for narrowly defined constructs; Clark &
Watson, 1995). The range, as determined by the difference between the highest item-rest
correlation and the lowest, were comparable between the mental health sample and the
current sample. This would indicate that although the desirable item-rest correlations
were not reached in either sample, the Stigma Impact Scale seemed to behave similarly in
both samples giving support for its utility across different samples.
However, it should be noted that the placements of the questions in the Stigma
Impact Scale may have invoked a response set bias in which there was a tendency for the
respondents to answer the series of questions in a certain direction regardless of their
content. The responses for the seven individual items within this scale were prompted
through two general questions and presented as a set to enhance instructional clarity. The
first general question, asking about the parent respondent personally, was a prompt for
four of the seven scale items (quality of life, social contacts, family relations and self-
esteem). The second general question, asking the parent respondent to report on their
family as a whole, was a prompt for the remaining three items (quality of life, social
contacts and family relations). As such, there were only slight modifications in wording
between the seven items which may have reflected redundancy across items within the
scale (Clark & Watson, 1995). Such similarly worded items added as a scale would tend
to increase the coefficient of alpha without substantially contributing to the theoretical
70
internal consistency of the scale. The Stigma Impact Scale also gave respondents a range
of response categories from 0 to 10, to rate the impact of stigma, thus, nuances in
response differences could potentially be captured by this scale (Bandalos & Enders,
1996). Yet, the medians for items within this scale, in the current sample, were mostly 1.
In the original sample of family members of adults with severe mental health problems,
the item-level medians ranged from 2.5 to 6 (Stuart et al., 2008). Thus, there was more
variability in responses when the scale was applied to the mental health sample than in
our current sample. It may be that the degree of impact of stigma on family members,
aimed to be captured by the Stigma Impact Scale, was more effective in capturing a range
of responses in the mental health sample because the respondent’s family member had
severe and differing mental health problems while we do not know the severity of
intellectual disabilities of the adult children of our current sample. Such finding could
also indicate that stigma by association does not contribute meaningfully to the current
experiences of parents of adults with intellectual disabilities.
Items within the Stigma Impact Scale which were redundant should be considered
for removal. The overall alpha remained the same (α: 0.94 to 0.95), if each of the seven
individual items was deleted, and the inter-correlations between items were high (range:
0.74-0.91). Thus, we cannot narrow down the recommendation for removal of specific
items within the scale due to redundancy. However, recommendation for the future use of
the Stigma Impact Scale would be to re-structure the survey instrument containing this
scale, such that items within the scale can be reworded and reorganized (dispersed) to
minimize response set bias. Additionally, the range for the response categories could be
more conservative if applied to a sample similar to the current study. A visual analogue

71
scale could be applied to develop the range of response categories aimed to capture the
degree of impact of stigma for such parents.
Like the Stigma Impact Scale, the Parental Changes Subscale also achieved an
excellent coefficient of reliability. However, unlike the Stigma Impact Scale, the Parental
Changes Subscale had a high number of missing responses where only 51 out of a
possible total sample of 97 answered all 18 items in the scale and were thus included in
the analysis of the internal consistency of the scale. The Parental Changes Subscale also
had more than double the number of questions/items than the Stigma Impact Scale. The
subgroup that was used to analyze the Parental Changes Subscale differed significantly
from the non-respondents. Non-respondents were more likely to be seniors, not
employed, had either some or completed public school or had some or completed up to
high school as their highest level of education, did not live with a spouse or partner, and
whose children were aged between 18 to 34 years. Parents with only either some or
completed public school or some or completed high school education may have had
difficulties understanding and answering all the questions in this scale. The difference
between respondents and non-respondents suggests that item non-response bias would
skew the results as, for example, older parents would not be represented in the responses
of how their child’s disability affected positive changes in them.
The distribution of the range of responses (1-5) at the item level was narrow, with
four items having a median of 5, and most item-level responses aggregated around 3 to 5,
likely due to a ceiling effect. This indicates that for the current sample, the items within
the Parental Changes Subscale failed to capture the possible range of responses. Items
which had strong agreement were when parents felt that they were: (1) becoming a
stronger person, (2) learning to speak out for their child, (3) learning to be more

72
compassionate towards others, and, (4) gaining a different perspective on life. It may be
that in asking parents such questions, the purpose of which was to reflect the effect of
having their child in their life; a type of response bias was induced, such as social
desirability which can be present even in anonymized surveys (Makimoto et al., 2001).
The items which showed greatest range of responses across the response categories were
also items that had the most missing data. Thus, the distribution in responses may be
indicative of the relevance of such items to the current sample. Questions such as
vocational change and marriage may not be applicable to all the respondents’ situations,
considering that most of the respondents were seniors (65 years or older) and not
employed (e.g., retired or homemaker) and, as previously mentioned, these subgroups of
parents were also less likely to respond to all the items within this scale.
As well, the alpha when an item was removed stayed within a tight range of the
overall coefficient of reliability (0.92-0.93) in the Parental Changes Subscale. This
indicated that removing a specific item was negligible to the overall coefficient of
reliability which was 0.92. Individual items, therefore, were redundant to the theoretical
internal consistency of the scale. It should be noted that this scale, applied to the current
sample of respondents, was a subscale taken out of a longer, comprehensive scale
(Scorgie & Sobsey, 2000). It was not feasible in the current study to apply the longer,
original version. Due to the issues discussed arising from the Parental Changes Subscale,
it should not be recommended in the future in its current form and should be administered
differently (than in our study), for a similar sample of respondents. Items should be
reworded to reduce the effect of social desirability, and an option of “not applicable”
should be added to all items to potentially lower item non-response. As well, the mode of

73
administration in a future study using this scale on a similar sample should consider the
possibility of follow-up to reduce item non-response.
The Stigma Experience Scale achieved a marginally acceptable coefficient of
reliability (KR-20=0.70). When it was originally applied to family members of
individuals with severe mental health problems (Stuart et al., 2008), the Stigma
Experience Scale achieved a slightly higher internal consistency (KR-20=0.76) than in the
current study (KR-20=0.70).
As well, unlike the two previously mentioned scales, the responses originally
given by the parents to the items within the Stigma Experience Scale were recoded into
dichotomous variables (extremes) to indicate the presence or absence of stigma.
Additionally, compared to the Stigma Impact Scale, this scale had much lower item-rest
correlation for the seven individual items (ranging from 0.30 to 0.56), with three items
falling below the acceptable level of 0.40. The lower item-rest correlations for items in
the Stigma Experience Scale in the current study compared to the item-rest correlations
for items in the mental health sample (ranging from 0.29 to 0.69 with two items falling
below 0.40) may be due to differences between the samples and/or due to differences in
stigma experiences (e.g., likely type of interactions with others in daily life engaged in by
the family member with the disability). The three items with low item-rest correlations in
the present sample were feeling stigmatized due to their adult child’s condition, making
and keeping friendships, and interacting with relatives. Additionally, two of these three
items also had low endorsements, with only 8 parents (10%) who felt stigmatized due to
their child’s condition and 14 parents (17%) who felt that stigma affected their family’s
ability to make and keep friends. The two items with low item-rest correlations in the
sample of family members of adults with severe mental health problems were general
74
questions asking whether the respondent believed people thought less of those with
mental health problems and whether most people were afraid of such individuals.
Another possible reason for the low item-rest correlations for individual items in
the Stigma Experience Scale may be due to the dichotomous nature of the scale responses
used for analyses. Responses of parents were re-coded into dichotomous variables to
indicate the presence or absence of stigma. Parents who reported that they “sometimes”
perceived or experienced stigmatization as outlined by a specific question or were “not
sure” if that stigmatizing experience was applicable to them were re-coded as having an
absence of that stigmatizing experience. As such, we were conservative with our
interpretation of the presence of stigmatizing experiences in our sample. However
dichotomizing the responses likely ignored the fact that there are varying levels to a
stigmatizing experience. As such, error (misclassification) would be introduced into the
re-coded responses as uncertainty or confusion on the part of the respondents in either
understanding or answering the question as indicated by “sometimes” or “not sure” was
equated to an absence of that stigmatizing experience. Another consequence of
dichotomizing a variable is that it leads to loss of efficiency of the scale with a reduction
in its correlation with other measures (Streiner & Norman, 2003). Thus, larger sample
sizes are required to show an effect for a scale that uses dichotomous responses, such as
our Stigma Experience Scale (Streiner & Norman, 2003).
In the current sample, only 10% of the parent respondents believed that they were
stigmatized due to their adult child’s intellectual disability, compared to 20% in the
mental health sample of family members (Stuart et al., 2008). The group of family
members in the original mental health sample included spouses, siblings, and other
relations, who may be more likely to feel stigmatized due to their relative’s disability
75
compared to parents. In our sample, approximately a quarter of the parents said that
stigma had affected their family’s quality of life compared to half of the family members
in the mental health sample. Previous studies indicate that parents of children with
intellectual disabilities often blame themselves for their child’s condition (Fink &
Tasman, 1992; Turnbull & Turnbull, 1978). The severity of the disability in the mental
health sample compared to the current sample could also explain the comparatively lower
reporting of effects to family’s quality of life, friend relations and interactions with
relatives, due to stigma, in the current sample. Additionally, parents of adults with
intellectual disabilities have had their child’s lifetime to set up social support networks,
while family members of adults with severe mental health problems most likely
encountered their relative’s condition later in life (e.g. onset of schizophrenia is usually
during late teens to early 20s). Given that only 10% of the parents reported that they felt
stigmatized due to their child’s intellectual disability, it may be that for the parents in our
sample, such experiences of stigma are currently not a significant part of their daily
reality. These parents may have had time and experience to adapt to such stigmatizing
conditions and adopted effective coping strategies.
However, for the Stigma Experience Scale, with a range of possible total scores
from 0 to 7, the median of the total score in the current sample was only 1. Thus, the
Stigma Experience Scale may either be measuring an accurate phenomenon of low
stigmatizing experiences in parents of adults with intellectual disabilities or such results
may indicate that the scale, as currently constructed, is problematic for evaluating
experiences of stigma in parents of adults with intellectual disabilities. It is recommended
that additional items be added as the items in the current scale may be too narrow or
irrelevant to capture the range of stigma experiences that are relevant to the current
76
study’s sample. Such additional items could be developed with the aid of responses from
the parents in our current sample to open-ended questions asked within the survey. For
example, items can be added to circumvent the likely feeling of guilt that parent
respondents feel in order to improve the range of their stigma experiences. Rather than
asking parents directly whether they “felt stigmatized because of their child’s [intellectual
disability]”, the question could be reworded to ask whether parents felt that others
stigmatized them due to being parents of children with intellectual disabilities.
6.1.1 Evaluating the inter-correlation between the scales
As seen by the graphical representations of the frequency of total scores for each
of the three scales (see Appendix I), with a normal distribution curve fitted to the data,
none of the total scores for the scales seemed like they followed a normal distribution.
Thus, inter-correlations between the scales were assessed using Spearman’s rank order
correlations. The Spearman’s rank order correlation showed that between the Stigma
Experience Scale and the Stigma Impact Scale, a moderate correlation coefficient was
achieved (0.67, p=0.01). In the original sample of family members of adults with severe
mental health problems, a correlation coefficient of 0.66 (p=0.001) was achieved. This
indicated that for both samples, the two scales target different dimensions of the same
construct(s).
Spearman’s rank order correlation was also evaluated between the Stigma Impact
Scale and the Parental Changes Subscale and between the Stigma Experience Scale and
the Parental Changes Subscale. The correlation coefficient was only -0.03 (p=0.84,
n=49) for the former, and -0.009 (p=0.95, n=46) for the latter, although the direction for
77
both implied a negative correlation, as expected, between the Parental Changes
Subscales (measuring positive changes) and each of the stigma scales. Such low
correlation coefficients may be attributed to response bias and given the small sample
sizes due to missing data. We may not have had enough power to test the associations
between each of the stigma scales and the Parental Changes Subscale. It further indicates
that the constructs being compared through their strength of associations show that the
scale measuring positive changes and each of the stigma scales are not predictive of one
another. Such lack of significance in correlations may be indicative that experience of
positive changes in parents is not mutually exclusive to also experiencing negative effects
of stigma. The moderate strength in correlation between the two stigma scales and lack of
significance in correlations between the Parental Changes Subscale and each of the
stigma scales also supports the construct validity of the stigma scales in measuring
different aspects of an underlying construct (assumed to be stigma) which were not
related to positive changes experienced by parents. Finally, given that the responses in the
Stigma Experience Scale were dichotomized, this may have reduced its correlation with
the Parental Changes Subscale (Streiner & Norman, 2003). As well, the ceiling effect
present in the Parental Changes Subscale may have also contributed to the lack of
significance in correlation with either of the two stigma scales.
6.2 Experiences of parents
In the current sample, most of the respondents were biological parents, mothers,
who were 65 years and older, and as expected, most did not work in competitive
employment, indicating that they were retired or homemakers. The majority of the

78
respondents also lived with a spouse and were the primary caregivers of their adult
children. However, only about half of the adult children currently lived with the parent
respondent. As well, half of the children had lived or were currently living (at the time of
the study) in a group home or institution. Given that a noticeable proportion of the parents
were ageing and were the current daily primary caregiver of their adult child (with most
in the sample being of retirement age and not working), caregiver burden and its stressors
would be relevant issues for these parents.
Most of the adult children were males which matched other studies’ findings of
higher prevalence of intellectual disabilities in males as compared to females (Kirgiss,
2002). The range in age of the adult children, as reported by our sample of parents, was
broad, from 18 years to 67 years. Eighteen parents reported that their adult children had
mobility issues. Limitations to mobility, within this population of individuals with
intellectual disabilities, are a common concern (Cleaver et al., 2007). Another challenge
facing this population is dual diagnosis such that the individual has not only an
intellectual disability but a concurrent diagnosis of a mental health problem (which may
include behaviour problems). Within the current sample, 32 of the total sample of parents
reported an accompanying mental health problem in their adult child with an intellectual
disability, meaning approximately 33% of the adult children had a likely dual diagnosis.
This reflects the findings in Ontario for the prevalence of dual diagnosis within the
intellectual disabilities population, which was found to be between 30% and 40% (Yu &
Atkinson, 1993). Thus, not only is the current sample of parents ageing with likely
increase in health concerns of their own due to age, but other stressors and burdens to
caregiving are present (e.g., mobility issues and dual diagnosis in their child).
79
Similarities were also seen between the respondent demographics in the original
sample of family members of adults with severe mental health problems and the current
sample of parent respondents. For both samples, most of the respondents were female,
mothers, 60 years or older, and lived with a spouse or partner. The relatives/children with
the disabilities in both samples were mostly males and the age ranges were comparable
between the two samples with the relatives of the original mental health sample ranging
from 20 to 60 years and older and the current sample’s children ranging from 18 to 67
years. One difference between the samples was that half of the respondents in the current
study had either some or completed public school education or had some or completed
high school as their highest level of education while the education level in the mental
health sample indicated that most of the respondents had completed college or university.
Thus, the respondents in the original mental health sample were more educated compared
to our current sample. Stigma related to mental health problems have shown that levels of
education may be associated with perceived stigma (Elbogen et al., 2005). Those with
higher levels of education may feel more shame from perceived stigma due to a lack of
control over their disability when they had achieved certain levels of mastery in other
areas of their lives in the past (such as education) (Elbogen et al., 2005). Achieving a
higher level of education may also reflect a hierarchical standing of social class. Thus,
influence of the level of education on experiences of stigma may be relevant not only for
the stigmatized individuals but also their family members’ experiences of stigma by
association. This may explain the difference in stigma experiences seen in the more
educated family members in the original mental health sample compared to the less
educated sample of parents in our current study. As well, the lower endorsements for
stigma items seen in the current sample compared to the original mental health sample
80
may due to lower education level of the parents in our current sample which might reflect
an inability to understand the questions and/or be familiar with the concept of stigma as
presented in the study.
The recruitment for the mental health sample used convenience sampling as it was
aimed at developing the psychometric tool, thus, not needing to be representative. It was
conducted in person at a conference that appealed to family members who were career
advocates, and as such, they were much more aware of the concept of stigma and its
applicability as conceived by the investigators who developed the tool. However, the
recruitment for the current sample was done through indirect mailing of surveys and self-
administered by respondents in their homes. The reliability of a scale depends on the
characteristics of the respondents, the setting where the scale was administered and its
purpose of use, thus there are limitations to comparisons between the mental health
sample and our current sample.
Since the Stigma Experience Scale is recommended with caution, for the current
population of parents, evaluation of parents’ experiences of stigma due to their child’s
condition was undertaken by assessing the association between parent and adult
characteristics with the presence or absence of stigma as measured by individual items
within the scale. A significant association was found between the gender and age of the
parent and whether stigma affects their ability to interact with relatives. Research dating
back 20 to 30 years had found that some parents of children with intellectual disabilities
report feeling socially excluded and having strained relationships (Birenbaum, 1970;
Levinson & Starling, 1981). As well, in a previous study, Gray (2002) found that mothers
were more likely to report stigma than fathers. In our current study, as most parents were
mothers who likely had to undertake the primary caregiver role for their adult children,
81
time for maintaining social contacts with other relatives would have had to become
secondary to their adult child’s caregiving and well-being. Fathers also were less likely to
report that stigma affected their ability to interact with relatives compared to mothers. It
may be that the gender of the parents influences their experiences of stigma. There are
also differences in caregiving relations between fathers and mothers such that interaction
with others (like relatives) may be more important for mothers than for fathers. Mothers,
as the more likely caregivers, may be more attuned than fathers, to changes in social
support, closeness and quality of interaction with other family relations like relatives.
Younger parents (under 55 years), as compared to older parents (65 years and up),
were more likely to report that stigma affected their ability to interact with relatives. As
well, age of the parents played a role in how they perceived what others thought of
individuals with intellectual disabilities. The younger parents were more likely to report
that others thought less of and were afraid of, individuals with intellectual disabilities, as
compared to older parents. These associations may indicate a cohort effect influencing the
expectations of the younger parents, whereby the older parents have had more years
(experience) to adopt coping strategies and acclimatize, and thus, desensitize themselves
to the stigmatizing responses of others, including their relatives.
Age of the respondents’ adult children were also significantly associated with
whether the respondents believed that most people thought less of, or were afraid of,
those with intellectual disabilities, whether stigma affected their ability to interact with
other relatives and whether stigma affected their family’s quality of life. Parents with
older adult children (aged 45 years and up) were less likely to perceive that others thought
negatively of individuals with intellectual disabilities and that stigma affected their ability
to interact with other relatives than parent with younger adult children. As the
82
respondents with older children will likely be older themselves, such an association is
reflective of the previous finding of significant association between age of parent
respondent and how they perceive other people view individuals with intellectual
disabilities and whether stigma had an effect on their family relations.
Parents with older children (aged 45 years and older) were also less likely to feel
that stigma affected their family’s quality of life than parents of younger adult children.
This, too, may be attributed to the previously mentioned cohort effect, with parents of
older children having had more years and experience to learn how to better cope with
their child’s disability such that they do not feel it affecting their family’s quality of life,
like the parents who have younger children.
Employment status of the parent was also associated with parents’ perception of
others’ thinking less of, and being afraid of, those with intellectual disabilities, as was
reporting whether stigma had an effect on their interactions with relatives. Seltzer et al.
(2001) found that parents of individuals with intellectual disabilities reported issues with
employment such as delayed entry into the workforce or low employment rates. Parents
who were employed were more likely to report that others had such stigmatizing
perceptions about individuals with intellectual disabilities and that they felt the effects of
stigma in their interaction with relatives, than parents who were not employed. As
previously mentioned, most parents who reported that they were unemployed were so
because they were either retired or homemakers. Since age of parent has been associated
with these perceptions of stigma from others, including relatives, it is likely that those
parents who are employed are younger. As well, they have more exposure to others’
through daily workplace interactions, and other social obligations (relatives), which
increases the likelihood of encountering such stigmatizing perceptions in others. The

83
employed parents in our sample may have also felt that certain barriers that they may
have faced in their places of employment (e.g., needing time-off to care for child with
special needs, or being granted emergency leave related to their child with intellectual
disability) may be a reflection of the perceptions carried by the employers about their
children with intellectual disabilities.
Lastly, dual diagnosis status in the adult children was significantly associated with
the current sample’s perceived effect of stigma on their family’s quality of life. Gray
(2002) reported that parents were more likely to report stigma if their child had aggressive
behaviour along with their intellectual disability than parents whose children did not have
added aggressive behaviour. Given that dual diagnosis means having an intellectual
disability and added mental disorders and/or behaviour problems, the results in our
current study validates such previous findings. Parents of adult children with dual
diagnosis were more likely to report that stigma had affected their family’s quality of life
than parents of adults with an intellectual disability only. Such a finding is predictable
given that the challenges of caregiving for an individual with an intellectual disability is
likely to be more pronounced with an added disability of a mental health problem. This
would increase stress within the parents which would diffuse towards the rest of the
family, thus affecting their quality of life.
6.3 Strengths and Limitations
This study was the first to apply a set of scales measuring stigma in families of
individuals with severe mental health problems (Stuart et al., 2008) to parents of adults
with intellectual disabilities. One other study has applied stigma scales to families of
84
individuals with an intellectual disability (Mak & Cheung, 2008). However, unlike the
two studies above, the current study limited the sample to only parents (versus family
member/caregivers) such that variance due to relationship type was removed. Compared
to family members in the original mental health sample (Stuart et al.. 2008), which
included spouses and siblings, we found that in our current sample, parents were more
hesitant to ascribe stigmatization to themselves due to their child’s condition (20% of
family members in the original mental health sample versus 10% of parents in our current
sample); perhaps feeling like such an outlook could be seen as indirectly blaming their
child. As such, stigma may not be internalized by the parents as stigma by association like
in other family relations. Also, given the nature of their adult child’s condition (i.e.,
intellectual disability) which had onset early in life, when compared with the mental
health sample, where individuals likely developed their condition later in life, the parents
in our sample likely had longer time and more experience to adapt to their child’s
condition. This indicates a unique experience of stigma in parents of adults with
intellectual disabilities, where stigma by association due to their adult child’s disability
may not be relevant for our sample of parents. Focusing on adult children has also
allowed for similar control over effects of life experiences; such as controlling for likely
differences between childhood to adulthood. Thus, a strength of our study was that it
allowed us to focus on a target group of individuals, parents of adults with intellectual
disabilities, who, as a sample, had never before been evaluated with regards to their
experiences of stigma. Although it was not evaluated for the current study, the returned
surveys had a substantial amount of qualitative data derived from open-ended questions
which can be useful for future analysis of the data, further explaining experiences of
parents, as well as, utilized for recommendations for the scales used in the study.
85
Another strength of the study is the relatively large sample size achieved from an
extensive sampling frame. Unlike the Stuart et al. (2008) study which applied a
convenience sampling approach, the current study chose a census approach. Thus, given
that we recruited the parents through identification of their adult children with intellectual
disabilities and given that we mailed our surveys to potential participants, without
possibility of follow-up and/or incentives, our achieved participation rate of 24% was
expected for our study (Evenhuis et al., 2004; Kanuk & Berenson, 1975).
However, there are limitations to the present study. Due to our indirect method of
accrual, there was no possibility of follow-up by investigators, which resulted in a
substantial amount of item non-response (missing data/values). This lowered the sample
sizes for analyses of two of the three scales, Stigma Experience Scale and Parental
Changes Subscale which would also lower the power to detect correlation between the
scales.
There is the potential for selection bias as 10 agencies declined participation in
our study. We do not know whether the parents affiliated with those 10 agencies were
significantly different than the parents recruited through our 23 participating agencies.
Dichotomizing the Stigma Experience Scale may have also introduced
misclassification of stigma experiences where parents who reported that they either were
“not sure” or that they “sometimes” felt that a particular stigma experiences were relevant
to them, were analyzed as having an absence of that stigma experience. Another
limitation of the study was in regards to the structure of items within the survey.
Specifically for scale items, a response option for “Not Applicable” would have likely
decreased the amount of item non-response. As well, presenting items within a scale as an
86
obvious set, e.g., the Stigma Impact Scale, may have contributed to the occurrence of
response set bias.
There were also limitations to the evaluation of the Parental Changes Subscale.
Only 51 out of a total sample of 97 parents responded to all items within this scale
indicating large item non-response. Such low sample size likely did not afford us enough
power to evaluate its association with each of the two stigma scales. Response bias was
also present for this scale as those parents who responded to all items within this scale
were significantly different from non-respondents. Given the narrow range of item
responses with most responses aggregating around the “agree” and “strongly agree”
response categories, social desirability bias may also be present along with a ceiling effect
limiting the measurement of positive changes in such parents.
Finally, the sample size for the subgroup of parents who reported that their child
had a likely dual diagnosis was small (n=32 out of a total, 97), which restricted analysis
options of this group. Given that parents of adults with a dual diagnosis were more likely
to report that stigma affected their family’s quality of life than parents whose children had
only an intellectual disability, it would seem that parents have differing family
experiences given the added diagnosis of mental health problems. Thus, it would have
been informative to be able to undertake a comparison of experiences (stigma and
positive) to explore how additional disability in an adult child impacts the parental
experience. Originally, the stigma scales were developed for a mental health sample, so it
would be of interest to see how the scales function in a group that deals with both an
intellectual disability and mental health problems. To date, there have been no studies that
have looked at stigma related to families of individuals with a dual diagnosis.

87
6.4 Future Direction of Study
The current study was exploratory in its analysis of some of the psychometric
properties of three scales aimed to measure the experiences of parents of adults with an
intellectual disability. The factor structure of the two stigma scales was assumed because
it was demonstrated in the mental health sample (Stuart et al., 2008). As such, the
dimensionality of the construct(s) aiming to be measured for each of the three scales
(experiences of stigma, impact of stigma and parental changes undergone by parents, due
to their adult child with intellectual disability) was not verified, only assumed. This
assumption is likely given that the coefficients of reliability of all the three scales were
high, whereas if a scale was truly multi-dimensional yet assumed otherwise, the
coefficient of reliability would be lower than expected (Miller, 1995). Miller (1995)
advocated that the coefficient of reliability be used to assess internal consistency only
after there is an established unidimensionality. However, it is also proposed that without
reliability, validity of a psychometric tool cannot exist (Cronbach, 1990). Thus, given that
validity of a scale cannot be confirmed without reliability, the current exploratory study
aimed to first determine the internal consistencies of each of the scales.
As previously discussed, due to its limitations, the Parental Changes Subscale is
not recommended for future use in parents of adults with an intellectual disability. Both
the Stigma Impact Scale and the Stigma Experience Scale are cautiously recommended
given some necessary changes to the scales. Scales with good psychometric properties are
necessary to adequately fulfill the goal of describing the experiences of parents of adults
with an intellectual disability. Future studies should further develop the two stigma scales
to tackle the issues previously discussed surrounding each scale, with consideration of the
88
relevance of the scale items to parents of adults with an intellectual disability. The
internal consistency of the modified scales should be re-analyzed, and if found to be
acceptable, a factor analysis should be undertaken. Consideration should be given to
developing a global stigma score by somehow combining the two stigma scales.
Most research surrounding stigma has focused on mental health problems. The
current study, with its use of two stigma scales that had originally been applied to families
of individuals with mental health problems, has demonstrated how the psychometric
properties, specifically, internal consistencies of the scales, hold when applied to families
of individuals with an intellectual disability. Such applications of the stigma scales to
different samples add to the instruments’ further development and breadth of utility. It
also allows for an opportunity to understand the process of stigma as it manifests in
different populations.
The current study has future implications for its underlying population, parents of
adults with an intellectual disability residing in South Eastern Ontario, in providing an
exploratory analysis of their stigma experiences, caregiving stressors and needs. We
found that age of adult children and age of parents were significantly associated with a
number of stigmatizing experiences. This may be indicative of an age cohort that
highlights differing caregiving stressors and needs of parents. Gender and employment
status were also significantly associated with some experiences of stigma with mothers or
those who were employed reporting more stigmatizing experiences than fathers or those
who were likely retired or homemakers (i.e., unemployed). Parents of those with a dual
diagnosis were more likely to report that stigma affected their family’s quality of life
compared to parents whose adult children only had an intellectual disability. Given
sufficient sample size, future studies may be able to stratify according to these
89
characteristics of interest to evaluate whether such variables may be mediating,
moderating or confounding the stigma experiences of parents. Additionally, focusing on
the experiences of such sub-groups specifically can allow for a better understanding of
how to direct supports and services for such families and their unique needs while also
being able to better target anti-stigma advocacy for intellectual disabilities.
90
CHAPTER 7: CONCLUSION
To date, only one previous study had applied a scale to measure stigma in families
of those with an intellectual disability (Mak & Cheung, 2008). The findings of the current
study mainly recommend two stigma scales, to be used in conjunction with one another.
One scale measures the experiences of stigma and the other scale measures the degree of
impact due to such experiences of stigma. Given that this study aimed to describe the
positive and negative experiences of parents of adults with an intellectual disability,
further development of the stigma scales should be undertaken and re-tested amongst the
same population of interest, along with an exploration of a more suitable scale to capture
the parents’ positive experiences. Originally developed for a mental health sample, future
development of the two scales used in our study, aiming to capture the experience and
impact of stigma, should focus on answering whether stigma is expressed in parents of
individuals with intellectual disabilities to the same magnitude as parents of those with
mental health problems, or whether stigma is even significantly relevant to parents of
adults with intellectual disabilities. Subgroups of parents differ significantly in terms of
certain stigma experiences so future studies should further explore characteristics of
parents that may influence experiences of stigma.
91
REFERENCES
Abbott, D. A. & Meredith, W. H. (1986). Strengths of parents with retarded children. Family Relations, 35(3), 371-376.
Ablon, J. (1990). Ambiguity and difference, families with dwarf children. Social Science
& Medicine, 30, 879–897. Abraham, C., Gregory, N., Wolf, L., & Pemberton, R. (2002). Self-esteem, stigma and
community participation amongst people with learning difficulties living in the community. Journal of Community & Applied Social Psychology, 12(6), 430-443.
Aday, L. A. & Cornelius, L. J. (2006). Designing and conducting health surveys: a
comprehensive guide (3rd edition). San Francisco, CA: Jossey-Bass. Altman, B. M. (1981). Studies of Attitudes toward the Handicapped: The Need for New
Direction. Social Problems, 28, 321-333. American Association on Intellectual and Developmental Disabilities. (2009). Definition
of Intellectual Disabilities. Accessed on November 06, 2009 at: http://www.aamr.org/content_100.cfm?navID=21
American Psychiatric Association. (2000). Diagnostic and Statistical Manual of Mental
Disorders, 4th Edition, Text Revision. Washington, DC: American Psychiatric Association.
Angermeyer, M. C., Schulze, B., & Diertrich, S. (2003). Courtesy stigma – a focus group
study of relatives of schizophrenia patients. Social Psychiatry and Psychiatric Epidemiology, 38, 593–602.
Arvio, M. & Sillanpaa, M. (2003) Prevalence, aetiology and comorbidity of severe and profound intellectual disability in Finland. Journal of Intellectual Disability Research, 47, 108–112.
Bandalos, D. L. & Enders, C.K. (1996). The effects of nonnormality and number of
response categories on reliability. Applied Measurement in Education, 9(2), 151-160.
Becker, H. S. (1963). Outsiders: Studies in the Sociology of Deviance. New York: The Free Press of Glencoe.
Biasini, F. J., Grupe, L., Huffman, L., & Bray, N.W. (1997). The prevalence of mental
retardation: a critical review of recent literature. Developmental Medicine and Child Neurology, 39, 125-32.
Birenbaum, A. (1970). On managing a courtesy stigma. Journal of Health and Social
Behavior, 2(3), 196-206.
92
Blum, N. (1991). The management of stigma by Alzheimer family caregivers. Journal of
Contemporary Ethnography, 20, 263–284. Borthwick-Duffy, S. A. & Eyman, R. K. (1990). Who are the dually diagnosed?
American Journal on Mental Retardation, 94, 586-595.
Bristol, M. M., Gallagher, J. J., & Schopler, E. (1988). Mothers and fathers of young developmentally disabled and nondisabled boys: Adaptation and spousal support. Developmental Psychology, 24, 441–451.
Brockley, J. A. (1999). History of mental retardation: An essay review. History of Psychology, 2(1), 25–36.
Camp, B. W., Broman, S. H., Nichols, P. L., & Leff, M. (1998). Maternal and neonatal
risk factors for mental retardation: defining the 'at-risk' child. Early Human Development, 50(2), 159-173.
Child and Family Services Statute Law Amendment Act. (2009). An Act to amend the
Child and Family Services Act and to make amendments to other Acts, CHAPTER 2. Accessed on January 17, 2010: http://www.e- laws.gov.on.ca/html/source/statutes/english/2009/elaws_src_s09002_e.htm
Childs, R. (1985). Maternal psychological conflicts associated with birth of a retarded
child. Maternal Child Nursing Journal, 14,175–182. Chung, K.F. & Wong, M.C. (2004). Experience of stigma among Chinese mental health
patients in Hong Kong. Psychiatric Bulletin, 28, 451-454.
Clark, L. A. & Watson, D. (1995). Constructing validity: Basic issues in scale development. Psychological Assessment, 7, 309-319.
Cleaver, S., Ouellette-Kuntz, H., & Hunter, D. (2007). Relationship Between Mobility
Limitations and the Places Where Older Adults With Intellectual Disabilities Live. Journal of Policy and Practice in Intellectual Disabilities, 5(4), 253-258.
Clifford, T. (2007). Transition to school: Experiences of children with intellectual
disabilities and their families. Autism Matters, 4(4), 22-24. Corrigan, P. W. & Penn, D. L. (1999). Lessons from social psychology on discrediting
psychiatric stigma. American Psychologist, 54, 765–776. Corrigan, P. W. (2000). Mental health stigma as social attribution: implications for
research methods and attitude change. Clinical Psychology: Science and Practice, 7, 48–67.

93
Corrigan, P. W., River, L. P., Lundin, R. K., Penn, D. L., Uphoff-Wasowski, K.,
Campion, J., Mathisen, J., Gagnon, C., Bergman, M., Goldstein, B. H., & Kubiak, M. A. (2000). Stigmatising attributions about mental illness. Journal of Community Psychology, 28, 91-102.
Corrigan, P. W., Edwards, A. B., Green, A., Diwan, S. L., & Penn, D. L. (2001).
Prejudice, social distance, and familiarity with mental illness. Schizophrenia Bulletin, 27 (2), 219-225.
Corrigan, P. W. & Watson, A. C. (2002). The paradox of self-stigma and mental illness.
Clinical Psychology, 9, 35–53. Corrigan, P. W. & Watson, A. C. (2002b). Understanding the impact of stigma on people
with mental illness. World Psychiatry, 1(1), 16-20. Crocker, J. & Major, B. (1989). Social stigma and self-esteem: the self-protective
properties of stigma. Psychological Review, 96, 608-630. Cummings, S. (1976). The impact of the child's deficiency on the father: A study of
fathers of mentally retarded and chronically ill children. American Journal of Orthopsychiatry, 46, 246-255.
Dagnan, D. & Sandhu, S. (1999). Social comparison, self-esteem and depression in
people with intellectual disability. Journal of Intellectual Disability Research, 43(5), 372–379.
Damrosh, S. P. & Perry, L. A. (1989). Self reported adjustment, chronic sorrow, and coping with parents of children with Down syndrome. Nursing Research, 38, 25-30.
Davis, N. J. (1972). Labelling theory in deviance research: a critique and reconsideration. Sociological Quarterly, 13, 447-474.
Developmental Service Act. [1990] (2008). R.S.O. 1990, CHAPTER D.11. Accessed on January 17, 2010 at: http://www.elaws.gov.on.ca/html/statutes/english/elaws_statutes_90d11_e.htm
Dickerson, F. B., Sommerville, J., Origoni, A. E., Ringel, R. B., & Parente,
R. (2002). Experiences of stigma among outpatients with schizophrenia. Schizophrenia Bulletin, 28, 143–147.
Dovidio, J.F., Major, B., & Crocker, J. (2000). Stigma: Introduction and overview. In:
Heatherton, Kleck, R. E., Hebl, M. R., & Hull, J.G., editors. The social psychology of stigma. New York: Guiltford.
94
Drews, C. D, Murphy, C. C., Yeargin-Allsopp, M., & Decoufle, P. (1996). The
relationship between idiopathic mental retardation and maternal smoking during pregnancy. Paediatrics, 97(4), 547-553.
Elbogen, E. B., Swanson, J. W., Swartz, M. S., & Van Dorn, R. (2005). Family Representative Payeeship and Violence Risk in Severe Mental Illness. Law and Human Behavior, 9(5), 563-574.
Evenhuis, H., van Splunder, J., Vink, M., Weerdenburg, C., van Zanten, B. & Stilma J. (2004). Obstacles in largescale pidemiological assessment of sensory impairments in a Dutch population with intellectual disabilities. Journal of Intellectual Disability Research, 48, 708–18.
Farina, A., Gliha, D., Boudreau, L. A., Allen, J. G., & Sherman, M. (1971). Mental illness and the impact of believing others know about it. Journal of Abnormal Psychology, 77, 1-5.
Farina, A. & Felner, R. D. (1973). Employment interviewer reactions to former mental
patients. Journal of Abnormal Psychology, 82, 268-272. Feinberg, J. (1978). Mentally handicapped. In: Reich, W.T., editor. Encyclopedia of
Bioethics. New York: Free Press. Fink, P. J. & Tasman, A. (1992). Stigma and Mental Illness. Washington, DC: American
Psychiatric Press. Freeman, H. E. & Simmons, O. G. (1961). Feelings of stigma among relatives of former
mental patients. Social Problems, 8, 312-321. Frid, C., Drott, P., Lundell, B., Rasmussen, F., & Anneren, G. (1999). Mortality in
Down's syndrome in relation to congenital malformations. Journal of Intellectual Disability Research, 43, 234-41.
Fryers, T. (1995). Epidemiological concerns in current literature. Current Opinion in
Psychiatry, 8(5), 272-275.
Gallagher, S., Phillips, A. C., Oliver, C., & Carroll, D. (2008). Predictors of Psychological Morbidity in Parents of Children with Intellectual Disabilities. Journal of Pediatric Psychology, 33(10), 1129-1136.
Goffman, E. (1963). Stigma: Notes on the Management of Spoiled Identity. New York: Touchstone.
Gordon, P. A., Feldman, D., Tantillo, J. C., & Perrone, K. (2004). Attitudes regarding
interpersonal relationships with persons with mental illness and mental retardation. Journal of Rehabilitation, 70, 50–56.
95
Gray, D. E. (2002). 'Everybody just freezes. Everybody is just embarrassed': felt and enacted stigma among parents of children with high functioning autism. Sociology of Health & Illness, 24 (6), 734–749.
Green, S. E. (2003). “What do you mean ‘what’s wrong with her?’”: stigma and the lives
of families of children with disabilities. Social Science & Medicine, 57, 1361– 1374.
Greenberg, J. S., Greenley, J. R., McKee, D., Brown, R., & Griffin-Francell, C. (1993).
Mothers caring for an adult child with schizophrenia: The effects of subjective burden on maternal health. Family Relations, 42, 205-211.
Griffiths, D., Stavrakaki, C. & Summers, J. (editors) (2002). An introduction to the
mental health needs of persons with developmental disabilities. Sudbury, ON: Habilitative Mental Health Resource Network.
Halsey, C. L, Collin M. F., & Anderson, C. L. (1996). Extremely low-birth-weight children and their peers. A comparison of school-age outcomes. Archives of Pediatrics & Adolescent Medicine, 150(8), 790-794.
Hamilton, D. L. & Sherman, J. W. (1994). Stereotypes. In: Wyer, R.S. Jr., & Srull,
T.K., editors. Handbook of social cognition (2nd ed., Vol. 2). Hillside, New Jearsey: Erlbaum.
Hand, J. E. (1994). Report of a national survey of older people with lifelong intellectual
handicap in New Zealand. Journal of Intellectual Disability Research, 38, 275-87. Hartlage, L. C. & Roland, P. E. (1971). Attitudes of employers toward different types of
handicapped workers. Journal of Applied Rehabilitation Counseling, 2, 115-120. Holmes, E. P. & River L.P. (1998). Individual strategies for coping with the stigma of
severe mental illness. Cognitive and Behavioural Practice, 5, 231-239. Holmes, E. P., Corrigan, P. W., Williams, P., Canar, J., & Kubiak, M. (1999). Changing
public attitudes about schizophrenia. Schizophrenia Bulletin, 25(3), 447-456.
Hulin, C., Netemeyer, R., & Cudeck, R. (2001). Can a reliability coefficient be too high? Journal of Consumer Psychology, 10(1), 55-58.
Jacobsson, L. (2002). The roots of stigmatization. World Psychiatry, 1(1), 25. Jahoda, A. & Markova, I. ( 2004). Coping with social stigma: people with intellectual
disabilities moving from institutions and family home. Journal of Intellectual Disability Research, 48, 719– 729.
96
Jones, E. E., Farina, A., Hastorf, A. H., Markus, H., Miller, D. T., & Scott, R. (1984). Social stigma: the psychology of marked relationships. New York: W.H. Freeman.
Kadri, N., Manoudi, F., Berrada, S., & Moussaoui, D. (2004). Stigma impact on Morrocan families of patients with schizophrenia. Canadian Journal of Psychiatry, 49(9), 625-629.
Kaiser, H. A. (1999). The Health Law Institute State of Advocacy for People With Mental
Disability in NS. Accessed on November 3, 2009: http://www.reachability.org/articles/The%20Health%20Law%20Institute%20Stat e%20of%20Advocacy.pdf
Kanuk, L. & Berenson, C. (1975). Mail Surveys and Response Rates: A Literature Review. Journal of Marketing Research, 12(4), 440-453.
Kearney, P. M. & Griffin, T. (2001). Between joy and sorrow: being a parent of a child with developmental disability. Journal of Advanced Nursing, 34, 582–92.
Kim, S., Larson, S. A., & Lakin, K. C. (2001). Behavioral outcomes of
deinstitutionalization for people with intellectual disability: A review of U.S. studies conducted between 1980 and 1999. Journal of Intellectual and Developmental Disability, 26(1), 35-50.
Kirby, M. (2006). Out of the Shadows at last: Transforming Mental Health, Mental
Illness and Addiction Services in Canada. Accessed on November 3, 2009 at: http://www.parl.gc.ca/39/1/parlbus/commbus/senate/Com-e/SOCI-E/rep-e/rep02may06-e.htm.
Kirgiss, C. R. (2008). Mental Retardation: Determining Eligibility for Social Security
Benefits. Washington, DC: National Academies Press. Lawton, M. P. (1991). A multidimensional view of quality of life. In: Birren, J.E.,
Lubben, J.E., Rowe, J.C., & Deutchman, D.E., editors. The concept and measurement of quality of life in the frail elderly. New York: Academic Press.
Lefley, H. (1992). Expressed emotion: conceptual, clinical and social policy issues.
Hospital and Community Psychiatry, 43, 591–598. Lemert, E. M. (1967). Human deviance, social problems and social control. Englewood
cliffs: Prentice-Hall.
Levinson, R. M. & Starling, D. M. (1981). Retardation and the burden of stigma. Deviant Behavior, 2, 371–390.
97
Link, B. G. (1987). Understanding labeling effects in the area of mental disorders: An assessment of the effects of expectations of rejection. American Sociological Review, 52, 96-112.
Link, B. G., Cullen, F. T., Struening, E., Shrout, P. E., & Dohrenwend, B. P. (1989). A
Modified Labeling Theory Approach to Mental Disorders: An Empirical Assessment. American Sociological Review, 54, 400-423.
Link, B. G., Phelan, J. C., Bresnahan, M., Stueve, A., & Pescosolido, B. A. (1999). Public
conceptions of mental illness: Labels, causes, dangerousness and social distance. American Journal of Public Health, 89, 1328-1333.
Link, B. & Phalen, J. (2001). Conceptualizing stigma. Annual Review of Sociology, 27,
363-385. López-Ibor, Jr., J. J. (2002). The power of stigma. World Psychiatry, 1(1), 23-24. Luckasson, R., Coulter, D. L., Polloway, E. A., Reiss, S., Schalock, R. L., Snell, M. E.,
Spitalnik, D. M., & Stark, J. A. (2002). Mental retardation: Definition, classification, and systems of supports (10th ed). Washington, DC: American Association on Mental Retardation.
Lunsky, Y., Garcin, N., Morin, D., Cobigo, D., & Bradley, E. (2007). Mental Health Services for Individuals with Intellectual Disabilities in Canada: Findings from a National Survey. Journal of Applied Research in Intellectual Disabilities. 20, 439–447.
MacRae, H. (1999). Managing courtesy stigma: The case of alzheimer’s disease.
Sociology of Health and Illness, 21, 54–70. Mak, W. W. & Cheung, R. Y. M. (2008). Affiliate Stigma Among Caregivers of People
with Intellectual Disability or Mental Illness. Journal of Applied Research in Intellectual Disabilities, 21 (6), 532-545.
Mak, W. W. & Kwok, Y. T. (2010). Internalization of stigma for parents of children with
autism spectrum disorder in Hong Kong, Social Science & Medicine, in press: doi:10.1016/j.socscimed.2010.02.023
Makimoto, K., Lida, Y., Hayashi, M., & Takasaki, F. (2001). Response bias by
neuroblastoma screening participation status and social desirability bias in an anonymous postal survey, Ishikawa, Japan. Journal of Epidemiology, 11(2), 70- 73.
McCallion, P., & McCarron, M. (2004) Intellectual disabilities and dementia. In:
Doka, K., editor. Living with Grief: Alzheimer’s disease (pp. 67–84).Washington, DC: Hospice Foundation of America.
98
McGuigan, S. M., Hollins, S., & Attard, M. (1995). Age-specific standardized mortality rates in people with learning disability. Journal of Intellectual Disability Research, 39(6), 527-531.
McLaren, J. & Bryson, S. E. (1987). Review of recent epidemiological studies in mental retardation: Prevalence, associated disorders, and etiology. American Journal of Mental Retardation, 92, 243-254.
Mehta, S. & Farina, A. (1988). Associative stigma: perceptions of the difficulties of college-aged children of stigmatized fathers. Journal of Social Clinical Psychology, 7, 192-202.
Mental Health Commission of Canada. (2007). Report to the Mental Health Commission
of Canada, A Time for Action: Tackling Stigma and Discrimination. Accessed online on January 17, 2010 at: http://www.mentalhealthcommission.ca/SiteCollectionDocuments/Anti- Stigma/TimeforAction_Eng.pdf
Miles, M. (2001). Martin Luther and Childhood Disability in 16th Century Germany:
What did he write? What did he say? Journal of Religion, Disability & Health, 5 (4), 5-36.
Miller, M. B. (1995). Coefficient alpha: A basic introduction from the perspectives
of classical test theory and structural equation modeling. Structural Equation Modeling, 2, 255-273.
Minns, R. A. (1997). Pre and perinatal conditions contributing to mental retardation. Current Opinion in Psychiatry,10(5), 354-59.
Nuehring, E. M. (1979). Stigma and state hospital patients. American Journal of Orthopsychiatry, 49, 626-633.
Nunnally, J. (1978). Psychometric theory. New York: McGraw-Hill.
O’Grady, J. (2007). Commentary on “Psychiatric Resident Education in Intellectual Disabilities”. Academic Psychiatry, 31(6), 417-418.
Ohaeri, J. U. & Fido, A. A. (2001). The opinion of caregivers on aspects of
schizophrenia and major affective disorders in Nigerian setting. Social Psychiatry Psychiatric Epidemiology, 36, 493–499.
Östman, M. & Kjellin, L. (2002) Stigma by association: psychological factors in relatives
of people with mental illness. British Journal of Psychiatry, 181, 494–498.
99
Ouellette-Kuntz, H., Minnes, P., Garcin, N., Martin, C., Lewis, M. E. S., & Holden, J. J. A. (2005). Addressing Health Disparities Through Promoting Equity for Individuals with Intellectual Disability. Canadian Journal of Public Health, 96(2), 8-22.
Page, S. (1977). Effects of the mental illness label in attempts to obtain accommodation.
Canadian Journal of Behavioural Science, 9, 85-90. Phelan, J. C., Bromet, E. J., & Link, B. G. (1998). Psychiatric illness and family stigma.
Schizophrenia Bulletin, 24, 115–126.
Payne, J. & Patton, J. (1981). Mental retardation. Columbus, Ohio: Charles E. Merrill.
Polder, J. J., Meerding, W. J, Bonneux, L., & van dermas, P. J. (2002). Health care costs of intellectual disability in the Netherlands: A cost-of-illness perspective. Journal of Intellectual Disability Research, 46, 168-78.
Radford, J. P. & Park, D. C. (1993). A convenient means of riddance: institutionalization of people diagnosed as mentally deficient in Ontario,1876-1934. Health and Canadian Society, 1(2), 369-392.
Raghuram, R., Weiss, M. G., Channabasavanna, S. M., & Diop, M. (1996). Stigma, depression and somatization in South India. American Journal of Psychiatry, 153,1043-1049.
Reiss, S. (1990). Prevalence of dual diagnosis in community-based programs in the Chicago metropolitan area. American Journal on Mental Retardation, 94, 578-584.
Roeleveld, N., Zielhuis, G. A., & Gabreels, F. (1997). The prevalence of mental retardation: a critical review of recent literature. Developmental Medicine and Child Neurology, 39, 125-32.
Royal College of Psychiatrists. (1999). Patient Advocacy. Council Report CR74. London: Royal College of Psychiatrists.
Rubin, S. & Roessler, R. (1983). Foundations of the vocational rehabilitation process. Baltimore: University Park.
Sartorius, N. (1999). One of the last obstacles to better mental health care: the stigma of mental illness. In: Guimon, J., Fischer, W., & Sartorius, N., editors. The Image of Madness: The Public Facing Mental Illness and Psychiatric Treatment. Basel, Switzerland: Karger.
100
Sartorius, M. & Schulze, H. (2005). Reducing the stigma of mental illness: a report from a global programme of the World Psychiatric Association. Cambridge: Cambridge University Press.
Scheerenberger, R. C. (1983). A History of Mental Retardation. Baltimore: P. H. Brooks Publishing Co.
Scheff, T. J. [1966] (1984). Being Mentally Ill: A Sociological Theory. New York: Aldine.
Schilling, R. F., Gilchrist, L. D., & Schinke, S. P. (1984). Coping and Social Support in
Families of Developmentally Disabled Children. Family Relations, 33, (1), 47-54. Schilling, R. F. & Schinke, S. P. (1984). Maltreatment and mental retardation.
Mental Retardation, 20, 201-209.
Schulze, B. & Angermeyer, M. C. (2003). Subjective experiences of stigma: A focus group study of schizophrenic patients, their relatives and mental health professionals. Social Science & Medicine, 56, 299–312.
Scorgie, K. & Sobsey, D. (2000). Transformational outcomes associated with parenting
children who have disabilities. Mental Retardation, 38, 195-206. Seltzer, M. M., Greenberg, J. S., Floyd, F. J., Pettee, Y., & Hong, J. (2001). Life course
impacts of parenting a child with a disability. American Journal on Mental Retardation, 106, 265–286.
Shibre, T., Negash, A., Kullgren, G., Kebede, D., Alem, A., Fekadu, A., Fekadu, D.,
Medhin, G., & Jacobsson, L. (2001). Perception of stigma among family members of individuals with schizophrenia and major affective disorders in rural Ethiopia. Social Psychiatry & Psychiatric Epidemiology, 36(6), 299–303.
Sigelman, C. K., Howell, J. L., Cornell, D. P., Cutright, J. D., & Dewey, J. C. (1991).
Courtesy stigma: The social implications of associating with a gay person. Journal of Social Psychology, 131, 45–56.
Spangenberg, J. & Theron, J. (2000). Stress and coping in parents of children with Down syndrome, Studia Psychologica, 43,41–48.
Stengler-Wenzke, K., Beck, M., Holzinger, A., & Angermeyer, M. C. (2004). Stigma Experiences of Patients with Obsessive Compulsive Disorders. Fortschritte Der Neurologie Psychiatrie, 72, 7-13.
Strauss, D. & Eyman, R. K. (1996). Mortality of people with mental retardation in California with and without Down's syndrome, 1986-1991. American Journal on Mental Retardation, 100, 643-53.

101
Streiner, D. L. & Norman, G. R. (2003). Health Measurement Scales: a practical guide to their development and use (3rd ed.). New York: Oxford University Press.
Strohmer, D. C., Grand, S. A., & Purcell, M. J. (1984). Attitudes toward persons with a disability: An examination of demographic factors, social context, and specific disability. Rehabilitation Psychology, 29, 131-145.
Struening, E. L., Perlick, D. A., Link, B. G., Hellman, F., Herman, J. D., & Sirey, J. A.
(2001). The extent to which caregivers believe most people devalue consumers and their families. Psychiatric Services, 52, 1633 –1638.
Stuart, H. & Arboleda-Flórez, J. (2001). Community Attitudes Toward People with Schizophrenia. Canadian Journal of Psychiatry, 46, 245-252.
Stuart, H., Milev, R., & Koller, M. (2005).The inventory of stigma experiences: Development and reliability. World Psychiatry, 4(1), 33-37.
Stuart, H. (2008). Building an evidence base for anti-stigma programming. In: Arboleda
Florez, J., & Sartorius, N., editors. Understanding the Stigma of Mental Illness – Theories and Interventions. Toronto: Wiley & Sons.
Stuart, H., Koller, M., & Milev, R. (2008). Inventories to Measure the Scope and Impact
of Stigma Experiences From the Perspective of Those Who Are Stigmatized— Consumer and Family Versions. In: Arboleda Florez, J., & Sartorius, N., editors. Understanding the Stigma of Mental Illness – Theories and Interventions. Toronto: Wiley & Sons.
Syzmanski, L. & Wilska, M. (1997) Mental retardation. In: Tasman, A., editor. Psychiatry, 1st Ed., pg. 606. Philadelphia: WB Saunders.
Szmukler, G. I., Burgess, P., Herrman, H., Benson, A., Colusa, S., & Bloch, S. (1996).
Caring for relatives with serious mental illness: The development of the Experience of Caregiving Inventory. Social Psychiatry and Psychiatric Epidemiology, 31(3-4), 137-148.
Tak-fai Lau, J. & Cheung, C. (1999). Discriminatory attitudes to people with intellectual
disability or mental health difficulty. International Social Work, 42(4), 431-444. Thomas, A. (2000). Stability of Tringo's hierarchy of preference toward disability groups:
30 years later. Psychological Reports, 86, 1155-1156.
Tossebro, J. (2004). Family Attitudes to Deinstitutionalization Before and After Resettlement: The Case of a Scandinavian Welfare State. Journal of Developmental and Physical Disabilities, 10(1), 55-72.
Tringo, J. L. (1970). The Hierarchy of Preference toward Disability Groups. The Journal of Special Education, 4(3), 295-306.
102
Turnbull, A. R. & Turnbull, H. R., editors. (1978). Parents Speak Out. Columbus, Ohio:
Merrill/Prentice Hall. van Schrojenstein Lantman-de Valk, H. M. J., van den Akker, M., Maaskant, M. A.,
Haveman, M. J., Urlings, H. F. J., Kessels, A. G. H., & Crebolder., H. F. J. K. (1997). Prevalence and incidence of health problems in people with intellectual disability. Journal of Intellectual Disability Research, 41(1), 42-51.
Wahl, O. F. & Harman, C. R. (1989). Family views of stigma. Schizophrenia Bulletin,
15, 131-139. WHO. ICD-10. (1992). International Statistical Classification of Diseases and Related
Health Problems, Tenth Revision. Volumes 1-3. Geneva: World Health Organization.
WHO. ICF. (2001). International Classification of Functioning, Disability and
Health. Geneva: World Health Organization.
Winzer, M. (2003). The history of special education: from isolation to integration. Washington, DC: Gallaudet University Press.
Wolfensberger, W. (1972). The principle of Normalization in human services. Toronto:
National Institute on Mental Retardation. Yu, D. & Atkinson, L. (1993). Intellectual disability with and without psychiatric
involvement: Prevalence estimates for Ontario. Journal on Intellectual Disabilities, 2, 92–99.
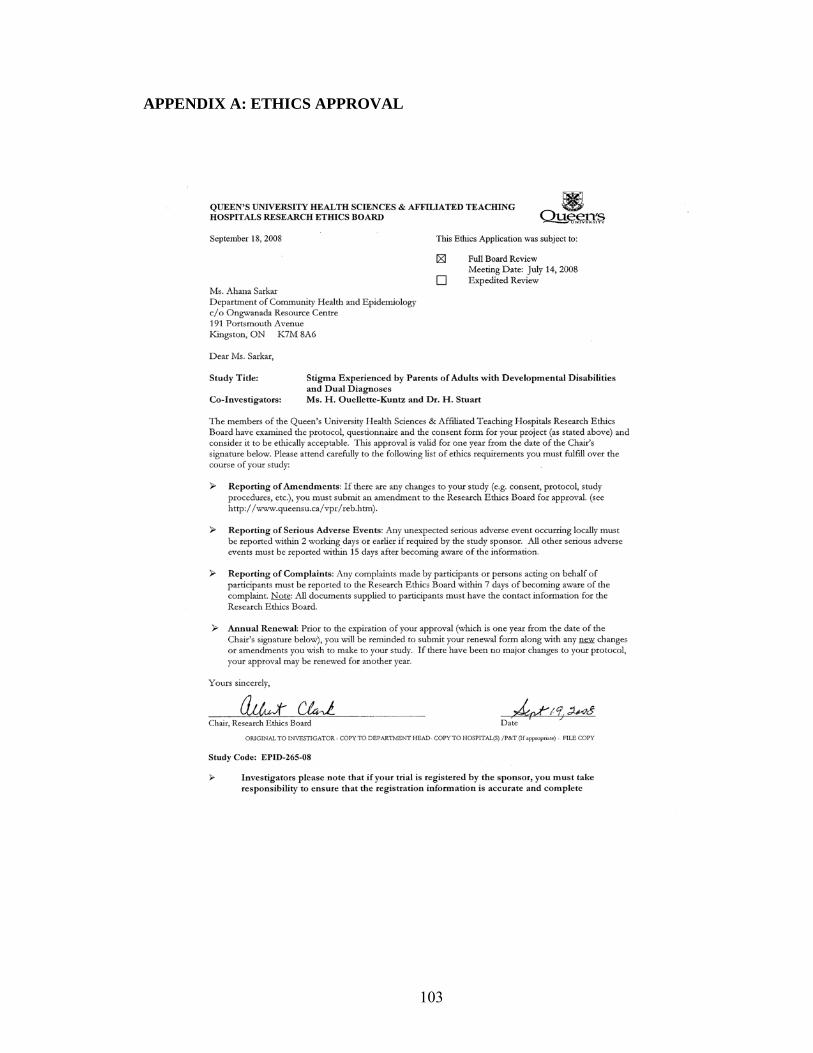
103
APPENDIX A: ETHICS APPROVAL

104
APPENDIX B: INITIAL LETTER OF INVITATION TO AGENCIES
Date Name of Executive Director Address Dear [Executive Director],
Title of Study: Stigma Experienced by Parents of Adults with Developmental Disabilities and Dual Diagnoses
As you know, raising a child with special needs can be both challenging and rewarding for parents. This SEO CURA in ID sponsored project will give parents of adults with developmental disabilities an opportunity to contribute to our understanding of stigma. The project is undertaken by one of my masters student, Ahana Sarkar. She is being supervised by both myself and Dr. Heather Stuart of the Department of Community Health & Epidemiology at Queen’s University. A total of 110 parents are needed. According to GRID records, your agency supports # adults with a developmental disability only, and # adults with a dual diagnosis. We recognize that not all will have parents who can be contacted. We are writing to ask for your agency’s assistance in contacting those parents for whom you have addresses. This would require sending a survey (copy attached) to parents on our behalf. We would provide all self-addressed stamped survey packages. If you can help us engage parents in this important project, please complete and fax back the attached response form. If you have any questions or concerns, do not hesitate to contact me (613-548-4417 x. 1198). You may also contact the Head of my Department at Queen’s, Dr. Bill MacKillop (613-533-2901), or the Chair of the Queen’s Research Ethics Board, Dr. Albert Clark (613-533-6081). Sincerely, Hélène Ouellette-Kuntz Director, SEO CURA in ID Associate Professor, Dept. Community Health & Epidemiology, Queens’ University Encl. cover letter and survey to parents, partner-agency response form.
105
PARTNER-AGENCY RESPONSE FORM
Title of Study: Stigma Experienced by Parents of Adults with Developmental Disabilities and
Dual Diagnoses
[Name of Agency] is willing to participate in the above-named project.
We understand that parents will be free to decide if they wish to take part and that
their decision will not affect the services we provide to them. We further note that
the information you will be collecting from families will be anonymous and
confidentiality will be assured.
To make arrangements to contact families, please speak with:
_________________________________ at ______________________________
[Name of agency contact] [phone number]
[Name of Agency] is unable to participate in the above-named project.
_______________________ ___________________________ ____________
Name, title Signature Date
PLEASE FAX BACK to Ahana Sarkar at 613-548-8135.

106
APPENDIX C: LETTER TO AGENCY CONTACT WITH LIST
(identification of potential participants)
Date Agency Contact, Title Address Dear [name of agency contact], Title of study: Stigma Experienced by Parents of Adults with Developmental Disabilities and Dual
Diagnoses
Thank you for your interest in helping us with the above-noted study. There are two parts to the recruitment of participants for which we need your help. For the first part, with this letter, we are sending you a list of all adult clients served by your agency. Please go through the attached list and check off all individuals for whom a parent (biological, adoptive, foster, step-parent) is available for participation in our study (i.e., eligibility for our study). Please use the enclosed self-addressed stamped envelope to mail the list back to us when completed. Once we receive the list, we will be able to determine the number of survey packages to be sent to each agency. We will then send you a list of selected clients along with survey packages to send to their parents on our behalf. Thank you for your time and involvement in helping us recruit participants for the study. If you have any questions, please feel free to contact us.
Ahana Sarkar, [email protected] (613-888-8971)
Hélène Ouellette-Kuntz, [email protected] (613-548-4417 x. 1198) Heather Stuart, [email protected] (613-533-6000 x. 77097)
If you have any worries about this project, you may contact Dr. Albert Clark, Chair of the Queen’s University Research Ethics Board, (613) 533-6081 or our Department Head at Queen’s University, Dr. Bill MacKillop (613-533-2901). Thanking you in advance. With regards, Ahana Sarkar
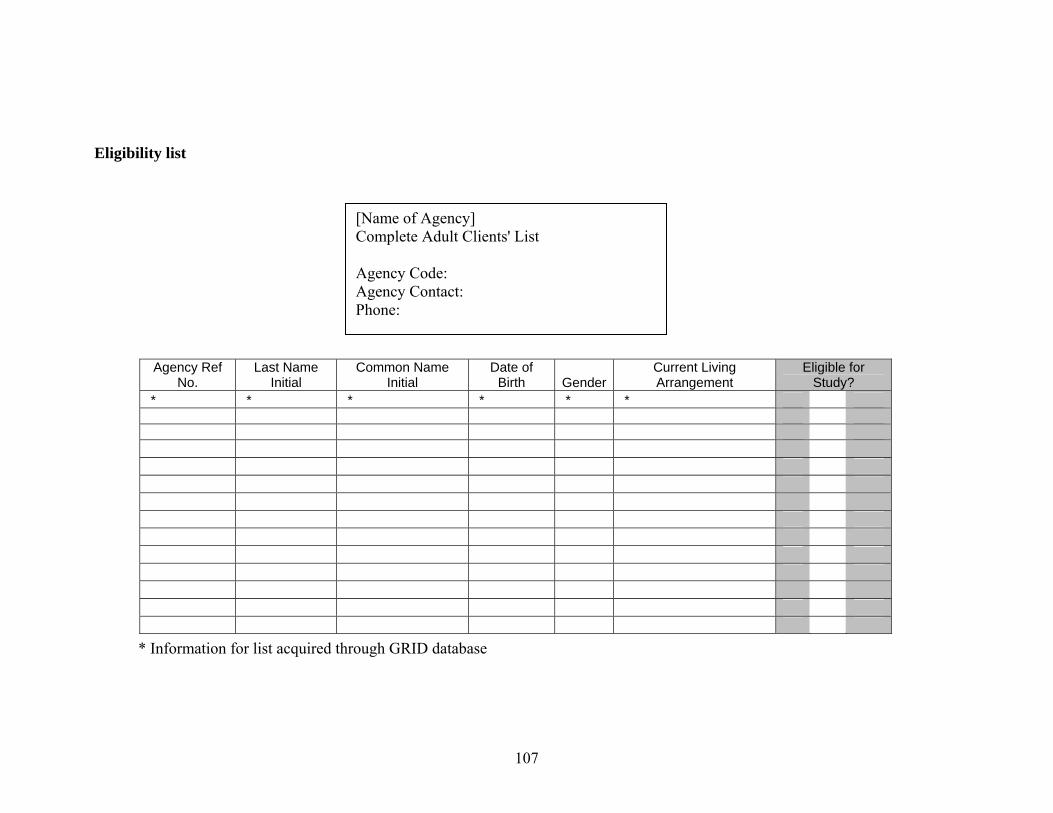
107
Eligibility list * Information for list acquired through GRID database
Agency Ref No.
Last Name Initial
Common Name Initial
Date of Birth Gender
Current Living Arrangement
Eligible for Study?
* * * * * *
[Name of Agency] Complete Adult Clients' List Agency Code: Agency Contact: Phone:
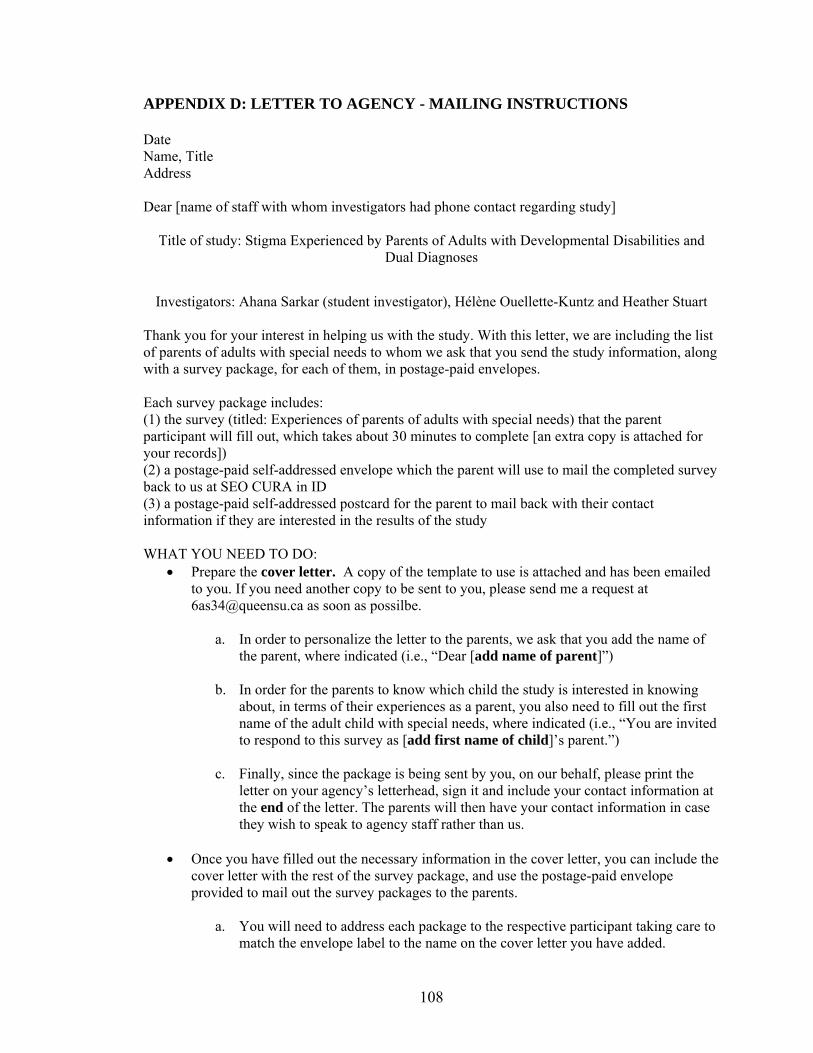
108
APPENDIX D: LETTER TO AGENCY - MAILING INSTRUCTIONS Date Name, Title Address Dear [name of staff with whom investigators had phone contact regarding study]
Title of study: Stigma Experienced by Parents of Adults with Developmental Disabilities and
Dual Diagnoses
Investigators: Ahana Sarkar (student investigator), Hélène Ouellette-Kuntz and Heather Stuart
Thank you for your interest in helping us with the study. With this letter, we are including the list of parents of adults with special needs to whom we ask that you send the study information, along with a survey package, for each of them, in postage-paid envelopes. Each survey package includes: (1) the survey (titled: Experiences of parents of adults with special needs) that the parent participant will fill out, which takes about 30 minutes to complete [an extra copy is attached for your records]) (2) a postage-paid self-addressed envelope which the parent will use to mail the completed survey back to us at SEO CURA in ID (3) a postage-paid self-addressed postcard for the parent to mail back with their contact information if they are interested in the results of the study WHAT YOU NEED TO DO:
• Prepare the cover letter. A copy of the template to use is attached and has been emailed to you. If you need another copy to be sent to you, please send me a request at [email protected] as soon as possilbe.
a. In order to personalize the letter to the parents, we ask that you add the name of
the parent, where indicated (i.e., “Dear [add name of parent]”) b. In order for the parents to know which child the study is interested in knowing
about, in terms of their experiences as a parent, you also need to fill out the first name of the adult child with special needs, where indicated (i.e., “You are invited to respond to this survey as [add first name of child]’s parent.”)
c. Finally, since the package is being sent by you, on our behalf, please print the
letter on your agency’s letterhead, sign it and include your contact information at the end of the letter. The parents will then have your contact information in case they wish to speak to agency staff rather than us.
• Once you have filled out the necessary information in the cover letter, you can include the
cover letter with the rest of the survey package, and use the postage-paid envelope provided to mail out the survey packages to the parents.
a. You will need to address each package to the respective participant taking care to
match the envelope label to the name on the cover letter you have added.

109
Thank you for your time and involvement in helping us recruit participants for the study. We hope that this study will help us understand the nature of experiences with stigma among these parents. We also expect that this study can give us a valid tool that can measure stigma and its impact across different populations. The results of such inquiries may one day benefit future programs and actions aimed at targeting the needs and issues surrounding the primary caregivers of adults with special needs, their parents. If you have any questions, please feel free to contact us.
Ahana Sarkar, [email protected] (613-888-8971)
Hélène Ouellette-Kuntz, [email protected] (613-548-4417 x. 1198) Heather Stuart, [email protected] (613-533-6000 x. 77097)
If you have any worries about this project, you may contact Dr. Albert Clark, Chair of the Queen’s University Research Ethics Board, (613) 533-6081 or our Department Head at Queen’s University, Dr. Bill MacKillop (613-533-2901). Thanking you in advance. With regards, Signed by student investigator Ahana Sarkar

110
APPENDIX E: COVER LETTER FOR PARENT PARTICIPANTS Date [Dear Agency staff: Please print this letter on your agency’s letterhead] Dear [Parent]: Title of study: Stigma Experienced by Parents of Adults with Developmental Disabilities and
Dual Diagnoses
As you know, raising a child with special needs can be both challenging and rewarding. We are working with researchers at Queen’s University to better understand the experiences of families of adult children with either developmental disability or dual diagnoses. By the term dual diagnoses, we mean diagnoses of both a developmental disability (e.g., intellectual disability) and mental health/behaviour problems. You are invited to respond to this survey as ________’s parent. There are two parts to this survey. The first part of the survey will ask you information about your child, use of specialized services and yourself. The second part of the questionnaire will ask you about a range of experiences you, as a parent, have had. It takes approximately 30 minutes to finish the survey. All of your answers will be kept strictly confidential. No names are collected so you will remain anonymous at all times. Your participation is entirely voluntary. Feel free to skip any questions that you do not wish to answer, or stop at any time. If you wish, you are free to discuss your participation in this study with your adult child. Information from this project will be used to help us and researchers at Queen’s University understand the nature of parents’ experiences and develop programs to enhance public awareness and acceptance. Your participation or lack of participation in this study will not affect any services you may be receiving currently or in the future. However, you may ultimately benefit from actions that may be informed by this research. If you choose to participate, your consent for participation in the study, and the consent for use of data collected from information in your survey, will be assumed by your completion and mailing back of the survey. There is a self-addressed stamped envelope provided for this purpose. Thank you. A grant to support this research has been obtained from the South Eastern Ontario Community-University Research Alliance in Intellectual Disabilities (SEO CURA in ID). If you would like to know the results of the study, you may fill out your contact information and mail back the self-addressed stamped postcard provided with the package, mailed separately from this survey, to maintain your anonymity.
Contact People If at any time you wish to talk to someone about this project, feel free to contact the investigators of the study. Ahana Sarkar, [email protected] (613-888-8971) Hélène Ouellette-Kuntz, [email protected] (613-548-4417 x. 1198) Heather Stuart, [email protected]

111
If you have any worries about this project, such as questions about your rights as a research subject, you may contact Dr. Albert Clark, Chair of the Queen’s University Research Ethics Board, (613) 533-6081 or Dr. Bill MacKillop, Head of the Department of Community Health & Epidemiology at Queen’s University, (613) 533-2901. You may also contact me if you feel the need to talk to someone regarding some of the issues raised in the survey. Signed by agency contact [Agency contact name, phone #] KEEP THIS PAGE FOR YOUR RECORDS
112
APPENDIX F: SURVEY
Experiences of parents of adults with special needs
Return survey by mail to: Ahana Sarkar 191 Portsmouth Avenue Kingston, Ontario K7M 8A6
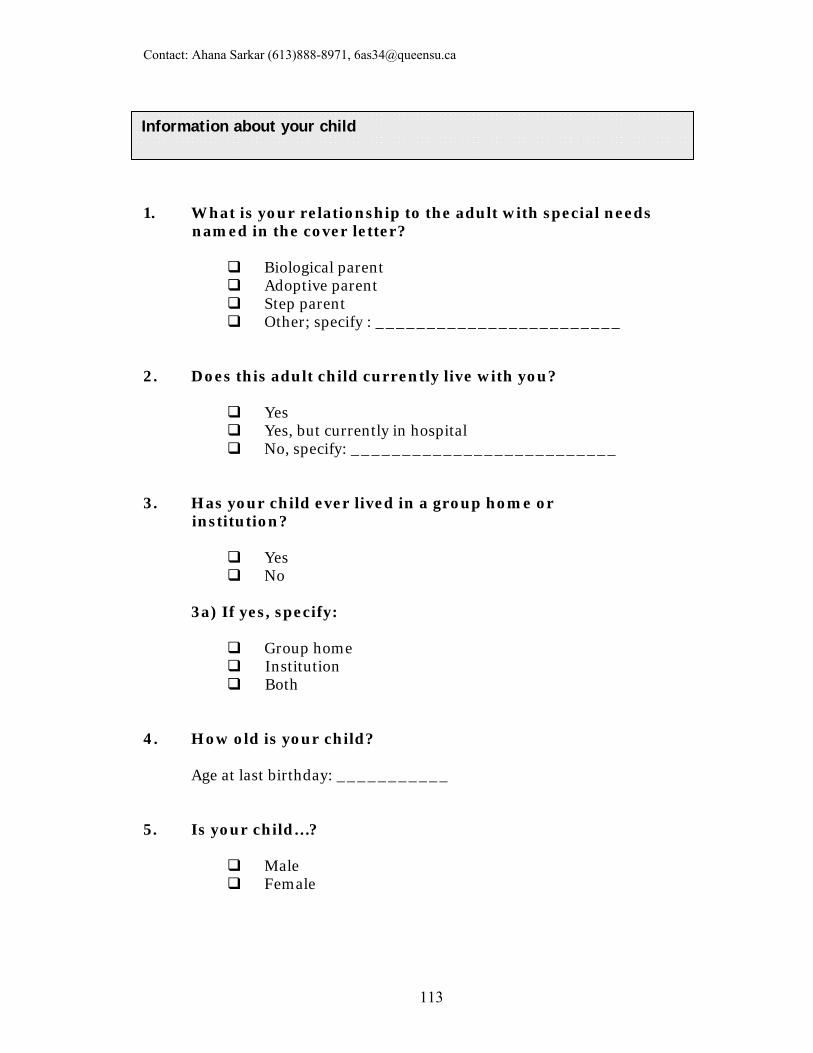
Contact: Ahana Sarkar (613)888-8971, [email protected]
113
1. What is your relationship to the adult with special needs named in the cover letter?
Biological parent Adoptive parent Step parent Other; specify : ________________________
2. Does this adult child currently live with you?
Yes Yes, but currently in hospital No, specify: __________________________
3. Has your child ever lived in a group home or institution?
Yes No
3a) If yes, specify:
Group home Institution Both
4. How old is your child?
Age at last birthday: ___________
5. Is your child…?
Male Female
Information about your child
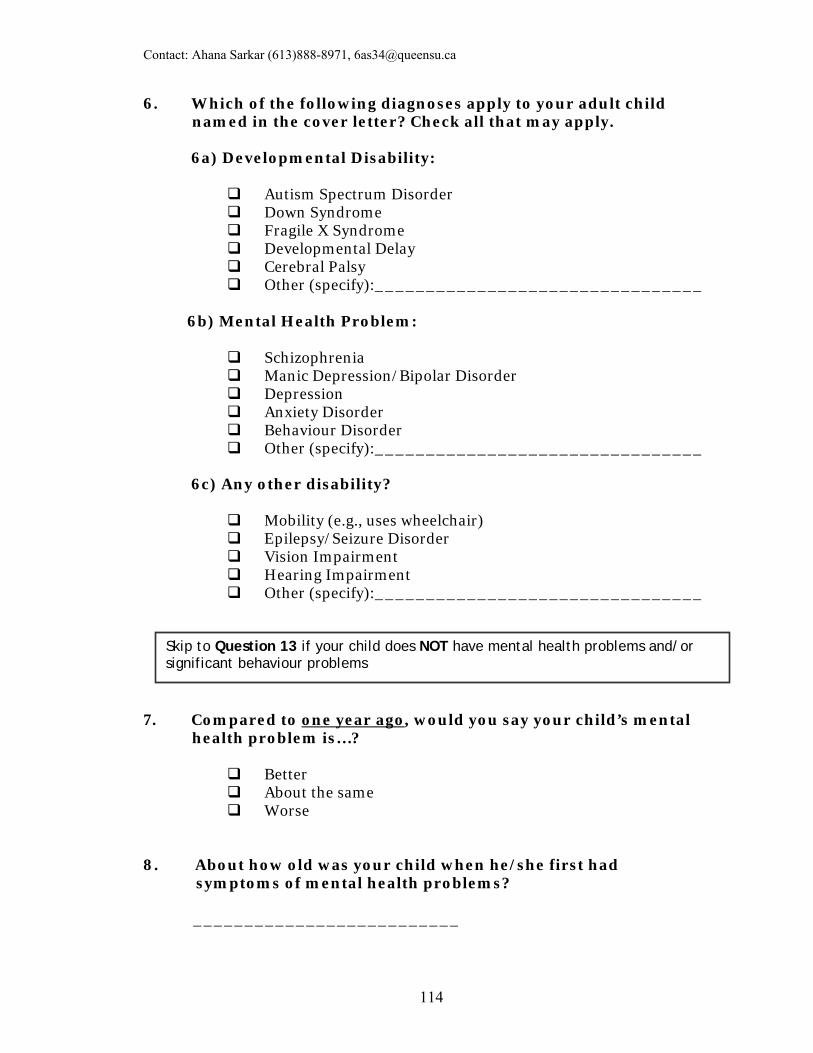
Contact: Ahana Sarkar (613)888-8971, [email protected]
114
6. Which of the following diagnoses apply to your adult child named in the cover letter? Check all that may apply. 6a) Developmental Disability:
Autism Spectrum Disorder Down Syndrome Fragile X Syndrome Developmental Delay Cerebral Palsy Other (specify):________________________________
6b) Mental Health Problem:
Schizophrenia Manic Depression/Bipolar Disorder Depression Anxiety Disorder Behaviour Disorder Other (specify):________________________________
6c) Any other disability?
Mobility (e.g., uses wheelchair) Epilepsy/Seizure Disorder Vision Impairment Hearing Impairment Other (specify):________________________________
7. Compared to one year ago, would you say your child’s mental health problem is…?
Better About the same Worse
8. About how old was your child when he/she first had symptoms of mental health problems? __________________________
Skip to Question 13 if your child does NOT have mental health problems and/or significant behaviour problems
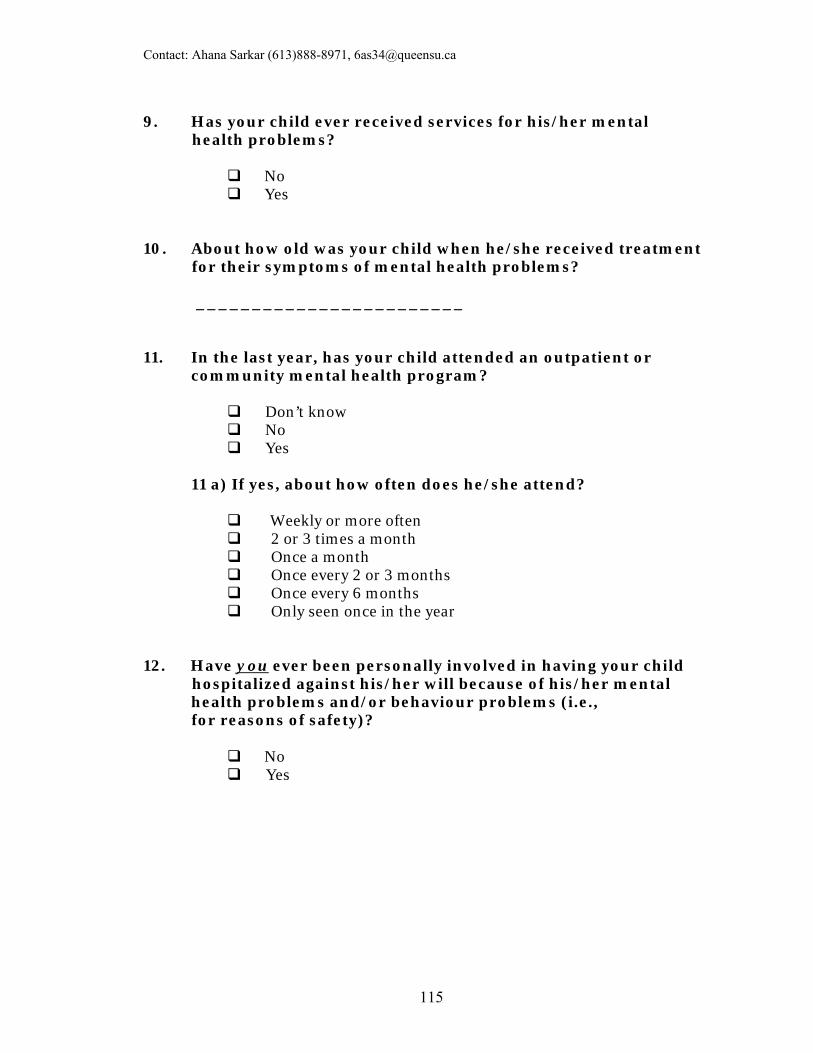
Contact: Ahana Sarkar (613)888-8971, [email protected]
115
9. Has your child ever received services for his/her mental health problems?
No Yes
10. About how old was your child when he/she received treatment for their symptoms of mental health problems? ________________________ 11. In the last year, has your child attended an outpatient or
community mental health program?
Don’t know No Yes
11 a) If yes, about how often does he/she attend?
Weekly or more often 2 or 3 times a month Once a month Once every 2 or 3 months Once every 6 months Only seen once in the year
12. Have you ever been personally involved in having your child hospitalized against his/her will because of his/her mental
health problems and/or behaviour problems (i.e., for reasons of safety)?
No Yes

Contact: Ahana Sarkar (613)888-8971, [email protected]
116
13. Was your child ever in conflict with the law (e.g., contact with the police)?
Don’t know No Yes
13 a) If yes, did it result in charges?
No
Yes, specify: _________________________
13 a i) If yes, what were the final legal consequences? _________________________________________ _________________________________________
14. Has your child ever used any of the following specialized services? Check all that apply.
Occupational therapy Physiotherapy Speech therapy Psychology Social Work Community behaviour management services Other (specify):________________________________
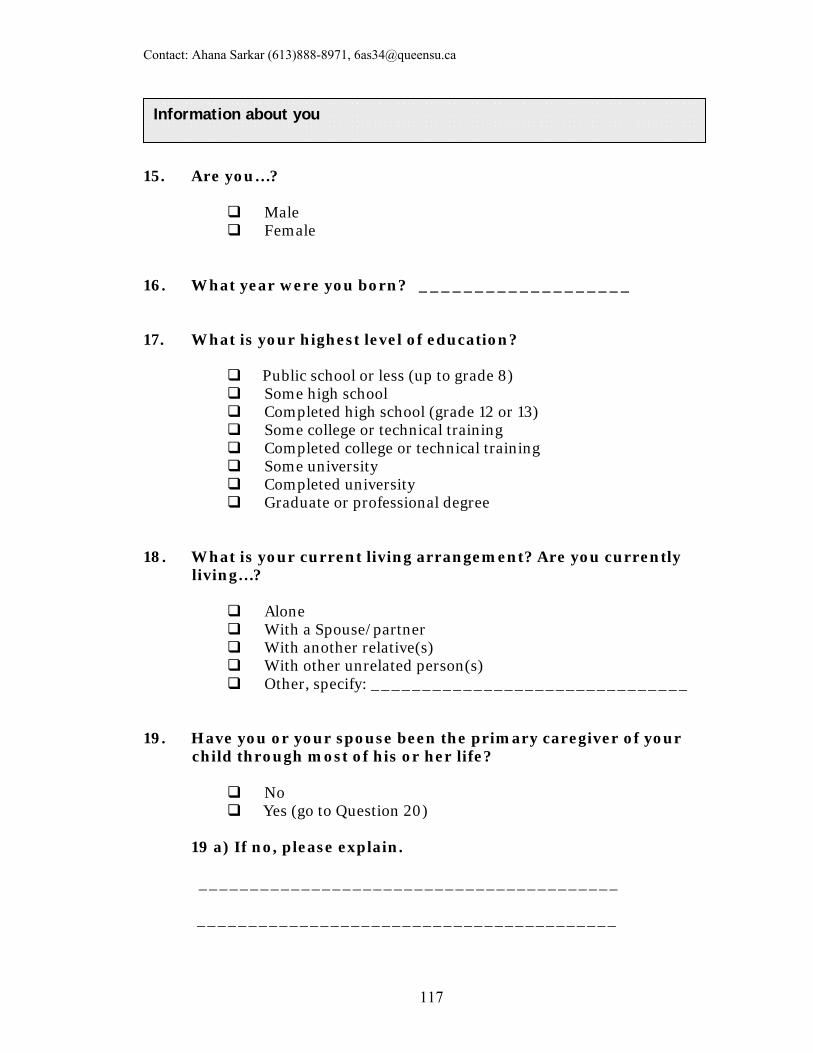
Contact: Ahana Sarkar (613)888-8971, [email protected]
117
15. Are you…?
Male Female
16. What year were you born? ___________________ 17. What is your highest level of education?
Public school or less (up to grade 8) Some high school Completed high school (grade 12 or 13) Some college or technical training Completed college or technical training Some university Completed university Graduate or professional degree
18. What is your current living arrangement? Are you currently living…?
Alone With a Spouse/partner With another relative(s) With other unrelated person(s) Other, specify: _______________________________
19. Have you or your spouse been the primary caregiver of your child through most of his or her life?
No Yes (go to Question 20)
19 a) If no, please explain. _________________________________________
_________________________________________
Information about you
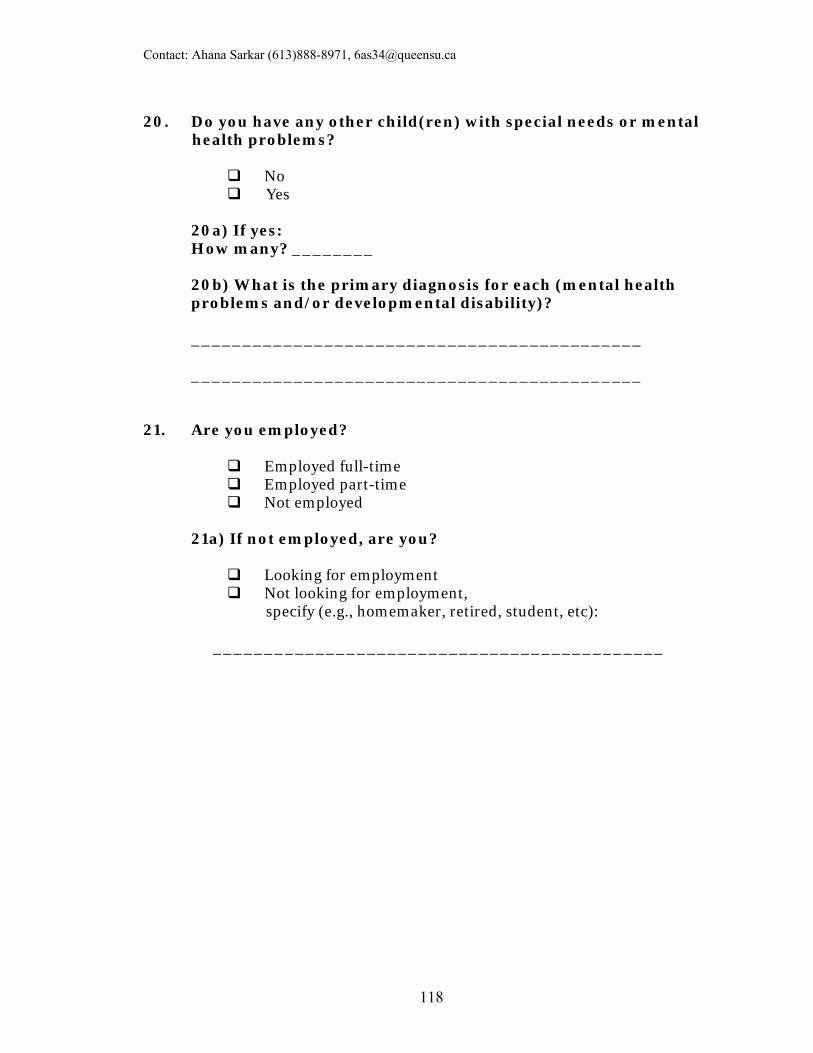
Contact: Ahana Sarkar (613)888-8971, [email protected]
118
20. Do you have any other child(ren) with special needs or mental health problems?
No Yes
20a) If yes: How many? ________
20b) What is the primary diagnosis for each (mental health problems and/or developmental disability)?
____________________________________________ ____________________________________________
21. Are you employed?
Employed full-time Employed part-time Not employed
21a) If not employed, are you?
Looking for employment Not looking for employment, specify (e.g., homemaker, retired, student, etc):
____________________________________________

Contact: Ahana Sarkar (613)888-8971, [email protected]
119
22a. Do you think that people think less of those who have mental health problems?
22b. Do you think that people think less of those who have a developmental disability?
22c. Do you think that people think less of those who have both a developmental disability and a mental health problem?
Never Rarely Sometimes Often Always
Never Rarely Sometimes Often Always
Never Rarely Sometimes Often Always
Experiences with Stigma The next section asks about experiences with stigma you or your family as a whole has had. By stigma we mean negative feelings people have towards persons with a developmental disability and/or mental health problems. We include both psychiatric disorders and significant behaviour problems as mental health problems.
Family Experiences with Stigma © Heather Stuart
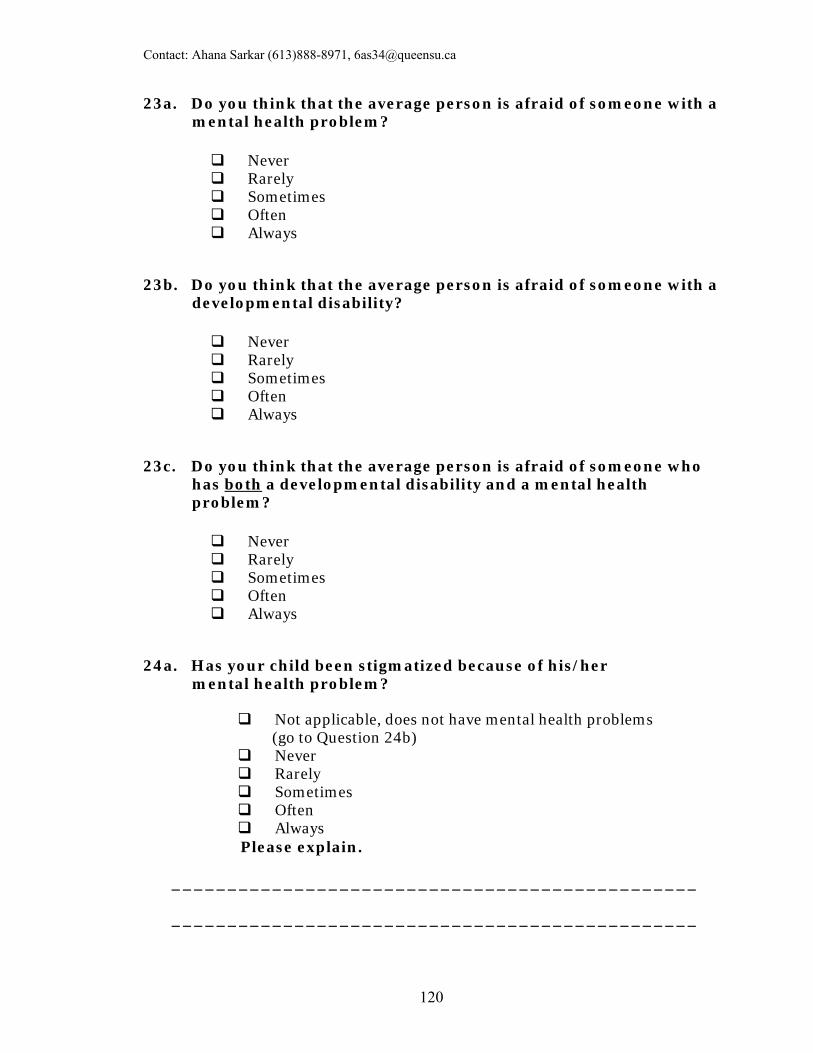
Contact: Ahana Sarkar (613)888-8971, [email protected]
120
23a. Do you think that the average person is afraid of someone with a mental health problem?
23b. Do you think that the average person is afraid of someone with a developmental disability?
23c. Do you think that the average person is afraid of someone who has both a developmental disability and a mental health problem?
24a. Has your child been stigmatized because of his/her mental health problem? Please explain. _______________________________________________ _______________________________________________
Never Rarely Sometimes Often Always
Never Rarely Sometimes Often Always
Never Rarely Sometimes Often Always
Not applicable, does not have mental health problems (go to Question 24b)
Never Rarely Sometimes Often Always
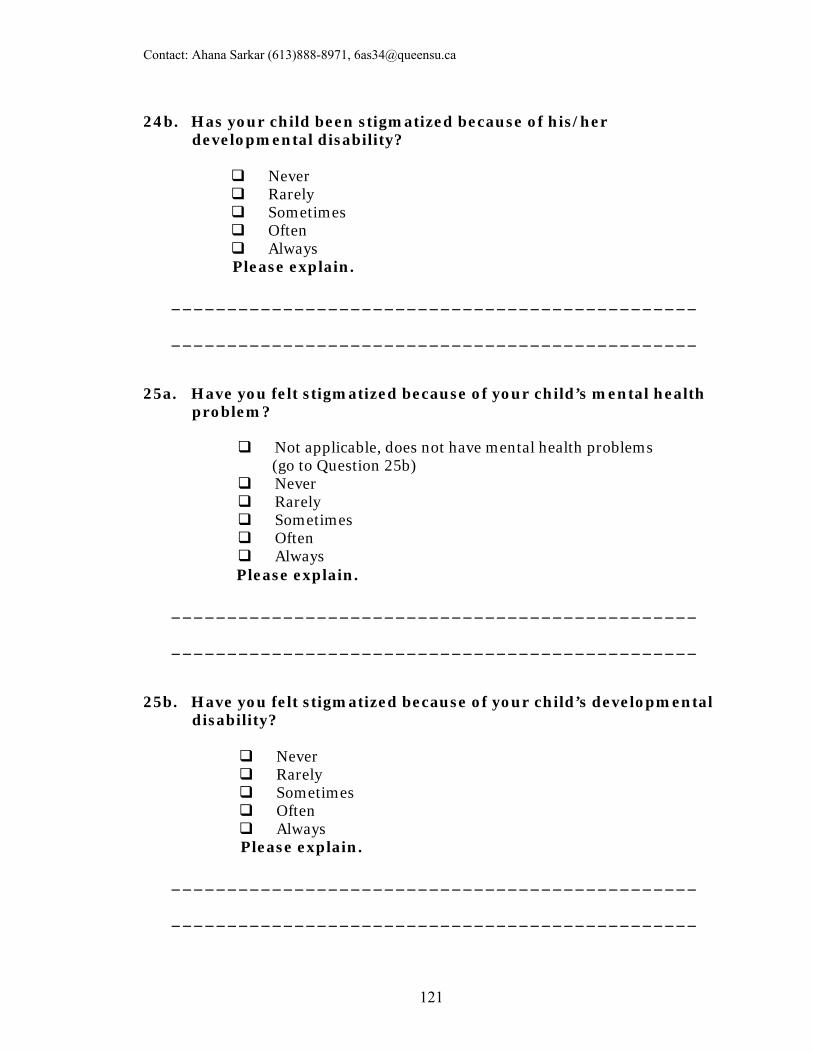
Contact: Ahana Sarkar (613)888-8971, [email protected]
121
24b. Has your child been stigmatized because of his/her developmental disability?
Never Rarely Sometimes Often Always
Please explain. _______________________________________________ _______________________________________________ 25a. Have you felt stigmatized because of your child’s mental health problem? Please explain. _______________________________________________ _______________________________________________ 25b. Have you felt stigmatized because of your child’s developmental disability?
Never Rarely Sometimes Often Always
Please explain. _______________________________________________ _______________________________________________
Not applicable, does not have mental health problems (go to Question 25b)
Never Rarely Sometimes Often Always

Contact: Ahana Sarkar (613)888-8971, [email protected]
122
26a. Have other members of your family been stigmatized because of your child’s mental health problem?
Not applicable, does not have mental health problems (go to Question 26b)
Never Rarely Sometimes Often Always
Please explain. _______________________________________________ _______________________________________________ 26b. Have other members of your family been stigmatized because of your child’s developmental disability?
Never Rarely Sometimes Often Always
Please explain.
_______________________________________________ _______________________________________________ 27. Could you give an example of a stigmatizing experience your family has had in the last year? _______________________________________________ _______________________________________________
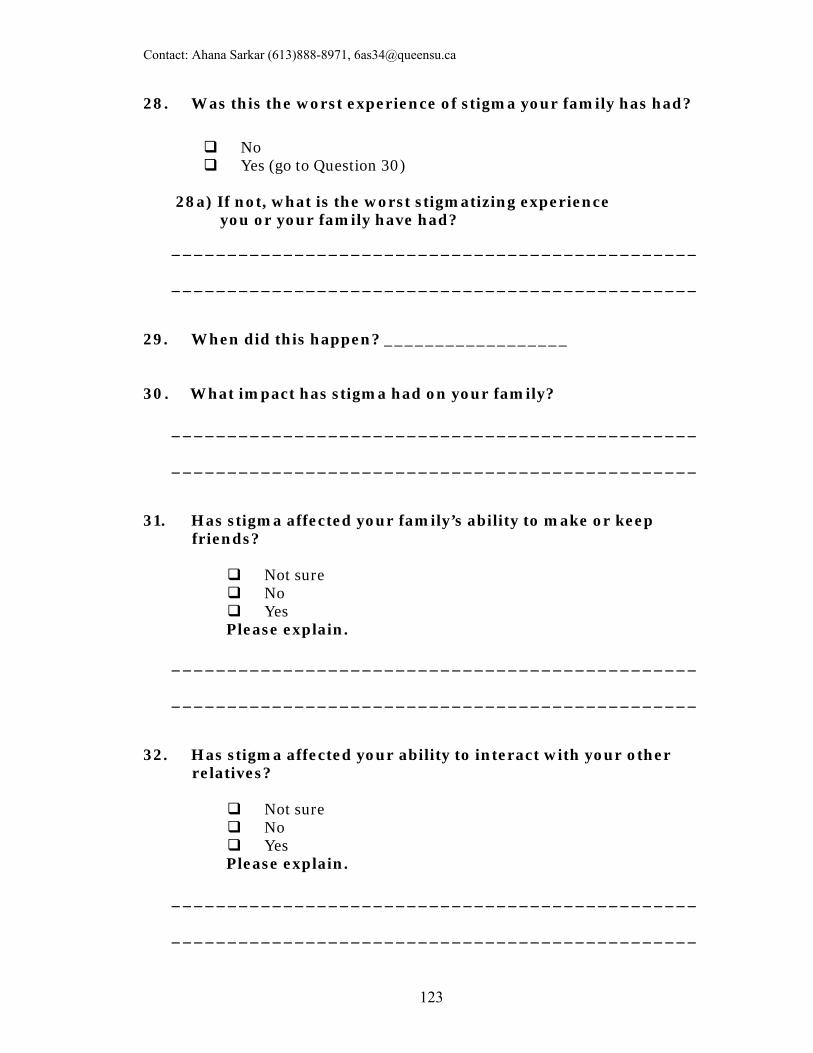
Contact: Ahana Sarkar (613)888-8971, [email protected]
123
28. Was this the worst experience of stigma your family has had?
_______________________________________________ _______________________________________________ 29. When did this happen? __________________ 30. What impact has stigma had on your family? _______________________________________________ _______________________________________________ 31. Has stigma affected your family’s ability to make or keep friends?
Not sure No Yes
Please explain. _______________________________________________ _______________________________________________ 32. Has stigma affected your ability to interact with your other relatives?
Not sure No Yes
Please explain. _______________________________________________ _______________________________________________
No Yes (go to Question 30)
28a) If not, what is the worst stigmatizing experience
you or your family have had?
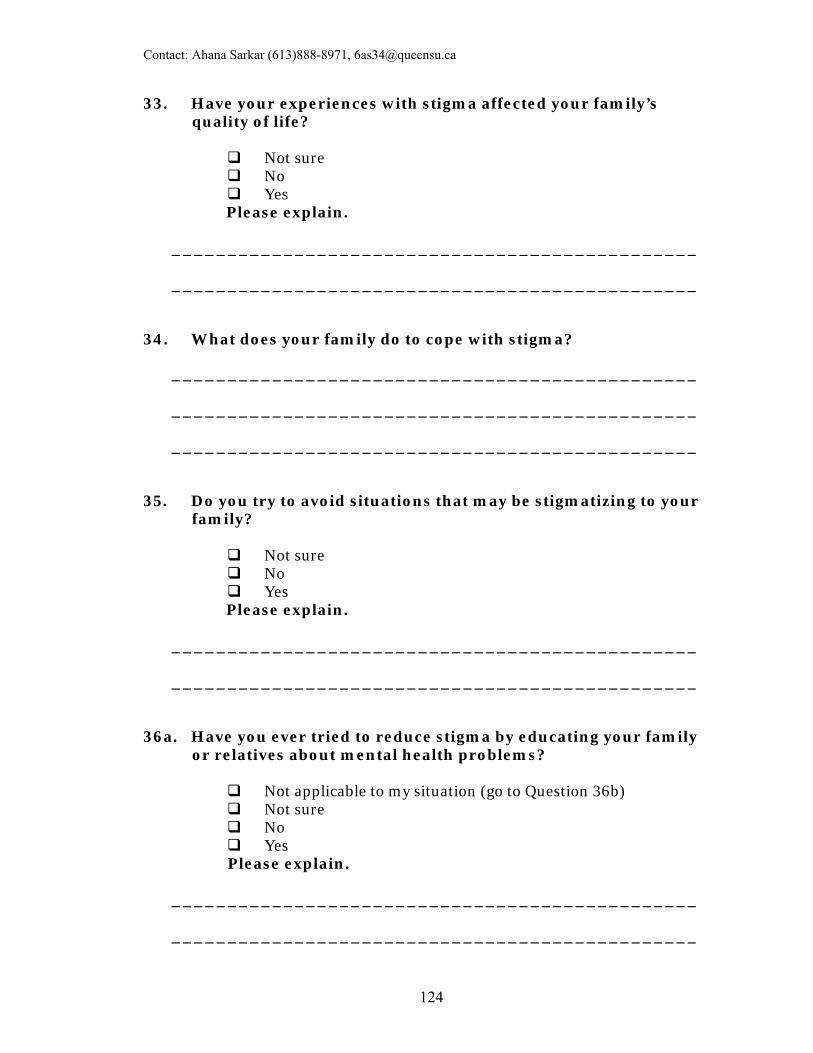
Contact: Ahana Sarkar (613)888-8971, [email protected]
124
33. Have your experiences with stigma affected your family’s quality of life?
Not sure No Yes
Please explain.
_______________________________________________ _______________________________________________ 34. What does your family do to cope with stigma? _______________________________________________ _______________________________________________ _______________________________________________ 35. Do you try to avoid situations that may be stigmatizing to your family?
Not sure No Yes
Please explain. _______________________________________________ _______________________________________________ 36a. Have you ever tried to reduce stigma by educating your family or relatives about mental health problems?
Not applicable to my situation (go to Question 36b) Not sure No Yes
Please explain. _______________________________________________ _______________________________________________
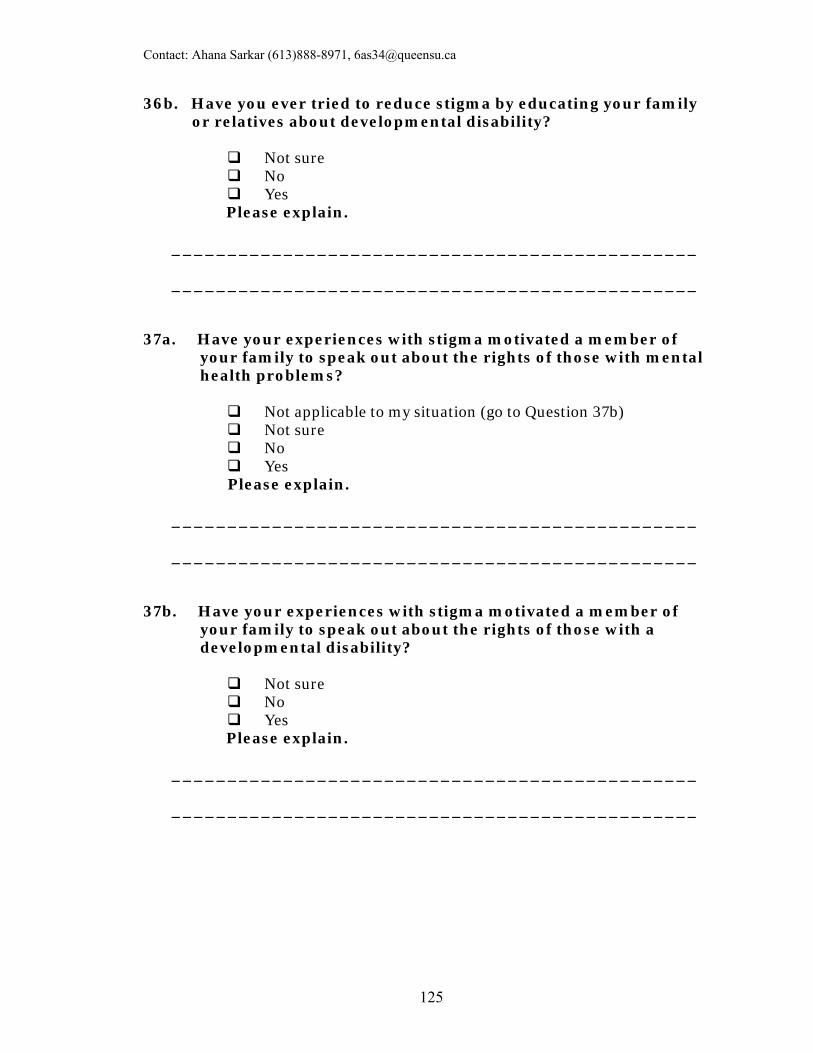
Contact: Ahana Sarkar (613)888-8971, [email protected]
125
36b. Have you ever tried to reduce stigma by educating your family or relatives about developmental disability?
Not sure No Yes
Please explain. _______________________________________________ _______________________________________________ 37a. Have your experiences with stigma motivated a member of your family to speak out about the rights of those with mental health problems?
Not applicable to my situation (go to Question 37b) Not sure No Yes
Please explain. _______________________________________________ _______________________________________________ 37b. Have your experiences with stigma motivated a member of your family to speak out about the rights of those with a developmental disability?
Not sure No Yes
Please explain. _______________________________________________ _______________________________________________
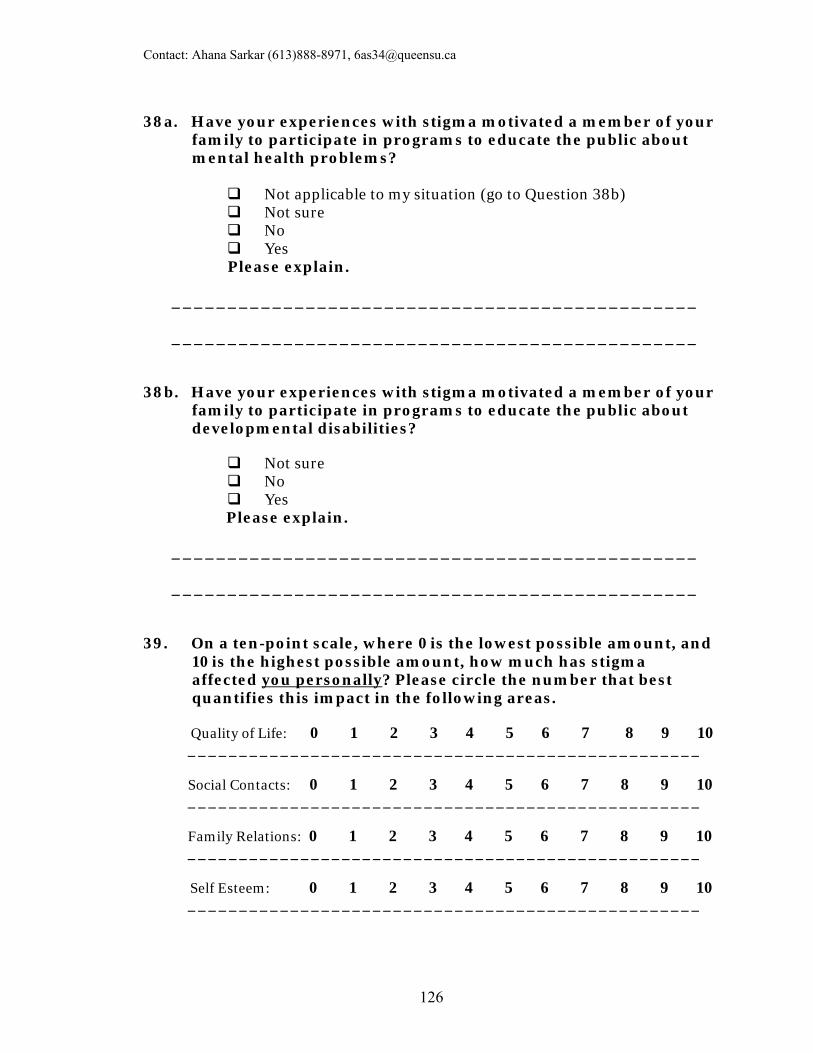
Contact: Ahana Sarkar (613)888-8971, [email protected]
126
38a. Have your experiences with stigma motivated a member of your family to participate in programs to educate the public about mental health problems?
Not applicable to my situation (go to Question 38b) Not sure No Yes
Please explain. _______________________________________________ _______________________________________________ 38b. Have your experiences with stigma motivated a member of your family to participate in programs to educate the public about developmental disabilities?
Not sure No Yes
Please explain.
_______________________________________________ _______________________________________________ 39. On a ten-point scale, where 0 is the lowest possible amount, and 10 is the highest possible amount, how much has stigma affected you personally? Please circle the number that best quantifies this impact in the following areas. Quality of Life: 0 1 2 3 4 5 6 7 8 9 10 __________________________________________________ Social Contacts: 0 1 2 3 4 5 6 7 8 9 10 __________________________________________________ Family Relations: 0 1 2 3 4 5 6 7 8 9 10 __________________________________________________ Self Esteem: 0 1 2 3 4 5 6 7 8 9 10 __________________________________________________
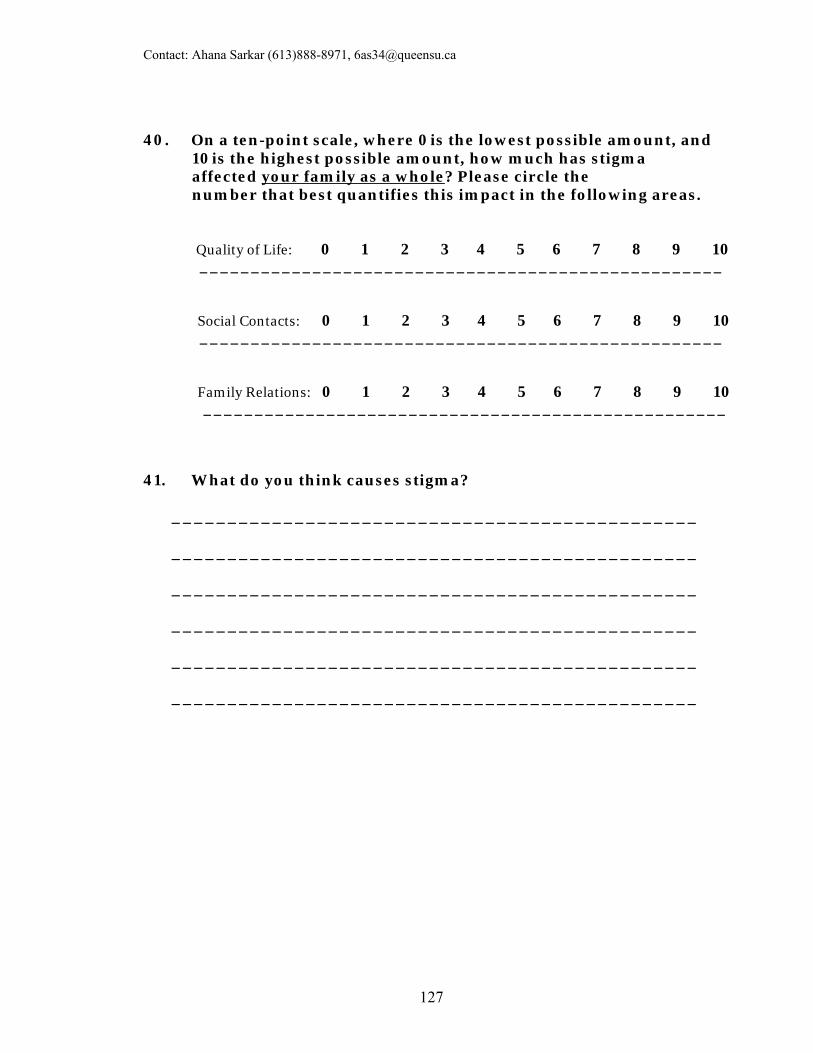
Contact: Ahana Sarkar (613)888-8971, [email protected]
127
40. On a ten-point scale, where 0 is the lowest possible amount, and 10 is the highest possible amount, how much has stigma affected your family as a whole? Please circle the number that best quantifies this impact in the following areas.
Quality of Life: 0 1 2 3 4 5 6 7 8 9 10 ___________________________________________________ Social Contacts: 0 1 2 3 4 5 6 7 8 9 10 ___________________________________________________ Family Relations: 0 1 2 3 4 5 6 7 8 9 10 ___________________________________________________
41. What do you think causes stigma? _______________________________________________ _______________________________________________ _______________________________________________ _______________________________________________ _______________________________________________ _______________________________________________
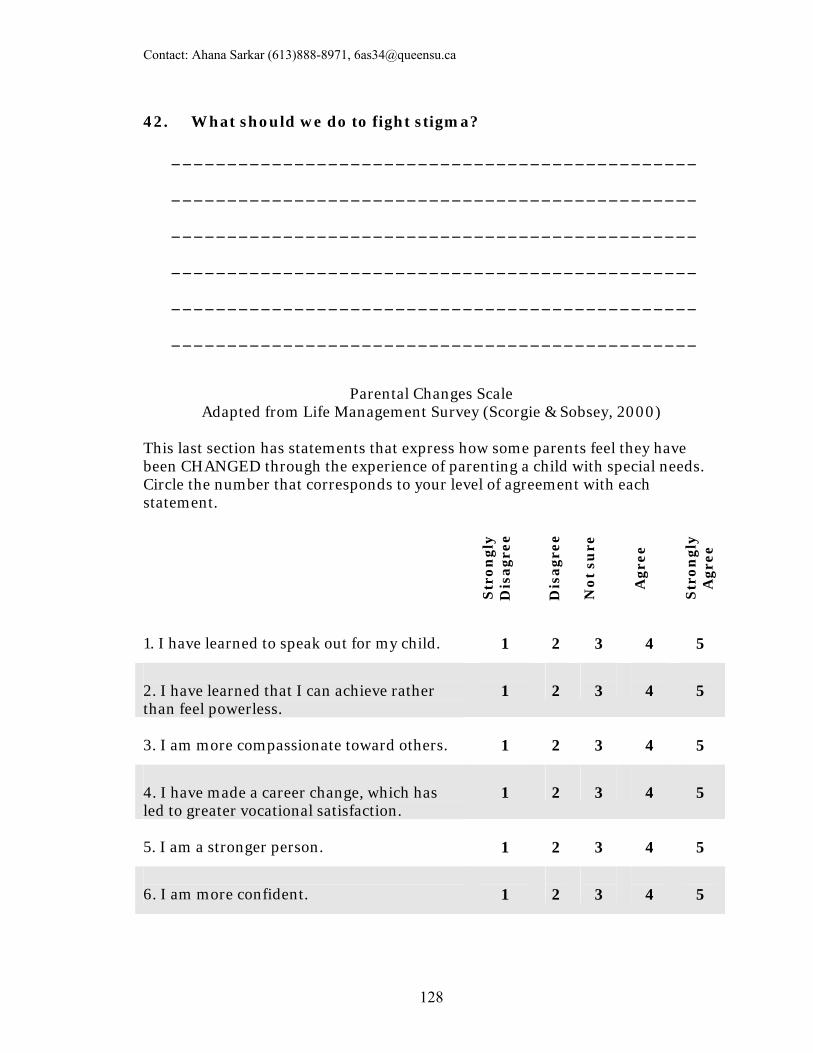
Contact: Ahana Sarkar (613)888-8971, [email protected]
128
42. What should we do to fight stigma? _______________________________________________ _______________________________________________ _______________________________________________ _______________________________________________ _______________________________________________ _______________________________________________
Parental Changes Scale
Adapted from Life Management Survey (Scorgie & Sobsey, 2000) This last section has statements that express how some parents feel they have been CHANGED through the experience of parenting a child with special needs. Circle the number that corresponds to your level of agreement with each statement.
Str
on
gly
D
isa
gre
e
Dis
ag
ree
No
t su
re
Ag
ree
Str
on
gly
A
gre
e
1. I have learned to speak out for my child.
1
2
3
4
5
2. I have learned that I can achieve rather than feel powerless.
1
2
3
4
5
3. I am more compassionate toward others.
1
2
3
4
5
4. I have made a career change, which has led to greater vocational satisfaction.
1
2
3
4
5
5. I am a stronger person.
1
2
3
4
5
6. I am more confident.
1
2
3
4
5
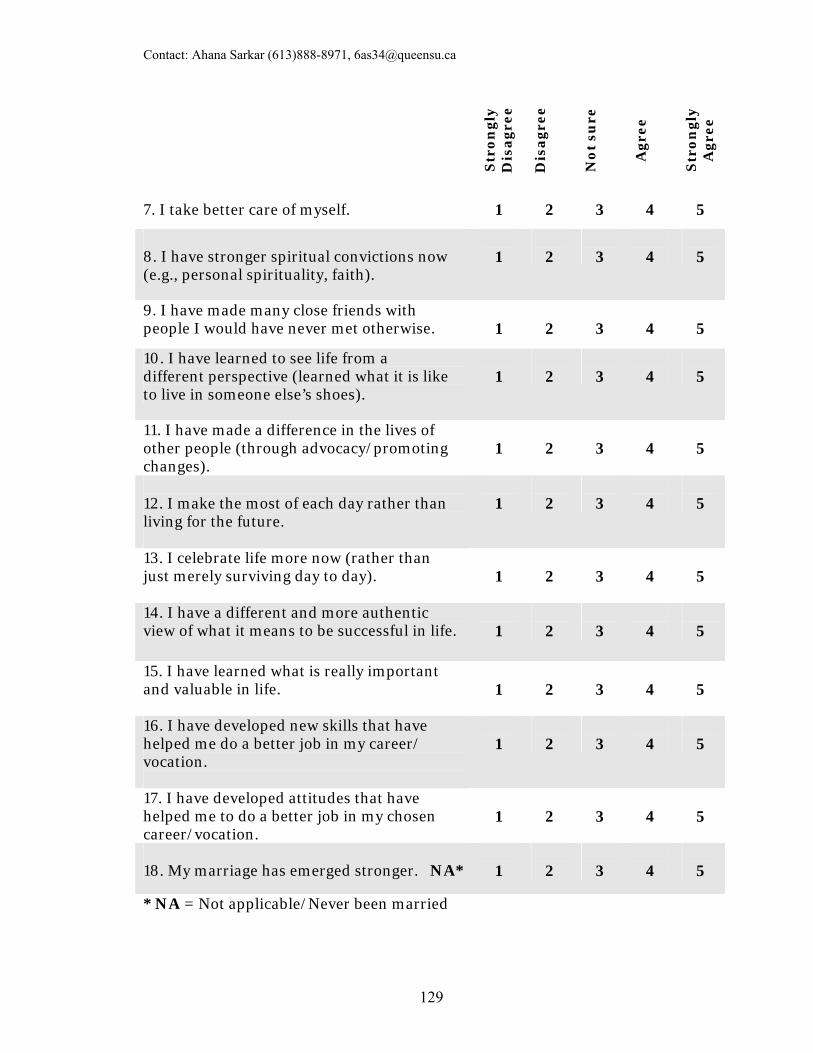
Contact: Ahana Sarkar (613)888-8971, [email protected]
129
* NA = Not applicable/Never been married
Str
on
gly
D
isa
gre
e
Dis
ag
ree
No
t su
re
Ag
ree
Str
on
gly
A
gre
e
7. I take better care of myself.
1
2
3
4
5
8. I have stronger spiritual convictions now (e.g., personal spirituality, faith).
1
2
3
4
5
9. I have made many close friends with people I would have never met otherwise.
1
2
3
4
5
10. I have learned to see life from a different perspective (learned what it is like to live in someone else’s shoes).
1
2
3
4
5
11. I have made a difference in the lives of other people (through advocacy/promoting changes).
1
2
3
4
5
12. I make the most of each day rather than living for the future.
1
2
3
4
5
13. I celebrate life more now (rather than just merely surviving day to day).
1
2
3
4
5
14. I have a different and more authentic view of what it means to be successful in life.
1
2
3
4
5
15. I have learned what is really important and valuable in life.
1
2
3
4
5
16. I have developed new skills that have helped me do a better job in my career/ vocation.
1
2
3
4
5
17. I have developed attitudes that have helped me to do a better job in my chosen career/vocation.
1
2
3
4
5
18. My marriage has emerged stronger. NA*
1
2
3
4
5

Contact: Ahana Sarkar (613)888-8971, [email protected]
130
You have reached the end of the survey. Thank you for your input. Please mail this survey back to us using the self-addressed, stamped envelope provided in the package. If you wish to receive a copy of the results of the study once it is completed, you can fill out the self-addressed, stamped contact information card included in the package and mail it in separately from this survey. This will maintain the anonymity of your survey responses.
Is there anything else you would like us to know about your experiences as a parent of an adult child with special needs that we have not asked? _______________________________________________ _______________________________________________ _______________________________________________ _______________________________________________ _______________________________________________ _______________________________________________ _______________________________________________ _______________________________________________ _______________________________________________ _______________________________________________ _______________________________________________
131
APPENDIX G: POSTCARD FOR PARTICIPANTS
TO OBTAIN RESULTS OF THE STUDY…
PLEASE FILL OUT YOUR
CONTACT INFORMATION
IF YOU WOULD LIKE TO
RECEIVE A COPY OF THE
RESULTS OF THE STUDY,
ONCE COMPLETED:
_______________________________
_______________________________
_______________________________
[BACK OF POSTCARD]
AHANA SARKAR 191 PORTSMOUTH AVENUE
KINGSTON, ONTARIO K7M 8A6
[FRONT OF POSTCARD]
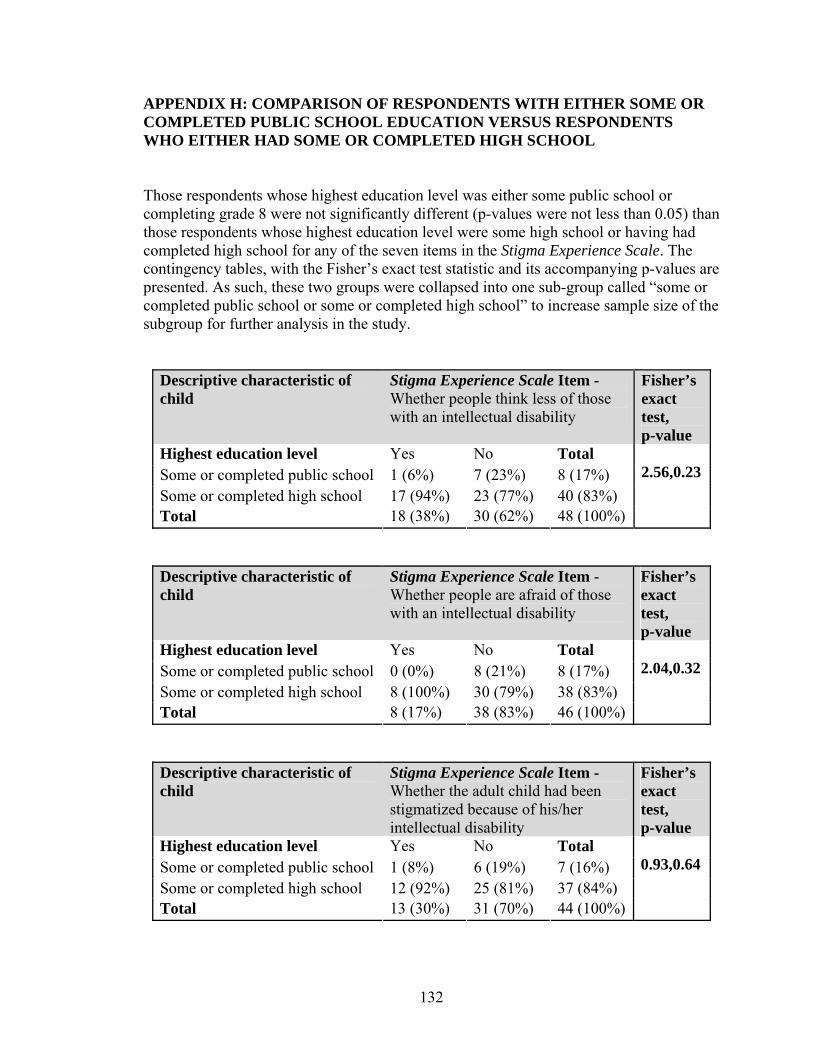
132
APPENDIX H: COMPARISON OF RESPONDENTS WITH EITHER SOME OR COMPLETED PUBLIC SCHOOL EDUCATION VERSUS RESPONDENTS WHO EITHER HAD SOME OR COMPLETED HIGH SCHOOL Those respondents whose highest education level was either some public school or completing grade 8 were not significantly different (p-values were not less than 0.05) than those respondents whose highest education level were some high school or having had completed high school for any of the seven items in the Stigma Experience Scale. The contingency tables, with the Fisher’s exact test statistic and its accompanying p-values are presented. As such, these two groups were collapsed into one sub-group called “some or completed public school or some or completed high school” to increase sample size of the subgroup for further analysis in the study.
Descriptive characteristic of child
Stigma Experience Scale Item - Whether people think less of those with an intellectual disability
Fisher’s exact test, p-value
Highest education level Yes No Total Some or completed public school 1 (6%) 7 (23%) 8 (17%) Some or completed high school 17 (94%) 23 (77%) 40 (83%) Total 18 (38%) 30 (62%) 48 (100%)
2.56,0.23
Descriptive characteristic of child
Stigma Experience Scale Item - Whether people are afraid of those with an intellectual disability
Fisher’s exact test, p-value
Highest education level Yes No Total Some or completed public school 0 (0%) 8 (21%) 8 (17%) Some or completed high school 8 (100%) 30 (79%) 38 (83%) Total 8 (17%) 38 (83%) 46 (100%)
2.04,0.32
Descriptive characteristic of child
Stigma Experience Scale Item - Whether the adult child had been stigmatized because of his/her intellectual disability
Fisher’s exact test, p-value
Highest education level Yes No Total Some or completed public school 1 (8%) 6 (19%) 7 (16%) Some or completed high school 12 (92%) 25 (81%) 37 (84%) Total 13 (30%) 31 (70%) 44 (100%)
0.93,0.64
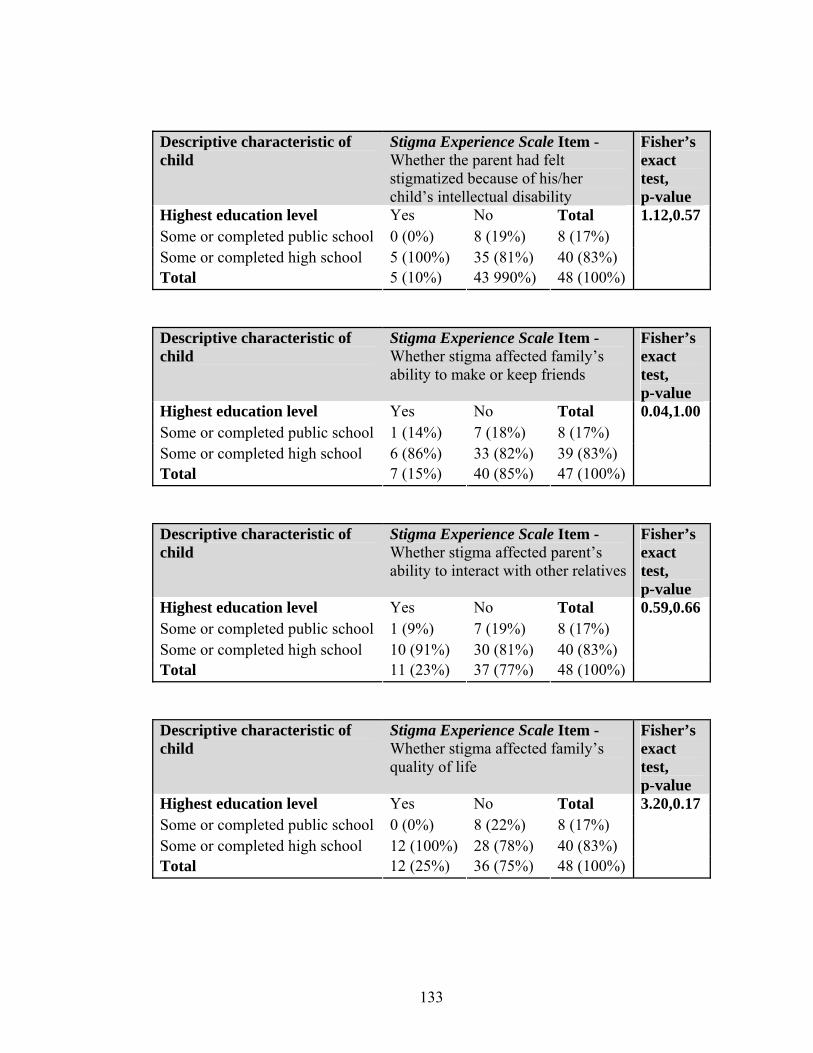
133
Descriptive characteristic of child
Stigma Experience Scale Item - Whether the parent had felt stigmatized because of his/her child’s intellectual disability
Fisher’s exact test, p-value
Highest education level Yes No Total Some or completed public school 0 (0%) 8 (19%) 8 (17%) Some or completed high school 5 (100%) 35 (81%) 40 (83%) Total 5 (10%) 43 990%) 48 (100%)
1.12,0.57
Descriptive characteristic of child
Stigma Experience Scale Item - Whether stigma affected family’s ability to make or keep friends
Fisher’s exact test, p-value
Highest education level Yes No Total Some or completed public school 1 (14%) 7 (18%) 8 (17%) Some or completed high school 6 (86%) 33 (82%) 39 (83%) Total 7 (15%) 40 (85%) 47 (100%)
0.04,1.00
Descriptive characteristic of child
Stigma Experience Scale Item - Whether stigma affected parent’s ability to interact with other relatives
Fisher’s exact test, p-value
Highest education level Yes No Total Some or completed public school 1 (9%) 7 (19%) 8 (17%) Some or completed high school 10 (91%) 30 (81%) 40 (83%) Total 11 (23%) 37 (77%) 48 (100%)
0.59,0.66
Descriptive characteristic of child
Stigma Experience Scale Item - Whether stigma affected family’s quality of life
Fisher’s exact test, p-value
Highest education level Yes No Total Some or completed public school 0 (0%) 8 (22%) 8 (17%) Some or completed high school 12 (100%) 28 (78%) 40 (83%) Total 12 (25%) 36 (75%) 48 (100%)
3.20,0.17
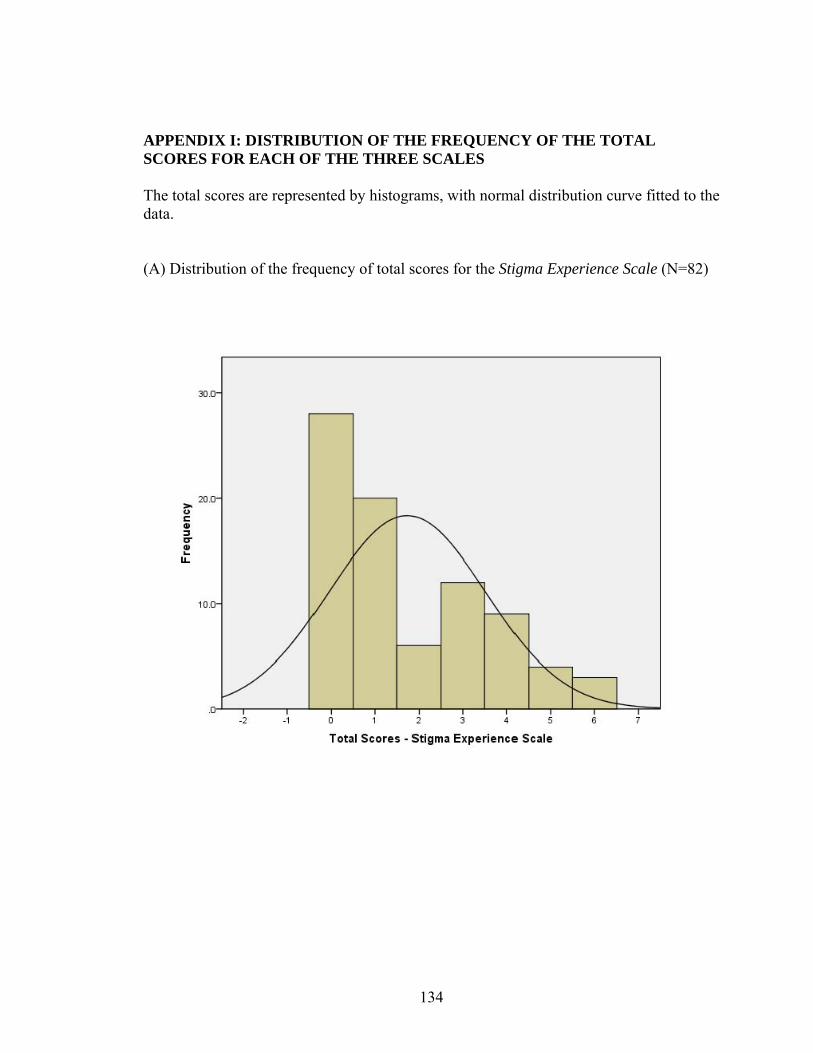
134
APPENDIX I: DISTRIBUTION OF THE FREQUENCY OF THE TOTAL SCORES FOR EACH OF THE THREE SCALES The total scores are represented by histograms, with normal distribution curve fitted to the data. (A) Distribution of the frequency of total scores for the Stigma Experience Scale (N=82)
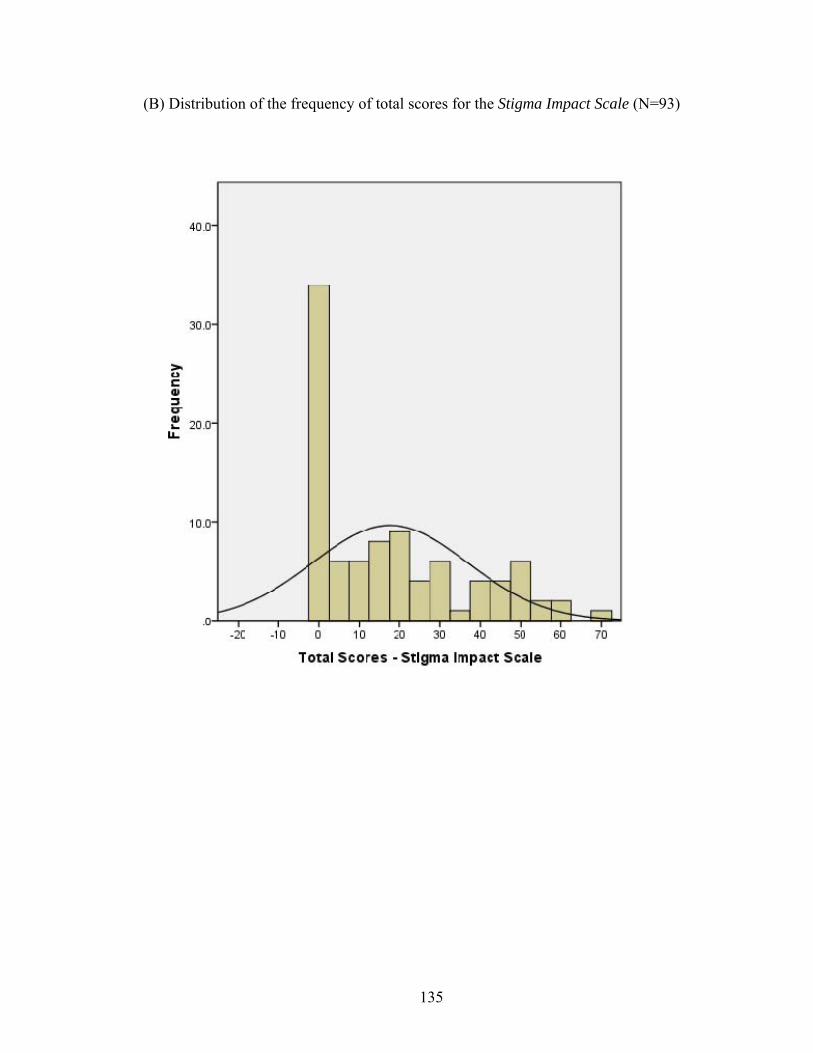
135
(B) Distribution of the frequency of total scores for the Stigma Impact Scale (N=93)
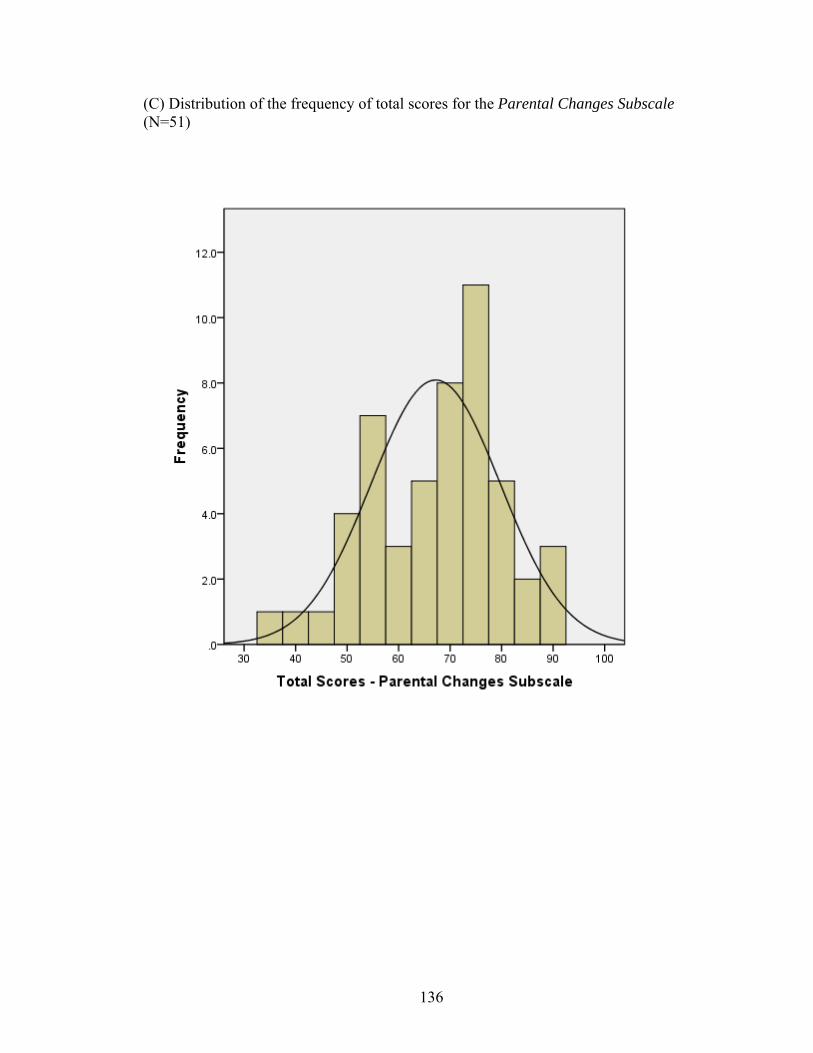
136
(C) Distribution of the frequency of total scores for the Parental Changes Subscale (N=51)
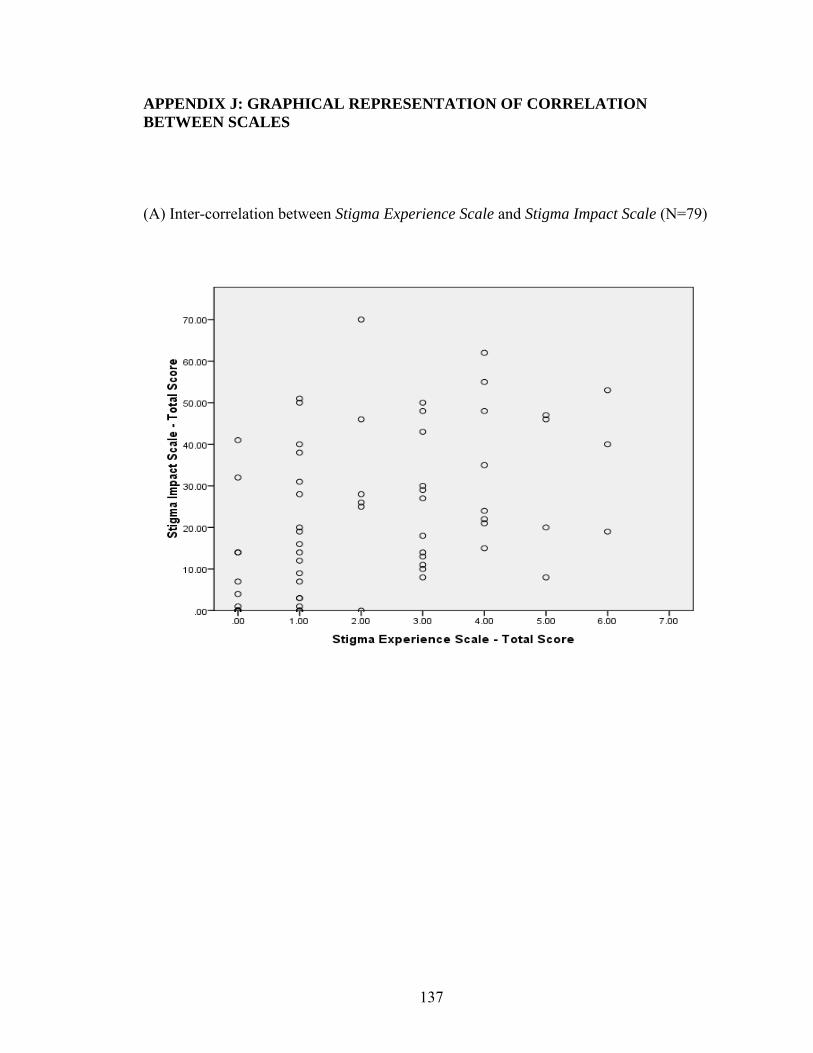
137
APPENDIX J: GRAPHICAL REPRESENTATION OF CORRELATION BETWEEN SCALES (A) Inter-correlation between Stigma Experience Scale and Stigma Impact Scale (N=79)
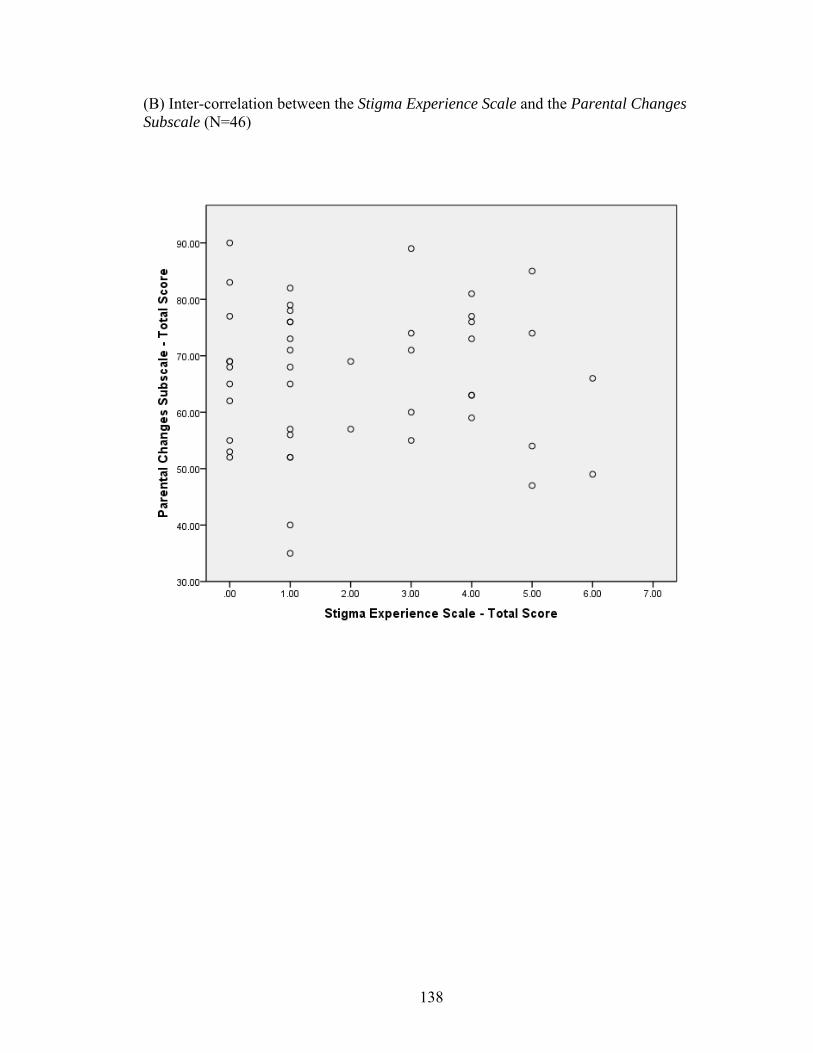
138
(B) Inter-correlation between the Stigma Experience Scale and the Parental Changes Subscale (N=46)
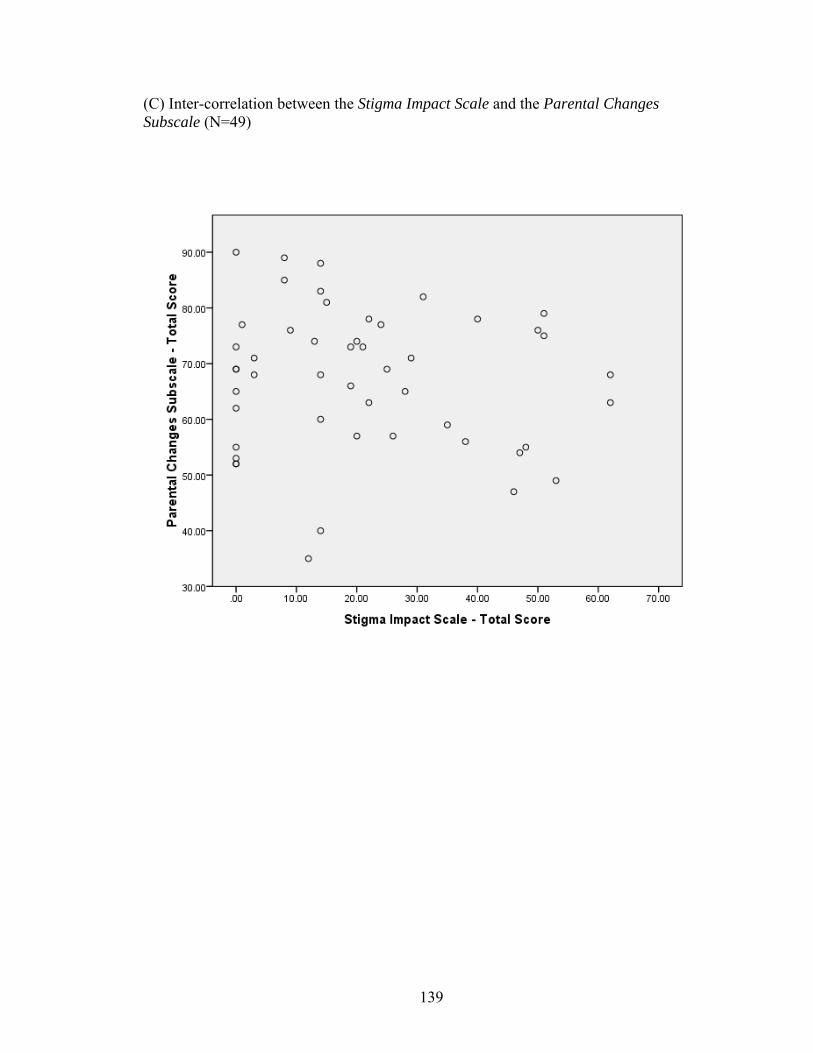
139
(C) Inter-correlation between the Stigma Impact Scale and the Parental Changes Subscale (N=49)
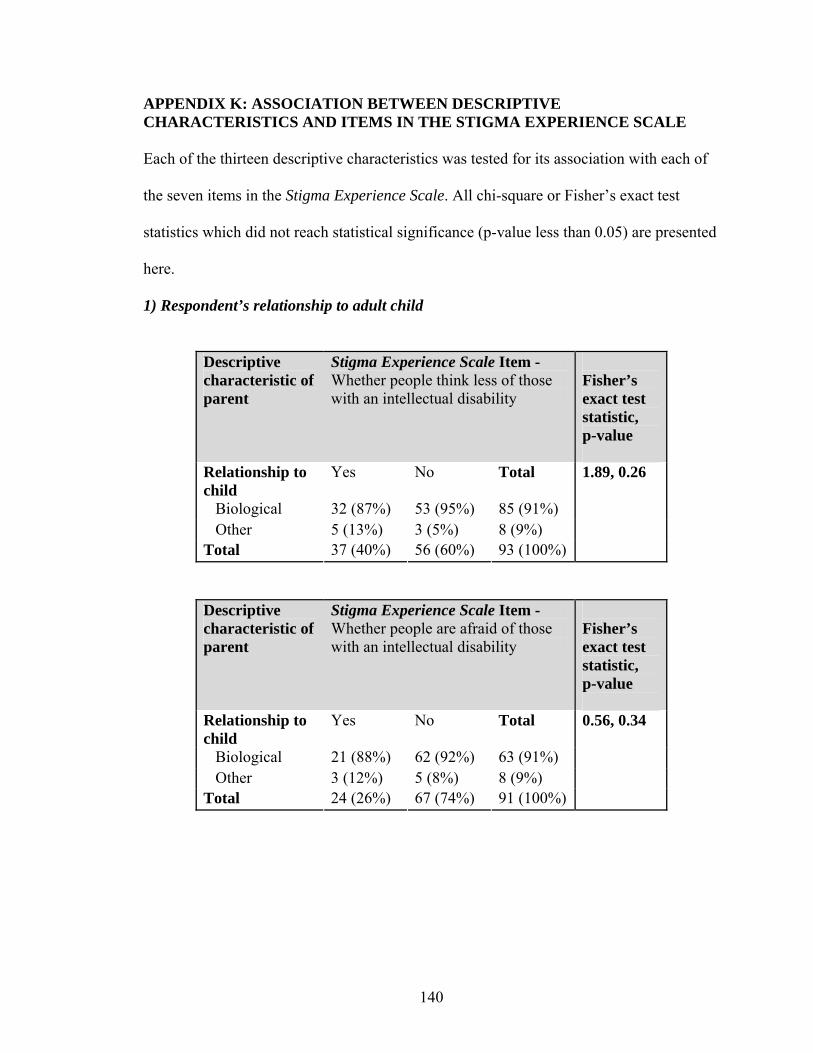
140
APPENDIX K: ASSOCIATION BETWEEN DESCRIPTIVE CHARACTERISTICS AND ITEMS IN THE STIGMA EXPERIENCE SCALE Each of the thirteen descriptive characteristics was tested for its association with each of
the seven items in the Stigma Experience Scale. All chi-square or Fisher’s exact test
statistics which did not reach statistical significance (p-value less than 0.05) are presented
here.
1) Respondent’s relationship to adult child
Descriptive characteristic of parent
Stigma Experience Scale Item - Whether people think less of those with an intellectual disability
Fisher’s exact test statistic, p-value
Relationship to child
Yes No Total
Biological 32 (87%) 53 (95%) 85 (91%) Other 5 (13%) 3 (5%) 8 (9%) Total 37 (40%) 56 (60%) 93 (100%)
1.89, 0.26
Descriptive characteristic of parent
Stigma Experience Scale Item - Whether people are afraid of those with an intellectual disability
Fisher’s exact test statistic, p-value
Relationship to child
Yes No Total
Biological 21 (88%) 62 (92%) 63 (91%) Other 3 (12%) 5 (8%) 8 (9%) Total 24 (26%) 67 (74%) 91 (100%)
0.56, 0.34

141
Descriptive characteristic of parent
Stigma Experience Scale Item - Whether the adult child had been stigmatized because of his/her intellectual disability
Fisher’s exact test statistic, p-value
Relationship to child
Yes No Total
Biological 18 (82%) 60 (91%) 78 (89%) Other 4 (18%) 6 (9%) 10 (11%) Total 22 (25%) 66 (75%) 88 (100%)
1.35, 0.26
Descriptive characteristic of parent
Stigma Experience Scale Item - Whether the parent had felt stigmatized because of his/her child’s intellectual disability
Fisher’s exact test statistic, p-value
Relationship to child
Yes No Total
Biological 8 (89%) 77 (90%) 85 (89%) Other 1 (11%) 9 (10%) 10 (11%) Total 9 (10%) 86 (90%) 95 (100%)
0.004, 1.00
Descriptive characteristic of parent
Stigma Experience Scale Item - Whether stigma affected family’s ability to make or keep friends
Fisher’s exact test statistic, p-value
Relationship to child
Yes No Total
Biological 15 (94%) 69 (90%) 84 (90%) Other 1 (6%) 8 (10%) 9 (10%) Total 16 (17%) 77 (83%) 93 (100%)
0.26, 1.00
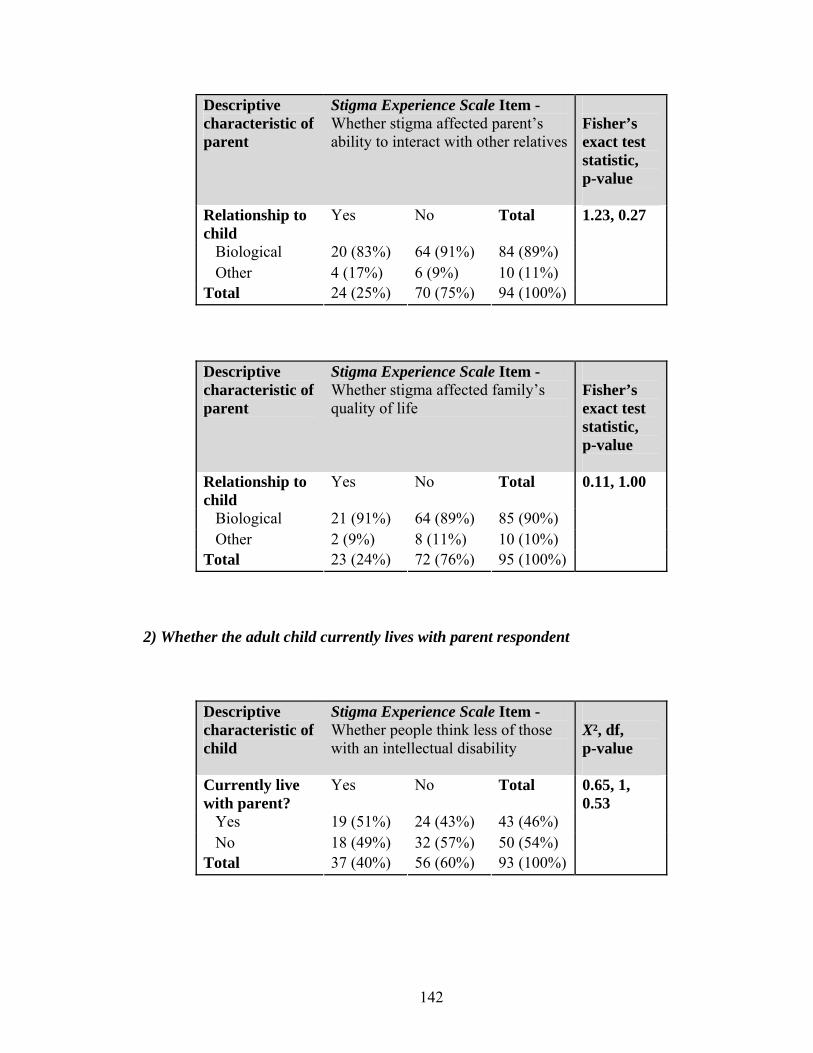
142
Descriptive characteristic of parent
Stigma Experience Scale Item - Whether stigma affected parent’s ability to interact with other relatives
Fisher’s exact test statistic, p-value
Relationship to child
Yes No Total
Biological 20 (83%) 64 (91%) 84 (89%) Other 4 (17%) 6 (9%) 10 (11%) Total 24 (25%) 70 (75%) 94 (100%)
1.23, 0.27
Descriptive characteristic of parent
Stigma Experience Scale Item - Whether stigma affected family’s quality of life
Fisher’s exact test statistic, p-value
Relationship to child
Yes No Total
Biological 21 (91%) 64 (89%) 85 (90%) Other 2 (9%) 8 (11%) 10 (10%) Total 23 (24%) 72 (76%) 95 (100%)
0.11, 1.00
2) Whether the adult child currently lives with parent respondent
Descriptive characteristic of child
Stigma Experience Scale Item - Whether people think less of those with an intellectual disability
X², df, p-value
Currently live with parent?
Yes No Total
Yes 19 (51%) 24 (43%) 43 (46%) No 18 (49%) 32 (57%) 50 (54%) Total 37 (40%) 56 (60%) 93 (100%)
0.65, 1, 0.53
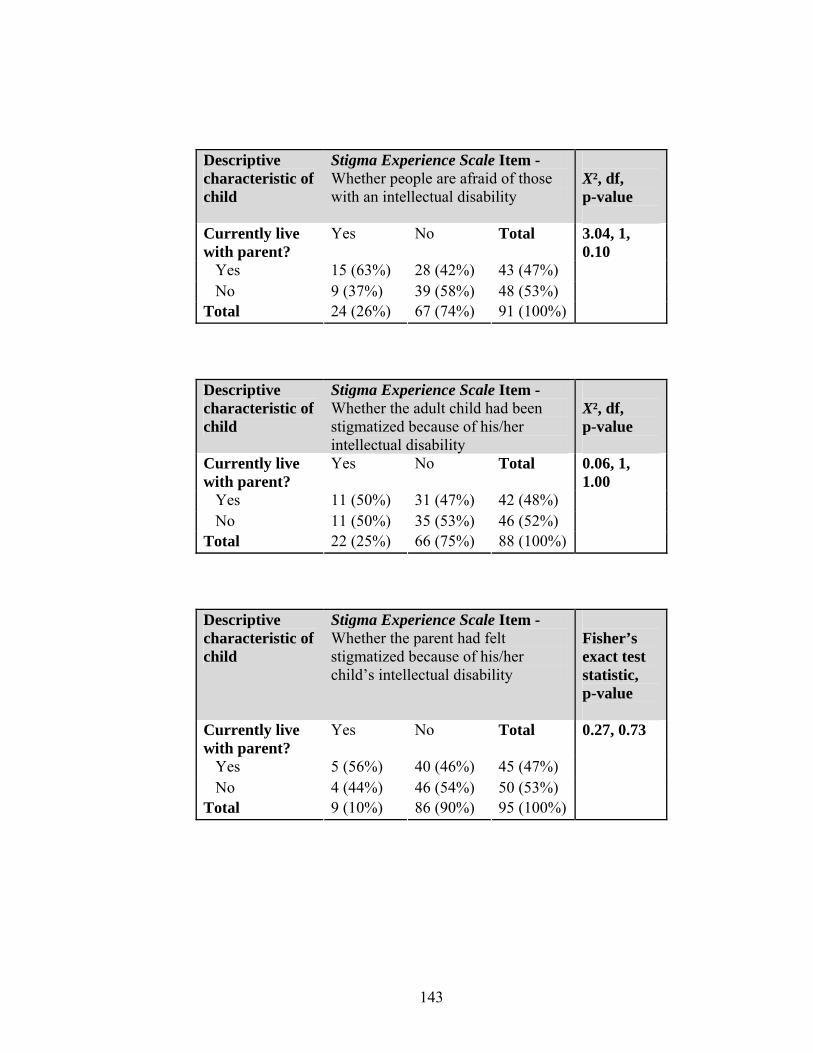
143
Descriptive characteristic of child
Stigma Experience Scale Item - Whether people are afraid of those with an intellectual disability
X², df, p-value
Currently live with parent?
Yes No Total
Yes 15 (63%) 28 (42%) 43 (47%) No 9 (37%) 39 (58%) 48 (53%) Total 24 (26%) 67 (74%) 91 (100%)
3.04, 1, 0.10
Descriptive characteristic of child
Stigma Experience Scale Item - Whether the adult child had been stigmatized because of his/her intellectual disability
X², df, p-value
Currently live with parent?
Yes No Total
Yes 11 (50%) 31 (47%) 42 (48%) No 11 (50%) 35 (53%) 46 (52%) Total 22 (25%) 66 (75%) 88 (100%)
0.06, 1, 1.00
Descriptive characteristic of child
Stigma Experience Scale Item - Whether the parent had felt stigmatized because of his/her child’s intellectual disability
Fisher’s exact test statistic, p-value
Currently live with parent?
Yes No Total
Yes 5 (56%) 40 (46%) 45 (47%) No 4 (44%) 46 (54%) 50 (53%) Total 9 (10%) 86 (90%) 95 (100%)
0.27, 0.73
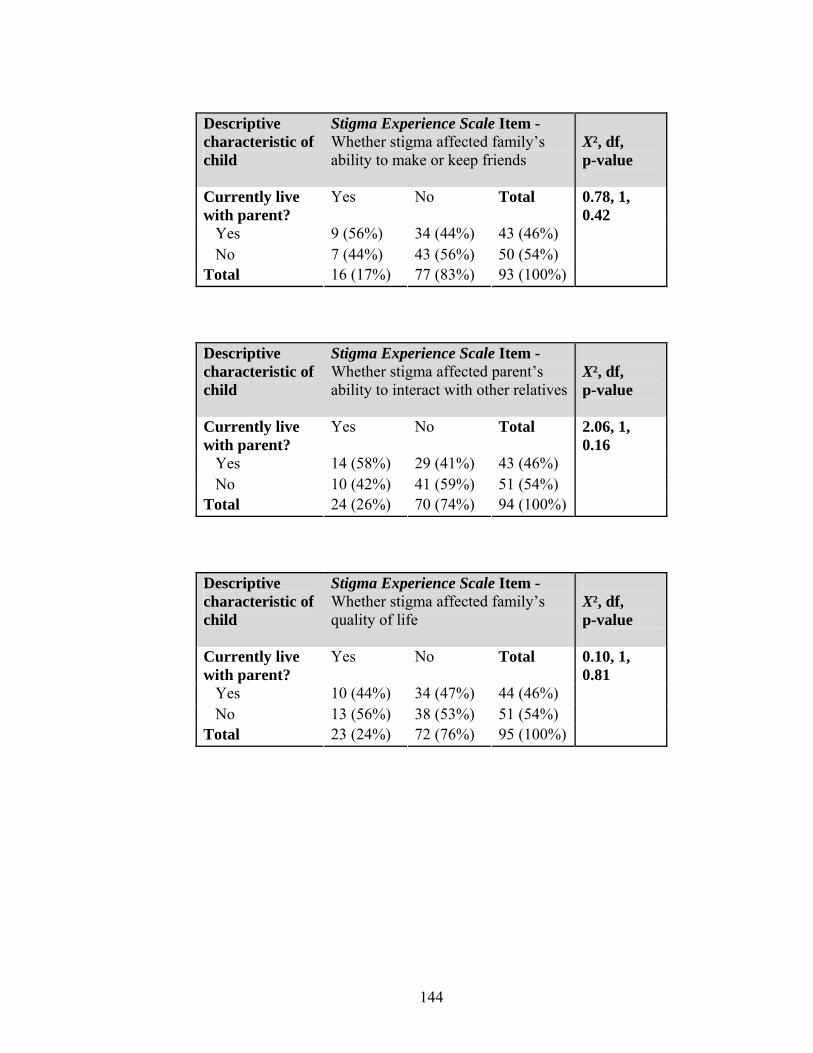
144
Descriptive characteristic of child
Stigma Experience Scale Item - Whether stigma affected family’s ability to make or keep friends
X², df, p-value
Currently live with parent?
Yes No Total
Yes 9 (56%) 34 (44%) 43 (46%) No 7 (44%) 43 (56%) 50 (54%) Total 16 (17%) 77 (83%) 93 (100%)
0.78, 1, 0.42
Descriptive characteristic of child
Stigma Experience Scale Item - Whether stigma affected parent’s ability to interact with other relatives
X², df, p-value
Currently live with parent?
Yes No Total
Yes 14 (58%) 29 (41%) 43 (46%) No 10 (42%) 41 (59%) 51 (54%) Total 24 (26%) 70 (74%) 94 (100%)
2.06, 1, 0.16
Descriptive characteristic of child
Stigma Experience Scale Item - Whether stigma affected family’s quality of life
X², df, p-value
Currently live with parent?
Yes No Total
Yes 10 (44%) 34 (47%) 44 (46%) No 13 (56%) 38 (53%) 51 (54%) Total 23 (24%) 72 (76%) 95 (100%)
0.10, 1, 0.81

145
3) Gender of respondent’s adult child with intellectual disability
Descriptive characteristic of child
Stigma Experience Scale Item - Whether people think less of those with an intellectual disability
X², df, p-value
Gender Yes No Total Male 21 (57%) 36 (64%) 57 (61%) Female 16 (43%) 20 (36%) 36 (39%) Total 37 (40%) 56 (60%) 93 (100%)
0.53, 1, 0.52
Descriptive characteristic of child
Stigma Experience Scale Item - Whether people are afraid of those with an intellectual disability
X², df, p-value
Gender Yes No Total Male 13 (54%) 43 (64%) 56 (62%) Female 11 (46%) 24 (36%) 35 (38%) Total 24 (26%) 67 (74%) 91 (100%)
0.75, 1, 0.47
Descriptive characteristic of child
Stigma Experience Scale Item - Whether the adult child had been stigmatized because of his/her intellectual disability
X², df, p-value
Gender Yes No Total Male 12 (55%) 40 (61%) 52 (59%) Female 10 (45%) 26 (39%) 36 (41%) Total 22 (25%) 66 (75%) 88 (100%)
0.25, 1, 0.80

146
Descriptive characteristic of child
Stigma Experience Scale Item - Whether the parent had felt stigmatized because of his/her child’s intellectual disability
Fisher’s exact test statistic, p-value
Gender Yes No Total Male 5 (56%) 53 (62%) 58 (61%) Female 4 (44%) 33 (38%) 37 (39%) Total 9 (10%) 86 (90%) 95 (100%)
0.13, 1.00
Descriptive characteristic of child
Stigma Experience Scale Item - Whether stigma affected family’s ability to make or keep friends
X², df, p-value
Gender Yes No Total Male 9 (56%) 48 (62%) 57 (61%) Female 7 (44%) 29 (38%) 36 (39%) Total 16 (17%) 77 (83%) 93 (100%)
0.21, 1, 0.78
Descriptive characteristic of child
Stigma Experience Scale Item - Whether stigma affected parent’s ability to interact with other relatives
X², df, p-value
Gender Yes No Total Male 14 (58%) 44 (63%) 58 (62%) Female 10 (42%) 26 (37%) 36 (38%) Total 24 (26%) 70 (74%) 94 (100%)
0.16, 1, 0.81
Descriptive characteristic of child
Stigma Experience Scale Item - Whether stigma affected family’s quality of life
X², df, p-value
Gender Yes No Total Male 14 (61%) 45 (62%) 59 (62%) Female 9 (39%) 27 (38%) 36 (38%) Total 23 (24%) 72 (76%) 95 (100%)
0.02, 1, 1.00
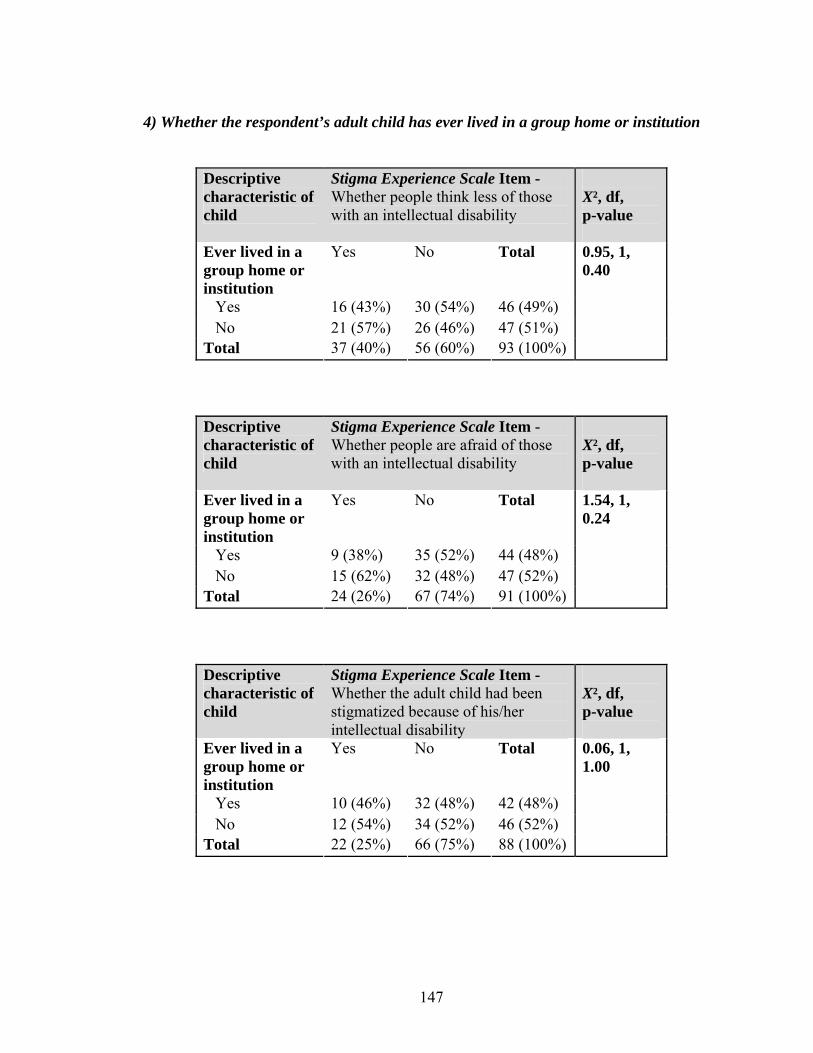
147
4) Whether the respondent’s adult child has ever lived in a group home or institution
Descriptive characteristic of child
Stigma Experience Scale Item - Whether people think less of those with an intellectual disability
X², df, p-value
Ever lived in a group home or institution
Yes No Total
Yes 16 (43%) 30 (54%) 46 (49%) No 21 (57%) 26 (46%) 47 (51%) Total 37 (40%) 56 (60%) 93 (100%)
0.95, 1, 0.40
Descriptive characteristic of child
Stigma Experience Scale Item - Whether people are afraid of those with an intellectual disability
X², df, p-value
Ever lived in a group home or institution
Yes No Total
Yes 9 (38%) 35 (52%) 44 (48%) No 15 (62%) 32 (48%) 47 (52%) Total 24 (26%) 67 (74%) 91 (100%)
1.54, 1, 0.24
Descriptive characteristic of child
Stigma Experience Scale Item - Whether the adult child had been stigmatized because of his/her intellectual disability
X², df, p-value
Ever lived in a group home or institution
Yes No Total
Yes 10 (46%) 32 (48%) 42 (48%) No 12 (54%) 34 (52%) 46 (52%) Total 22 (25%) 66 (75%) 88 (100%)
0.06, 1, 1.00
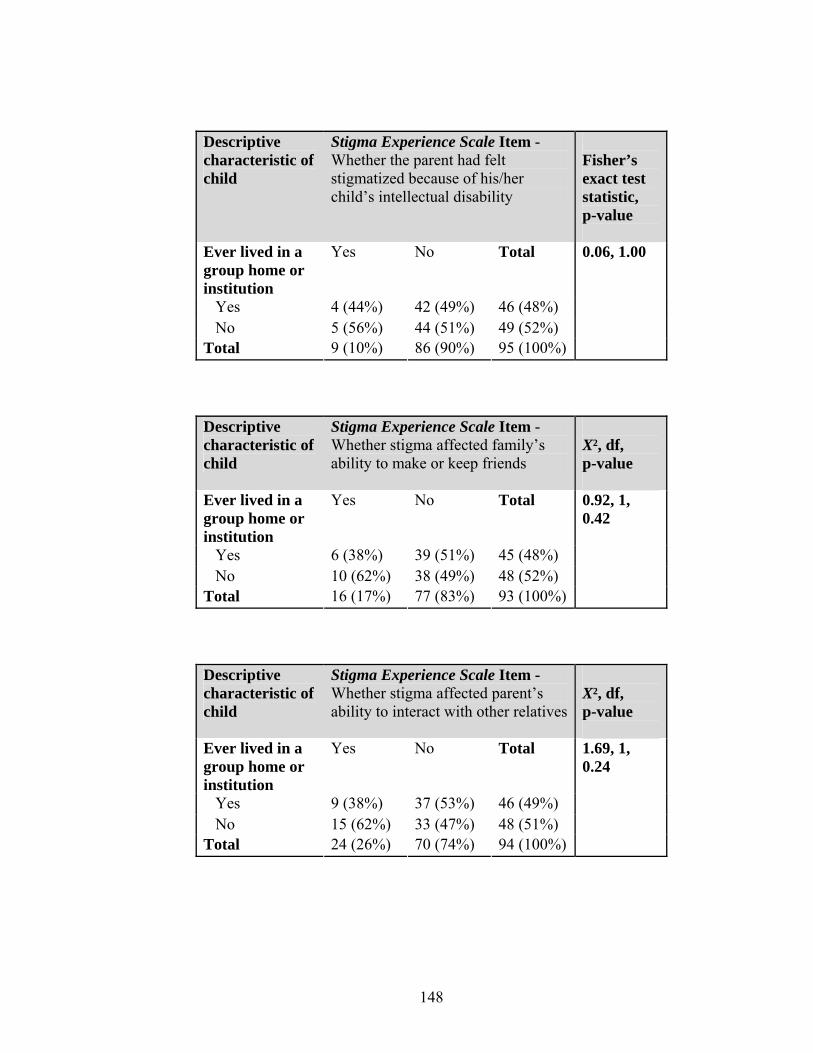
148
Descriptive characteristic of child
Stigma Experience Scale Item - Whether the parent had felt stigmatized because of his/her child’s intellectual disability
Fisher’s exact test statistic, p-value
Ever lived in a group home or institution
Yes No Total
Yes 4 (44%) 42 (49%) 46 (48%) No 5 (56%) 44 (51%) 49 (52%) Total 9 (10%) 86 (90%) 95 (100%)
0.06, 1.00
Descriptive characteristic of child
Stigma Experience Scale Item - Whether stigma affected family’s ability to make or keep friends
X², df, p-value
Ever lived in a group home or institution
Yes No Total
Yes 6 (38%) 39 (51%) 45 (48%) No 10 (62%) 38 (49%) 48 (52%) Total 16 (17%) 77 (83%) 93 (100%)
0.92, 1, 0.42
Descriptive characteristic of child
Stigma Experience Scale Item - Whether stigma affected parent’s ability to interact with other relatives
X², df, p-value
Ever lived in a group home or institution
Yes No Total
Yes 9 (38%) 37 (53%) 46 (49%) No 15 (62%) 33 (47%) 48 (51%) Total 24 (26%) 70 (74%) 94 (100%)
1.69, 1, 0.24

149
Descriptive characteristic of child
Stigma Experience Scale Item - Whether stigma affected family’s quality of life
X², df, p-value
Ever lived in a group home or institution
Yes No Total
Yes 12 (52%) 34 (47%) 46 (48%) No 11 (48%) 38 (53%) 49 (52%) Total 23 (24%) 72 (76%) 95 (100%)
0.17, 1, 0.81
5) Whether the respondent is the primary caregiver of their adult child
Descriptive characteristic of parent
Stigma Experience Scale Item - Whether people think less of those with an intellectual disability
X², df, p-value
Primary caregiver
Yes No Total
Yes 30 (79%) 40 (73%) 70 (75%) No 8 (21%) 15 (27%) 23 (25%) Total 38 (41%) 55 (59%) 93 (100%)
0.47, 1, 0.63
Descriptive characteristic of parent
Stigma Experience Scale Item - Whether people are afraid of those with an intellectual disability
Fisher’s exact test statistic, p-value
Primary caregiver
Yes No Total
Yes 20 (80%) 49 (74%) 69 (76%) No 5 (20%) 17 (26%) 22 (24%) Total 25 (28%) 66 (72%) 91 (100%)
0.33, 0.78
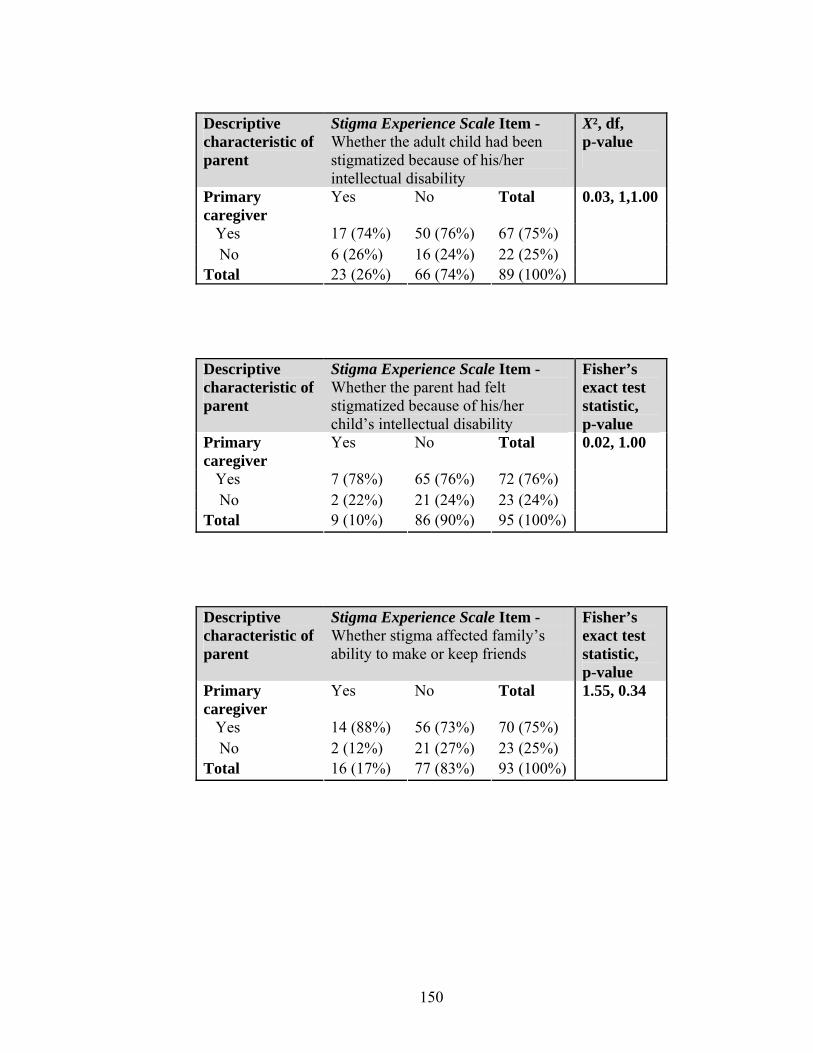
150
Descriptive characteristic of parent
Stigma Experience Scale Item - Whether the adult child had been stigmatized because of his/her intellectual disability
X², df, p-value
Primary caregiver
Yes No Total
Yes 17 (74%) 50 (76%) 67 (75%) No 6 (26%) 16 (24%) 22 (25%) Total 23 (26%) 66 (74%) 89 (100%)
0.03, 1,1.00
Descriptive characteristic of parent
Stigma Experience Scale Item - Whether the parent had felt stigmatized because of his/her child’s intellectual disability
Fisher’s exact test statistic, p-value
Primary caregiver
Yes No Total
Yes 7 (78%) 65 (76%) 72 (76%) No 2 (22%) 21 (24%) 23 (24%) Total 9 (10%) 86 (90%) 95 (100%)
0.02, 1.00
Descriptive characteristic of parent
Stigma Experience Scale Item - Whether stigma affected family’s ability to make or keep friends
Fisher’s exact test statistic, p-value
Primary caregiver
Yes No Total
Yes 14 (88%) 56 (73%) 70 (75%) No 2 (12%) 21 (27%) 23 (25%) Total 16 (17%) 77 (83%) 93 (100%)
1.55, 0.34
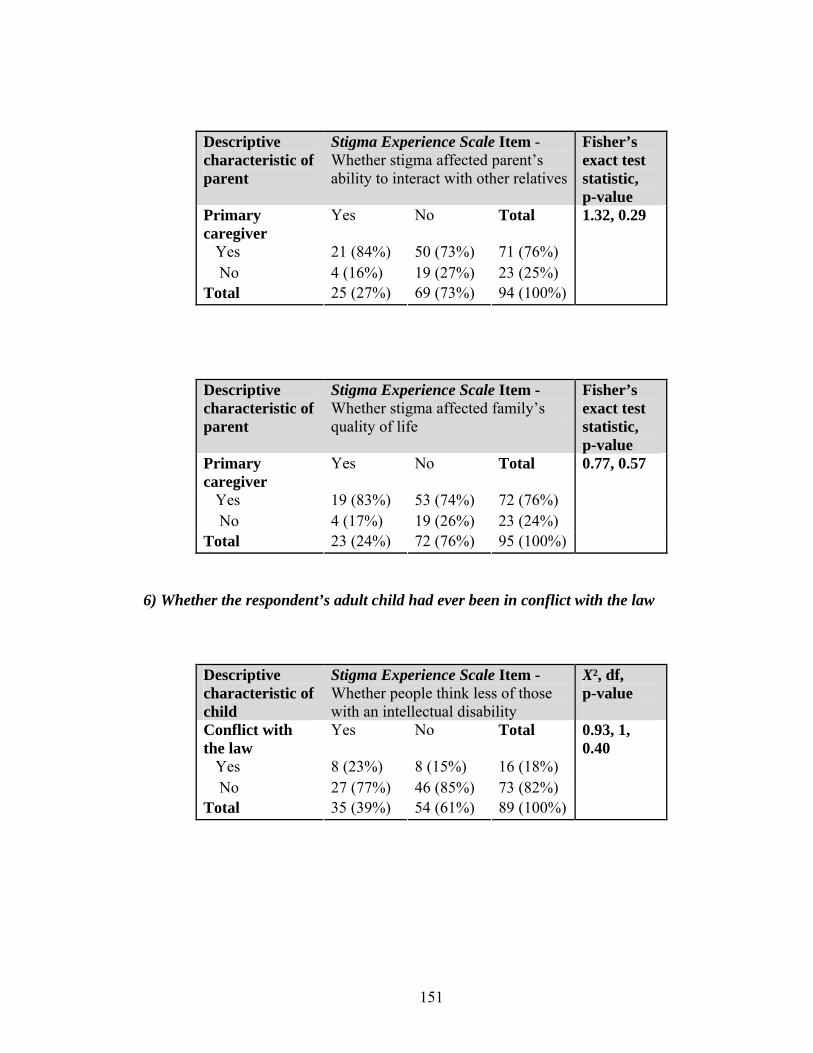
151
Descriptive characteristic of parent
Stigma Experience Scale Item - Whether stigma affected parent’s ability to interact with other relatives
Fisher’s exact test statistic, p-value
Primary caregiver
Yes No Total
Yes 21 (84%) 50 (73%) 71 (76%) No 4 (16%) 19 (27%) 23 (25%) Total 25 (27%) 69 (73%) 94 (100%)
1.32, 0.29
Descriptive characteristic of parent
Stigma Experience Scale Item - Whether stigma affected family’s quality of life
Fisher’s exact test statistic, p-value
Primary caregiver
Yes No Total
Yes 19 (83%) 53 (74%) 72 (76%) No 4 (17%) 19 (26%) 23 (24%) Total 23 (24%) 72 (76%) 95 (100%)
0.77, 0.57
6) Whether the respondent’s adult child had ever been in conflict with the law
Descriptive characteristic of child
Stigma Experience Scale Item - Whether people think less of those with an intellectual disability
X², df, p-value
Conflict with the law
Yes No Total
Yes 8 (23%) 8 (15%) 16 (18%) No 27 (77%) 46 (85%) 73 (82%) Total 35 (39%) 54 (61%) 89 (100%)
0.93, 1, 0.40
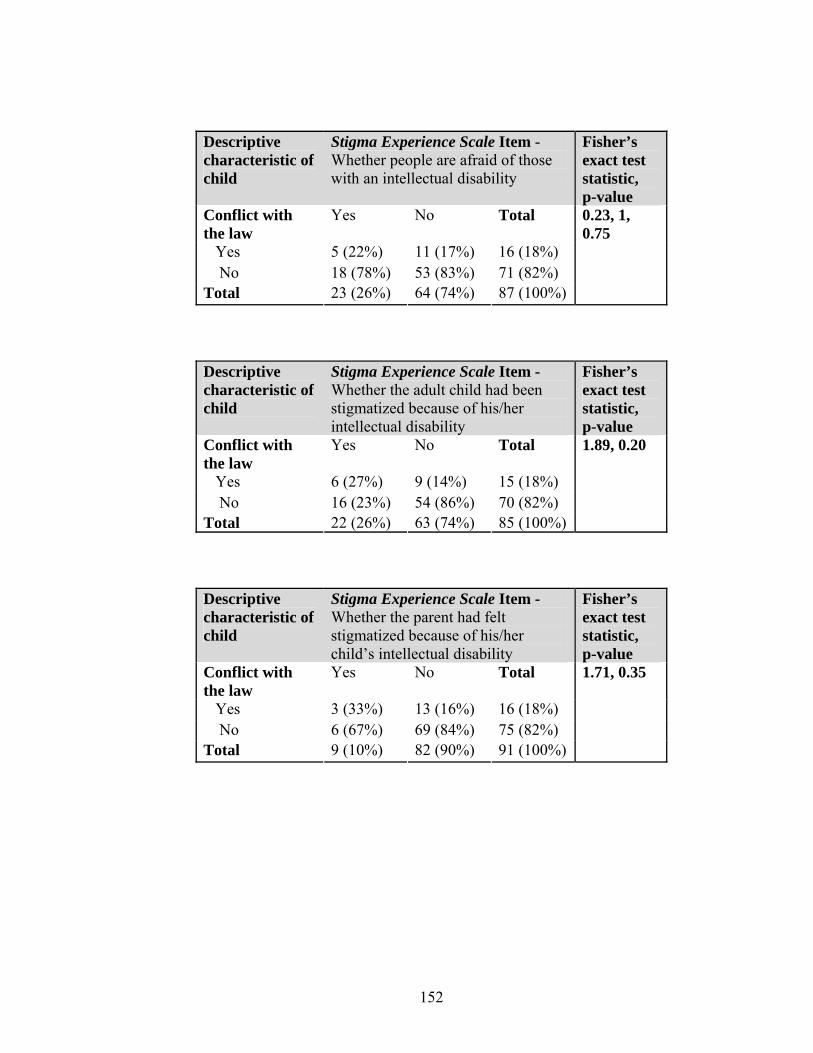
152
Descriptive characteristic of child
Stigma Experience Scale Item - Whether people are afraid of those with an intellectual disability
Fisher’s exact test statistic, p-value
Conflict with the law
Yes No Total
Yes 5 (22%) 11 (17%) 16 (18%) No 18 (78%) 53 (83%) 71 (82%) Total 23 (26%) 64 (74%) 87 (100%)
0.23, 1, 0.75
Descriptive characteristic of child
Stigma Experience Scale Item - Whether the adult child had been stigmatized because of his/her intellectual disability
Fisher’s exact test statistic, p-value
Conflict with the law
Yes No Total
Yes 6 (27%) 9 (14%) 15 (18%) No 16 (23%) 54 (86%) 70 (82%) Total 22 (26%) 63 (74%) 85 (100%)
1.89, 0.20
Descriptive characteristic of child
Stigma Experience Scale Item - Whether the parent had felt stigmatized because of his/her child’s intellectual disability
Fisher’s exact test statistic, p-value
Conflict with the law
Yes No Total
Yes 3 (33%) 13 (16%) 16 (18%) No 6 (67%) 69 (84%) 75 (82%) Total 9 (10%) 82 (90%) 91 (100%)
1.71, 0.35
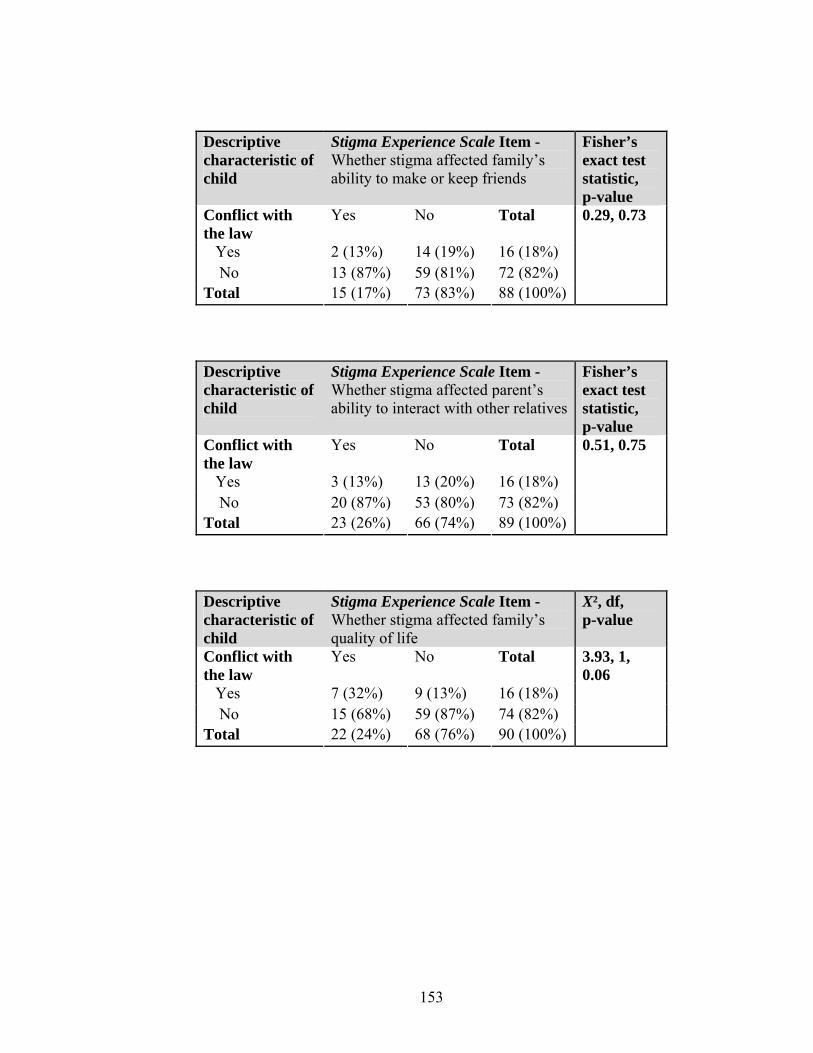
153
Descriptive characteristic of child
Stigma Experience Scale Item - Whether stigma affected family’s ability to make or keep friends
Fisher’s exact test statistic, p-value
Conflict with the law
Yes No Total
Yes 2 (13%) 14 (19%) 16 (18%) No 13 (87%) 59 (81%) 72 (82%) Total 15 (17%) 73 (83%) 88 (100%)
0.29, 0.73
Descriptive characteristic of child
Stigma Experience Scale Item - Whether stigma affected parent’s ability to interact with other relatives
Fisher’s exact test statistic, p-value
Conflict with the law
Yes No Total
Yes 3 (13%) 13 (20%) 16 (18%) No 20 (87%) 53 (80%) 73 (82%) Total 23 (26%) 66 (74%) 89 (100%)
0.51, 0.75
Descriptive characteristic of child
Stigma Experience Scale Item - Whether stigma affected family’s quality of life
X², df, p-value
Conflict with the law
Yes No Total
Yes 7 (32%) 9 (13%) 16 (18%) No 15 (68%) 59 (87%) 74 (82%) Total 22 (24%) 68 (76%) 90 (100%)
3.93, 1, 0.06
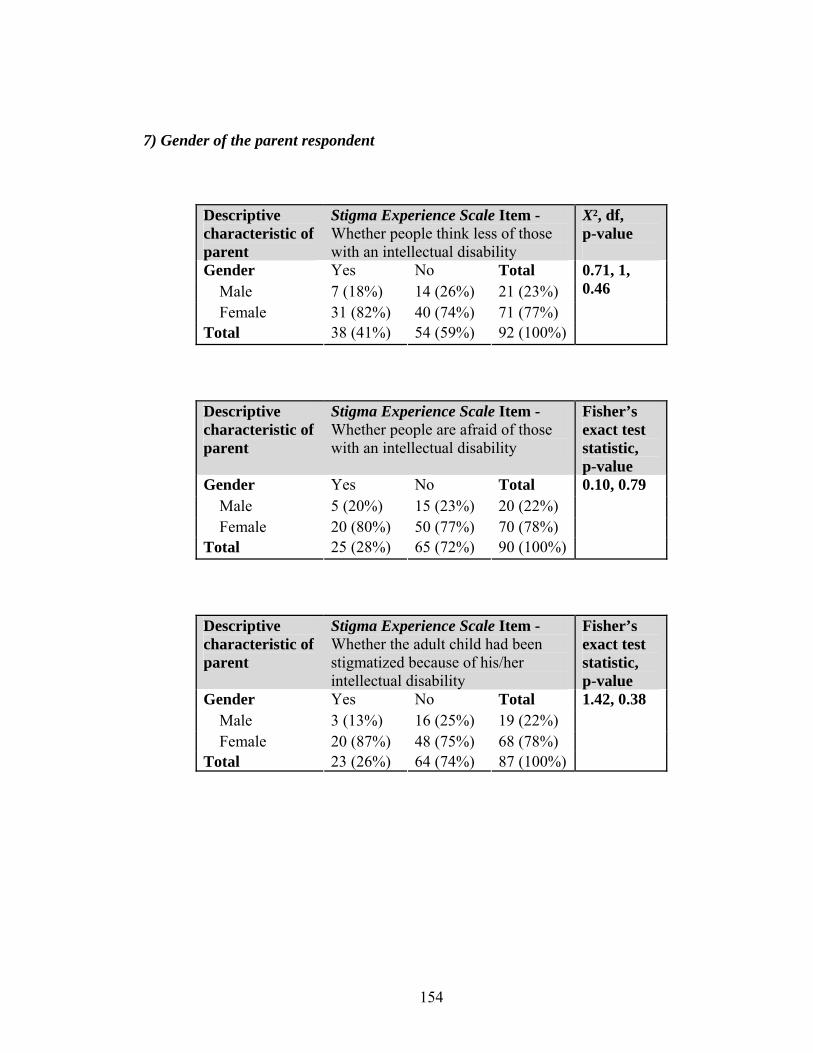
154
7) Gender of the parent respondent
Descriptive characteristic of parent
Stigma Experience Scale Item - Whether people think less of those with an intellectual disability
X², df, p-value
Gender Yes No Total Male 7 (18%) 14 (26%) 21 (23%) Female 31 (82%) 40 (74%) 71 (77%) Total 38 (41%) 54 (59%) 92 (100%)
0.71, 1, 0.46
Descriptive characteristic of parent
Stigma Experience Scale Item - Whether people are afraid of those with an intellectual disability
Fisher’s exact test statistic, p-value
Gender Yes No Total Male 5 (20%) 15 (23%) 20 (22%) Female 20 (80%) 50 (77%) 70 (78%) Total 25 (28%) 65 (72%) 90 (100%)
0.10, 0.79
Descriptive characteristic of parent
Stigma Experience Scale Item - Whether the adult child had been stigmatized because of his/her intellectual disability
Fisher’s exact test statistic, p-value
Gender Yes No Total Male 3 (13%) 16 (25%) 19 (22%) Female 20 (87%) 48 (75%) 68 (78%) Total 23 (26%) 64 (74%) 87 (100%)
1.42, 0.38
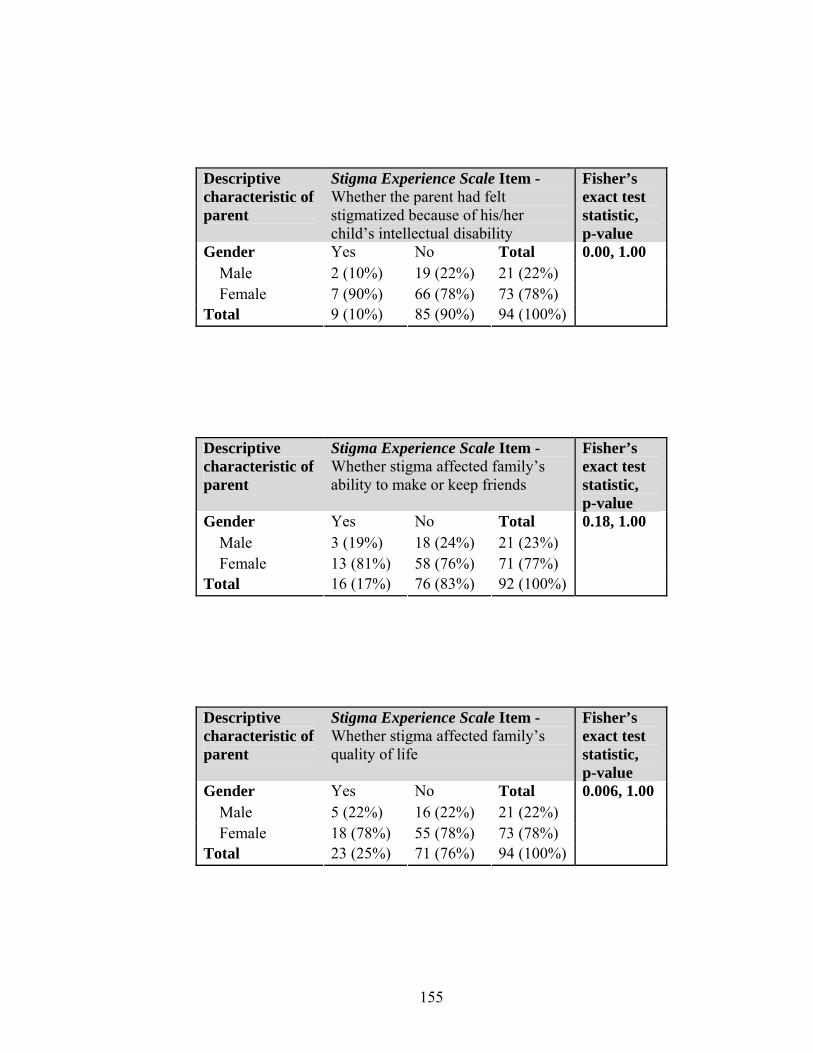
155
Descriptive characteristic of parent
Stigma Experience Scale Item - Whether the parent had felt stigmatized because of his/her child’s intellectual disability
Fisher’s exact test statistic, p-value
Gender Yes No Total Male 2 (10%) 19 (22%) 21 (22%) Female 7 (90%) 66 (78%) 73 (78%) Total 9 (10%) 85 (90%) 94 (100%)
0.00, 1.00
Descriptive characteristic of parent
Stigma Experience Scale Item - Whether stigma affected family’s ability to make or keep friends
Fisher’s exact test statistic, p-value
Gender Yes No Total Male 3 (19%) 18 (24%) 21 (23%) Female 13 (81%) 58 (76%) 71 (77%) Total 16 (17%) 76 (83%) 92 (100%)
0.18, 1.00
Descriptive characteristic of parent
Stigma Experience Scale Item - Whether stigma affected family’s quality of life
Fisher’s exact test statistic, p-value
Gender Yes No Total Male 5 (22%) 16 (22%) 21 (22%) Female 18 (78%) 55 (78%) 73 (78%) Total 23 (25%) 71 (76%) 94 (100%)
0.006, 1.00
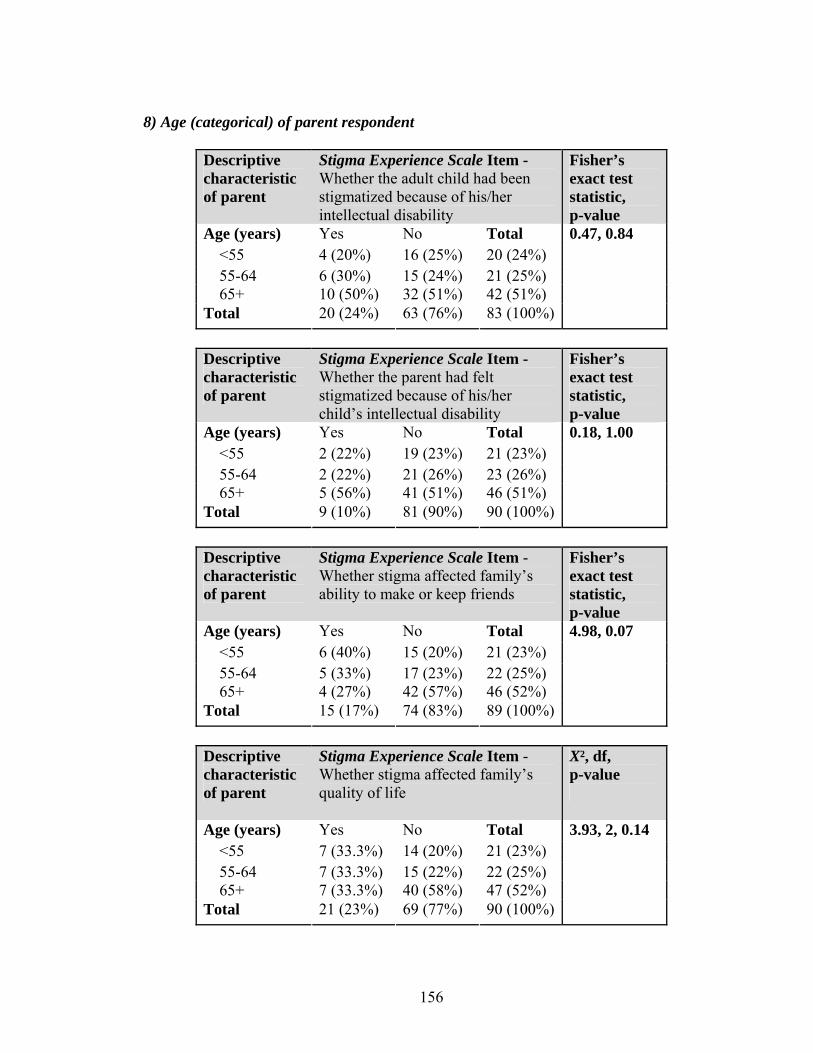
156
8) Age (categorical) of parent respondent
Descriptive characteristic of parent
Stigma Experience Scale Item - Whether the adult child had been stigmatized because of his/her intellectual disability
Fisher’s exact test statistic, p-value
Age (years) Yes No Total <55 4 (20%) 16 (25%) 20 (24%) 55-64 6 (30%) 15 (24%) 21 (25%) 65+ 10 (50%) 32 (51%) 42 (51%) Total 20 (24%) 63 (76%) 83 (100%)
0.47, 0.84
Descriptive characteristic of parent
Stigma Experience Scale Item - Whether the parent had felt stigmatized because of his/her child’s intellectual disability
Fisher’s exact test statistic, p-value
Age (years) Yes No Total <55 2 (22%) 19 (23%) 21 (23%) 55-64 2 (22%) 21 (26%) 23 (26%) 65+ 5 (56%) 41 (51%) 46 (51%) Total 9 (10%) 81 (90%) 90 (100%)
0.18, 1.00
Descriptive characteristic of parent
Stigma Experience Scale Item - Whether stigma affected family’s ability to make or keep friends
Fisher’s exact test statistic, p-value
Age (years) Yes No Total <55 6 (40%) 15 (20%) 21 (23%) 55-64 5 (33%) 17 (23%) 22 (25%) 65+ 4 (27%) 42 (57%) 46 (52%) Total 15 (17%) 74 (83%) 89 (100%)
4.98, 0.07
Descriptive characteristic of parent
Stigma Experience Scale Item - Whether stigma affected family’s quality of life
X², df, p-value
Age (years) Yes No Total <55 7 (33.3%) 14 (20%) 21 (23%) 55-64 7 (33.3%) 15 (22%) 22 (25%) 65+ 7 (33.3%) 40 (58%) 47 (52%) Total 21 (23%) 69 (77%) 90 (100%)
3.93, 2, 0.14
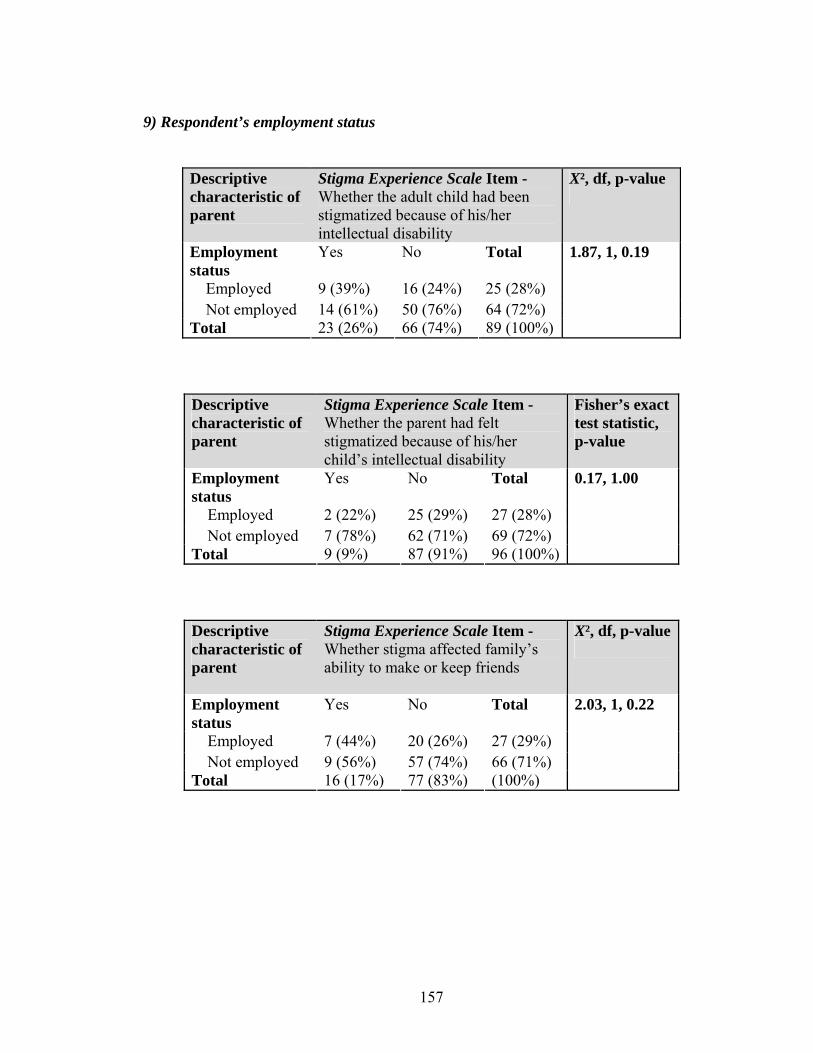
157
9) Respondent’s employment status
Descriptive characteristic of parent
Stigma Experience Scale Item - Whether the adult child had been stigmatized because of his/her intellectual disability
X², df, p-value
Employment status
Yes No Total
Employed 9 (39%) 16 (24%) 25 (28%) Not employed 14 (61%) 50 (76%) 64 (72%) Total 23 (26%) 66 (74%) 89 (100%)
1.87, 1, 0.19
Descriptive characteristic of parent
Stigma Experience Scale Item - Whether the parent had felt stigmatized because of his/her child’s intellectual disability
Fisher’s exact test statistic, p-value
Employment status
Yes No Total
Employed 2 (22%) 25 (29%) 27 (28%) Not employed 7 (78%) 62 (71%) 69 (72%) Total 9 (9%) 87 (91%) 96 (100%)
0.17, 1.00
Descriptive characteristic of parent
Stigma Experience Scale Item - Whether stigma affected family’s ability to make or keep friends
X², df, p-value
Employment status
Yes No Total
Employed 7 (44%) 20 (26%) 27 (29%) Not employed 9 (56%) 57 (74%) 66 (71%) Total 16 (17%) 77 (83%) (100%)
2.03, 1, 0.22
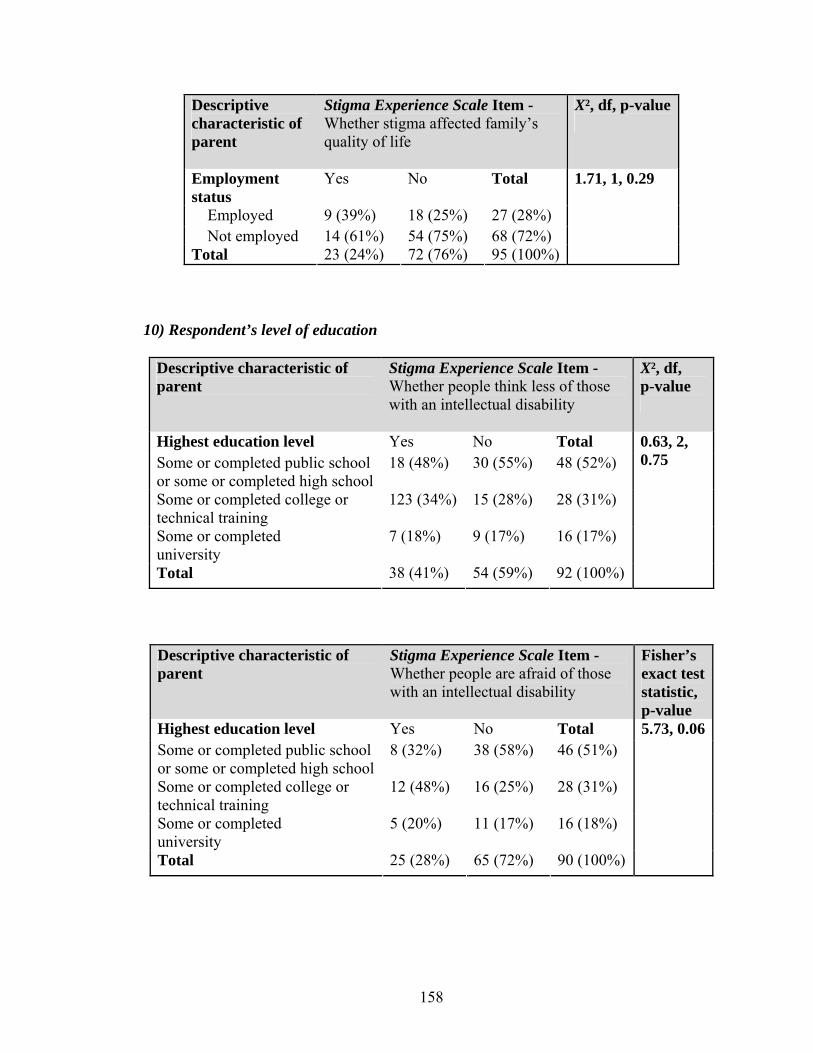
158
Descriptive characteristic of parent
Stigma Experience Scale Item - Whether stigma affected family’s quality of life
X², df, p-value
Employment status
Yes No Total
Employed 9 (39%) 18 (25%) 27 (28%) Not employed 14 (61%) 54 (75%) 68 (72%) Total 23 (24%) 72 (76%) 95 (100%)
1.71, 1, 0.29
10) Respondent’s level of education
Descriptive characteristic of parent
Stigma Experience Scale Item - Whether people think less of those with an intellectual disability
X², df, p-value
Highest education level Yes No Total Some or completed public school or some or completed high school
18 (48%) 30 (55%) 48 (52%)
Some or completed college or technical training
123 (34%) 15 (28%) 28 (31%)
Some or completed university
7 (18%) 9 (17%) 16 (17%)
Total 38 (41%) 54 (59%) 92 (100%)
0.63, 2, 0.75
Descriptive characteristic of parent
Stigma Experience Scale Item - Whether people are afraid of those with an intellectual disability
Fisher’s exact test statistic, p-value
Highest education level Yes No Total Some or completed public school or some or completed high school
8 (32%) 38 (58%) 46 (51%)
Some or completed college or technical training
12 (48%) 16 (25%) 28 (31%)
Some or completed university
5 (20%) 11 (17%) 16 (18%)
Total 25 (28%) 65 (72%) 90 (100%)
5.73, 0.06
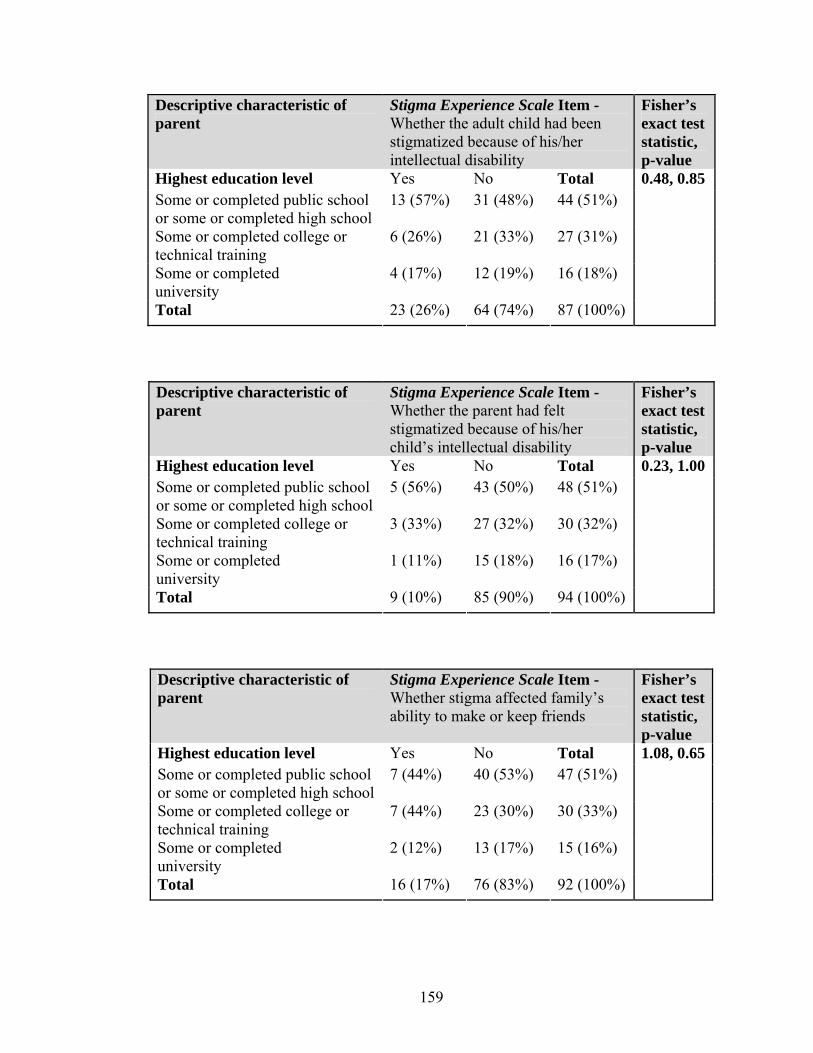
159
Descriptive characteristic of parent
Stigma Experience Scale Item - Whether the adult child had been stigmatized because of his/her intellectual disability
Fisher’s exact test statistic, p-value
Highest education level Yes No Total Some or completed public school or some or completed high school
13 (57%) 31 (48%) 44 (51%)
Some or completed college or technical training
6 (26%) 21 (33%) 27 (31%)
Some or completed university
4 (17%) 12 (19%) 16 (18%)
Total 23 (26%) 64 (74%) 87 (100%)
0.48, 0.85
Descriptive characteristic of parent
Stigma Experience Scale Item - Whether the parent had felt stigmatized because of his/her child’s intellectual disability
Fisher’s exact test statistic, p-value
Highest education level Yes No Total Some or completed public school or some or completed high school
5 (56%) 43 (50%) 48 (51%)
Some or completed college or technical training
3 (33%) 27 (32%) 30 (32%)
Some or completed university
1 (11%) 15 (18%) 16 (17%)
Total 9 (10%) 85 (90%) 94 (100%)
0.23, 1.00
Descriptive characteristic of parent
Stigma Experience Scale Item - Whether stigma affected family’s ability to make or keep friends
Fisher’s exact test statistic, p-value
Highest education level Yes No Total Some or completed public school or some or completed high school
7 (44%) 40 (53%) 47 (51%)
Some or completed college or technical training
7 (44%) 23 (30%) 30 (33%)
Some or completed university
2 (12%) 13 (17%) 15 (16%)
Total 16 (17%) 76 (83%) 92 (100%)
1.08, 0.65
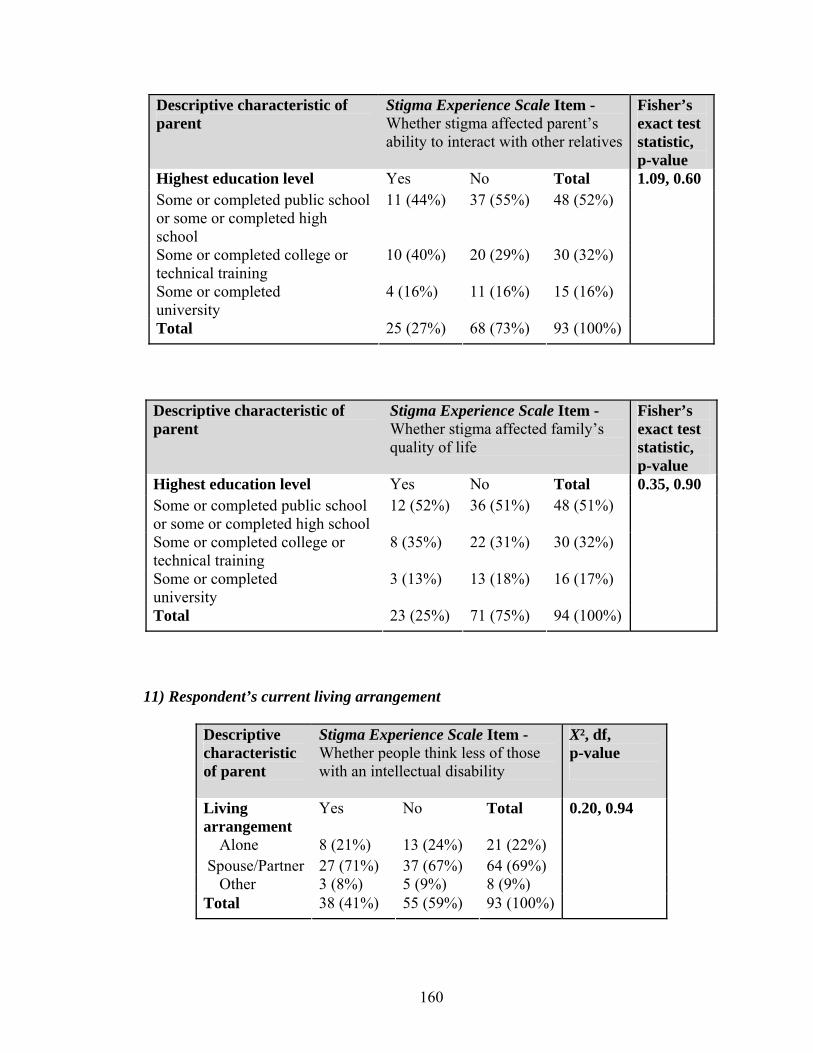
160
Descriptive characteristic of parent
Stigma Experience Scale Item - Whether stigma affected parent’s ability to interact with other relatives
Fisher’s exact test statistic, p-value
Highest education level Yes No Total Some or completed public school or some or completed high school
11 (44%) 37 (55%) 48 (52%)
Some or completed college or technical training
10 (40%) 20 (29%) 30 (32%)
Some or completed university
4 (16%) 11 (16%) 15 (16%)
Total 25 (27%) 68 (73%) 93 (100%)
1.09, 0.60
Descriptive characteristic of parent
Stigma Experience Scale Item - Whether stigma affected family’s quality of life
Fisher’s exact test statistic, p-value
Highest education level Yes No Total Some or completed public school or some or completed high school
12 (52%) 36 (51%) 48 (51%)
Some or completed college or technical training
8 (35%) 22 (31%) 30 (32%)
Some or completed university
3 (13%) 13 (18%) 16 (17%)
Total 23 (25%) 71 (75%) 94 (100%)
0.35, 0.90
11) Respondent’s current living arrangement
Descriptive characteristic of parent
Stigma Experience Scale Item - Whether people think less of those with an intellectual disability
X², df, p-value
Living arrangement
Yes No Total
Alone 8 (21%) 13 (24%) 21 (22%) Spouse/Partner 27 (71%) 37 (67%) 64 (69%) Other 3 (8%) 5 (9%) 8 (9%) Total 38 (41%) 55 (59%) 93 (100%)
0.20, 0.94
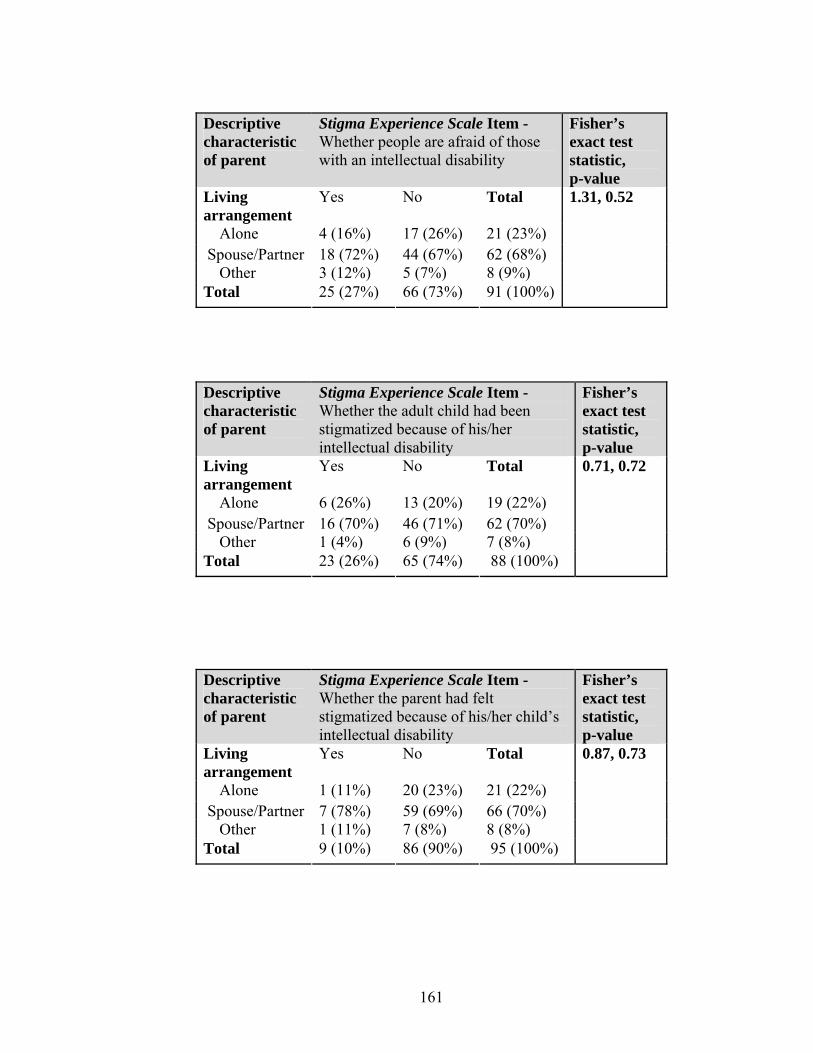
161
Descriptive characteristic of parent
Stigma Experience Scale Item - Whether people are afraid of those with an intellectual disability
Fisher’s exact test statistic, p-value
Living arrangement
Yes No Total
Alone 4 (16%) 17 (26%) 21 (23%) Spouse/Partner 18 (72%) 44 (67%) 62 (68%) Other 3 (12%) 5 (7%) 8 (9%) Total 25 (27%) 66 (73%) 91 (100%)
1.31, 0.52
Descriptive characteristic of parent
Stigma Experience Scale Item - Whether the adult child had been stigmatized because of his/her intellectual disability
Fisher’s exact test statistic, p-value
Living arrangement
Yes No Total
Alone 6 (26%) 13 (20%) 19 (22%) Spouse/Partner 16 (70%) 46 (71%) 62 (70%) Other 1 (4%) 6 (9%) 7 (8%) Total 23 (26%) 65 (74%) 88 (100%)
0.71, 0.72
Descriptive characteristic of parent
Stigma Experience Scale Item - Whether the parent had felt stigmatized because of his/her child’s intellectual disability
Fisher’s exact test statistic, p-value
Living arrangement
Yes No Total
Alone 1 (11%) 20 (23%) 21 (22%) Spouse/Partner 7 (78%) 59 (69%) 66 (70%) Other 1 (11%) 7 (8%) 8 (8%) Total 9 (10%) 86 (90%) 95 (100%)
0.87, 0.73

162
Descriptive characteristic of parent
Stigma Experience Scale Item - Whether stigma affected family’s ability to make or keep friends
Fisher’s exact test statistic, p-value
Living arrangement
Yes No Total
Alone 4 (25%) 18 (23%) 22 (24%) Spouse/Partner 12 (75%) 51 (66%) 63 (68%) Other 0 (0%) 8 (11%) 8 (8%) Total 16 (17%) 77 (83%) 93 (100%)
1.38, 0.61
Descriptive characteristic of parent
Stigma Experience Scale Item - Whether stigma affected parent’s ability to interact with other relatives
Fisher’s exact test statistic, p-value
Living arrangement
Yes No Total
Alone 6 (24%) 16 (23%) 22 (23%) Spouse/Partner 18 (72%) 46 (67%) 64 (68%) Other 1 (4%) 7 (10%) 8 (9%) Total 25 (27%) 69 (73%) 94 (100%)
0.70, 0.81
Descriptive characteristic of parent
Stigma Experience Scale Item - Whether stigma affected family’s quality of life
Fisher’s exact test statistic, p-value
Living arrangement
Yes No Total
Alone 5 (22%) 17 (24%) 22 (23%) Spouse/Partner 18 (78%) 47 (65%) 65 (69%) Other 0 (0%) 8 (11%) 8 (8%) Total 23 (24%) 72 (76%) 95 (100%)
2.74, 0.25
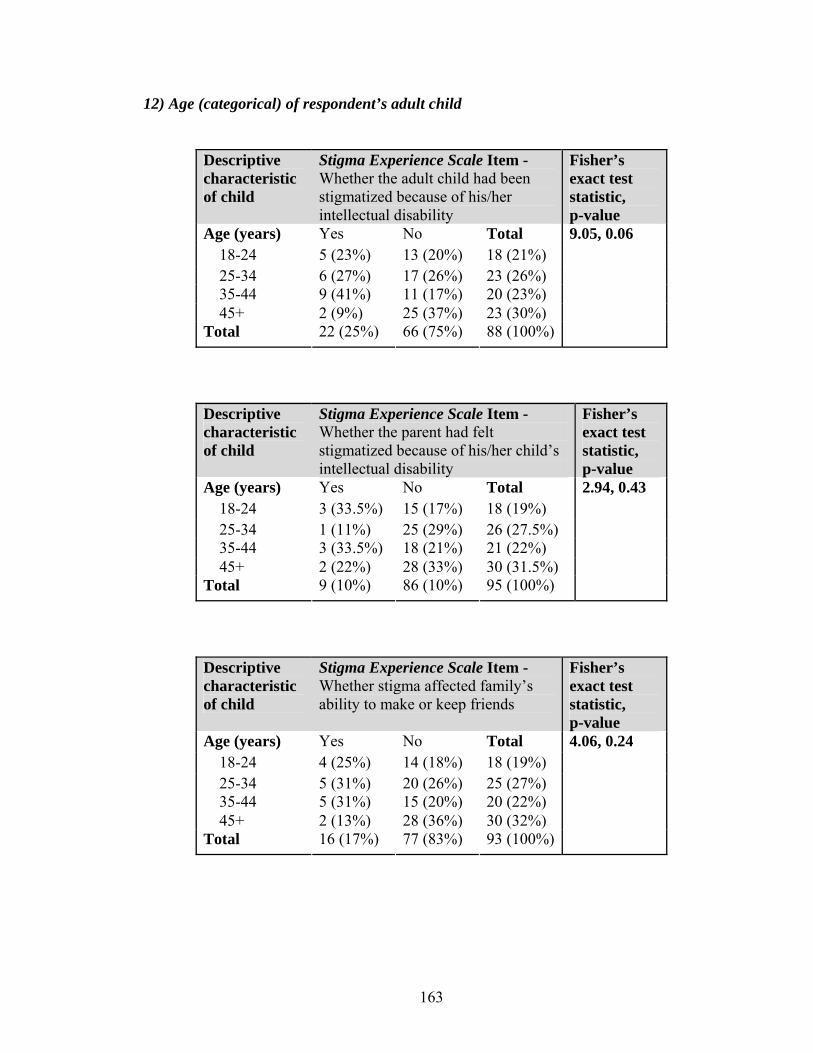
163
12) Age (categorical) of respondent’s adult child
Descriptive characteristic of child
Stigma Experience Scale Item - Whether the adult child had been stigmatized because of his/her intellectual disability
Fisher’s exact test statistic, p-value
Age (years) Yes No Total 18-24 5 (23%) 13 (20%) 18 (21%) 25-34 6 (27%) 17 (26%) 23 (26%) 35-44 9 (41%) 11 (17%) 20 (23%) 45+ 2 (9%) 25 (37%) 23 (30%) Total 22 (25%) 66 (75%) 88 (100%)
9.05, 0.06
Descriptive characteristic of child
Stigma Experience Scale Item - Whether the parent had felt stigmatized because of his/her child’s intellectual disability
Fisher’s exact test statistic, p-value
Age (years) Yes No Total 18-24 3 (33.5%) 15 (17%) 18 (19%) 25-34 1 (11%) 25 (29%) 26 (27.5%) 35-44 3 (33.5%) 18 (21%) 21 (22%) 45+ 2 (22%) 28 (33%) 30 (31.5%) Total 9 (10%) 86 (10%) 95 (100%)
2.94, 0.43
Descriptive characteristic of child
Stigma Experience Scale Item - Whether stigma affected family’s ability to make or keep friends
Fisher’s exact test statistic, p-value
Age (years) Yes No Total 18-24 4 (25%) 14 (18%) 18 (19%) 25-34 5 (31%) 20 (26%) 25 (27%) 35-44 5 (31%) 15 (20%) 20 (22%) 45+ 2 (13%) 28 (36%) 30 (32%) Total 16 (17%) 77 (83%) 93 (100%)
4.06, 0.24
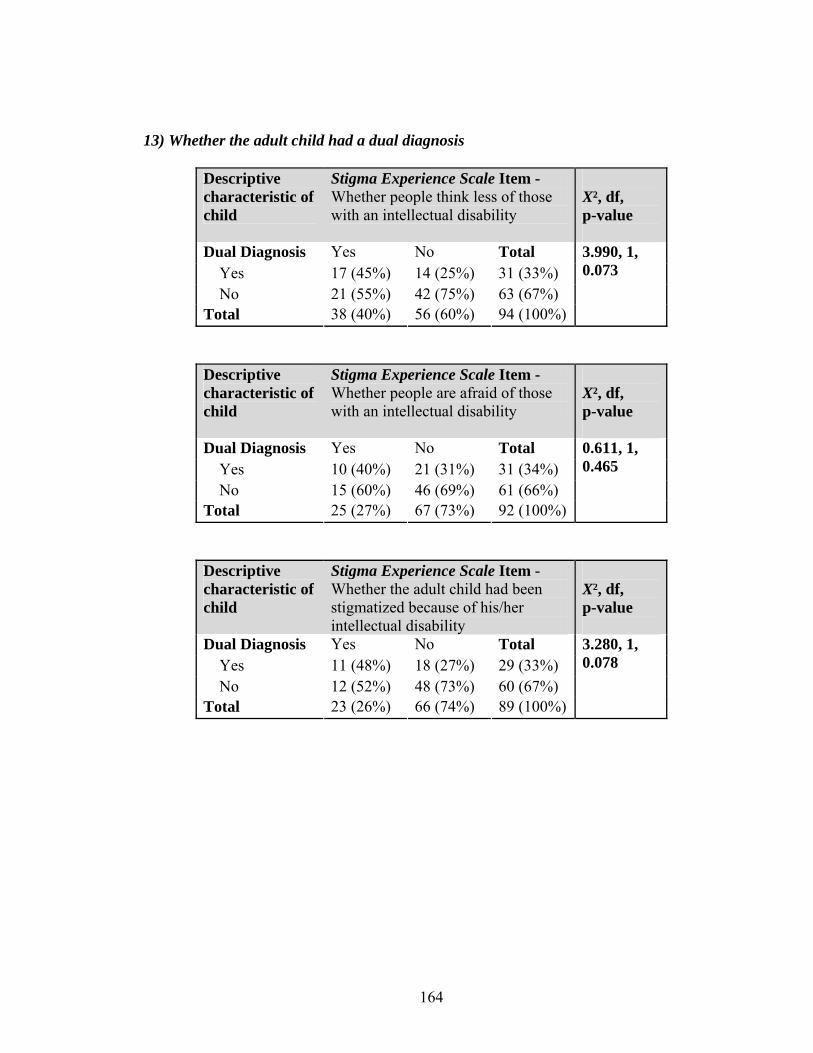
164
13) Whether the adult child had a dual diagnosis
Descriptive characteristic of child
Stigma Experience Scale Item - Whether people think less of those with an intellectual disability
X², df, p-value
Dual Diagnosis Yes No Total Yes 17 (45%) 14 (25%) 31 (33%) No 21 (55%) 42 (75%) 63 (67%) Total 38 (40%) 56 (60%) 94 (100%)
3.990, 1, 0.073
Descriptive characteristic of child
Stigma Experience Scale Item - Whether people are afraid of those with an intellectual disability
X², df, p-value
Dual Diagnosis Yes No Total Yes 10 (40%) 21 (31%) 31 (34%) No 15 (60%) 46 (69%) 61 (66%) Total 25 (27%) 67 (73%) 92 (100%)
0.611, 1, 0.465
Descriptive characteristic of child
Stigma Experience Scale Item - Whether the adult child had been stigmatized because of his/her intellectual disability
X², df, p-value
Dual Diagnosis Yes No Total Yes 11 (48%) 18 (27%) 29 (33%) No 12 (52%) 48 (73%) 60 (67%) Total 23 (26%) 66 (74%) 89 (100%)
3.280, 1, 0.078

165
Descriptive characteristic of child
Stigma Experience Scale Item - Whether the parent had felt stigmatized because of his/her child’s intellectual disability
Fisher’s exact test statistic, p-value
Dual Diagnosis Yes No Total Yes 3 (33%) 29 (33%) 32 (33%) No 6 (67%) 58 (67%) 64 (67%) Total 9 (9%) 87 (91%) 96 (100%)
0.000, 1, 1.000
Descriptive characteristic of child
Stigma Experience Scale Item - Whether stigma affected family’s ability to make or keep friends
X², df, p-value
Dual Diagnosis Yes No Total Yes 8 (50%) 22 (28%) 30 (32%) No 8 (50%) 56 (72%) 64 (68%) Total 16 (17%) 78 (83%) 94 (100%)
2.902, 1, 0.139
Descriptive characteristic of child
Stigma Experience Scale Item - Whether stigma affected parent’s ability to interact with other relatives
X², df, p-value
Dual Diagnosis Yes No Total Yes 9 (36%) 22 (31%) 31 (33%) No 16 (64%) 48 (69%) 64 (67%) Total 25 (26%) 70 (74%) 95 (100%)
0.175, 1, 0.804
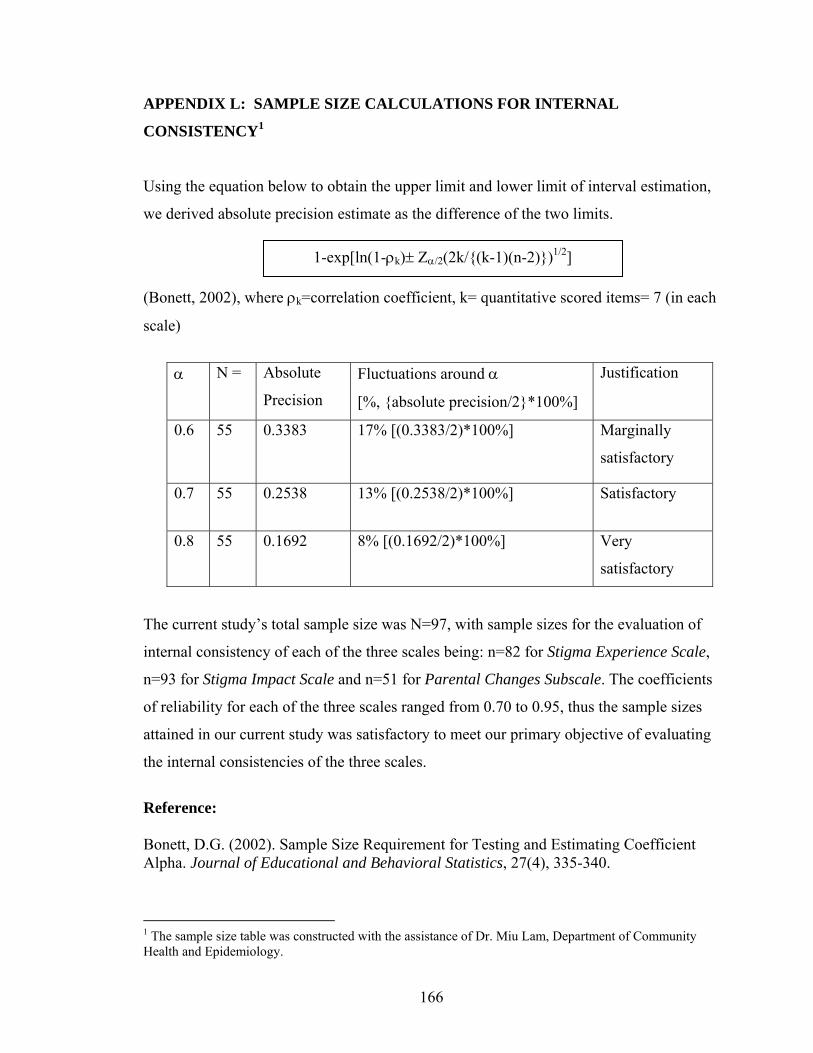
166
APPENDIX L: SAMPLE SIZE CALCULATIONS FOR INTERNAL
CONSISTENCY1
Using the equation below to obtain the upper limit and lower limit of interval estimation,
we derived absolute precision estimate as the difference of the two limits.
(Bonett, 2002), where ρk=correlation coefficient, k= quantitative scored items= 7 (in each
scale)
The current study’s total sample size was N=97, with sample sizes for the evaluation of
internal consistency of each of the three scales being: n=82 for Stigma Experience Scale,
n=93 for Stigma Impact Scale and n=51 for Parental Changes Subscale. The coefficients
of reliability for each of the three scales ranged from 0.70 to 0.95, thus the sample sizes
attained in our current study was satisfactory to meet our primary objective of evaluating
the internal consistencies of the three scales.
Reference: Bonett, D.G. (2002). Sample Size Requirement for Testing and Estimating Coefficient Alpha. Journal of Educational and Behavioral Statistics, 27(4), 335-340.
1 The sample size table was constructed with the assistance of Dr. Miu Lam, Department of Community Health and Epidemiology.
α N = Absolute
Precision
Fluctuations around α
[%, {absolute precision/2}*100%]
Justification
0.6 55 0.3383 17% [(0.3383/2)*100%] Marginally
satisfactory
0.7 55 0.2538 13% [(0.2538/2)*100%] Satisfactory
0.8 55 0.1692 8% [(0.1692/2)*100%] Very
satisfactory
1-exp[ln(1-ρk)± Ζα/2(2k/{(k-1)(n-2)})1/2]

167
APPENDIX M: COMPARISON OF RESPONDENTS AND NON-RESPONDENTS
FOR THE STIGMA EXPERIENCE SCALE
Testing the association between each of the thirteen key characteristics of the respondents
(and their adult child) and whether they completed the Stigma Experience Scale (none
reached statistical significance, i.e., p-value of less that 0.05):
Descriptive characteristic of child
Stigma Experience Scale – answered all 7 items?
X², df, p-value
Dual Diagnosis
Yes No Total
Yes 26 (81%) 6 (19%) 32 (33%) No 56 (86%) 9 (14%) 65 (67%) Total 82 (85%) 15 (15%) 97 (100%)
0.39, 1, 0.56
Descriptive characteristic of child
Stigma Experience Scale – answered all 7 items?
Fisher’s exact test statistic, p-value
Age (years) Yes No Total 18-24 16 (89%) 2 (11%) 18 (19%) 25-34 22 (85%) 4 (15%) 26 (27%) 35-44 17 (81%) 4 (19%) 21 (22%) 45+ 26 (84%) 5 (16%) 31 (32%) Total 81 (84%) 15 (16%) 96 (100%)
0.56, 0.98
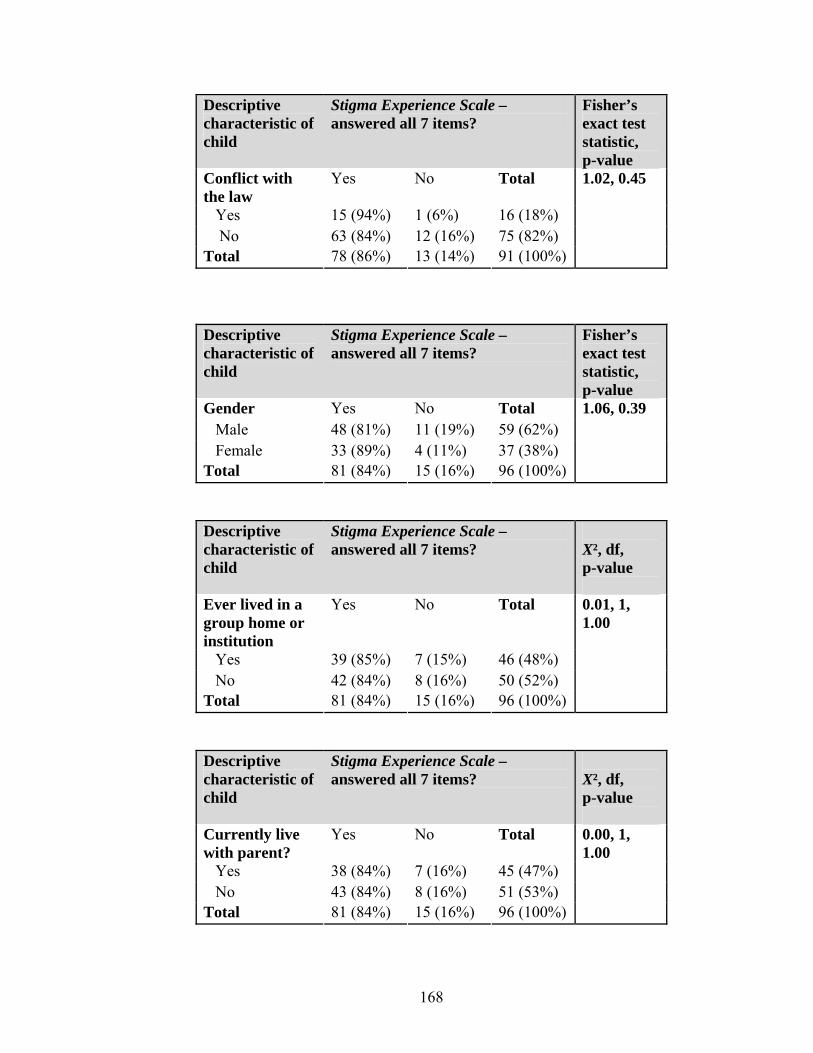
168
Descriptive characteristic of child
Stigma Experience Scale – answered all 7 items?
Fisher’s exact test statistic, p-value
Conflict with the law
Yes No Total
Yes 15 (94%) 1 (6%) 16 (18%) No 63 (84%) 12 (16%) 75 (82%) Total 78 (86%) 13 (14%) 91 (100%)
1.02, 0.45
Descriptive characteristic of child
Stigma Experience Scale – answered all 7 items?
Fisher’s exact test statistic, p-value
Gender Yes No Total Male 48 (81%) 11 (19%) 59 (62%) Female 33 (89%) 4 (11%) 37 (38%) Total 81 (84%) 15 (16%) 96 (100%)
1.06, 0.39
Descriptive characteristic of child
Stigma Experience Scale – answered all 7 items?
X², df, p-value
Ever lived in a group home or institution
Yes No Total
Yes 39 (85%) 7 (15%) 46 (48%) No 42 (84%) 8 (16%) 50 (52%) Total 81 (84%) 15 (16%) 96 (100%)
0.01, 1, 1.00
Descriptive characteristic of child
Stigma Experience Scale – answered all 7 items?
X², df, p-value
Currently live with parent?
Yes No Total
Yes 38 (84%) 7 (16%) 45 (47%) No 43 (84%) 8 (16%) 51 (53%) Total 81 (84%) 15 (16%) 96 (100%)
0.00, 1, 1.00
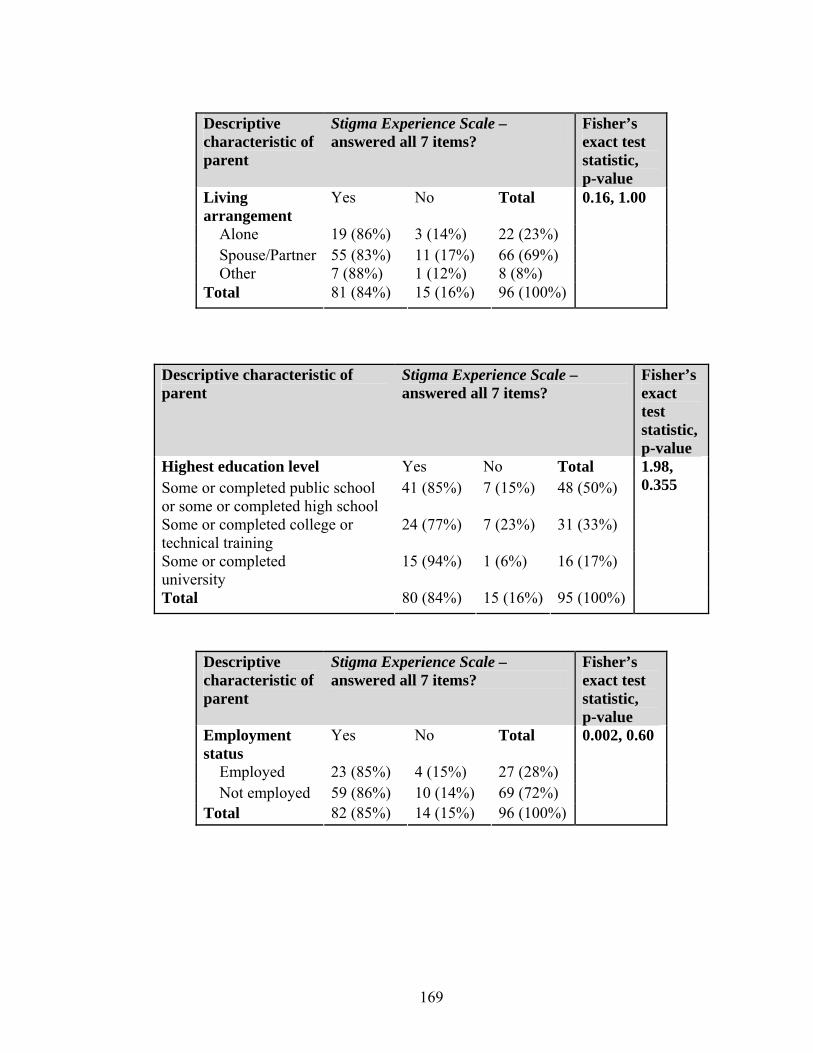
169
Descriptive characteristic of parent
Stigma Experience Scale – answered all 7 items?
Fisher’s exact test statistic, p-value
Living arrangement
Yes No Total
Alone 19 (86%) 3 (14%) 22 (23%) Spouse/Partner 55 (83%) 11 (17%) 66 (69%) Other 7 (88%) 1 (12%) 8 (8%) Total 81 (84%) 15 (16%) 96 (100%)
0.16, 1.00
Descriptive characteristic of parent
Stigma Experience Scale – answered all 7 items?
Fisher’s exact test statistic, p-value
Highest education level Yes No Total Some or completed public school or some or completed high school
41 (85%) 7 (15%) 48 (50%)
Some or completed college or technical training
24 (77%) 7 (23%) 31 (33%)
Some or completed university
15 (94%) 1 (6%) 16 (17%)
Total 80 (84%) 15 (16%) 95 (100%)
1.98, 0.355
Descriptive characteristic of parent
Stigma Experience Scale – answered all 7 items?
Fisher’s exact test statistic, p-value
Employment status
Yes No Total
Employed 23 (85%) 4 (15%) 27 (28%) Not employed 59 (86%) 10 (14%) 69 (72%) Total 82 (85%) 14 (15%) 96 (100%)
0.002, 0.60
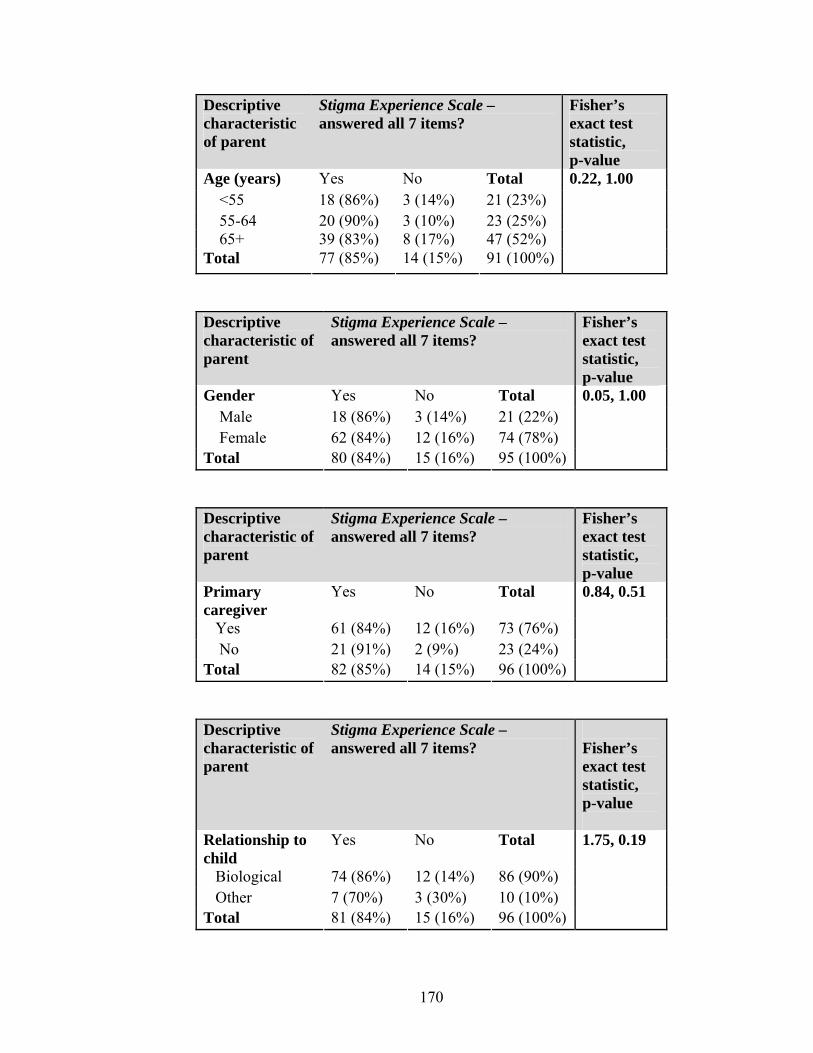
170
Descriptive characteristic of parent
Stigma Experience Scale – answered all 7 items?
Fisher’s exact test statistic, p-value
Age (years) Yes No Total <55 18 (86%) 3 (14%) 21 (23%) 55-64 20 (90%) 3 (10%) 23 (25%) 65+ 39 (83%) 8 (17%) 47 (52%) Total 77 (85%) 14 (15%) 91 (100%)
0.22, 1.00
Descriptive characteristic of parent
Stigma Experience Scale – answered all 7 items?
Fisher’s exact test statistic, p-value
Gender Yes No Total Male 18 (86%) 3 (14%) 21 (22%) Female 62 (84%) 12 (16%) 74 (78%) Total 80 (84%) 15 (16%) 95 (100%)
0.05, 1.00
Descriptive characteristic of parent
Stigma Experience Scale – answered all 7 items?
Fisher’s exact test statistic, p-value
Primary caregiver
Yes No Total
Yes 61 (84%) 12 (16%) 73 (76%) No 21 (91%) 2 (9%) 23 (24%) Total 82 (85%) 14 (15%) 96 (100%)
0.84, 0.51
Descriptive characteristic of parent
Stigma Experience Scale – answered all 7 items?
Fisher’s exact test statistic, p-value
Relationship to child
Yes No Total
Biological 74 (86%) 12 (14%) 86 (90%) Other 7 (70%) 3 (30%) 10 (10%) Total 81 (84%) 15 (16%) 96 (100%)
1.75, 0.19
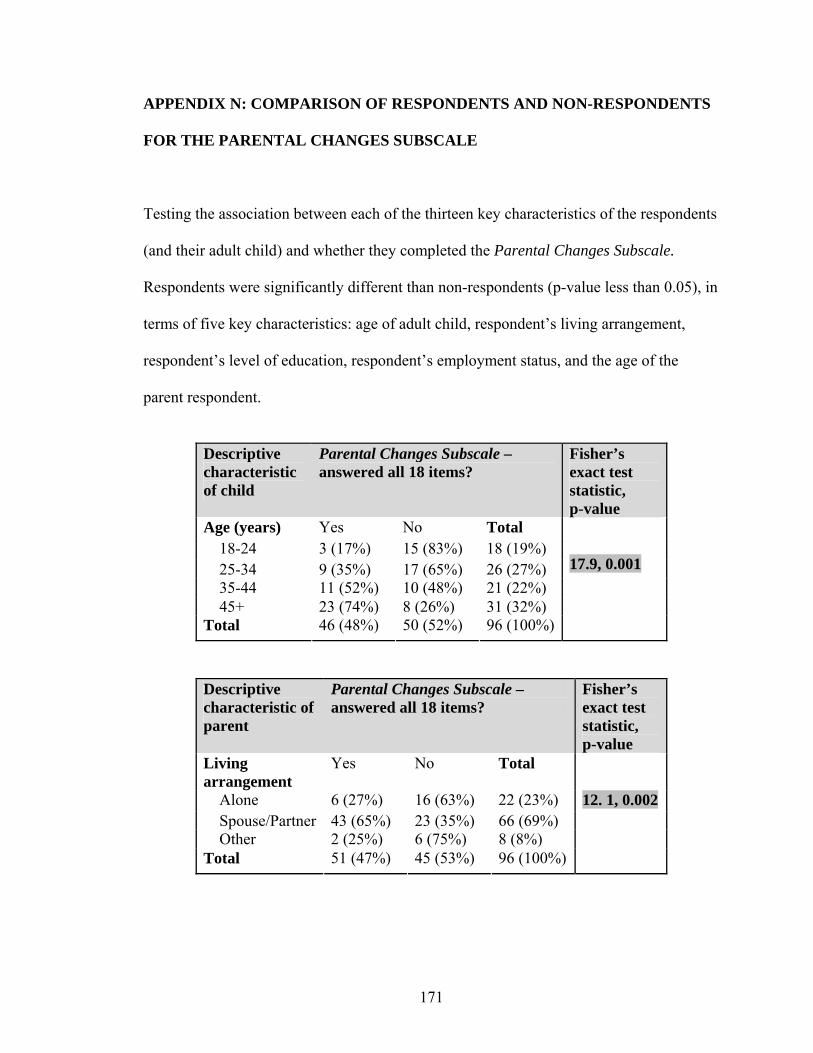
171
APPENDIX N: COMPARISON OF RESPONDENTS AND NON-RESPONDENTS
FOR THE PARENTAL CHANGES SUBSCALE
Testing the association between each of the thirteen key characteristics of the respondents
(and their adult child) and whether they completed the Parental Changes Subscale.
Respondents were significantly different than non-respondents (p-value less than 0.05), in
terms of five key characteristics: age of adult child, respondent’s living arrangement,
respondent’s level of education, respondent’s employment status, and the age of the
parent respondent.
Descriptive characteristic of child
Parental Changes Subscale – answered all 18 items?
Fisher’s exact test statistic, p-value
Age (years) Yes No Total 18-24 3 (17%) 15 (83%) 18 (19%) 25-34 9 (35%) 17 (65%) 26 (27%) 35-44 11 (52%) 10 (48%) 21 (22%) 45+ 23 (74%) 8 (26%) 31 (32%) Total 46 (48%) 50 (52%) 96 (100%)
17.9, 0.001
Descriptive characteristic of parent
Parental Changes Subscale – answered all 18 items?
Fisher’s exact test statistic, p-value
Living arrangement
Yes No Total
Alone 6 (27%) 16 (63%) 22 (23%) Spouse/Partner 43 (65%) 23 (35%) 66 (69%) Other 2 (25%) 6 (75%) 8 (8%) Total 51 (47%) 45 (53%) 96 (100%)
12. 1, 0.002
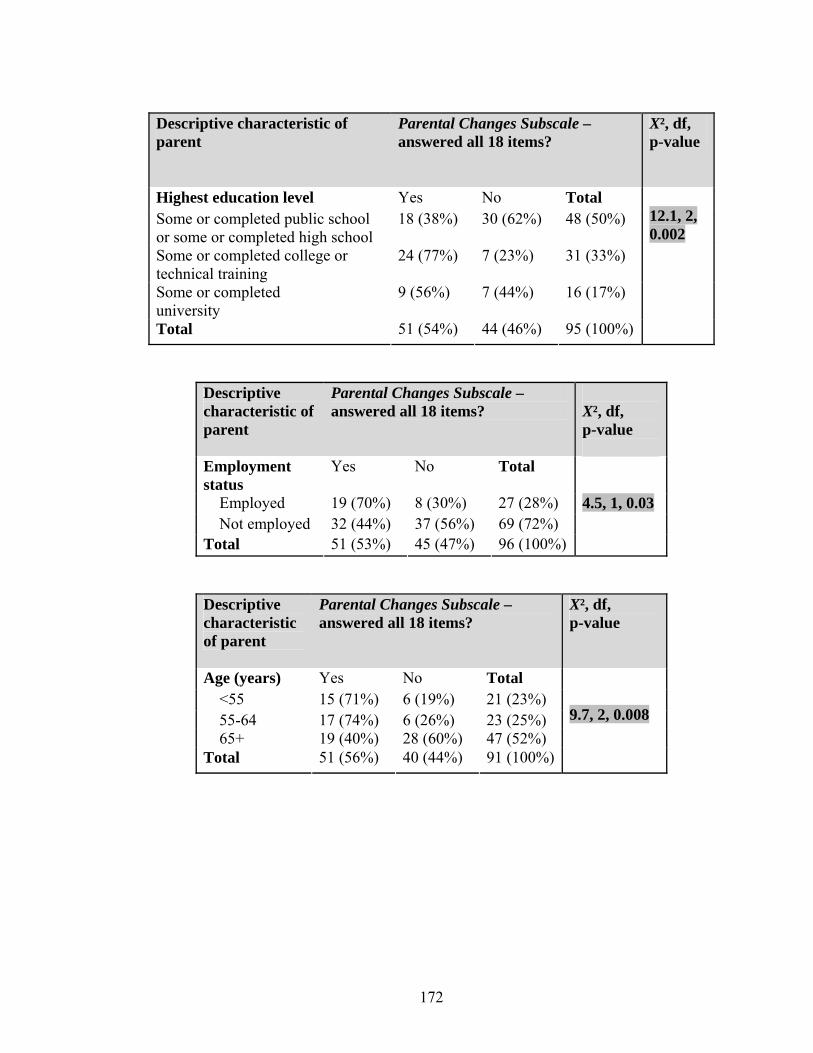
172
Descriptive characteristic of parent
Parental Changes Subscale – answered all 18 items?
X², df, p-value
Highest education level Yes No Total Some or completed public school or some or completed high school
18 (38%) 30 (62%) 48 (50%)
Some or completed college or technical training
24 (77%) 7 (23%) 31 (33%)
Some or completed university
9 (56%) 7 (44%) 16 (17%)
Total 51 (54%) 44 (46%) 95 (100%)
12.1, 2, 0.002
Descriptive characteristic of parent
Parental Changes Subscale – answered all 18 items?
X², df, p-value
Employment status
Yes No Total
Employed 19 (70%) 8 (30%) 27 (28%) Not employed 32 (44%) 37 (56%) 69 (72%) Total 51 (53%) 45 (47%) 96 (100%)
4.5, 1, 0.03
Descriptive characteristic of parent
Parental Changes Subscale – answered all 18 items?
X², df, p-value
Age (years) Yes No Total <55 15 (71%) 6 (19%) 21 (23%) 55-64 17 (74%) 6 (26%) 23 (25%) 65+ 19 (40%) 28 (60%) 47 (52%) Total 51 (56%) 40 (44%) 91 (100%)
9.7, 2, 0.008
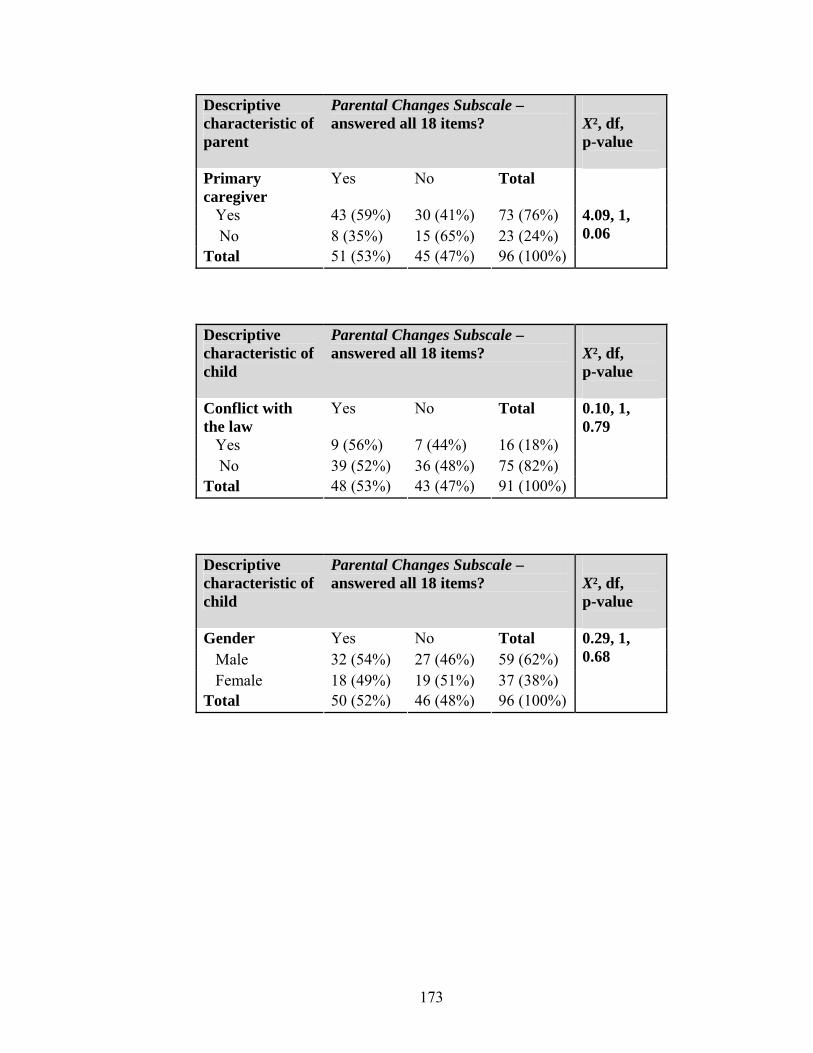
173
Descriptive characteristic of parent
Parental Changes Subscale – answered all 18 items?
X², df, p-value
Primary caregiver
Yes No Total
Yes 43 (59%) 30 (41%) 73 (76%) No 8 (35%) 15 (65%) 23 (24%) Total 51 (53%) 45 (47%) 96 (100%)
4.09, 1, 0.06
Descriptive characteristic of child
Parental Changes Subscale – answered all 18 items?
X², df, p-value
Conflict with the law
Yes No Total
Yes 9 (56%) 7 (44%) 16 (18%) No 39 (52%) 36 (48%) 75 (82%) Total 48 (53%) 43 (47%) 91 (100%)
0.10, 1, 0.79
Descriptive characteristic of child
Parental Changes Subscale – answered all 18 items?
X², df, p-value
Gender Yes No Total Male 32 (54%) 27 (46%) 59 (62%) Female 18 (49%) 19 (51%) 37 (38%) Total 50 (52%) 46 (48%) 96 (100%)
0.29, 1, 0.68

174
Descriptive characteristic of child
Parental Changes Subscale – answered all 18 items?
X², df, p-value
Ever lived in a group home or institution
Yes No Total
Yes 21 (46%) 25 (54%) 46 (48%) No 29 (58%) 21 (46%) 50 (52%) Total 50 (52%) 46 (48%) 96 (100%)
1.46, 1, 0.31
Descriptive characteristic of child
Parental Changes Subscale – answered all 18 items?
X², df, p-value
Currently live with parent?
Yes No Total
Yes 28 (62%) 17 (38%) 45 (47%) No 22 (43%) 29 (57%) 51 (53%) Total 50 (52%) 46 (48%) 96 (100%)
3.49, 1, 0.07
Descriptive characteristic of child
Parental Changes Subscale – answered all 18 items?
X², df, p-value
Dual Diagnosis
Yes No Total
Yes 18 (56%) 14 (44%) 32 (33%) No 33 (51%) 32 (49%) 65 (67%) Total 51 (53%) 46 (47%) 97 (100%)
0.26, 1, 0.61
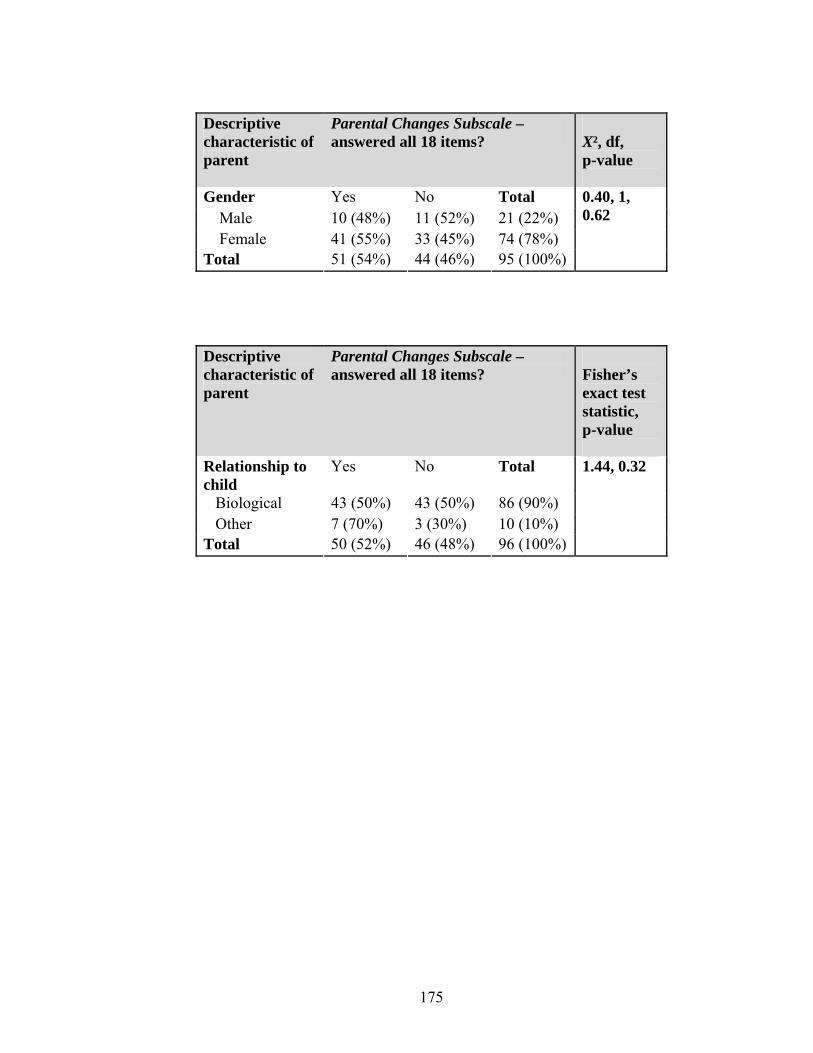
175
Descriptive characteristic of parent
Parental Changes Subscale – answered all 18 items?
X², df, p-value
Gender Yes No Total Male 10 (48%) 11 (52%) 21 (22%) Female 41 (55%) 33 (45%) 74 (78%) Total 51 (54%) 44 (46%) 95 (100%)
0.40, 1, 0.62
Descriptive characteristic of parent
Parental Changes Subscale – answered all 18 items?
Fisher’s exact test statistic, p-value
Relationship to child
Yes No Total
Biological 43 (50%) 43 (50%) 86 (90%) Other 7 (70%) 3 (30%) 10 (10%) Total 50 (52%) 46 (48%) 96 (100%)
1.44, 0.32

![[XLS] 1a... · Web viewA.K. Choudhary W/C/201005/95 Vikram Narula W/C/201005/96 Shrinarayan Dwivedi Ic ANAND RATHI SHARE & STOCK BROKERS LTD. W/C/201005/97 Subhashree Nayak W/C/201005/98](https://img.pdfslide.net/doc/110x75/5ad818297f8b9ab8378cebdc/xls-1aweb-viewak-choudhary-wc20100595-vikram-narula-wc20100596-shrinarayan.jpg)