Embed Size (px)
Citation preview

Sarma (NDR) Nuthalapati, PhD
Research ScientistTexas A&M University, College Station, TX
Control Room Solutions Task Team
NASPI Work Group meeting and first International Synchrophasor Symposium,
March 22-24, 2016, Atlanta, GA
SYNCHROPHASOR TECHNOLOGY –
PMU USE CASE EXAMPLES

Control Room Solutions Task Team
NASPI Work Group meeting and first International Synchrophasor Symposium,
March 22-24, 2016, Atlanta, GA
SYNCHROPHASOR TECHNOLOGY –
PMU USE CASE EXAMPLES
Source: https://www.smartgrid.gov/files/CCET-SGDP-FTR_Feb_2015.pdf

3
WHAT IS A VOLTAGE PHASOR ?
4
SYNCHROPHASOR TECHNOLOGY – PMU USE CASE EXAMPLES
John W Ballance - EPG
Prashant C Palayam – EPG
Sarma (NDR) Nuthapalati - ERCOT
November 5, 2014Prepared for CCET DAT Synchrophasor Team
5
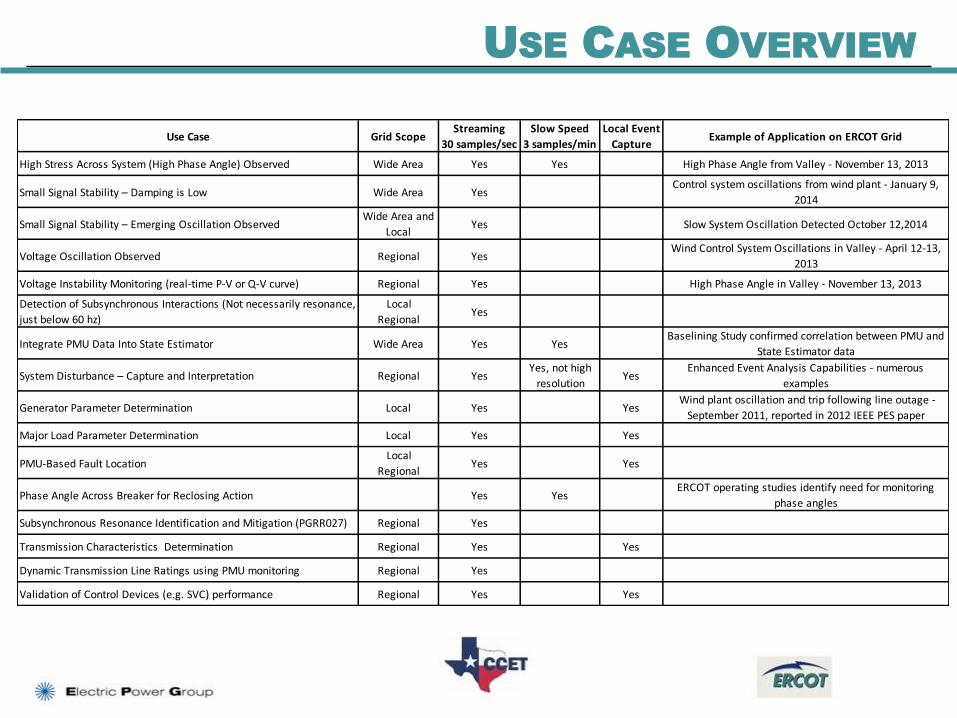
USE CASE OVERVIEW
Use Case Grid ScopeStreaming
30 samples/sec
Slow Speed
3 samples/min
Local Event
CaptureExample of Application on ERCOT Grid
High Stress Across System (High Phase Angle) Observed Wide Area Yes Yes High Phase Angle from Valley - November 13, 2013
Small Signal Stability – Damping is Low Wide Area YesControl system oscillations from wind plant - January 9,
2014
Small Signal Stability – Emerging Oscillation ObservedWide Area and
LocalYes Slow System Oscillation Detected October 12,2014
Voltage Oscillation Observed Regional YesWind Control System Oscillations in Valley - April 12-13,
2013
Voltage Instability Monitoring (real-time P-V or Q-V curve) Regional Yes High Phase Angle in Valley - November 13, 2013
Detection of Subsynchronous Interactions (Not necessarily resonance,
just below 60 hz)
Local
RegionalYes
Integrate PMU Data Into State Estimator Wide Area Yes YesBaselining Study confirmed correlation between PMU and
State Estimator data
System Disturbance – Capture and Interpretation Regional YesYes, not high
resolutionYes
Enhanced Event Analysis Capabilities - numerous
examples
Generator Parameter Determination Local Yes Yes Wind plant oscillation and trip following line outage -
September 2011, reported in 2012 IEEE PES paper
Major Load Parameter Determination Local Yes Yes
PMU-Based Fault LocationLocal
RegionalYes Yes
Phase Angle Across Breaker for Reclosing Action Yes YesERCOT operating studies identify need for monitoring
phase angles
Subsynchronous Resonance Identification and Mitigation (PGRR027) Regional Yes
Transmission Characteristics Determination Regional Yes Yes
Dynamic Transmission Line Ratings using PMU monitoring Regional Yes
Validation of Control Devices (e.g. SVC) performance Regional Yes Yes
6
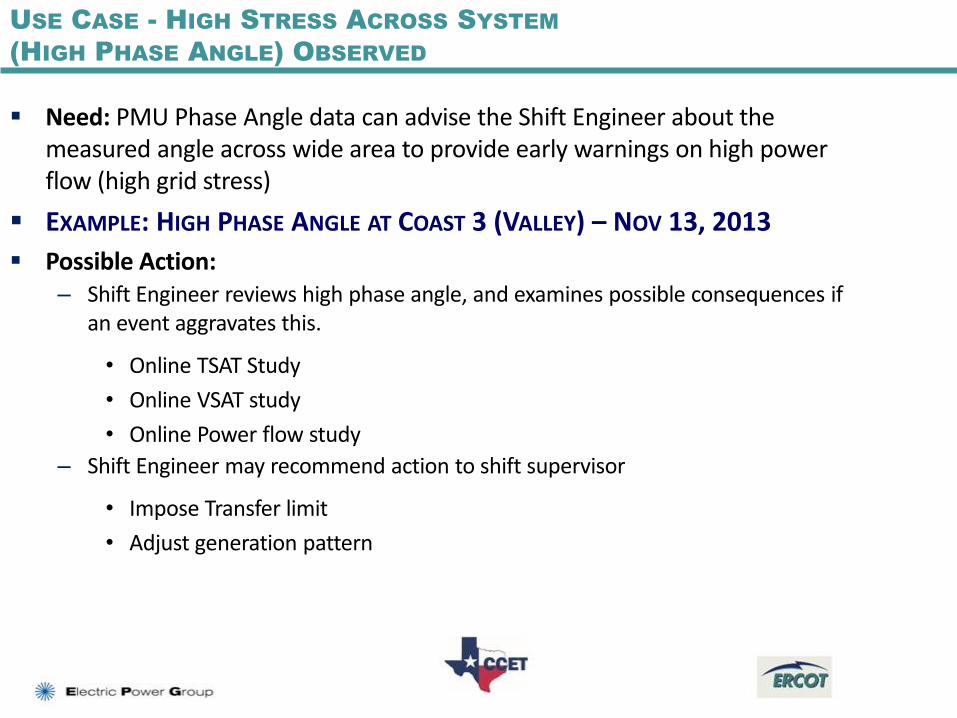
USE CASE - HIGH STRESS ACROSS SYSTEM
(HIGH PHASE ANGLE) OBSERVED
Need: PMU Phase Angle data can advise the Shift Engineer about the measured angle across wide area to provide early warnings on high power flow (high grid stress)
EXAMPLE: HIGH PHASE ANGLE AT COAST 3 (VALLEY) – NOV 13, 2013
Possible Action: – Shift Engineer reviews high phase angle, and examines possible consequences if
an event aggravates this.
• Online TSAT Study
• Online VSAT study
• Online Power flow study
– Shift Engineer may recommend action to shift supervisor
• Impose Transfer limit
• Adjust generation pattern

7
EVENT ANALYSIS – IMPACT OF HIGH WIND ON SYSTEM
PERFORMANCE FOLLOWING WIND RAMP

8
USE CASE - SMALL SIGNAL STABILITY –
LOW DAMPING
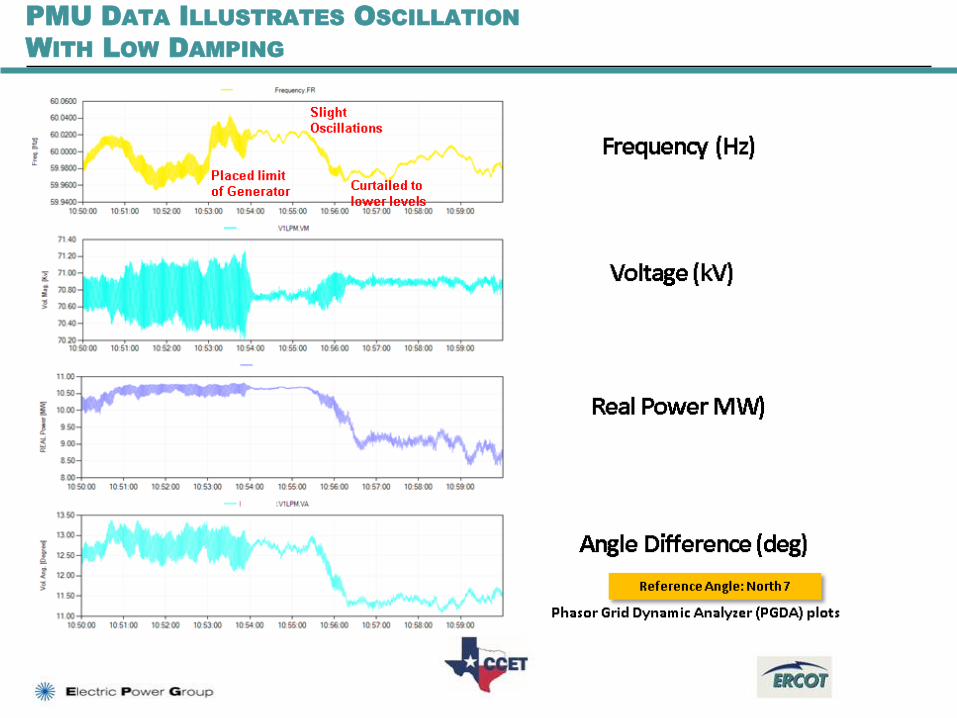
Need: PMU data can advise the Shift Engineer about both known & unknown oscillations at location/s
EXAMPLE: CONTROL SYSTEM OSCILLATIONS FROM WIND PLANT – JANUARY 9, 2014
Possible Action: – Shift engineer should review
• Oscillatory frequency & damping
• Determine type of oscillation (inter-area such as 0.6Hz North-South Mode, Local Control system such as 3.2Hz at West 10)
– Shift Engineer may recommend action to shift supervisor
• Reduce Transfer out of area
• Reduce generation output
• Revert control system settings to original value & restore output
9
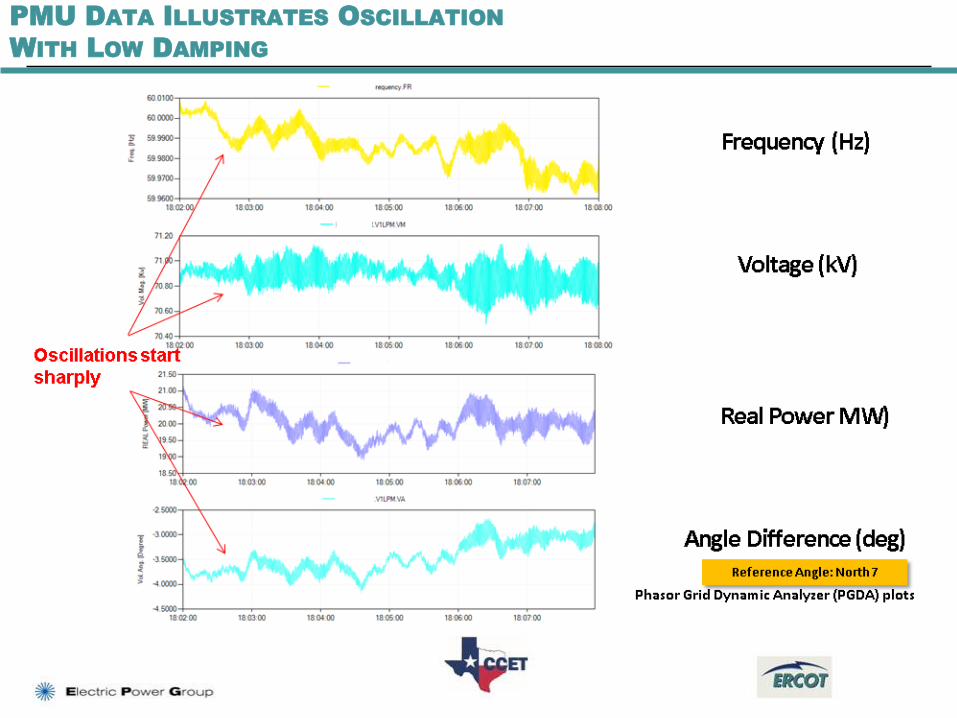
PMU DATA ILLUSTRATES OSCILLATION
WITH LOW DAMPING
10
PMU DATA ILLUSTRATES OSCILLATION
WITH LOW DAMPING

11
USE CASE - SMALL SIGNAL STABILITY –
EMERGING OSCILLATION OBSERVED
• Need: PMU data can advise the Shift Engineer about both known & unknown oscillations at location/s
• EXAMPLE: SYSTEM-WIDE OSCILLATIONS FOLLOWING LOSS OF
GENERATION – OCTOBER 12, 2014
• Possible Action:
– Shift engineer should review
• Oscillatory frequency & damping
• Determine type of oscillation (e.g. inter-area such as 0.6Hz North-South Mode or Local Control system such as 3.2Hz at West 10)
– Shift Engineer may recommend action to shift supervisor
• Reduce Transfer out of area
• Reduce generation output
• Block control system (to eliminate control system-driven oscillations)

12
PMU DATA ILLUSTRATES EMERGING OSCILLATION
13
USE CASE - VOLTAGE OSCILLATION OBSERVED
Need: PMU Voltage Phasor can advise the Shift Engineer about the voltage oscillations at location/s due to fast voltage controllers at wind generators and other control devices in the grid
EXAMPLE: VOLTAGE CONTROL OSCILLATIONS FROM NEARBY WIND PLANT –APRIL 12-13, 2013
Possible Action:
– Shift engineer should review location for possible causes
• Low strength area (weak grid or low circuit ratio)
• Incorrect settings on voltage controllers/voltage regulators
– Shift Engineer may recommend action to shift supervisor
• Reduce Transfer out of area
• Reduce generation output
• Restore outages

14
NEARBY PMU DETECTS VOLTAGE OSCILLATION
Voltage
Current
Frequency
Screenshots of PGDA (Phasor Grid Dynamics Analyzer)
Oscillation increased sharply

15
NEARBY PMU DETECTS VOLTAGE OSCILLATION
Current
VoltageOscillation ended abruptly
Screenshots of PGDA (Phasor Grid Dynamics Analyzer)

16
USE CASE - VOLTAGE INSTABILITY MONITORING (P-V, Q-V)
Need: PMU data (Real, Reactive Power & Voltage) can advise the Shift Engineer indirectly on high grid stress under low voltage deteriorating conditions
EXAMPLE: HIGH PHASE ANGLE AT COAST 3 (VALLEY) – NOV 13, 2013
Possible Action: – Shift Engineer reviews P-V performance, compares to online VSAT study
– Shift Engineer may recommend action to shift supervisor
• Impose Transfer limit
• Adjust generation pattern
– Operations planning studies and benchmarking will be required to identify critical substations for voltage instability monitoring

17
PMU DATA ILLUSTRATES VOLTAGE STRESS
DURING POWER RAMP

18
PMU DATA ILLUSTRATES VOLTAGE STRESS
DURING POWER RAMP
11.05.2014Page 18
19
USE CASE - VALIDATE STATE ESTIMATOR RESULTS USED IN CONTROL
ROOMS
Need: PMU Phase Angles can used to validate the state estimator results used in control rooms (locates differences which reflects anomalies in models used for state estimation)
EXAMPLE: BASELINING STUDIES
Possible Action:
– Identify the root cause for the mismatch and update models
11.05.2014Page 19

20
PMU DATA VS SE DATA COMPARISON
21
USE CASE - SYSTEM DISTURBANCE –
CAUSE & INTERPRETATION
Need: PMU data is useful for event analysis and determine root cause of the event and its location.
EXAMPLE: EVENT SIGNATURES OF GENERATION TRIP, LINE TRIP & OSCILLATIONS
Possible Action:
– Shift Engineer reviews network performance, including frequency dip and recovery, voltage dip and recovery, power dip (and phase angle) and recovery, and any transient oscillations and the associated ring-down characteristics
– If recovery looks slow, refers to Advanced Network Applications expert or System Planning dynamics expert to determine if some action is recommended or for further review
– If frequency, voltage, or power (and phase angle) dip looks too large or too small, or does not return to expected levels, refer to Advanced Network Applications expert or System Planning dynamics expert to investigate the reasons for abnormal grid responsiveness
– Frequency response and/or transient voltage response of generation (including wind, solar, and conventional generation) should be monitored for compliance with standards
– Should include an automatic reporting capability, providing a high-level review of the network performance
22
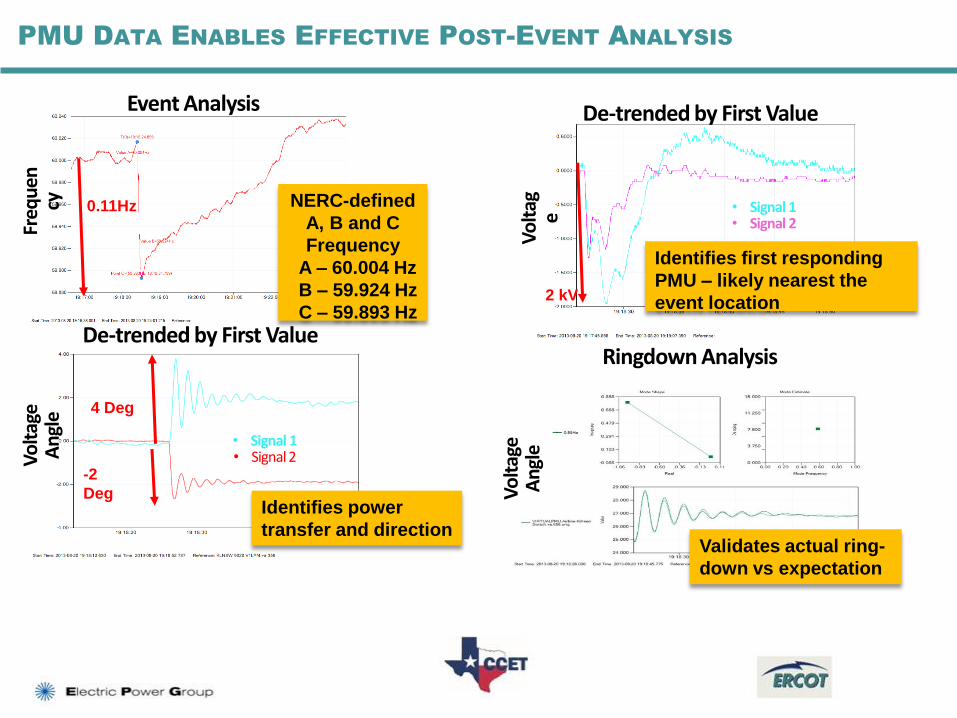
PMU DATA ENABLES EFFECTIVE POST-EVENT ANALYSIS
Event Analysis
0.11Hz NERC-defined
A, B and C
Frequency
A – 60.004 Hz
B – 59.924 Hz
C – 59.893 Hz
Freq
uen
cy
De-trended by First Value
2 kV
Identifies first responding
PMU – likely nearest the
event location
• Signal 1• Signal 2
Vo
ltag
e
Ringdown Analysis
Vo
ltag
e A
ngl
e Validates actual ring-
down vs expectation
De-trended by First Value
4 Deg
-2
DegIdentifies power
transfer and direction
• Signal 1• Signal 2V
olt
age
An
gle
PGDA used for analysis

23
PMU DATA ENABLES EFFECTIVE POST-EVENT ANALYSIS – POWER
LOAD UNBALANCE CIRCUIT EXAMPLE

24
EVENT ANALYSIS - SYSTEM CONDITION

25
EVENT ANALYSIS - FAULT

26
EVENT ANALYSIS - DESCRIPTION

27
EVENT ANALYSIS - LESSONS LEARNED

28
USE CASE - GENERATOR PARAMETER DETERMINATION
Need: PMU data (Voltage Phasor, P & Q) can advise generator dynamic response following a nearby transient, compares results to simulated response (based on system planning models), and alerts if differences are significant (meaning that the generator response to the transient event was different from what was expected)
EXAMPLE: PMU DATA USED TO VALIDATE AND CALIBRATE GENERATOR MODELS
Possible Action: – Advance Network Applications expert or System Planning dynamics expert reviews the event
and the generator response differences, and if necessary, triggers the capture of the current grid state for further study
– System Planning dynamics expert coordinates with generator owner to investigate the reasons for unexpected generator response
– System Planning – Dynamics Working Group utilizes the apparent unit parameters and system response data to tune/benchmark the dynamic model associated with the unit in the ERCOT DWG dynamic dataset
29
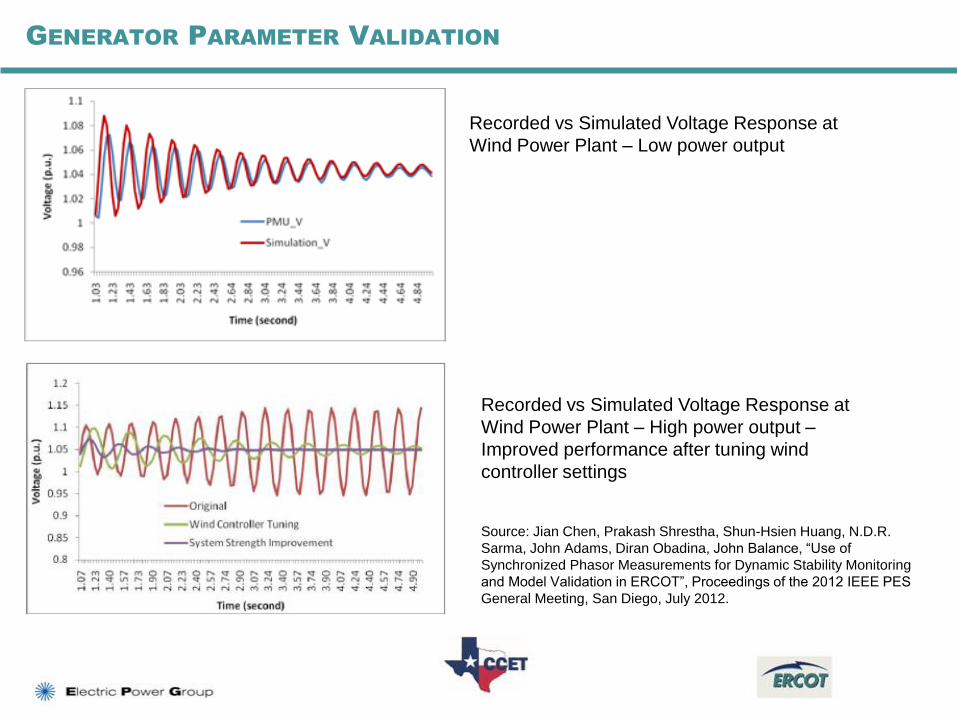
GENERATOR PARAMETER VALIDATION
Recorded vs Simulated Voltage Response at
Wind Power Plant – Low power output
Recorded vs Simulated Voltage Response at
Wind Power Plant – High power output –
Improved performance after tuning wind
controller settings
Source: Jian Chen, Prakash Shrestha, Shun-Hsien Huang, N.D.R.
Sarma, John Adams, Diran Obadina, John Balance, “Use of
Synchronized Phasor Measurements for Dynamic Stability Monitoring
and Model Validation in ERCOT”, Proceedings of the 2012 IEEE PES
General Meeting, San Diego, July 2012.

30
USE CASE - PHASE ANGLE ACROSS BREAKER FOR RECLOSING ACTION
Page 3011.05.2014
Need: PMU data is useful during an event to identify stress across system, and validate safe restoration actions
EXAMPLE: HIGH PHASE ANGLE ACROSS BREAKER
Possible Action:
– Shift Engineer reviews PMU voltage phase angle differences between substations (with breaker open between them)
– If voltage phase angle difference is within safe breaker reclosing limits, proceed with planned restoration of lines
– If voltage phase angle difference looks too large, refer to Advanced Network Applications expert or System Planning dynamics expert to identify mitigation actions needed to reduce phase angle to within limits for restoration

31
PHASE ANGLE ACROSS OPEN BREAKER - EXAMPLE
Example: With a Safe Closing Angle of
30°, West Region Wind Generation
would have to be reduced below 2900
MW to reclose this open circuit breaker

32
QUESTIONS