Embed Size (px)
Citation preview
1
Biotechnology Division
June 7, 2006
Sartobind® Membrane AdsorbersOverview and News
Dr. Stefan Fischer-FrühholzProduct Manager Membrane AdsorbersPurification Technologies
2
Biotechnology Division
Overview
1. Membrane Adsorber technology1. Membrane Adsorber technology
2. Membrane products for laboratory and production2. Membrane products for laboratory and production
3. Applications production3. Applications production
3
Biotechnology Division
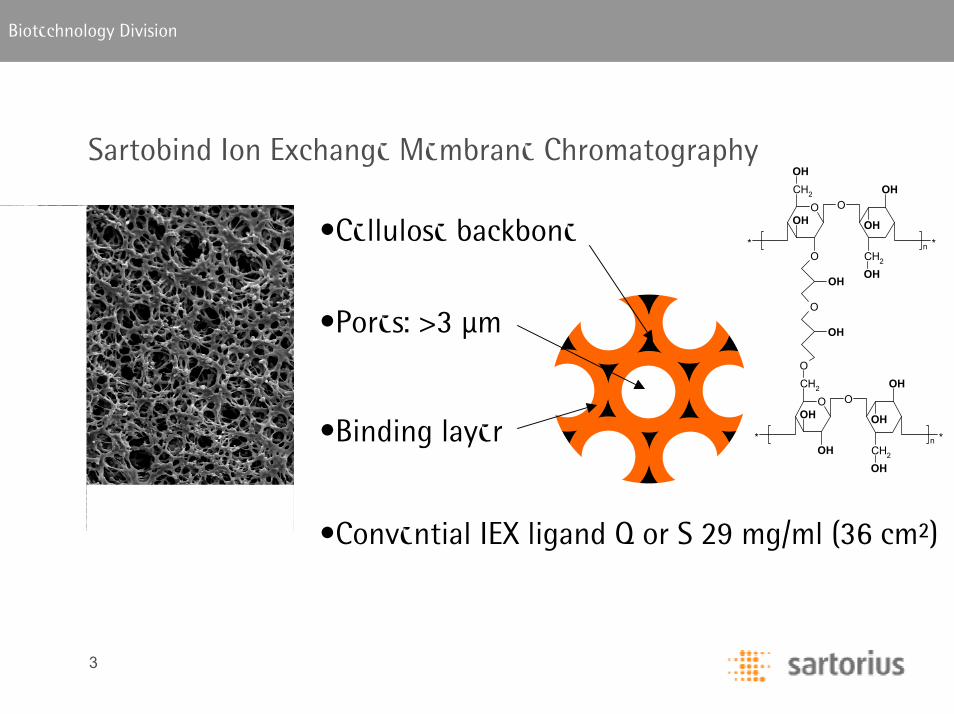
Sartobind Ion Exchange Membrane Chromatography
•Convential IEX ligand Q or S 29 mg/ml (36 cm²)
•Binding layer
•Pores: >3 µm
•Cellulose backbone
O
CH2
OH
OH
O
OH
CH2
* *n
OH
OHO
O
CH2
OH
O
O
OH
OH
CH2
* *n
OH
OHOH
O
OH
4
Biotechnology Division
5
Biotechnology Division
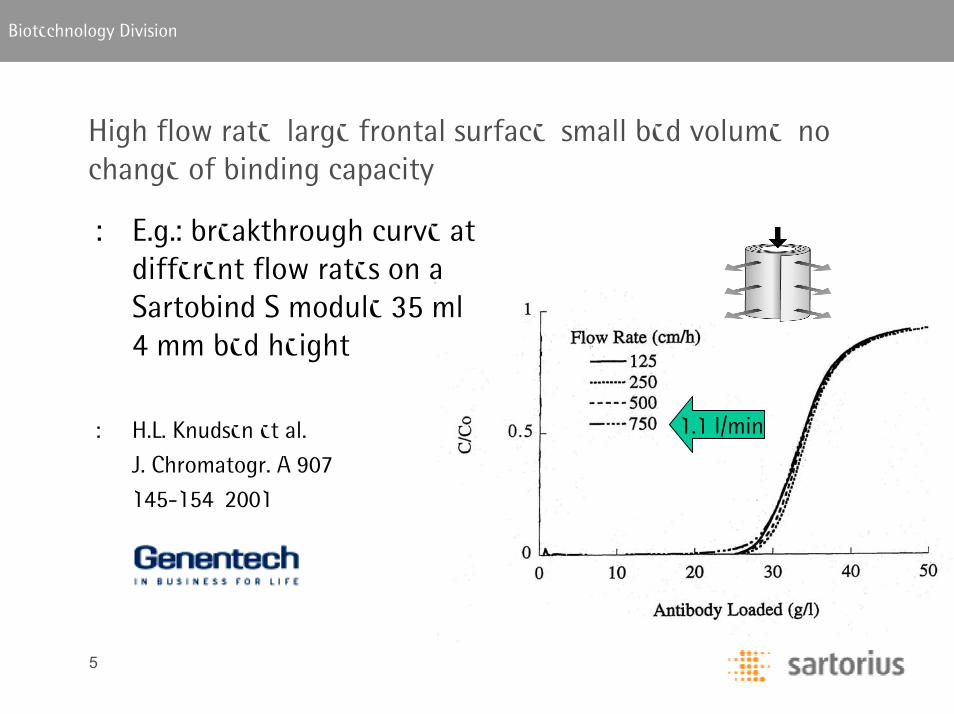
High flow rate, large frontal surface, small bed volume, no change of binding capacity
: E.g.: breakthrough curve at different flow rates on a Sartobind S module 35 ml, 4 mm bed height
: H.L. Knudsen et al.,
J. Chromatogr. A 907
145-154, 2001
1.1 l/min
6
Biotechnology Division
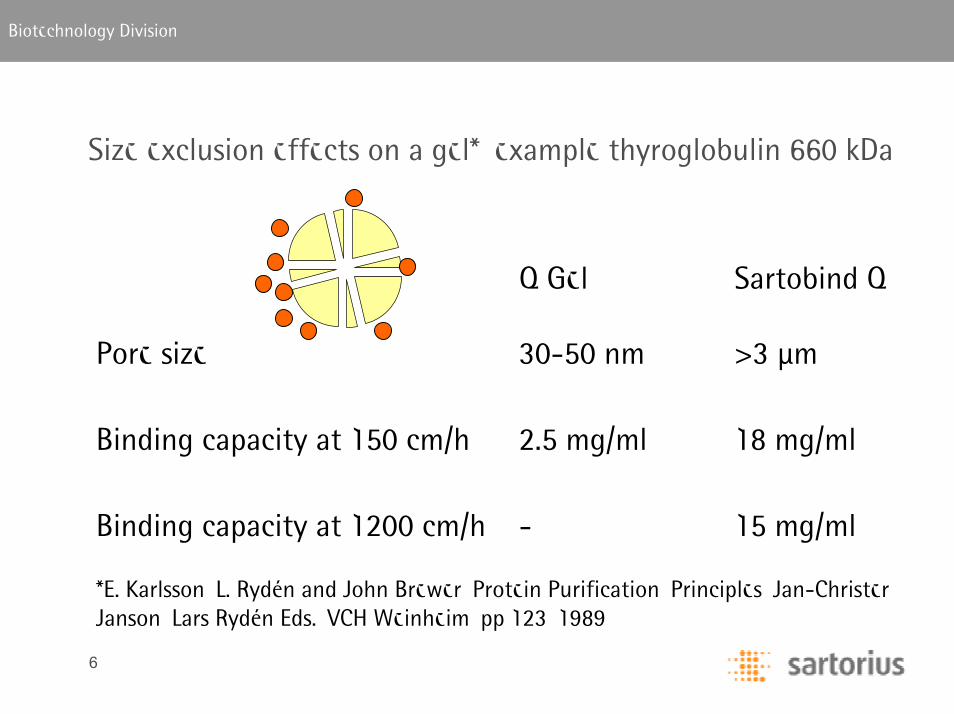
Size exclusion effects on a gel*, example thyroglobulin 660 kDa
Sartobind QQ Gel
15 mg/ml-Binding capacity at 1200 cm/h
Binding capacity at 150 cm/h
Pore size
18 mg/ml2.5 mg/ml
>3 µm30-50 nm
*E. Karlsson, L. Rydén and John Brewer, Protein Purification, Principles, Jan-Christer Janson, Lars Rydén Eds., VCH Weinheim, pp 123, 1989
7
Biotechnology Division
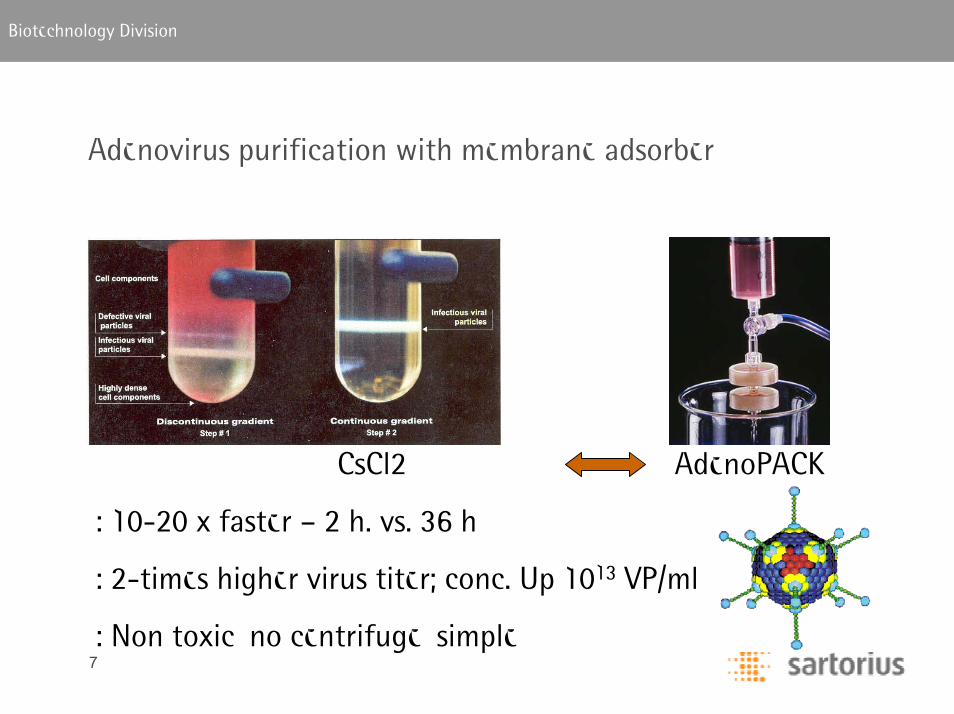
Adenovirus purification with membrane adsorber
CsCl2 AdenoPACK
: 10-20 x faster – 2 h. vs. 36 h
: 2-times higher virus titer; conc. Up 1013 VP/ml
: Non toxic, no centrifuge, simple
8
Biotechnology Division
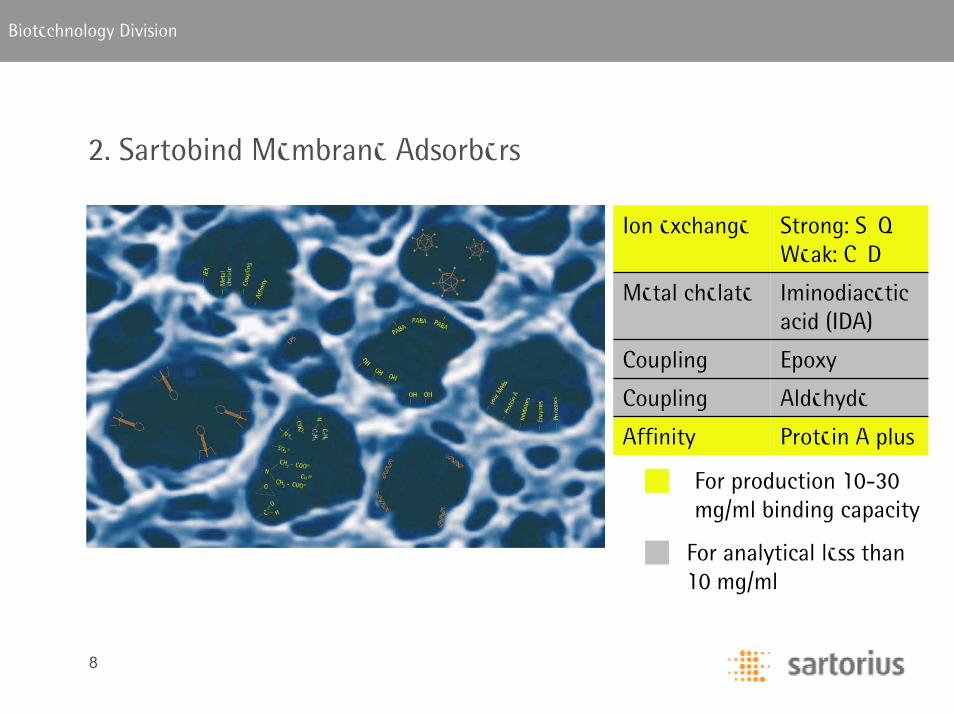
2. Sartobind Membrane Adsorbers
Affinity
Coupling
Coupling
Metal chelate
Ion exchange
Protein A plus
Aldehyde
Epoxy
Iminodiacetic acid (IDA)
Strong: S, Q Weak: C, D
For production 10-30 mg/ml binding capacity
For analytical less than 10 mg/ml
9
Biotechnology Division
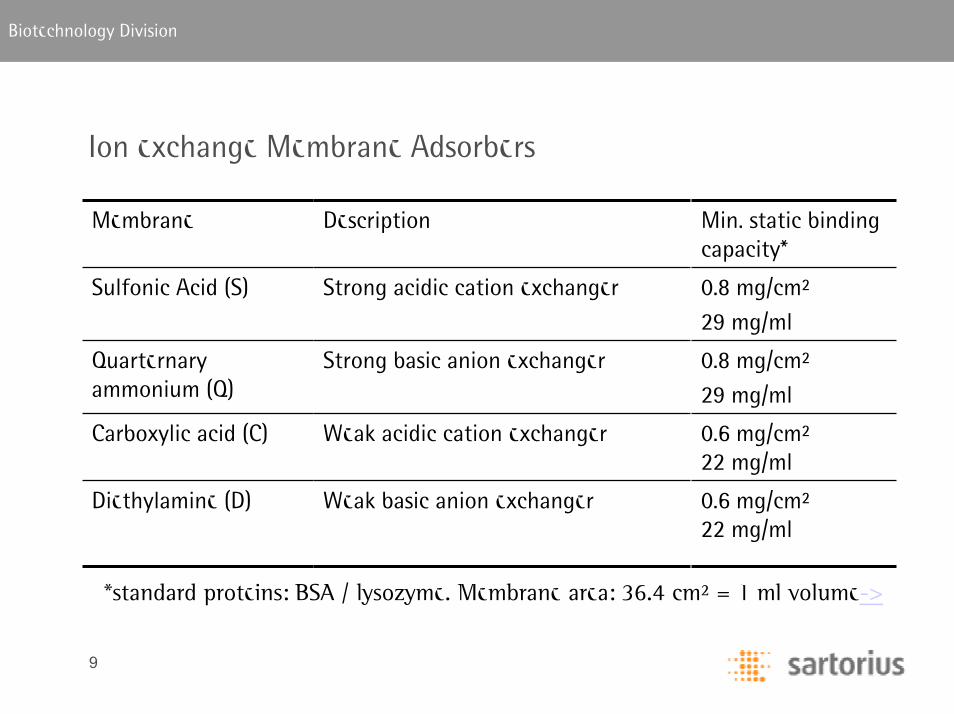
Ion exchange Membrane Adsorbers
Weak basic anion exchanger
Weak acidic cation exchanger
Strong basic anion exchanger
Strong acidic cation exchanger
Description
0.6 mg/cm²22 mg/ml
0.6 mg/cm²22 mg/ml
0.8 mg/cm²
29 mg/ml
0.8 mg/cm²
29 mg/ml
Min. static bindingcapacity*
Diethylamine (D)
Carboxylic acid (C)
Quarternaryammonium (Q)
Sulfonic Acid (S)
Membrane
*standard proteins: BSA / lysozyme. Membrane area: 36.4 cm² = 1 ml volume->
10
Biotechnology Division
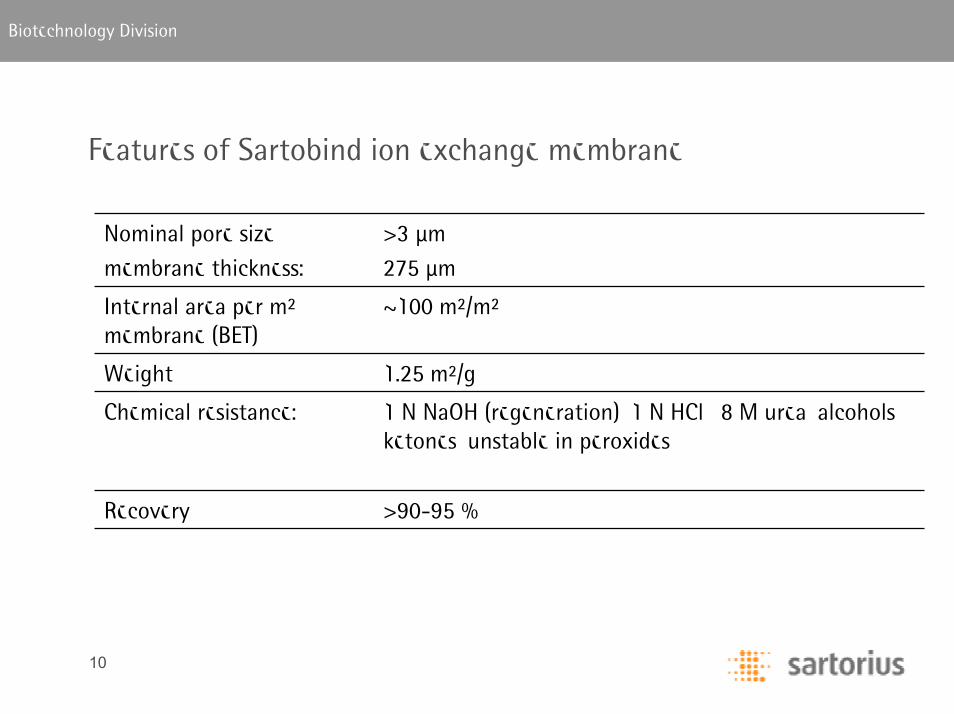
Features of Sartobind ion exchange membrane
>90-95 %Recovery
Chemical resistance:
Weight
Internal area per m²membrane (BET)
Nominal pore size
membrane thickness:
1 N NaOH (regeneration), 1 N HCl , 8 M urea, alcohols, ketones, unstable in peroxides
1.25 m²/g
>3 µm
275 µm
~100 m²/m²
11
Biotechnology Division
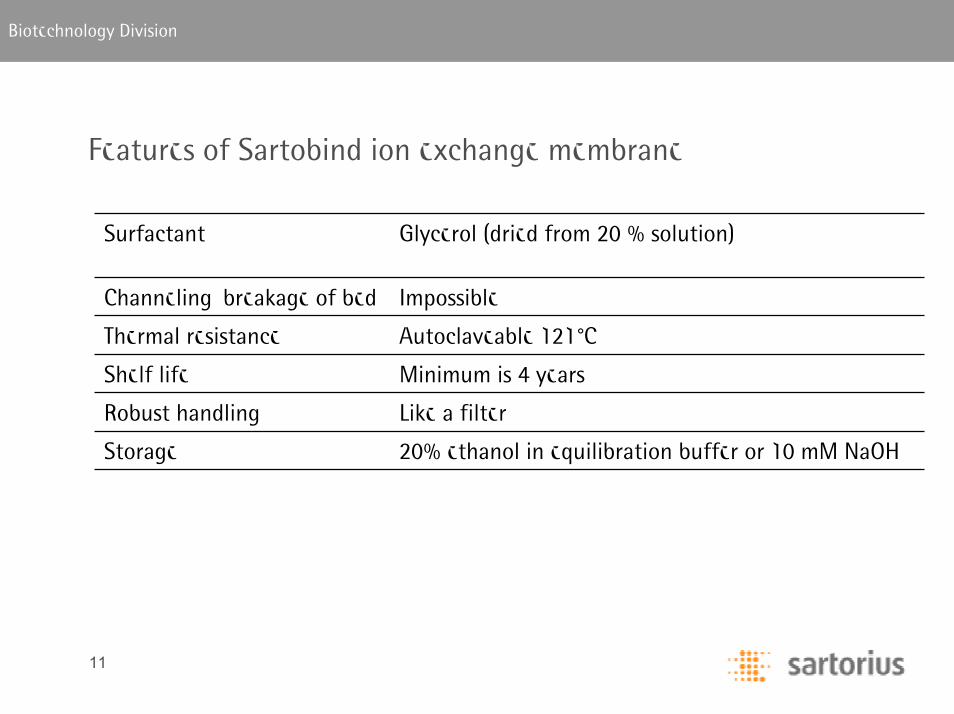
Features of Sartobind ion exchange membrane
20% ethanol in equilibration buffer or 10 mM NaOHStorage
Like a filterRobust handling
Minimum is 4 yearsShelf life
Autoclaveable 121°C Thermal resistance
Channeling, breakage of bed
Surfactant
Impossible
Glycerol (dried from 20 % solution)

12
Biotechnology Division
Lineare pressure flow relation over a wide range: E.g.:15 membrane layers 4 mm bed height
Flow vs. pressure of Q 75 with 10 mM KPi pH 7
0
20
40
60
80
100
120
0 1 2 3 4 5 6Pressure [bar]
Flow
[m
l/m
in]
13
Biotechnology Division
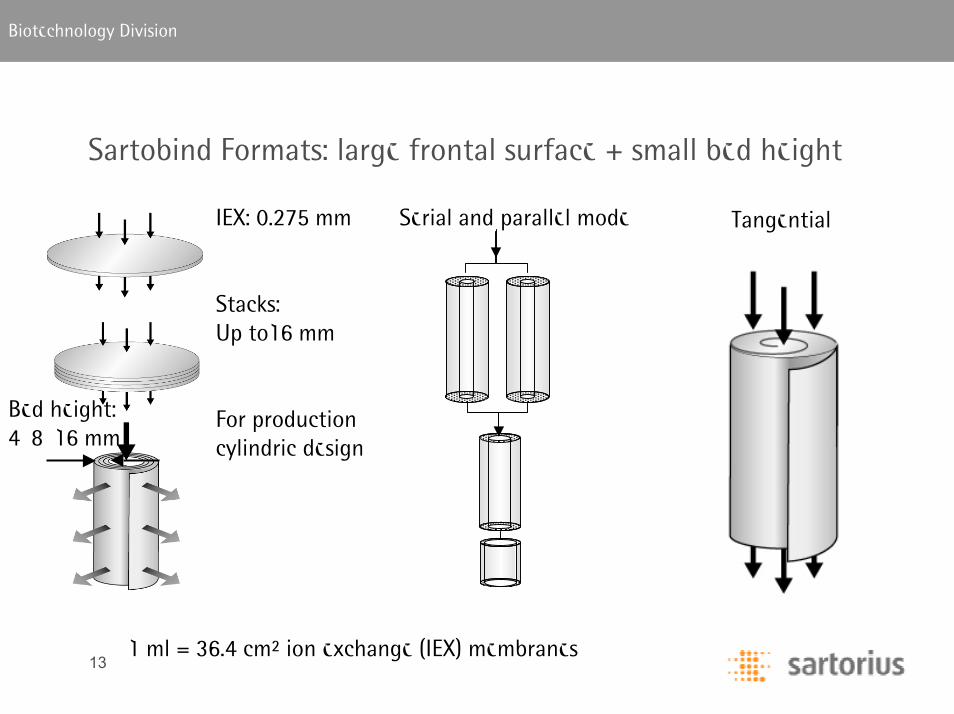
Sartobind Formats: large frontal surface + small bed height
IEX: 0.275 mm
Stacks: Up to16 mm
For production cylindric design
TangentialSerial and parallel mode
Bed height: 4, 8, 16 mm
1 ml = 36.4 cm² ion exchange (IEX) membranes
14
Biotechnology Division
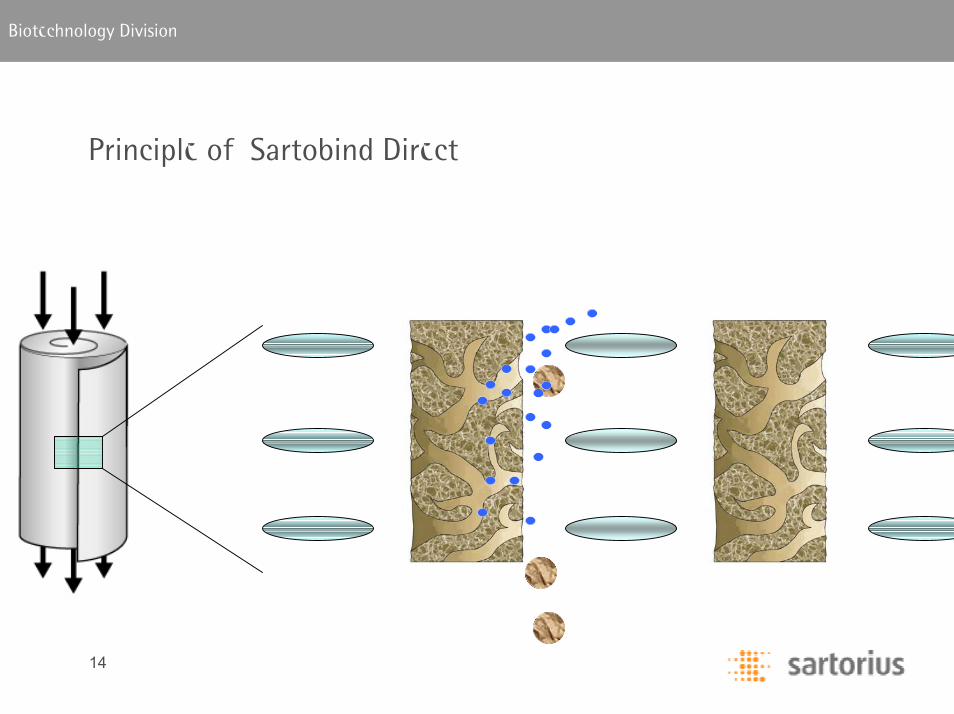
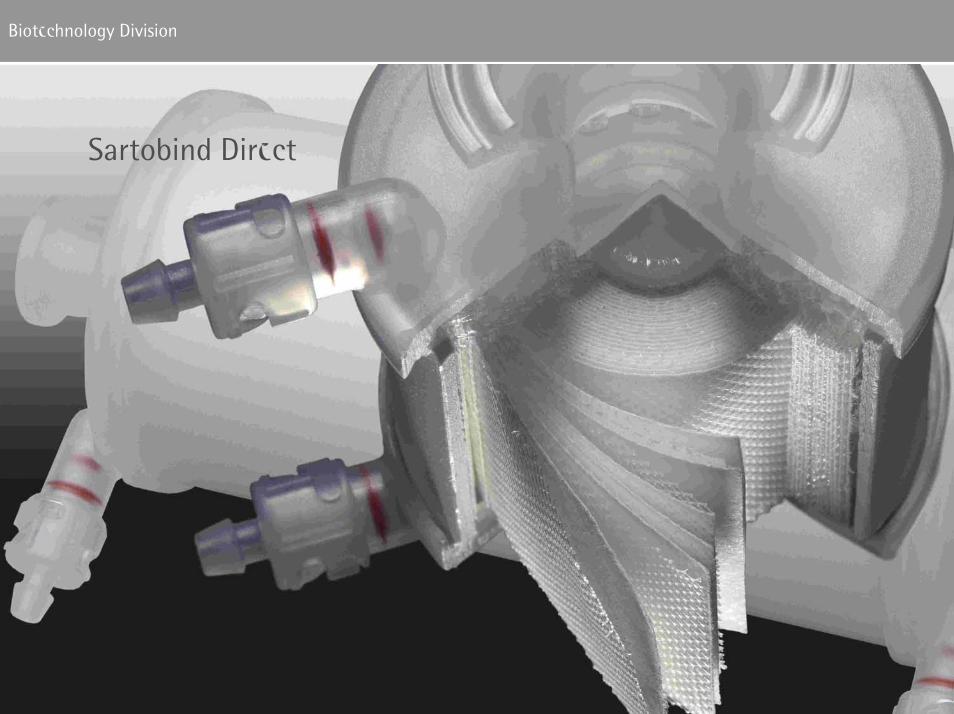
Principle of Sartobind Direct
15
Biotechnology Division
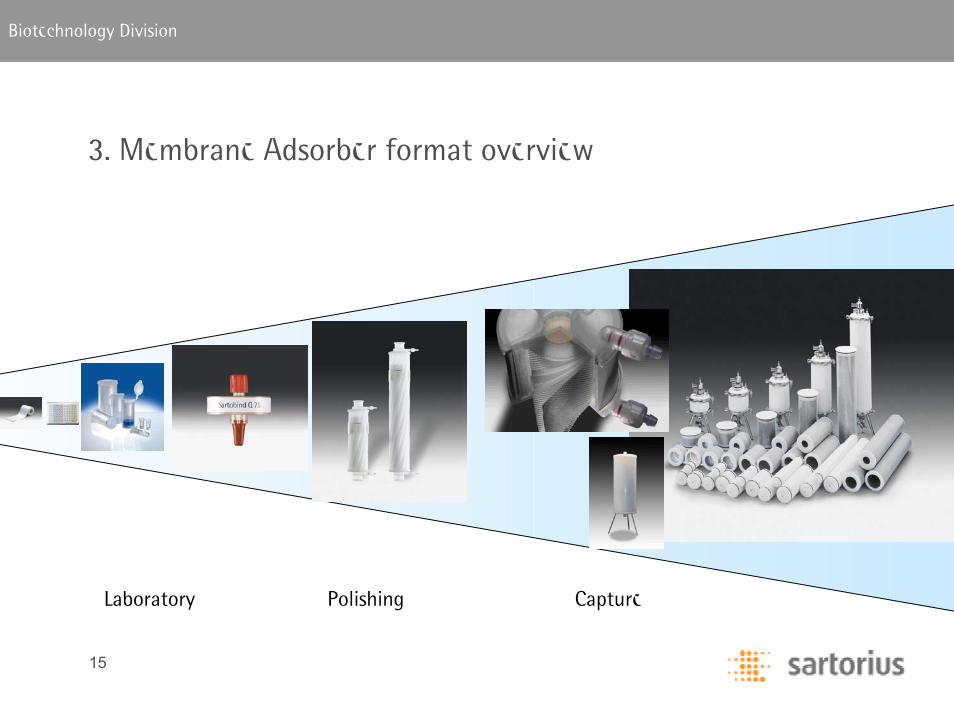
3. Membrane Adsorber format overview
CapturePolishingLaboratory
16
Biotechnology Division
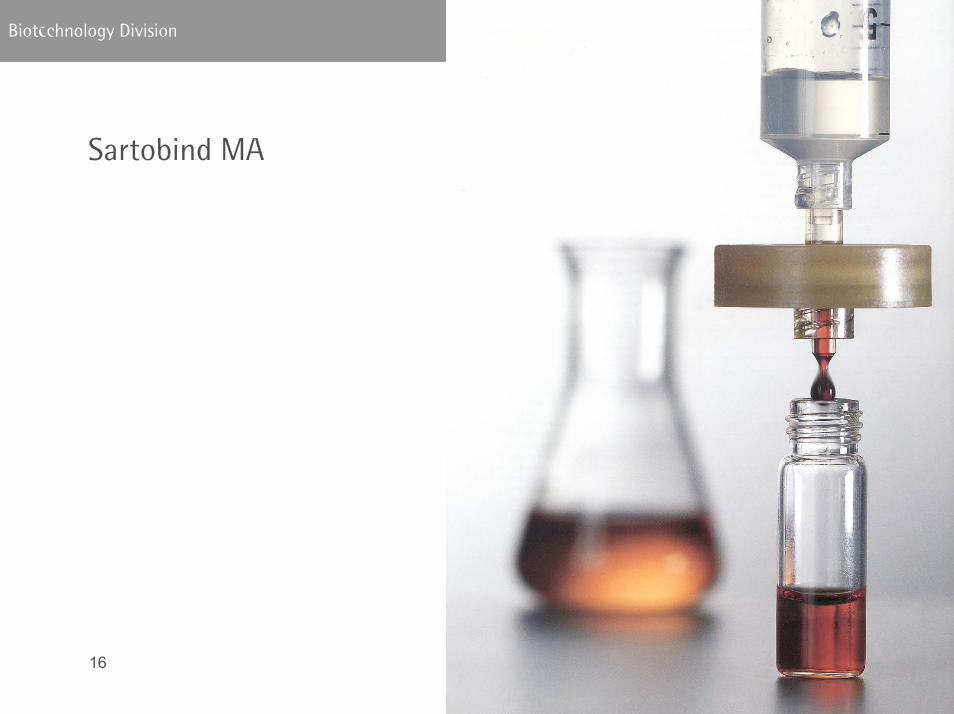
Sartobind MA
17
Biotechnology Division
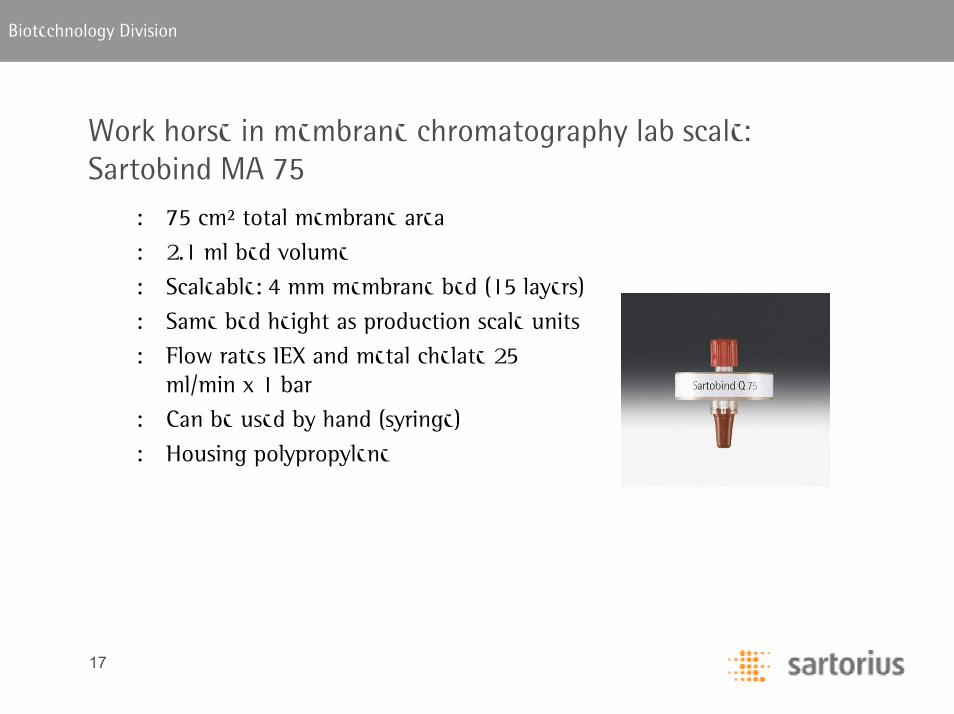
Work horse in membrane chromatography lab scale:Sartobind MA 75
: 75 cm² total membrane area
: 2.1 ml bed volume
: Scaleable: 4 mm membrane bed (15 layers)
: Same bed height as production scale units
: Flow rates IEX and metal chelate 25 ml/min x 1 bar
: Can be used by hand (syringe)
: Housing polypropylene
18
Biotechnology Division
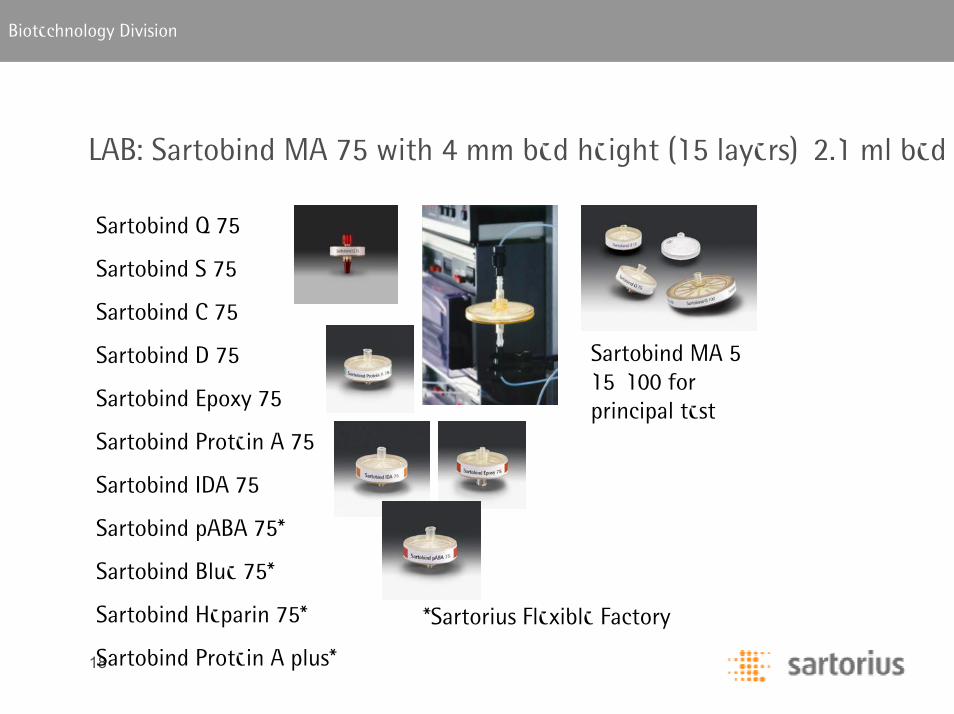
LAB: Sartobind MA 75 with 4 mm bed height (15 layers), 2.1 ml bed
Sartobind MA 5, 15, 100 for principal test
Sartobind Q 75
Sartobind S 75
Sartobind C 75
Sartobind D 75
Sartobind Epoxy 75
Sartobind Protein A 75
Sartobind IDA 75
Sartobind pABA 75*
Sartobind Blue 75*
Sartobind Heparin 75*
Sartobind Protein A plus*
*Sartorius Flexible Factory
19
Biotechnology Division
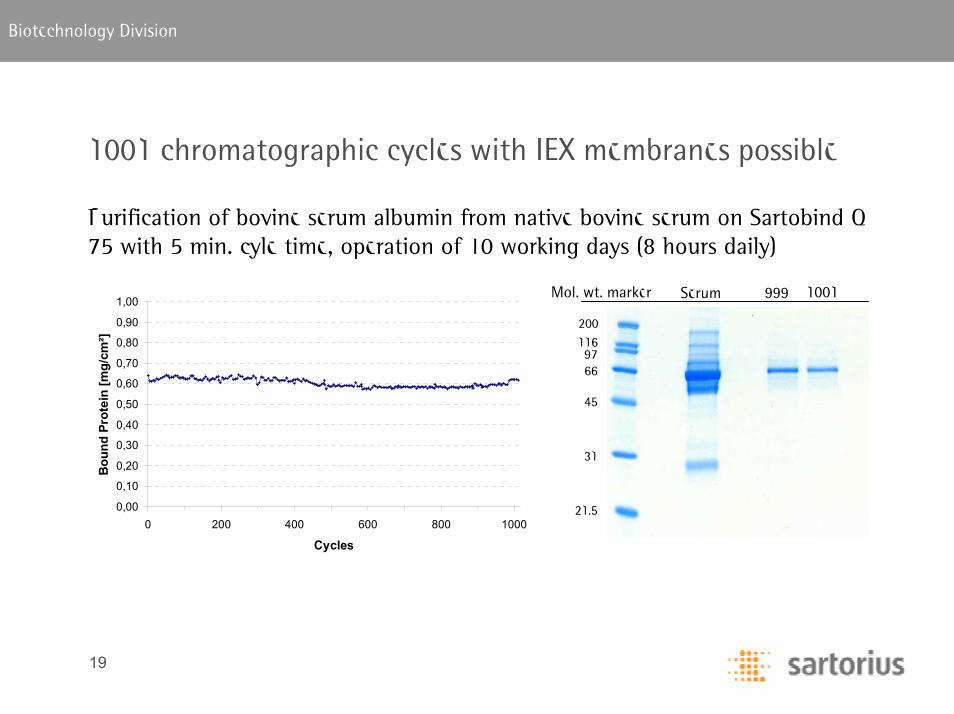
1001 chromatographic cycles with IEX membranes possible
Purification of bovine serum albumin from native bovine serum on Sartobind Q 75 with 5 min. cyle time, operation of 10 working days (8 hours daily)
0,00
0,10
0,20
0,30
0,40
0,50
0,60
0,70
0,80
0,90
1,00
0 200 400 600 800 1000
Cycles
Bou
nd P
rote
in [m
g/cm
²]
45
9766
200116
31
21.5
999Serum 1001 1001999Mol. wt. marker
20
Biotechnology Division
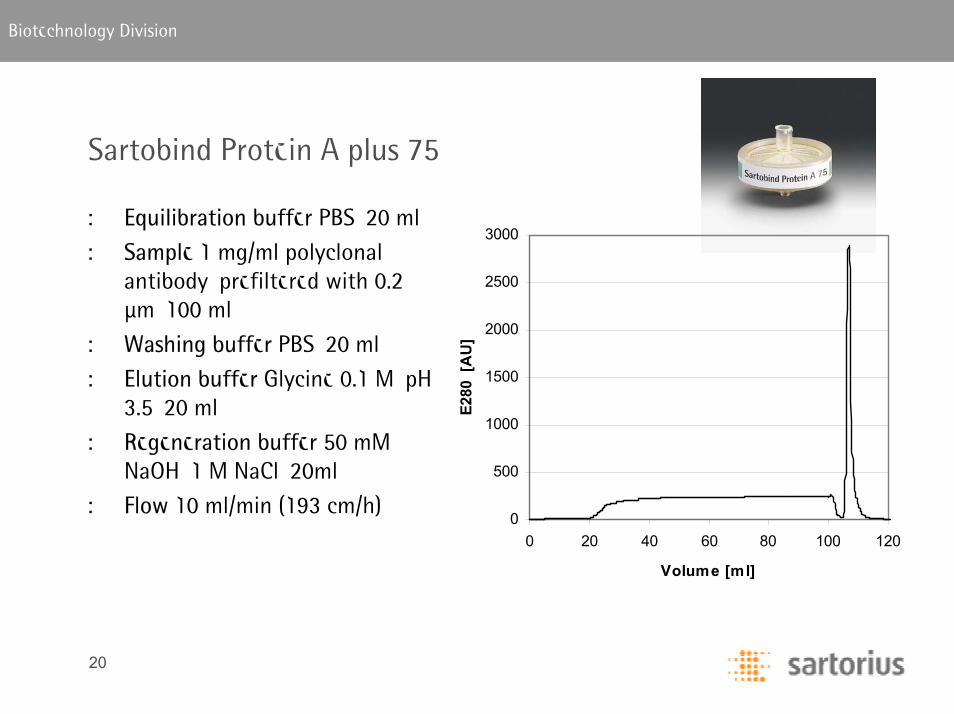
Sartobind Protein A plus 75
: Equilibration buffer PBS, 20 ml
: Sample 1 mg/ml polyclonal antibody, prefiltered with 0.2 µm, 100 ml
: Washing buffer PBS, 20 ml
: Elution buffer Glycine 0.1 M, pH 3.5, 20 ml
: Regeneration buffer 50 mM NaOH, 1 M NaCl, 20ml
: Flow 10 ml/min (193 cm/h)0
500
1000
1500
2000
2500
3000
0 20 40 60 80 100 120
Volume [ml]
E280
[A
U]
21
Biotechnology Division
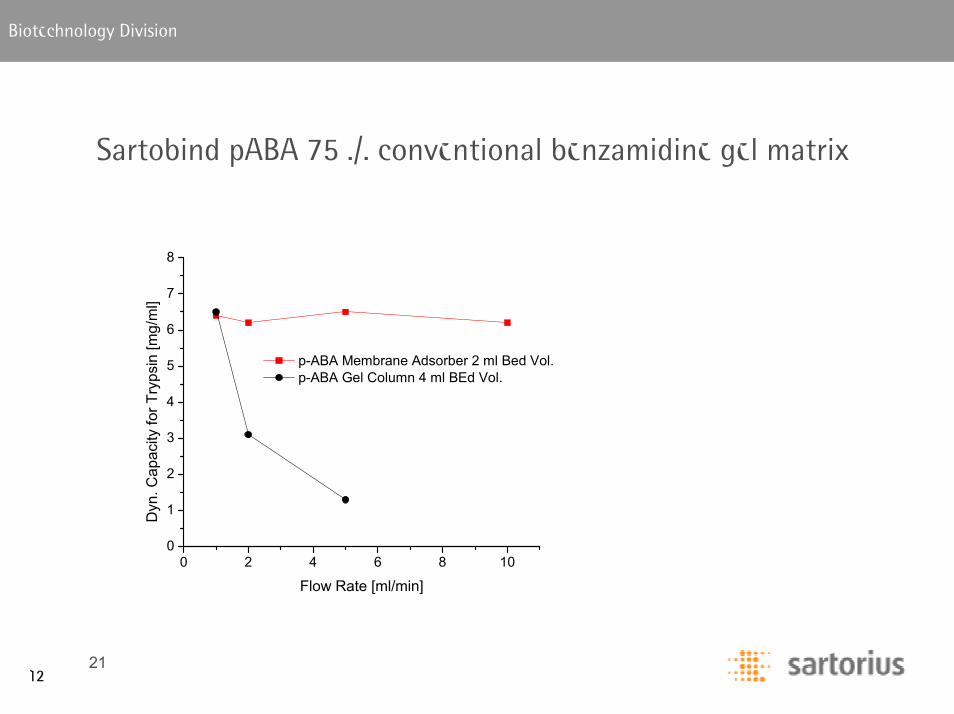
Sartobind pABA 75 ./. conventional benzamidine gel matrix
0 2 4 6 8 100
1
2
3
4
5
6
7
8
Dyn
. Cap
acity
for T
ryps
in [m
g/m
l]
Flow Rate [ml/min]
p-ABA Membrane Adsorber 2 ml Bed Vol. p-ABA Gel Column 4 ml BEd Vol.
Dynamic Capacity of different Chromatogarphy Matrices
12
22
Biotechnology Division
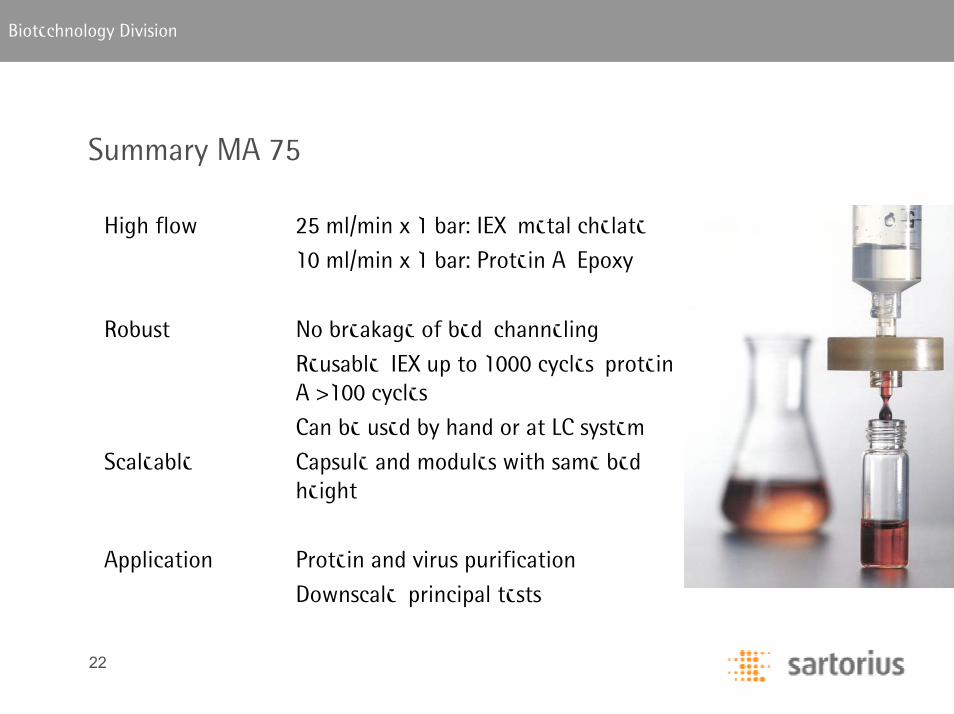
Summary MA 75
High flow 25 ml/min x 1 bar: IEX, metal chelate
10 ml/min x 1 bar: Protein A, Epoxy
Robust No breakage of bed, channeling
Reusable, IEX up to 1000 cycles, protein A >100 cycles
Can be used by hand or at LC system
Scaleable Capsule and modules with same bed height
Application Protein and virus purification
Downscale, principal tests
23
Biotechnology Division
Sartobind SingleSep Capsules
24
Biotechnology Division
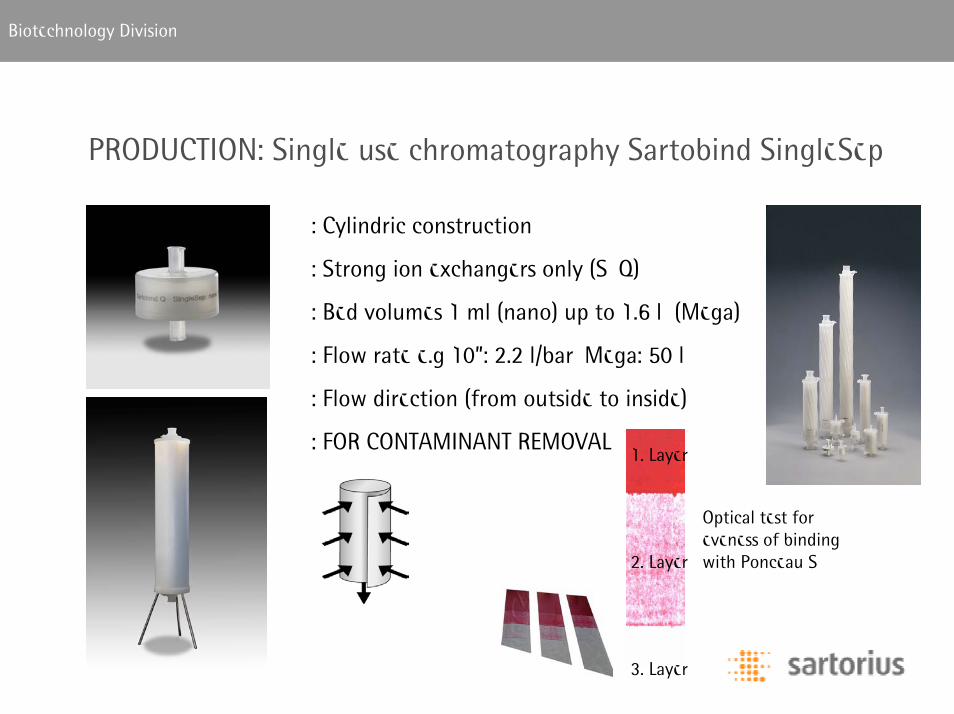
PRODUCTION: Single use chromatography Sartobind SingleSep
: Cylindric construction
: Strong ion exchangers only (S, Q)
: Bed volumes 1 ml (nano) up to 1.6 l (Mega)
: Flow rate e.g 10”: 2.2 l/bar, Mega: 50 l
: Flow direction (from outside to inside)
: FOR CONTAMINANT REMOVAL
Optical test for eveness of binding with Ponceau S
1. Layer
2. Layer
3. Layer
25
Biotechnology Division
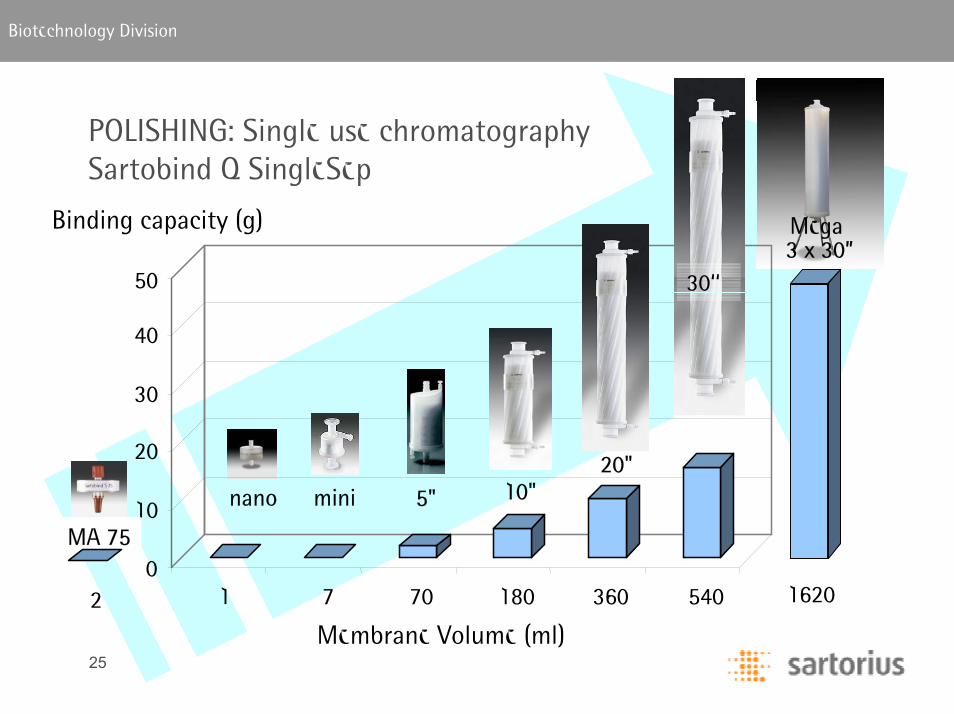
0
10
20
30
40
50
1 7 70 180 360 540
Binding capacity (g)
nano mini 5" 10"20"
1620
MA 75
2
Mega3 x 30”
30‘‘
POLISHING: Single use chromatography Sartobind Q SingleSep
Membrane Volume (ml)

26
Biotechnology Division
Sartobind costs of goods model
SpeedHandling and scale-up
Process timeHigh flow rates
CostsBuffer consumption, ConsumablesNo hardware investment
ValidationSingle use
LaborNo packing
Sartobind QQ-Column
20 %
Materials
Capital Charges
Labour
Consumables
100 %
Cost of Goods Calculator: Andrew Sinclair
27
Biotechnology Division
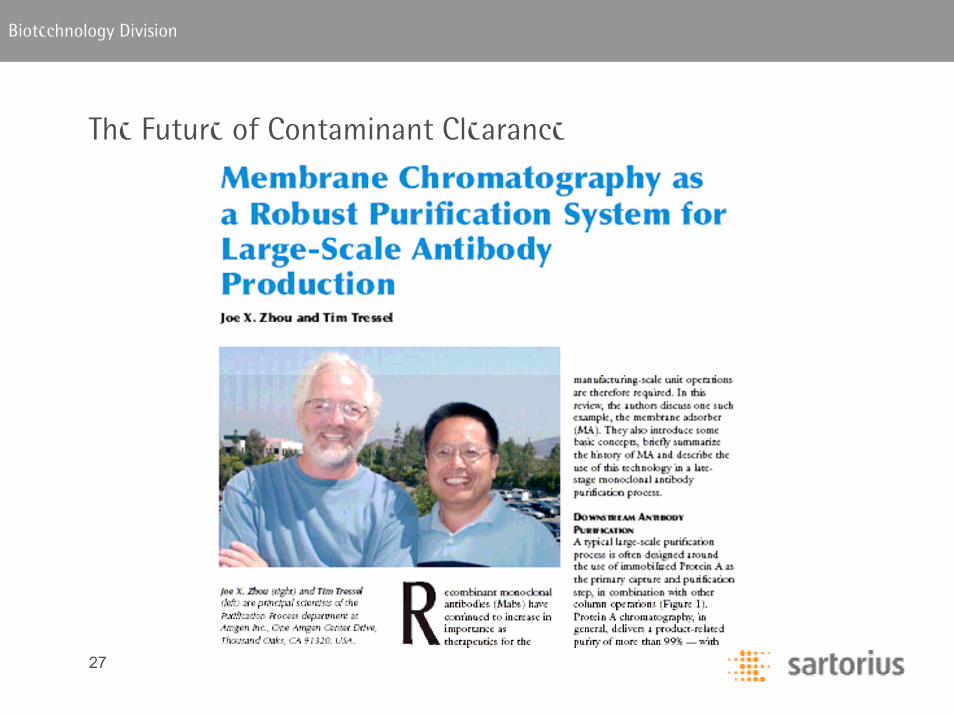
The Future of Contaminant Clearance
28
Biotechnology Division
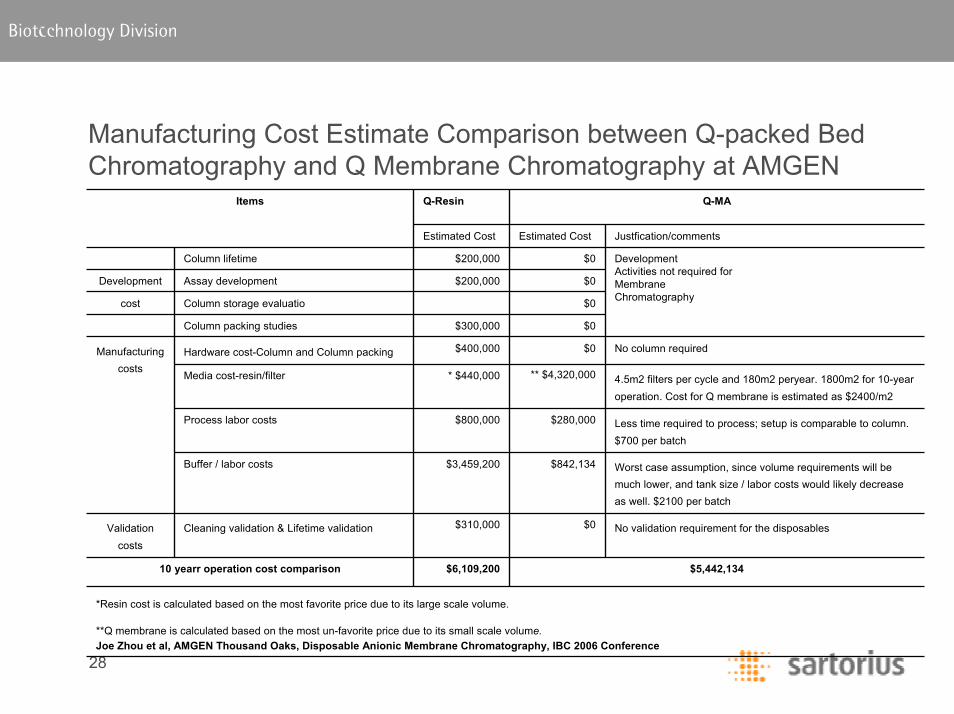
Manufacturing Cost Estimate Comparison between Q-packed Bed Chromatography and Q Membrane Chromatography at AMGEN
*Resin cost is calculated based on the most favorite price due to its large scale volume.
**Q membrane is calculated based on the most un-favorite price due to its small scale volume.Joe Zhou et al, AMGEN Thousand Oaks, Disposable Anionic Membrane Chromatography, IBC 2006 Conference
$5,442,134$6,109,20010 yearr operation cost comparison
No validation requirement for the disposables$0$310,000Cleaning validation & Lifetime validationValidation costs
Worst case assumption, since volume requirements will be much lower, and tank size / labor costs would likely decrease as well. $2100 per batch
$842,134$3,459,200Buffer / labor costs
Less time required to process; setup is comparable to column. $700 per batch
$280,000$800,000Process labor costs
4.5m2 filters per cycle and 180m2 peryear. 1800m2 for 10-year operation. Cost for Q membrane is estimated as $2400/m2
** $4,320,000* $440,000Media cost-resin/filter
No column required$0$400,000Hardware cost-Column and Column packingManufacturing costs
$0$300,000Column packing studies
$0Column storage evaluatiocost
$0$200,000Assay developmentDevelopment
DevelopmentActivities not required forMembraneChromatography
$0$200,000Column lifetime
Justfication/commentsEstimated CostEstimated Cost
Q-MAQ-ResinItems
29
Biotechnology Division
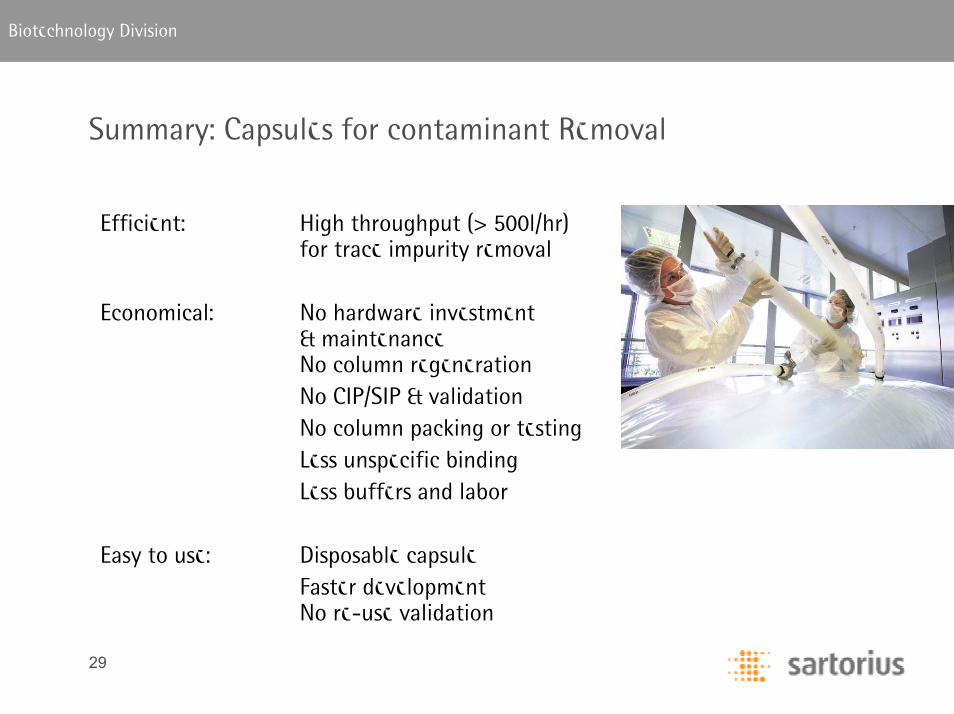
Summary: Capsules for contaminant Removal
Efficient: High throughput (> 500l/hr) for trace impurity removal
Economical: No hardware investment& maintenanceNo column regeneration No CIP/SIP & validationNo column packing or testingLess unspecific bindingLess buffers and labor
Easy to use: Disposable capsuleFaster developmentNo re-use validation
30
Biotechnology Division
Sartobind System (reusable modules)
31
Biotechnology Division
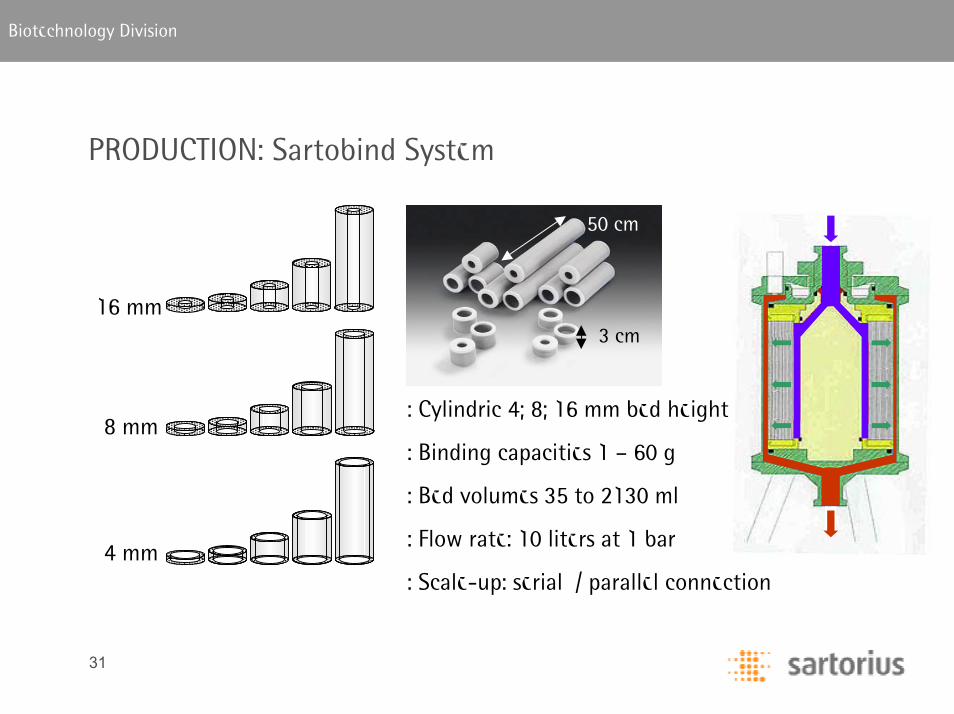
PRODUCTION: Sartobind System
3 cm
50 cm
: Cylindric 4; 8; 16 mm bed height
: Binding capacities 1 – 60 g
: Bed volumes 35 to 2130 ml
: Flow rate: 10 liters at 1 bar
: Scale-up: serial / parallel connection
16 mm
8 mm
4 mm
32
Biotechnology Division
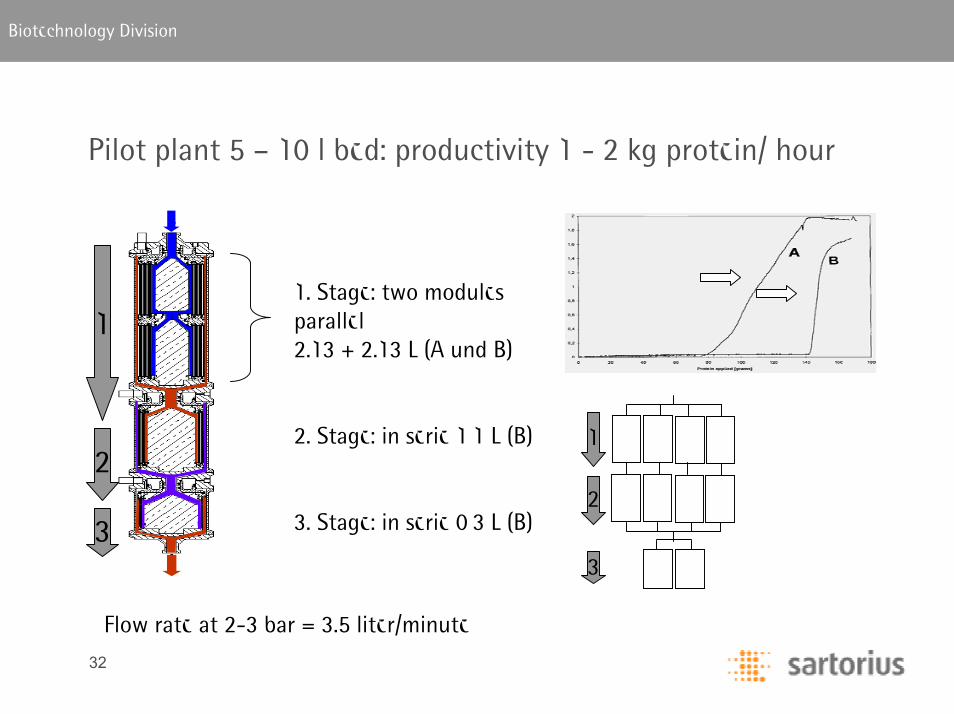
Pilot plant 5 – 10 l bed: productivity 1 - 2 kg protein/ hour
1
2
3
1. Stage: two modules parallel2.13 + 2.13 L (A und B)
2. Stage: in serie 1,1 L (B)
3. Stage: in serie 0,3 L (B)
1
2
3
Flow rate at 2-3 bar = 3.5 liter/minute
33
Biotechnology Division
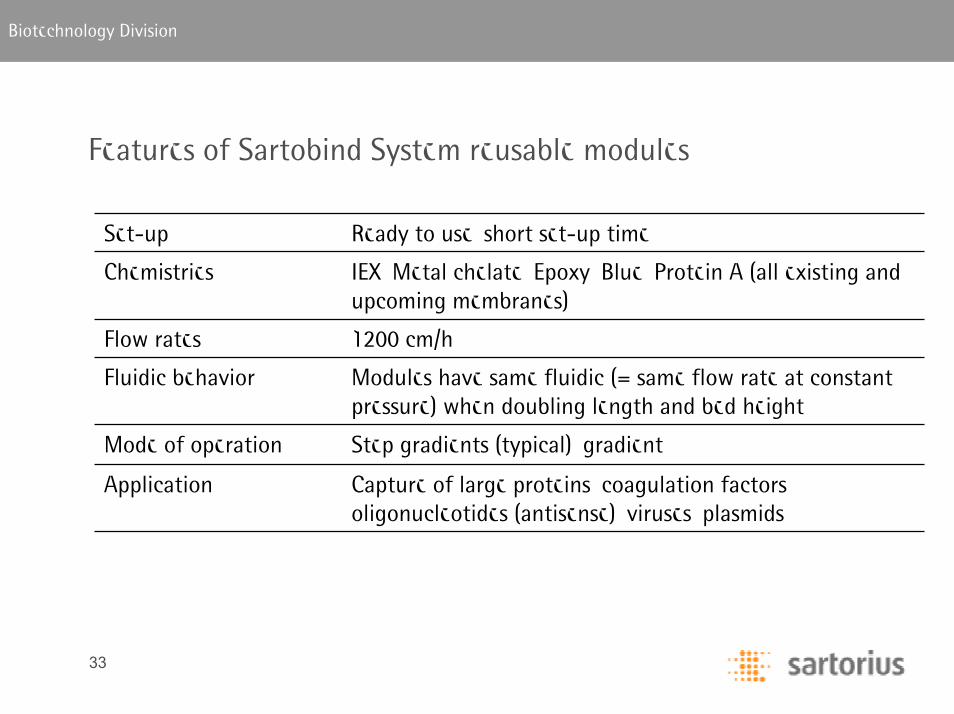
Features of Sartobind System reusable modules
Capture of large proteins, coagulation factors, oligonucleotides (antisense), viruses, plasmids
Application
Modules have same fluidic (= same flow rate at constantpressure) when doubling length and bed height
Fluidic behavior
Mode of operation
Flow rates
Chemistries
Set-up
Step gradients (typical), gradient
1200 cm/h
Ready to use, short set-up time
IEX, Metal chelate, Epoxy, Blue, Protein A (all existing and upcoming membranes)
34
Biotechnology Division
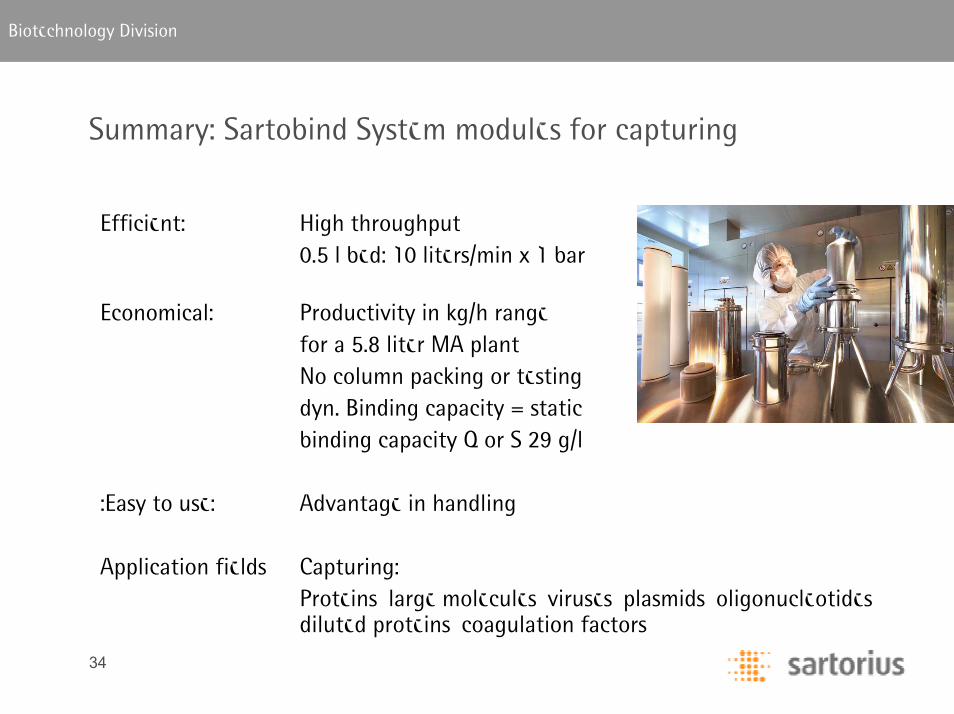
Summary: Sartobind System modules for capturing
Efficient: High throughput0.5 l bed: 10 liters/min x 1 bar
Economical: Productivity in kg/h rangefor a 5.8 liter MA plantNo column packing or testingdyn. Binding capacity = static binding capacity Q or S 29 g/l
:Easy to use: Advantage in handling
Application fields Capturing: Proteins, large molecules, viruses, plasmids, oligonucleotides diluted proteins, coagulation factors

35
Biotechnology Division Sartobind
Albumin [g]
Sartobind Jumbo
110 gDyn. binding capacity 10% (BSA)
QLigand
25 liter/minRec flow rate
8 mm (30 layers)Bed height (mm)
5 lBed volume (l)
36
Biotechnology Division
Sartobind Direct
37
Biotechnology Division
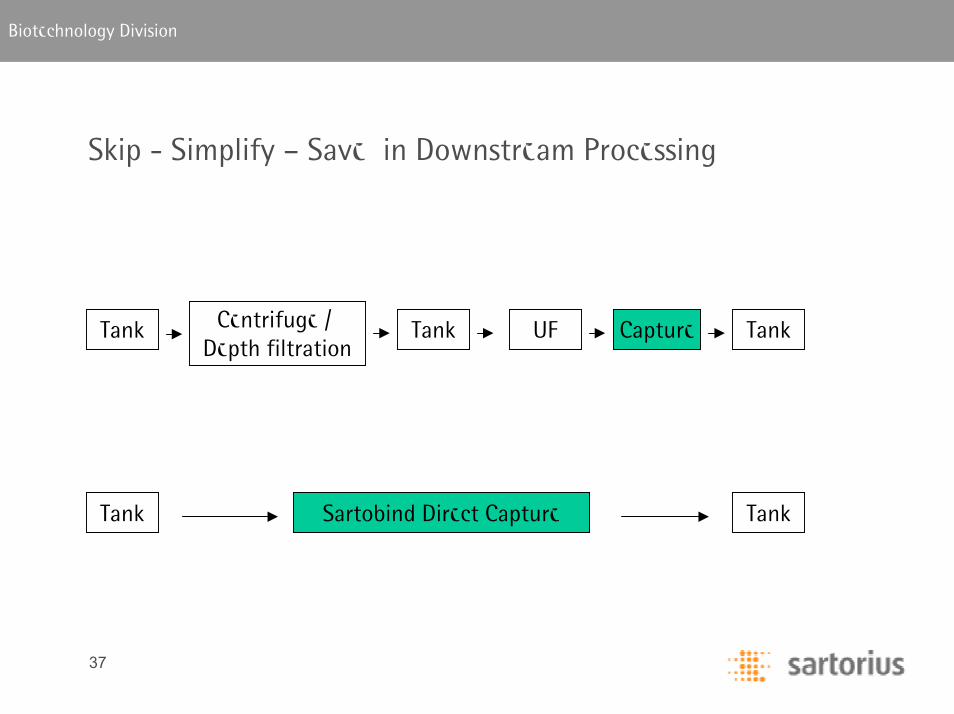
Skip - Simplify – Save in Downstream Processing
Centrifuge / Depth filtration
Tank Tank UF Capture Tank
Tank Sartobind Direct Capture Tank
38
Biotechnology Division Sartobind Direct
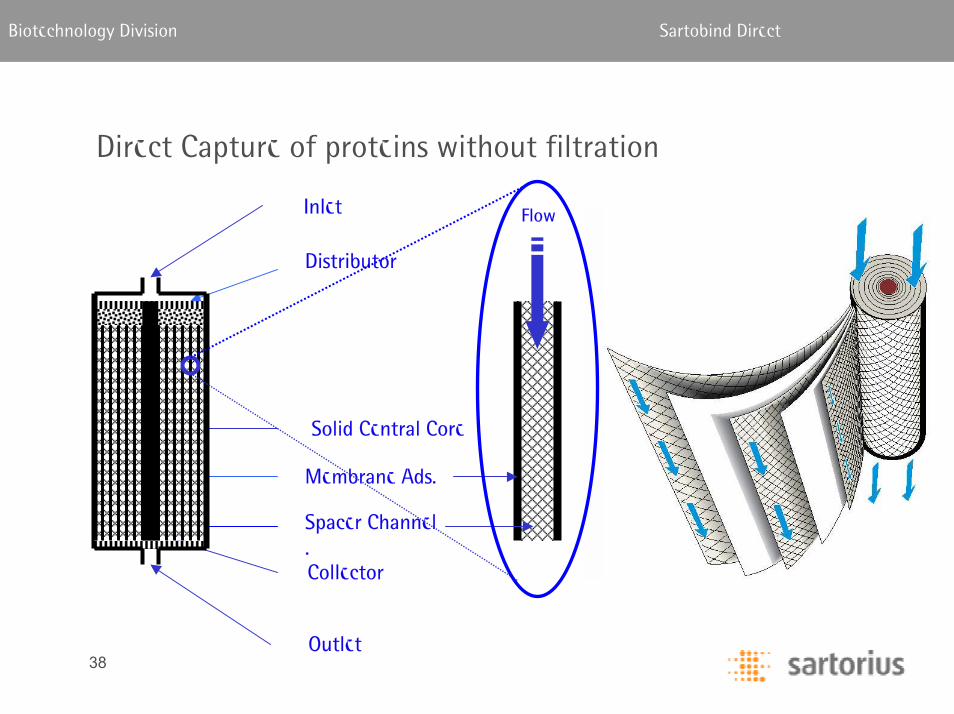
Direct Capture of proteins without filtration
Inlet
Spacer Channel.
Membrane Ads.
Collector
Distributor
Solid Central Core
Flow
Outlet
39
Biotechnology Division Sartobind Direct
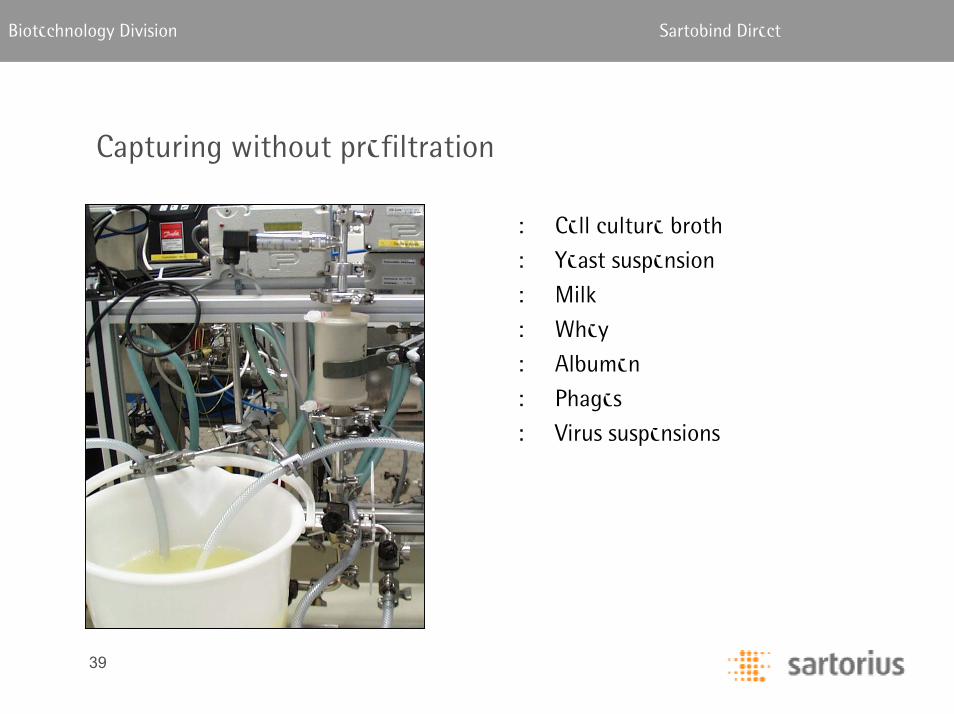
Capturing without prefiltration
: Cell culture broth
: Yeast suspension
: Milk
: Whey
: Albumen
: Phages
: Virus suspensions
40
Biotechnology Division Sartobind Direct
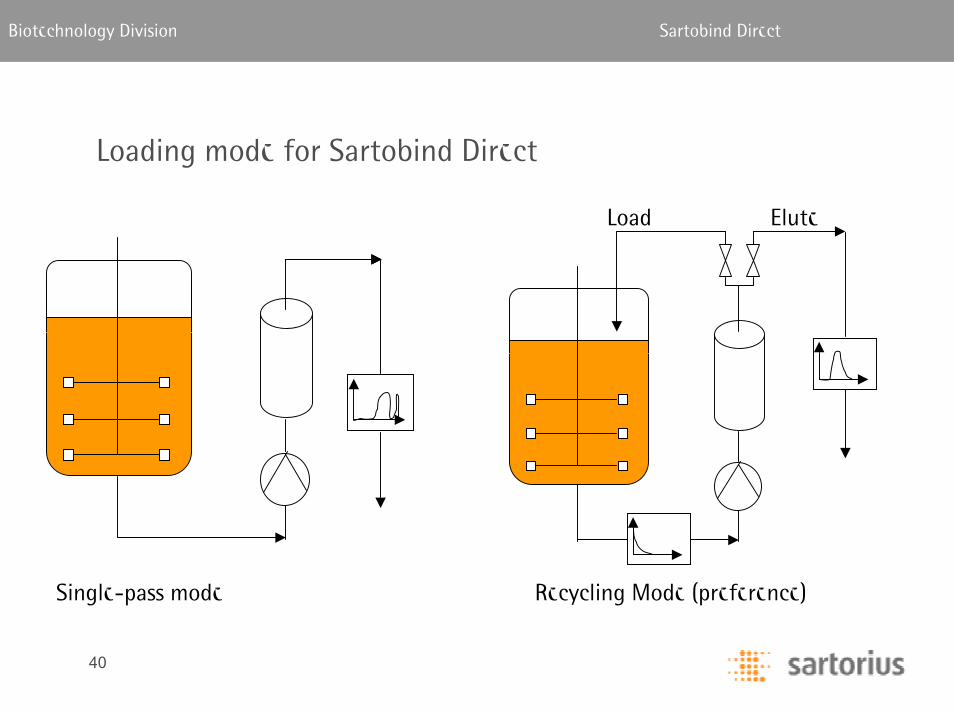
Loading mode for Sartobind Direct
Load Elute
Single-pass mode Recycling Mode (preference)
41
Biotechnology Division Sartobind Direct
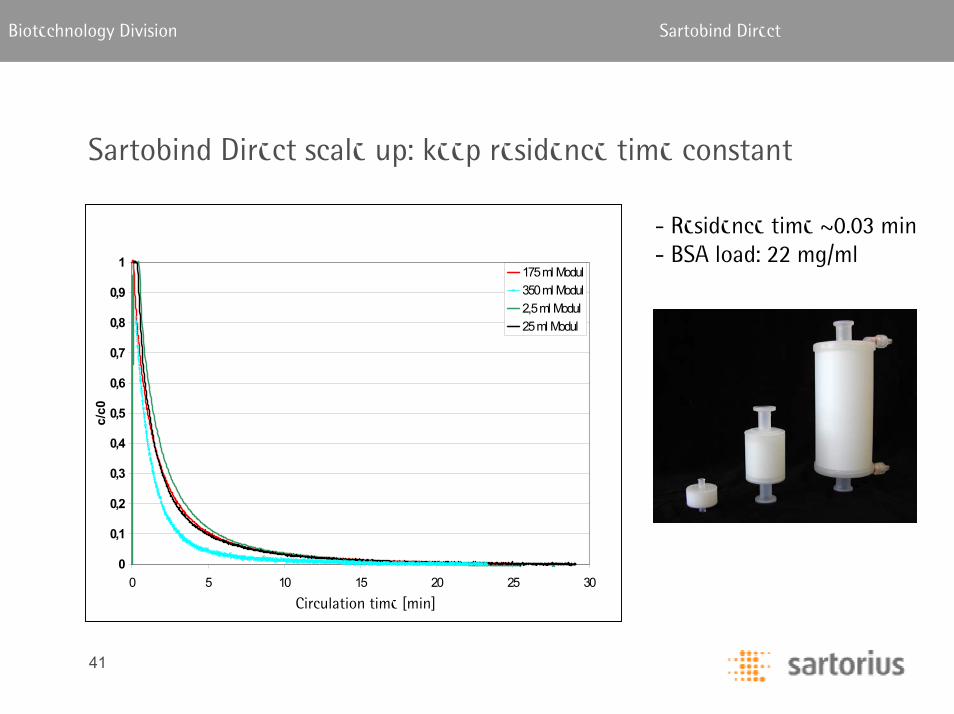
Sartobind Direct scale up: keep residence time constant
0
0,1
0,2
0,3
0,4
0,5
0,6
0,7
0,8
0,9
1
0 5 10 15 20 25 30
Rezirkulationszeit [min]
c/c0
175 ml Modul350 ml Modul2,5 ml Modul25 ml Modul
- Residence time ~0.03 min- BSA load: 22 mg/ml
Circulation time [min]
42
Biotechnology Division Sartobind Direct
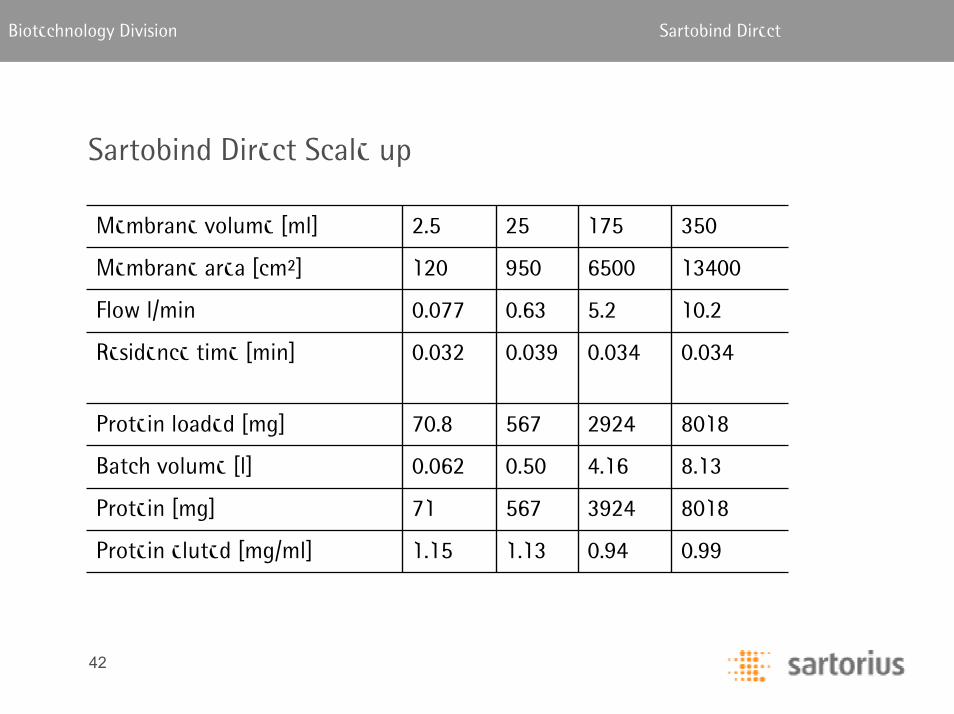
Sartobind Direct Scale up
134006500950120Membrane area [cm²]
0.990.941.131.15Protein eluted [mg/ml]
8018392456771Protein [mg]
8.134.160.500.062Batch volume [l]
8018292456770.8Protein loaded [mg]
0.0340.0340.0390.032Residence time [min]
10.25.20.630.077Flow l/min
350175252.5Membrane volume [ml]
43
Biotechnology Division
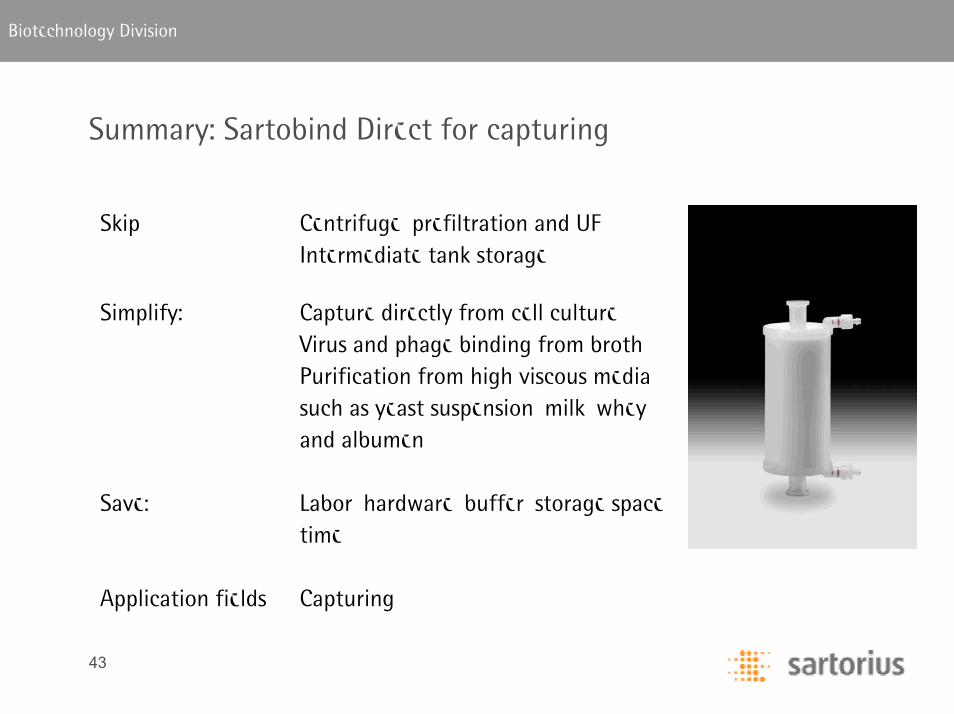
Summary: Sartobind Direct for capturing
Skip Centrifuge, prefiltration and UFIntermediate tank storage
Simplify: Capture directly from cell cultureVirus and phage binding from brothPurification from high viscous mediasuch as yeast suspension, milk, wheyand albumen
Save: Labor, hardware, buffer, storage spacetime,
Application fields Capturing
44
Biotechnology Division
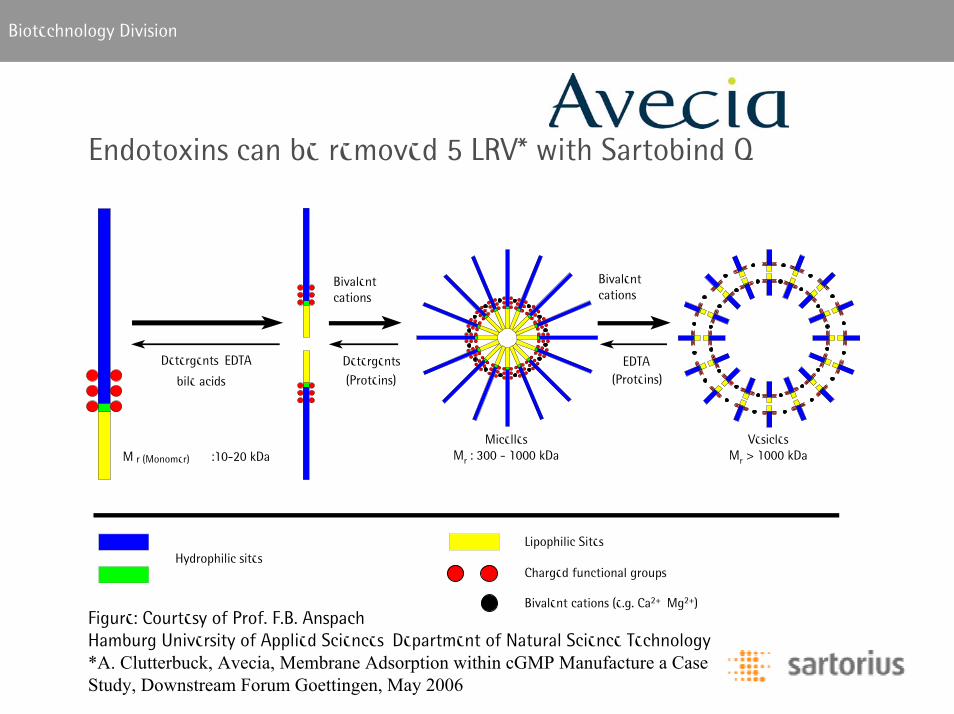
Endotoxins can be removed 5 LRV* with Sartobind Q
M r (Monomer) :10-20 kDa
Detergents, EDTA,
Bivalentcations
MicellesMr : 300 - 1000 kDa
EDTADetergents
bile acids
VesiclesMr > 1000 kDa
Hydrophilic sitesLipophilic Sites
Charged functional groups
Bivalentcations
Bivalent cations (e.g. Ca2+, Mg2+)
(Proteins) (Proteins)
Figure: Courtesy of Prof. F.B. Anspach, Hamburg University of Applied Sciences, Department of Natural Science Technology*A. Clutterbuck, Avecia, Membrane Adsorption within cGMP Manufacture a Case Study, Downstream Forum Goettingen, May 2006
45
Biotechnology Division
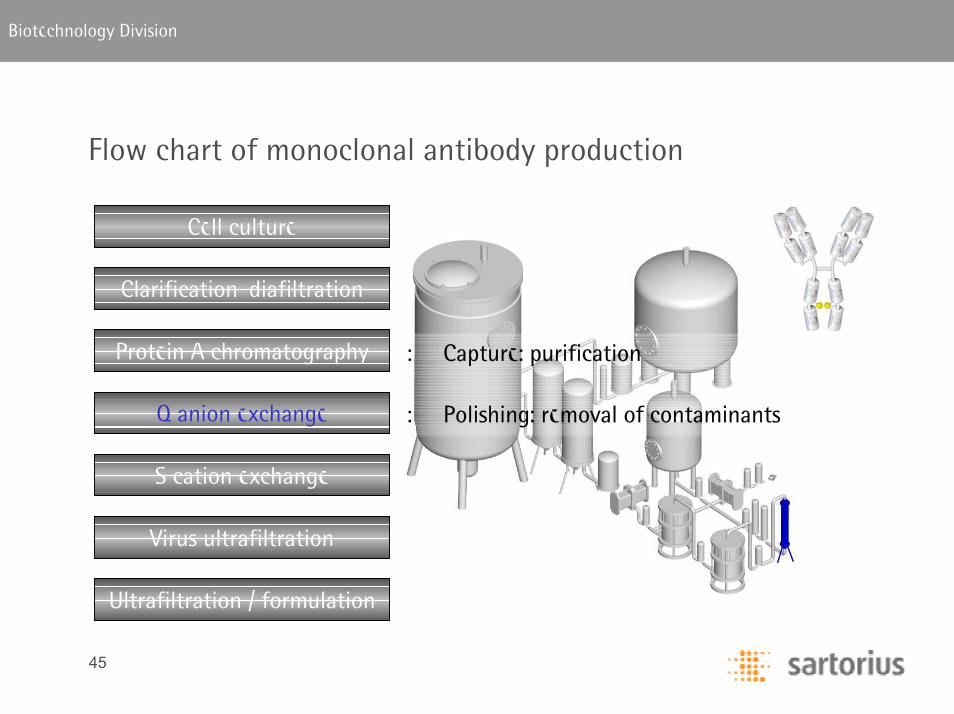
Flow chart of monoclonal antibody production
Clarification, diafiltration
Cell culture
Protein A chromatography
Q anion exchange
S cation exchange
Virus ultrafiltration
Ultrafiltration / formulation
: Capture: purification
: Polishing: removal of contaminants
46
Biotechnology Division
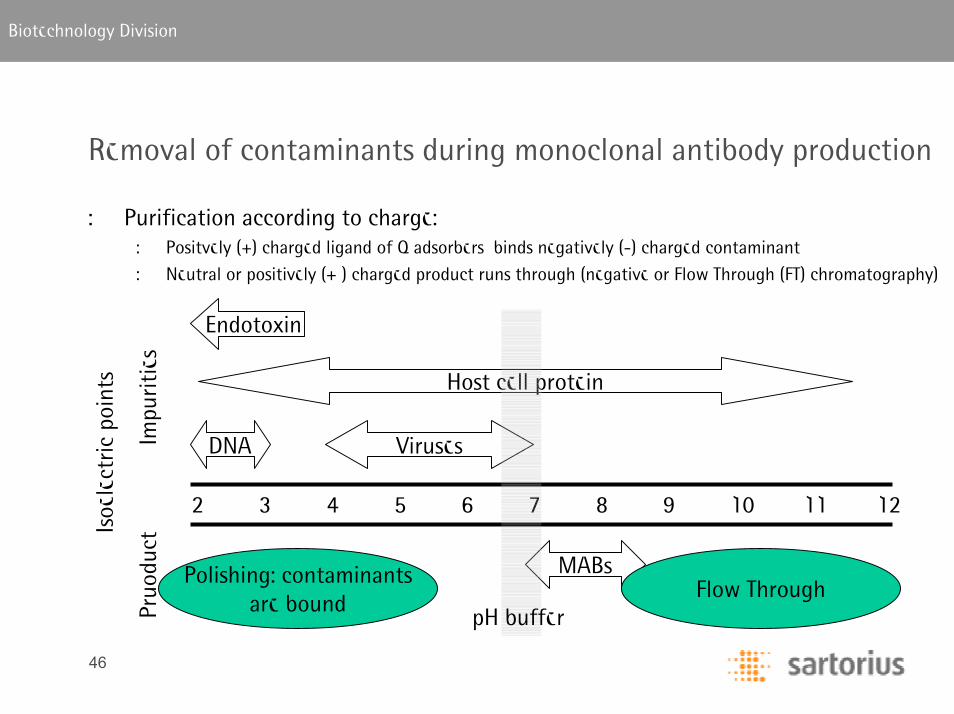
Removal of contaminants during monoclonal antibody production
: Purification according to charge:: Positvely (+) charged ligand of Q adsorbers binds negatively (-) charged contaminant
: Neutral or positively (+ ) charged product runs through (negative or Flow Through (FT) chromatography)
DNA Viruses
Host cell protein
2 3 4 5 6 7 8 9 10 11 12
MABs
Isoe
lect
ric p
oint
s
Pruo
duct
Im
purit
ies
Endotoxin
pH buffer
Polishing: contaminantsare bound
Flow Through
47
Biotechnology Division
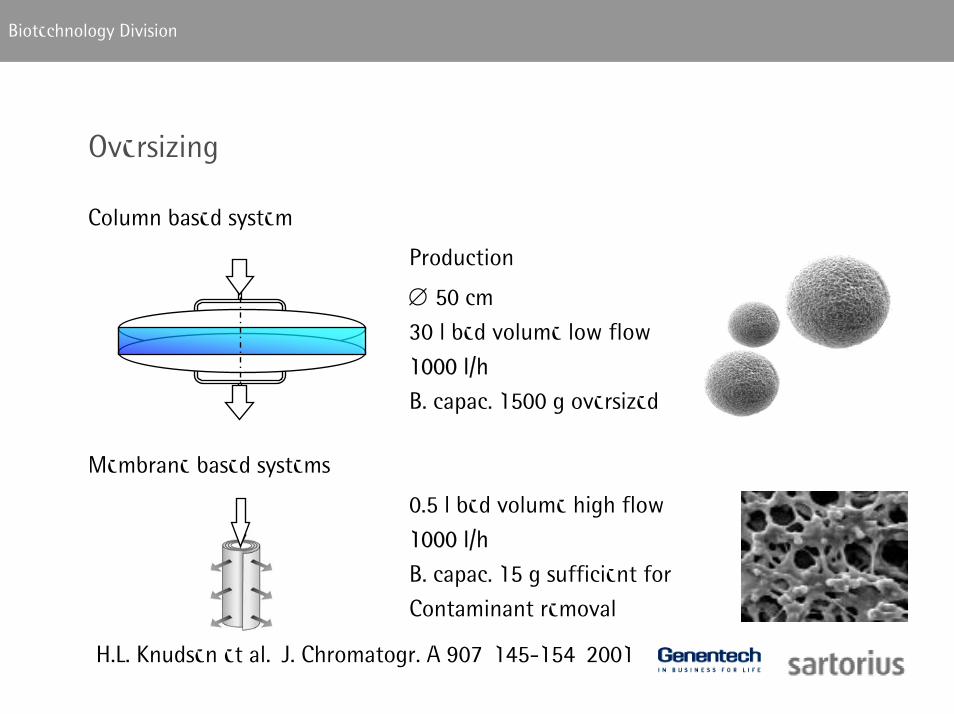
Oversizing
Column based system
0.5 l bed volume high flow
1000 l/h
B. capac. 15 g sufficient for
Contaminant removal
Membrane based systems
∅ 50 cm
30 l bed volume low flow
1000 l/h
B. capac. 1500 g oversized
Production
H.L. Knudsen et al., J. Chromatogr. A 907, 145-154, 2001

48
Biotechnology Division
DNA removal from a therapeutic antibody. Campath 1-H
DNA binding capacity
0
2
4
6
Sartobind Q Q-Sepharose FF
mg /
ml
: ...clears the DNA
below detection limit
: „superior pressure/flow relation
: ...the process time is reduced 23-fold, excluding the benefit in handling for set-up.
: ...diminish a loss of product
: ...installed as in-line filters and can be disposed after use*
.
Aver age of thr ee 12,500 l iter batches with 15-50 module
050
100150200
Af ter pr oteinA
Af terSar tobind Q
pg D
NA p
ro m
g
Pro
tein
Galliher P, Fowler E, Millennium Pharmaceuticals Inc.: Validation of Impurity Removal by the CAMPATH-1H Biomanufacturing Process. IBC’s Biopharmaceutical Production Week, Paradise Point Resort – San Diego, CA, November 12-15, 2001
J. K. Walter, Bioseparation and Bioprocessing, G.Subramanian (ed.) Wiley VCH, Vol. II p. 447-460, 1998
FDA approvalMarch 2001

49
Biotechnology Division
Impurity Levels after Protein A (12k run ~12,000 g product):
: 1.5% aggregate 180g
: 1000 ppm CHOP 12g
: 200 ppm DNA 2.4 g
: 30 ppm Leached ProA 0.3 g
Typical load value: 2 kg/L (FT)
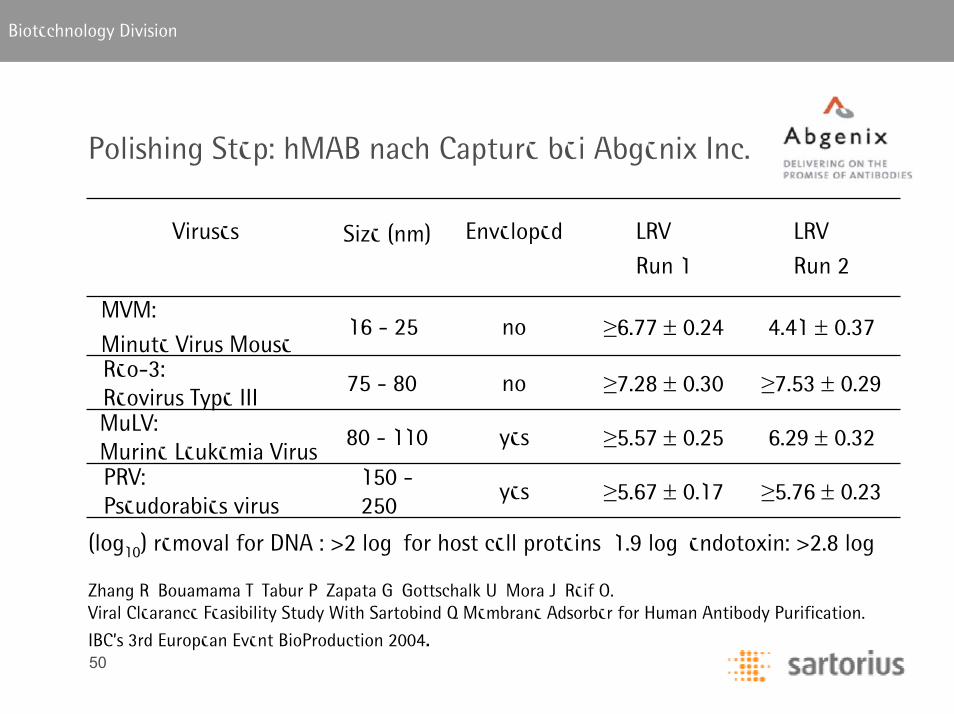
Polishing Step: hMAB after Capturing at Abgenix Inc.
1 2
*Membrane Chromatography for Purification of Human Antibodies in Commercial Processes. Gerardo Zapata et al. (Abgenix Inc.) IBC Antibody Meeting 2005
50
Biotechnology Division
Polishing Step: hMAB nach Capture bei Abgenix Inc.
≥5.76 ± 0.23≥5.67 ± 0.17yes150 -250
PRV: Pseudorabies virus
6.29 ± 0.32≥5.57 ± 0.25yes80 - 110MuLV: Murine Leukemia Virus
≥7.53 ± 0.29≥7.28 ± 0.30no75 - 80Reo-3: Reovirus Type III
4.41 ± 0.37≥6.77 ± 0.24no16 - 25MVM:
Minute Virus Mouse
Viruses Enveloped LRV
Run 1
LRV
Run 2Size (nm)
(log10) removal for DNA : >2 log, for host cell proteins 1.9 log, endotoxin: >2.8 log
Zhang R, Bouamama T, Tabur P, Zapata G, Gottschalk U, Mora J, Reif O. Viral Clearance Feasibility Study With Sartobind Q Membrane Adsorber for Human Antibody Purification.
IBC’s 3rd European Event BioProduction 2004.
51
Biotechnology Division
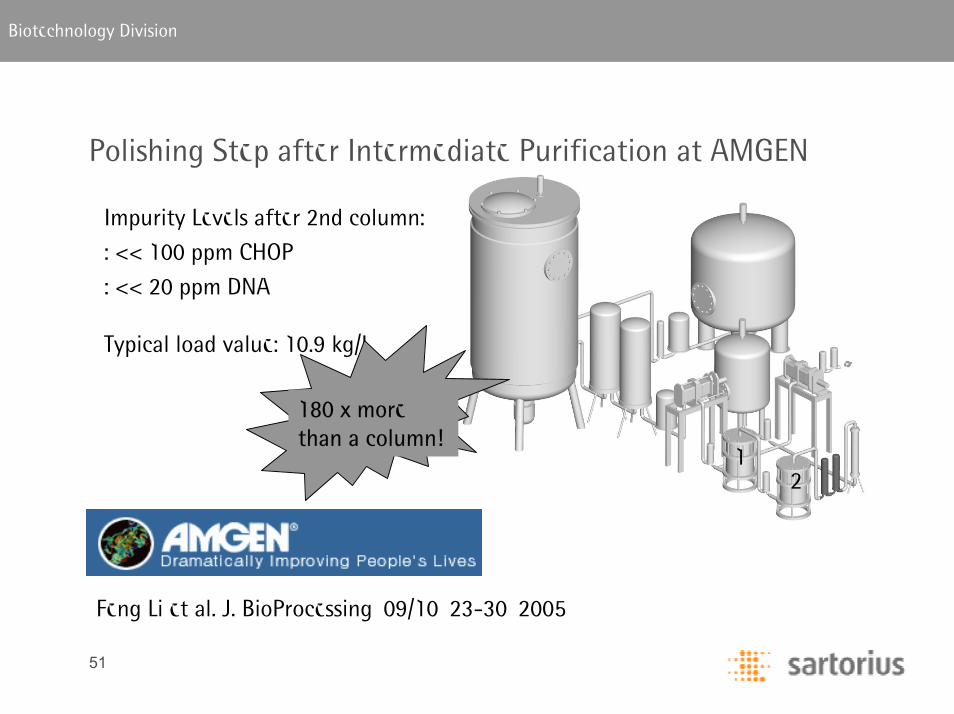
Polishing Step after Intermediate Purification at AMGEN
Impurity Levels after 2nd column:
: << 100 ppm CHOP
: << 20 ppm DNA
Typical load value: 10.9 kg/L
180 x more than a column!
1 2
Feng Li et al. J. BioProcessing, 09/10, 23-30, 2005
52
Biotechnology Division
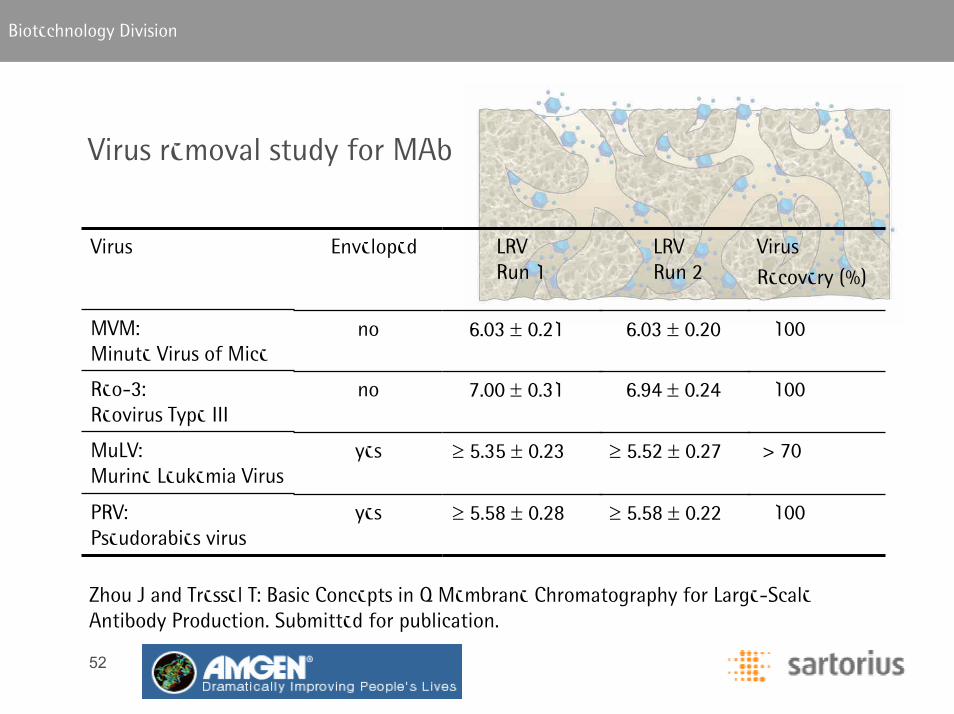
≥ 5.58 ± 0.28
≥ 5.35 ± 0.23
7.00 ± 0.31
6.03 ± 0.21
LRVRun 1
≥ 5.58 ± 0.22
≥ 5.52 ± 0.27
6.94 ± 0.24
6.03 ± 0.20
LRVRun 2
100
> 70
100
100
Virus
Recovery (%)
Virus removal study for MAb
yes
yes
no
no
Enveloped
PRV: Pseudorabies virus
MuLV: Murine Leukemia Virus
Reo-3: Reovirus Type III
MVM:Minute Virus of Mice
Virus
Zhou J and Tressel T: Basic Concepts in Q Membrane Chromatography for Large-Scale Antibody Production. Submitted for publication.
53
Biotechnology Division
Summary
: 1. Differences Sartobind / conventional gels: : Negligible diffusion limitation, high speed, less size exclusion: Larger binding capacity for large proteins: Rapid virus purification, high yield: Specific format possible with adsorbers: Sartobind Direct: Capturing in 2 kg protein / hour feasable
: 2. Single use products: Simple to use (like a filter), disposable: Save up to 80 % of column costs
: 3. Application: contaminant removal.: >5 log Endotoxin: DNA below detection limit: Virus removal >6 log
: Used in FDA approved production since 2001


![Lecture 17 Membrane separations - CHERIC · Lecture 17. Membrane Separations [Ch. 14] •Membrane Separation •Membrane Materials •Membrane Modules •Transport in Membranes-Bulk](https://img.pdfslide.net/doc/110x75/5e688f368fbb145949438f76/lecture-17-membrane-separations-cheric-lecture-17-membrane-separations-ch-14.jpg)