Embed Size (px)
Citation preview

© Sino-American Silicon Products Inc. All rights reserved.
SAS Q4 2019 Earnings Report
03/19/2020

© Sino-American Silicon Products Inc. All rights reserved.
This presentation has been prepared by Sino-American Silicon Products Inc. (the “Company”). This presentation and the materials provided herewith do not constitute an offer to sell or issue or the solicitation of an offer to buy or acquire securities of the Company in any jurisdiction or an inducement to enter into investment activity, nor may it or any part of it form the basis of or be relied on in connection with any contract or commitment whatsoever. Any decision to purchase securities in a proposed offering should be made solely on the basis of the information contained in the offering circular published in relation to such proposed offering, if any.
The information contained in this presentation has not been independently verified. No representation, warranty or undertaking, express or implied, is made as to, and no reliance should be placed on, the fairness, accuracy, completeness or correctness of the information or the opinions contained herein. The information contained in this document should be considered in the context of the circumstances prevailing at the time and has not been, and will not be, updated to reflect material developments which may occur after the date of the presentation. None of the Company nor any of its affiliates, advisors or representatives will be liable (in negligence or otherwise) for any loss howsoever arising from any use of this presentation or its contents or otherwise arising in connection with the presentation.
1
Disclaimer

© Sino-American Silicon Products Inc. All rights reserved.
1. COVID-19 Impacts vary in the different positions of the supply chain
- Wafer, Cell, Module : No disruption, seasonal piling serves as safety inventory.
- Solar Farm construction: Huge impact. National quarantine policy and border ban in
many countries significantly interfere manpower availability and transportation.
Manpower shortage and obstacles in logistics result in delayed shipment and
installation.
No operating disruption in SAS (including solar farm installation) for now.
Damage magnitude for long-term is unclear since it depends on if the containment is
effective, hard to assess now whether the outbreak leads to slackening global economy.
2. 2019FY
Solid Performance - 2H 2019 OP ratio reaches 25.0%, increasing by 6.7% vs. 2H 2018 (18.4%)
- 2019 EPS is NTD 3.86, increasing by NTD 0.5 vs. 2018 (NTD 3.36).
- 2019 Gross Profit and Operating Profit are the HIGHEST EVER.
Revenue remains stable with nearly 90% contribution from GWC, solar sector share drops to 11%.
Solar operation cash is positive.
Executive Comments
2

© Sino-American Silicon Products Inc. All rights reserved.
3. Outlook
The widening climate change urges alternative solution – renewable energy.
WW solar installation are expected to reach 142 GW in 2020, double-digit YoY growth.
With many industries launching clean energy program, we foresee the necessity to advance
green power is integral in world supply chain.
4. Dividend Policy Dividend payout once every six months to share constant growth with shareholders.
5. GWC
NO operating disruption in GWC now.
(Semiconductor business is exempted from Malaysian national closure, KL site is back to normal
production)
GWC vigilantly adjusts worldwide capacity and utilizes its flexible shipment as countermeasure
against quarantine policies in different countries.
Record-Breaking Year
2nd Best Revenue : NTD 58bn! (-1.6% YoY)
All-Time High in many aspects –
EBITDA %, GM & GM%, OP & OP%, Net Income & Net income %, EPS……
BEST EPS since foundation : NTD 31.35, Dividend : NTD 25,
Very High Payout ratio : 79.7%
Dividend payout once every six months.
(1H20 dividend payout in 1Q21; 2H20 dividend payout in 3Q21)
3

© Sino-American Silicon Products Inc. All rights reserved.
SAS Group Overview
4

© Sino-American Silicon Products Inc. All rights reserved.
Group Structure
Note: SAS’ shareholding % of GWC : GWC shares held by SAS / GWC total outstanding shares deducting repurchased shares
Solar Business
Cathay Sunrise
Corp.
(Taiwan)
Power Plant
Investment
Aleo Solar
GmbH
(Germany)
SAS Sunrise Inc.
(Cayman)
Solar Panel
Manufacturer
Power Plant
Investment
CSC
30% 100% 100%
Sino-American Silicon
Products Inc.
(Taiwan)
Semiconductor
Business
GlobalWafers Co., Ltd.
(6488-TW)
(Taiwan)
Silicon Ingot and Wafer
Manufacturer
51.17%1
Sapphire
Business
Crystalwise
Technology Inc.
(4944-TW)
(Taiwan)
Sapphire Components
Manufacturer
41.94%
Specialty Gas
Business
Taiwan Specialty
Chemicals Corporation
(Taiwan)
Disilane, Trisilane
Manufacturer
30.93%
5

© Sino-American Silicon Products Inc. All rights reserved.
Group Revenue by Business
11,900 12,959 13,172 13,159 10,175
7,416
15,922 15,310 18,427
46,213
59,064
58,094
27,821 28,269
31,599
59,371
69,239
65,510
FY2014 FY2015 FY2016 FY2017 FY2018 FY2019
Solar Semiconductor Wafer
(NT$mn)
57%
43%
58%
42%
54%
46%
78%
22%
85%
15%
6
89%
11%

© Sino-American Silicon Products Inc. All rights reserved.
Solar Industry Overview (PRE COVID-19)
7

© Sino-American Silicon Products Inc. All rights reserved.
Source : International Renewable Energy Agency (IRENA), Climate Change And Renewable Energy Report, June 2019. *TPES : total primary energy supply *Reference Case: Current and planned energy policies. *REmap Case: Assumption based on the potential for countries, regions and the world to scale up renewables.
Climate Change Solution : Renewable Energy Research shows to effectively limiting the rise of global temperature, the share of renewable energy
needs to rise from around 14% of total primary energy supply(TPES) in 2016 to around 65% in 2050.
Renewable and Non-renewable Shares Share in TPES* (2016-2050)
8
Renewable
Non-renewable

© Sino-American Silicon Products Inc. All rights reserved.
Source: IRENA Global energy transformation: A roadmap to 2050 (2019 edition), April 2019. *REmap Case: Assumption based on the potential for countries, regions and the world to scale up renewables.
Solar Power and Wind Dominate Growth in Renewable-based Generation Based on analyses, under the renewable energy acceleration scenario, by 2050 solar power, with
8,500 GW installed capacity, and wind, with 6,000 GW, would account for three-fifths of global
electricity generation. Electricity consumption in end-use sectors will more than double from
today's level.
Electricity Generation and Total Installed Power Capacity
9

© Sino-American Silicon Products Inc. All rights reserved.
Source: IHS Markit, January 2020
Global Solar Installations – China vs. RoW (PRECOVID-19)
Installations outside of China grew by 53% in 2019 and are expected to continue growing by double
digits in 2020.
Participation of new emerging areas leverages the overreliance of preeminent China, showing
diversification and expansion of solar installation demand across the globe. Global Solar Installations, China vs. Rest of the World
10

© Sino-American Silicon Products Inc. All rights reserved.
Taiwan Solar Policy – 20GW in 2025 Taiwan government’s dedication in energy transformation aims to produce and generate 20% of its
electricity from renewable sources by 2025.
Assuming to see the steady PV installation of additional output. Targets call for 6.5 GW by 2020 and
a total of 20 GW by 2025.
Solar Installation Plan
11
Source: Department of Information Services, Executive Yuan
0
5,000
10,000
15,000
20,000
25,000
2012 2013 2014 2015 2016 2017 2018 2019 2020 2021 2022 2023 2024 2025
Actual Installation Target Installation Accumulative Installation
Unit: MW

© Sino-American Silicon Products Inc. All rights reserved.
SAS Consolidated
Performance Update
12

© Sino-American Silicon Products Inc. All rights reserved.
1. Revenue 2019 revenue reaches NTD 65.5B (USD 2.19 B)1, a decrease of 5.4% YoY.
2H19 revenue reaches NTD 31.3B (USD 1.05B)1, a decrease of 10.5% YoY.
(nearly 90% contributed by GWC semiconductor wafer business)
2. Minimizing Solar Sector Loss By recognizing onerous contract provision (NTD4.35bn) of polysilicon LTA in 19Q2,
SAS is alleviated from its last LTA burden, a healthier financial structure is anticipated.
3. GM, Net Profit & EPS Financial results excluding onerous contract provision indicates more clearly SAS’
operations and profitability.
2019 Gross Margin : NTD 19.3B (Record High!)
2019 Operating Profit : NTD 13.5B (Record High!)
2019 EPS : NTD 3.86
2H19 EPS : NTD 4.62
4. Sufficient Cash 2019 net cash position reaches NT$ 34,901mn (USD 1,164 mn)*1
13
Note : 1. FX Rate: NTD:USD = 29.98
Financial Highlights

© Sino-American Silicon Products Inc. All rights reserved.
(NT$mn) 2019 2018 YoY
Revenue 65,510 69,239 -5.4%
EBITDA*1 18,668 19,030 -1.9%
EBITDA % 28.5% 27.5% 1.0%
EBIT 12,049 13,047 -7.6%
Operating Profit 13,515 13,178 2.6%
Operating Profit % 20.6% 19.0% 1.6%
Net Profit 8,895 8,635 3.0%
Net Profit % 13.6% 12.5% 1.1%
EPS NT$3.86 NT$3.36 NT$0.50
ROE*2 (annualized) 18.4% 18.8% -0.4%
ROA*3(annualized) 8.5% 9.1% -0.7%
Financial Highlight : 2019 vs. 2018
1.EBITDA= Net Profit + Tax + Interests + Depreciation + Amortization.
2.ROE = Net Profit / Average Shareholders Equity
3.ROA = (Net Profit + Interest*(1- Effective Tax Rate))/Average Asset
14

© Sino-American Silicon Products Inc. All rights reserved. 15
15,772
16,007
16,891
17,308 17,275
17,765
17,505
16,656
16,107
15,242
Q317 Q417 Q118 Q218 Q318 Q418 Q119 Q219 Q319 Q419
22,215
27,821 28,269
31,599
59,371
69,239
65,510
2013 2014 2015 2016* 2017 2018 2019
Quarterly Annual
(NT$mn) (NT$mn)
Revenue
Note:
1.Upon completion of GWC’s acquisition of SunEdison Semiconductor (“SEMI”) in 2016, FY2016 financials has included earnings from SEMI from the period of 02 Dec 2016 – 31 Dec 2016.
2. Impairment of assets and onerous contract provision were recognized in Q418 & Q219 respectively

© Sino-American Silicon Products Inc. All rights reserved.
18,642 19,267
2,439 3,498
4,271 3,435
11,403
11% 13% 15%
11%
19%
27% 29%
2013 2014 2015 2016* 2017 2018* 2019*
Gross Margin GM% (incl. write-off)
3,313
3,934
1,880
3,739
4,641 4,861
5,206
6,497
5,546 5,188
21% 23%
27% 28% 30%
22%
37%
11%
34% 34%
Q317 Q417 Q118 Q218 Q318 Q418* Q119 Q219* Q319 Q419
Gross Margin GM% (incl. write-off)
(NT$mn) (NT$mn)
Quarterly Annual
16
Gross Profit
Note:
1.Upon completion of GWC’s acquisition of SunEdison Semiconductor (“SEMI”) in 2016, FY2016 financials has included earnings from SEMI from the period of 02 Dec 2016 – 31 Dec 2016.
2. Impairment of assets and onerous contract provision were recognized in Q418 & Q219 respectively

© Sino-American Silicon Products Inc. All rights reserved.
13,178 13,515
629 1,447
2,236
42
6,325
3% 5%
8%
0%
11%
19% 21%
2013 2014 2015 2016* 2017 2018* 2019*
Operating Profit OP% (incl. write-off)
2,565
622
2,094 2,284
3,330 3,408
3,875
5,064
4,082
3,591
13% 14%
19% 20% 22%
14%
29%
4%
25% 24%
Q317 Q417 Q118 Q218 Q318 Q418* Q119 Q219* Q319 Q419
Operating Profit OP% (incl. write-off)
(NT$mn) (NT$mn)
Quarterly Annual
17
Operating Profit
Note:
1.Upon completion of GWC’s acquisition of SunEdison Semiconductor (“SEMI”) in 2016, FY2016 financials has included earnings from SEMI from the period of 02 Dec 2016 – 31 Dec 2016.
2. Impairment of assets and onerous contract provision were recognized in Q418 & Q219 respectively

© Sino-American Silicon Products Inc. All rights reserved.
1,281
-552
1,564 1,497
2,055
2,706 2,594
3,716
3,230
2,501
10% 9%
12%
16% 15%
7%
21%
-3%
20%
16%
Q317 Q417 Q118 Q218 Q318 Q418* Q119 Q219* Q319 Q419
Net Profit NP% (incl. write-off)
-1,289
8,635 8,895
340
1,299 1,056
3,519
2% 5% 4%
-4%
6%
12% 14%
2013 2014 2015 2016* 2017 2018* 2019*
Net Profit NP% (incl. write-off)
(NT$mn) (NT$mn)
Quarterly Annual
18
Net Profit
Note:
1.Upon completion of GWC’s acquisition of SunEdison Semiconductor (“SEMI”) in 2016, FY2016 financials has included earnings from SEMI from the period of 02 Dec 2016 – 31 Dec 2016.
2. Impairment of assets and onerous contract provision were recognized in Q418 & Q219 respectively

© Sino-American Silicon Products Inc. All rights reserved.
-0.99
-3.92
1.34 0.94
1.23
1.7 1.42
3.15 2.76
1.86
Q317 Q417 Q118 Q218 Q318 Q418* Q119 Q219* Q319 Q419
EPS
3.36
-0.76
3.86
0.57
2.06
0.93
-2.77
1.8
2013 2014 2015 2016* 2017 2018* 1H19* 2019*
EPS (NT$ ) (NT$ )
Quarterly Annual
19
EPS
Note:
1.Upon completion of GWC’s acquisition of SunEdison Semiconductor (“SEMI”) in 2016, FY2016 financials has included earnings from SEMI from the period of 02 Dec 2016 – 31 Dec 2016.
2. Impairment of assets and onerous contract provision were recognized in Q418 & Q219 respectively

© Sino-American Silicon Products Inc. All rights reserved.
14,978
16,996 18,615 18,821
24,206
21,757 21,073
2013 2014 2015 2016 2017 2018 2019
(NT$mn)
Abundant Capital Surplus Capable of Fruitful Dividend
With abundant capital surplus, SAS is capable of distributing dividend even in the absence of remunerative earning.
Distribution from capital surplus reduces the exposure of taxable dividends.
Capital Surplus
20

© Sino-American Silicon Products Inc. All rights reserved.
* 2019 dividend payout is subject to AGM approval on June 24, 2020
Multiple Dividend Distribution Dividend payout in every 6 months as steady income stream for shareholders, beneficial for
reinvest and flexible use of funds.
Delivering a robust track record of dividend payments reflects SAS’s commitment to share the constant growth with shareholders.
Dividend Distribution schedule :
• 20201H dividend → to be distributed in 2021Q1
• 20202H dividend → to be distributed in 2021Q3
295
1,128
535
-1,589
1,036
1,951 2,248
523
1,044 862 862
1,760 1,759
2,931
177%
93%
161% 170%
90%
130%
-200%
-150%
-100%
-50%
0%
50%
100%
150%
200%
-2,000
-1,000
-
1,000
2,000
3,000
4,000
5,000
2013 2014 2015 2016 2017 2018 2019
Net Income (attributed to parent company) Dividend Distritution Dividend / Net Income (%)
21
(NT$mn)
Dividend Distribution vs. Net Income Attributed to Parent Company

© Sino-American Silicon Products Inc. All rights reserved.
Dividend Payout SAS is committed to provide stable dividend payout to its shareholders with lucrative yield rate
even when net income is negative.
Dividend versus EPS
Dividend
Payout
Ratio
175.4% 87.4% 161.3% NA 166.7% 89.3% 129.5%
* 2019 dividend payout is subject to AGM approval on June 24, 2020
22
0.57
2.06 0.93
-2.77
1.80
3.36 3.86
0.80
2.31 2.58
1.00 1.80 0.70
1.50
3.00
0.69
2.42
-4
-2
0
2
4
6
2013 2014 2015 2016 2017 2018 2019
EPS Dividend from Earning Dividend from Capital Surplus

© Sino-American Silicon Products Inc. All rights reserved.
66.6%
55.6%
Q117 Q419
34,972
11,465
7,796
34,901
Q117 Q419
Total Loan Cash
(NT$m
n) Net Cash Position
23
Total Liabilities to Total Asset
Cash increased due to GWC’s repayment of all bank loans associated with the acquisition of SunEdison Semiconductor in 4Q16.
Possessing sufficient net cash on book with considerable contribution from GWC for sustainable development and high-potential investment.
Total Loan and Cash
Leverage

© Sino-American Silicon Products Inc. All rights reserved.
Income statement
(NT$mm) 2013 2014 2015 2016* 2017 2018* 2019*
Revenue 22,215 27,821 28,269 31,599 59,371 69,239 65,510
Growth (%) 20.8% 25.2% 1.6% 11.8% 87.9% 16.6% (5.4%)
Gross Profit 2,439 3,498 4,271 3,435 11,403 18,642 19,267
Gross Profit Margin (%) 11.0% 12.6% 15.1% 10.9% 19.2% 26.9% 29.4%
EBITDA 4,058 4,214 4,184 2,052 11,741 19,030 18,668
EBITDA Margin (%) 18.3% 15.1% 14.8% 6.5% 19.8% 27.5% 28.5%
Operating Profit 629 1,447 2,236 42 6,325 13,178 13,515
Operating Profit Margin (%) 2.8% 5.2% 7.9% 0.1% 10.7% 19.0% 20.6%
Profit before Tax 128 1,925 1,960 (856) 5,126 13,318 13,924
Profit before Tax Margin (%) 0.6% 6.9% 6.9% (2.7%) 8.6% 19.2% 21.3%
Net Profit 340 1,299 1,056 (1,289) 3,519 8,635 8,895
Net Profit Margin (%) 1.5% 4.7% 3.7% (4.1%) 5.9% 12.5% 13.6%
EPS (NT$) 0.57 2.06 0.93 (2.77) 1.80 3.36 3.86
24
Note:
1.Upon completion of GWC’s acquisition of SunEdison Semiconductor (“SEMI”) in 2016, FY2016 financials has included earnings from SEMI from the period of 02 Dec 2016 – 31
Dec 2016.
2. Impairment of assets and onerous contract provision were recognized in Q418 & Q219 respectively
Income Statement

© Sino-American Silicon Products Inc. All rights reserved.
Balance Sheet
(NT$mm) 2013 2014 2015 2016* 2017 2018* 2019*
Assets
Cash and cash equivalents 3,682 5,391 5,902 9,269 20,343 36,829 34,901
Account receivable 4,064 5,019 6,204 8,560 8,830 9,881 8,507
Inventories 4,416 1,607 5,749 9,708 10,048 7,881 7,398
Property, plant and equipment 16,098 15,244 18,905 41,398 37,529 37,439 40,277
Other assets 11,414 13,627 9,427 14,079 12,593 11,955 18,300
Total assets 39,674 40,887 46,186 83,014 89,343 103,985 109,383
Liabilities
Short-term loan 2,576 3,486 2,676 17,704 14,367 9,335 11,465
Account payable 2,754 2,713 2,932 6,328 5,352 5,236 4,180
Long term loan 4,373 3,807 2,546 16,357 5,034 2,040 0
Other liabilities 9,385 9,299 9,464 15,399 20,814 39,460 45,122
Total liabilities 19,088 19,304 17,617 55,787 45,566 56,071 60,767
Shareholder Equity 20,586 21,583 28,570 27,227 43,777 47,914 48,616
25
Note:
1. Upon completion of GWC’s acquisition of SunEdison Semiconductor (“SEMI”) in 2016, FY2016 financials has included earnings from SEMI from the period of 02 Dec 2016 – 31
Dec 2016.
2. Impairment of assets and onerous contract provision were recognized in Q418 & Q219 respectively
3. Account receivables include account receivables from related parties.
4. Account payables include account payables from related parties.
Balance Sheet

© Sino-American Silicon Products Inc. All rights reserved. 26
GWC Performance Update

© Sino-American Silicon Products Inc. All rights reserved. 27
1. All-Time High
EBITDA %, GM & GM%, OP & OP%, Net Income & Net income %, EPS……
Reflect correct operational strategy and supply chain management efficiencies.
2. EPS & Dividend
2019 EPS amounts to NT$ 31.35. (BEST EVER)
Appropriate NTD25*1 as dividends. (Pay-out ratio 79.7%)
Dividend payout once in every six months.
3. Financial Leverage
Sufficient net cash position – NT$ 32,822 mn (US$ 1,095 mn)*2.
Prepayment – NT$ 20,393 mn (US$ 680 mn)*2.
2019 Financial Highlights
Note:
1. 2019 dividend payout is subject to AGM approval on June 23, 2020
2. FX Rate: NTD:USD = 29.98

© Sino-American Silicon Products Inc. All rights reserved. 28
Financial Highlight : 2019 vs. 2018
1.EBITDA = Net Profit + Tax + Interests + Depreciation + Amortization.
2.ROE = Net Profit / Average Shareholders Equity
3.ROA = (Net Profit + Interest*(1- Effective Tax Rate))/Average Asset
(NT$mn) 2019 2018 YoY
Revenue 58,094 59,064 -1.6%
EBITDA*1 22,648 22,712 -0.3%
EBITDA % 39.0% 38.5% 1.4%
EBIT 17,902 17,897 0.0%
Operating Profit 17,897 17,578 1.8%
Operating Profit % 30.8% 29.8% 1.0%
Net Profit 13,636 13,634 0.0%
Net Profit % 23.5% 23.1% 0.4%
EPS NT$31.35 NT$31.18 NT$0.17
ROE*2 (annualized) 30.9% 35.3% -4.4%
ROA*3(annualized) 14.7% 17.1% -2.5%
© Sino-American Silicon Products Inc. All rights reserved.
6.14 6.60 5.80
2.54
12.68
31.18 31.35
2013 2014 2015 2016 2017 2018 2019
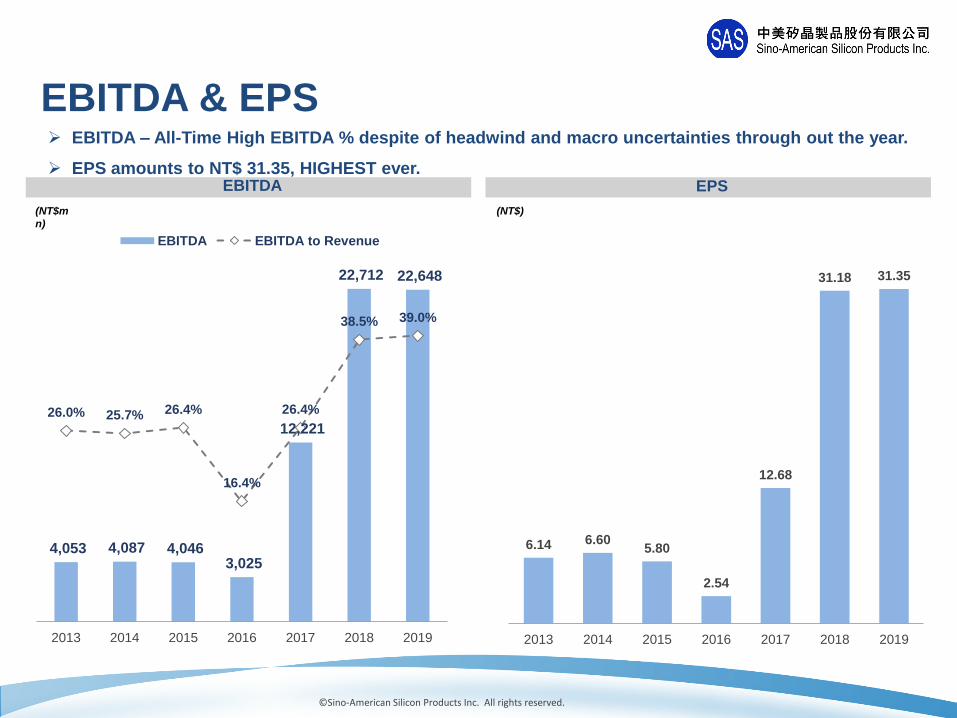
EBITDA – All-Time High EBITDA % despite of headwind and macro uncertainties through out the year.
EPS amounts to NT$ 31.35, HIGHEST ever. EBITDA EPS
(NT$m
n)
(NT$)
4,053 4,087 4,046 3,025
12,221
22,712 22,648
26.0% 25.7% 26.4%
16.4%
26.4%
38.5% 39.0%
2013 2014 2015 2016 2017 2018 2019
EBITDA EBITDA to Revenue
EBITDA & EPS

© Sino-American Silicon Products Inc. All rights reserved.
6.14 6.60 5.80
2.54
12.68
31.18 31.35
5.50 5.70 5.00
2.50
10.00
25.00 25.00
2013 2014 2015 2016 2017 2018 2019
EPS Dividend
Dividend
Payout
Ratio%
89.6% 86.4% 86.2% 98.4% 78.9% 80.2% 79.7%
30
(NT$)
Dividend Payout Lucrative EPS in conjunction with high dividend payout policy bring out profitable earnings for
shareholders.
* 2019 dividend payout is subject to AGM approval on June 23, 2020
Dividend Payout since 2012 versus EPS

© Sino-American Silicon Products Inc. All rights reserved. 31
Income Statement
(NT$mn) 2013 2014 2015 2016 2017 2018 2019
Revenue 15,570 15,922 15,310 18,427 46,213 59,064 58,094
Growth (%) - 2.3% -3.8% 20.4% 150.8% 27.8% -1.6%
Gross Profit 3,663 3,728 4,073 4,130 11,808 22,299 22,847
Gross Profit Margin (%) 23.5% 23.4% 26.6% 22.4% 25.6% 37.8% 39.3%
EBITDA 4,053 4,087 4,046 3,025 12,221 22,712 22,648
EBITDA Margin (%) 26.0% 25.7% 26.4% 16.4% 26.4% 38.5% 39.0%
Operating Profit 2,194 2,336 2,685 1,378 7,414 17,578 17,897
Operating Profit Margin (%) 14.1% 14.7% 17.5% 7.5% 16.0% 29.8% 30.8%
Profit before Tax 2,204 2,679 2,808 1,344 6,875 18,253 18,554
Profit before Tax Margin (%) 14.2% 16.8% 18.3% 7.3% 14.9% 30.9% 31.9%
Net Profit 1,948 2,095 2,044 939 5,278 13,634 13,636
Net Profit Margin (%) 12.5% 13.2% 13.4% 5.1% 11.4% 23.1% 23.5%
EPS (NT$) 6.14 6.60 5.80 2.54 12.68 31.18 31.35
Income Statement
Note: Upon completion of GWC’s acquisition of SunEdison Semiconductor (“SEMI”) in 2016, FY2016 financials has included earnings from SEMI from the period of 02 Dec 2016 – 31 Dec 2016.

© Sino-American Silicon Products Inc. All rights reserved. 32
Balance Sheet
(NT$mn) 2013 2014 2015 2016 2017 2018 2019
Assets
Cash and cash equivalents 1,536 2,685 3,662 5,628 18,794 35,214 32,822
Account receivable 3,165 3,694 4,538 7,642 7,869 9,226 8,140
Inventories 3,291 2,829 3,262 7,307 7,347 7,040 6,849
Property, plant and equipment 9,796 8,972 9,361 31,036 28,202 30,887 34,697
Other assets 3,286 3,204 2,994 8,948 8,020 7,455 14,078
Total assets 21,074 21,385 23,816 60,560 70,232 89,822 96,586
Liabilities
Short-term loan 1,302 2,069 696 12,982 10,738 5,042 9,886
Account payable 1,816 1,789 1,383 5,126 4,269 4,870 3,837
Long term loan -- -- -- 14,367 3,663 430 0
Other liabilities 4,821 4,325 5,012 12,267 17,508 36,324 37,790
Total liabilities 7,939 8,184 7,091 44,742 36,178 46,666 51,513
Shareholder equity 13,135 13,201 16,725 15,819 34,054 43,156 45,073
Balance Sheet
Note:
1.Upon completion of GWC’s acquisition of SunEdison Semiconductor (“SEMI”) in 2016, FY2016 financials has included earnings from SEMI from the period of 02 Dec 2016 – 31 Dec 2016.
2.Account receivables include account receivables from related parties.
3.Account payables include account payables from related parties.

© Sino-American Silicon Products Inc. All rights reserved. 33
Q&A

© Sino-American Silicon Products Inc. All rights reserved.
Thank you
34