Embed Size (px)
Citation preview

i
2013-2014
Simran Singh Gill
September, 2014
Saskatchewan Dental Health Screening Program Report

ii
Saskatchewan Dental Health Screening Program Report
2013-14

iii
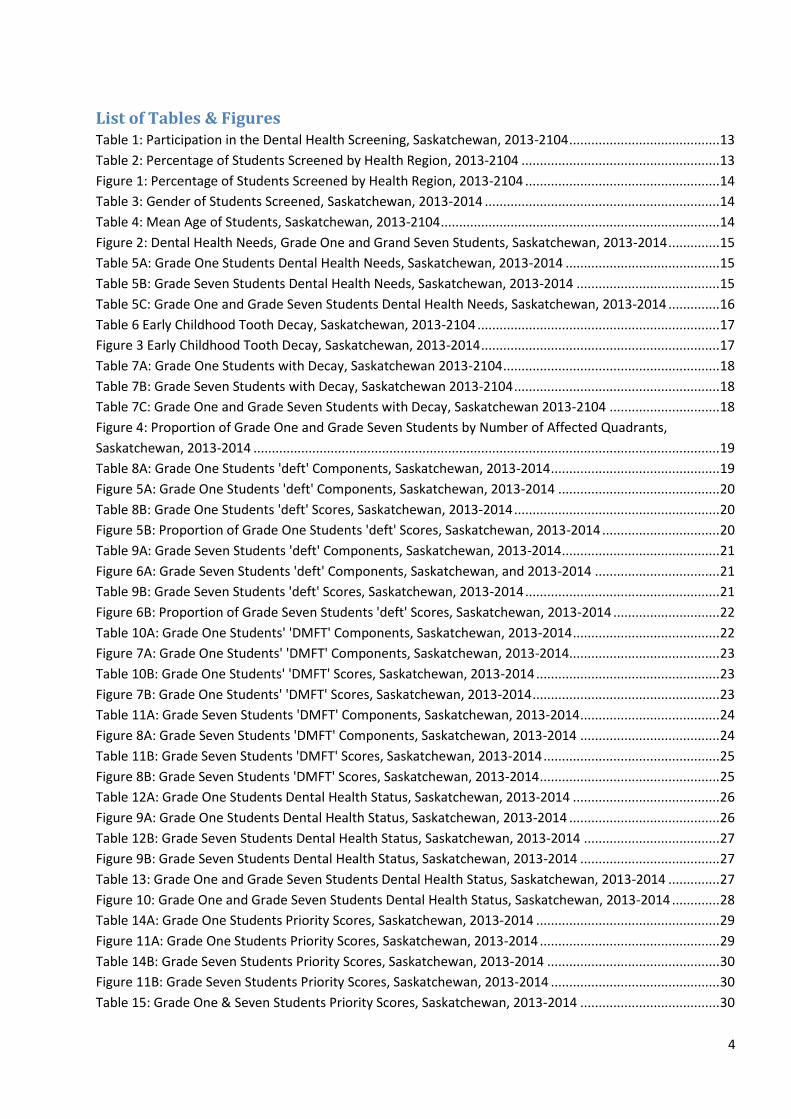
Table of Contents List of Tables & Figures .................................................................................................................................. 4
Acknowledgements ........................................................................................................................................ 6
Executive Summary ........................................................................................................................................ 7
Introduction ................................................................................................................................................. 11
Methods ....................................................................................................................................................... 12
Dental Health Screening Results, Saskatchewan 2013-2014 ....................................................................... 13
Participation ............................................................................................................................................. 13
Location .................................................................................................................................................... 13
Gender Distribution ................................................................................................................................. 14
Age ........................................................................................................................................................... 14
Dental Health Assessment ....................................................................................................................... 14
Early Childhood Tooth Decay (ECTD) ....................................................................................................... 17
Quadrants ................................................................................................................................................ 18
'deft' Index ............................................................................................................................................... 19
'DMFT' Index ............................................................................................................................................ 22
Dental Health Status ................................................................................................................................ 26
Priority Scores .......................................................................................................................................... 29
Tobacco Usage: ........................................................................................................................................ 31
Dental Health Trends in Saskatchewan ................................................................................................... 32
Canadian Oral Health Strategy (COHS) Guidelines for 2010: Goal 21 ...................................................... 37
Canadian Oral Health Framework 2013-2014 (COHF):2 ........................................................................... 40
Dental Health Disparities ......................................................................................................................... 43
COMPARATIVE ANALYSIS ......................................................................................................................... 44
Dental Health Status by Region ............................................................................................................... 59
Epidemiological Studies: .......................................................................................................................... 60
Discussion..................................................................................................................................................... 62
APPENDIX .................................................................................................................................................. 64
References ................................................................................................................................................... 79
4
List of Tables & Figures Table 1: Participation in the Dental Health Screening, Saskatchewan, 2013-2104 ......................................... 13
Table 2: Percentage of Students Screened by Health Region, 2013-2104 ...................................................... 13
Figure 1: Percentage of Students Screened by Health Region, 2013-2104 ..................................................... 14
Table 3: Gender of Students Screened, Saskatchewan, 2013-2014 ................................................................ 14
Table 4: Mean Age of Students, Saskatchewan, 2013-2104 ............................................................................ 14
Figure 2: Dental Health Needs, Grade One and Grand Seven Students, Saskatchewan, 2013-2014 .............. 15
Table 5A: Grade One Students Dental Health Needs, Saskatchewan, 2013-2014 .......................................... 15
Table 5B: Grade Seven Students Dental Health Needs, Saskatchewan, 2013-2014 ....................................... 15
Table 5C: Grade One and Grade Seven Students Dental Health Needs, Saskatchewan, 2013-2014 .............. 16
Table 6 Early Childhood Tooth Decay, Saskatchewan, 2013-2104 .................................................................. 17
Figure 3 Early Childhood Tooth Decay, Saskatchewan, 2013-2014 ................................................................. 17
Table 7A: Grade One Students with Decay, Saskatchewan 2013-2104 ........................................................... 18
Table 7B: Grade Seven Students with Decay, Saskatchewan 2013-2104 ........................................................ 18
Table 7C: Grade One and Grade Seven Students with Decay, Saskatchewan 2013-2104 .............................. 18
Figure 4: Proportion of Grade One and Grade Seven Students by Number of Affected Quadrants,
Saskatchewan, 2013-2014 ............................................................................................................................... 19
Table 8A: Grade One Students 'deft' Components, Saskatchewan, 2013-2014 .............................................. 19
Figure 5A: Grade One Students 'deft' Components, Saskatchewan, 2013-2014 ............................................ 20
Table 8B: Grade One Students 'deft' Scores, Saskatchewan, 2013-2014 ........................................................ 20
Figure 5B: Proportion of Grade One Students 'deft' Scores, Saskatchewan, 2013-2014 ................................ 20
Table 9A: Grade Seven Students 'deft' Components, Saskatchewan, 2013-2014 ........................................... 21
Figure 6A: Grade Seven Students 'deft' Components, Saskatchewan, and 2013-2014 .................................. 21
Table 9B: Grade Seven Students 'deft' Scores, Saskatchewan, 2013-2014 ..................................................... 21
Figure 6B: Proportion of Grade Seven Students 'deft' Scores, Saskatchewan, 2013-2014 ............................. 22
Table 10A: Grade One Students' 'DMFT' Components, Saskatchewan, 2013-2014 ........................................ 22
Figure 7A: Grade One Students' 'DMFT' Components, Saskatchewan, 2013-2014......................................... 23
Table 10B: Grade One Students' 'DMFT' Scores, Saskatchewan, 2013-2014 .................................................. 23
Figure 7B: Grade One Students' 'DMFT' Scores, Saskatchewan, 2013-2014 ................................................... 23
Table 11A: Grade Seven Students 'DMFT' Components, Saskatchewan, 2013-2014 ...................................... 24
Figure 8A: Grade Seven Students 'DMFT' Components, Saskatchewan, 2013-2014 ...................................... 24
Table 11B: Grade Seven Students 'DMFT' Scores, Saskatchewan, 2013-2014 ................................................ 25
Figure 8B: Grade Seven Students 'DMFT' Scores, Saskatchewan, 2013-2014 ................................................. 25
Table 12A: Grade One Students Dental Health Status, Saskatchewan, 2013-2014 ........................................ 26
Figure 9A: Grade One Students Dental Health Status, Saskatchewan, 2013-2014 ......................................... 26
Table 12B: Grade Seven Students Dental Health Status, Saskatchewan, 2013-2014 ..................................... 27
Figure 9B: Grade Seven Students Dental Health Status, Saskatchewan, 2013-2014 ...................................... 27
Table 13: Grade One and Grade Seven Students Dental Health Status, Saskatchewan, 2013-2014 .............. 27
Figure 10: Grade One and Grade Seven Students Dental Health Status, Saskatchewan, 2013-2014 ............. 28
Table 14A: Grade One Students Priority Scores, Saskatchewan, 2013-2014 .................................................. 29
Figure 11A: Grade One Students Priority Scores, Saskatchewan, 2013-2014 ................................................. 29
Table 14B: Grade Seven Students Priority Scores, Saskatchewan, 2013-2014 ............................................... 30
Figure 11B: Grade Seven Students Priority Scores, Saskatchewan, 2013-2014 .............................................. 30
Table 15: Grade One & Seven Students Priority Scores, Saskatchewan, 2013-2014 ...................................... 30

5
Figure 12: Grade One & Seven Students Priority Scores, Saskatchewan, 2013-2014 ..................................... 31
Table16: Grade One Students Dental Health by Screening Year, Saskatchewan ............................................ 32
Figure 13: Grade One Comparisons; Average deft/DMFT ............................................................................... 32
Figure 14: Grade One Comparisons; % with Cavities ....................................................................................... 33
Figure 15: Grade One Comparisons; % with No Evidence of Dental Care ....................................................... 33
Figure 16: Grade One Comparisons; Pain (%) .................................................................................................. 34
Figure 17: Grade One Comparisons; %Cavity Free .......................................................................................... 34
Table17: Grade Seven Students Dental Health by Screening Year, Saskatchewan ......................................... 35
Figure 18: Grade Seven Comparisons; Average 'deft/DMFT' .......................................................................... 35
Figure 19: Grade Seven Comparisons; % with Cavities .................................................................................... 35
Figure 20: Grade Seven Comparisons; % Cavities free .................................................................................... 36
Table 18: COHS 2010 Guidelines, Saskatchewan (Grade One; 2008-09 vs. 2013-14) ..................................... 37
Table 19: COHS 2010 Guidelines, Saskatchewan (Grade Seven; 2008-09 vs. 2013-14) .................................. 38
Table 20 Canadian Oral Health Guidelines for 2018: 6-year old ..................................................................... 40
Table 21: Canadian Oral Health Guidelines for 2018: 12-year old .................................................................. 41
Table 22: COHF 2013-2018; FN/I school based preventive services ............................................................... 42
Table-23: Comparative analysis; Urban vs. Rural ............................................................................................ 44
.Figure 21: Dental Health of Students by Urban/Rural School Location, Saskatchewan, 2013-2014. ............ 45
Table-24: Comparative analysis; Water Supply: Fluoridated vs. Non-Fluoridated .......................................... 46
Figure 22: Dental Health of Students by Fluoridated/Non-Fluoridated Water Supply, Saskatchewan, 2013-
2014. ................................................................................................................................................................ 47
Table-25: Comparative analysis; Dental Visit; YES vs. NO ............................................................................... 48
Figure 23: Dental Health of Students by Dental Visit YES/NO, Saskatchewan, 2013-2014. ............................ 50
Table-26: Comparative Analysis; Aboriginal vs. Non-Aboriginal. .................................................................... 51
Figure 24: Dental Health of Students by Aboriginal/Non-Aboriginal Status, Saskatchewan, 2013-2014. ...... 52
Table 27: Comparative Analysis; Hutterite vs. Non-Hutterite. ........................................................................ 53
Figure 25: Dental Health of Students by Hutterite/Non-Hutterite Community, Saskatchewan, 2013-2014. . 54
Table 28: Comparative Analysis; Dental Insurance (Yes vs. No). ..................................................................... 55
Figure 26: Dental Health of Students by Dental Insurance Yes vs. No, Saskatchewan, 2013-2014. ............... 56
Table 29: Comparative Analysis; City (Regina vs. Saskatoon). ......................................................................... 57
Figure 27: Dental Health of Students by City (Regina vs. Saskatoon), Saskatchewan, 2013-2014. ................. 58
Table 30: Dental Health of Students by Health Region. 2013-2014, Saskatchewan ....................................... 59
Table 31: Calculation of Odds Ratio for being Cavity free between Urban and Rural communities in
Saskatchewan, 2013-2014 ............................................................................................................................... 60
Table 32: Calculation of Odds Ratio for being Cavity free between Schools that have access to Community
Water Fluoridation and Schools that do not have access in Saskatchewan, 2013-2014 ................................ 60
Table 33: Calculation of Odds Ratio for being Cavity free between Hutterite Schools and Non-Hutterite
Schools in Saskatchewan, 2013-2014 .............................................................................................................. 61

6
Acknowledgements
Dental Health Screening Advisors
Leslie Topola Manager, Population and Public Health
Cynthia Ostafie Saskatoon Health Region
Julie Laberge-Lalonde Saskatoon Health Region
Cindy Hansen Keewatin Yatthé Health Region
Cathleen Lesperance Prince Albert Parkland Health Region
Ashley White Prairie North Health Region
Clara Ellert Five Hills Health Region
Shari Moneta Kelsey Trail Health Region
Janet Gray Mamawetan Churchill River Health Region
Loretta Singh Cypress Health Region
Bernie Laevens Sunrise Health Region
Valerie Stopanski Heartland Health Region
Juanita McArthur Big Eagle Sun Country Health Region
Rosemary Henricksen Regina Qu'Appelle Health Region
Data Analysis
Simran S Gill M.P.H. Practicum Student (U of S)
Writing
Simran S Gill M.P.H. Practicum Student (U of S)
Leslie Topola Manager, Population and Public Health
Editing
Simran S Gill M.P.H. Practicum Student (U of S)
Leslie Topola Manager, Population and Public Health
Cynthia Ostafie Dental Health Educator
Julie Laberge-Lalonde Dental Health Educator
Office Administration
Bob Toso IT Department
Joyce Birchfield Office Administrative Assistant
Barbara Anderson Office Administrative Assistant
Josh Marko Epidemiologist, Public Health Observatory
Sponsor
College of Dentistry, University of Saskatchewan

7
Executive Summary
The Saskatchewan Dental Health Screening Program 2013-2014 Report highlights the
results of dental health screening program in Saskatchewan during 2013-2014. It assesses
the oral health status, monitors trends, determines the schools and communities that are
at high risk for caries, identifies the students with unmet dental needs and measures the
effectiveness of preventive dental programs. It is the fifth screening survey of the
Saskatchewan Dental Health Education Program since its introduction in 1993-1994. The
2013-2014 screening provides a comprehensive and pivotal appraisal of the dental health
of Grade One and Grade Seven students. The screening program involved the public
health dental professionals and was designed to have an insight on the dental health of
children in Saskatchewan.
In 2013-2014 school year, 19279 children participated in the provincial Grade One and
Grade Seven dental screenings (Table-1). Along with the proportion of students screened
in each health region (Table-2), analysis of the gender distribution and mean age of
students participating in dental screening was also carried out (Table 3 & 4). The oral
health issues like Calculus, Staining, Gingivitis and Malocclusion were analyzed to
understand the oral health better (Table 5).
The 2013-2014 Dental Health Screening marks the introduction of measuring and analysis
of Early Childhood Tooth Decay (ECTD) (previously measured as Early Childhood Caries)
and Severe Early Childhood Tooth Decay, which is an additional component of ECTD
(Table-6) (Appendix-2). ECTD was measured using a different criteria, thus, it cannot be
compared to the past screening results. However, it provides the baseline for the future
screenings. ECTD was experienced by 2.76% of Grade One students (Table-6) and rate of
S-ECTD in Grade One students was 2.17%.
To determine the caries burden, carious involvement of quadrants was assessed. The
Grade One students had a higher carious burden with 27.62% of students having visible
tooth decay while 14.23 % of Grade Seven students had visible tooth decay at the time of
examination.
The tooth decay in the primary and permanent dentition was determined using 'deft' and
'DMFT' index respectively. The 'deft' measures the prevalence of dental caries (past or
present) in primary dentition and is a significant indicator of tooth decay in Grade One
students. The 'DMFT' index is used to determine the prevalence of caries in permanent
dentition (Appendix-1). The results of 2013-2014 screening showed that Saskatchewan
children in Grade One are experiencing more decay as compared to Grade Seven
students. The average deft+DMFT for Grade One students was 3.58 in relation to average
deft+DMFT of 1.68 for Grade Seven students.
The prevalence of dental caries for primary dentition among Grade One students in
Saskatchewan, 2013-2014, was 60.69% (See Table 8B). The proportion of Grade One
students with at least one decayed primary tooth was 27.95% while 4.19% students had at
least one or more decayed permanent teeth. The prevalence of dental caries in the

8
permanent dentition among Grade Seven students was 43.28% (Table 11B). Also, 3.95%
Grade Seven students had at least one decayed primary tooth while 12.79% students had
at least one or more decayed permanent teeth.
The deft and DMFT indices were used to allocate Dental Health Status to each child,
categorized as NDE, CCC, PCC and NEC (Appendix-3). Grade One students were shown
to have caries experience with 15.97% partial caries care (PCC) and 13.54% students had
no evidence of care (NEC) (Table12). For Grade Seven students, the caries experience
was 9.26% with partial caries care (PCC) and 6.44% students had no evidence of care
(NEC) (Table 12B). Compared to 2008-2009, NEC increased from 8.6% to 10.44% in 2013-
2014 for Grade One and Grade Seven Combined while NDE decreased from 49.20% in
2008-2009 to 44.19% in 2013-2014.
Unmet dental needs were measured in the Dental Health Screening 2013-2014 based on
the Priority scores for both Grade One and Grade Seven. Of the Grade One students,
72.33% did not require any immediate treatment while proportion of students with unmet
dental needs was 27.67%. (Table 14A). For Grade Seven students, 85.96% did not require
any immediate treatment while the percentage of unmet dental needs among Grade
Seven students of Saskatchewan was 14.02%.
Optional information was collected from the students regarding dental insurance
coverage, visit to dentist in past year, history of dental sealants and tobacco usage. Of
the students who responded to the Tobacco usage question, 0.71% responded with 'Yes'.
The dental health trends in Saskatchewan were analyzed and compared with the
previous dental screenings. The analysis outlines the decline in oral health of
Saskatchewan students as measured from factors like average deft+DMFT, current
cavities and absence of decay. The percentage of Grade One students with cavities was
highest (29.71%) and that of cavity free (39.2%) was lowest in 2013-2014 as compared to
all the dental screenings since 1993-1994. However, Grade One students have shown
improvement in the number of students presenting with pain and those who have no
evidence of care compared to previous dental screenings (Table 16). On the other hand,
Grade Seven students showed improvement only in the case of students who presented
with pain while depicting decline in other factors when compared to 2008-2009 (Table
17).
The 2008-2009 Dental Health Screening used Canadian Oral Health Strategy 2005-2010
(COHS)1 to assess the results in accordance with goals and guidelines. The results of 2013-
2014 were also analyzed on the basis of COHS 2010 guidelines to determine the progress
in relation to the previous Dental Screening program. The screening results of 2008-2009
did not meet the goals for Grade One/6 year old children while it partially met goals for
Grade Seven/12 year old children. However, the results from 2013-2014 screening did not
meet the goals for both Grade One/6 year old and Grade Seven/12 year old children.
Overall the measurements in 2008-2009 for the COHS guidelines were better as compared
to the measurements in 2013-2014 (Table 18 &19).
9
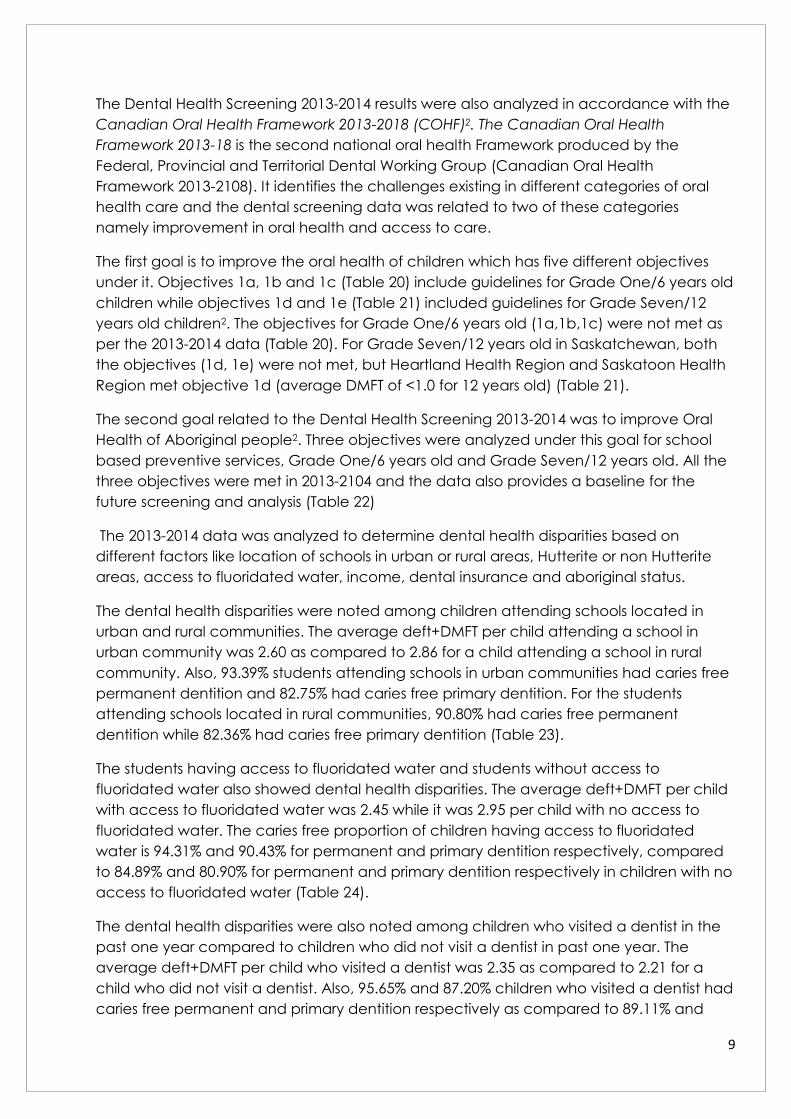
The Dental Health Screening 2013-2014 results were also analyzed in accordance with the
Canadian Oral Health Framework 2013-2018 (COHF)2. The Canadian Oral Health
Framework 2013-18 is the second national oral health Framework produced by the
Federal, Provincial and Territorial Dental Working Group (Canadian Oral Health
Framework 2013-2108). It identifies the challenges existing in different categories of oral
health care and the dental screening data was related to two of these categories
namely improvement in oral health and access to care.
The first goal is to improve the oral health of children which has five different objectives
under it. Objectives 1a, 1b and 1c (Table 20) include guidelines for Grade One/6 years old
children while objectives 1d and 1e (Table 21) included guidelines for Grade Seven/12
years old children2. The objectives for Grade One/6 years old (1a,1b,1c) were not met as
per the 2013-2014 data (Table 20). For Grade Seven/12 years old in Saskatchewan, both
the objectives (1d, 1e) were not met, but Heartland Health Region and Saskatoon Health
Region met objective 1d (average DMFT of <1.0 for 12 years old) (Table 21).
The second goal related to the Dental Health Screening 2013-2014 was to improve Oral
Health of Aboriginal people2. Three objectives were analyzed under this goal for school
based preventive services, Grade One/6 years old and Grade Seven/12 years old. All the
three objectives were met in 2013-2104 and the data also provides a baseline for the
future screening and analysis (Table 22)
The 2013-2014 data was analyzed to determine dental health disparities based on
different factors like location of schools in urban or rural areas, Hutterite or non Hutterite
areas, access to fluoridated water, income, dental insurance and aboriginal status.
The dental health disparities were noted among children attending schools located in
urban and rural communities. The average deft+DMFT per child attending a school in
urban community was 2.60 as compared to 2.86 for a child attending a school in rural
community. Also, 93.39% students attending schools in urban communities had caries free
permanent dentition and 82.75% had caries free primary dentition. For the students
attending schools located in rural communities, 90.80% had caries free permanent
dentition while 82.36% had caries free primary dentition (Table 23).
The students having access to fluoridated water and students without access to
fluoridated water also showed dental health disparities. The average deft+DMFT per child
with access to fluoridated water was 2.45 while it was 2.95 per child with no access to
fluoridated water. The caries free proportion of children having access to fluoridated
water is 94.31% and 90.43% for permanent and primary dentition respectively, compared
to 84.89% and 80.90% for permanent and primary dentition respectively in children with no
access to fluoridated water (Table 24).
The dental health disparities were also noted among children who visited a dentist in the
past one year compared to children who did not visit a dentist in past one year. The
average deft+DMFT per child who visited a dentist was 2.35 as compared to 2.21 for a
child who did not visit a dentist. Also, 95.65% and 87.20% children who visited a dentist had
caries free permanent and primary dentition respectively as compared to 89.11% and
10
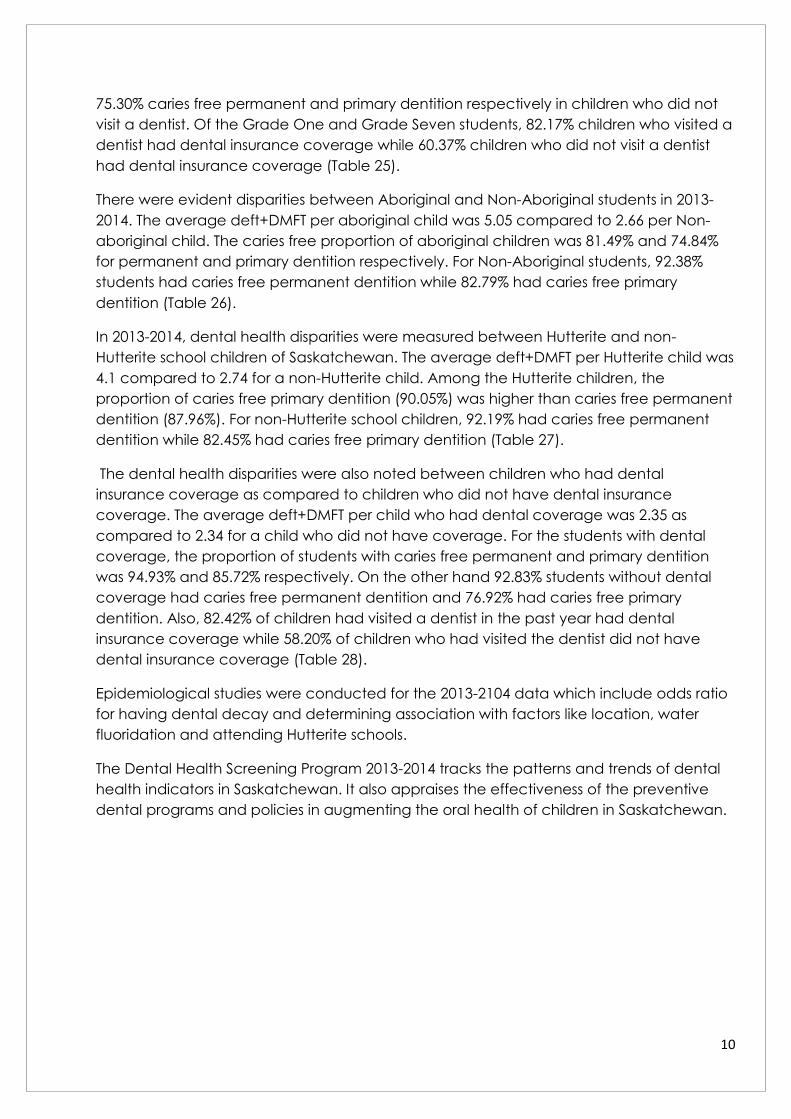
75.30% caries free permanent and primary dentition respectively in children who did not
visit a dentist. Of the Grade One and Grade Seven students, 82.17% children who visited a
dentist had dental insurance coverage while 60.37% children who did not visit a dentist
had dental insurance coverage (Table 25).
There were evident disparities between Aboriginal and Non-Aboriginal students in 2013-
2014. The average deft+DMFT per aboriginal child was 5.05 compared to 2.66 per Non-
aboriginal child. The caries free proportion of aboriginal children was 81.49% and 74.84%
for permanent and primary dentition respectively. For Non-Aboriginal students, 92.38%
students had caries free permanent dentition while 82.79% had caries free primary
dentition (Table 26).
In 2013-2014, dental health disparities were measured between Hutterite and non-
Hutterite school children of Saskatchewan. The average deft+DMFT per Hutterite child was
4.1 compared to 2.74 for a non-Hutterite child. Among the Hutterite children, the
proportion of caries free primary dentition (90.05%) was higher than caries free permanent
dentition (87.96%). For non-Hutterite school children, 92.19% had caries free permanent
dentition while 82.45% had caries free primary dentition (Table 27).
The dental health disparities were also noted between children who had dental
insurance coverage as compared to children who did not have dental insurance
coverage. The average deft+DMFT per child who had dental coverage was 2.35 as
compared to 2.34 for a child who did not have coverage. For the students with dental
coverage, the proportion of students with caries free permanent and primary dentition
was 94.93% and 85.72% respectively. On the other hand 92.83% students without dental
coverage had caries free permanent dentition and 76.92% had caries free primary
dentition. Also, 82.42% of children had visited a dentist in the past year had dental
insurance coverage while 58.20% of children who had visited the dentist did not have
dental insurance coverage (Table 28).
Epidemiological studies were conducted for the 2013-2104 data which include odds ratio
for having dental decay and determining association with factors like location, water
fluoridation and attending Hutterite schools.
The Dental Health Screening Program 2013-2014 tracks the patterns and trends of dental
health indicators in Saskatchewan. It also appraises the effectiveness of the preventive
dental programs and policies in augmenting the oral health of children in Saskatchewan.
11
Introduction
Oral health is an integral part of overall health and contributes to physical, mental and
social wellbeing. Good oral health is imperative to enjoy life's possibilities, as it allows one
to speak, eat and socialize unhindered by pain, discomfort or embarrassment.3
According to World Health Organization (WHO), a healthy oral cavity is a state free from
chronic oro-facial pain, oro-pharyngeal cancer, oral ulcers, congenital oro-facial defects
such as cleft palate and cleft lips, dental caries, tooth fatality due to dental caries and
other pathological factors that affect the oral cavity.4 WHO estimates 60-90% of school
children worldwide have dental cavities, often leading to pain and discomfort.5 It is
considered one of the major factors of economic burden owing to oral health issues.5
Oral health is greatly influenced by socioeconomic factors. Canadian Oral Health
Framework 2013-2014 identifies the disparities among different populations regarding
access to dental care and higher rates of disease in specific populations.2 There has
been a decrease in funding of publicly-provided services in Canada which can further
widen these disparities.2 First Nations and Inuit people are found to have higher rate of
dental caries than non-Aboriginals and they have lesser access to oral health care than
the Canadian average.2
Despite being preventable, dental caries greatly impairs the quality of life due to inflicting
pain, difficulty eating and sleeping. Once established, dental caries requires treatment
and if left untreated, it not only becomes extensive but more expensive to repair also.6
Early Childhood Decay is a severe form of tooth decay affecting primary teeth in child 71
months of age or younger. It involves multiple primary teeth and in severe cases may
require dental surgery under general anesthesia.7
Dental caries can be prevented by maintaining a constant low level of fluoride in the oral
cavity. Water fluoridation is the most effective public health measure for the prevention of
dental decay.6,8 Long term exposure to optimal levels of fluoride level in water significantly
reduce the dental caries in children as well as adults.6 Other sources of fluoride are
toothpastes, mouth rinses and gels, as well as through application of foams and
varnishes.8
The dental health screening report provides comprehensive information regarding oral
health status of the Grade One and Grade Seven students in Saskatchewan including
comparative analysis based on health disparities.
12
Methods
Dental screening was offered to all the Grade One and Grade Seven students who
attended schools in Saskatchewan between September 2013 and 2014,
The oral health screenings were carried out by licensed Saskatchewan Dental Therapists
and a licensed Dental Hygienist by recording history and visual examinations of Grade
One and Grade Seven students. Mouth mirrors, LED (light emitting diode) flashlights were
used to carry out visual oral examinations. The examinations recorded oral health
indicators like filled/restored teeth and cavitated lesions/untreated tooth decay. These
recordings were then entered into the database where further oral health measures were
calculated using the Microsoft Access Software.
A 'Dear Parent/Guardian' letter was initially provided (Appendix - 6) which also included
four optional questions to be filled by the parent/guardian. The responses to these
questions were also added to the database along with the other screening data.
Students were assessed for possible health needs, and these were communicated via a
'Dear Parent/Guardian letter'. The students were also provided basic recommendation for
oral hygiene, including illustrations of proper flossing and tooth brushing techniques.
An extensive oral health data was collected through history, visual examination and 'Dear
Parent/Guardian' letter. The data was then entered into an Access database. The
screening data was exported to Microsoft Excel and SPSS 22.0 for analysis. The data was
cleaned, filtered and compared to original database. In cases where anomalous values
were not resolved, they were excluded from the analysis.
Grade One and Grade Seven students were analyzed together for dental health
disparities. Epidemiological studies, involving Odds ratio for having Dental decay were
calculated using the software OpenEpi, Version 2.3. The significance level used for
inferential statistics was 0.05 prior to calculation of p-value.

13
Dental Health Screening Results, Saskatchewan 2013-2014
Participation
The total students enrolled in Grade One and Grade Seven are 22851, out of which 19279
students* participated in the Dental Health Screening 2013-2014. Out of the total number
of students screened, 10851 students were of Grade One while 8428 were of Grade
Seven. There were 12 out of 13 health regions that participated in the dental screening.
The Athabsca Health Authority (AHA) did not participate due to staffing.
Table 1: Participation in the Dental Health Screening, Saskatchewan, 2013-2104
Participation-Saskatchewan 2013-2014
Total Enrolments Total Screened* Total Absent\Refused
22851 19279 (84.37%) 3572 (15.13%) *Includes students screened in schools only
Location
Of the total number of students screened, 10168 students attended rural schools and 9111
attended urban schools*. Majority of the students included in the analysis were from
Saskatoon Health Region (6611), Regina Qu'Appelle Health Region (4493), and the rest
were from other small health regions in Saskatchewan. (See Table 2, Figure 1)
Table 2: Percentage of Students Screened by Health Region, 2013-2104
Location
Location of School Screened Number Percentage
Cypress 841 4.36%
Five Hills 840 4.36%
Heartland 809 4.20%
Keewatin Yatthé 134 0.70%
Kelsey Trail 774 4.01%
Mamawetan Churchill River 374 1.94%
Prairie North 1148 5.95%
Prince Albert Parkland 1315 6.82%
Regina Qu’Appelle 4493 23.31%
Saskatoon 6611 34.29%
Sun Country 830 4.31%
Sunrise 1110 5.76% *Includes students screened in schools only **Athabasca Health Authority) did not participate due to lack of staff to carry out the dental screenings

14
Figure 1: Percentage of Students Screened by Health Region, 2013-2104
Gender Distribution
The gender distribution seems to be similar in Grade One while the proportion of male
students seems to be higher than female students in Grade Seven. (See Table 3)
Table 3: Gender of Students Screened, Saskatchewan, 2013-2014
Grade Male* Female*
Number Percentage Number Percentage
Grade One 5371 50.3% 5299 49.7%
Grade Seven 4316 52.1% 3963 47.9% *Gender recorded for 10670 Grade 1 students & 8279 Grade 7 students
Age
Student's date of birth and date of examination were entered into the screening
database and the descriptive statistics were analysed based on this information
Table 4: Mean Age of Students, Saskatchewan, 2013-2104
Mean Age
Grade One 6.67 years (80.09 months)
Grade Seven 12.67 years (152.08 months)
Dental Health Assessment
Dental Health Assessment ascertains the dental health by determining decayed, treated
or teeth extracted due to caries. These three aspects of dental health assessment are
5% 4%
4% 1%
4% 2%
6%
7%
23%
34%
4% 6%
Students Screened by Location
Cypress
Five Hills
Heartland
Keewatin
Kelsey Trail
Mamawetan
Praire North
Prince Albert
Regina
Saskatoon
Sun Country
Sun Rise

15
important for determining past or present caries experiences and also any outstanding
dental needs.
The factors included for assessment of Dental Health Needs were malocclusion, staining,
gingivitis and calculus, the extent of which is illustrated in Figure 2 and Tables 5 A&B
Figure 2: Dental Health Needs, Grade One and Grand Seven Students, Saskatchewan, 2013-2014
Table 5: Grade One and Grade Seven Students Dental Health Needs, Saskatchewan, 2013-2014
Table 5A: Grade One Students Dental Health Needs, Saskatchewan, 2013-2014
Grade 1
Dental Health Need Malocclusion Staining Gingival Calculus
Number 1379 689 145 182
Percentage 12.70% 6.34% 1.33% 1.67%
Table 5B: Grade Seven Students Dental Health Needs, Saskatchewan, 2013-2014
Grade 7
Dental Health Need Malocclusion Staining Gingival Calculus
Number 2137 526 691 415
Percentage 25.35% 6.24% 8.19% 4.94%
Malocclusion Staining Gingival Calculus
Grade 1 12.70% 6.34% 1.33% 1.67%
Grade 7 25.35% 6.24% 8.19% 4.94%
0%
5%
10%
15%
20%
25%
30%
Pe
rce
nta
ge
Dental Health Need 2013-14
Grade 1 vs Grade 7
16
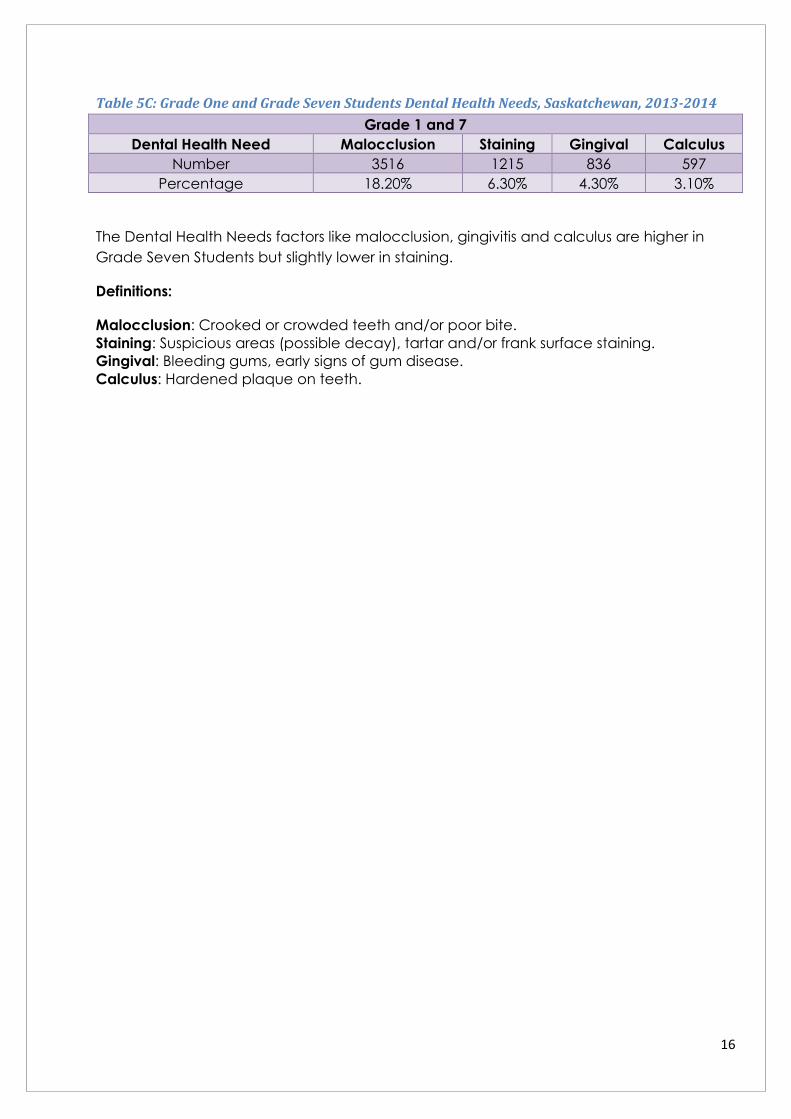
Table 5C: Grade One and Grade Seven Students Dental Health Needs, Saskatchewan, 2013-2014
Grade 1 and 7
Dental Health Need Malocclusion Staining Gingival Calculus
Number 3516 1215 836 597
Percentage 18.20% 6.30% 4.30% 3.10%
The Dental Health Needs factors like malocclusion, gingivitis and calculus are higher in
Grade Seven Students but slightly lower in staining.
Definitions:
Malocclusion: Crooked or crowded teeth and/or poor bite.
Staining: Suspicious areas (possible decay), tartar and/or frank surface staining.
Gingival: Bleeding gums, early signs of gum disease.
Calculus: Hardened plaque on teeth.

17
Early Childhood Tooth Decay (ECTD)
ECTD is a rapid form of tooth decay affecting deciduous dentition which was previously
measured as Early Childhood Caries (ECC). As described by American Academy of
Pediatric Dentistry, 2008, ECTD has an additional form S-ECTD which is defined as extreme
form of ECTD. It is measured only for children less than or equal to 71 months of age.
Therefore, only Grade One students were assessed for ECTD; the extent is illustrated in
Table 6 and Figure 3
Table 6 Early Childhood Tooth Decay, Saskatchewan, 2013-2104
EARLY
CHILDHOOD
TOOTH
DECAY
ECTD S-ECTD NON-ECTD
300 236 10315
2.76% 2.17% 95.07%
Figure 3 Early Childhood Tooth Decay, Saskatchewan, 2013-2014
Early Childhood Caries was measured using a different criteria in the previous reports and
was not measured as ECTD. Therefore, the results mentioned above cannot be compared
to those of previous reports. Refer to Appendix (3), for Dental Screening Program
Definitions-2013/2014 for further details.
2.76% 2.17%
95.07%
Early Childhood Tooth Decay
ECTD
S-ECTD
NON-ECTD

18
Quadrants
Grade One and Grade Seven students were assessed for visible, current tooth decay and
scored on the specific quadrant (0-4) of the oral cavity. The dental arches were divided
into the quadrants as upper right, upper left, lower right and lower left. Any decay in one
of these quadrants was recorded as involved in decay.
There were 2997 (27.62%) Grade One students who had visible tooth decay and 1199
(14.23%) of Grade Seven students who had visible tooth decay at the time of
examination. The extent is illustrated in Table 7 and Figure 4
Table 7: Grade One and Grade Seven Students with Decay, Saskatchewan 2013-2104
Table 7A: Grade One Students with Decay, Saskatchewan 2013-2104
Grade 1
Quadrant None 1 Quadrant 2 Quadrant 3 Quadrant 4 Quadrant
Number 7854 1085 897 419 596
Percentage 72.38% 9.99% 8.26% 3.86% 5.49%
Table 7B: Grade Seven Students with Decay, Saskatchewan 2013-2104
Grade 7
Quadrant None 1 Quadrant 2 Quadrant 3 Quadrant 4 Quadrant
Number 7229 639 293 132 135
Percentage 85.77% 7.58% 3.48% 1.56% 1.60%
Table 7C: Grade One and Grade Seven Students with Decay, Saskatchewan 2013-2104
Grade 1 & 7
Quadrant None 1 Quadrant 2 Quadrant 3 Quadrant 4 Quadrant
Number 15083 1724 1190 551 731
Percentage 78.24% 8.94% 6.17% 2.86% 3.79%

19
Figure 4: Proportion of Grade One and Grade Seven Students by Number of Affected Quadrants,
Saskatchewan, 2013-2014
'deft' Index
'deft' is an index which describes the prevalence of caries in primary dentition. It has
three components namely decayed (d), extracted (due to caries) (e) and filled (f) which
measures the current caries as well as previous carious experience. It is calculated by
counting the number of decayed, extracted and filled deciduous teeth. Refer to
Appendix - 1 for the Dental Screening Program Definitions 2013-2104.
Table 8: Grade One Students 'deft' Components and Scores, Saskatchewan, 2013-2014
Table 8A: Grade One Students 'deft' Components, Saskatchewan, 2013-2014
Grade 1 deft Components
Number of Affected Teeth Decayed Extracted Filled
None 7818 (72.05%) 9209 (84.88%) 5996(55.28%)
1 to 3 1965 (18.11%) 1236 (11.39 %%) 1833 (16.90%)
4 to 6 633 (5.83%) 318(2.93%) 1679(15.48%)
7+ 435(4.01%) 86(0.79%) 1338(12.34%)
There were 27.95% Grade One students who had at least one decayed primary tooth.
About 15.11% had at least one primary tooth extracted as a consequence of dental
caries and the proportion with at least one primary tooth filled was 44.72%.
78%
9%
6%
3% 4%
Grade 1 & 7
Prpoprtion of Quadrants affected
None
1 Quadrant
2 Quadrant
3 Quadrant
4 Quadrant

20
Figure 5A: Grade One Students 'deft' Components, Saskatchewan, 2013-2014
Table 8B: Grade One Students 'deft' Scores, Saskatchewan, 2013-2014
Grade 1 deft Scores
deft' Score Number Proportion
0 4328 39.91%
1 to 3 2113 19.49%
4 to 6 1748 16.12%
7+ 2655 24.48%
Average deft for Grade One students was 3.4
Figure 5B: Proportion of Grade One Students 'deft' Scores, Saskatchewan, 2013-2014
The prevalence of dental caries for primary dentition among Grade One students in
Saskatchewan, 2013-2014, was 60.69%. (See Table 8B)
0% 10% 20% 30% 40% 50% 60% 70% 80% 90%
None
1 to 3
4 to 6
7+
None 1 to 3 4 to 6 7+
Filled 55.28% 16.90% 15.48% 12.34%
Extracted 84.88% 11.39% 2.93% 0.79%
Dcayed 72.05% 18.11% 5.83% 4.01%
Grade 1 'deft' Components
39.91%
19.49%
16.12%
24.48%
Grade 1 (deft) Scores
0
1 to 3
4 to 6
7+

21
Table 9: Grade Seven Students 'deft' Components and Scores, Saskatchewan, 2013-2014
Table 9A: Grade Seven Students 'deft' Components, Saskatchewan, 2013-2014
Grade 7 (deft)
Number of Affected Teeth Decayed Extracted Filled
None 8095 (96.05%) 8373 (99.35%) 7433 (88.19%)
1 to 3 316 (3.75%) 51 (0.61%) 824 (9.78%)
4 to 6 15 (0.18%) 4 (0.05%) 151 (1.79%)
7+ 2 (0.02%) 0 20 (0.24%)
Of the Grade Seven students, 3.95% had at least one decayed primary tooth. About
0.66% had at least one primary tooth extracted as a consequence of dental caries and
the proportion with at least one primary tooth filled was 11.81%.
Figure 6A: Grade Seven Students 'deft' Components, Saskatchewan, and 2013-2014
Table 9B: Grade Seven Students 'deft' Scores, Saskatchewan, 2013-2014
Grade 7 deft Scores
deft' Score Number Proportion
0 7220 85.67%
1 to 3 979 11.62%
4 to 6 198 2.35%
7+ 31 0.37%
Average deft for Grade Seven students was 0.33
0.00% 20.00% 40.00% 60.00% 80.00% 100.00% 120.00%
None
1 to 3
4 to 6
7+
None 1 to 3 4 to 6 7+
Filled 88.19% 9.78% 1.79% 0.24%
Extracted 99.35% 0.61% 0.05% 0
Dcayed 96.05% 3.75% 0.18% 0.02%
Grade 7 'deft' Components

22
Figure 6B: Proportion of Grade Seven Students 'deft' Scores, Saskatchewan, 2013-2014
The prevalence of dental caries for primary dentition among Grade Seven students in
Saskatchewan, 2013-2014, was 14.34%. (See Table 9B)
'DMFT' Index
'DMFT' is an index which describes the prevalence of caries index in permanent dentition.
It also has three components namely decayed (D), Missing (due to caries) (M) and filled
(due to caries) (F) which measures the current caries as well as previous carious
experience. It is calculated by counting the number of decayed, missing and filled
permanent teeth. Refer to Appendix - (1) for the Dental Screening Program Definitions
2013-2104.
Table 10: Grade One Students' 'DMFT' Components and Scores, Saskatchewan, 2013-2014
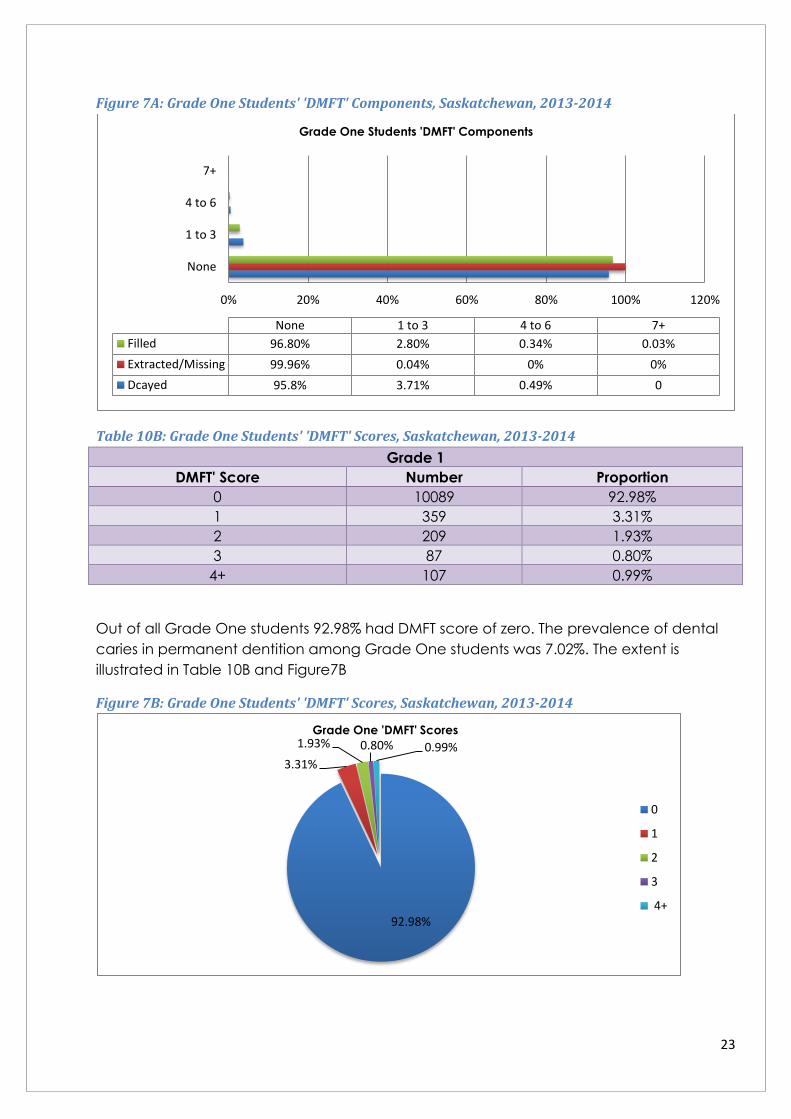
Table 10A: Grade One Students' 'DMFT' Components, Saskatchewan, 2013-2014
Grade 1 DMFT Components
Number of Affected Teeth Decayed Extracted/Missing Filled
None 10392 (95.8%) 10847 (99.96%) 10505(96.8%)
1 to 3 405 (3.7%) 4 (0.04%) 306(2.8%)
4 to 6 54 (0.49%) 0 (0%) 37(0.34%)
7+ 0 (0%) 0 (0%) 3(0.03%)
Out of the total Grade One students, 4.19% students had at least one or more Decayed
(D) and 0.04% had at least one tooth Missing (M) as a consequence of extraction due to
dental caries (Tooth Fatality Rate). On the other hand, 3.17% had at least one tooth filled
permanent teeth.
85.66%
11.62%
2.35% 0.37%
Grade 7 (deft) Scores
0
1 to 3
4 to 6
7+
23
Figure 7A: Grade One Students' 'DMFT' Components, Saskatchewan, 2013-2014
Table 10B: Grade One Students' 'DMFT' Scores, Saskatchewan, 2013-2014
Grade 1
DMFT' Score Number Proportion
0 10089 92.98%
1 359 3.31%
2 209 1.93%
3 87 0.80%
4+ 107 0.99%
Out of all Grade One students 92.98% had DMFT score of zero. The prevalence of dental
caries in permanent dentition among Grade One students was 7.02%. The extent is
illustrated in Table 10B and Figure7B
Figure 7B: Grade One Students' 'DMFT' Scores, Saskatchewan, 2013-2014
0% 20% 40% 60% 80% 100% 120%
None
1 to 3
4 to 6
7+
None 1 to 3 4 to 6 7+
Filled 96.80% 2.80% 0.34% 0.03%
Extracted/Missing 99.96% 0.04% 0% 0%
Dcayed 95.8% 3.71% 0.49% 0
Grade One Students 'DMFT' Components
92.98%
3.31%
1.93% 0.80% 0.99%
Grade One 'DMFT' Scores
0
1
2
3
4+

24
The low prevalence of caries in permanent teeth among Grade One students is due to
the eruption sequence of permanent teeth. They start erupting around age of six
(average of Grade One students), thus, Grade One students have a low number of
permanent teeth. This corresponds to low caries prevalence in permanent dentition in
them.
The average DMFT Score for Grade 1 was 0.13
Table 11: Grade Seven Students 'DMFT' Components and Scores, Saskatchewan, 2013-2014
Table 11A: Grade Seven Students 'DMFT' Components, Saskatchewan, 2013-2014
Grade 7
Number of Affected Teeth Decayed Extracted/Missing Filled
None 7350 (87.21%) 8190(97.18%) 5345 (63.42%)
1 to 3 863 (10.24%) 212 (2.52%) 2253 (26.73%)
4 to 6 154 (1.83%) 24 (0.28%) 696 (8.26%)
7+ 61 (0.72%) 2 (0.02%) 134 (1.59%)
Out of the total Grade Seven students, 12.79% students had at least one or more
Decayed (D) and 2.82% had at least one teeth Missing (M) as a consequence of
extraction due to dental caries (Tooth Fatality Rate). On the other hand, 36.58% had at
least one filled permanent tooth.
Figure 8A: Grade Seven Students 'DMFT' Components, Saskatchewan, 2013-2014
0% 20% 40% 60% 80% 100% 120%
None
1 to 3
4 to 6
7+
None 1 to 3 4 to 6 7+
Filled 63.42% 26.73% 8.26% 1.59%
Extracted/Missing 97.18% 2.52% 0.28% 0.02%
Dcayed 87.21% 10.24% 1.83% 0.72%
Grade Seven DMFT Components

25
Table 11B: Grade Seven Students 'DMFT' Scores, Saskatchewan, 2013-2014
Grade 7
DMFT' Score Number Proportion
0 4779 56.72%
1 996 11.82%
2 849 10.07%
3 539 6.40%
4+ 1265 15.01%
The average DMFT Score for Grade Seven was 1.35. Out of all Grade Seven students
56.72% had DMFT score of zero. The prevalence of dental caries in permanent dentition
among Grade Seven students was 43.28%. The extent is illustrated in Table 11B and Figure
8B
Figure 8B: Grade Seven Students 'DMFT' Scores, Saskatchewan, 2013-2014
56.70%
11.82%
10.07%
6.40% 15.01%
Grade 7 'DMFT' Scores
0
1
2
3
4+
26
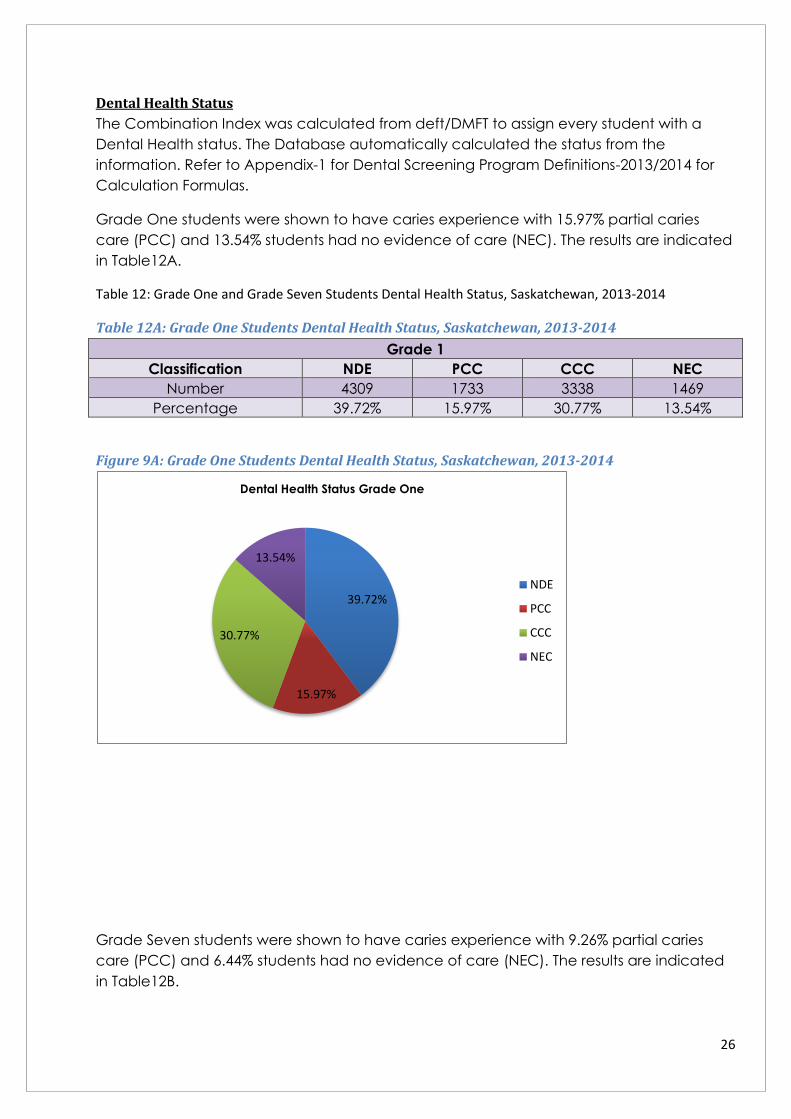
Dental Health Status
The Combination Index was calculated from deft/DMFT to assign every student with a
Dental Health status. The Database automatically calculated the status from the
information. Refer to Appendix-1 for Dental Screening Program Definitions-2013/2014 for
Calculation Formulas.
Grade One students were shown to have caries experience with 15.97% partial caries
care (PCC) and 13.54% students had no evidence of care (NEC). The results are indicated
in Table12A.
Table 12: Grade One and Grade Seven Students Dental Health Status, Saskatchewan, 2013-2014
Table 12A: Grade One Students Dental Health Status, Saskatchewan, 2013-2014
Grade 1
Classification NDE PCC CCC NEC
Number 4309 1733 3338 1469
Percentage 39.72% 15.97% 30.77% 13.54%
Figure 9A: Grade One Students Dental Health Status, Saskatchewan, 2013-2014
Grade Seven students were shown to have caries experience with 9.26% partial caries
care (PCC) and 6.44% students had no evidence of care (NEC). The results are indicated
in Table12B.
39.72%
15.97%
30.77%
13.54%
Dental Health Status Grade One
NDE
PCC
CCC
NEC

27
Table 12B: Grade Seven Students Dental Health Status, Saskatchewan, 2013-2014
Grade 7
Classification NDE PCC CCC NEC
Number 4210 780 2894 543
Percentage 49.96% 9.26% 34.34% 6.44%
Figure 9B: Grade Seven Students Dental Health Status, Saskatchewan, 2013-2014
Combined Grade One and Grade Seven: Dental Health Status:
Table 13: Grade One and Grade Seven Students Dental Health Status, Saskatchewan, 2013-2014
Combined Grade 1 & 7
Classification NDE PCC CCC NEC
Number 8519 2513 6232 2012
Percentage 44.19% 13.03% 32.33% 10.44%
49.96%
9.26%
34.34%
6.44%
Dental Health Status Grade Seven
NDE
PCC
CCC
NEC

28
Figure 10: Grade One and Grade Seven Students Dental Health Status, Saskatchewan, 2013-2014
Definitions:
NDE = No decay, fillings or extractions evident.
CCC = All decayed teeth appear to have been treated.
PCC = Some teeth are treated; but decay still evident.
NEC = Decay with no evidence of past or present treatment.
44.19%
13.04%
32.33%
10.44%
Dental Health Status Grade One & Grade Seven
NDE
PCC
CCC
NEC

29
Priority Scores
Depending on the urgency of their dental health needs, students were scored for
treatment priority. The priorities were assigned based on 3 categories which are as follows;
Priority 1 = Urgent (pain or infection) requiring immediate treatment.
Priority 2 = Treatment required as soon as possible.
Priority 3 = No immediate treatment indicated.
Table 14: Grade One and Grade Seven Students Priority Scores, Saskatchewan, 2013-2014
Of the Grade One Students, 72.33% did not require any immediate treatment. However,
the percentage of unmet dental needs among Grade One students of Saskatchewan is
27.67%. (See Table 14A and Figure 11A)
Table 14A: Grade One Students Priority Scores, Saskatchewan, 2013-2014
Priority Scores Grade One
1 2 3
219(2.02%) 2783(25.65%) 7849(72.33%)
Figure 11A: Grade One Students Priority Scores, Saskatchewan, 2013-2014
Of the Grade Seven Students, 85.96% did not require any immediate treatment. However,
the percentage of unmet dental needs among Grade Seven students of Saskatchewan is
14.02%. (See Table14B and Figure 11B)
2.02%
25.65%
72.33%
Priority Scores Grade One
1
2
3

30
Table 14B: Grade Seven Students Priority Scores, Saskatchewan, 2013-2014
Priority Scores Grade Seven
1 2 3
55(0.65%) 1127(13.37%) 7246(85.96%)
Figure 11B: Grade Seven Students Priority Scores, Saskatchewan, 2013-2014
Grade One and Grade Seven Combined: Priority Scores
Table 15 and Figure 12 illustrate the total number and percentage of Priority Scores in both
the grades combined.
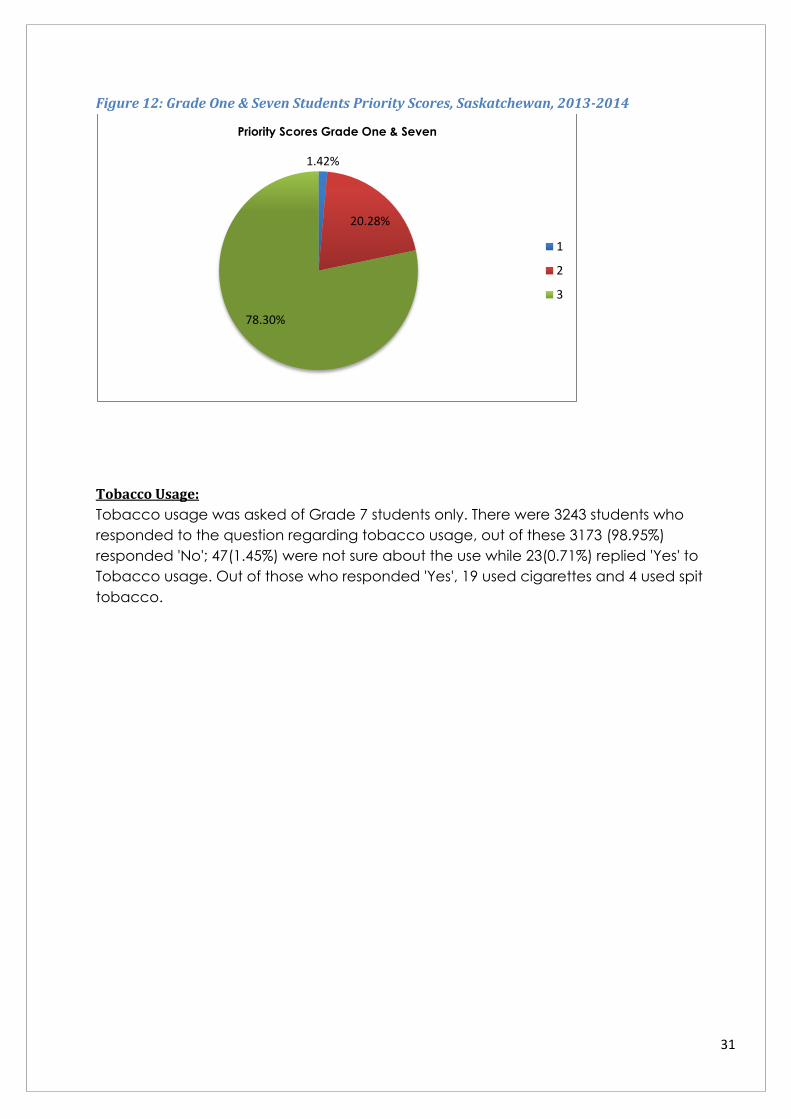
Table 15: Grade One & Seven Students Priority Scores, Saskatchewan, 2013-2014
Priority Scores Grade One and Seven
1 2 3
274(1.42%) 3910(20.28%) 15095(78.30%)
0.65%
13.37%
85.98%
Priority Scores Grade Seven
1
2
3
31
Figure 12: Grade One & Seven Students Priority Scores, Saskatchewan, 2013-2014
Tobacco Usage:
Tobacco usage was asked of Grade 7 students only. There were 3243 students who
responded to the question regarding tobacco usage, out of these 3173 (98.95%)
responded 'No'; 47(1.45%) were not sure about the use while 23(0.71%) replied 'Yes' to
Tobacco usage. Out of those who responded 'Yes', 19 used cigarettes and 4 used spit
tobacco.
1.42%
20.28%
78.30%
Priority Scores Grade One & Seven
1
2
3

32
Dental Health Trends in Saskatchewan
Table16: Grade One Students Dental Health by Screening Year, Saskatchewan
Grade 1
Screenin
g Year
Number of
Children
Screened
Average
‘deft/DMFT'
% with
Cavities
% with No
Evidence of
Dental Care
Pain
(%)
%
Cavity-
free
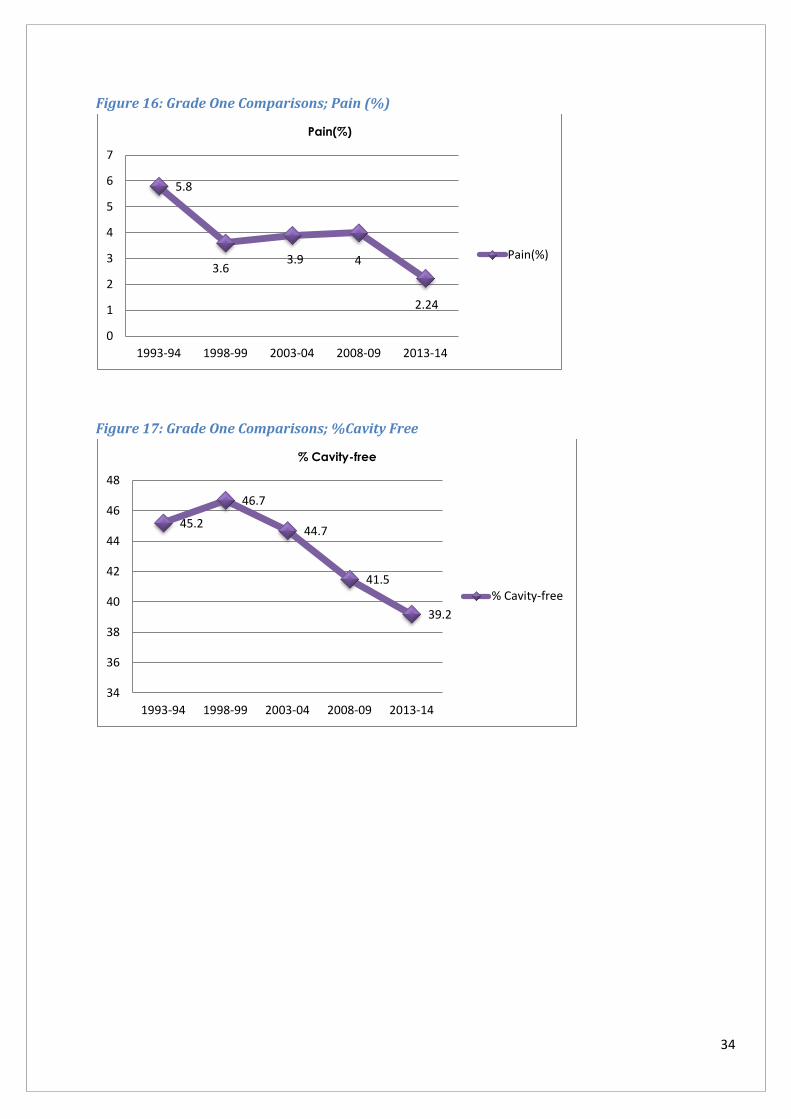
1993-94 13398 2.74 20 9.6 5.8 45.2
1998-99 12701 2.61 24.9 12.4 3.6 46.7
2003-04 10832 2.94 25.5 13.2 3.9 44.7
2008-09 9079 3.14 27.5 11.9 4 41.5
2013-14 10851 3.58 29.71 10.8 2.24 39.2
Figure 13: Grade One Comparisons; Average deft/DMFT
2.74 2.61
2.94 3.14
3.58
0
0.5
1
1.5
2
2.5
3
3.5
4
1993-94 1998-99 2003-04 2008-09 2013-14
Average ‘deft/DMFT'
Average ‘deft/DMFT'

33
Figure 14: Grade One Comparisons; % with Cavities
Figure 15: Grade One Comparisons; % with No Evidence of Dental Care
20
24.9 25.5
27.5 29.71
0
5
10
15
20
25
30
35
1993-94 1998-99 2003-04 2008-09 2013-14
% with Cavities
% with Cavities
9.6
12.4 13.2
11.9
10.8
0
2
4
6
8
10
12
14
1993-94 1998-99 2003-04 2008-09 2013-14
% with No Evidence of Dental Care
% with No Evidence ofDental Care
34
Figure 16: Grade One Comparisons; Pain (%)
Figure 17: Grade One Comparisons; %Cavity Free
5.8
3.6 3.9 4
2.24
0
1
2
3
4
5
6
7
1993-94 1998-99 2003-04 2008-09 2013-14
Pain(%)
Pain(%)
45.2
46.7
44.7
41.5
39.2
34
36
38
40
42
44
46
48
1993-94 1998-99 2003-04 2008-09 2013-14
% Cavity-free
% Cavity-free
35
Table17: Grade Seven Students Dental Health by Screening Year, Saskatchewan
Grade 7
Screening
Year
Number of
Children
Screened
Average
‘deft/DMFT'
% with
Cavities
% with No
Evidence of
Dental Care
Pai
n
(%)
%
Cavity-
free
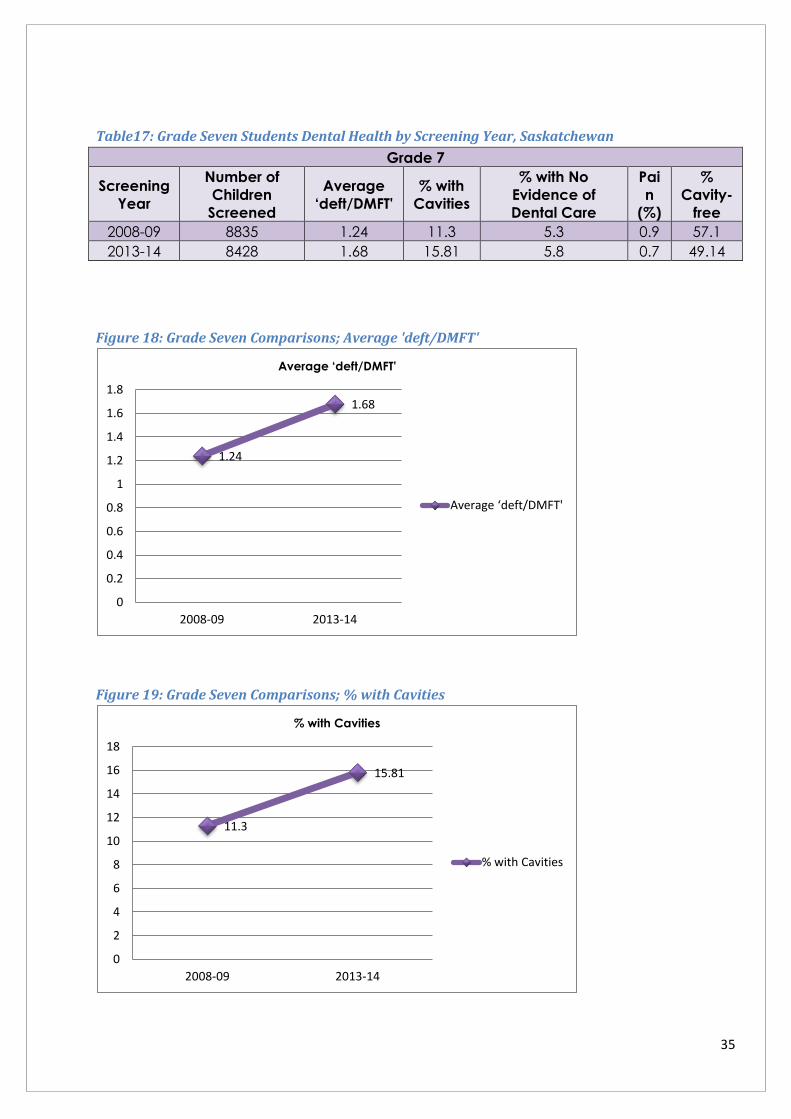
2008-09 8835 1.24 11.3 5.3 0.9 57.1
2013-14 8428 1.68 15.81 5.8 0.7 49.14
Figure 18: Grade Seven Comparisons; Average 'deft/DMFT'
Figure 19: Grade Seven Comparisons; % with Cavities
1.24
1.68
0
0.2
0.4
0.6
0.8
1
1.2
1.4
1.6
1.8
2008-09 2013-14
Average ‘deft/DMFT'
Average ‘deft/DMFT'
11.3
15.81
0
2
4
6
8
10
12
14
16
18
2008-09 2013-14
% with Cavities
% with Cavities
36
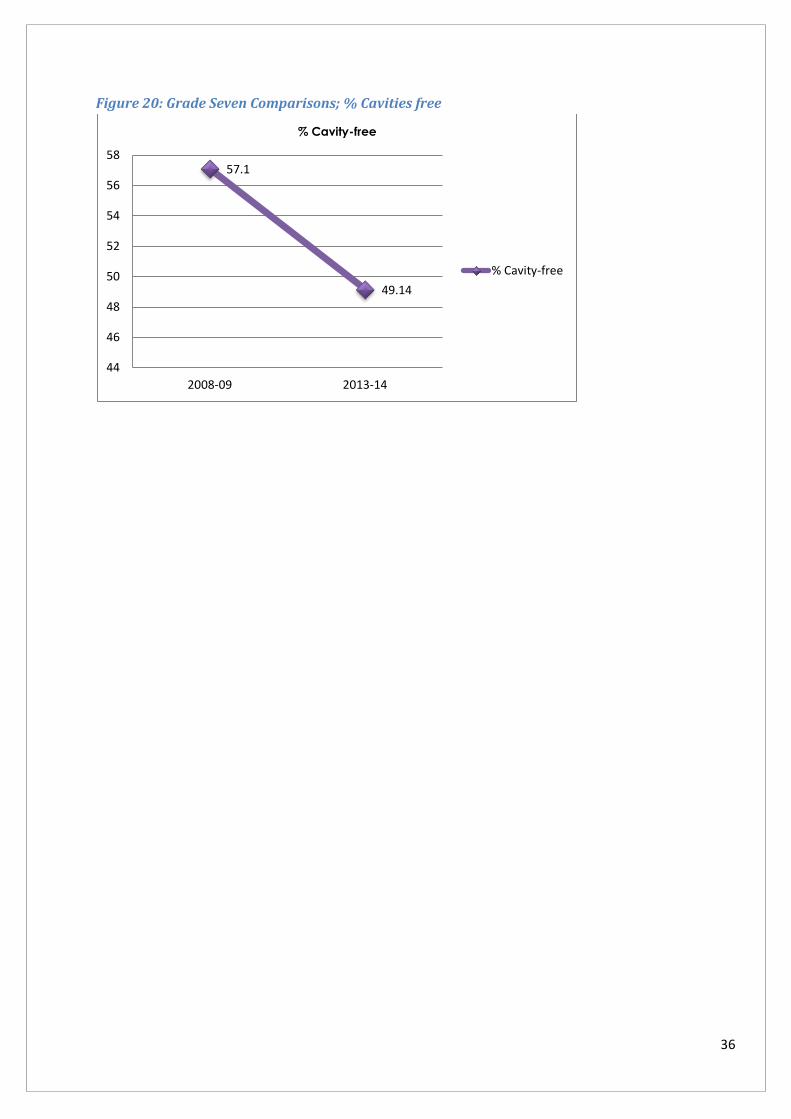
Figure 20: Grade Seven Comparisons; % Cavities free
57.1
49.14
44
46
48
50
52
54
56
58
2008-09 2013-14
% Cavity-free
% Cavity-free

37
Canadian Oral Health Strategy (COHS) Guidelines for 2010: Goal 21
2.2: Reduction of dental decay
At age 6, 50% of children have never experienced dental decay.
At age 6, no more than 20% of children have unmet dental treatment needs.
At age 12, 75% of children have never experienced decay in their permanent teeth.
At age 12, no more than 10% of children have unmet dental treatment needs.
At age 12, an average ‘DMFT’ of 1.0 or less.
At age 12, a ‘Significant Caries Index’, ‘DMFT’ of 3.0 or less.
Table 18: COHS 2010 Guidelines, Saskatchewan (Grade One; 2008-09 vs. 2013-14)
COHS Guidelines 2010: Grade One
Health Region
50% of children have never
experienced dental decay
No more than 20% of
children have unmet dental
treatment needs
2008-09 2013-14 2008-09 2013-14
Cypress 45.5% 36.8% 21.1% 27.5%
Five Hills 47.5% 40.2% 27.8% 31.6%
Heartland 35.0% 33.3% 28.1% 31.3%
Keewatin Yatthé 11.1% 5.2% 62.2% 61.0%
Kelsey Trail 34.0% 36.5% 32.8% 34.4%
Mamawetan Churchill River 21.6% 16.0% 56.5% 61.0%
Prairie North 37.8% 32.12% 27.1% 28.6%
Prince Albert Parkland 26.6% 27.8% 29.0% 38.9%
Regina Qu’Appelle 42.9% 38.6% 31.9% 33.8%
Saskatoon 50.8% 47.3% 19.4% 19.7%
Sun Country 43.4% 41.5% 29.6% 26.6%
Sunrise 35.7% 34.6% 26.5% 35.1%
Saskatchewan 41.5% 39.9% 27.1% 29.1%
The Canadian Oral Health Strategy (COHS) Guidelines 2010 for Saskatchewan Grade One
students are not met in 2013-2104 , as 39.9% of students have never experienced dental
decay and 29.1% of students have unmet dental treatment needs. In 2008-2009, the
COHS Guidelines were also not met as 41.5% of students have never experienced dental
decay and 27.1% of students have unmet dental treatment needs.
38
Table 19: COHS 2010 Guidelines, Saskatchewan (Grade Seven; 2008-09 vs. 2013-14)
COHS Guidelines 2010: Grade Seven
Health Region
75% of children
have never
experienced
decay in their
permanent
teeth
No more than
10% of children
have unmet
dental
treatment
needs
Average ‘DMFT’
of 1.0 or less
‘Significant
Caries Index’,
‘DMFT’ of 3.0 or
less.
2008-
09
2013-
14
2008-
09
2013-
14
2008-
09
2013-
14
2008-
09
2013-
14
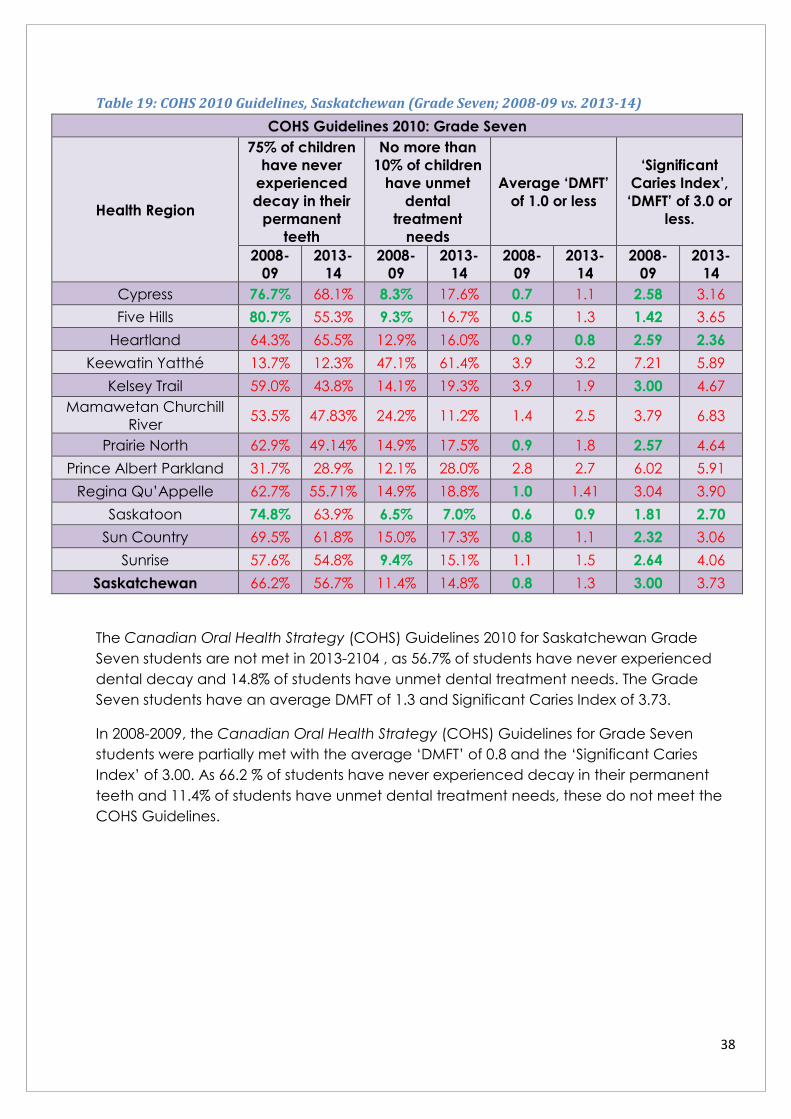
Cypress 76.7% 68.1% 8.3% 17.6% 0.7 1.1 2.58 3.16
Five Hills 80.7% 55.3% 9.3% 16.7% 0.5 1.3 1.42 3.65
Heartland 64.3% 65.5% 12.9% 16.0% 0.9 0.8 2.59 2.36
Keewatin Yatthé 13.7% 12.3% 47.1% 61.4% 3.9 3.2 7.21 5.89
Kelsey Trail 59.0% 43.8% 14.1% 19.3% 3.9 1.9 3.00 4.67
Mamawetan Churchill
River 53.5% 47.83% 24.2% 11.2% 1.4 2.5 3.79 6.83
Prairie North 62.9% 49.14% 14.9% 17.5% 0.9 1.8 2.57 4.64
Prince Albert Parkland 31.7% 28.9% 12.1% 28.0% 2.8 2.7 6.02 5.91
Regina Qu’Appelle 62.7% 55.71% 14.9% 18.8% 1.0 1.41 3.04 3.90
Saskatoon 74.8% 63.9% 6.5% 7.0% 0.6 0.9 1.81 2.70
Sun Country 69.5% 61.8% 15.0% 17.3% 0.8 1.1 2.32 3.06
Sunrise 57.6% 54.8% 9.4% 15.1% 1.1 1.5 2.64 4.06
Saskatchewan 66.2% 56.7% 11.4% 14.8% 0.8 1.3 3.00 3.73
The Canadian Oral Health Strategy (COHS) Guidelines 2010 for Saskatchewan Grade
Seven students are not met in 2013-2104 , as 56.7% of students have never experienced
dental decay and 14.8% of students have unmet dental treatment needs. The Grade
Seven students have an average DMFT of 1.3 and Significant Caries Index of 3.73.
In 2008-2009, the Canadian Oral Health Strategy (COHS) Guidelines for Grade Seven
students were partially met with the average ‘DMFT’ of 0.8 and the ‘Significant Caries
Index’ of 3.00. As 66.2 % of students have never experienced decay in their permanent
teeth and 11.4% of students have unmet dental treatment needs, these do not meet the
COHS Guidelines.

39
Significant Caries Index (SiC): Grade Seven Students, Saskatchewan, 2008-20091
Significant Caries Index for Grade Seven Students, Saskatchewan, 2013-2014 is 3.73 as
compared to 3.00 in 2008-2009.
Significant Caries Index:
New goal set by World Health Organization (WHO).
New goal set by the Canadian Oral Health Strategy Guidelines for Grade Seven/
children who are twelve years of age.
For countries, who still did not achieve the WHO/FDI (Fédération Dentaire
International) global health goal of ‘DMFT’ less than or equal to 3, this goal is an
urgent priority.
Ideally ‘SiC’ should be less than 3, by the year 2015.
SiC is calculated by recording the mean ‘DMFT’ scores of one-third of the population with
highest ‘DMFT’ scores.

40
Canadian Oral Health Framework 2013-2018 (COHF):2
Objectives:
Improve Oral Health: Improve Oral Health for Children and Youth
Access to Care: Improve Oral Health for Aboriginal People
Improve Oral Health: Improve Oral Health for Children and Youth
Table 20 Canadian Oral Health Guidelines for 2018: 6-year old
Canadian Oral Health Framework 2013-2018
S.No. Objective Baseline Indicator
1.a
Reduce the
number of teeth
affected by cavities
in 6-year-olds
2.52 deft +DMFT of <2.5 for 6
year old
1.b
Reduce the
percentage of 6-
year-olds who
experienced
cavities
46.60% 55% of 6 year
old have deft+DMFT=0
1.c
Reduce the
percentage of 6-
year-olds with
untreated cavities
18.60% <15% of 6 year
olds have d+D>0
Canadian Oral Health Framework 2013-2018 -6 year olds
Health Region 1.a 1.b 1.c
Cypress 3.45 36.84% 26.54%
Five Hills 3.83 40.16% 29.82%
Heartland 3.64 33.33% 28.41%
Keewatin Yatthé 8.07 5.19% 51.95%
Kelsey Trail 4.15 36.46% 31.90%
Mamawetan Churchill River 7.47 15.96% 52.58%
Prairie North 4.17 32.12% 27.69%
Prince Albert Parkland 5.19 27.83% 35.42%
Regina Qu’Appelle 3.53 38.63% 32.33%
Saskatoon 2.79 47.28% 20.92%
Sun Country 2.64 41.51% 25.58%
Sunrise 3.91 34.62% 33.95%
Saskatchewan 3.58 39.90% 28.20%
The Canadian Oral Health Strategy (COHS) Guidelines 2018 for Saskatchewan Grade One
students are not met as
deft+DMFT is 3.58 (1.a)
41
% of students with deft+DMFT=0 is 39.90% (1.b)
% of students with untreated cavities is 28.20% (1.c)
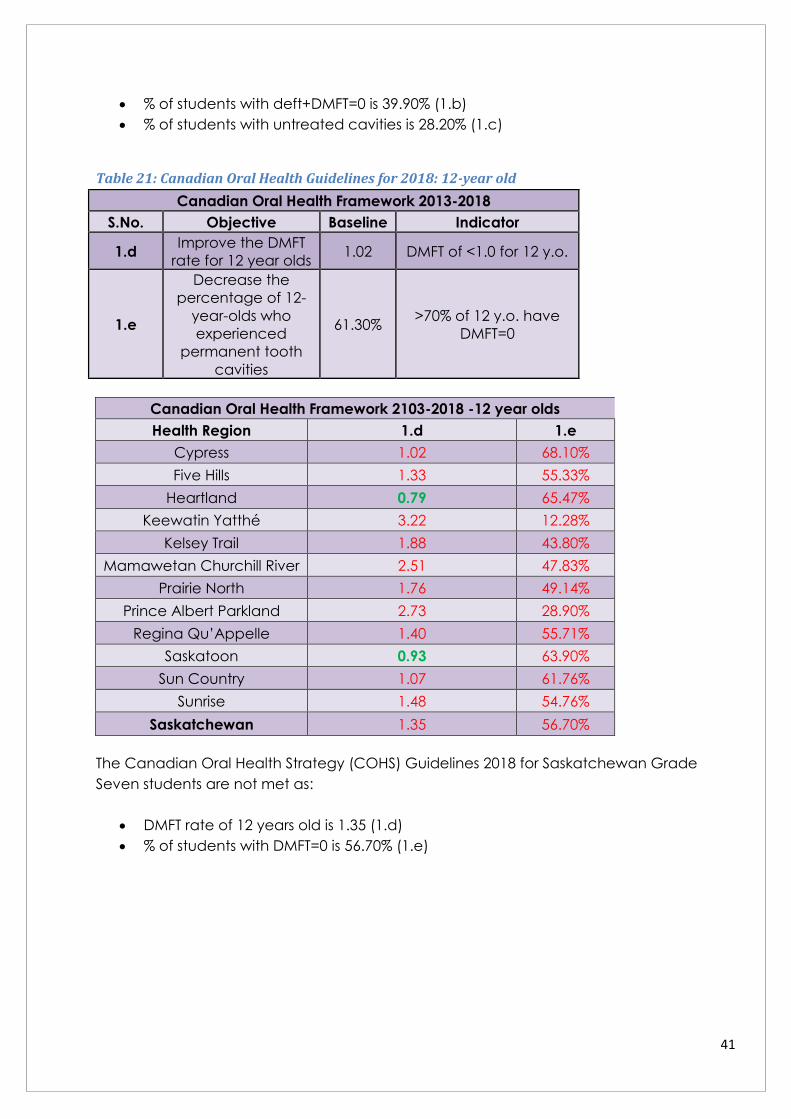
Table 21: Canadian Oral Health Guidelines for 2018: 12-year old
Canadian Oral Health Framework 2013-2018
S.No. Objective Baseline Indicator
1.d Improve the DMFT
rate for 12 year olds 1.02 DMFT of <1.0 for 12 y.o.
1.e
Decrease the
percentage of 12-
year-olds who
experienced
permanent tooth
cavities
61.30% >70% of 12 y.o. have
DMFT=0
Canadian Oral Health Framework 2103-2018 -12 year olds
Health Region 1.d 1.e
Cypress 1.02 68.10%
Five Hills 1.33 55.33%
Heartland 0.79 65.47%
Keewatin Yatthé 3.22 12.28%
Kelsey Trail 1.88 43.80%
Mamawetan Churchill River 2.51 47.83%
Prairie North 1.76 49.14%
Prince Albert Parkland 2.73 28.90%
Regina Qu’Appelle 1.40 55.71%
Saskatoon 0.93 63.90%
Sun Country 1.07 61.76%
Sunrise 1.48 54.76%
Saskatchewan 1.35 56.70%
The Canadian Oral Health Strategy (COHS) Guidelines 2018 for Saskatchewan Grade
Seven students are not met as:
DMFT rate of 12 years old is 1.35 (1.d)
% of students with DMFT=0 is 56.70% (1.e)

42
Improve Oral Health Access for Aboriginal People: COHF Guidelines 2013-2018 for FN/I
School based preventive services;2
The Aboriginal status of children was determined using the information provided on the
dental insurance coverage. Under dental insurance coverage, there was an option to
declare the type of coverage used for dental care. The students who declared their
coverage from First Nations/Inuit Branch were considered to be Aboriginal.
Table 22: COHF 2013-2018; FN/I school based preventive services
Canadian Oral Health Framework 2103-2018
# Objectives Indicator Saskatchewan 2013-2014
2.b
50% of FN/I schools
provide school-
based preventive
dental services
% of FN/I schools
provide school-
based preventive
dental services
89.58%
The Canadian Oral Health Strategy (COHS) Guidelines 2018 for Saskatchewan for
Aboriginal People are met as 89.58% of FN/I schools provide school-based preventive
dental services, 17.47% have deft+DMFT=0 (6 years old) and 31.56% 12 years old have
DMFT=0.
Canadian Oral Health Framework 2103-2018 -6 year olds (Aboriginal)
# Objective Baseline Indicator Saskatchewan 2013-14
2.c
Improve the oral
health status of
those children
entering school (6
year olds)
13.90% 15% of 6 year old FN/I
have deft +DMFT=0 17.47%
Canadian Oral Health Framework 2103-2018 -12 year olds (Aboriginal)
# Objective Baseline Indicator Saskatchewan 2013-14
2.d
Improve the oral
health status of
12 year old FN/I
17.8% of 12
year old FN/I
38.7% of 12
year old.
Canadians
20% of 12 year old
FN/I have DMFT=0 31.56%

43
Dental Health Disparities
-------------------------------------------------------------------------------------------------
In this section, we analyzed the screening data for Grade One and Grade Seven students
together. Comparisons among students are:
Attending schools located in rural versus urban areas.
Attending schools located in communities with and without access to fluoridated water
systems.
Attending Hutterite versus non-Hutterite schools.
Residing in Regina and Saskatoon neighbourhoods by income status.
Urban/Rural, water fluoridation, neighbourhoods by income status and Hutterite
categories were determined according to where each child attended school i.e. school
location.
The results for these comparisons are provided in the following section.
44
COMPARATIVE ANALYSIS
Statistical analysis of the Dental Screening 2013-2014 results was done based on different
criterion. The criteria highlight the disparities that might exist in oral health of children on
the basis of following factors:
Location; Urban vs. Rural Schools:
All children were assigned as attending a rural or urban school based on the location of
the school they attended during the screening year.
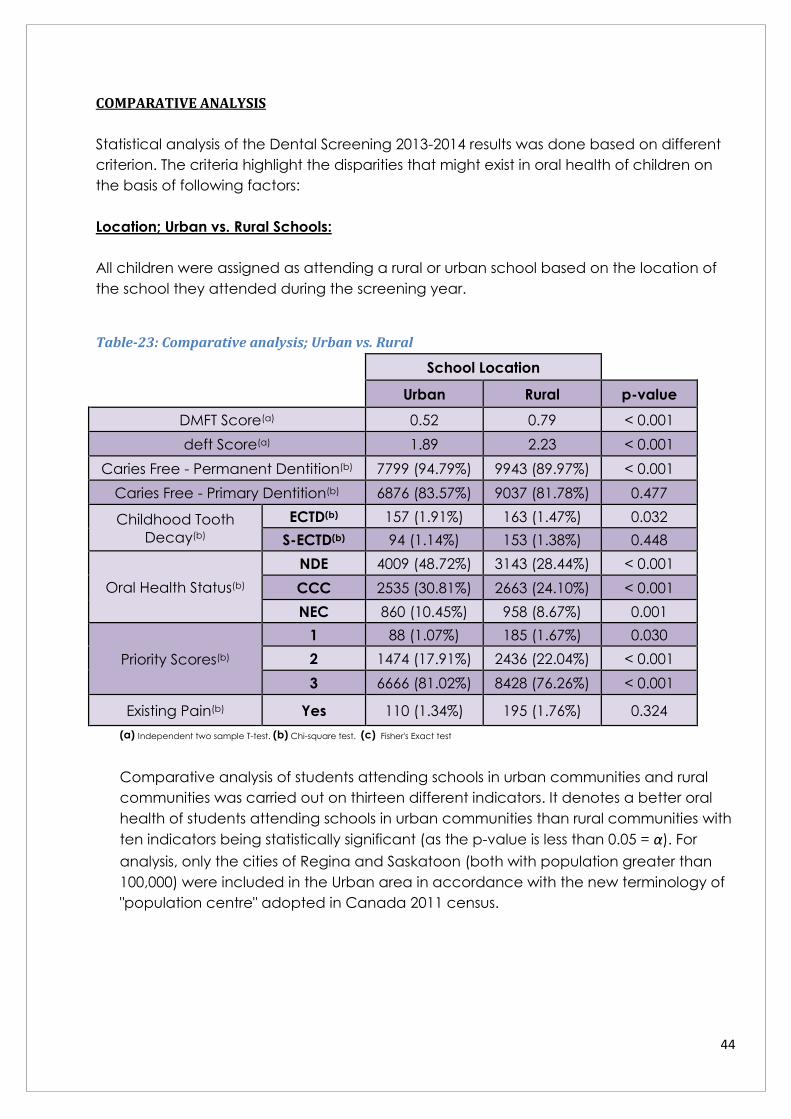
Table-23: Comparative analysis; Urban vs. Rural
School Location
Urban Rural p-value
DMFT Score(a) 0.52 0.79 < 0.001
deft Score(a) 1.89 2.23 < 0.001
Caries Free - Permanent Dentition(b) 7799 (94.79%) 9943 (89.97%) < 0.001
Caries Free - Primary Dentition(b) 6876 (83.57%) 9037 (81.78%) 0.477
Childhood Tooth
Decay(b)
ECTD(b) 157 (1.91%) 163 (1.47%) 0.032
S-ECTD(b) 94 (1.14%) 153 (1.38%) 0.448
Oral Health Status(b)
NDE 4009 (48.72%) 3143 (28.44%) < 0.001
CCC 2535 (30.81%) 2663 (24.10%) < 0.001
NEC 860 (10.45%) 958 (8.67%) 0.001
Priority Scores(b)
1 88 (1.07%) 185 (1.67%) 0.030
2 1474 (17.91%) 2436 (22.04%) < 0.001
3 6666 (81.02%) 8428 (76.26%) < 0.001
Existing Pain(b) Yes 110 (1.34%) 195 (1.76%) 0.324
(a) Independent two sample T-test. (b) Chi-square test. (c) Fisher's Exact test
Comparative analysis of students attending schools in urban communities and rural
communities was carried out on thirteen different indicators. It denotes a better oral
health of students attending schools in urban communities than rural communities with
ten indicators being statistically significant (as the p-value is less than 0.05 = α). For
analysis, only the cities of Regina and Saskatoon (both with population greater than
100,000) were included in the Urban area in accordance with the new terminology of
"population centre" adopted in Canada 2011 census.

45
.Figure 21: Dental Health of Students by Urban/Rural School Location, Saskatchewan, 2013-2014.
0%
10%
20%
30%
40%
50%
60%
70%
80%
90%
100%
Urban vs. Rural
Urban Rural

46
Table-24: Comparative analysis; Water Supply: Fluoridated vs. Non-Fluoridated
Water Supply
Fluoridated Non-
Fluoridated p-value
DMFT Score(a) 0.57 0.73 < 0.001
deft Score(a) 1.88 2.22 < 0.001
Caries Free - Permanent Dentition(b) 7477 (94.31%) 10265 (90.43%) < 0.001
Caries Free - Primary Dentition(b) 6730 (84.89%) 9183 (80.90%) < 0.001
Childhood Tooth
Decay(b)
ECTD 186 (2.34%) 134 (1.18%) < 0.001
S-ECTD 97 (1.22%) 150 (1.32%) 0.552
Oral Health Status(b)
NDE 5239 (46.15%) 2689 (33.92%) < 0.001
CCC 1803 (22.74%) 3639 (32.05%) < 0.001
NEC 608 (7.66%) 1304 (11.49%) < 0.001
Priority Scores(b)
1 106 (1.33%) 167 (2.10%) 0.438
2 1351 (17.04%) 2559 (22.54%) < 0.001
3 6470 (81.61%) 8623 (75.97%) < 0.001
Pain YES 117(1.48%) 188(1.66%) 0.323
(a) Independent two sample T-test. (b) Chi-square test. (c) Fisher's Exact test.
Comparative analysis of students attending schools in communities with fluoridated
water and communities with non-fluoridated water was carried out on thirteen
different indicators. The students having access to fluoridated water showed better
oral health on nine of the thirteen indicators analyzed and ten indicators were
statistically significant as well (as the p-value is less than 0.05 = α).

47
Figure 22: Dental Health of Students by Fluoridated/Non-Fluoridated Water Supply,
Saskatchewan, 2013-2014.
0%
10%
20%
30%
40%
50%
60%
70%
80%
90%
100%
Fluoridated vs. Non Fluoridated
Fluoridated Non-Fluoridated
48
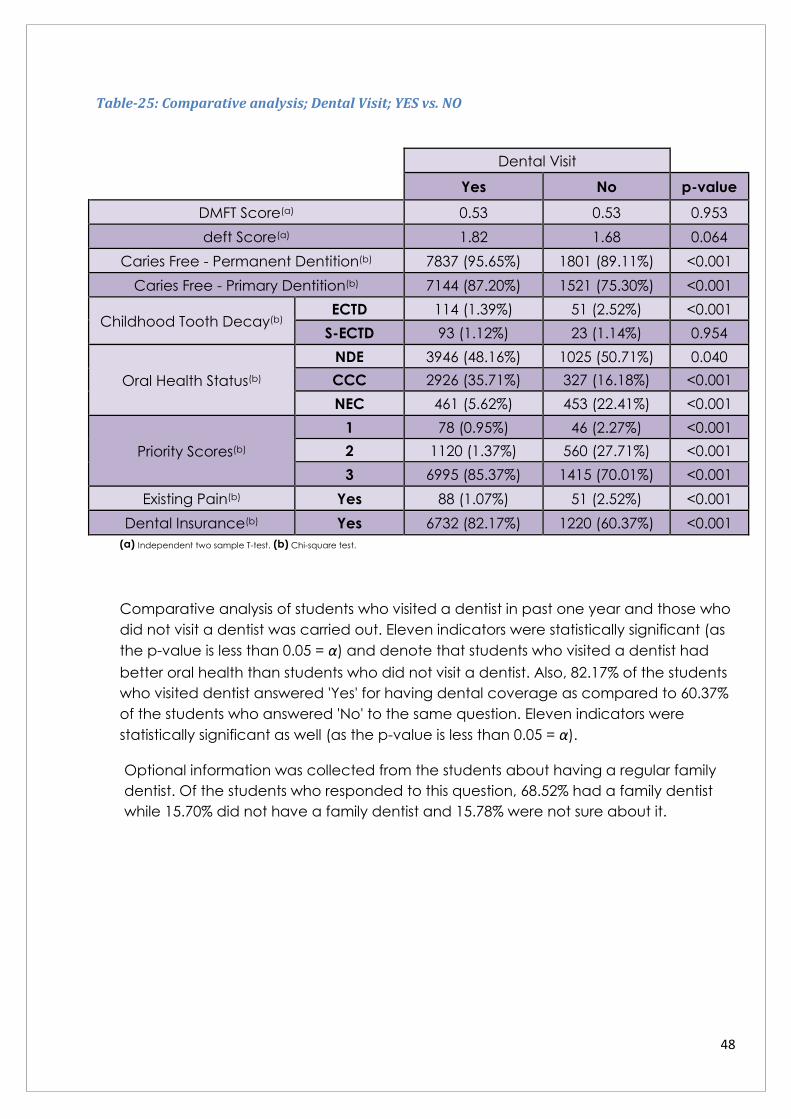
Table-25: Comparative analysis; Dental Visit; YES vs. NO
Dental Visit
Yes No p-value
DMFT Score(a) 0.53 0.53 0.953
deft Score(a) 1.82 1.68 0.064
Caries Free - Permanent Dentition(b) 7837 (95.65%) 1801 (89.11%) <0.001
Caries Free - Primary Dentition(b) 7144 (87.20%) 1521 (75.30%) <0.001
Childhood Tooth Decay(b) ECTD 114 (1.39%) 51 (2.52%) <0.001
S-ECTD 93 (1.12%) 23 (1.14%) 0.954
Oral Health Status(b)
NDE 3946 (48.16%) 1025 (50.71%) 0.040
CCC 2926 (35.71%) 327 (16.18%) <0.001
NEC 461 (5.62%) 453 (22.41%) <0.001
Priority Scores(b)
1 78 (0.95%) 46 (2.27%) <0.001
2 1120 (1.37%) 560 (27.71%) <0.001
3 6995 (85.37%) 1415 (70.01%) <0.001
Existing Pain(b) Yes 88 (1.07%) 51 (2.52%) <0.001
Dental Insurance(b) Yes 6732 (82.17%) 1220 (60.37%) <0.001
(a) Independent two sample T-test. (b) Chi-square test.
Comparative analysis of students who visited a dentist in past one year and those who
did not visit a dentist was carried out. Eleven indicators were statistically significant (as
the p-value is less than 0.05 = α) and denote that students who visited a dentist had
better oral health than students who did not visit a dentist. Also, 82.17% of the students
who visited dentist answered 'Yes' for having dental coverage as compared to 60.37%
of the students who answered 'No' to the same question. Eleven indicators were
statistically significant as well (as the p-value is less than 0.05 = α).
Optional information was collected from the students about having a regular family
dentist. Of the students who responded to this question, 68.52% had a family dentist
while 15.70% did not have a family dentist and 15.78% were not sure about it.

49
Table: Comparative analysis; Family Dentist: Yes Vs .No
Comparative analysis between students having regular dentist and those not having
regular dentist was carried out. Out of the thirteen dental health indicators, students with
a regular dentist had better oral health than those without a regular dentist in all the
indicators. All indicators were statistically significant as well (as the p-value is less than 0.05
= α). Also, 90.75% of the students who had a regular dentist answered 'Yes' for visiting a
dentist in past year as compared to 31.01% of the students who answered 'No' to the
same question. Moreover, 84.52% of the students with dental coverage had a regular
dentist compared to 51.34% without a coverage.
Regular Dentist
Yes No p-value
DMFT Score(a) 0.49 0.60 0.006
deft Score(a) 1.67 1.93 0.003
Caries Free - Permanent
Dentition(b) 7347 (96.34%) 1557 (89.12%) < 0.001
Caries Free - Primary Dentition(b) 6768 (88.74%) 1271 (72.75%) < 0.001
Childhood Tooth
Decay(c) ECTD 4 (0.05%) 4 (0.23%) 0.045
Oral Health Status(b)
NDE 3857 (50.57%) 806(46.13%) 0.001
CCC 2692 (35.30%) 322 (18.43%) < 0.001
NEC 360 (4.72%) 425 (24.32%) < 0.001
Priority Scores(b)
1 58 (0.76%) 62 (3.55%) < 0.001
2 929 (12.18%) 505 (28.90%) < 0.001
3 6639 (87.06%) 1180(67.54%) < 0.001
Dental Visit(b) Yes 6921 (90.75%) 539 (31.01%) < 0.001
Dental Insurance(b) Yes 6446 (84.52%) 897(51.34%) < 0.001

50
Figure 23: Dental Health of Students by Dental Visit YES/NO, Saskatchewan, 2013-2014.
0%
20%
40%
60%
80%
100%
120%
Dental Visit YES vs. NO
Dental Visit (Yes) Dental Visit (No)

51
Table-26: Comparative Analysis; Aboriginal vs. Non-Aboriginal.
The Aboriginal statue of children was determined using the information provided on the
dental insurance coverage. Under dental insurance coverage, there was option to
declare the type of coverage used for dental care. The students who declared their
coverage from First Nations/Inuit Branch were considered to be Aboriginal.
Aboriginal Status
Aboriginal Non-Aboriginal p-value
DMFT Score(a) 1.31 0.64 < 0.001
deft Score(a) 3.74 2.02 < 0.001
Caries Free - Permanent Dentition(b) 502 (81.49%) 17240 (92.38%) < 0.001
Caries Free - Primary Dentition(b) 461 (74.84%) 15452 (82.79%) < 0.001
Childhood Tooth
Decay
ECTD(b) 14 (2.27%) 306 (1.63%) 0.226
S-ECTD(b) 21 (3.41%) 226 (1.21%) < 0.001
Oral Health(b) Status
NDE 148 (22.24%) 5972 (32.00%) < 0.001
CCC 225 (36.53%) 4325 (23.17%) < 0.001
NEC 72 (11.68%) 1651 (8.85%) 0.015
Priority Scores
1(b) 20 (3.25%) 253 (1.36%) < 0.001
2(b) 195 (31.66%) 3715 (19.91%) < 0.001
3(b) 401 (65.10%) 14693 (78.73%) < 0.001
Existing Pain(b) Yes 24 (3.90%) 281 (1.51%) < 0.001
(a) Independent two sample T-test. (b) Chi-square test.
Comparative analysis of Aboriginal students and non-Aboriginal students was carried
out on thirteen different indicators. Non-Aboriginal students performed better on
twelve of the thirteen indicators signifying the barriers existing in the access to oral
health care for Aboriginal population. Out of these twelve indicators were statistically
significant as well (as the p-value is less than 0.05 = α).

52
Figure 24: Dental Health of Students by Aboriginal/Non-Aboriginal Status, Saskatchewan, 2013-
2014.
0%
10%
20%
30%
40%
50%
60%
70%
80%
90%
100%
Aboriginal vs Non Aboriginal
Aboriginal Non-Aboriginal

53
Table 27: Comparative Analysis; Hutterite vs. Non-Hutterite.
Hutterites are communal people who live throughout the prairies in colonies consisting
of, on an average, fifteen families. They work within their colony and they have public
schools on their own colony.
Community
Hutterite Non Hutterite p-value
DMFT Score(a) 1.26 0.66 0.003
deft Score(a) 2.84 2.08 0.003
Caries Free - Permanent
Dentition(b) 168 (87.96%)
17574
(92.19%) 0.038
Caries Free - Primary Dentition(b) 172 (90.05%) 19061
(82.45%) 0.006
Childhood Tooth
Decay(c)
ECTD 3 (1.57%) 315 (1.65%) 0.930
S-ECTD 2 (1.05%) 245 (1.28%) 0.771
Oral Health Status(b)
NDE 46 (24.08%) 6024(31.60%) 0.026
CCC 107 (56.02%) 84 (0.44%) < 0.001
NEC 7 (3.66%) 4381 (22.98%) < 0.001
Priority Scores(b)
1(c) 0 (0.00%) 273 (1.43%) 0.096
2 37 (0.19%) 3871 (20.31%) 0.749
3 154 (80.63%) 14915(78.25%) 0.428
Pain (c) Yes 0(0.00%) 305(1.60%) 0.078
(a) Independent two sample T-test. (b) Chi-square test. (c) Fisher's Exact test.
Comparative analysis of students attending Hutterite colony schools was carried out
with those attending non-Hutterite colony schools. Generally, the students attending
non-Hutterite colony schools seem to have better oral health as compared to those
attending Hutterite colony schools with seven statistically significant indicators (as the
p-value is less than 0.05 = α).

54
Figure 25: Dental Health of Students by Hutterite/Non-Hutterite Community, Saskatchewan,
2013-2014.
0%
10%
20%
30%
40%
50%
60%
70%
80%
90%
100%
Hutterite vs. NonHutterite
Hutterite Non Hutterite

55
Table 28: Comparative Analysis; Dental Insurance (Yes vs. No).
Dental Insurance
Yes No p-value
DMFT Score(a) 0.51 0.45 0.001
deft Score(a) 1.84 1.89 < 0.001
Caries Free - Permanent
Dentition(b) 7753 (94.93%) 1126 (92.83%) < 0.001
Caries Free - Primary Dentition(b) 7002 (85.72%) 933 (76.92%) 0.001
Childhood Tooth
Decay(b)
ECTD 131 (1.60%) 27 (2.23%) 0.116
S-ECTD 94 (1.15%) 12 (0.99%) 0.637
Oral Health Status(b)
NDE 4000 (48.97%) 574(47.32%) 0.283
CCC 2682 (32.84%) 296 (24.40%) < 0.001
NEC 617 (7.55%) 202 (16.65%) < 0.001
Priority Scores(b)
1 85 (1.04%) 23 (1.90%) 0.009
2 1262 (15.45%) 293 (24.15%) < 0.001
3 6821 (83.51%) 897(73.95%) < 0.001
Pain (b) Yes 94(7.75%) 24(1.98%) 0.014
Dental Visit in Past
Year Yes 6732 (82.42%) 706(58.20%) < 0.001
(a) Independent two sample T-test. (b) Chi-square test. (c) Fisher's Exact test.
Comparative analysis between students having dental insurance coverage and those
not having dental insurance coverage was carried out. Out of the fourteen dental
health indicators, students with dental coverage were better than those without
dental coverage in ten indicators. Eleven indicators were statistically significant as well
(as the p-value is less than 0.05 = α). Also, 82.42% of the students who had dental
coverage answered 'Yes' for visiting dentist in past one year as compared to 58.20% of
the students who answered 'No' to the same question. This advocates the importance
of dental coverage for having access to dental care.

56
Figure 26: Dental Health of Students by Dental Insurance Yes vs. No, Saskatchewan, 2013-2014.
0%
10%
20%
30%
40%
50%
60%
70%
80%
90%
100%
Dental Insurance Yes vs. No
Yes No

57
Table 29: Comparative Analysis; City (Regina vs. Saskatoon).
City
Regina Saskatoon p-value
DMFT Score(a) 1.62 1.20 < 0.001
deft Score(a) 2.10 1.66 < 0.001
Caries Free - Permanent
Dentition(b) 4079 (90.79%) 6400 (96.81%) < 0.001
Caries Free - Primary Dentition(b) 3578 (79.63%) 5791 (87.60%) < 0.001
Childhood Tooth
Decay(b)
ECTD 33 (0.73%) 164 (2.48%) < 0.001
S-ECTD 51 (1.14%) 64 (0.97%) 0.394
Oral Health Status(b)
NDE 1983 (44.14%) 3404(51.49%) < 0.001
CCC 1277 (28.42%) 2221 (33.60%) < 0.001
NEC 576 (12.82%) 517 (7.82%) < 0.001
Priority Scores(b)
1 36 (0.80%) 80 (1.21%) 0.038
2 1058 (23.55%) 842 (12.74%) < 0.001
3 3390 (75.63%) 5689(86.05%) < 0.001
Pain (b) Yes 51(1.14%) 88(1.33%) 0.362
Communities with Fluoridated
Water(b) 1 (0.02%) 5369 (81.21%) < 0.001
(a) Independent two sample T-test. (b) Chi-square test.
Comparative analysis of students attending schools in cities of Regina and Saskatoon
was carried out on thirteen different indicators. The students in Saskatoon showed
better oral health on ten of the thirteen indicators analyzed and eleven indicators
were statistically significant as well (as the p-value is less than 0.05 = α).

58
Figure 27: Dental Health of Students by City (Regina vs. Saskatoon), Saskatchewan, 2013-2014.
0.00%
20.00%
40.00%
60.00%
80.00%
100.00%
120.00%
Regina vs. Saskatoon
Regina Saskatoon

59
Dental Health Status by Region
The following table illustrates a summary of dental health status indicators by Health
Region.
Table 30: Dental Health of Students by Health Region. 2013-2014, Saskatchewan
Dental Health Status
Location of School
Average
‘deft/DMFT'
% Cavities
Free
% with No
Evidence of
Dental Care Pain
Cypress 2.47 77.05% 10.58% 1.66%
Five Hills 2.55 74.40% 9.04% 0.60%
Heartland 2.74 75.655% 9.89% 1.73%
Keewatin Yatthé 6.05 38.06% 17.91% 0.75%
Kelsey Trail 3.3 72.48% 10.98% 2.71%
Mamawetan Churchill
River 5.53 43.05% 13.64% 0.53%
Prairie North 3.43 75.26% 8.23% 2.70%
Prince Albert Parkland 4.35 65.78% 12.32% 3.35%
Regina Qu’Appelle 2.77 72.29% 12.82% 1.14%
Saskatoon 2.11 84.99% 7.82% 1.33%
Sun Country 2.18 76.99% 10.72% 1.80%
Sunrise 2.93 73.96% 12.79% 1.71%

60
Epidemiological Studies:
An odds ratio (OR) is a measure of association between an exposure and an outcome. It
quantifies how strongly the presence or absence of an exposure is associated with
presence or absence of outcome.
In this section, the Odds Ratio measures the association of the outcome (Dental Decay)
and the following exposures:
1) Location of the School.
2) Community Water Fluoridation.
3) Hutterite Communities
1) Location of School:
Table 31: Calculation of Odds Ratio for being Cavity free between Urban and Rural communities
in Saskatchewan, 2013-2014
ODDS RATIO Dental Decay Decay free Total
Rural 935 9233 10168
Urban 602 8509 9111
Total 1537 17742 19279
Odds Ratio: 1.4 ( p-value = <0.0001)
As the value is greater than 1, a student residing in Rural community is more likely to have
"Dental Decay"(Caries) than a student residing in Urban community in Saskatchewan.
2) Community Water Fluoridation:
Table 32: Calculation of Odds Ratio for being Cavity free between Schools that have access to
Community Water Fluoridation and Schools that do not have access in Saskatchewan, 2013-2014
ODDS RATIO Dental Decay Decay free Total
Fluoridated 451 7477 7928
Non-Fluoridated 1086 10265 11351
Total 1537 17742 19279
Odds Ratio: 0.6 ( p-value = <0.0001)
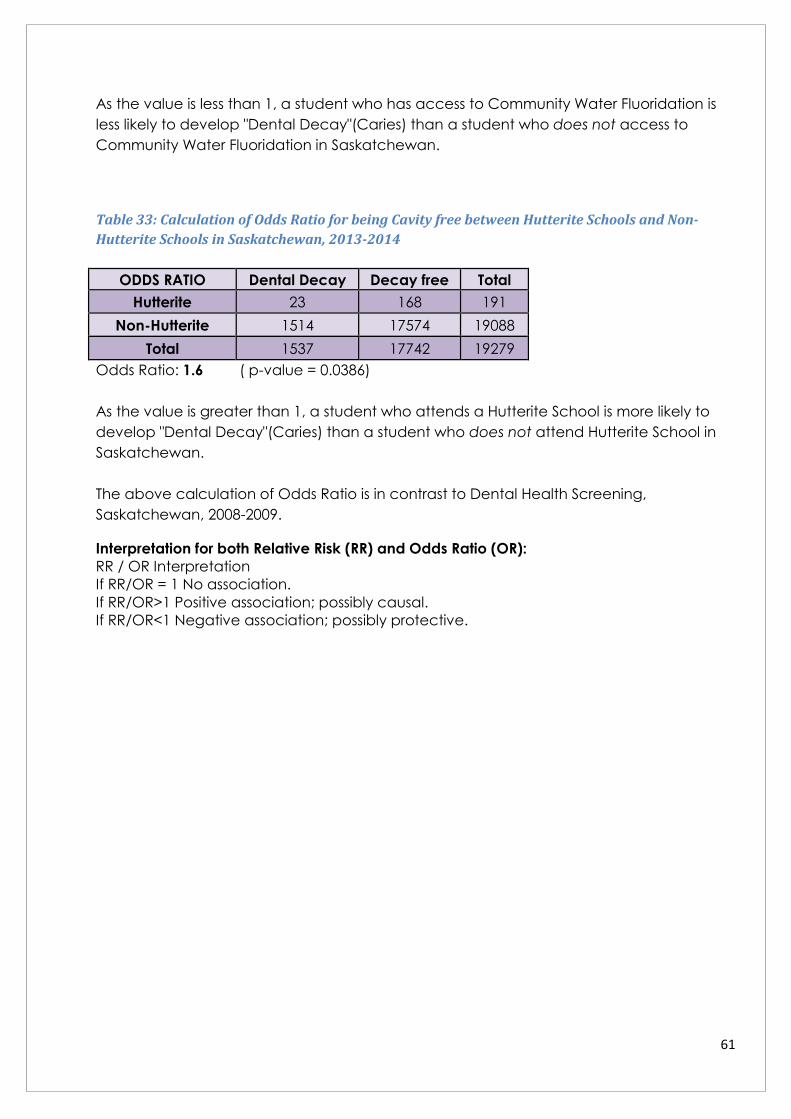
61
As the value is less than 1, a student who has access to Community Water Fluoridation is
less likely to develop "Dental Decay"(Caries) than a student who does not access to
Community Water Fluoridation in Saskatchewan.
Table 33: Calculation of Odds Ratio for being Cavity free between Hutterite Schools and Non-
Hutterite Schools in Saskatchewan, 2013-2014
ODDS RATIO Dental Decay Decay free Total
Hutterite 23 168 191
Non-Hutterite 1514 17574 19088
Total 1537 17742 19279
Odds Ratio: 1.6 ( p-value = 0.0386)
As the value is greater than 1, a student who attends a Hutterite School is more likely to
develop "Dental Decay"(Caries) than a student who does not attend Hutterite School in
Saskatchewan.
The above calculation of Odds Ratio is in contrast to Dental Health Screening,
Saskatchewan, 2008-2009.
Interpretation for both Relative Risk (RR) and Odds Ratio (OR):
RR / OR Interpretation
If RR/OR = 1 No association.
If RR/OR>1 Positive association; possibly causal.
If RR/OR<1 Negative association; possibly protective.
62
Discussion
The overall participation rate of students in Dental Health Screening, Saskatchewan was
84.37% while 15.63% were either absent on the day of screening, or did not return signed
consent forms from their parents/guardians in time or stated “NO” to the dental screening.
They are not included in analysis. The percentage of students screened represents hidden
morbidity, as they might have cavities. The number of Grade One students screened was
higher than those screened in 2008-2009 while the number of Grade Seven students
screened was lower than that of 2008-2009. It is required to take in consideration the
barriers that exist which might prevent a child from receiving a screening.
The majority of the schools included in the analysis were from Saskatoon Health Region
(34.29%), Regina Qu'Appelle Health Region (23.31%), and the rest were from other health
regions in Saskatchewan. Saskatoon Health Region and Regina Qu'Appelle Health Region
together constitute 57.6% of the students screened in Saskatchewan. The gender
distribution was similar for Grade One students while proportion of males was slightly higher
than those of females among Grade Seven students.
The dental health needs were assessed using factors like malocclusion, staining, gingivitis
and the presence of calculus. Grade Seven students had higher dental health needs
except for staining. For instance, 25.35% of Grade Seven students experience
malocclusion as compared to 12.70% of Grade One students. Malocclusion not only
affects facial esthetics but can also lead to psychological disturbances and increased risk
of cavities. Malocclusion also poses hindrance to proper cleansing of teeth resulting in
poor oral hygiene, gingivitis and periodontitis due to plaque/calculation accumulation.
The screening did not record the severity or classification of the malocclusion to establish
the need to take immediate action. It calls for emphasis on the preventive aspect of
orthodontics rather than interceptive orthodontics.
In 2013-2014, Early Childhood Tooth Decay (ECTD) was recorded in contrast to Early
Childhood Caries recorded in 2008-2009. ECTD is a rapid form of tooth decay which was
previously measured as Early Childhood Caries and S-ECTD is an extreme form of ECTD. In
2013-2014, 2.76% Grade One students had ECTD while 2.17% experienced S-ECTD.
The 'deft' and DMFT indices were recorded to assess the prevalence of dental decay in
primary and permanent dentition. Tooth decay is significant health problem among the
Grade One and Grade Seven children. The proportion of Grade One students that had
visible tooth decay was 27.62% and that of Grade Seven students was 14.23% at the time
of examination. The prevalence of dental caries for primary dentition among Grade One
students in Saskatchewan, 2013-2014, was 60.69% (See Table 8B). There were 27.95%
Grade One students with at least one decayed primary tooth while 4.19% students had at
least one or more decayed permanent tooth. The prevalence of dental caries in
63
permanent dentition among Grade Seven students was 43.28% (Table 11B). Also, 3.95%
Grade Seven students had at least one decayed primary tooth while 12.79% students had
at least one or more decayed permanent tooth.
The Combination Index was calculated from deft/DMFT to assign every student with a
Dental Health status. The Database automatically calculated the status from the
information. Grade One students were shown to have caries experience with 15.97%
partial caries care (PCC) and 13.54% students had no evidence of care (NEC). Grade
Seven students were shown to have caries experience with 9.26% partial caries care
(PCC) and 6.44% students had no evidence of care (NEC).
Depending on the urgency of their dental health needs, students were scored for
treatment priority. Of the Grade One Students, 72.33% did not require any immediate
treatment. However, the percentage of unmet dental needs among Grade One students
of Saskatchewan is 27.67% while that of Grade Seven is 14.02%. Optional information was
also collected about dental insurance, history of dental visit from the students.
Regular dentist visits are important for maintaining good health. Based on the 2013-2014
screening results, nearly 80.2% of children visited the dentist in the past year. However, the
reason for the dental visit was not recorded, if it was for preventive, diagnostic or
treatment.
The Dental Health Trends in Saskatchewan outlines the decline in oral health of
Saskatchewan students as measured from factors like average deft+DMFT, current
cavities and caries free. The percentage Grade One students with cavities was highest
(29.71%) and cavity free (39.2%) was found to be lowest in 2013-2014 as compared to
previous year dental screenings since 1993-1994. However, Grade One students have
shown improvement in fewer students presenting with pain and those who have no
evidence of care from the previous dental screenings. On the other hand, Grade Seven
students showed improvement only in the case of fewer students who presented with
pain while depicting decline in other factors when compared to 2008-2009.
Public health dental clinics must be utilized to full potential to meet the needs of children
in Saskatchewan. There is a need to recognize and understand barriers to accessing
preventive dental care that originate on the basis of location, community water
fluoridation, dental insurance and attending Hutterite schools. These barriers need to be
considered for planning future service delivery and deploy the public health resources to
protect and promote the oral health of children and adults in Saskatchewan.

64
APPENDIX

65
Appendix-1
Dental Screening Program Definitions 2013-2014.
deft/DMFT:
index used to measure disease experience. It is the count of the number of decayed,
extracted (due to caries), and filled deciduous teeth of an individual and the number
of decayed, missing and filled (due to caries) permanent teeth of an individual.
deft:
decay:
visual or obvious decay of primary teeth
discoloration or loss of translucency typical of undermined or de-mineralized
enamel
the tooth may or may not be restorable.
extracted:
the primary teeth that have been extracted because of dental caries. Teeth
missing for other reasons (i.e.: ortho, trauma, heredity) are not recorded.
filled:
a primary tooth with a permanent or temporary restoration as a result of caries
if the tooth has a defective restoration without evidence of decay. (Note: Record
as broken/fractured/lost).
DMFT:
Decay:
visual or obvious decay of permanent teeth
discoloration or loss of translucency typical of undermined or de-mineralized
enamel
the tooth may or may not be restorable.
Missing:
the permanent teeth that have been extracted as a result of dental caries. Teeth
lost for other reasons (i.e.: ortho, trauma, heredity) are not recorded.
Filled:
a permanent tooth with a permanent or temporary restoration as a result of caries
if the tooth has a defective restoration without evidence of decay. (Note: Record
as broken/fractured/lost).

66
Note - Recurrent decay:
when a tooth has visible recurrent decay (around a filling) then the tooth is marked
as decayed even though it may have a restoration in place.
when a tooth has a restoration in place with no visible recurrent decay (around a
filling) but decay is visible on another surface (e.g. mesial, distal) record the tooth
as decayed.
Pain:
pain as a result of tooth decay, injury, periodontal disease, or over retention.
Infection:
infection visible (abscess).
Broken/Fractured/Lost:
a tooth that has been restored where the restoration (i.e.: crown, amalgam) has failed
and there is no obvious decay.
Restored/Fractured:
fracture of the crown involving the dentin. The tooth is restored.
Non-restored/Fractured:
fracture of the crown involving the dentin. The tooth is not restored or the restoration
has been lost.

67
Appendix-2
ECTD:
is the presence of one or more decayed (noncavitated or cavitated lesions), missing
(due to caries), or filled tooth surfaces in any primary tooth in a child 71 months of age
or younger. (American Academy of Pediatric Dentistry, 2008)
*Dental Screening Database has formula set to calculate this automatically.
S-ECTD:
is any sign of smooth-surface caries in children younger than 3 years of age. From
ages 3 through 5, one or more cavitated, missing (due to caries), or filled smooth
surfaces in primary maxillary anterior teeth or a decayed, missing or filled score of 4
(age 3), 5 (age 4), or 6 (age 5) surfaces constitutes S-ECC. (American Academy of
Pediatric Dentistry, 2008).
*Dental Screening Database has formula set to calculate this automatically.
Notes:
Supernumerary Teeth:
- supernumerary teeth are not counted. You must decide which tooth is the
legitimate occupant of the space. Overretained:
- where both primary and permanent teeth occupy the same tooth space
only the permanent tooth is considered. Non-vital Teeth:
- are to be scored as if they are vital.
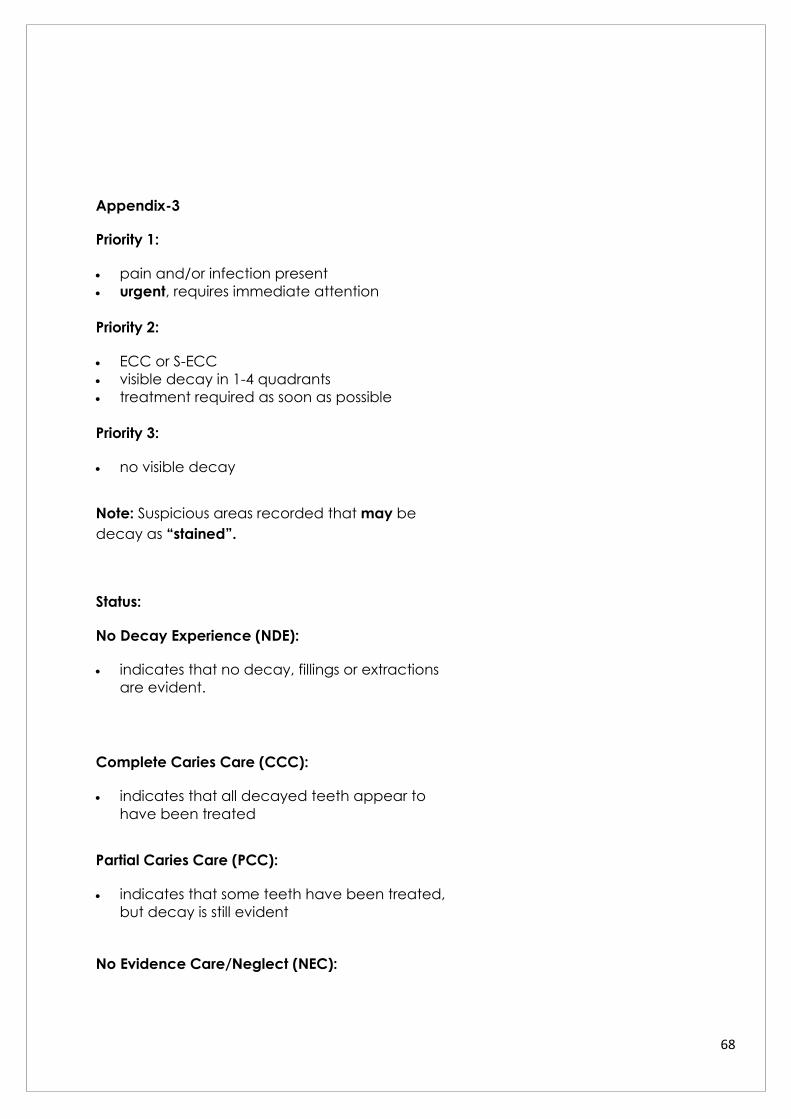
68
Appendix-3
Priority 1:
pain and/or infection present
urgent, requires immediate attention
Priority 2:
ECC or S-ECC
visible decay in 1-4 quadrants
treatment required as soon as possible
Priority 3:
no visible decay
Note: Suspicious areas recorded that may be
decay as “stained”.
Status:
No Decay Experience (NDE):
indicates that no decay, fillings or extractions
are evident.
Complete Caries Care (CCC):
indicates that all decayed teeth appear to
have been treated
Partial Caries Care (PCC):
indicates that some teeth have been treated,
but decay is still evident
No Evidence Care/Neglect (NEC):

69
indicates that there is decay but no evidence
of past or present dental treatment
Formulas:
Priority 1:
Pain
Infection
Priority 2:
Quadrants 1-4 marked
d/D = 1 or more
ECC or S-ECC
Priority 3:
Blank – Pain
Blank - Infection
Blank – Quadrants 1-4
Blank – ECC+
d/D = 0
Neither is marked
NDE:
deft/DMFT = 0
CCC:
d, D = 0; e, f, M & F = 1 or more
PCC:
d/D = 1 or more and e, f, M, F = 1 or more
NEC:
d/D = 1 or more and e, f, M, F = 0

70
Appendix-4
List of Hutterite Schools
School Name School Name
Abbey Hutterite School Hillsvale Colony School
Arm River Hutterite School Hulbert Hutterite School
Baildon Colony Hutterite Elementary School Lajord Colony School
Barr Colony School Lakeside Colony School
Belle Plain Hutterite School Leask Colony School
Bone Creek Hutterite Lost River Hutterite Colony School
Box Elder Hutterite School McMahon Colony School
Butte Hutterite School Norfolk Hutterite School
Capeland Hutterite School Pelletier Hill Hutterian School
Carmichael Hutterite School Pennant Colony School
Clear Springs Hutterite School Riverbend Hutterite Colony School
Clelland Hutterite Colony School Riverview Hutterite School
Creston Bench Hutterian School Rose Valley Hutterian
Cypress Hutterite School Ruskin Hutterian School
Downie Lake Hutterite School Sand Lake Hutterite Elementary
Earview Hutterian School Sask. Central Hutterite School
East Fairwell Hutterian School Spring Creek Hutterite School
Estuary Hutterite School Spring Lake Hutterite School
Friesen Hutterite School Webb Hutterite School
Haven Hutterite School Wheatland Hutterite School
Hillcrest Hutterite School Wymark Hutterite Colony
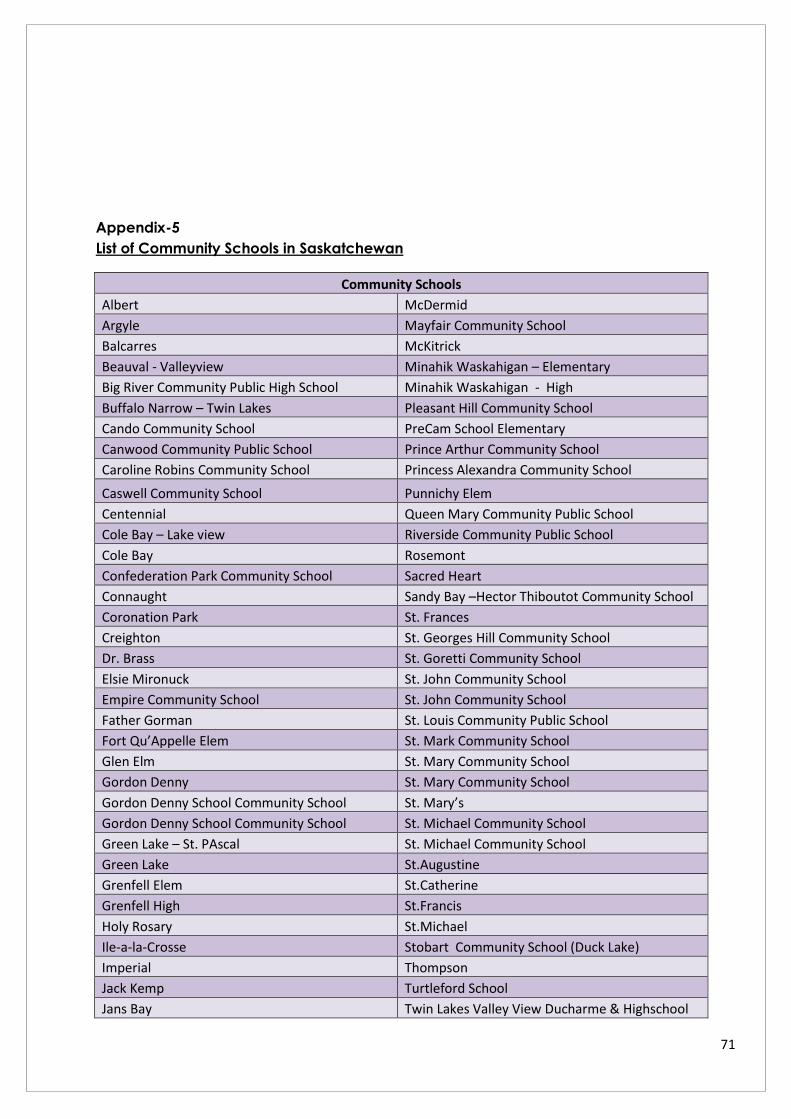
71
Appendix-5
List of Community Schools in Saskatchewan
Community Schools
Albert McDermid
Argyle Mayfair Community School
Balcarres McKitrick
Beauval - Valleyview Minahik Waskahigan – Elementary
Big River Community Public High School Minahik Waskahigan - High
Buffalo Narrow – Twin Lakes Pleasant Hill Community School
Cando Community School PreCam School Elementary
Canwood Community Public School Prince Arthur Community School
Caroline Robins Community School Princess Alexandra Community School
Caswell Community School Punnichy Elem
Centennial Queen Mary Community Public School
Cole Bay – Lake view Riverside Community Public School
Cole Bay Rosemont
Confederation Park Community School Sacred Heart
Connaught Sandy Bay –Hector Thiboutot Community School
Coronation Park St. Frances
Creighton St. Georges Hill Community School
Dr. Brass St. Goretti Community School
Elsie Mironuck St. John Community School
Empire Community School St. John Community School
Father Gorman St. Louis Community Public School
Fort Qu’Appelle Elem St. Mark Community School
Glen Elm St. Mary Community School
Gordon Denny St. Mary Community School
Gordon Denny School Community School St. Mary’s
Gordon Denny School Community School St. Michael Community School
Green Lake – St. PAscal St. Michael Community School
Green Lake St.Augustine
Grenfell Elem St.Catherine
Grenfell High St.Francis
Holy Rosary St.Michael
Ile-a-la-Crosse Stobart Community School (Duck Lake)
Imperial Thompson
Jack Kemp Turtleford School
Jans Bay Twin Lakes Valley View Ducharme & Highschool

72
Jans Bay Victoria School
Jonas Sampson Jr High Vincent Massey Community Public School
Jubilee Elementary Vincent Massey Community School
King George Community Public School W.P. Bate Community School
King George Community School Wascana
Kitchener Westmount Community School
Lakeview Elementary Westview Community Public School
La Loche – Dene High Community School Weyakwin - Kiskahikan
La Loche – Ducharme School Community School WFA Turgeon Catholic Community School
Leask Community Public School

73
Appendix-6: Dental Screening Information Letter'2013-2014

74

75
Appendix-7: Dental Screening Results Letter'2013-2014 (Ministry of Health, Govt. of SK)

76

77

78
Appendix - 8
Community Water Fluoridation (CWF) 2010
Aberdeen Luseland
Allan Martensville
Annaheim McTaggart
Assiniboia Meadow Lake
Baildon Colony Melfort
Balgonie Melville
Beatty Milden Colony
Bradwell Moose Jaw
Bruno Moosomin
Canora Muenster
Carnduff Osler
Clavet Outlook
Corman Park Quill Lake
Cudworth RM of Kinistino
Dalmeny RM Rosetown
Dinsmore Colony Saskatoon
Domremy St. Isidore de Bellevue
Elstow St. Louis
Eston Star City
Gronlid Star City Colony
Gull Lake Swift Current
Hague Tisdale
Humbolt Wadena
Indian Head Wakaw
Kindersley Warman
Kinistino Watson
La Ronge Weldon
Lake Lenore Weyburn
Langenburg Wynyard

79
References
1. Federal, Provincial and Territorial Dental Working Group. (2005). Canadian Oral
Health Strategy. Montreal. Retrieved from
http://www.fptdwg.ca/assets/PDF/Canadian%20Oral%20Health%20Strategy
%20-%20Final.pdf
2. Federal, Provincial and Territorial Dental Working Group. (2012). Reducing Dental
Disease. Retrieved from
http://www.caphd.ca/sites/default/files/FrameworkOctober15FINALEnglish.
3. Canadian Dental Association. (2014). About Us: Canadian Dental Association.
Retrieved from Canadian Dental Association Web site: https://www.cda-
adc.ca/en/oral_health/index.asp
4. World Health Organization. (2014). About Us: World Health Organization.
Retrieved from World Health Organization Web site:
http://www.who.int/topics/oral_health/en/
5. World Health Organization. (2012, April). About Us: World Health Organization.
Retrieved from World Health Organization Web site:
http://www.who.int/mediacentre/factsheets/fs318/en/
6. Centers for Disease Control and Prevention. (2013, July 10). About Us: Centers for
Disease Control and Prevention. Retrieved from Centers for Disease Control
and Prevention Web site:
http://www.cdc.gov/oralhealth/publications/factsheets/dental_caries.htm
7. American Academy of Pediatric Dentistry. (2008). Policy on Early Childhood
Caries (ECC): Classifications, Consequences, and Preventive Strategies. Oral
Health Policies, 32(6), 41-44. United States of America. Retrieved from
http://www.aapd.org/assets/1/7/P_ECCClassifications.pdf
8. World Health Organization. (2001). About Us: World Health Organization.
Retrieved from World Health Organization Web site:
http://www.who.int/water_sanitation_health/oralhealth/en/index2.html