Embed Size (px)
Citation preview
Annual Report Superannuation Plan Dental Planfor 2015-16
Saskatchewan Teachers’ Superannuation Commission
saskatchewan.ca
1
Table of Contents
Letter of Transmittal ...................................................................................................................................................... 2
Message from the Chairperson ..................................................................................................................................... 5
Profile ............................................................................................................................................................................ 6
Teachers’ Superannuation Commission ........................................................................................................................ 7
Teachers’ Superannuation Plan ................................................................................................................................... 21
Teachers’ Disability Benefits Plan ................................................................................................................................ 22
Teachers’ Dental Plan .................................................................................................................................................. 23
Management Report, 2016 ......................................................................................................................................... 24
Actuary’s Opinion ........................................................................................................................................................ 25
Auditor's Report .......................................................................................................................................................... 26
Statement of Financial Position ................................................................................................................................... 27
Statement of Changes in Net Assets Available for Benefits ........................................................................................ 28
Statement of Changes in Pension Obligations............................................................................................................. 29
Notes to the Financial Statements .............................................................................................................................. 30
Investment Schedules ................................................................................................................................................. 45
This annual report is available in electronic format at www.stsc.gov.sk.ca.
2
Letter of Transmittal
The Honourable Don Morgan, Q.C.
Minister in Charge
Teachers' Superannuation Commission
Sir:
The Teachers' Superannuation Commission has the honour to submit the Annual Report outlining activities under
The Teachers Superannuation and Disability Benefits Act for the year ending June 30, 2016 and The Teachers’
Dental Plan Act for the period ending December 31, 2015.
Respectfully submitted,
Dr. Derwyn Crozier-Smith
Chairperson
3
2015 – 2016 Annual Report
The Saskatchewan Teachers' Superannuation Commission
129 – 3085 Albert Street
Regina, Saskatchewan S4S 0B1
submits the:
Eighty-sixth Annual Report with respect to
The Teachers Superannuation and Disability
Benefits Act for the Year Ended June 30, 2016 and
Thirty-first Annual Report with respect to
The Teachers’ Dental Plan Act
for the Year Ended December 31, 2015

4
(This page intentionally left blank)
5
Message from the Chairperson
On behalf of the Teachers’ Superannuation Commission, I am pleased to present the 2015-16 Annual Report of the
Saskatchewan Teachers’ Superannuation Commission.
Effective July 1, 2012, the Commission implemented a de-risking investment strategy. The objective of the
de-risking investment strategy is to preserve capital, mitigate fluctuating investment returns caused by market
volatility and reduce risk as the Teachers’ Superannuation Fund (TSF) winds down to its legislative end date of
June 30, 2030. In July 2015, the Commission shifted to the next stage in the de-risking glidepath for the TSF asset
allocation. Canadian small cap was removed from the portfolio, while the allocation for short-term investments
increased. The TSF’s fair market value as at June 30, 2016 was $334.8M. Despite the Fund’s asset mix being
constructed with lower risk investments, the overall portfolio returned 4.1% for 2015-16 beating its benchmark of
3.5%. The Fund also met its real return performance objective of 2.35% by gaining 4.0% over 10 years.
As the TSF market value of assets continues to reduce, the Commission amended its investment policy to move to
the next step of the de-risking glidepath for the Fund’s asset mix to be effective July 1, 2016. The next stage of the
de-risking investment strategy will see short-term investments increase by 15%, with bonds decreasing by 10% and
real estate decreasing by 5%. The Commission will continue to monitor the asset base of the TSF as well as the
progress and performance of the TSF de-risking model.
To build on its governance and risk management framework, the Commission reviewed its processes and systems
for cyber security to ensure proper controls are in place to mitigate any internal or external cyberattacks. The
Commission also met with one its investment managers, Greystone Managed Investments to discuss Greystone’s
approach to managing risks for stock selection and building investment portfolios.
Through collective bargaining between Saskatchewan teachers and the Government of Saskatchewan, The
Teachers Superannuation and Disability Act (the Act) was amended to allow teachers with less than 20 days of
contributory service eligible to receive a refund of their contributions with interest. Previously legislation locked-in
these contributions and were only payable as a death benefit. The amendment to the Act received royal assent on
June 30, 2016.
The Commission completed an actuarial valuation for the year ending June 30, 2015. The previous valuation was
conducted two years earlier as at June 30, 2013. This financial snapshot in time assists the Commission in
monitoring the growing Plan deficit that exists within the Teachers’ Superannuation Plan. The Commission will
continue to conduct biennial valuations.
The Commission acknowledges with sincere appreciation, the administrative team whose efforts resulted in
another successful year of service to the membership. The Commission also expresses its appreciation to the
Saskatchewan Teachers’ Federation, the Superannuated Teachers of Saskatchewan, the school divisions and
regional colleges and the administrative staff within the Ministry of Education for their respective contributions to
the success of the Commission.
Dr. Derwyn Crozier-Smith
Chairperson, Teachers’ Superannuation Commission
6
Profile
The Teachers’ Superannuation Commission (TSC,
the Commission) is established under The
Teachers Superannuation and Disability Benefits
Act.
The Minister of Finance is the trustee of the
Teachers’ Superannuation Fund (TSF) while the
TSC is charged with administration of The
Teachers Superannuation and Disability Benefits
Act, The Teachers’ Dental Plan Act, and The
Teachers’ Life Insurance (Government
Contributory) Act.
The Province of Saskatchewan sponsors the TSF,
with contributions also coming from plan
members who are represented by the
Saskatchewan Teachers’ Federation (STF).
The Teachers Superannuation and Disability Benefits Act
is a negotiable matter under The Education Act, 1995.
The Teachers’ Superannuation Plan was closed in July
1980, and a new plan was created, now known as the
Saskatchewan Teachers’ Retirement Plan, for which
administration has been transferred to the STF.
As at June 30, 2016, the TSF has net assets available for
benefits of $0.377 billion, actuarial pension obligations
of $6.329 billion, and a deficit of $5.952 billion.
More on-line at www.stsc.gov.sk.ca
Plan Governance at a Glance
Mission, mandate and objectives 7 Commission Independence 16
Commission member background 8 Investment performance 18
Commission member attendance 8 Responsibility for financial statements 24
Commission member role and responsibilities 9 Actuary’s opinion 25
Commission strategic plan: key functions, objectives and actions 9 Auditor’s report 26
7
Teachers’ Superannuation Commission
Mission
The Commission’s mission is to provide pensions
and benefits for plan members through prudent
stewardship of assets and liabilities and effective
plan administration in accordance with current
legislation.
Mandate
To attain this outcome, our organizational
mandate is to administer the various Acts to
ensure the provision of retirement and
negotiated benefits to teachers. The various Acts
(and regulations thereto) are:
The Teachers Superannuation and Disability
Benefits Act
The Teachers' Life Insurance (Government
Contributory) Act
The Teachers' Dental Plan Act
The TSC is not subject to the Saskatchewan
Pension Benefits Act, 1992 except in relation to
investments.
Objectives
Our specific objectives associated with this
organizational mandate are:
Communicate information and guidance to
plan members
Collect pension contributions from all
participating teachers
Accept additional contributions for the
Voluntary Contributions Fund
Calculate and distribute retirement benefits
to teachers, spouses and dependents of
deceased teachers
Assess, review and provide disability benefits
to eligible teachers
Monitor the performance of the pension fund
investments
Negotiate and administer reciprocal transfer
agreements with other jurisdictions
Maintain appropriate financial records of the
affairs of the Plan
Manage accurate and timely dental claims
administration in conjunction with the insurance
carrier
Administer the insurance claims associated with
death and dismemberment in conjunction with the
insurance carrier
Governance
The Commission maintains its governance manual
which is posted on its website. This manual is the key
document directing the Commission’s governance
activity during the year. The manual facilitates the
planning and tracking of progress in areas such as
ongoing board education, strategic planning, board-self
assessment, and monitoring of administration
operations and management. The manual also
addresses various overarching matters such as: conflict
of interest, dispute resolution, risk management,
investment policy and monitoring, roles and
responsibilities, and code of conduct.
Accountability
The TSC issues this annual report including audited
financial statements supported by an actuarial opinion.
8
Commission Members
The TSC is responsible to the Minister in Charge for
the administration of The Teachers Superannuation
and Disability Benefits Act, who at present is also
the Minister of Education (the Minister).
The TSC consists of seven members appointed by
the Lieutenant Governor in Council:
Three members are nominated by the STF
executive committee
Three members are nominated by the Minister
A Chairperson is nominated by the other six
members
Appointments are typically for a term of five years and
are eligible for reappointment.
Dr. Derwyn Crozier-Smith was nominated by the
members of the Commission to continue as
Chairperson. Dr. Crozier-Smith was reappointed as
Commission Chairperson for a term not to exceed five
years on May 18, 2016.
* Mr. Dustin Antonini was appointed to the
Commission effective September 23, 2015.
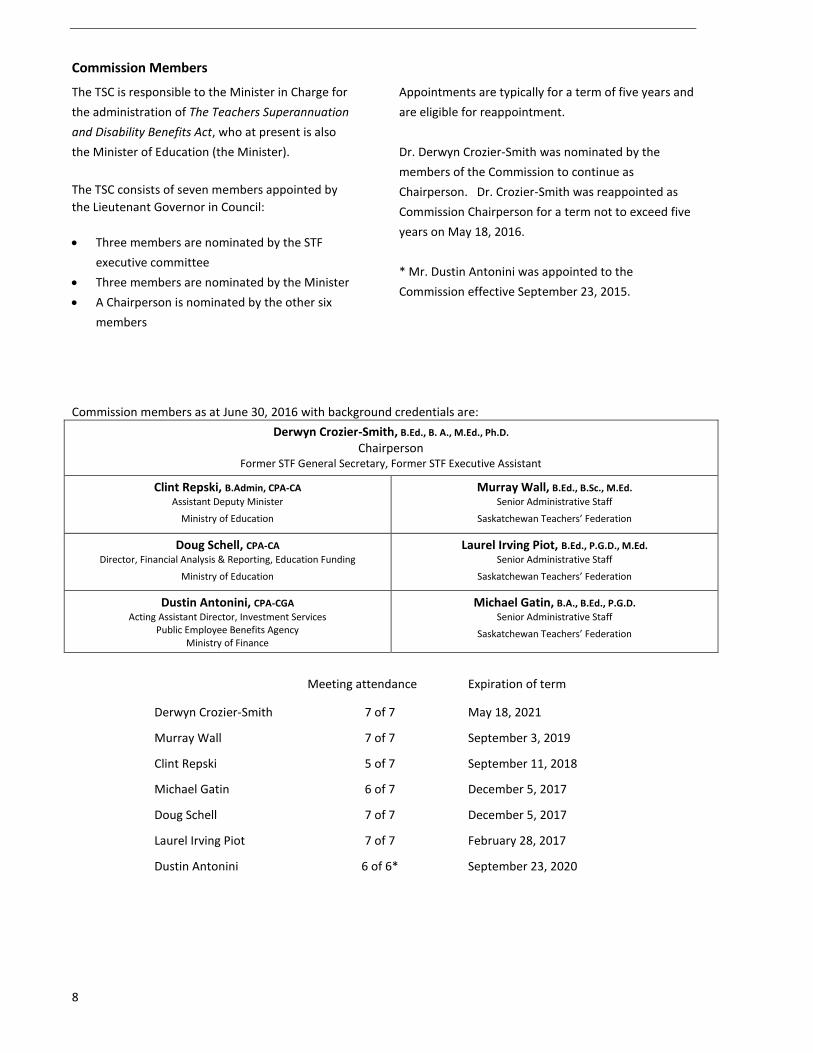
Commission members as at June 30, 2016 with background credentials are:
Derwyn Crozier-Smith, B.Ed., B. A., M.Ed., Ph.D.
Chairperson Former STF General Secretary, Former STF Executive Assistant
Clint Repski, B.Admin, CPA-CA Assistant Deputy Minister
Ministry of Education
Murray Wall, B.Ed., B.Sc., M.Ed. Senior Administrative Staff
Saskatchewan Teachers’ Federation
Doug Schell, CPA-CA Director, Financial Analysis & Reporting, Education Funding
Ministry of Education
Laurel Irving Piot, B.Ed., P.G.D., M.Ed. Senior Administrative Staff
Saskatchewan Teachers’ Federation
Dustin Antonini, CPA-CGA Acting Assistant Director, Investment Services
Public Employee Benefits Agency Ministry of Finance
Michael Gatin, B.A., B.Ed., P.G.D. Senior Administrative Staff
Saskatchewan Teachers’ Federation
Meeting attendance Expiration of term
Derwyn Crozier-Smith 7 of 7 May 18, 2021
Murray Wall 7 of 7 September 3, 2019
Clint Repski 5 of 7 September 11, 2018
Michael Gatin 6 of 7 December 5, 2017
Doug Schell 7 of 7 December 5, 2017
Laurel Irving Piot 7 of 7 February 28, 2017
Dustin Antonini 6 of 6* September 23, 2020
9
Commission Member Role and Responsibilities
It is the collective responsibility of the members
of the Commission to:
Fulfill the mission statement
Administer the Plans in compliance with
governing legislation
Determine any question as to the application
of The Teachers Superannuation and
Disability Benefits Act
Review all applications for disability benefits
Establish investment policy and monitor
investment performance
Promote awareness and understanding of
the Plans
Monitor management and administration of
the Plans
Report annually to the Minister responsible
for the Commission
Commission Strategic Plan:
Key Functions, Objectives and Actions
To fulfill its statutory obligations and to address
challenges and opportunities, the Commission
reviewed and updated its Strategic Plan in
October 2015. The Strategic Plan contemplates a
number of risks identified in the Risk Assessment
and Management Plan.
The Strategic Plan outlines four key functions:
1. Governance
2. Administration
3. Member Services
4. Affiliate Services
Each Key Function involves a number of Strategic
Objectives that the Commission and its Executive
Director review and revise on an annual basis in
accordance with the TSC’s governance manual. These
Strategic Objectives indicate where the TSC is headed,
at least in the foreseeable future.
For each Strategic Objective, the Strategic Plan
highlights various Strategic Actions that the
Commission will do to carry out the TSC’s purpose of
providing appropriate pension, long-term disability,
dental and group life insurance benefits to relevant
Saskatchewan members.
The application of the Strategic Plan is designed to
highlight and communicate the nature of the services
provided by the TSC and is intended to maintain the
focus on activities that best address relevant risks and
ensure statutory obligations are being met. The
Strategic Plan is structured to be concise, practical, and
manageable, relying on reference documents that
contain greater detail (i.e., risks, communication,
information systems) and facilitates healthy governance
in identifying measurable objectives through which
measurement against plan and reporting can occur.
10
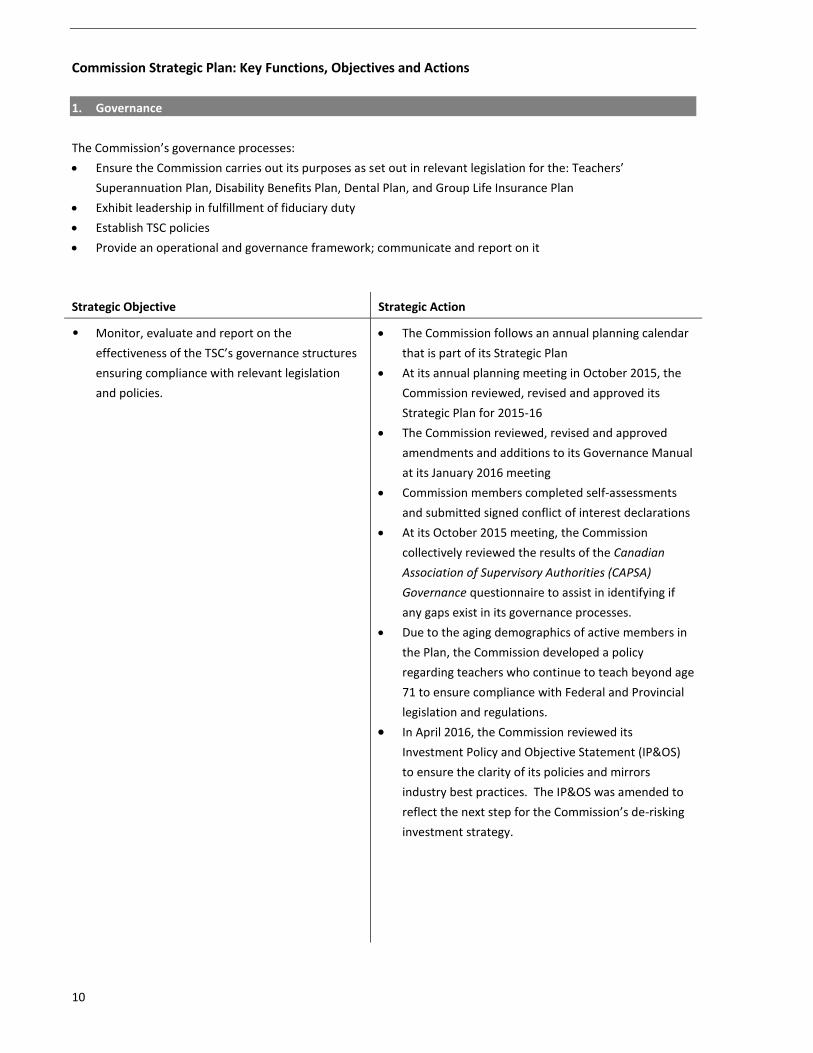
Commission Strategic Plan: Key Functions, Objectives and Actions
1. Governance
The Commission’s governance processes:
Ensure the Commission carries out its purposes as set out in relevant legislation for the: Teachers’
Superannuation Plan, Disability Benefits Plan, Dental Plan, and Group Life Insurance Plan
Exhibit leadership in fulfillment of fiduciary duty
Establish TSC policies
Provide an operational and governance framework; communicate and report on it
Strategic Objective Strategic Action
• Monitor, evaluate and report on the
effectiveness of the TSC’s governance structures
ensuring compliance with relevant legislation
and policies.
The Commission follows an annual planning calendar
that is part of its Strategic Plan
At its annual planning meeting in October 2015, the
Commission reviewed, revised and approved its
Strategic Plan for 2015-16
The Commission reviewed, revised and approved
amendments and additions to its Governance Manual
at its January 2016 meeting
Commission members completed self-assessments
and submitted signed conflict of interest declarations
At its October 2015 meeting, the Commission
collectively reviewed the results of the Canadian
Association of Supervisory Authorities (CAPSA)
Governance questionnaire to assist in identifying if
any gaps exist in its governance processes.
Due to the aging demographics of active members in
the Plan, the Commission developed a policy
regarding teachers who continue to teach beyond age
71 to ensure compliance with Federal and Provincial
legislation and regulations.
In April 2016, the Commission reviewed its
Investment Policy and Objective Statement (IP&OS)
to ensure the clarity of its policies and mirrors
industry best practices. The IP&OS was amended to
reflect the next step for the Commission’s de-risking
investment strategy.
11
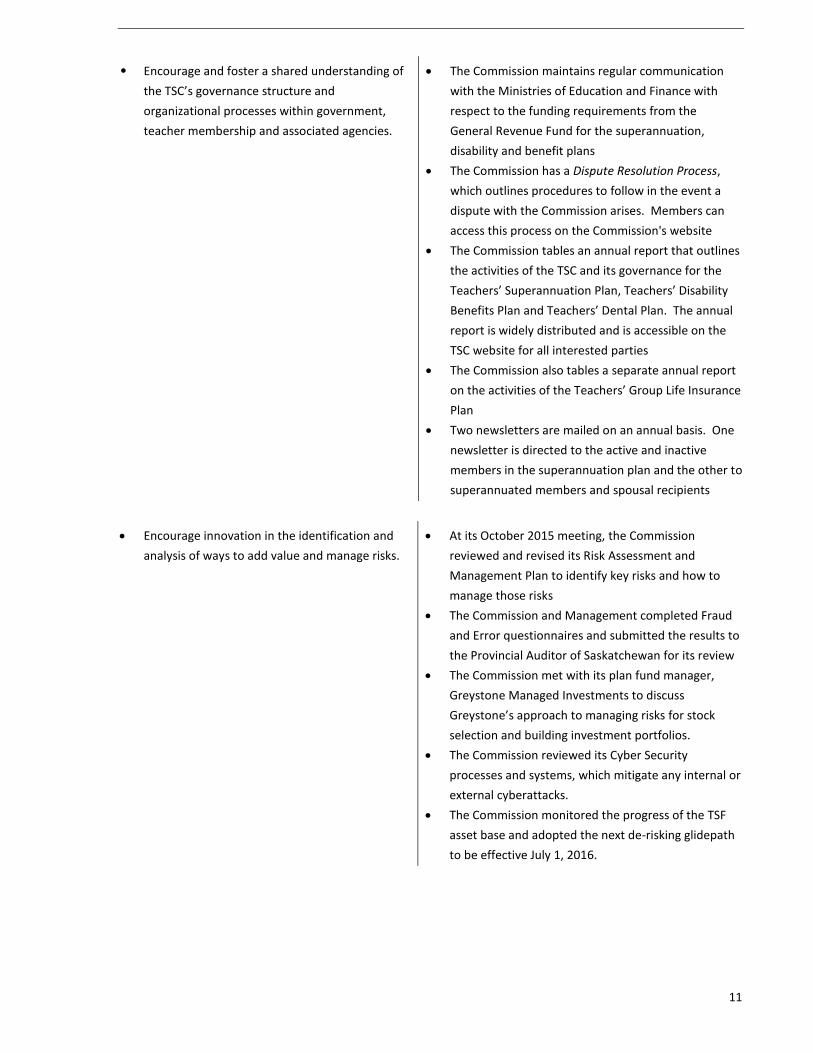
• Encourage and foster a shared understanding of
the TSC’s governance structure and
organizational processes within government,
teacher membership and associated agencies.
The Commission maintains regular communication
with the Ministries of Education and Finance with
respect to the funding requirements from the
General Revenue Fund for the superannuation,
disability and benefit plans
The Commission has a Dispute Resolution Process,
which outlines procedures to follow in the event a
dispute with the Commission arises. Members can
access this process on the Commission's website
The Commission tables an annual report that outlines
the activities of the TSC and its governance for the
Teachers’ Superannuation Plan, Teachers’ Disability
Benefits Plan and Teachers’ Dental Plan. The annual
report is widely distributed and is accessible on the
TSC website for all interested parties
The Commission also tables a separate annual report
on the activities of the Teachers’ Group Life Insurance
Plan
Two newsletters are mailed on an annual basis. One
newsletter is directed to the active and inactive
members in the superannuation plan and the other to
superannuated members and spousal recipients
Encourage innovation in the identification and
analysis of ways to add value and manage risks.
At its October 2015 meeting, the Commission
reviewed and revised its Risk Assessment and
Management Plan to identify key risks and how to
manage those risks
The Commission and Management completed Fraud
and Error questionnaires and submitted the results to
the Provincial Auditor of Saskatchewan for its review
The Commission met with its plan fund manager,
Greystone Managed Investments to discuss
Greystone’s approach to managing risks for stock
selection and building investment portfolios.
The Commission reviewed its Cyber Security
processes and systems, which mitigate any internal or
external cyberattacks.
The Commission monitored the progress of the TSF
asset base and adopted the next de-risking glidepath
to be effective July 1, 2016.
12
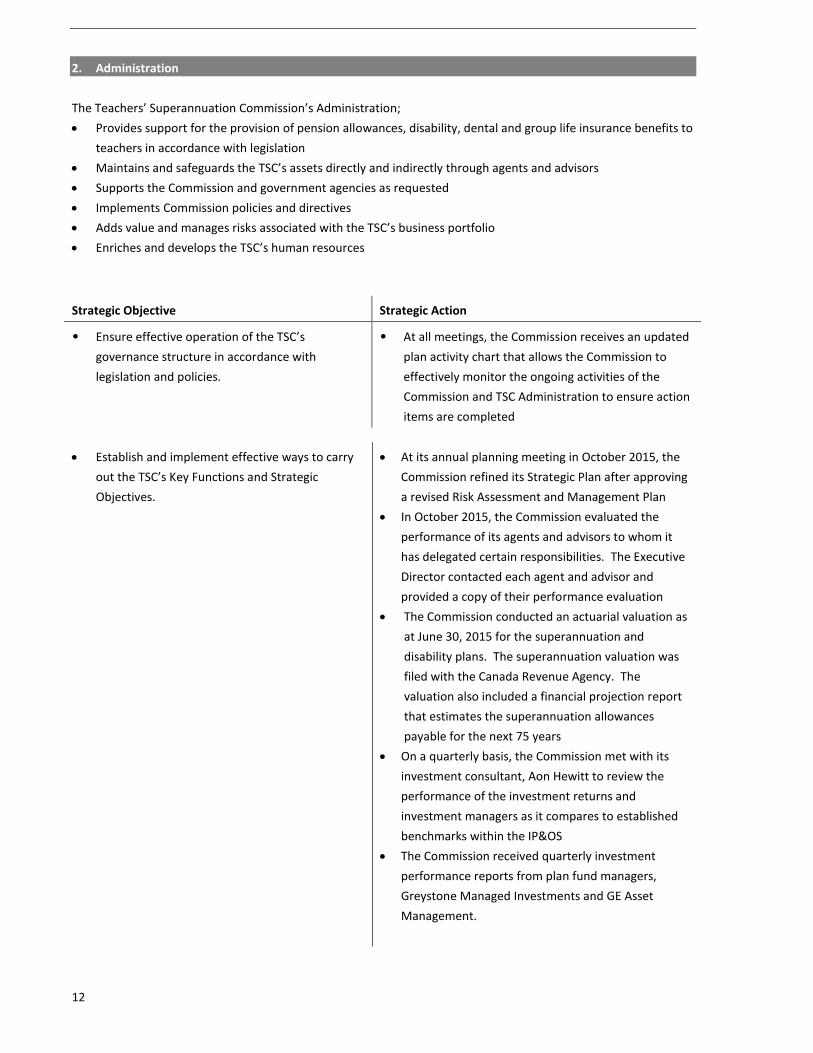
2. Administration
The Teachers’ Superannuation Commission’s Administration;
Provides support for the provision of pension allowances, disability, dental and group life insurance benefits to
teachers in accordance with legislation
Maintains and safeguards the TSC’s assets directly and indirectly through agents and advisors
Supports the Commission and government agencies as requested
Implements Commission policies and directives
Adds value and manages risks associated with the TSC’s business portfolio
Enriches and develops the TSC’s human resources
Strategic Objective Strategic Action
• Ensure effective operation of the TSC’s
governance structure in accordance with
legislation and policies.
• At all meetings, the Commission receives an updated
plan activity chart that allows the Commission to
effectively monitor the ongoing activities of the
Commission and TSC Administration to ensure action
items are completed
Establish and implement effective ways to carry
out the TSC’s Key Functions and Strategic
Objectives.
At its annual planning meeting in October 2015, the
Commission refined its Strategic Plan after approving
a revised Risk Assessment and Management Plan
In October 2015, the Commission evaluated the
performance of its agents and advisors to whom it
has delegated certain responsibilities. The Executive
Director contacted each agent and advisor and
provided a copy of their performance evaluation
The Commission conducted an actuarial valuation as
at June 30, 2015 for the superannuation and
disability plans. The superannuation valuation was
filed with the Canada Revenue Agency. The
valuation also included a financial projection report
that estimates the superannuation allowances
payable for the next 75 years
On a quarterly basis, the Commission met with its
investment consultant, Aon Hewitt to review the
performance of the investment returns and
investment managers as it compares to established
benchmarks within the IP&OS
The Commission received quarterly investment
performance reports from plan fund managers,
Greystone Managed Investments and GE Asset
Management.
13
Management participated in the Annual Investors
Update Conference Call with the GE Asset
Management Private Equity Investment team.
Management reports back to the Commission with an
update surrounding the investment status,
performance and outlook for both international
private equity portfolios.
TSC administrative staff attended various education
and professional development sessions during
2015-16
All TSC employees have established work plans that
are assessed and reviewed annually
Along with its information technology service
provider, the Commission maintains an information
technology plan for disaster recovery that integrates
with a business continuity plan for its information
systems
In January 2016, the Commission reviewed, revised
and approved its Communication Plan. The
Communication Plan is aligned with the overall
Strategic Plan and TSC Governance Manual
The Commission maintains and reviews an effective
Risk Assessment and Management Plan
Provide effective oversight of the administrative
operations of the TSC.
The Commission receives regular updates on the
progress towards fulfilling the recommendations
made by the Provincial Auditor of Saskatchewan
The Commission annually evaluates the performance
of the Executive Director utilizing the management
performance tool, Planning for Success
The Commission receives quarterly financial reports
on the financial operations of the TSC as well as all
pension and benefit plans under administration
The Commission considered one submission received
under its Dispute Resolution Process during 2015-16
The Commission receives an administrative update
report from Management on the administrative and
financial operations of the Teachers’ Superannuation
Commission at every meeting
14
3. Member Services
The TSC acknowledges the importance of service to teachers. For member services, the TSC will:
Assist/Enable teachers to understand the options available to them respecting their pension, disability
benefits, dental and group life insurance coverage
Support teachers through timely, responsive and appropriate communication
Render services with personalized care and attention, with integrity, fairness and efficiency
Strategic Objective Strategic Action
Identify and assess performance measurement
against relevant service standards.
The TSC Staff provide care and attention to the
quality of service provided to teachers for all plans
under administration
Management regularly reviews its policies and
procedures to ensure it is meeting its statutory
requirements for the teacher pension and benefit
plans
The TSC staff collaborates with the insurance
carrier to implement the most efficient processes
to administer the benefit plans
Administration meets annually with the insurance
carrier to review service standards and claim
turnaround times
Ensure continuity and consistency of service
received.
The TSC has procedures and processes in place for
cross-training to maintain high quality service and
ensure adequate segregation of duties to mitigate
risk to superannuation and benefit plan monies
The TSC staff is available to members to provide
pension information and options for retirement
planning as well as be of assistance to members for
questions surrounding the group life insurance and
dental plans.
A toll-free number is provided for teachers and
superannuates with access to staff to answer any
questions regarding the teacher superannuation
and benefit plans
The TSC website provides members with pertinent
information and forms with respect to the teacher
superannuation and benefit plans
15
4. Affiliate Services
The TSC interacts with a number of affiliate parties when delivering services to teachers. For affiliate services the
TSC will:
Support teachers through cooperative, progressive relationships with teacher related organizations (i.e.
School Divisions, Saskatchewan Association of School Business Officials (SASBO), League of Education
Administrators, Directors and Superintendents (LEADS), etc.)
Work with the Saskatchewan Teachers’ Federation (STF) and Superannuated Teachers of Saskatchewan (STS)
where possible and invited to do so in support of Saskatchewan teachers
Strategic Objective Strategic Action
Seek collaboration and initiate activities that
increase service to membership or add value and
minimize risk to teachers or the people of
Saskatchewan.
When requested by the STF, the TSC Administrative
staff attends STF sponsored retirement planning
seminars and provides pension projections for
seminar participants
The TSC staff communicate regularly with school
divisions to continue the efficiency of remitting
teacher contributions for the superannuation and
group life insurance plans
Maintain an open dialogue with the STF and STS to
best serve the needs of current and superannuated
teachers
16
Administration
The TSC employs an Executive Director and staff
required for administration of the various legislation
and commission policies and is independent from
management.
The administrative team consisting of 12.0 full time
equivalent employees is responsible for all the
administrative functions that result in meeting the
objectives outlined earlier and includes the strategic
and operating unit work plans, financial and business
decisions, evaluation of results against these plans,
and reporting of activity to Commission members.
Refer to the governance manual for further
elaboration of management’s roles and
responsibilities.
The administrative team also highlights certain
policy decision items to the Commission members,
including relevant recommendations, and responds
to requests for information or onward execution as
requested by Commission members.
Administration works very closely and cooperatively
with the Saskatchewan Teachers’ Federation and the
Superannuated Teachers of Saskatchewan to ensure
seamless delivery of consistent, high-quality services
to teachers across the province. This is particularly
true in relation to the retirement planning sessions
facilitated by the Saskatchewan Teachers’
Federation. Collaboration on these retirement
oriented activities ensures the teachers of
Saskatchewan have the opportunity to be informed
through group and one-on-one counseling sessions.
Management formally communicates to Commission
members on the operational activities at the
regularly scheduled meetings, in addition to ad-hoc
communications on various matters. The
Commission conducts performance evaluation of
management against established objectives.
The $1.563 million operating budget of the
Commission is paid out of monies appropriated by
the Legislature.
17
Consultants
The TSC, as part of fulfilling its fiduciary duty in
relation to the assets of the funds and as part of
good governance, may acquire specialist
competencies. This may include the engagement
of technical, professional or other advisor,
specialist or consultant services. Given the
specialist knowledge required in investment
management, defined benefit plan valuations and
calculations, and pension administration software,
the TSC does engage a number of outside
consultants and advisors.
Actuarial consulting firms assist with the
development of the investment policy guidelines,
propose assumptions and perform the calculations
of benefits for marriage breakdown, and actuarial
present value for the purpose of reciprocal transfer
agreements. Actuarial services are also required in
preparing a valuation of the Plan and for cash flow
projections. The current actuary for the plan is Aon
Hewitt.
Investment managers provide the necessary
expertise in managing the pension assets in
compliance with the asset mix guidelines to ensure
risk-adjusted returns are maximized and achieve
performance at or above the established
performance benchmarks. Quarterly performance
reports and presentations are provided to
Commission members. Greystone Managed
Investments Inc. is responsible for managing the
assets with the exception of private equity
managed by GE Asset Management.
State Street Trust Company, the investment
custodian, provides compliance reporting on a
quarterly basis and all results are reported to
Commission members.
Aon Hewitt also assists the Commission as an
investment advisor by monitoring performance of the
investment managers. Reports and presentations are
provided to Commission members quarterly.
When required, legal consultation is provided by
either the Ministry of Justice or private legal counsel.
Legal advice provided to the Commission ensures all
legal obligations are fulfilled.
Specialized information technology services are
purchased to ensure the critical pension
administration system, retirement management and
payroll systems, disability systems and backbone
network systems are securely maintained.
Valuation
The Commission has historically reviewed the
valuation assumptions biennially and does so in
consultation with the plan actuary. The 2015
valuation discount rate assumption was updated to
reflect the Saskatchewan provincial bond yield curve
as at June 30, 2015 to match the timing and amount
of future expected benefit payments as well as the
expected rate of return on assets of 3.65%. This single
discount rate for valuation purposes was 2.8% per
annum and was determined as a blend between the
funded and unfunded portions of the Plan. The
financial statements at June 30, 2016 are based on an
extrapolation of the June 30, 2015 valuation results.
The total deficit as at June 30, 2016 is $5.95 billion.
The legal obligation to pay pensions to the teachers of
Saskatchewan in accordance with the provisions of
The Teachers Superannuation and Disability Benefits
Act rests with the government of Saskatchewan.
18
Investments
The segregated funds of the Teachers’
Superannuation Fund assets and all of the
Voluntary Contributions Fund (together known as
the Teachers’ Superannuation Plan or the “Plan”)
are held in trust by State Street Trust Company,
custodian of the investments on behalf of the Plan.
Custodial fees of $46,314 (2015 – $49,458) and
$27,846 (2015 – $38,060) for brokerage fees were
paid to State Street Trust Company for 2016.
Greystone Managed Investments Inc. is responsible
for investing the funds. Investment fees paid to
Greystone Managed Investments Inc. for 2016 were
$483,991 (2015 – $657,408). Investment
management fees for private equity paid to GE
Asset Management for 2016 were $145,052 (2015 –
$1,527,994). State Street Trust Company is also the
custodian for the pooled fund investments on
behalf of Greystone Managed Investments Inc.
The TSC with the assistance of the investment
manager, investment consultant, and actuarial
consultant develop investment policies, strategies
and objectives for each fund of the Plan. The
Investment Policy & Objectives Statement (IP&OS)
details the asset mix guidelines, and a benchmark
portfolio against which the performance of the
investment managers is measured. Individual asset
class performance is also measured against their
relevant, respective indices. The current IP&OS is
posted on the TSC website.
In meeting with its investment consultant, the
Commission reviews its IP&OS annually. A key aspect
of risk is managed through adequate portfolio
diversification. Working in conjunction with the asset
manager, investment consultants and actuary, the
desired risk-adjusted return is established.
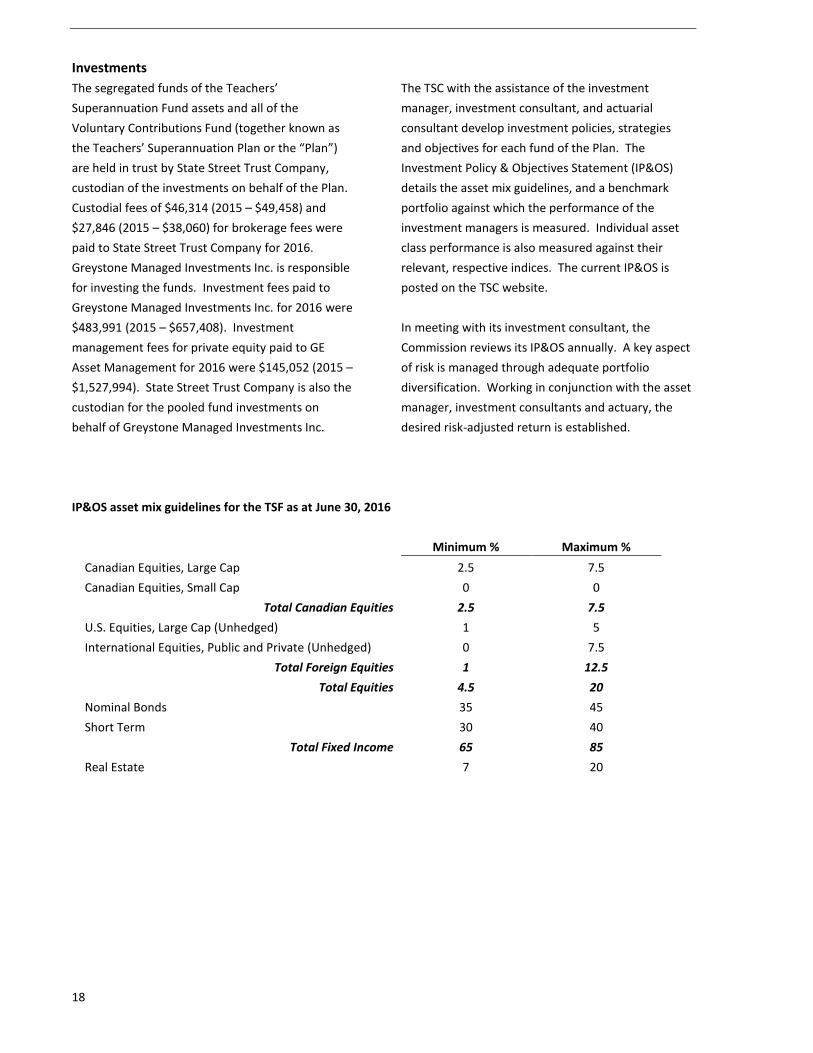
IP&OS asset mix guidelines for the TSF as at June 30, 2016
Minimum % Maximum %
Canadian Equities, Large Cap 2.5 7.5
Canadian Equities, Small Cap 0 0
Total Canadian Equities 2.5 7.5
U.S. Equities, Large Cap (Unhedged) 1 5
International Equities, Public and Private (Unhedged) 0 7.5
Total Foreign Equities 1 12.5
Total Equities 4.5 20
Nominal Bonds 35 45
Short Term 30 40
Total Fixed Income 65 85
Real Estate 7 20
19
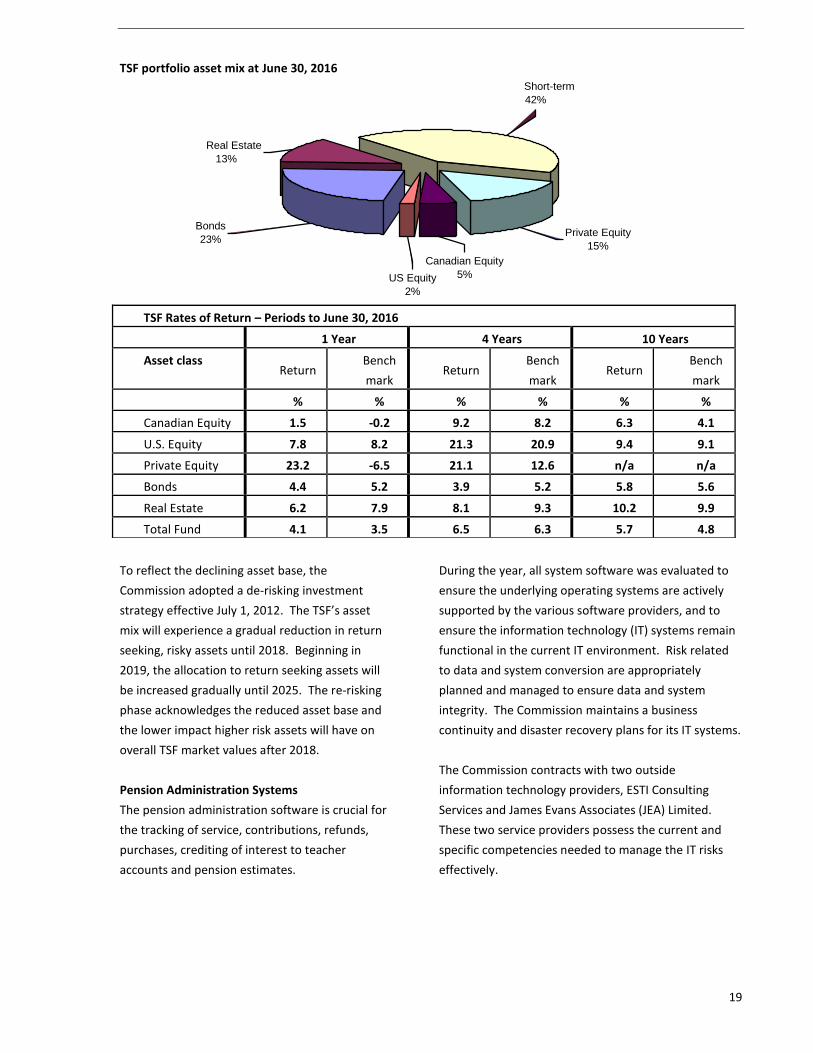
US Equity
2%
Canadian Equity
5%
Private Equity
15%
Short-term
42%
Real Estate
13%
Bonds
23%
TSF portfolio asset mix at June 30, 2016
To reflect the declining asset base, the
Commission adopted a de-risking investment
strategy effective July 1, 2012. The TSF’s asset
mix will experience a gradual reduction in return
seeking, risky assets until 2018. Beginning in
2019, the allocation to return seeking assets will
be increased gradually until 2025. The re-risking
phase acknowledges the reduced asset base and
the lower impact higher risk assets will have on
overall TSF market values after 2018.
Pension Administration Systems
The pension administration software is crucial for
the tracking of service, contributions, refunds,
purchases, crediting of interest to teacher
accounts and pension estimates.
During the year, all system software was evaluated to
ensure the underlying operating systems are actively
supported by the various software providers, and to
ensure the information technology (IT) systems remain
functional in the current IT environment. Risk related
to data and system conversion are appropriately
planned and managed to ensure data and system
integrity. The Commission maintains a business
continuity and disaster recovery plans for its IT systems.
The Commission contracts with two outside
information technology providers, ESTI Consulting
Services and James Evans Associates (JEA) Limited.
These two service providers possess the current and
specific competencies needed to manage the IT risks
effectively.
TSF Rates of Return – Periods to June 30, 2016
1 Year 4 Years 10 Years
Asset class Return
Bench
mark Return
Bench
mark Return
Bench
mark
% % % % % %
Canadian Equity 1.5 -0.2 9.2 8.2 6.3 4.1
U.S. Equity 7.8 8.2 21.3 20.9 9.4 9.1
Private Equity 23.2 -6.5 21.1 12.6 n/a n/a
Bonds 4.4 5.2 3.9 5.2 5.8 5.6
Real Estate 6.2 7.9 8.1 9.3 10.2 9.9
Total Fund 4.1 3.5 6.5 6.3 5.7 4.8
20
Risk Management
As part of governance processes, the Commission
adopted a risk assessment and management plan
whereby key risks are identified, along with
identification of how risks will be managed and who
is responsible. The outcome of this approach is to
provide cost-effective management of risk and to
create opportunities to add value. The following are
potential risks that could adversely affect the
operation of the Plan:
Risk of loss associated with non-compliance with
laws, rules, regulations, prescribed practices or
ethical standards within jurisdiction of operation
Risks arising from inability to implement
appropriate business plans, strategies, decision-
making, resource allocation and inability to
adapt to changes in the business environment
Risk of direct or indirect loss resulting from the
inadequate or failed internal processes, people,
system or from external events
Risk associated with direct or indirect loss
resulting from market events and investment
related profiles
Risk of not having adequate procedures and
processes in place to continue operations in the
event of a disaster or inability to access building
The Commission reviews and updates its Risk
Assessment and Management Plan on an annual
basis.
Communication
Timely and transparent communications are an
essential element of good pension governance. The
Commission strives to achieve effective
communication with its teacher and superannuated
members.
Federal and Provincial legislation in the area of
privacy along with the implementation of the Privacy
Framework within the Province will not only serve to
protect the interests of teachers but mitigate the
related risks and concerns. This privacy legislation is
impacting communication not only in relation to
what type of information is communicated from the
pension plan, but also in assessing what the
Commission collects directly from members.
In addition to this annual report and the annual
statements to members, the TSC website and email
have become increasingly important as the
preferred tools of communication and information
exchange. The website provides considerable
information:
Downloadable forms for Dental, Group Life
Insurance, Disability, Reciprocal Transfers, and
personal information change forms
Information, including Frequently Asked
Questions on Dental, Pension, Disability and
Group Life Insurance
Various legislative Acts and Regulations
administered by the Commission
Policies and responsibilities adhered to by the
Commission
Recent annual reports, superannuate and
annual statement letters
Contact information
Dispute Resolution Process
Governance Manual
Communication Plan
Strategic Plan
Investment Policy & Objective Statement
More on-line at www.stsc.gov.sk.ca
21
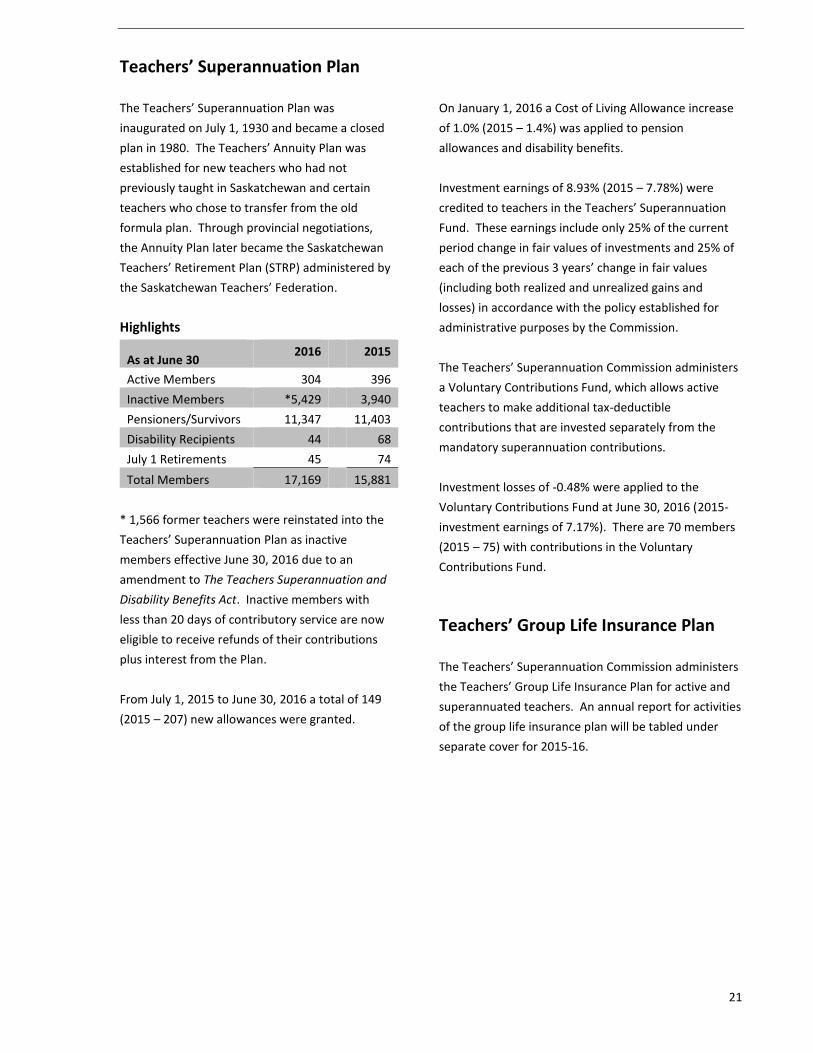
Teachers’ Superannuation Plan
The Teachers’ Superannuation Plan was
inaugurated on July 1, 1930 and became a closed
plan in 1980. The Teachers’ Annuity Plan was
established for new teachers who had not
previously taught in Saskatchewan and certain
teachers who chose to transfer from the old
formula plan. Through provincial negotiations,
the Annuity Plan later became the Saskatchewan
Teachers’ Retirement Plan (STRP) administered by
the Saskatchewan Teachers’ Federation.
Highlights
As at June 30 2016 2015
Active Members 304 396
Inactive Members *5,429 3,940
Pensioners/Survivors 11,347 11,403
Disability Recipients 44 68
July 1 Retirements 45 74
Total Members 17,169 15,881
* 1,566 former teachers were reinstated into the
Teachers’ Superannuation Plan as inactive
members effective June 30, 2016 due to an
amendment to The Teachers Superannuation and
Disability Benefits Act. Inactive members with
less than 20 days of contributory service are now
eligible to receive refunds of their contributions
plus interest from the Plan.
From July 1, 2015 to June 30, 2016 a total of 149
(2015 – 207) new allowances were granted.
On January 1, 2016 a Cost of Living Allowance increase
of 1.0% (2015 – 1.4%) was applied to pension
allowances and disability benefits.
Investment earnings of 8.93% (2015 – 7.78%) were
credited to teachers in the Teachers’ Superannuation
Fund. These earnings include only 25% of the current
period change in fair values of investments and 25% of
each of the previous 3 years’ change in fair values
(including both realized and unrealized gains and
losses) in accordance with the policy established for
administrative purposes by the Commission.
The Teachers’ Superannuation Commission administers
a Voluntary Contributions Fund, which allows active
teachers to make additional tax-deductible
contributions that are invested separately from the
mandatory superannuation contributions.
Investment losses of -0.48% were applied to the
Voluntary Contributions Fund at June 30, 2016 (2015-
investment earnings of 7.17%). There are 70 members
(2015 – 75) with contributions in the Voluntary
Contributions Fund.
Teachers’ Group Life Insurance Plan
The Teachers’ Superannuation Commission administers
the Teachers’ Group Life Insurance Plan for active and
superannuated teachers. An annual report for activities
of the group life insurance plan will be tabled under
separate cover for 2015-16.
22
Teachers’ Disability Benefits Plan
Disability benefits are available when a teacher is
physically or mentally incapacitated and unable to
teach. All payments are a charge on and payable
from the General Revenue Fund of the Province of
Saskatchewan, pursuant to Section 38(2) of The
Teachers Superannuation and Disability Benefits
Act.
Eligibility
Teachers who participate in The Teachers’
Superannuation Plan are eligible for benefits from
this Plan. The Plan provides benefits based on a
formula incorporating years of service and average
earnings. To be eligible, a teacher must have 10
years of eligibility service of which three years are
in the five years immediately preceding the
disability date, be under the age of 65 and the
disability continues beyond 60 days. The disability
payment commences when the sick leave benefits
from a school board cease.
Medical evidence is required from two physicians
verifying the disability. Ongoing eligibility for
benefits is confirmed by periodic medical reviews.
Teachers who are partially disabled and teaching
on a part-time basis are entitled to benefits in
proportion to the non-teaching time.
A teacher’s disability benefit ceases on the earliest
of:
(a) The commencement of a pension allowance;
(b) The attainment of age 65 by the teacher; and
(c) The death of the teacher.
At June 30, 2016, 44 teachers (2015 – 68) were in
receipt of disability benefits from the Plan. Teachers
are also encouraged to apply for disability benefits
from the Canada Pension Plan. If benefits are not
payable from the Canada Pension Plan, the amount
payable by the Teachers’ Disability Benefits Plan are
increased accordingly.
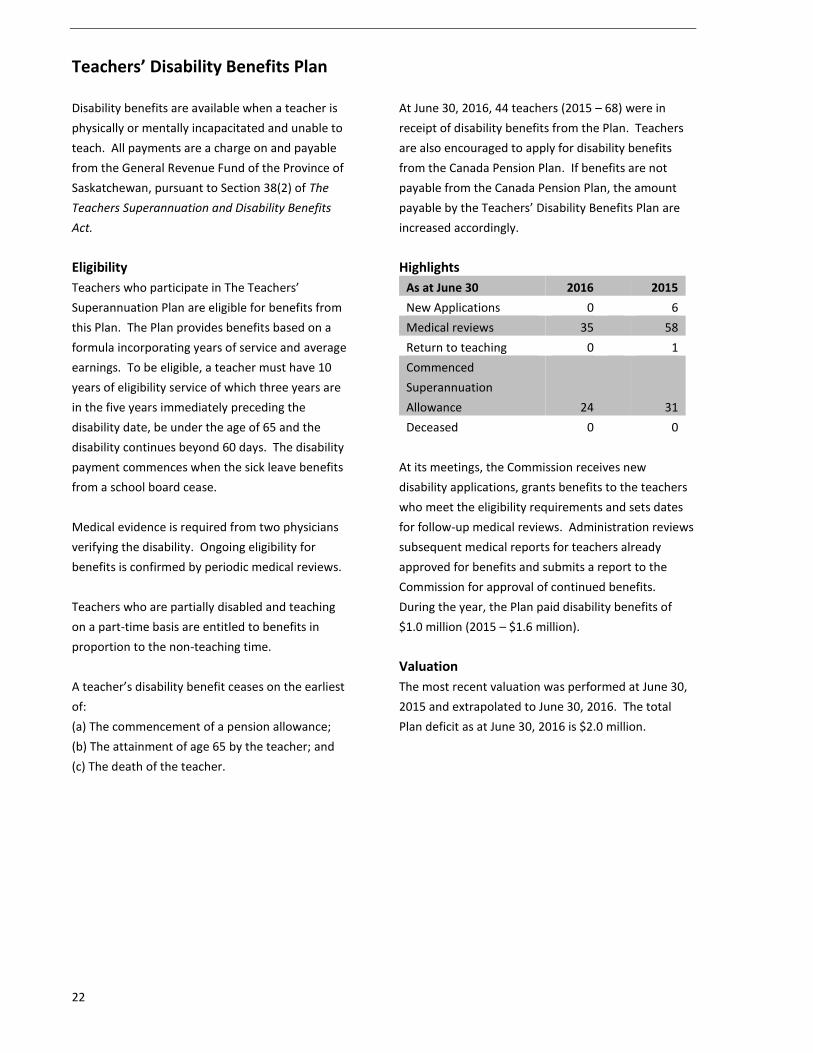
Highlights
As at June 30 2016 2015
New Applications 0 6
Medical reviews 35 58
Return to teaching 0 1
Commenced
Superannuation
Allowance
24
31
Deceased 0 0
At its meetings, the Commission receives new
disability applications, grants benefits to the teachers
who meet the eligibility requirements and sets dates
for follow-up medical reviews. Administration reviews
subsequent medical reports for teachers already
approved for benefits and submits a report to the
Commission for approval of continued benefits.
During the year, the Plan paid disability benefits of
$1.0 million (2015 – $1.6 million).
Valuation
The most recent valuation was performed at June 30,
2015 and extrapolated to June 30, 2016. The total
Plan deficit as at June 30, 2016 is $2.0 million.
23
Teachers’ Dental Plan
The Teachers’ Dental Plan was implemented
effective January 1, 1986 for Saskatchewan teachers
and is a collectively bargained benefit. In
accordance with The Teachers’ Dental Plan Act, the
Minister of Finance, on behalf of the Government of
Saskatchewan, is responsible for all the costs
associated with the dental plan. The Teachers’
Dental Plan is a benefit provided to all eligible
teachers and their families for dental care promoting
health and wellness. The intent of the plan is to
promote good dental health by reducing costs for
preventative, routine and major restorative dental
work. Teachers with regular or temporary contracts
are eligible for dental coverage as well as their
spouse and dependants. Dependents 21 years of
age to the age of 26 continue to be eligible for
coverage provided they are in full-time attendance
at an educational institution. Teachers receiving
disability benefits under the STF Income
Continuance Plan and/or the Teachers' Disability
Benefits Plan are covered under the Plan.
Dental Coverage
The Plan provides Saskatchewan teachers and their
dependants with coverage for Preventive, Routine
and Major Restorative dental services. It also
provides orthodontic services for members.
Level I – Preventive Services – 100% of the
eligible charge.
Level II – Basic and Routine Services – 85% of
the eligible charge.
Level III – Major Restorative Services – 60% of
the eligible charge.
Level IV – Orthodontic Services – 50% of the
eligible charge to the maximum of $2,000 per
person.
Insurance Carrier
The Government of Saskatchewan and the STF
mutually agree upon the insurance carrier to provide
administrative services. The dental plan is
administered by Sun Life Assurance Company of
Canada on an Administrative Services Only (ASO)
basis under Group Policy # 25273. Teachers can
electronically submit or mail claims directly to Sun
Life for processing. Dental forms can be
downloaded from the internet on the website
www.stsc.gov.sk.ca/forms/. Sun Life can be
contacted at their toll free number 1-800-361-6212
or online at www.sunlife.ca.
Highlights
For the year ending December 31, 2015, Sun Life
processed 55,055 (2014 – 51,430) dental claims.
For the year ending December 31, 2015, the
government paid $12,064,520 (2014 – $11,320,717)
in dental benefits and administrative costs.
Dental claim forms and additional information on
the dental plan regarding costs, benefits after
termination, pre-treatment estimates, coordination
of benefits, maximum reimbursement levels,
dependent coverage, how to make a claim, link to
enroll on the insurance carrier website, fee changes,
etc., are available on-line at
www.stsc.gov.sk.ca/dental/.
24
Teachers’ Superannuation Commission Management Report, 2016
The management of the Teachers’ Superannuation Commission is responsible for the integrity of the
accompanying financial statements and all other information in this Annual Report. In Canada, it is the
responsibility of management to prepare financial statements in accordance with Canadian generally accepted
accounting principles.
The integrity of the financial records from which these financial statements are prepared is largely dependent on
the systems of internal accounting controls. The purpose of such systems is to provide reasonable assurance that
transactions are executed in accordance with proper authorization, transactions are appropriately recorded in
order to permit preparation of financial statements and assets are properly accounted for and safeguarded against
loss from unauthorized use. Underlying this concept of reasonable assurance is the fact that limitations exist in
any system of internal accounting controls based on the premise that the cost of such controls should not exceed
the benefits derived there from.
The pension obligations and actuarial value of net assets available for benefit are determined by an actuarial
valuation and extrapolation. Actuarial valuation and extrapolation reports require best judgment in order that the
financial statements reflect fairly the financial position of the Plan. The actuary’s opinion for the Teachers’
Superannuation Plan for the June 30, 2015 valuation and the extrapolation of the valuation results to
June 30, 2016 appear on page 25.
The financial statements have been audited by the Provincial Auditor of Saskatchewan. The report to the
Members of the Legislative Assembly, stating the scope of the examination and opinion on the financial
statements, appears on page 26.
The financial statements have been examined and approved by the Commission.
Doug Volk, BA, PPAC Sharlene Arklie, FCPA, FCGA
Executive Director Senior Manager, Financial Operations
Regina, Saskatchewan
October 13, 2016
25
Actuary’s Opinion
Aon Hewitt was retained by the Saskatchewan Teachers’ Superannuation Commission (the “Commission”) to
perform an actuarial valuation of the assets and liabilities of the Saskatchewan Teachers’ Superannuation Plan (the
“Plan”) as at June 30, 2015. Aon Hewitt was further retained to prepare an extrapolation of the valuation results
to June 30, 2016 for inclusion in the Annual Report with respect to The Teachers Superannuation and Disability
Benefits Act for the Year Ended June 30, 2016.
The valuation and extrapolation of the Plan’s actuarial assets and liabilities were based on:
Membership data provided by the Commission as at June 30, 2015;
Financial Statements as at June 30, 2016 provided by the Commission;
Methods prescribed by the Chartered Professional Accountants of Canada for pension plan financial
statements; and
Assumptions about future events (economic and demographic) which were developed by management and
Aon Hewitt and are considered as management’s best estimate of these events.
While the actuarial assumptions used to estimate liabilities for the Plan’s financial statements contained in the
Annual Report represent management’s best estimate of future events, and while, in my opinion, these
assumptions are appropriate for the purposes of the valuation and extrapolation, the Plan’s future experience will
differ from the actuarial assumptions. Emerging experience differing from the assumptions will result in gains or
losses that will be revealed in future valuations and will affect the financial position of the Plan.
I have tested the data for reasonableness and consistency with prior valuations and, in my opinion, the data is
sufficient and reliable for the purposes of the valuation and the extrapolation. In my opinion, the methods and
assumptions used in the valuation and extrapolation are appropriate for the purposes of the valuation and
extrapolation. My opinions have been given, and the valuation and extrapolation have been performed, in
accordance with accepted actuarial practice in Canada.
Paul Hebert
Fellow, Canadian Institute of Actuaries
Fellow, Society of Actuaries
October 13, 2016
26
INDEPENDENT AUDITOR’S REPORT
To: The Members of the Legislative Assembly of Saskatchewan
I have audited the accompanying financial statements of the Teachers’ Superannuation Plan, which comprise the
statement of financial position as at June 30, 2016, and the statement of changes in net assets available for
benefits, and statement of changes in pension obligations for the year then ended, and a summary of significant
accounting policies and other explanatory information.
Management's Responsibility for the Financial Statements
Management is responsible for the preparation and fair presentation of these financial statements in accordance
with Canadian accounting standards for pension plans for Treasury Board’s approval, and for such internal
control as management determines is necessary to enable the preparation of financial statements that are free
from material misstatement, whether due to fraud or error.
Auditor's Responsibility
My responsibility is to express an opinion on these financial statements based on my audit. I conducted my audit
in accordance with Canadian generally accepted auditing standards. Those standards require that I comply with
ethical requirements and plan and perform the audit to obtain reasonable assurance about whether the financial
statements are free from material misstatement.
An audit involves performing procedures to obtain audit evidence about the amounts and disclosures in the
financial statements. The procedures selected depend on the auditor's judgment, including the assessment of
the risks of material misstatement of the financial statements, whether due to fraud or error. In making those risk
assessments, the auditor considers internal control relevant to the entity's preparation and fair presentation of the
financial statements in order to design audit procedures that are appropriate in the circumstances, but not for the
purpose of expressing an opinion on the effectiveness of the entity's internal control. An audit also includes
evaluating the appropriateness of accounting policies used and the reasonableness of accounting estimates
made by management, as well as evaluating the overall presentation of the financial statements.
I believe that the audit evidence I have obtained is sufficient and appropriate to provide a basis for my audit
opinion.
Opinion
In my opinion, the financial statements present fairly, in all material respects, the financial position of the
Teachers’ Superannuation Plan as at June 30, 2016, and the changes in its net assets available for benefits and
changes in its pension obligations for the year then ended in accordance with Canadian accounting standards for
pension plans.
Regina, Saskatchewan Judy Ferguson, FCPA, FCA October 13, 2016 Provincial Auditor
27
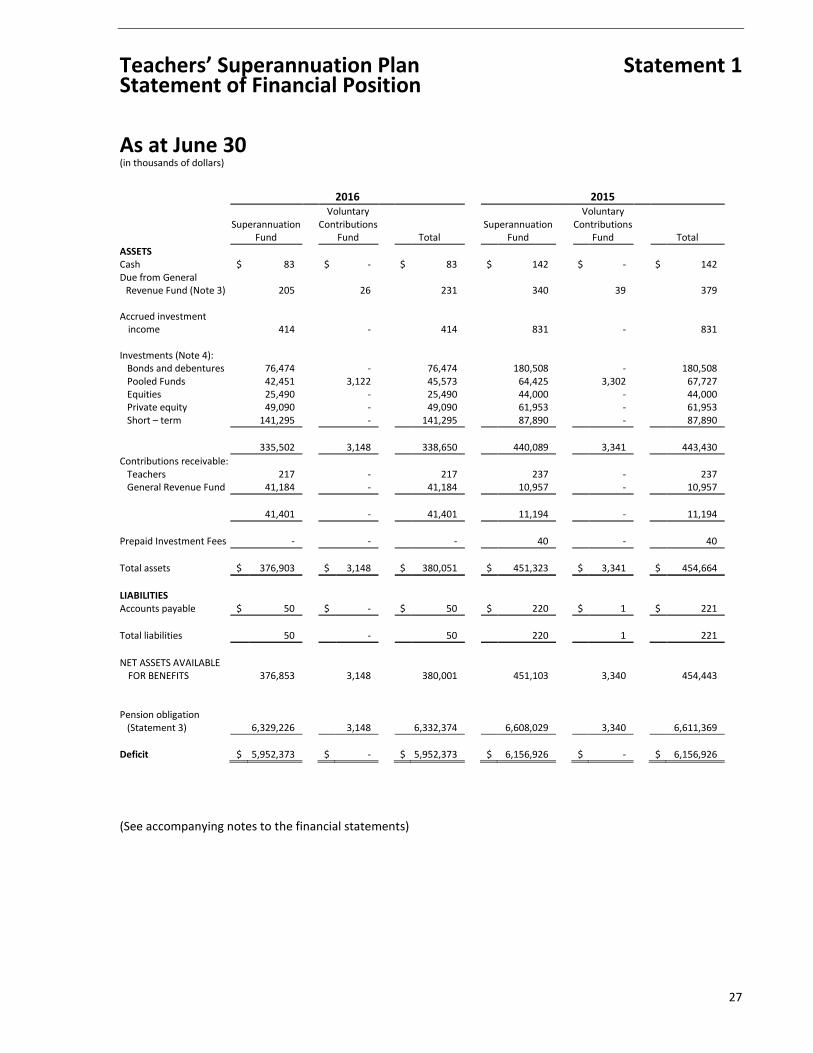
Teachers’ Superannuation Plan Statement 1
Statement of Financial Position
As at June 30 (in thousands of dollars)
2016 2015
Superannuation
Fund
Voluntary Contributions
Fund
Total
Superannuation
Fund
Voluntary Contributions
Fund
Total
ASSETS Cash $ 83 $ - $ 83 $ 142 $ - $ 142 Due from General
Revenue Fund (Note 3)
205 26 231 340 39 379
Accrued investment income
414 - 414 831 - 831
Investments (Note 4):
Bonds and debentures 76,474 - 76,474 180,508 - 180,508 Pooled Funds 42,451 3,122 45,573 64,425 3,302 67,727 Equities 25,490 - 25,490 44,000 - 44,000 Private equity 49,090 - 49,090 61,953 - 61,953 Short – term 141,295 - 141,295 87,890 - 87,890
335,502 3,148 338,650 440,089 3,341 443,430
Contributions receivable: Teachers 217 - 217 237 - 237 General Revenue Fund 41,184 - 41,184 10,957 - 10,957
41,401 - 41,401 11,194 - 11,194
Prepaid Investment Fees - - - 40 - 40
Total assets $ 376,903 $ 3,148 $ 380,051 $ 451,323 $ 3,341 $ 454,664
LIABILITIES Accounts payable $ 50 $ - $ 50 $ 220 $ 1 $ 221
Total liabilities 50 - 50 220 1 221
NET ASSETS AVAILABLE
FOR BENEFITS
376,853
3,148
380,001
451,103
3,340
454,443 Pension obligation
(Statement 3)
6,329,226
3,148
6,332,374
6,608,029
3,340
6,611,369
Deficit $ 5,952,373 $ - $ 5,952,373 $ 6,156,926 $ - $ 6,156,926
(See accompanying notes to the financial statements)
28
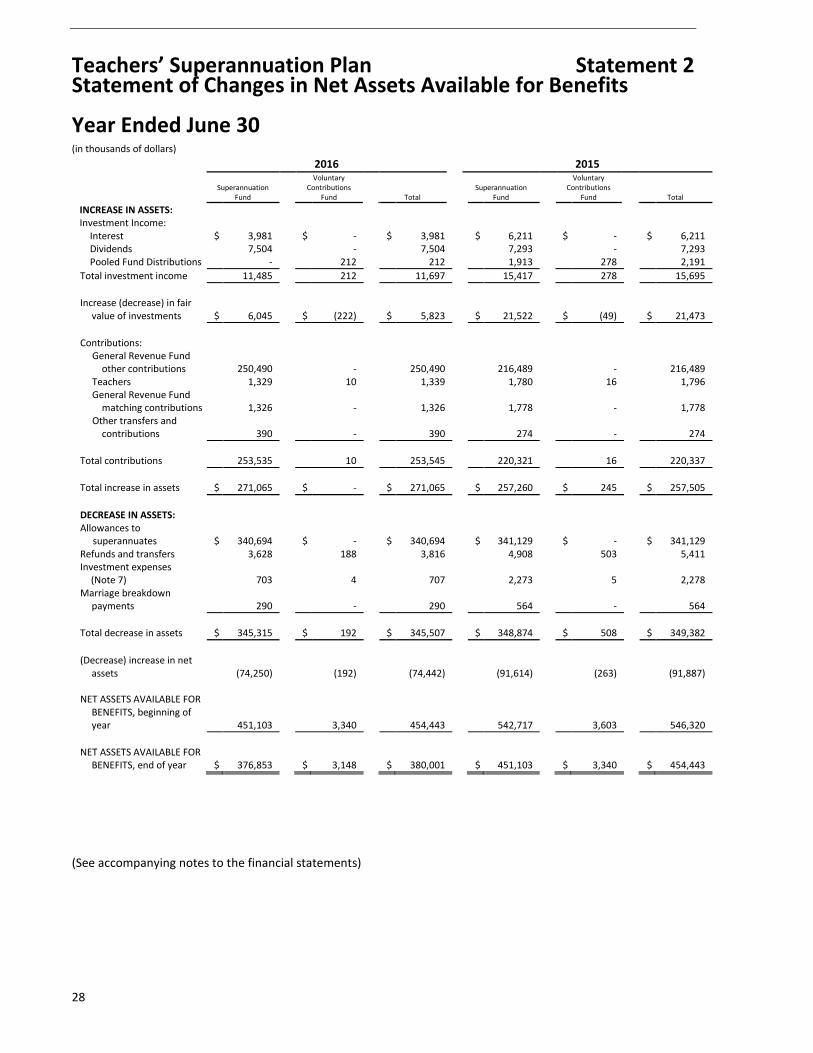
Teachers’ Superannuation Plan Statement 2
Statement of Changes in Net Assets Available for Benefits Year Ended June 30 (in thousands of dollars)
2016 2015
Superannuation
Fund
Voluntary Contributions
Fund
Total
Superannuation
Fund
Voluntary Contributions
Fund
Total
INCREASE IN ASSETS: Investment Income:
Interest $ 3,981 $ - $ 3,981 $ 6,211 $ - $ 6,211 Dividends 7,504 - 7,504 7,293 - 7,293 Pooled Fund Distributions - 212 212 1,913 278 2,191
Total investment income 11,485 212 11,697 15,417 278 15,695
Increase (decrease) in fair
value of investments $ 6,045
$ (222)
$ 5,823
$ 21,522
$ (49)
$ 21,473
Contributions:
General Revenue Fund other contributions
250,490
-
250,490
216,489
-
216,489
Teachers 1,329 10 1,339 1,780 16 1,796 General Revenue Fund
matching contributions
1,326
-
1,326
1,778
-
1,778 Other transfers and
contributions
390
-
390
274
-
274
Total contributions 253,535 10 253,545 220,321 16 220,337
Total increase in assets $ 271,065 $ - $ 271,065 $ 257,260 $ 245 $ 257,505
DECREASE IN ASSETS: Allowances to
superannuates $ 340,694 $ - $ 340,694 $ 341,129 $ - $ 341,129
Refunds and transfers 3,628 188 3,816 4,908 503 5,411 Investment expenses
(Note 7)
703 4 707 2,273 5 2,278 Marriage breakdown
payments
290 - 290 564 - 564
Total decrease in assets $ 345,315 $ 192 $ 345,507 $ 348,874 $ 508 $ 349,382
(Decrease) increase in net
assets
(74,250)
(192)
(74,442)
(91,614)
(263)
(91,887) NET ASSETS AVAILABLE FOR
BENEFITS, beginning of year
451,103
3,340
454,443
542,717
3,603
546,320
NET ASSETS AVAILABLE FOR
BENEFITS, end of year $ 376,853
$ 3,148
$ 380,001
$ 451,103
$ 3,340
$ 454,443
(See accompanying notes to the financial statements)
29
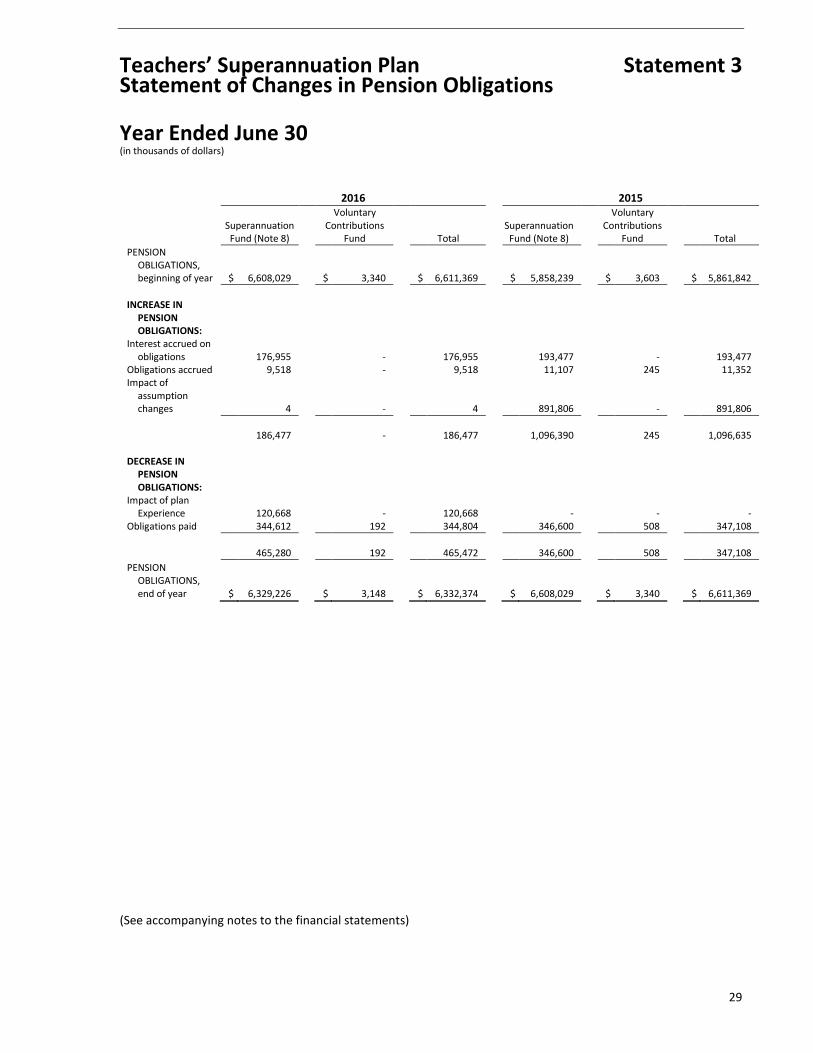
Teachers’ Superannuation Plan Statement 3 Statement of Changes in Pension Obligations
Year Ended June 30 (in thousands of dollars)
2016 2015
Superannuation Fund (Note 8)
Voluntary Contributions
Fund Total Superannuation Fund (Note 8)
Voluntary Contributions
Fund Total
PENSION OBLIGATIONS, beginning of year $ 6,608,029
$ 3,340
$ 6,611,369
$ 5,858,239
$ 3,603
$ 5,861,842
INCREASE IN
PENSION OBLIGATIONS:
Interest accrued on obligations
176,955 - 176,955 193,477 - 193,477
Obligations accrued 9,518 - 9,518 11,107 245 11,352 Impact of
assumption changes
4 - 4 891,806 - 891,806
186,477 - 186,477 1,096,390 245 1,096,635 DECREASE IN
PENSION OBLIGATIONS:
Impact of plan Experience
120,668 - 120,668 - - -
Obligations paid 344,612 192 344,804 346,600 508 347,108
465,280 192 465,472 346,600 508 347,108
PENSION OBLIGATIONS, end of year $ 6,329,226
$ 3,148
$ 6,332,374
$ 6,608,029
$ 3,340
$ 6,611,369
(See accompanying notes to the financial statements)
30
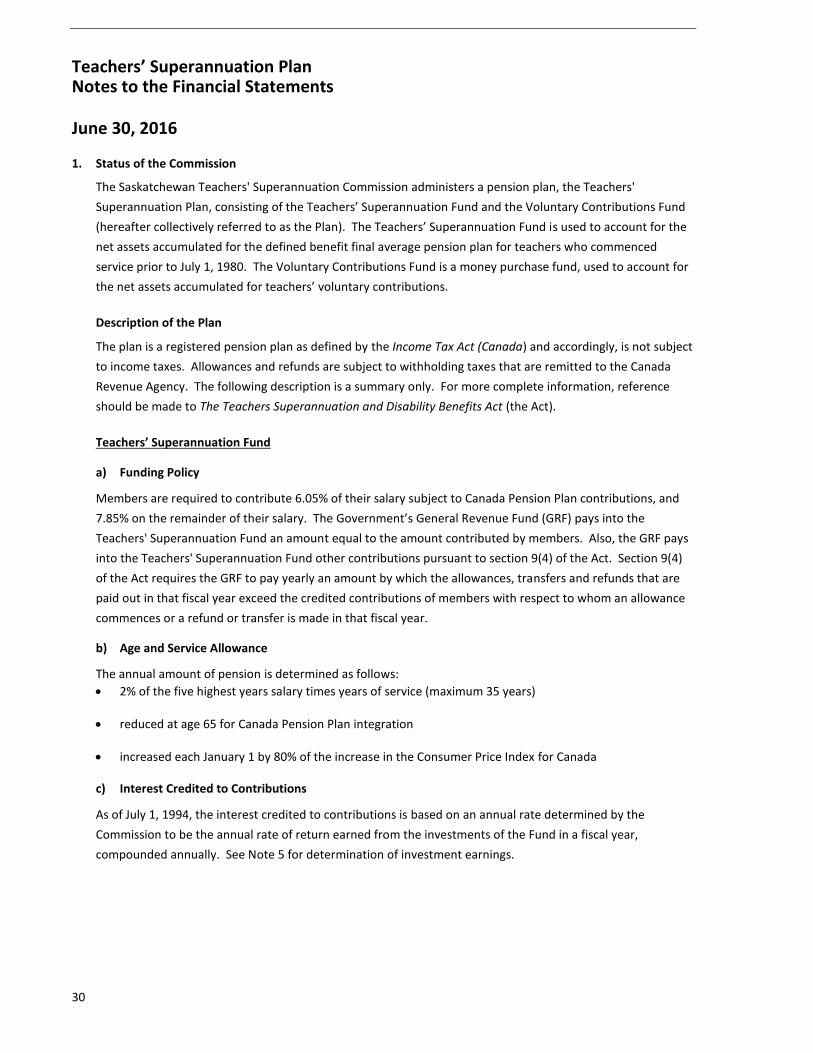
Teachers’ Superannuation Plan Notes to the Financial Statements
June 30, 2016
1. Status of the Commission
The Saskatchewan Teachers' Superannuation Commission administers a pension plan, the Teachers'
Superannuation Plan, consisting of the Teachers’ Superannuation Fund and the Voluntary Contributions Fund
(hereafter collectively referred to as the Plan). The Teachers’ Superannuation Fund is used to account for the
net assets accumulated for the defined benefit final average pension plan for teachers who commenced
service prior to July 1, 1980. The Voluntary Contributions Fund is a money purchase fund, used to account for
the net assets accumulated for teachers’ voluntary contributions.
Description of the Plan
The plan is a registered pension plan as defined by the Income Tax Act (Canada) and accordingly, is not subject
to income taxes. Allowances and refunds are subject to withholding taxes that are remitted to the Canada
Revenue Agency. The following description is a summary only. For more complete information, reference
should be made to The Teachers Superannuation and Disability Benefits Act (the Act).
Teachers’ Superannuation Fund
a) Funding Policy
Members are required to contribute 6.05% of their salary subject to Canada Pension Plan contributions, and
7.85% on the remainder of their salary. The Government’s General Revenue Fund (GRF) pays into the
Teachers' Superannuation Fund an amount equal to the amount contributed by members. Also, the GRF pays
into the Teachers' Superannuation Fund other contributions pursuant to section 9(4) of the Act. Section 9(4)
of the Act requires the GRF to pay yearly an amount by which the allowances, transfers and refunds that are
paid out in that fiscal year exceed the credited contributions of members with respect to whom an allowance
commences or a refund or transfer is made in that fiscal year.
b) Age and Service Allowance
The annual amount of pension is determined as follows:
2% of the five highest years salary times years of service (maximum 35 years)
reduced at age 65 for Canada Pension Plan integration
increased each January 1 by 80% of the increase in the Consumer Price Index for Canada
c) Interest Credited to Contributions
As of July 1, 1994, the interest credited to contributions is based on an annual rate determined by the
Commission to be the annual rate of return earned from the investments of the Fund in a fiscal year,
compounded annually. See Note 5 for determination of investment earnings.
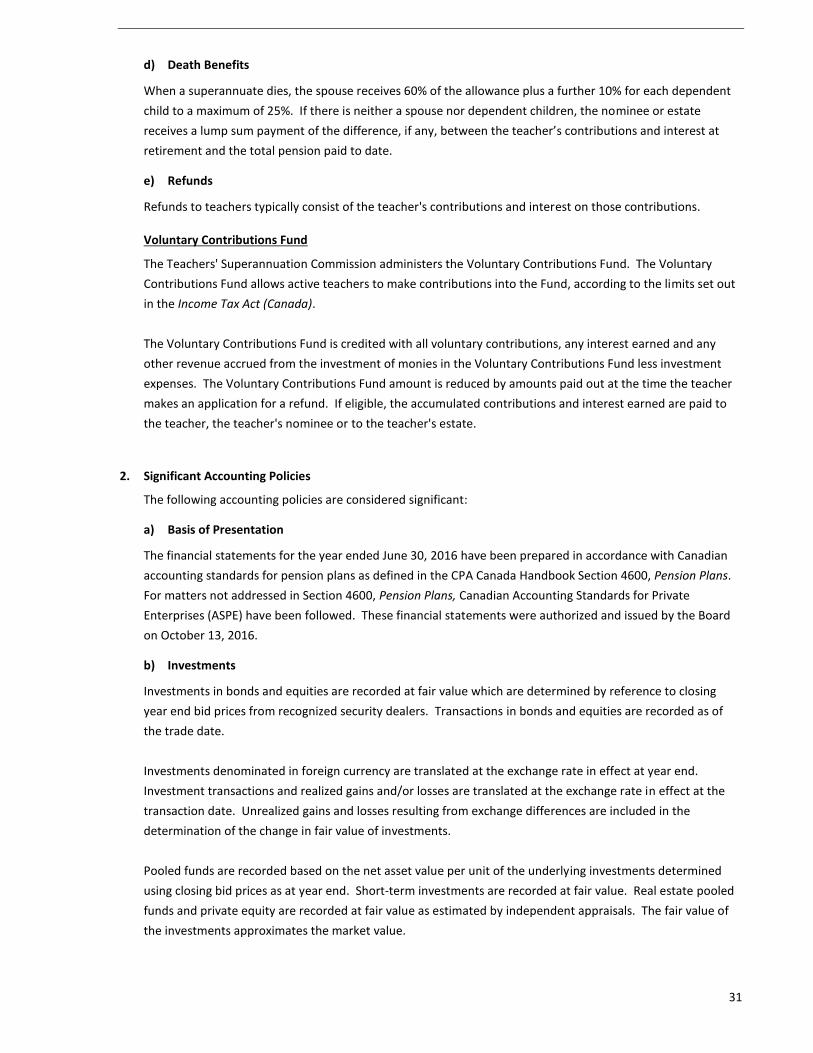
31
d) Death Benefits
When a superannuate dies, the spouse receives 60% of the allowance plus a further 10% for each dependent
child to a maximum of 25%. If there is neither a spouse nor dependent children, the nominee or estate
receives a lump sum payment of the difference, if any, between the teacher’s contributions and interest at
retirement and the total pension paid to date.
e) Refunds
Refunds to teachers typically consist of the teacher's contributions and interest on those contributions.
Voluntary Contributions Fund
The Teachers' Superannuation Commission administers the Voluntary Contributions Fund. The Voluntary
Contributions Fund allows active teachers to make contributions into the Fund, according to the limits set out
in the Income Tax Act (Canada).
The Voluntary Contributions Fund is credited with all voluntary contributions, any interest earned and any
other revenue accrued from the investment of monies in the Voluntary Contributions Fund less investment
expenses. The Voluntary Contributions Fund amount is reduced by amounts paid out at the time the teacher
makes an application for a refund. If eligible, the accumulated contributions and interest earned are paid to
the teacher, the teacher's nominee or to the teacher's estate.
2. Significant Accounting Policies
The following accounting policies are considered significant:
a) Basis of Presentation
The financial statements for the year ended June 30, 2016 have been prepared in accordance with Canadian
accounting standards for pension plans as defined in the CPA Canada Handbook Section 4600, Pension Plans.
For matters not addressed in Section 4600, Pension Plans, Canadian Accounting Standards for Private
Enterprises (ASPE) have been followed. These financial statements were authorized and issued by the Board
on October 13, 2016.
b) Investments
Investments in bonds and equities are recorded at fair value which are determined by reference to closing
year end bid prices from recognized security dealers. Transactions in bonds and equities are recorded as of
the trade date.
Investments denominated in foreign currency are translated at the exchange rate in effect at year end.
Investment transactions and realized gains and/or losses are translated at the exchange rate in effect at the
transaction date. Unrealized gains and losses resulting from exchange differences are included in the
determination of the change in fair value of investments.
Pooled funds are recorded based on the net asset value per unit of the underlying investments determined
using closing bid prices as at year end. Short-term investments are recorded at fair value. Real estate pooled
funds and private equity are recorded at fair value as estimated by independent appraisals. The fair value of
the investments approximates the market value.
32
c) Use of Estimates
The preparation of financial statements in accordance with Canadian accounting standards for pension plans
requires management to make estimates and assumptions that affect the recorded amounts of assets and
liabilities and disclosures of contingent assets and liabilities at the date of the financial statement and the
recorded amounts of revenue and expenses during the year. Significant items subject to such estimates and
assumptions include the valuation of investments and accrued pension obligation. Actual results could differ
from these estimates.
d) Future Accounting Pronouncements
Certain new standards, amendments to standards and interpretations are not yet effective for the year ended
June 30, 2016 and have not been applied in preparing these financial statements. In particular, IFRS 9,
Financial Instruments, which currently has an effective date of adoption of January 1, 2018. The extent of the
impact of adoption of this standard is not known at this time.
3. Due From General Revenue Fund
The Plan’s bank accounts are included in the Consolidated Offset Bank Concentration (COBC) arrangement for
the Government of Saskatchewan. Under this arrangement, interest is calculated on the net position of all
COBC accounts and is paid by the bank into the GRF.
The Funds’ share of this interest is allocated and paid by the GRF on a quarterly basis into the Funds’ bank
accounts using the Government’s thirty-day borrowing rate. The Government’s average thirty-day borrowing
rate in 2016 was 0.57% (2015 – 0.85%).
4. Investments
Due to the long-term horizon of the Plan’s pension obligation, the Plan takes a long-term investment
perspective. The Commission’s strategy is to invest cash flows from contributions, maturing debentures and
investment returns into assets such as Canadian, foreign and private equities, pooled funds, money market
securities, bonds and real estate pooled funds.
Teachers' Superannuation Fund
The Act and the Plan’s investment policy require that all the Fund’s investments comply with the provisions of
The Pension Benefits Act, 1992, which does not allow any one holding to represent more than 10% of the cost
of the Fund’s portfolio at the time of acquisition.
During 2011-12, the Commission engaged its Investment Consultant to conduct a de-risking optimization study
of the asset mix for the Teachers’ Superannuation Fund. In March 2012, the Commission amended their
investment policy to reflect the de-risking investment strategy. The transition to this new investment strategy
was effective July 1, 2012 and the effect of this change has been reflected in the future projections used in the
actuarial valuation at June 30, 2015 and the extrapolation at June 30, 2016 in Note 8.
Short-term Investments
These investments are comprised of T-Bills, notes and commercial paper with effective interest rates of 0.49%
to 1.07% (2015 – 0.58% to 1.13%) and a weighted average term to maturity 114 days (2015 – 97 days).
Interest is receivable at maturity.
33
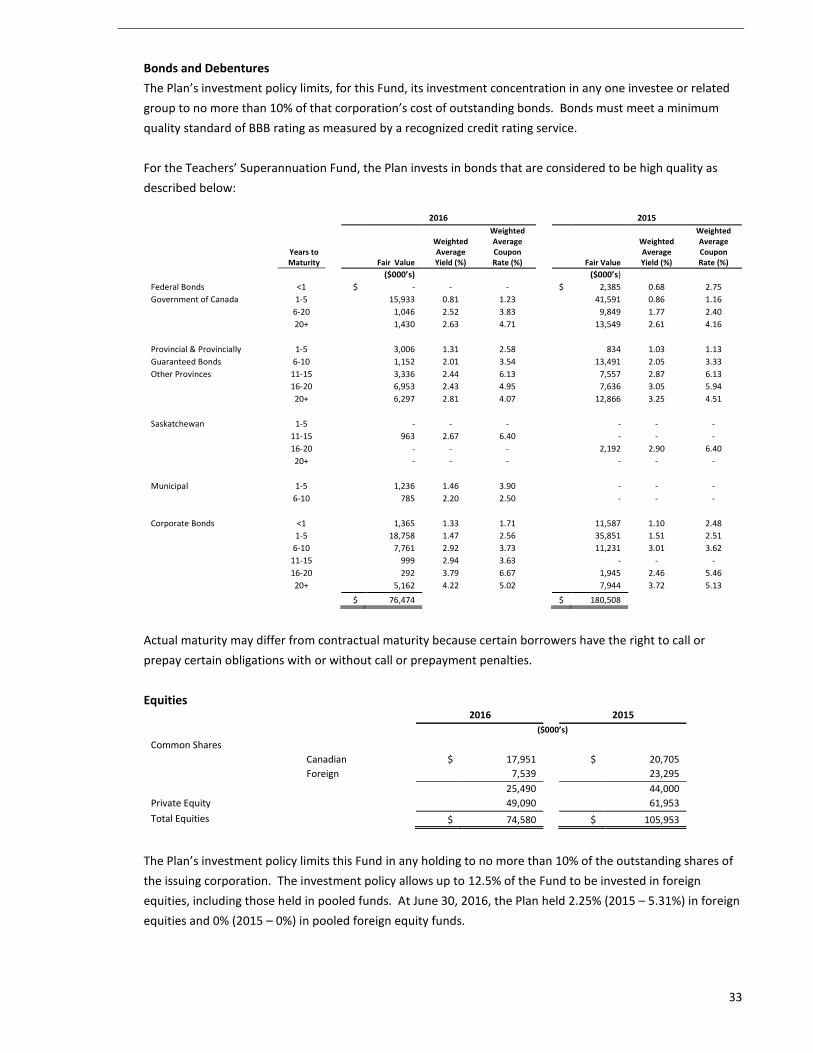
Bonds and Debentures
The Plan’s investment policy limits, for this Fund, its investment concentration in any one investee or related
group to no more than 10% of that corporation’s cost of outstanding bonds. Bonds must meet a minimum
quality standard of BBB rating as measured by a recognized credit rating service.
For the Teachers’ Superannuation Fund, the Plan invests in bonds that are considered to be high quality as
described below:
2016 2015
Years to Maturity
Fair Value
Weighted Average Yield (%)
Weighted Average Coupon Rate (%) Fair Value
Weighted Average Yield (%)
Weighted Average Coupon Rate (%)
($000’s) ($000’s)
Federal Bonds <1 $ - - - $ 2,385 0.68 2.75
Government of Canada 1-5 15,933 0.81 1.23 41,591 0.86 1.16
6-20 1,046 2.52 3.83 9,849 1.77 2.40
20+ 1,430 2.63 4.71 13,549 2.61 4.16
Provincial & Provincially 1-5 3,006 1.31 2.58 834 1.03 1.13
Guaranteed Bonds 6-10 1,152 2.01 3.54 13,491 2.05 3.33
Other Provinces 11-15 3,336 2.44 6.13 7,557 2.87 6.13
16-20 6,953 2.43 4.95 7,636 3.05 5.94
20+ 6,297 2.81 4.07 12,866 3.25 4.51
Saskatchewan 1-5 - - - - - -
11-15 963 2.67 6.40 - - -
16-20 - - - 2,192 2.90 6.40
20+ - - - - - -
Municipal 1-5 1,236 1.46 3.90 - - -
6-10 785 2.20 2.50 - - -
Corporate Bonds <1 1,365 1.33 1.71 11,587 1.10 2.48
1-5 18,758 1.47 2.56 35,851 1.51 2.51
6-10 7,761 2.92 3.73 11,231 3.01 3.62
11-15 999 2.94 3.63 - - -
16-20 292 3.79 6.67 1,945 2.46 5.46
20+ 5,162 4.22 5.02 7,944 3.72 5.13
$ 76,474 $ 180,508
Actual maturity may differ from contractual maturity because certain borrowers have the right to call or
prepay certain obligations with or without call or prepayment penalties.
Equities 2016 2015
($000’s)
Common Shares
Canadian $ 17,951 $ 20,705
Foreign 7,539 23,295
25,490 44,000
Private Equity 49,090 61,953
Total Equities $ 74,580 $ 105,953
The Plan’s investment policy limits this Fund in any holding to no more than 10% of the outstanding shares of
the issuing corporation. The investment policy allows up to 12.5% of the Fund to be invested in foreign
equities, including those held in pooled funds. At June 30, 2016, the Plan held 2.25% (2015 – 5.31%) in foreign
equities and 0% (2015 – 0%) in pooled foreign equity funds.
34
Foreign equities and pooled funds are denominated in Canadian dollars. The Fund’s equities include common
shares that have no fixed maturity date and are generally not exposed to interest rate risk. Dividends are
generally declared on a quarterly basis. The average effective dividend rate during the year was 10.9% (2015 –
9.4%).
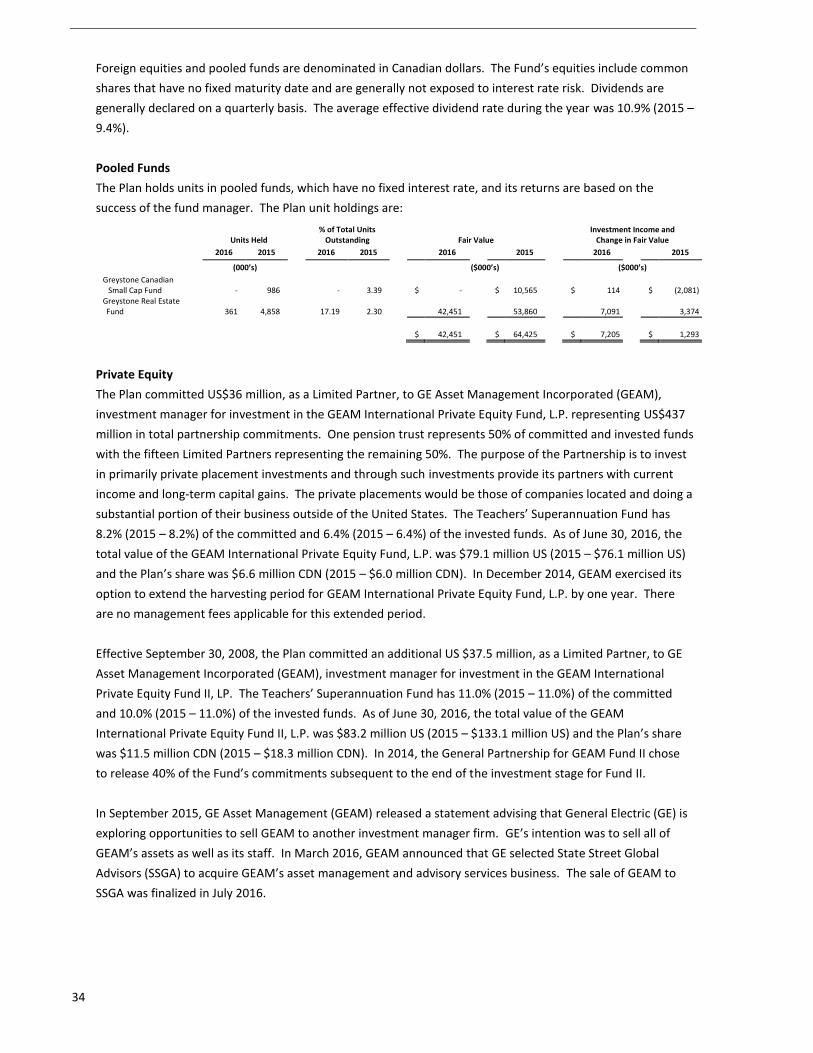
Pooled Funds
The Plan holds units in pooled funds, which have no fixed interest rate, and its returns are based on the
success of the fund manager. The Plan unit holdings are:
Units Held
% of Total Units Outstanding
Fair Value
Investment Income and Change in Fair Value
2016 2015 2016 2015 2016 2015 2016 2015
(000’s) ($000’s) ($000’s)
Greystone Canadian Small Cap Fund - 986 - 3.39 $ - $ 10,565 $ 114 $ (2,081)
Greystone Real Estate Fund 361 4,858 17.19 2.30 42,451 53,860 7,091 3,374
$ 42,451 $ 64,425 $ 7,205 $ 1,293
Private Equity
The Plan committed US$36 million, as a Limited Partner, to GE Asset Management Incorporated (GEAM),
investment manager for investment in the GEAM International Private Equity Fund, L.P. representing US$437
million in total partnership commitments. One pension trust represents 50% of committed and invested funds
with the fifteen Limited Partners representing the remaining 50%. The purpose of the Partnership is to invest
in primarily private placement investments and through such investments provide its partners with current
income and long-term capital gains. The private placements would be those of companies located and doing a
substantial portion of their business outside of the United States. The Teachers’ Superannuation Fund has
8.2% (2015 – 8.2%) of the committed and 6.4% (2015 – 6.4%) of the invested funds. As of June 30, 2016, the
total value of the GEAM International Private Equity Fund, L.P. was $79.1 million US (2015 – $76.1 million US)
and the Plan’s share was $6.6 million CDN (2015 – $6.0 million CDN). In December 2014, GEAM exercised its
option to extend the harvesting period for GEAM International Private Equity Fund, L.P. by one year. There
are no management fees applicable for this extended period.
Effective September 30, 2008, the Plan committed an additional US $37.5 million, as a Limited Partner, to GE
Asset Management Incorporated (GEAM), investment manager for investment in the GEAM International
Private Equity Fund II, LP. The Teachers’ Superannuation Fund has 11.0% (2015 – 11.0%) of the committed
and 10.0% (2015 – 11.0%) of the invested funds. As of June 30, 2016, the total value of the GEAM
International Private Equity Fund II, L.P. was $83.2 million US (2015 – $133.1 million US) and the Plan’s share
was $11.5 million CDN (2015 – $18.3 million CDN). In 2014, the General Partnership for GEAM Fund II chose
to release 40% of the Fund’s commitments subsequent to the end of the investment stage for Fund II.
In September 2015, GE Asset Management (GEAM) released a statement advising that General Electric (GE) is
exploring opportunities to sell GEAM to another investment manager firm. GE’s intention was to sell all of
GEAM’s assets as well as its staff. In March 2016, GEAM announced that GE selected State Street Global
Advisors (SSGA) to acquire GEAM’s asset management and advisory services business. The sale of GEAM to
SSGA was finalized in July 2016.
35
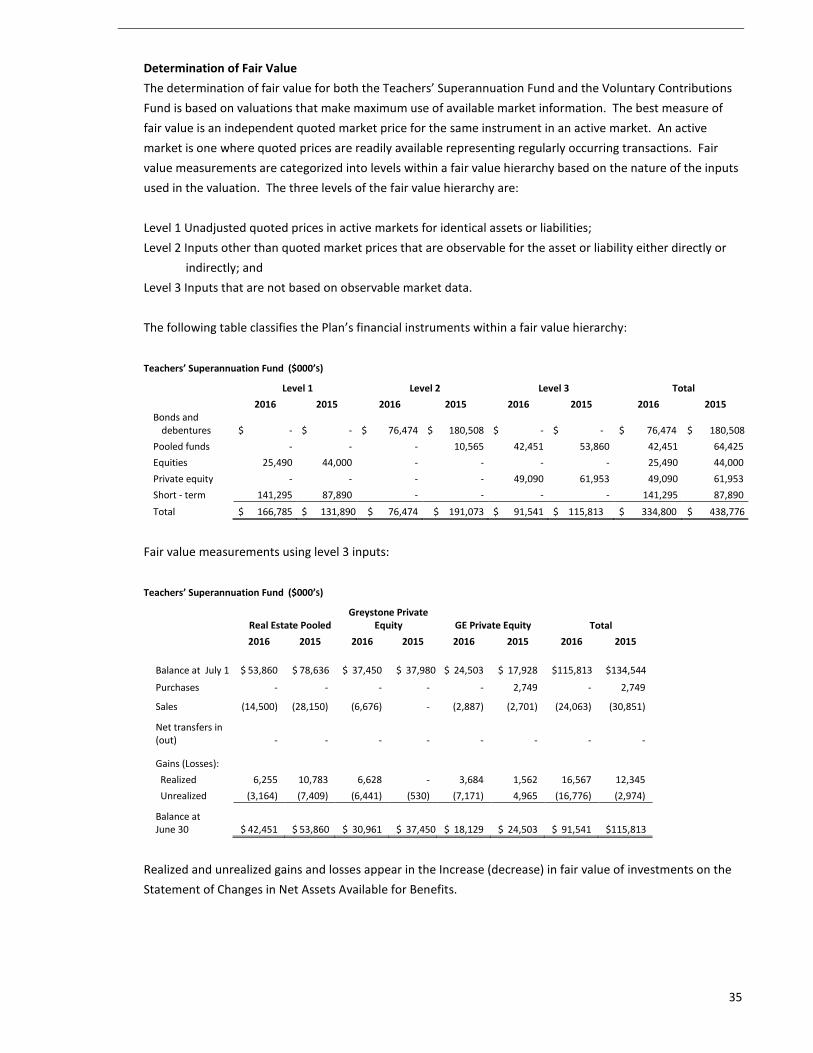
Determination of Fair Value
The determination of fair value for both the Teachers’ Superannuation Fund and the Voluntary Contributions
Fund is based on valuations that make maximum use of available market information. The best measure of
fair value is an independent quoted market price for the same instrument in an active market. An active
market is one where quoted prices are readily available representing regularly occurring transactions. Fair
value measurements are categorized into levels within a fair value hierarchy based on the nature of the inputs
used in the valuation. The three levels of the fair value hierarchy are:
Level 1 Unadjusted quoted prices in active markets for identical assets or liabilities;
Level 2 Inputs other than quoted market prices that are observable for the asset or liability either directly or
indirectly; and
Level 3 Inputs that are not based on observable market data.
The following table classifies the Plan’s financial instruments within a fair value hierarchy:
Teachers’ Superannuation Fund
($000’S)
Level 1 Level 2 Level 3 Total
2016 2015 2016 2015 2016 2015 2016 2015 Bonds and
debentures $ - $ - $ 76,474 $ 180,508 $ - $ - $ 76,474 $ 180,508
Pooled funds - - - 10,565 42,451 53,860 42,451 64,425
Equities 25,490 44,000 - - - - 25,490 44,000
Private equity - - - - 49,090 61,953 49,090 61,953
Short - term 141,295 87,890 - - - - 141,295 87,890
Total $ 166,785 $ 131,890 $ 76,474 $ 191,073 $ 91,541 $ 115,813 $ 334,800 $ 438,776
Fair value measurements using level 3 inputs:
Teachers’ Superannuation Fund
($000’S)
Real Estate Pooled Greystone Private
Equity GE Private Equity
Total
2016 2015 2016 2015 2016 2015 2016 2015
Balance at July 1 $ 53,860 $ 78,636 $ 37,450 $ 37,980 $ 24,503 $ 17,928 $115,813 $134,544
Purchases - - - - - 2,749 - 2,749
Sales (14,500) (28,150) (6,676) - (2,887) (2,701) (24,063) (30,851)
Net transfers in (out) - - - - - - - -
Gains (Losses):
Realized 6,255 10,783 6,628 - 3,684 1,562 16,567 12,345
Unrealized (3,164) (7,409) (6,441) (530) (7,171) 4,965 (16,776) (2,974)
Balance at June 30 $ 42,451 $ 53,860 $ 30,961 $ 37,450 $ 18,129 $ 24,503 $ 91,541 $115,813
Realized and unrealized gains and losses appear in the Increase (decrease) in fair value of investments on the
Statement of Changes in Net Assets Available for Benefits.
36
At June 30, 2016, the following techniques were used to determine the fair value of the investments
categorized in level 3:
i. Real Estate Pooled Funds
For the Greystone Real Estate Pooled Funds, the Pool Fund Manager uses an independent arm’s length
appraisal process for each property held within the pooled fund to establish the fair market value of the real
estate investments on a semi-annual basis for each property in the Pooled Fund.
The fund is audited by an independent accounting firm on an annual basis which includes a review of the
valuation process as well as the appropriateness of the values contained within the financial statements of the
Real Estate Pooled Fund to ensure compliance with all standards set by the CPA Canada Handbook and all
Canadian pension legislation that may apply to the Fund or its shareholders. Changes in the underlying
assumptions would have an immaterial impact on the market value of the investments.
ii. Greystone Private Equity
The Plan’s private equity investment in Greystone Capital Managed Investments (GCMI) consists of 183,811
shares (2015 - 223,811). The fair market value of the shares is derived by using an income valuation approach
whereby an adjusted operating earnings before interest, taxes, depreciation and amortization (EBITDA) is
multiplied by an income multiple and adjusted for working capital cash positions. Changes in the underlying
assumptions would have an immaterial impact on the market value of the investments.
iii. GE Private Equity
The Plan’s private equity investment in GE Private Equity Fund I and Fund II are held through limited
partnerships within the corresponding funds. The investments are valued using the net asset valuation
technique by the General Partner, using the best information available, including quoted market prices or
market prices for similar assets when available, internal cash flow estimates discounted at an appropriate
interest rate or independent appraisals as appropriate. Changes in the underlying assumptions would have an
immaterial impact on the market value of the investments.
The Voluntary Contributions Fund holds pooled funds which are classified as level 2 and are described below.
Voluntary Contributions Fund
Pooled Funds
The Plan holds for the Voluntary Contributions Fund units in pooled funds, which have no fixed interest rate,
and its returns are based on the success of the manager.
The Greystone EAFE Growth Fund may use derivative financial instruments such as equity index future
contracts for managing its equity portfolio and forward contracts for cash management. Derivative financial
instruments are financial contracts that change in value resulting from changes in underlying assets or indices.
Derivative transactions are conducted in over-the-counter markets directly between two counterparties or on
regulated exchange markets. All derivative financial instruments are recorded at fair value using market
prices. Where market prices are not readily available, other valuation techniques are used to determine fair
value.
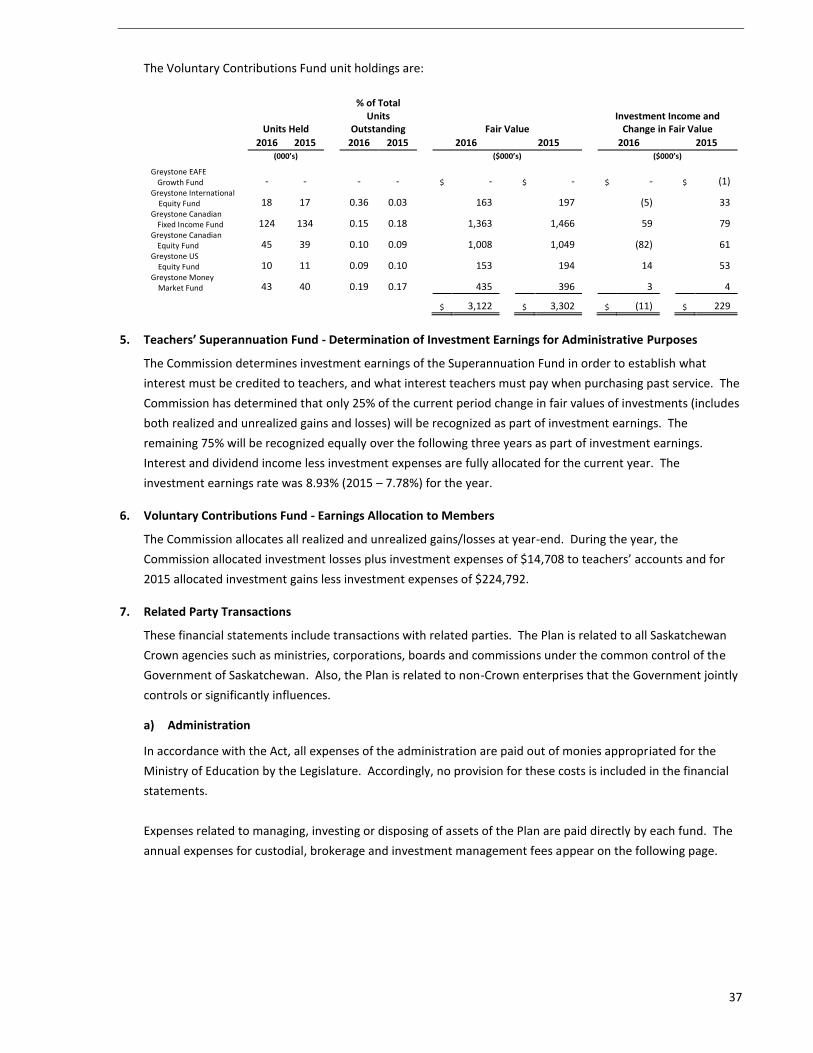
37
The Voluntary Contributions Fund unit holdings are:
Units Held
% of Total Units
Outstanding Fair Value
Investment Income and Change in Fair Value
2016 2015 2016 2015 2016 2015 2016 2015 (000’s) ($000’s) ($000’s)
Greystone EAFE Growth Fund - - - - $ - $ - $ - $ (1)
Greystone International Equity Fund 18 17 0.36 0.03 163 197 (5) 33 Greystone Canadian
Fixed Income Fund 124 134 0.15 0.18 1,363 1,466 59 79 Greystone Canadian
Equity Fund 45 39 0.10 0.09 1,008 1,049 (82) 61 Greystone US
Equity Fund 10 11 0.09 0.10 153 194 14 53 Greystone Money
Market Fund 43 40 0.19 0.17 435 396 3 4
$ 3,122 $ 3,302 $ (11) $ 229
5. Teachers’ Superannuation Fund - Determination of Investment Earnings for Administrative Purposes
The Commission determines investment earnings of the Superannuation Fund in order to establish what
interest must be credited to teachers, and what interest teachers must pay when purchasing past service. The
Commission has determined that only 25% of the current period change in fair values of investments (includes
both realized and unrealized gains and losses) will be recognized as part of investment earnings. The
remaining 75% will be recognized equally over the following three years as part of investment earnings.
Interest and dividend income less investment expenses are fully allocated for the current year. The
investment earnings rate was 8.93% (2015 – 7.78%) for the year.
6. Voluntary Contributions Fund - Earnings Allocation to Members
The Commission allocates all realized and unrealized gains/losses at year-end. During the year, the
Commission allocated investment losses plus investment expenses of $14,708 to teachers’ accounts and for
2015 allocated investment gains less investment expenses of $224,792.
7. Related Party Transactions
These financial statements include transactions with related parties. The Plan is related to all Saskatchewan
Crown agencies such as ministries, corporations, boards and commissions under the common control of the
Government of Saskatchewan. Also, the Plan is related to non-Crown enterprises that the Government jointly
controls or significantly influences.
a) Administration
In accordance with the Act, all expenses of the administration are paid out of monies appropriated for the
Ministry of Education by the Legislature. Accordingly, no provision for these costs is included in the financial
statements.
Expenses related to managing, investing or disposing of assets of the Plan are paid directly by each fund. The
annual expenses for custodial, brokerage and investment management fees appear on the following page.
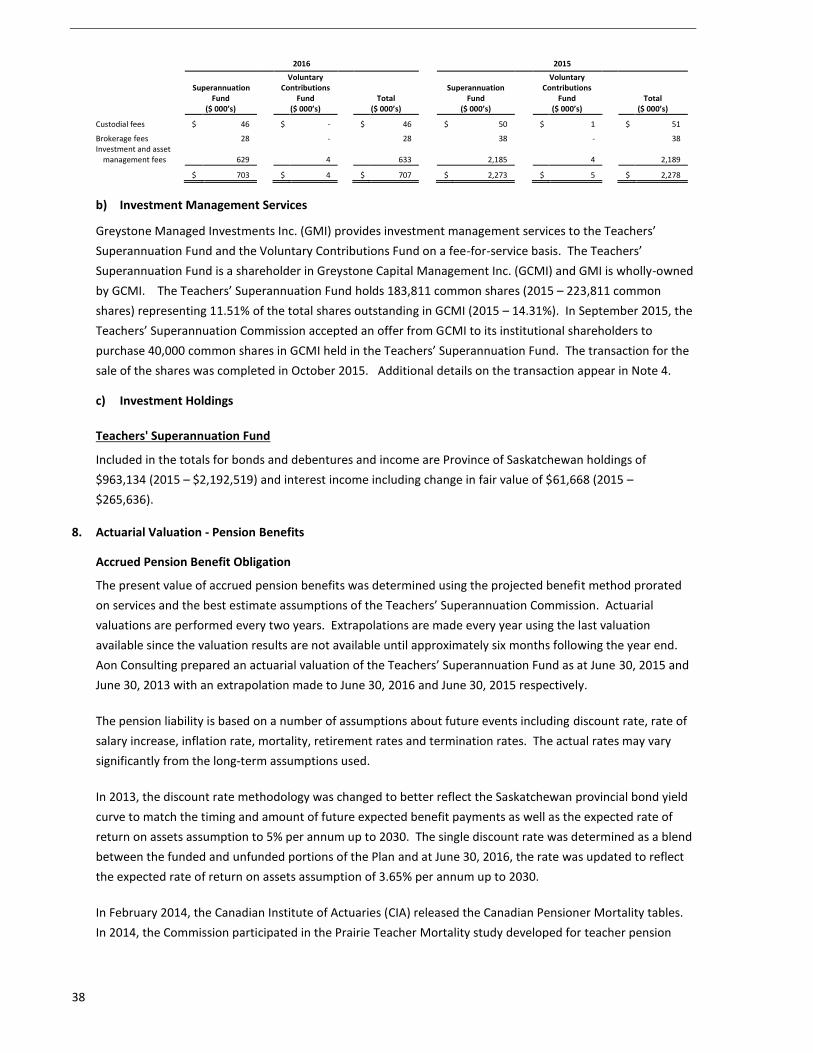
38
($ 00 2016 2015
Superannuation
Fund ($ 000’s)
Voluntary Contributions
Fund ($ 000’s)
Total ($ 000’s)
Superannuation
Fund ($ 000’s)
Voluntary Contributions
Fund ($ 000’s)
Total ($ 000’s)
Custodial fees $ 46 $ - $ 46 $ 50 $ 1 $ 51
Brokerage fees 28 - 28 38 - 38 Investment and asset
management fees
629 4 633
2,185 4 2,189
$ 703 $ 4 $ 707 $ 2,273 $ 5 $ 2,278
b) Investment Management Services
Greystone Managed Investments Inc. (GMI) provides investment management services to the Teachers’
Superannuation Fund and the Voluntary Contributions Fund on a fee-for-service basis. The Teachers’
Superannuation Fund is a shareholder in Greystone Capital Management Inc. (GCMI) and GMI is wholly-owned
by GCMI. The Teachers’ Superannuation Fund holds 183,811 common shares (2015 – 223,811 common
shares) representing 11.51% of the total shares outstanding in GCMI (2015 – 14.31%). In September 2015, the
Teachers’ Superannuation Commission accepted an offer from GCMI to its institutional shareholders to
purchase 40,000 common shares in GCMI held in the Teachers’ Superannuation Fund. The transaction for the
sale of the shares was completed in October 2015. Additional details on the transaction appear in Note 4.
c) Investment Holdings
Teachers' Superannuation Fund
Included in the totals for bonds and debentures and income are Province of Saskatchewan holdings of
$963,134 (2015 – $2,192,519) and interest income including change in fair value of $61,668 (2015 –
$265,636).
8. Actuarial Valuation - Pension Benefits
Accrued Pension Benefit Obligation
The present value of accrued pension benefits was determined using the projected benefit method prorated
on services and the best estimate assumptions of the Teachers’ Superannuation Commission. Actuarial
valuations are performed every two years. Extrapolations are made every year using the last valuation
available since the valuation results are not available until approximately six months following the year end.
Aon Consulting prepared an actuarial valuation of the Teachers’ Superannuation Fund as at June 30, 2015 and
June 30, 2013 with an extrapolation made to June 30, 2016 and June 30, 2015 respectively.
The pension liability is based on a number of assumptions about future events including discount rate, rate of
salary increase, inflation rate, mortality, retirement rates and termination rates. The actual rates may vary
significantly from the long-term assumptions used.
In 2013, the discount rate methodology was changed to better reflect the Saskatchewan provincial bond yield
curve to match the timing and amount of future expected benefit payments as well as the expected rate of
return on assets assumption to 5% per annum up to 2030. The single discount rate was determined as a blend
between the funded and unfunded portions of the Plan and at June 30, 2016, the rate was updated to reflect
the expected rate of return on assets assumption of 3.65% per annum up to 2030.
In February 2014, the Canadian Institute of Actuaries (CIA) released the Canadian Pensioner Mortality tables.
In 2014, the Commission participated in the Prairie Teacher Mortality study developed for teacher pension
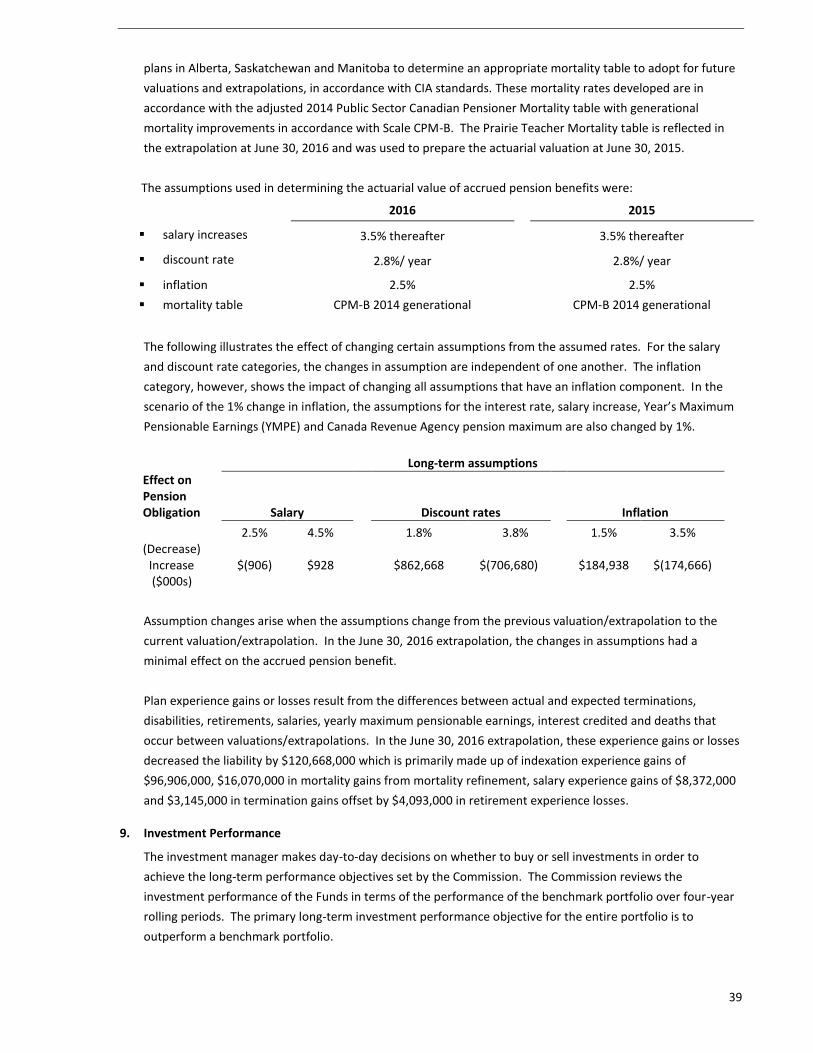
39
plans in Alberta, Saskatchewan and Manitoba to determine an appropriate mortality table to adopt for future
valuations and extrapolations, in accordance with CIA standards. These mortality rates developed are in
accordance with the adjusted 2014 Public Sector Canadian Pensioner Mortality table with generational
mortality improvements in accordance with Scale CPM-B. The Prairie Teacher Mortality table is reflected in
the extrapolation at June 30, 2016 and was used to prepare the actuarial valuation at June 30, 2015.
The assumptions used in determining the actuarial value of accrued pension benefits were:
2016 2015
salary increases 3.5% thereafter 3.5% thereafter
discount rate 2.8%/ year 2.8%/ year
inflation
mortality table
2.5%
CPM-B 2014 generational
2.5%
CPM-B 2014 generational
The following illustrates the effect of changing certain assumptions from the assumed rates. For the salary
and discount rate categories, the changes in assumption are independent of one another. The inflation
category, however, shows the impact of changing all assumptions that have an inflation component. In the
scenario of the 1% change in inflation, the assumptions for the interest rate, salary increase, Year’s Maximum
Pensionable Earnings (YMPE) and Canada Revenue Agency pension maximum are also changed by 1%.
Long-term assumptions
Effect on Pension Obligation
Salary
Discount rates
Inflation
2.5% 4.5% 1.8% 3.8% 1.5% 3.5% (Decrease) Increase ($000s)
$(906)
$928
$862,668
$(706,680)
$184,938
$(174,666)
Assumption changes arise when the assumptions change from the previous valuation/extrapolation to the
current valuation/extrapolation. In the June 30, 2016 extrapolation, the changes in assumptions had a
minimal effect on the accrued pension benefit.
Plan experience gains or losses result from the differences between actual and expected terminations,
disabilities, retirements, salaries, yearly maximum pensionable earnings, interest credited and deaths that
occur between valuations/extrapolations. In the June 30, 2016 extrapolation, these experience gains or losses
decreased the liability by $120,668,000 which is primarily made up of indexation experience gains of
$96,906,000, $16,070,000 in mortality gains from mortality refinement, salary experience gains of $8,372,000
and $3,145,000 in termination gains offset by $4,093,000 in retirement experience losses.
9. Investment Performance
The investment manager makes day-to-day decisions on whether to buy or sell investments in order to
achieve the long-term performance objectives set by the Commission. The Commission reviews the
investment performance of the Funds in terms of the performance of the benchmark portfolio over four-year
rolling periods. The primary long-term investment performance objective for the entire portfolio is to
outperform a benchmark portfolio.
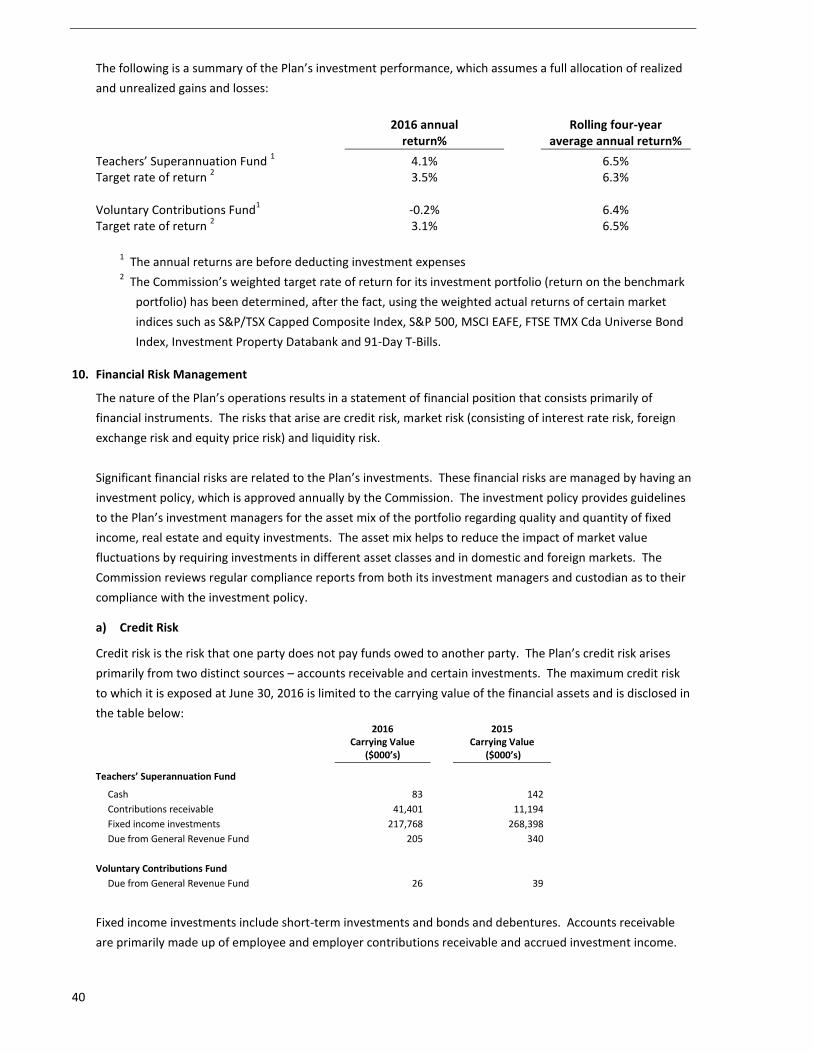
40
The following is a summary of the Plan’s investment performance, which assumes a full allocation of realized
and unrealized gains and losses:
2016 annual return%
Rolling four-year average annual return%
Teachers’ Superannuation Fund 1
4.1% 6.5% Target rate of return
2 3.5% 6.3%
Voluntary Contributions Fund
1 -0.2% 6.4%
Target rate of return 2 3.1% 6.5%
1 The annual returns are before deducting investment expenses
2 The Commission’s weighted target rate of return for its investment portfolio (return on the benchmark
portfolio) has been determined, after the fact, using the weighted actual returns of certain market
indices such as S&P/TSX Capped Composite Index, S&P 500, MSCI EAFE, FTSE TMX Cda Universe Bond
Index, Investment Property Databank and 91-Day T-Bills.
10. Financial Risk Management
The nature of the Plan’s operations results in a statement of financial position that consists primarily of
financial instruments. The risks that arise are credit risk, market risk (consisting of interest rate risk, foreign
exchange risk and equity price risk) and liquidity risk.
Significant financial risks are related to the Plan’s investments. These financial risks are managed by having an
investment policy, which is approved annually by the Commission. The investment policy provides guidelines
to the Plan’s investment managers for the asset mix of the portfolio regarding quality and quantity of fixed
income, real estate and equity investments. The asset mix helps to reduce the impact of market value
fluctuations by requiring investments in different asset classes and in domestic and foreign markets. The
Commission reviews regular compliance reports from both its investment managers and custodian as to their
compliance with the investment policy.
a) Credit Risk
Credit risk is the risk that one party does not pay funds owed to another party. The Plan’s credit risk arises
primarily from two distinct sources – accounts receivable and certain investments. The maximum credit risk
to which it is exposed at June 30, 2016 is limited to the carrying value of the financial assets and is disclosed in
the table below: 2016
Carrying Value ($000’s)
2015 Carrying Value
($000’s)
Teachers’ Superannuation Fund
Cash 83 142
Contributions receivable 41,401 11,194
Fixed income investments 217,768 268,398
Due from General Revenue Fund 205 340
Voluntary Contributions Fund
Due from General Revenue Fund 26 39
Fixed income investments include short-term investments and bonds and debentures. Accounts receivable
are primarily made up of employee and employer contributions receivable and accrued investment income.
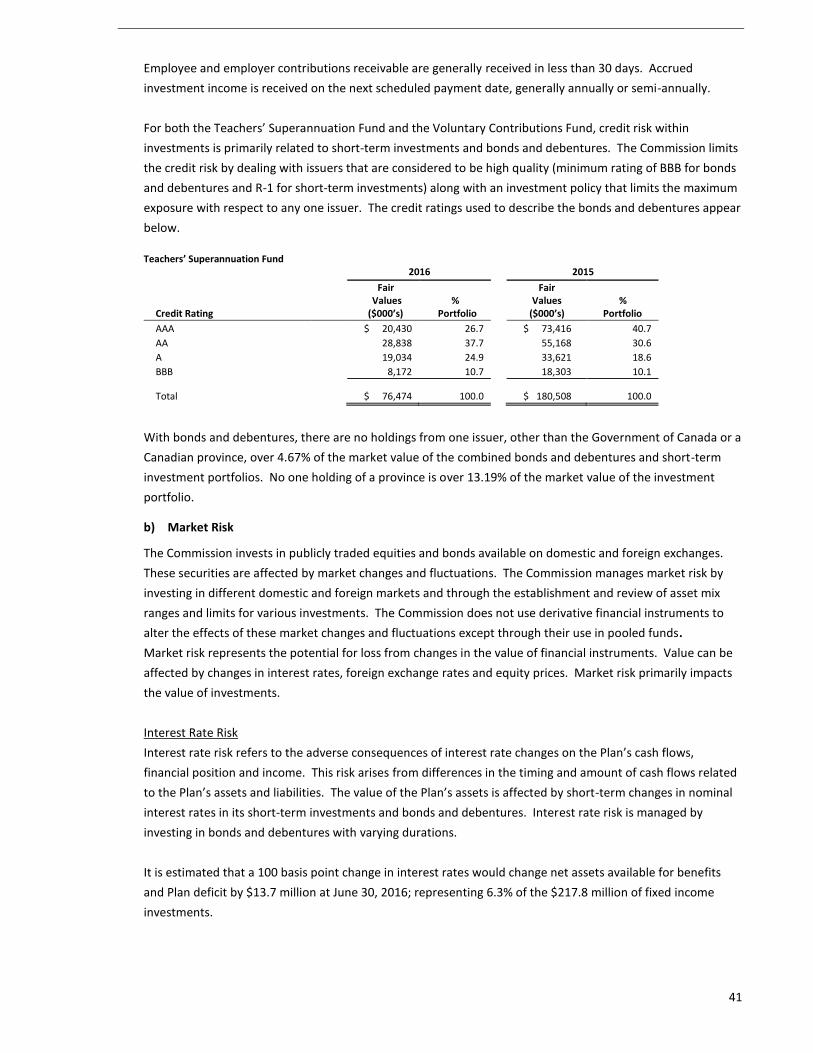
41
Employee and employer contributions receivable are generally received in less than 30 days. Accrued
investment income is received on the next scheduled payment date, generally annually or semi-annually.
For both the Teachers’ Superannuation Fund and the Voluntary Contributions Fund, credit risk within
investments is primarily related to short-term investments and bonds and debentures. The Commission limits
the credit risk by dealing with issuers that are considered to be high quality (minimum rating of BBB for bonds
and debentures and R-1 for short-term investments) along with an investment policy that limits the maximum
exposure with respect to any one issuer. The credit ratings used to describe the bonds and debentures appear
below.
Teachers’ Superannuation Fund
2016 2015
Credit Rating
Fair Values ($000’s)
% Portfolio
Fair Values
($000’s) %
Portfolio
AAA $ 20,430 26.7 $ 73,416 40.7
AA 28,838 37.7 55,168 30.6
A 19,034 24.9 33,621 18.6
BBB 8,172 10.7 18,303 10.1
Total
$ 76,474 100.0 $ 180,508 100.0
With bonds and debentures, there are no holdings from one issuer, other than the Government of Canada or a
Canadian province, over 4.67% of the market value of the combined bonds and debentures and short-term
investment portfolios. No one holding of a province is over 13.19% of the market value of the investment
portfolio.
b) Market Risk
The Commission invests in publicly traded equities and bonds available on domestic and foreign exchanges.
These securities are affected by market changes and fluctuations. The Commission manages market risk by
investing in different domestic and foreign markets and through the establishment and review of asset mix
ranges and limits for various investments. The Commission does not use derivative financial instruments to
alter the effects of these market changes and fluctuations except through their use in pooled funds.
Market risk represents the potential for loss from changes in the value of financial instruments. Value can be
affected by changes in interest rates, foreign exchange rates and equity prices. Market risk primarily impacts
the value of investments.
Interest Rate Risk
Interest rate risk refers to the adverse consequences of interest rate changes on the Plan’s cash flows,
financial position and income. This risk arises from differences in the timing and amount of cash flows related
to the Plan’s assets and liabilities. The value of the Plan’s assets is affected by short-term changes in nominal
interest rates in its short-term investments and bonds and debentures. Interest rate risk is managed by
investing in bonds and debentures with varying durations.
It is estimated that a 100 basis point change in interest rates would change net assets available for benefits
and Plan deficit by $13.7 million at June 30, 2016; representing 6.3% of the $217.8 million of fixed income
investments.
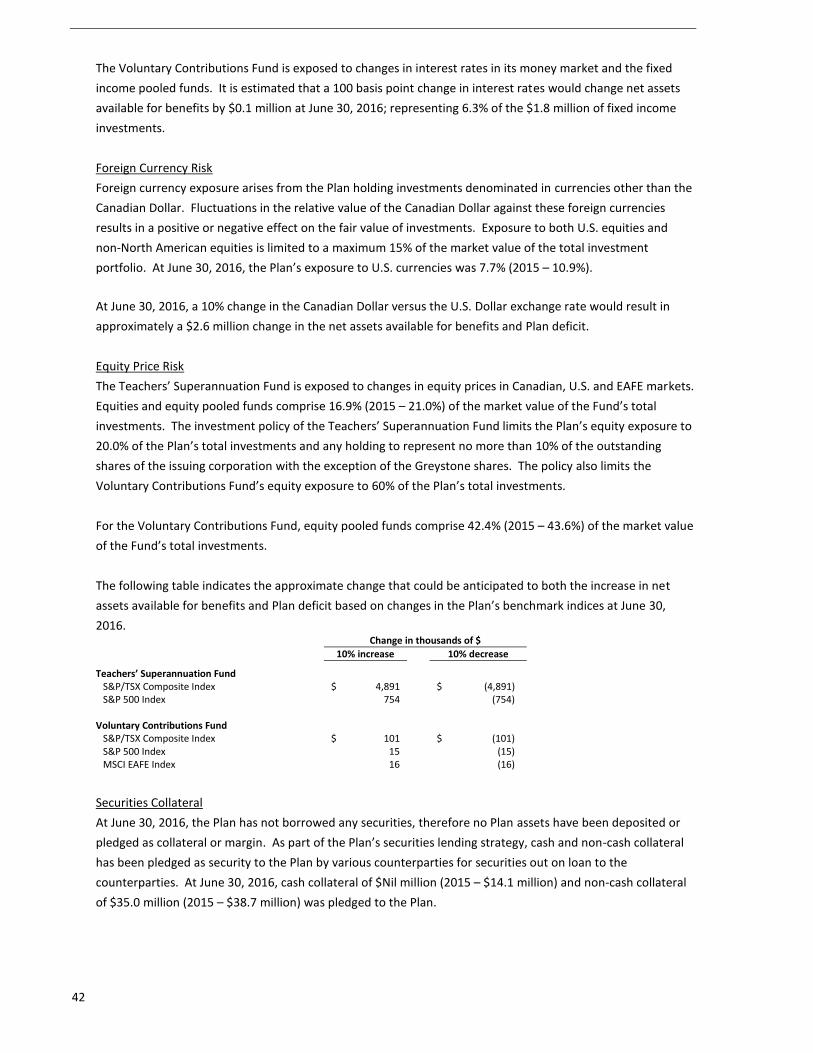
42
The Voluntary Contributions Fund is exposed to changes in interest rates in its money market and the fixed
income pooled funds. It is estimated that a 100 basis point change in interest rates would change net assets
available for benefits by $0.1 million at June 30, 2016; representing 6.3% of the $1.8 million of fixed income
investments.
Foreign Currency Risk
Foreign currency exposure arises from the Plan holding investments denominated in currencies other than the
Canadian Dollar. Fluctuations in the relative value of the Canadian Dollar against these foreign currencies
results in a positive or negative effect on the fair value of investments. Exposure to both U.S. equities and
non-North American equities is limited to a maximum 15% of the market value of the total investment
portfolio. At June 30, 2016, the Plan’s exposure to U.S. currencies was 7.7% (2015 – 10.9%).
At June 30, 2016, a 10% change in the Canadian Dollar versus the U.S. Dollar exchange rate would result in
approximately a $2.6 million change in the net assets available for benefits and Plan deficit.
Equity Price Risk
The Teachers’ Superannuation Fund is exposed to changes in equity prices in Canadian, U.S. and EAFE markets.
Equities and equity pooled funds comprise 16.9% (2015 – 21.0%) of the market value of the Fund’s total
investments. The investment policy of the Teachers’ Superannuation Fund limits the Plan’s equity exposure to
20.0% of the Plan’s total investments and any holding to represent no more than 10% of the outstanding
shares of the issuing corporation with the exception of the Greystone shares. The policy also limits the
Voluntary Contributions Fund’s equity exposure to 60% of the Plan’s total investments.
For the Voluntary Contributions Fund, equity pooled funds comprise 42.4% (2015 – 43.6%) of the market value
of the Fund’s total investments.
The following table indicates the approximate change that could be anticipated to both the increase in net
assets available for benefits and Plan deficit based on changes in the Plan’s benchmark indices at June 30,
2016. Change in thousands of $
10% increase 10% decrease
Teachers’ Superannuation Fund S&P/TSX Composite Index $ 4,891 $ (4,891) S&P 500 Index 754 (754)
Voluntary Contributions Fund
S&P/TSX Composite Index $ 101 $ (101) S&P 500 Index 15 (15) MSCI EAFE Index 16 (16)
Securities Collateral
At June 30, 2016, the Plan has not borrowed any securities, therefore no Plan assets have been deposited or
pledged as collateral or margin. As part of the Plan’s securities lending strategy, cash and non-cash collateral
has been pledged as security to the Plan by various counterparties for securities out on loan to the
counterparties. At June 30, 2016, cash collateral of $Nil million (2015 – $14.1 million) and non-cash collateral
of $35.0 million (2015 – $38.7 million) was pledged to the Plan.
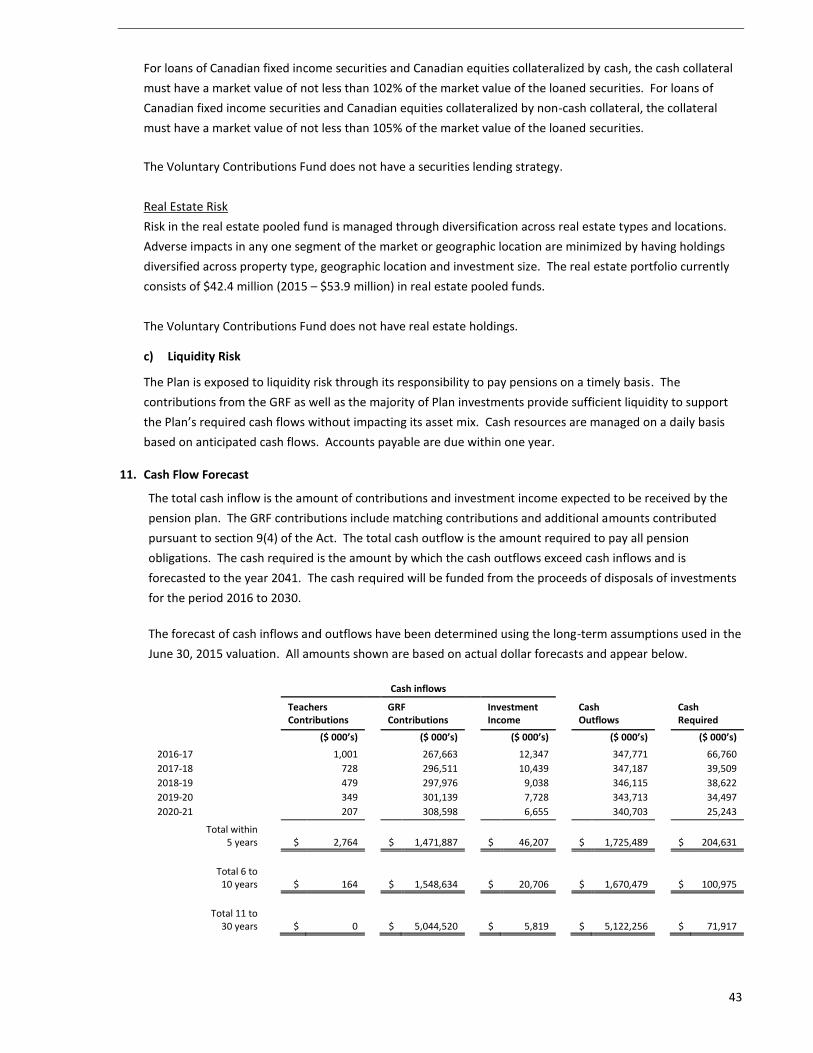
43
For loans of Canadian fixed income securities and Canadian equities collateralized by cash, the cash collateral
must have a market value of not less than 102% of the market value of the loaned securities. For loans of
Canadian fixed income securities and Canadian equities collateralized by non-cash collateral, the collateral
must have a market value of not less than 105% of the market value of the loaned securities.
The Voluntary Contributions Fund does not have a securities lending strategy.
Real Estate Risk
Risk in the real estate pooled fund is managed through diversification across real estate types and locations.
Adverse impacts in any one segment of the market or geographic location are minimized by having holdings
diversified across property type, geographic location and investment size. The real estate portfolio currently
consists of $42.4 million (2015 – $53.9 million) in real estate pooled funds.
The Voluntary Contributions Fund does not have real estate holdings.
c) Liquidity Risk
The Plan is exposed to liquidity risk through its responsibility to pay pensions on a timely basis. The
contributions from the GRF as well as the majority of Plan investments provide sufficient liquidity to support
the Plan’s required cash flows without impacting its asset mix. Cash resources are managed on a daily basis
based on anticipated cash flows. Accounts payable are due within one year.
11. Cash Flow Forecast
The total cash inflow is the amount of contributions and investment income expected to be received by the
pension plan. The GRF contributions include matching contributions and additional amounts contributed
pursuant to section 9(4) of the Act. The total cash outflow is the amount required to pay all pension
obligations. The cash required is the amount by which the cash outflows exceed cash inflows and is
forecasted to the year 2041. The cash required will be funded from the proceeds of disposals of investments
for the period 2016 to 2030.
The forecast of cash inflows and outflows have been determined using the long-term assumptions used in the
June 30, 2015 valuation. All amounts shown are based on actual dollar forecasts and appear below.
Cash inflows
Teachers Contributions
GRF Contributions
Investment Income
Cash Outflows
Cash Required
($ 000’s) ($ 000’s) ($ 000’s) ($ 000’s) ($ 000’s)
2016-17 1,001 267,663 12,347 347,771 66,760
2017-18 728 296,511 10,439 347,187 39,509
2018-19 479 297,976 9,038 346,115 38,622
2019-20 349 301,139 7,728 343,713 34,497
2020-21 207 308,598 6,655 340,703 25,243
Total within 5 years
$ 2,764 $ 1,471,887 $ 46,207 $ 1,725,489 $ 204,631
Total 6 to
10 years
$ 164 $ 1,548,634 $ 20,706 $ 1,670,479 $ 100,975
Total 11 to
30 years
$ 0 $ 5,044,520 $ 5,819 $ 5,122,256 $ 71,917
44
12. Fair Value of Financial Assets and Financial Liabilities
For the following financial instruments the fair value approximates their carrying value due to the immediate
or short-term nature of these instruments. These financial instruments are interest and non-interest bearing
and are due or payable within the next year.
Cash
Due from GRF
Accrued investment income
Teachers’ contributions receivable and GRF contributions receivable
Accounts Payable
For investments, fair values are considered to be market value, the calculation of which is described in Note 4.
The actuarial accrued pension benefits are long-term in nature and there is no market for settling these
obligations. Therefore, determination of the fair value of the actuarial accrued pension benefits is not
practicable (see Note 8).
13. Capital Management
The Plan receives new capital from employee and employer contributions. The plan also benefits from income
and market value increases on its invested capital. The Plan’s capital is invested in a number of asset classes
including equities, fixed-income and short-term investments. The Commission has delegated the operational
investment decisions to a number of different investment management firms through a number of different
investment mandates as defined in the Plan’s Statement of Investment Policy and Objective Statement
(IP&OS).
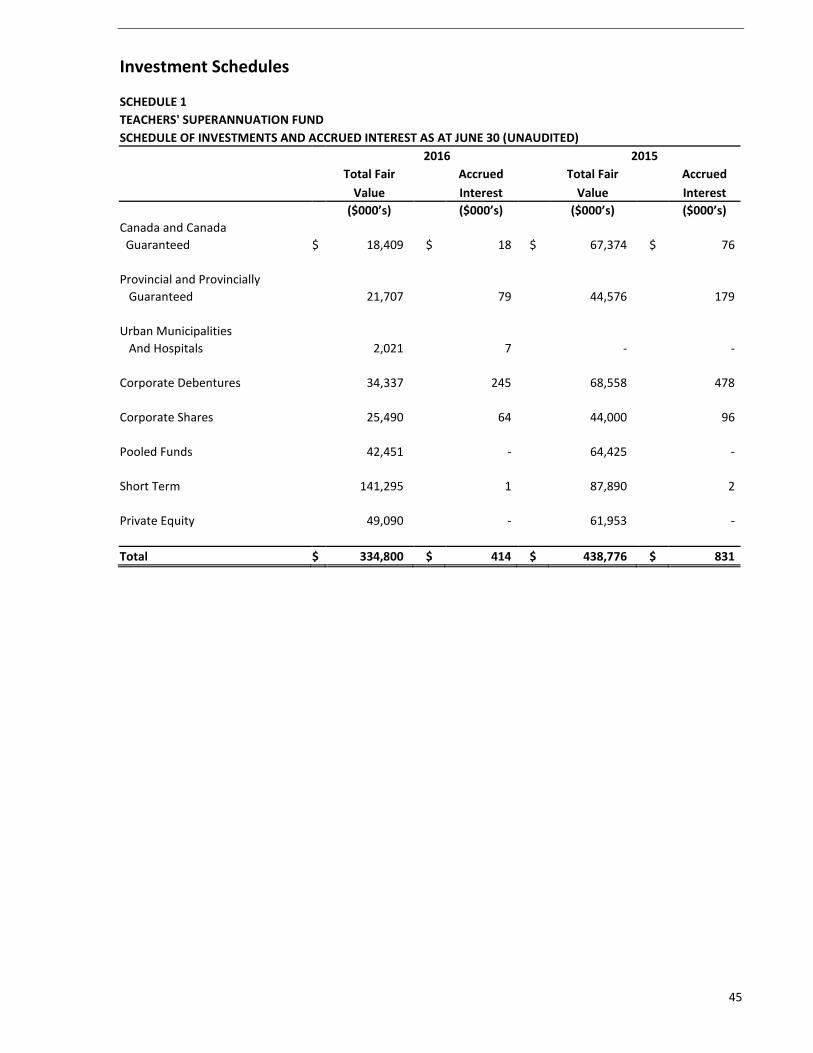
45
Investment Schedules
SCHEDULE 1
TEACHERS' SUPERANNUATION FUND
SCHEDULE OF INVESTMENTS AND ACCRUED INTEREST AS AT JUNE 30 (UNAUDITED)
2016 2015
Total Fair Accrued Total Fair Accrued
Value Interest Value Interest
($000’s) ($000’s) ($000’s) ($000’s)
Canada and Canada
Guaranteed $ 18,409 $ 18 $ 67,374 $ 76
Provincial and Provincially
Guaranteed 21,707 79 44,576 179
Urban Municipalities
And Hospitals 2,021 7 - -
Corporate Debentures 34,337 245 68,558 478
Corporate Shares 25,490 64 44,000 96
Pooled Funds 42,451 - 64,425 -
Short Term 141,295 1 87,890 2
Private Equity 49,090 - 61,953 -
Total $ 334,800 $ 414 $ 438,776 $ 831
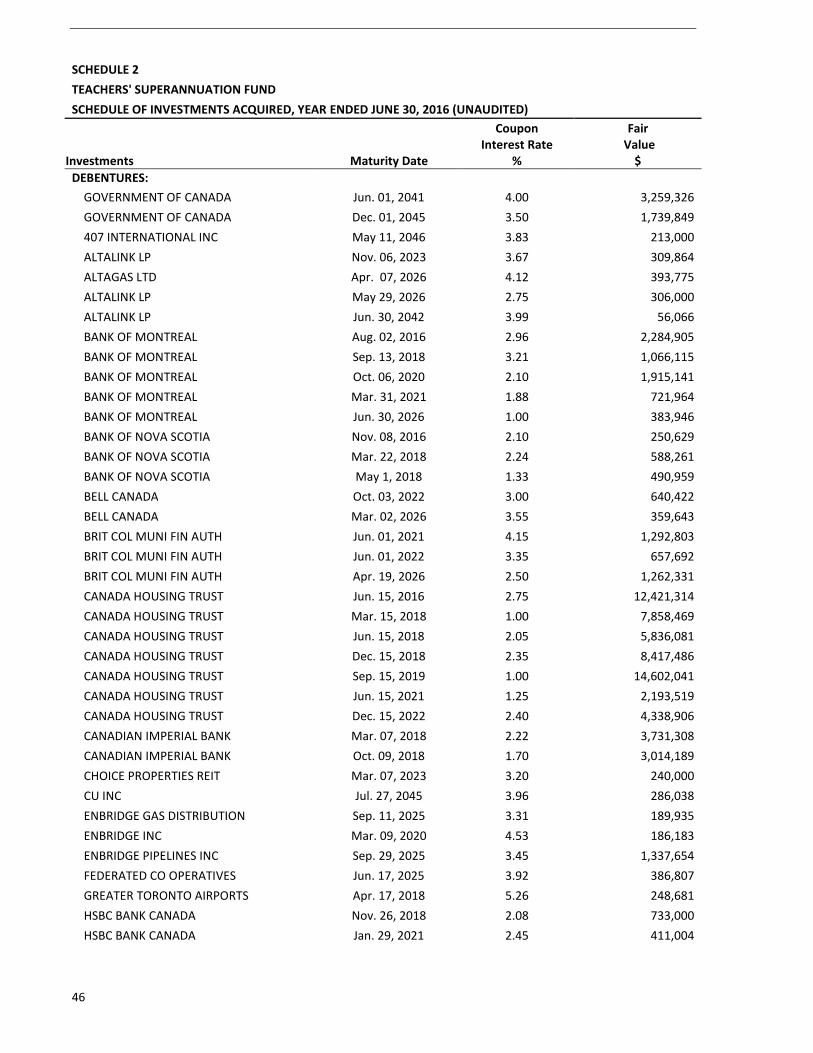
46
SCHEDULE 2
TEACHERS' SUPERANNUATION FUND
SCHEDULE OF INVESTMENTS ACQUIRED, YEAR ENDED JUNE 30, 2016 (UNAUDITED)
Investments Maturity Date
Coupon Interest Rate
%
Fair Value
$
DEBENTURES:
GOVERNMENT OF CANADA Jun. 01, 2041 4.00 3,259,326
GOVERNMENT OF CANADA Dec. 01, 2045 3.50 1,739,849
407 INTERNATIONAL INC May 11, 2046 3.83 213,000
ALTALINK LP Nov. 06, 2023 3.67 309,864
ALTAGAS LTD Apr. 07, 2026 4.12 393,775
ALTALINK LP May 29, 2026 2.75 306,000
ALTALINK LP Jun. 30, 2042 3.99 56,066
BANK OF MONTREAL Aug. 02, 2016 2.96 2,284,905
BANK OF MONTREAL Sep. 13, 2018 3.21 1,066,115
BANK OF MONTREAL Oct. 06, 2020 2.10 1,915,141
BANK OF MONTREAL Mar. 31, 2021 1.88 721,964
BANK OF MONTREAL Jun. 30, 2026 1.00 383,946
BANK OF NOVA SCOTIA Nov. 08, 2016 2.10 250,629
BANK OF NOVA SCOTIA Mar. 22, 2018 2.24 588,261
BANK OF NOVA SCOTIA May 1, 2018 1.33 490,959
BELL CANADA Oct. 03, 2022 3.00 640,422
BELL CANADA Mar. 02, 2026 3.55 359,643
BRIT COL MUNI FIN AUTH Jun. 01, 2021 4.15 1,292,803
BRIT COL MUNI FIN AUTH Jun. 01, 2022 3.35 657,692
BRIT COL MUNI FIN AUTH Apr. 19, 2026 2.50 1,262,331
CANADA HOUSING TRUST Jun. 15, 2016 2.75 12,421,314
CANADA HOUSING TRUST Mar. 15, 2018 1.00 7,858,469
CANADA HOUSING TRUST Jun. 15, 2018 2.05 5,836,081
CANADA HOUSING TRUST Dec. 15, 2018 2.35 8,417,486
CANADA HOUSING TRUST Sep. 15, 2019 1.00 14,602,041
CANADA HOUSING TRUST Jun. 15, 2021 1.25 2,193,519
CANADA HOUSING TRUST Dec. 15, 2022 2.40 4,338,906
CANADIAN IMPERIAL BANK Mar. 07, 2018 2.22 3,731,308
CANADIAN IMPERIAL BANK Oct. 09, 2018 1.70 3,014,189
CHOICE PROPERTIES REIT Mar. 07, 2023 3.20 240,000
CU INC Jul. 27, 2045 3.96 286,038
ENBRIDGE GAS DISTRIBUTION Sep. 11, 2025 3.31 189,935
ENBRIDGE INC Mar. 09, 2020 4.53 186,183
ENBRIDGE PIPELINES INC Sep. 29, 2025 3.45 1,337,654
FEDERATED CO OPERATIVES Jun. 17, 2025 3.92 386,807
GREATER TORONTO AIRPORTS Apr. 17, 2018 5.26 248,681
HSBC BANK CANADA Nov. 26, 2018 2.08 733,000
HSBC BANK CANADA Jan. 29, 2021 2.45 411,004
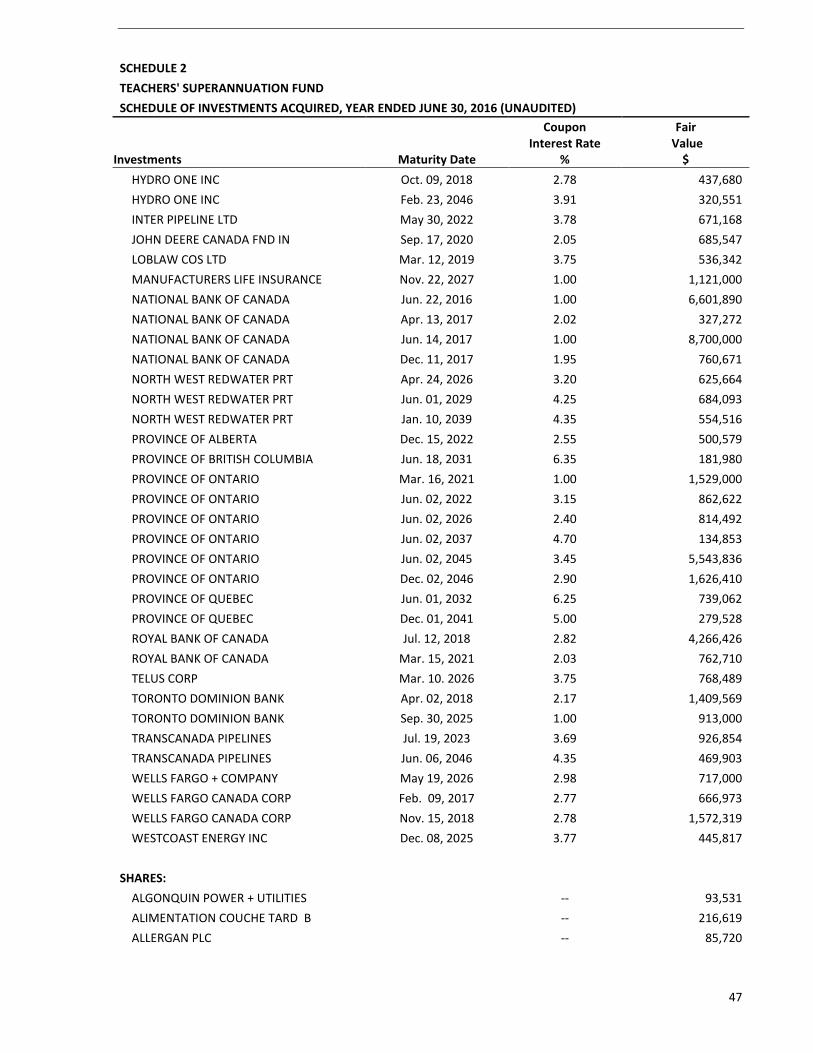
47
SCHEDULE 2
TEACHERS' SUPERANNUATION FUND
SCHEDULE OF INVESTMENTS ACQUIRED, YEAR ENDED JUNE 30, 2016 (UNAUDITED)
Investments Maturity Date
Coupon Interest Rate
%
Fair Value
$
HYDRO ONE INC Oct. 09, 2018 2.78 437,680
HYDRO ONE INC Feb. 23, 2046 3.91 320,551
INTER PIPELINE LTD May 30, 2022 3.78 671,168
JOHN DEERE CANADA FND IN Sep. 17, 2020 2.05 685,547
LOBLAW COS LTD Mar. 12, 2019 3.75 536,342
MANUFACTURERS LIFE INSURANCE Nov. 22, 2027 1.00 1,121,000
NATIONAL BANK OF CANADA Jun. 22, 2016 1.00 6,601,890
NATIONAL BANK OF CANADA Apr. 13, 2017 2.02 327,272
NATIONAL BANK OF CANADA Jun. 14, 2017 1.00 8,700,000
NATIONAL BANK OF CANADA Dec. 11, 2017 1.95 760,671
NORTH WEST REDWATER PRT Apr. 24, 2026 3.20 625,664
NORTH WEST REDWATER PRT Jun. 01, 2029 4.25 684,093
NORTH WEST REDWATER PRT Jan. 10, 2039 4.35 554,516
PROVINCE OF ALBERTA Dec. 15, 2022 2.55 500,579
PROVINCE OF BRITISH COLUMBIA Jun. 18, 2031 6.35 181,980
PROVINCE OF ONTARIO Mar. 16, 2021 1.00 1,529,000
PROVINCE OF ONTARIO Jun. 02, 2022 3.15 862,622
PROVINCE OF ONTARIO Jun. 02, 2026 2.40 814,492
PROVINCE OF ONTARIO Jun. 02, 2037 4.70 134,853
PROVINCE OF ONTARIO Jun. 02, 2045 3.45 5,543,836
PROVINCE OF ONTARIO Dec. 02, 2046 2.90 1,626,410
PROVINCE OF QUEBEC Jun. 01, 2032 6.25 739,062
PROVINCE OF QUEBEC Dec. 01, 2041 5.00 279,528
ROYAL BANK OF CANADA Jul. 12, 2018 2.82 4,266,426
ROYAL BANK OF CANADA Mar. 15, 2021 2.03 762,710
TELUS CORP Mar. 10. 2026 3.75 768,489
TORONTO DOMINION BANK Apr. 02, 2018 2.17 1,409,569
TORONTO DOMINION BANK Sep. 30, 2025 1.00 913,000
TRANSCANADA PIPELINES Jul. 19, 2023 3.69 926,854
TRANSCANADA PIPELINES Jun. 06, 2046 4.35 469,903
WELLS FARGO + COMPANY May 19, 2026 2.98 717,000
WELLS FARGO CANADA CORP Feb. 09, 2017 2.77 666,973
WELLS FARGO CANADA CORP Nov. 15, 2018 2.78 1,572,319
WESTCOAST ENERGY INC Dec. 08, 2025 3.77 445,817
SHARES:
ALGONQUIN POWER + UTILITIES -- 93,531
ALIMENTATION COUCHE TARD B -- 216,619
ALLERGAN PLC -- 85,720
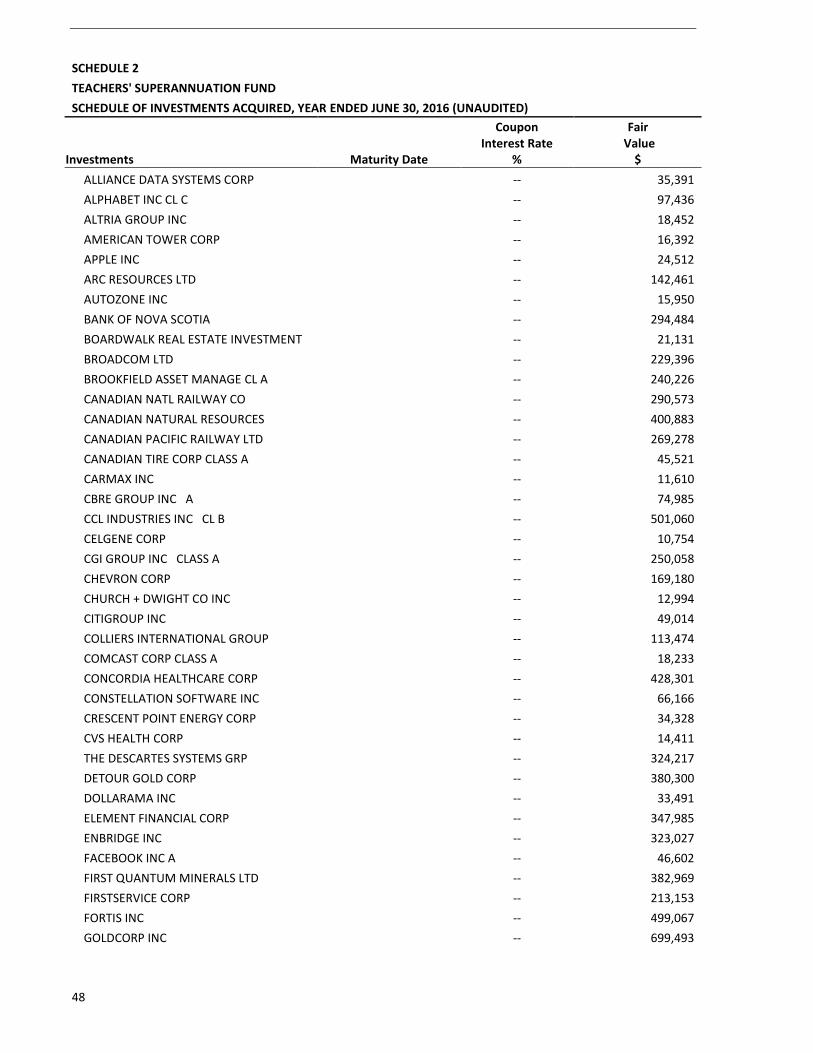
48
SCHEDULE 2
TEACHERS' SUPERANNUATION FUND
SCHEDULE OF INVESTMENTS ACQUIRED, YEAR ENDED JUNE 30, 2016 (UNAUDITED)
Investments Maturity Date
Coupon Interest Rate
%
Fair Value
$
ALLIANCE DATA SYSTEMS CORP -- 35,391
ALPHABET INC CL C -- 97,436
ALTRIA GROUP INC -- 18,452
AMERICAN TOWER CORP -- 16,392
APPLE INC -- 24,512
ARC RESOURCES LTD -- 142,461
AUTOZONE INC -- 15,950
BANK OF NOVA SCOTIA -- 294,484
BOARDWALK REAL ESTATE INVESTMENT -- 21,131
BROADCOM LTD -- 229,396
BROOKFIELD ASSET MANAGE CL A -- 240,226
CANADIAN NATL RAILWAY CO -- 290,573
CANADIAN NATURAL RESOURCES -- 400,883
CANADIAN PACIFIC RAILWAY LTD -- 269,278
CANADIAN TIRE CORP CLASS A -- 45,521
CARMAX INC -- 11,610
CBRE GROUP INC A -- 74,985
CCL INDUSTRIES INC CL B -- 501,060
CELGENE CORP -- 10,754
CGI GROUP INC CLASS A -- 250,058
CHEVRON CORP -- 169,180
CHURCH + DWIGHT CO INC -- 12,994
CITIGROUP INC -- 49,014
COLLIERS INTERNATIONAL GROUP -- 113,474
COMCAST CORP CLASS A -- 18,233
CONCORDIA HEALTHCARE CORP -- 428,301
CONSTELLATION SOFTWARE INC -- 66,166
CRESCENT POINT ENERGY CORP -- 34,328
CVS HEALTH CORP -- 14,411
THE DESCARTES SYSTEMS GRP -- 324,217
DETOUR GOLD CORP -- 380,300
DOLLARAMA INC -- 33,491
ELEMENT FINANCIAL CORP -- 347,985
ENBRIDGE INC -- 323,027
FACEBOOK INC A -- 46,602
FIRST QUANTUM MINERALS LTD -- 382,969
FIRSTSERVICE CORP -- 213,153
FORTIS INC -- 499,067
GOLDCORP INC -- 699,493
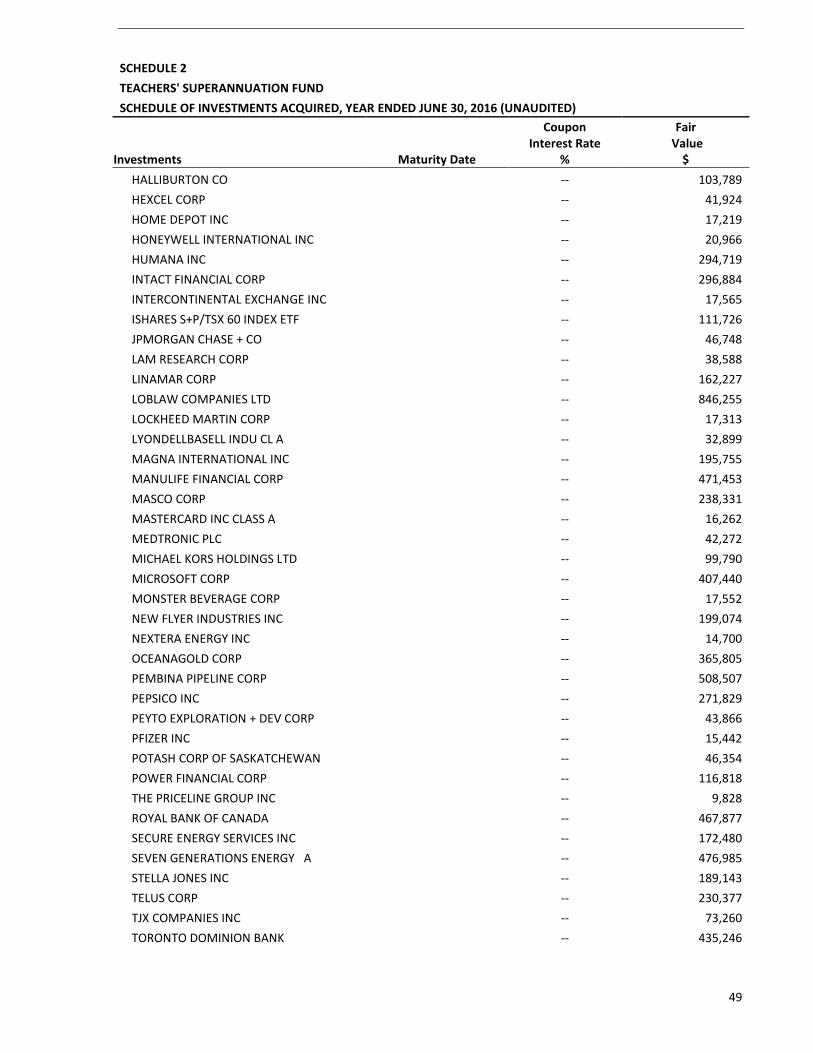
49
SCHEDULE 2
TEACHERS' SUPERANNUATION FUND
SCHEDULE OF INVESTMENTS ACQUIRED, YEAR ENDED JUNE 30, 2016 (UNAUDITED)
Investments Maturity Date
Coupon Interest Rate
%
Fair Value
$
HALLIBURTON CO -- 103,789
HEXCEL CORP -- 41,924
HOME DEPOT INC -- 17,219
HONEYWELL INTERNATIONAL INC -- 20,966
HUMANA INC -- 294,719
INTACT FINANCIAL CORP -- 296,884
INTERCONTINENTAL EXCHANGE INC -- 17,565
ISHARES S+P/TSX 60 INDEX ETF -- 111,726
JPMORGAN CHASE + CO -- 46,748
LAM RESEARCH CORP -- 38,588
LINAMAR CORP -- 162,227
LOBLAW COMPANIES LTD -- 846,255
LOCKHEED MARTIN CORP -- 17,313
LYONDELLBASELL INDU CL A -- 32,899
MAGNA INTERNATIONAL INC -- 195,755
MANULIFE FINANCIAL CORP -- 471,453
MASCO CORP -- 238,331
MASTERCARD INC CLASS A -- 16,262
MEDTRONIC PLC -- 42,272
MICHAEL KORS HOLDINGS LTD -- 99,790
MICROSOFT CORP -- 407,440
MONSTER BEVERAGE CORP -- 17,552
NEW FLYER INDUSTRIES INC -- 199,074
NEXTERA ENERGY INC -- 14,700
OCEANAGOLD CORP -- 365,805
PEMBINA PIPELINE CORP -- 508,507
PEPSICO INC -- 271,829
PEYTO EXPLORATION + DEV CORP -- 43,866
PFIZER INC -- 15,442
POTASH CORP OF SASKATCHEWAN -- 46,354
POWER FINANCIAL CORP -- 116,818
THE PRICELINE GROUP INC -- 9,828
ROYAL BANK OF CANADA -- 467,877
SECURE ENERGY SERVICES INC -- 172,480
SEVEN GENERATIONS ENERGY A -- 476,985
STELLA JONES INC -- 189,143
TELUS CORP -- 230,377
TJX COMPANIES INC -- 73,260
TORONTO DOMINION BANK -- 435,246
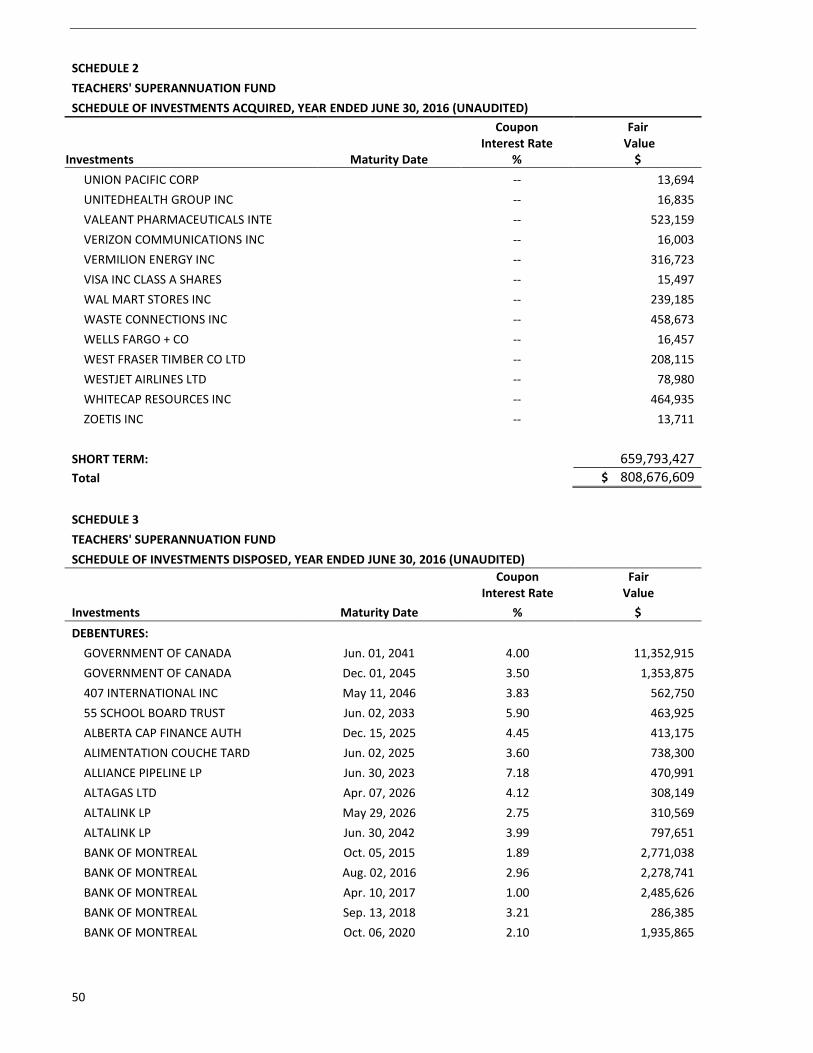
50
SCHEDULE 2
TEACHERS' SUPERANNUATION FUND
SCHEDULE OF INVESTMENTS ACQUIRED, YEAR ENDED JUNE 30, 2016 (UNAUDITED)
Investments Maturity Date
Coupon Interest Rate
%
Fair Value
$
UNION PACIFIC CORP -- 13,694
UNITEDHEALTH GROUP INC -- 16,835
VALEANT PHARMACEUTICALS INTE -- 523,159
VERIZON COMMUNICATIONS INC -- 16,003
VERMILION ENERGY INC -- 316,723
VISA INC CLASS A SHARES -- 15,497
WAL MART STORES INC -- 239,185
WASTE CONNECTIONS INC -- 458,673
WELLS FARGO + CO -- 16,457
WEST FRASER TIMBER CO LTD -- 208,115
WESTJET AIRLINES LTD -- 78,980
WHITECAP RESOURCES INC -- 464,935
ZOETIS INC -- 13,711
SHORT TERM: 659,793,427
Total $ 808,676,609
SCHEDULE 3
TEACHERS' SUPERANNUATION FUND
SCHEDULE OF INVESTMENTS DISPOSED, YEAR ENDED JUNE 30, 2016 (UNAUDITED)
Investments Maturity Date
Coupon Interest Rate
%
Fair Value
$
DEBENTURES:
GOVERNMENT OF CANADA Jun. 01, 2041 4.00 11,352,915
GOVERNMENT OF CANADA Dec. 01, 2045 3.50 1,353,875
407 INTERNATIONAL INC May 11, 2046 3.83 562,750
55 SCHOOL BOARD TRUST Jun. 02, 2033 5.90 463,925
ALBERTA CAP FINANCE AUTH Dec. 15, 2025 4.45 413,175
ALIMENTATION COUCHE TARD Jun. 02, 2025 3.60 738,300
ALLIANCE PIPELINE LP Jun. 30, 2023 7.18 470,991
ALTAGAS LTD Apr. 07, 2026 4.12 308,149
ALTALINK LP May 29, 2026 2.75 310,569
ALTALINK LP Jun. 30, 2042 3.99 797,651
BANK OF MONTREAL Oct. 05, 2015 1.89 2,771,038
BANK OF MONTREAL Aug. 02, 2016 2.96 2,278,741
BANK OF MONTREAL Apr. 10, 2017 1.00 2,485,626
BANK OF MONTREAL Sep. 13, 2018 3.21 286,385
BANK OF MONTREAL Oct. 06, 2020 2.10 1,935,865
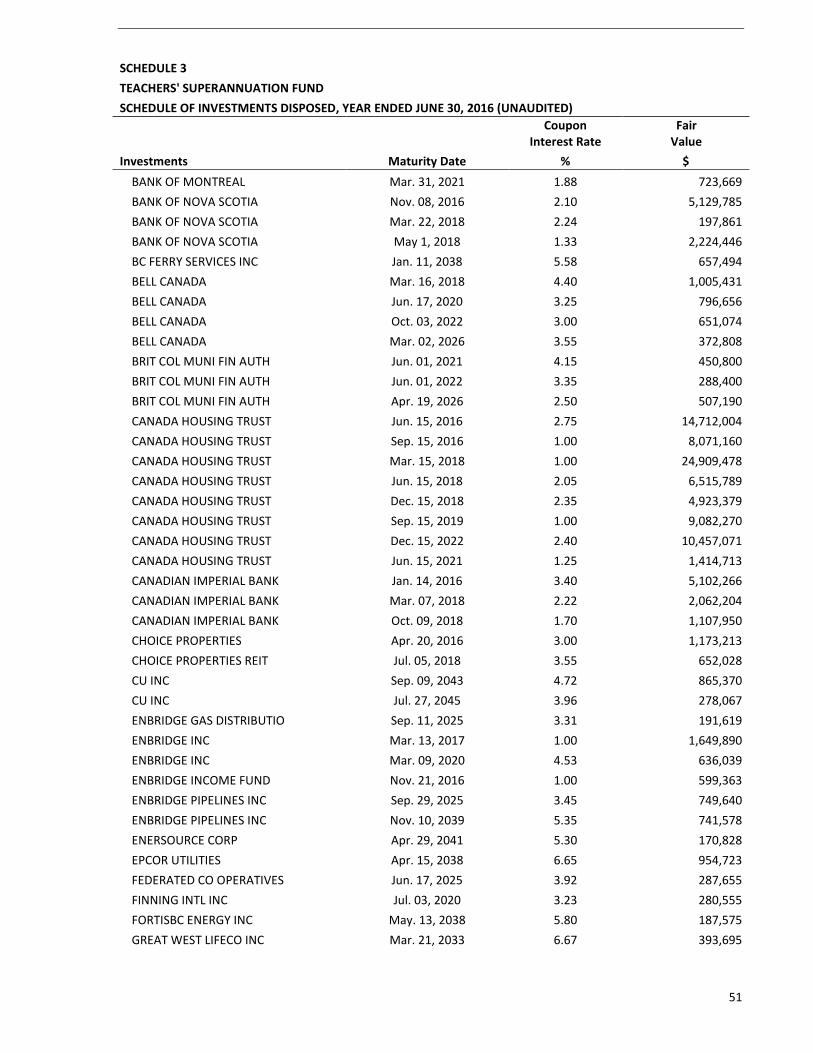
51
SCHEDULE 3
TEACHERS' SUPERANNUATION FUND
SCHEDULE OF INVESTMENTS DISPOSED, YEAR ENDED JUNE 30, 2016 (UNAUDITED)
Investments Maturity Date
Coupon Interest Rate
%
Fair Value
$
BANK OF MONTREAL Mar. 31, 2021 1.88 723,669
BANK OF NOVA SCOTIA Nov. 08, 2016 2.10 5,129,785
BANK OF NOVA SCOTIA Mar. 22, 2018 2.24 197,861
BANK OF NOVA SCOTIA May 1, 2018 1.33 2,224,446
BC FERRY SERVICES INC Jan. 11, 2038 5.58 657,494
BELL CANADA Mar. 16, 2018 4.40 1,005,431
BELL CANADA Jun. 17, 2020 3.25 796,656
BELL CANADA Oct. 03, 2022 3.00 651,074
BELL CANADA Mar. 02, 2026 3.55 372,808
BRIT COL MUNI FIN AUTH Jun. 01, 2021 4.15 450,800
BRIT COL MUNI FIN AUTH Jun. 01, 2022 3.35 288,400
BRIT COL MUNI FIN AUTH Apr. 19, 2026 2.50 507,190
CANADA HOUSING TRUST Jun. 15, 2016 2.75 14,712,004
CANADA HOUSING TRUST Sep. 15, 2016 1.00 8,071,160
CANADA HOUSING TRUST Mar. 15, 2018 1.00 24,909,478
CANADA HOUSING TRUST Jun. 15, 2018 2.05 6,515,789
CANADA HOUSING TRUST Dec. 15, 2018 2.35 4,923,379
CANADA HOUSING TRUST Sep. 15, 2019 1.00 9,082,270
CANADA HOUSING TRUST Dec. 15, 2022 2.40 10,457,071
CANADA HOUSING TRUST Jun. 15, 2021 1.25 1,414,713
CANADIAN IMPERIAL BANK Jan. 14, 2016 3.40 5,102,266
CANADIAN IMPERIAL BANK Mar. 07, 2018 2.22 2,062,204
CANADIAN IMPERIAL BANK Oct. 09, 2018 1.70 1,107,950
CHOICE PROPERTIES Apr. 20, 2016 3.00 1,173,213
CHOICE PROPERTIES REIT Jul. 05, 2018 3.55 652,028
CU INC Sep. 09, 2043 4.72 865,370
CU INC Jul. 27, 2045 3.96 278,067
ENBRIDGE GAS DISTRIBUTIO Sep. 11, 2025 3.31 191,619
ENBRIDGE INC Mar. 13, 2017 1.00 1,649,890
ENBRIDGE INC Mar. 09, 2020 4.53 636,039
ENBRIDGE INCOME FUND Nov. 21, 2016 1.00 599,363
ENBRIDGE PIPELINES INC Sep. 29, 2025 3.45 749,640
ENBRIDGE PIPELINES INC Nov. 10, 2039 5.35 741,578
ENERSOURCE CORP Apr. 29, 2041 5.30 170,828
EPCOR UTILITIES Apr. 15, 2038 6.65 954,723
FEDERATED CO OPERATIVES Jun. 17, 2025 3.92 287,655
FINNING INTL INC Jul. 03, 2020 3.23 280,555
FORTISBC ENERGY INC May. 13, 2038 5.80 187,575
GREAT WEST LIFECO INC Mar. 21, 2033 6.67 393,695
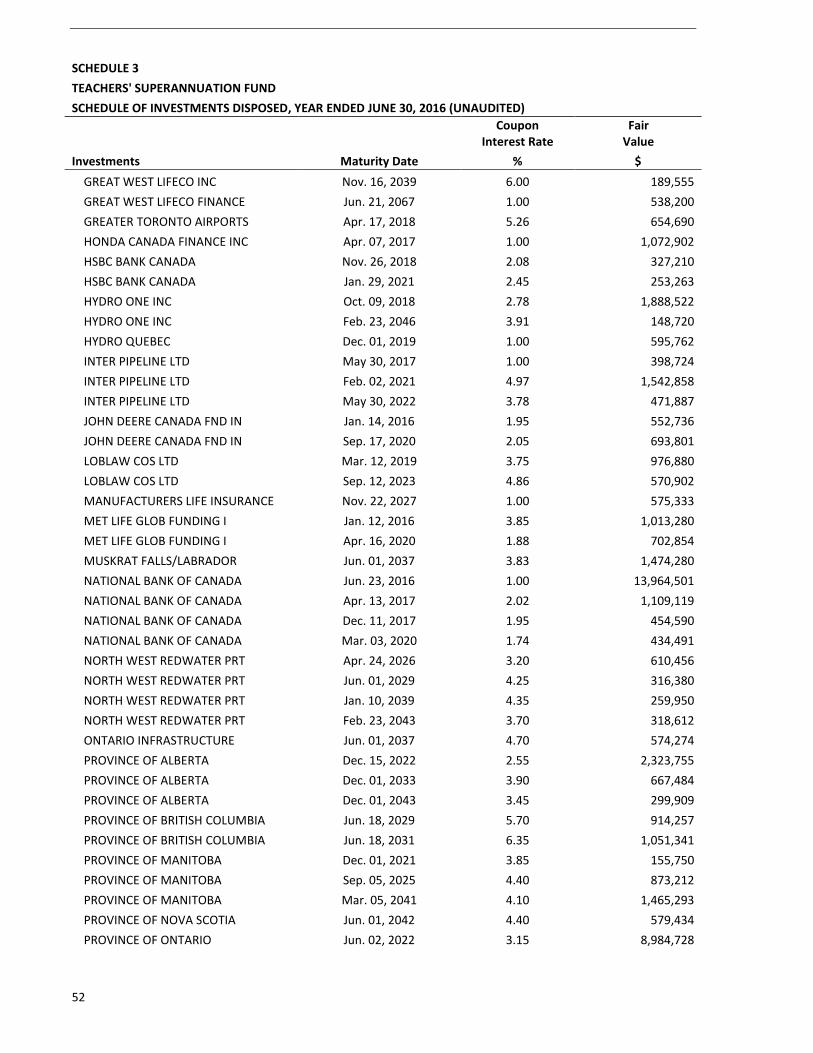
52
SCHEDULE 3
TEACHERS' SUPERANNUATION FUND
SCHEDULE OF INVESTMENTS DISPOSED, YEAR ENDED JUNE 30, 2016 (UNAUDITED)
Investments Maturity Date
Coupon Interest Rate
%
Fair Value
$
GREAT WEST LIFECO INC Nov. 16, 2039 6.00 189,555
GREAT WEST LIFECO FINANCE Jun. 21, 2067 1.00 538,200
GREATER TORONTO AIRPORTS Apr. 17, 2018 5.26 654,690
HONDA CANADA FINANCE INC Apr. 07, 2017 1.00 1,072,902
HSBC BANK CANADA Nov. 26, 2018 2.08 327,210
HSBC BANK CANADA Jan. 29, 2021 2.45 253,263
HYDRO ONE INC Oct. 09, 2018 2.78 1,888,522
HYDRO ONE INC Feb. 23, 2046 3.91 148,720
HYDRO QUEBEC Dec. 01, 2019 1.00 595,762
INTER PIPELINE LTD May 30, 2017 1.00 398,724
INTER PIPELINE LTD Feb. 02, 2021 4.97 1,542,858
INTER PIPELINE LTD May 30, 2022 3.78 471,887
JOHN DEERE CANADA FND IN Jan. 14, 2016 1.95 552,736
JOHN DEERE CANADA FND IN Sep. 17, 2020 2.05 693,801
LOBLAW COS LTD Mar. 12, 2019 3.75 976,880
LOBLAW COS LTD Sep. 12, 2023 4.86 570,902
MANUFACTURERS LIFE INSURANCE Nov. 22, 2027 1.00 575,333
MET LIFE GLOB FUNDING I Jan. 12, 2016 3.85 1,013,280
MET LIFE GLOB FUNDING I Apr. 16, 2020 1.88 702,854
MUSKRAT FALLS/LABRADOR Jun. 01, 2037 3.83 1,474,280
NATIONAL BANK OF CANADA Jun. 23, 2016 1.00 13,964,501
NATIONAL BANK OF CANADA Apr. 13, 2017 2.02 1,109,119
NATIONAL BANK OF CANADA Dec. 11, 2017 1.95 454,590
NATIONAL BANK OF CANADA Mar. 03, 2020 1.74 434,491
NORTH WEST REDWATER PRT Apr. 24, 2026 3.20 610,456
NORTH WEST REDWATER PRT Jun. 01, 2029 4.25 316,380
NORTH WEST REDWATER PRT Jan. 10, 2039 4.35 259,950
NORTH WEST REDWATER PRT Feb. 23, 2043 3.70 318,612
ONTARIO INFRASTRUCTURE Jun. 01, 2037 4.70 574,274
PROVINCE OF ALBERTA Dec. 15, 2022 2.55 2,323,755
PROVINCE OF ALBERTA Dec. 01, 2033 3.90 667,484
PROVINCE OF ALBERTA Dec. 01, 2043 3.45 299,909
PROVINCE OF BRITISH COLUMBIA Jun. 18, 2029 5.70 914,257
PROVINCE OF BRITISH COLUMBIA Jun. 18, 2031 6.35 1,051,341
PROVINCE OF MANITOBA Dec. 01, 2021 3.85 155,750
PROVINCE OF MANITOBA Sep. 05, 2025 4.40 873,212
PROVINCE OF MANITOBA Mar. 05, 2041 4.10 1,465,293
PROVINCE OF NOVA SCOTIA Jun. 01, 2042 4.40 579,434
PROVINCE OF ONTARIO Jun. 02, 2022 3.15 8,984,728
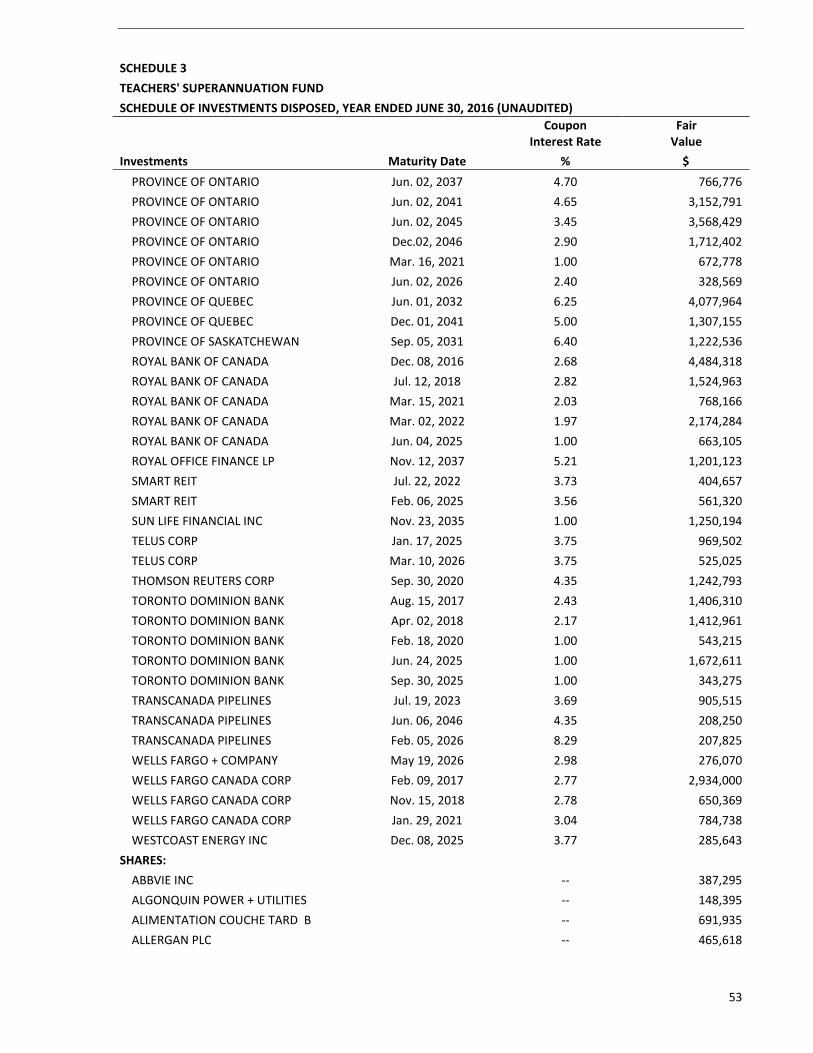
53
SCHEDULE 3
TEACHERS' SUPERANNUATION FUND
SCHEDULE OF INVESTMENTS DISPOSED, YEAR ENDED JUNE 30, 2016 (UNAUDITED)
Investments Maturity Date
Coupon Interest Rate
%
Fair Value
$
PROVINCE OF ONTARIO Jun. 02, 2037 4.70 766,776
PROVINCE OF ONTARIO Jun. 02, 2041 4.65 3,152,791
PROVINCE OF ONTARIO Jun. 02, 2045 3.45 3,568,429
PROVINCE OF ONTARIO Dec.02, 2046 2.90 1,712,402
PROVINCE OF ONTARIO Mar. 16, 2021 1.00 672,778
PROVINCE OF ONTARIO Jun. 02, 2026 2.40 328,569
PROVINCE OF QUEBEC Jun. 01, 2032 6.25 4,077,964
PROVINCE OF QUEBEC Dec. 01, 2041 5.00 1,307,155
PROVINCE OF SASKATCHEWAN Sep. 05, 2031 6.40 1,222,536
ROYAL BANK OF CANADA Dec. 08, 2016 2.68 4,484,318
ROYAL BANK OF CANADA Jul. 12, 2018 2.82 1,524,963
ROYAL BANK OF CANADA Mar. 15, 2021 2.03 768,166
ROYAL BANK OF CANADA Mar. 02, 2022 1.97 2,174,284
ROYAL BANK OF CANADA Jun. 04, 2025 1.00 663,105
ROYAL OFFICE FINANCE LP Nov. 12, 2037 5.21 1,201,123
SMART REIT Jul. 22, 2022 3.73 404,657
SMART REIT Feb. 06, 2025 3.56 561,320
SUN LIFE FINANCIAL INC Nov. 23, 2035 1.00 1,250,194
TELUS CORP Jan. 17, 2025 3.75 969,502
TELUS CORP Mar. 10, 2026 3.75 525,025
THOMSON REUTERS CORP Sep. 30, 2020 4.35 1,242,793
TORONTO DOMINION BANK Aug. 15, 2017 2.43 1,406,310
TORONTO DOMINION BANK Apr. 02, 2018 2.17 1,412,961
TORONTO DOMINION BANK Feb. 18, 2020 1.00 543,215
TORONTO DOMINION BANK Jun. 24, 2025 1.00 1,672,611
TORONTO DOMINION BANK Sep. 30, 2025 1.00 343,275
TRANSCANADA PIPELINES Jul. 19, 2023 3.69 905,515
TRANSCANADA PIPELINES Jun. 06, 2046 4.35 208,250
TRANSCANADA PIPELINES Feb. 05, 2026 8.29 207,825
WELLS FARGO + COMPANY May 19, 2026 2.98 276,070
WELLS FARGO CANADA CORP Feb. 09, 2017 2.77 2,934,000
WELLS FARGO CANADA CORP Nov. 15, 2018 2.78 650,369
WELLS FARGO CANADA CORP Jan. 29, 2021 3.04 784,738
WESTCOAST ENERGY INC Dec. 08, 2025 3.77 285,643
SHARES:
ABBVIE INC -- 387,295
ALGONQUIN POWER + UTILITIES -- 148,395
ALIMENTATION COUCHE TARD B -- 691,935
ALLERGAN PLC -- 465,618
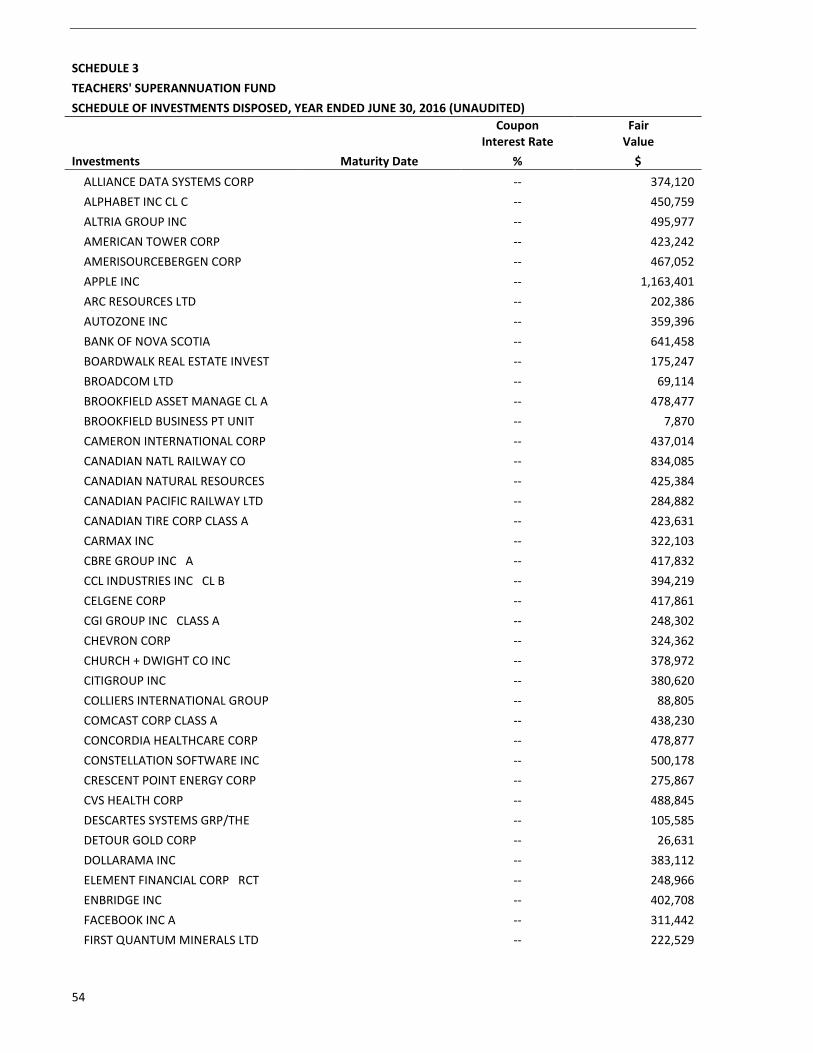
54
SCHEDULE 3
TEACHERS' SUPERANNUATION FUND
SCHEDULE OF INVESTMENTS DISPOSED, YEAR ENDED JUNE 30, 2016 (UNAUDITED)
Investments Maturity Date
Coupon Interest Rate
%
Fair Value
$
ALLIANCE DATA SYSTEMS CORP -- 374,120
ALPHABET INC CL C -- 450,759
ALTRIA GROUP INC -- 495,977
AMERICAN TOWER CORP -- 423,242
AMERISOURCEBERGEN CORP -- 467,052
APPLE INC -- 1,163,401
ARC RESOURCES LTD -- 202,386
AUTOZONE INC -- 359,396
BANK OF NOVA SCOTIA -- 641,458
BOARDWALK REAL ESTATE INVEST -- 175,247
BROADCOM LTD -- 69,114
BROOKFIELD ASSET MANAGE CL A -- 478,477
BROOKFIELD BUSINESS PT UNIT -- 7,870
CAMERON INTERNATIONAL CORP -- 437,014
CANADIAN NATL RAILWAY CO -- 834,085
CANADIAN NATURAL RESOURCES -- 425,384
CANADIAN PACIFIC RAILWAY LTD -- 284,882
CANADIAN TIRE CORP CLASS A -- 423,631
CARMAX INC -- 322,103
CBRE GROUP INC A -- 417,832
CCL INDUSTRIES INC CL B -- 394,219
CELGENE CORP -- 417,861
CGI GROUP INC CLASS A -- 248,302
CHEVRON CORP -- 324,362
CHURCH + DWIGHT CO INC -- 378,972
CITIGROUP INC -- 380,620
COLLIERS INTERNATIONAL GROUP -- 88,805
COMCAST CORP CLASS A -- 438,230
CONCORDIA HEALTHCARE CORP -- 478,877
CONSTELLATION SOFTWARE INC -- 500,178
CRESCENT POINT ENERGY CORP -- 275,867
CVS HEALTH CORP -- 488,845
DESCARTES SYSTEMS GRP/THE -- 105,585
DETOUR GOLD CORP -- 26,631
DOLLARAMA INC -- 383,112
ELEMENT FINANCIAL CORP RCT -- 248,966
ENBRIDGE INC -- 402,708
FACEBOOK INC A -- 311,442
FIRST QUANTUM MINERALS LTD -- 222,529
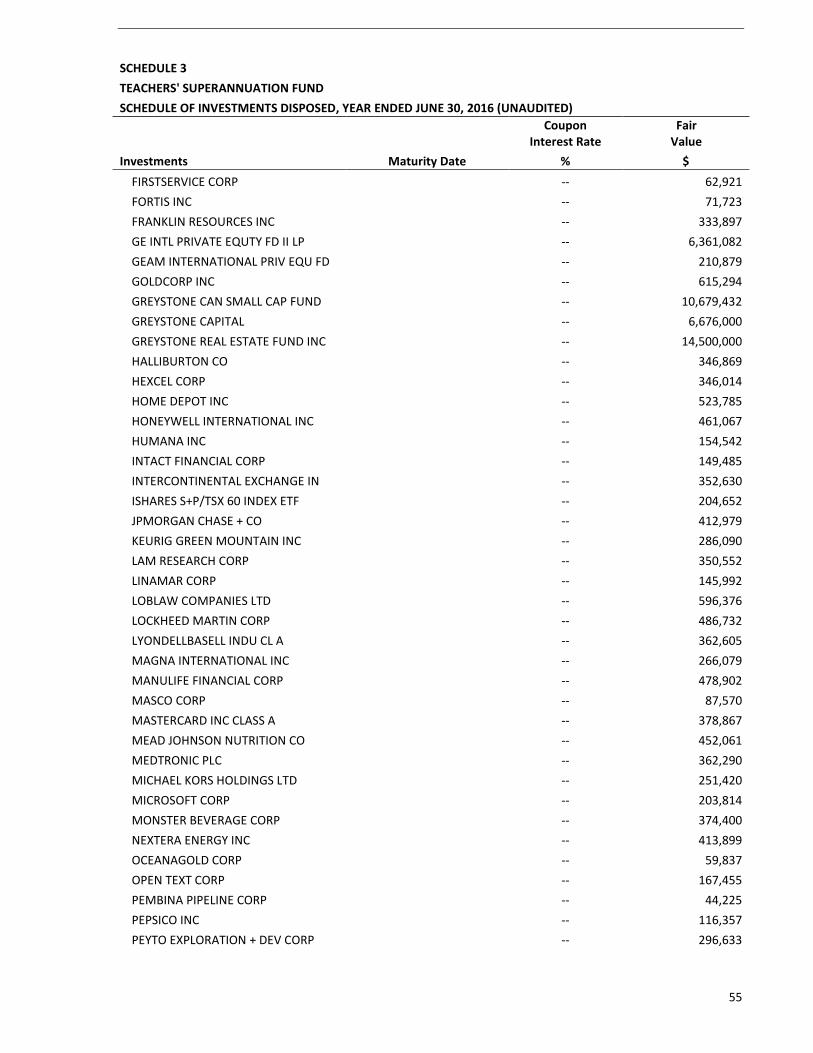
55
SCHEDULE 3
TEACHERS' SUPERANNUATION FUND
SCHEDULE OF INVESTMENTS DISPOSED, YEAR ENDED JUNE 30, 2016 (UNAUDITED)
Investments Maturity Date
Coupon Interest Rate
%
Fair Value
$
FIRSTSERVICE CORP -- 62,921
FORTIS INC -- 71,723
FRANKLIN RESOURCES INC -- 333,897
GE INTL PRIVATE EQUTY FD II LP -- 6,361,082
GEAM INTERNATIONAL PRIV EQU FD -- 210,879
GOLDCORP INC -- 615,294
GREYSTONE CAN SMALL CAP FUND -- 10,679,432
GREYSTONE CAPITAL -- 6,676,000
GREYSTONE REAL ESTATE FUND INC -- 14,500,000
HALLIBURTON CO -- 346,869
HEXCEL CORP -- 346,014
HOME DEPOT INC -- 523,785
HONEYWELL INTERNATIONAL INC -- 461,067
HUMANA INC -- 154,542
INTACT FINANCIAL CORP -- 149,485
INTERCONTINENTAL EXCHANGE IN -- 352,630
ISHARES S+P/TSX 60 INDEX ETF -- 204,652
JPMORGAN CHASE + CO -- 412,979
KEURIG GREEN MOUNTAIN INC -- 286,090
LAM RESEARCH CORP -- 350,552
LINAMAR CORP -- 145,992
LOBLAW COMPANIES LTD -- 596,376
LOCKHEED MARTIN CORP -- 486,732
LYONDELLBASELL INDU CL A -- 362,605
MAGNA INTERNATIONAL INC -- 266,079
MANULIFE FINANCIAL CORP -- 478,902
MASCO CORP -- 87,570
MASTERCARD INC CLASS A -- 378,867
MEAD JOHNSON NUTRITION CO -- 452,061
MEDTRONIC PLC -- 362,290
MICHAEL KORS HOLDINGS LTD -- 251,420
MICROSOFT CORP -- 203,814
MONSTER BEVERAGE CORP -- 374,400
NEXTERA ENERGY INC -- 413,899
OCEANAGOLD CORP -- 59,837
OPEN TEXT CORP -- 167,455
PEMBINA PIPELINE CORP -- 44,225
PEPSICO INC -- 116,357
PEYTO EXPLORATION + DEV CORP -- 296,633
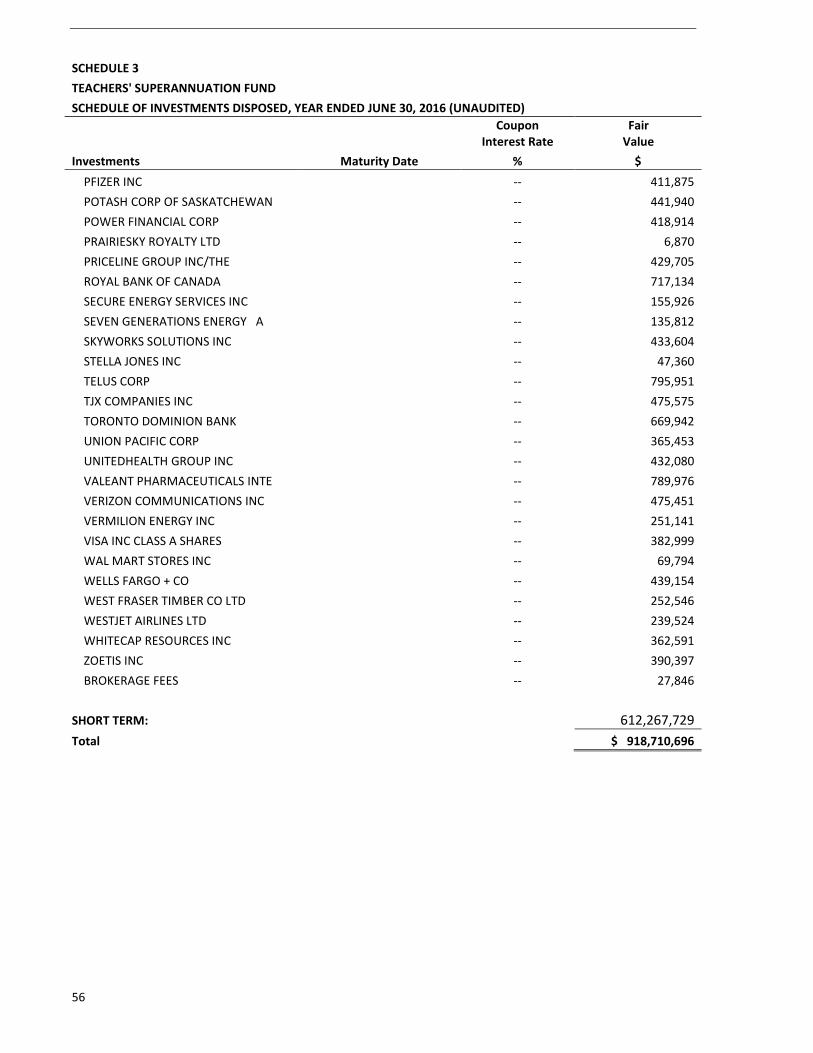
56
SCHEDULE 3
TEACHERS' SUPERANNUATION FUND
SCHEDULE OF INVESTMENTS DISPOSED, YEAR ENDED JUNE 30, 2016 (UNAUDITED)
Investments Maturity Date
Coupon Interest Rate
%
Fair Value
$
PFIZER INC -- 411,875
POTASH CORP OF SASKATCHEWAN -- 441,940
POWER FINANCIAL CORP -- 418,914
PRAIRIESKY ROYALTY LTD -- 6,870
PRICELINE GROUP INC/THE -- 429,705
ROYAL BANK OF CANADA -- 717,134
SECURE ENERGY SERVICES INC -- 155,926
SEVEN GENERATIONS ENERGY A -- 135,812
SKYWORKS SOLUTIONS INC -- 433,604
STELLA JONES INC -- 47,360
TELUS CORP -- 795,951
TJX COMPANIES INC -- 475,575
TORONTO DOMINION BANK -- 669,942
UNION PACIFIC CORP -- 365,453
UNITEDHEALTH GROUP INC -- 432,080
VALEANT PHARMACEUTICALS INTE -- 789,976
VERIZON COMMUNICATIONS INC -- 475,451
VERMILION ENERGY INC -- 251,141
VISA INC CLASS A SHARES -- 382,999
WAL MART STORES INC -- 69,794
WELLS FARGO + CO -- 439,154
WEST FRASER TIMBER CO LTD -- 252,546
WESTJET AIRLINES LTD -- 239,524
WHITECAP RESOURCES INC -- 362,591
ZOETIS INC -- 390,397
BROKERAGE FEES -- 27,846
SHORT TERM: 612,267,729
Total $ 918,710,696
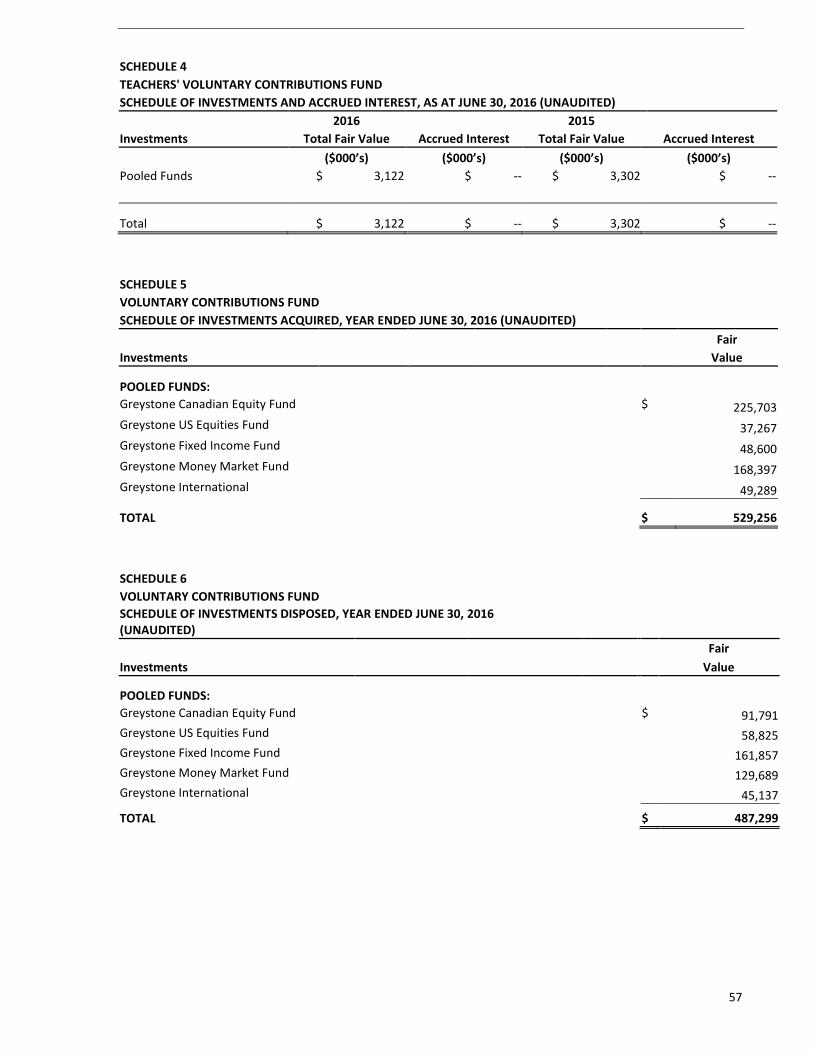
57
SCHEDULE 4
TEACHERS' VOLUNTARY CONTRIBUTIONS FUND
SCHEDULE OF INVESTMENTS AND ACCRUED INTEREST, AS AT JUNE 30, 2016 (UNAUDITED)
2016 2015
Investments Total Fair Value Accrued Interest Total Fair Value Accrued Interest
($000’s) ($000’s) ($000’s) ($000’s)
Pooled Funds $ 3,122 $ -- $ 3,302 $ --
Total $ 3,122 $ -- $ 3,302 $ --
SCHEDULE 5
VOLUNTARY CONTRIBUTIONS FUND
SCHEDULE OF INVESTMENTS ACQUIRED, YEAR ENDED JUNE 30, 2016 (UNAUDITED)
Fair
Investments Value
POOLED FUNDS:
Greystone Canadian Equity Fund $ 225,703
Greystone US Equities Fund 37,267
Greystone Fixed Income Fund 48,600
Greystone Money Market Fund 168,397
Greystone International 49,289
TOTAL $ 529,256
SCHEDULE 6
VOLUNTARY CONTRIBUTIONS FUND
SCHEDULE OF INVESTMENTS DISPOSED, YEAR ENDED JUNE 30, 2016 (UNAUDITED)
Fair
Investments Value
POOLED FUNDS:
Greystone Canadian Equity Fund $ 91,791
Greystone US Equities Fund 58,825
Greystone Fixed Income Fund 161,857
Greystone Money Market Fund 129,689
Greystone International 45,137
TOTAL $ 487,299

58
(This page intentionally left blank)