Embed Size (px)
Citation preview
Guest editorialOdd Gutteberg 3
Elements of satellite technologyand communicationOdd Gutteberg 4
Satellite communicationsstandardisation in EuropeGunnar Stette 22
A review of Norwegian space activitiesGeorg Rosenberg 26
TSAT - a low-cost satellite communicationnetworkTerje Pettersen and Petter Chr Amundsen 31
Very Small Aperture Terminal (VSAT) systems- basic principles and designLiv Oddrun Voll and Gunn Kristin Klungsøyr 39
Fleet management using INMARSAT-C andGPS - a Norwegian pilot projectArvid Bertheau Johannessen 46
Terminals for mobile satellite communicationsJens Andenæs 49
Future systems for mobile satellitecommunicationsPer Hovstad and Odd Gutteberg 54
Effects of atmosphere on earth-space radiopropagationOdd Gutteberg 63
The use of millimetre waves insatellite communicationsTord Fredriksen 71
The effect of interference for an OBP systemutilising the geostationary orbitPer Hovstad 75
Earth station antenna technologyArnfinn Nyseth and Svein A Skyttemyr 85
Contents
Developing the Norwegiantelecommunication network hasalways been a challenging effort.This is due to this country’s spe-cial topography and its scatteredpopulation. Furthermore, it hasbeen difficult to establish reliablecommunications with the mer-chant fleet, oil rigs, and animportant Norwegian outpost -the Arctic islands of Svalbard(Spitzbergen).
In the early sixties, it becameevident that communications viasatellites opened up new oppor-tunities for surmounting thesedifficulties. Norwegian Telecomunderstood the possibilities, andas the first country in Europe,Norway established in 1976 adomestic satellite communica-tion system. This system, calledNORSAT-A, utilised leasedtransponder capacity on the geo-stationary INTELSAT-IV satel-lite for communication between the Norwegian mainland andthe oil rigs in the North Sea. In 1979 Svalbard was connected tothis system. The earth station at Svalbard was the first commer-cial earth station world-wide, operating with an elevation angleless than 3 degrees.
The success with the NORSAT-A system has been followed upby a meshed network, the NORSAT-B system. This systemutilises Very Small Aperture Terminals (VSAT) for businesscommunications.
As a large shipping nation, Norway caught an early interest inusing satellites for maritime communications. In the seventiesNorwegian Telecom was one of the driving forces behind theestablishement of the International Maritime Satellite Organisa-tion (INMARSAT), and Norway is at present the third largestshareholder. The first European coastal earth station in theINMARSAT system was built in southern Norway, and put intoservice in 1982.
The Norwegian telecommunica-tions industry has been veryactive since satellite transmis-sion was introduced in Norway.Among other things they aremanufacturing the earth stationsin NORSAT-B, and coastalearth stations and mobile termi-nals for the differentINMARSAT standards. Norwe-gian industry has also developeda new data collection satellitesystem, called TSAT (Teleme-try via SATellite).
The last addition to the “familytree” is satellite broadcasting.This application is especiallyattractive for a sparsely popu-lated country like Norway. Amajor step was taken when theNorwegian Telecom bought thepowerful TV satellite “MarcoPolo 2” from Britain in 1992.The satellite was renamed“Thor” and moved to the posi-
tion 1 degree west in the geostationary orbit. The purchase ofthis satellite represents a significant change in Norwegian spaceactivity. The Norwegian Telecom has now moved from being asatellite user to a satellite owner and operator - with all the chal-lenging tasks this implies.
As the satellite technology improves, the earth terminalbecomes smaller and cheaper, as we have seen in the VSATsystems. However, the major challenge for the satellite commu-nity is now to provide a global mobile telephone system withhand-held terminals. This will necessitate studies of new con-cepts such as satellites in low-earth orbits, inter-satellite links,multibeam antennas, on-board processing and possibly use ofhigher frequency bands.
3
Guest editorial
B Y O D D G U T T E B E R G
4
Elements of satellite technology and communication
B Y O D D G U T T E B E R G
1 Introduction and
overview
More than 35 years ago, on 4 October1957, the world’s first artificial satellitewas launched by the Soviet Union. Thesatellite, which became known as Sput-nik-I, opened up a new era of practicaluse of the outer space. The satellite’sweight was 84 kg and it circled 1400times around the earth before burning upin the atmosphere after 93 days. Thelaunch of Sputnik-I was followed by theUnited States’ Explorer-I in January1958. Even though these satellites wereprimarily not intended for communica-tions, they demonstrated that this wastechnically and economically feasible.
The use of artificial satellites in earthorbits is now a well established and inte-grated part of the world’s telecommuni-cations network. The evolution of thesatellite technology together with morepowerful launchers have made the satel-lites suitable, not only for long distancecommunications, but also for nationalcommunications, television broadcastingand mobile services.
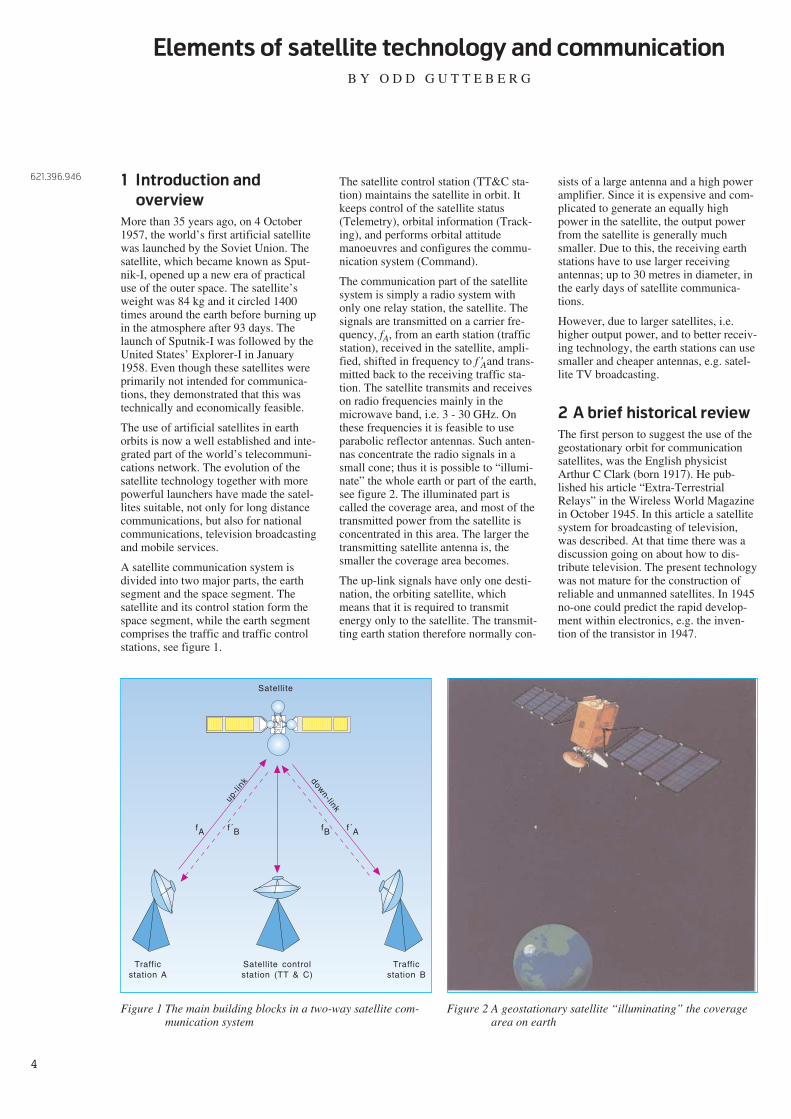
A satellite communication system isdivided into two major parts, the earthsegment and the space segment. Thesatellite and its control station form thespace segment, while the earth segmentcomprises the traffic and traffic controlstations, see figure 1.
The satellite control station (TT&C sta-tion) maintains the satellite in orbit. Itkeeps control of the satellite status(Telemetry), orbital information (Track-ing), and performs orbital attitudemanoeuvres and configures the commu-nication system (Command).
The communication part of the satellitesystem is simply a radio system withonly one relay station, the satellite. Thesignals are transmitted on a carrier fre-quency, fA, from an earth station (trafficstation), received in the satellite, ampli-fied, shifted in frequency to f 'Aand trans-mitted back to the receiving traffic sta-tion. The satellite transmits and receiveson radio frequencies mainly in themicrowave band, i.e. 3 - 30 GHz. Onthese frequencies it is feasible to useparabolic reflector antennas. Such anten-nas concentrate the radio signals in asmall cone; thus it is possible to “illumi-nate” the whole earth or part of the earth,see figure 2. The illuminated part iscalled the coverage area, and most of thetransmitted power from the satellite isconcentrated in this area. The larger thetransmitting satellite antenna is, thesmaller the coverage area becomes.
The up-link signals have only one desti-nation, the orbiting satellite, whichmeans that it is required to transmitenergy only to the satellite. The transmit-ting earth station therefore normally con-
sists of a large antenna and a high poweramplifier. Since it is expensive and com-plicated to generate an equally highpower in the satellite, the output powerfrom the satellite is generally muchsmaller. Due to this, the receiving earthstations have to use larger receivingantennas; up to 30 metres in diameter, inthe early days of satellite communica-tions.
However, due to larger satellites, i.e.higher output power, and to better receiv-ing technology, the earth stations can usesmaller and cheaper antennas, e.g. satel-lite TV broadcasting.
2 A brief historical review
The first person to suggest the use of thegeostationary orbit for communicationsatellites, was the English physicistArthur C Clark (born 1917). He pub-lished his article “Extra-TerrestrialRelays” in the Wireless World Magazinein October 1945. In this article a satellitesystem for broadcasting of television,was described. At that time there was adiscussion going on about how to dis-tribute television. The present technologywas not mature for the construction ofreliable and unmanned satellites. In 1945no-one could predict the rapid develop-ment within electronics, e.g. the inven-tion of the transistor in 1947.
Satellite
Trafficstation A
Satellite controlstation (TT & C)
Trafficstation B
up-li
nk
down-link
fA f´B fB f´A
Figure 1 The main building blocks in a two-way satellite com-munication system
Figure 2 A geostationary satellite “illuminating” the coveragearea on earth
621.396.946
5
The Space Age started with the laun-ching of the first artificial satellite,Sputnik-I, in 1957. It is worth whilenoticing that the first trans-Atlantictelephone cable was stretched thesame year. In the following years seve-ral satellites were launched, both forscientific purposes and for other speci-fic applications. Communication expe-riments with passive reflecting satel-lites, Echo-I and -II (1960), were alsocarried out.
An operational system with passivesatellites was never realised, but theproject made essential contributions tothe development of the earth stationtechnology.
The first active telecommunicationsatellites were launched in the early1960s, Courier (1960), Telstar-I and -II(1962 and 1963) and Relay-I and -II(1962 and 1964).
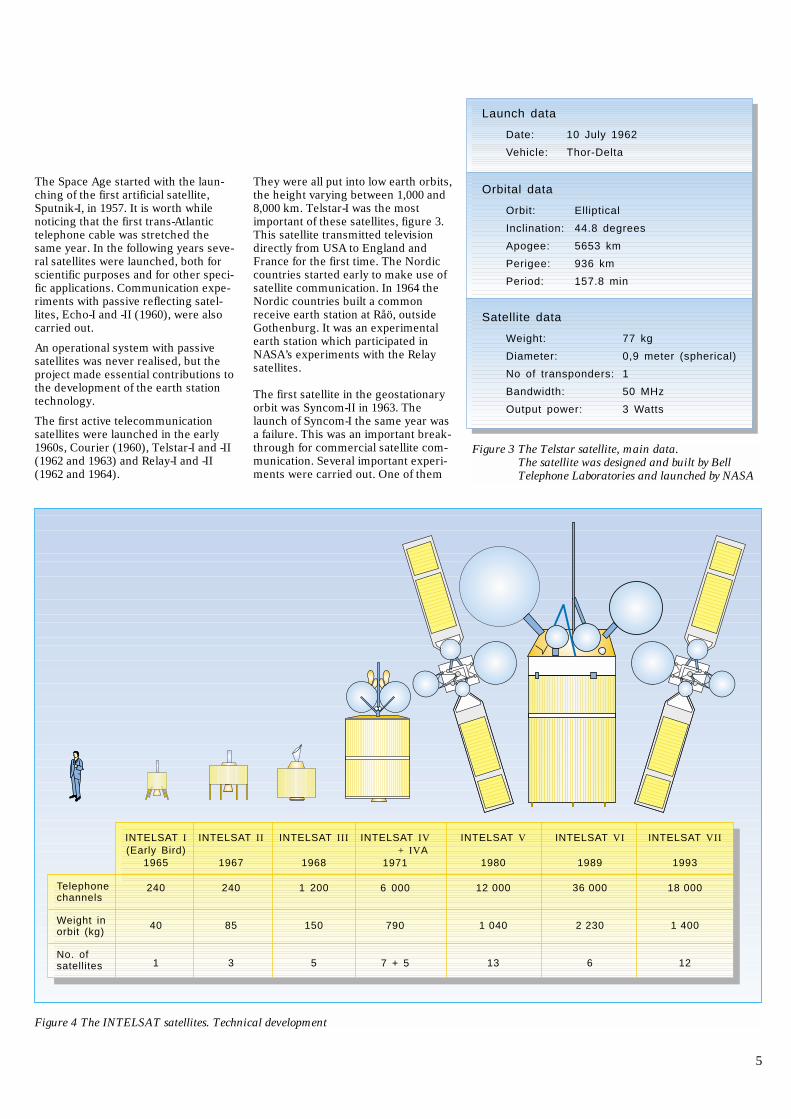
They were all put into low earth orbits,the height varying between 1,000 and8,000 km. Telstar-I was the mostimportant of these satellites, figure 3.This satellite transmitted televisiondirectly from USA to England andFrance for the first time. The Nordiccountries started early to make use ofsatellite communication. In 1964 theNordic countries built a commonreceive earth station at Råö, outsideGothenburg. It was an experimentalearth station which participated inNASA’s experiments with the Relaysatellites.
The first satellite in the geostationaryorbit was Syncom-II in 1963. Thelaunch of Syncom-I the same year wasa failure. This was an important break-through for commercial satellite com-munication. Several important experi-ments were carried out. One of them
Launch data
Date:
Vehicle:
10 July 1962
Thor-Delta
Orbital data
Orbit:
Inclination:
Apogee:
Perigee:
Period:
Elliptical
44.8 degrees
5653 km
936 km
157.8 min
Satellite data
Weight:
Diameter:
No of transponders:
Bandwidth:
Output power:
77 kg
0,9 meter (spherical)
1
50 MHz
3 Watts
Figure 3 The Telstar satellite, main data.The satellite was designed and built by BellTelephone Laboratories and launched by NASA
INTELSAT I(Early Bird)
1965
240
40
1
INTELSAT II
1967
240
85
3
INTELSAT III
1968
1 200
150
5
INTELSAT IV + IVA
1971
6 000
790
7 + 5
INTELSAT V
1980
12 000
1 040
13
INTELSAT VI
1989
36 000
2 230
6
INTELSAT VII
1993
18 000
1 400
12
Telephonechannels
Weight inorbit (kg)
No. ofsatellites
Figure 4 The INTELSAT satellites. Technical development
6
was to examine whether or not geosta-tionary satellites could be a part of thepublic telephone network. The problemwas the time delay of the radio signal.With a mismatch at the other end of theconnection, one would hear oneself half asecond later. This was thought to be amajor obstacle for a two-way telephoneconversation. Effective echo cancellerswere then developed. This reduced theproblem to such a degree that the tele-phone users accepted a connection viasatellite.
In 1965, the first commercial geostation-ary satellite, Early Bird, was placed in aposition over the Atlantic Ocean. Thisbecame the first satellite in the interna-tional organisation for telecommunica-tion satellites, INTELSAT. A prelimi-nary agreement was made in 1964between 11 countries, but the final agree-ment was not signed until 1973. Thisorganisation has been the leading one inthe development of communication satel-lites. Over 100 countries are members,and there are almost 600 earth stations in170 countries. INTELSAT has launched35 geostationary satellites and only sixhave been unsuccessful.
Figure 4 shows the development of theINTELSAT system.
The first Nordic INTELSAT earth stationwas built in 1971 at Tanum in Bohuslän.This earth station communicates with
geostationary satellites over the Atlanticand Indian Oceans. The first Europeancommercial communication satellite,EUTELSAT-I, was launched in 1983.
3 Applications
The most important application of satel-lite communication has up till now beeninter-continental telephone and TV trans-missions. This was the first applicationand is still the most important. Large andexpensive earth stations with antennas upto 20 m in diameter are employed. TheINTELSAT-A system is an example ofthis.
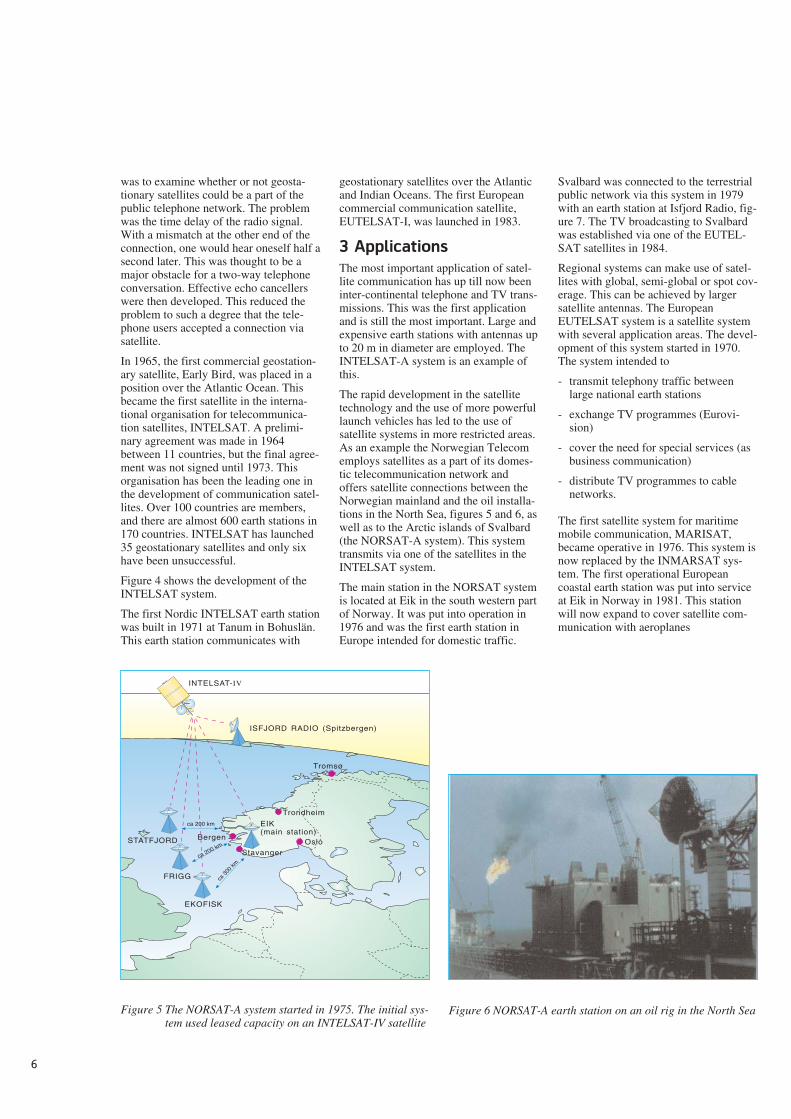
The rapid development in the satellitetechnology and the use of more powerfullaunch vehicles has led to the use ofsatellite systems in more restricted areas.As an example the Norwegian Telecomemploys satellites as a part of its domes-tic telecommunication network andoffers satellite connections between theNorwegian mainland and the oil installa-tions in the North Sea, figures 5 and 6, aswell as to the Arctic islands of Svalbard(the NORSAT-A system). This systemtransmits via one of the satellites in theINTELSAT system.
The main station in the NORSAT systemis located at Eik in the south western partof Norway. It was put into operation in1976 and was the first earth station inEurope intended for domestic traffic.
Svalbard was connected to the terrestrialpublic network via this system in 1979with an earth station at Isfjord Radio, fig-ure 7. The TV broadcasting to Svalbardwas established via one of the EUTEL-SAT satellites in 1984.
Regional systems can make use of satel-lites with global, semi-global or spot cov-erage. This can be achieved by largersatellite antennas. The EuropeanEUTELSAT system is a satellite systemwith several application areas. The devel-opment of this system started in 1970.The system intended to
- transmit telephony traffic betweenlarge national earth stations
- exchange TV programmes (Eurovi-sion)
- cover the need for special services (asbusiness communication)
- distribute TV programmes to cablenetworks.
The first satellite system for maritimemobile communication, MARISAT,became operative in 1976. This system isnow replaced by the INMARSAT sys-tem. The first operational Europeancoastal earth station was put into serviceat Eik in Norway in 1981. This stationwill now expand to cover satellite com-munication with aeroplanes
ISFJORD RADIO (Spitzbergen)
EIK(main station)
STATFJORD
FRIGG
EKOFISK
ca 200 km
ca 200 km
ca 3
00 km
OsloStavanger
Bergen
Trondheim
Tromsø
INTELSAT-IV
Figure 5 The NORSAT-A system started in 1975. The initial sys-tem used leased capacity on an INTELSAT-IV satellite
Figure 6 NORSAT-A earth station on an oil rig in the North Sea
7
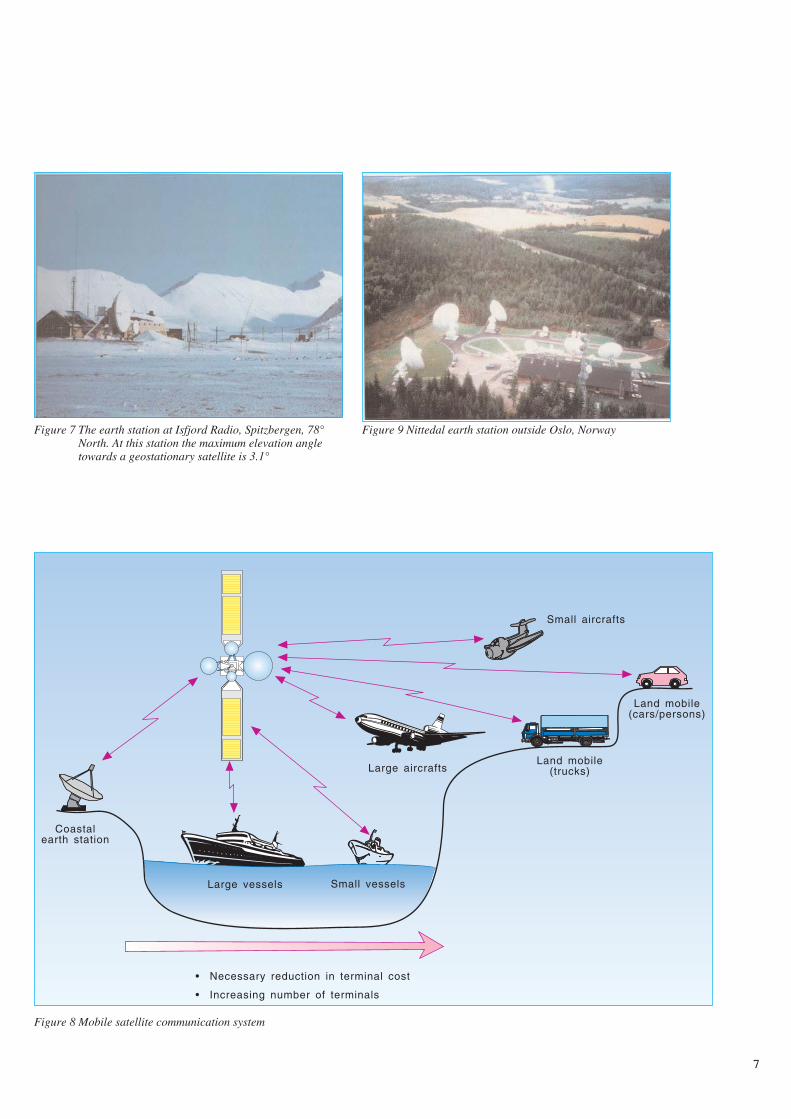
Figure 7 The earth station at Isfjord Radio, Spitzbergen, 78°North. At this station the maximum elevation angletowards a geostationary satellite is 3.1°
Figure 9 Nittedal earth station outside Oslo, Norway
Coastalearth station
Large vessels Small vessels
Large aircraftsLand mobile
(trucks)
Land mobile(cars/persons)
Small aircrafts
• Necessary reduction in terminal cost
• Increasing number of terminals
Figure 8 Mobile satellite communication system

8
(INMARSAT AERO). The evolutionpoints at communication with evensmaller units such as trucks, privatecars and individuals, figure 8.
As the satellites become more power-ful it is possible to make simpler earthstation equipment. Then the satelliteterminals can be located closer to theuser. This is done in the VSAT sys-tems which are mainly used for busi-ness communication. The NorwegianTelecom has established an earth sta-tion at Nittedal, 1987, for Europeandata communication via the EUTEL-SAT system, figure 9, as well as a traf-fic control station at Eik for businesscommunication, the NORSAT-B sys-tem. The NORSAT-B system offersconnections between unmanned earthstations in Europe.
The last application area is broadcast-ing of television and sound. This is apoint-to-multipoint system where wemake full use of the advantage of satel-lite communication. One satellite ingeostationary orbit will cover 97 % ofall households in Norway. Today morethan 100 television programmes aretransmitted via satellite to Europeancountries. Arthur C Clarke’s originalidea from 1945 has become a reality.Figure 10 shows the total involvementof the Norwegian Telecom in satellitecommunication.
4 Orbital considerationsA satellite’s period of revolution isdetermined by the distance from theearth. The farther from earth, thelonger the period. The nearest satel-
lites, e.g. the space shuttle, has anorbital period of approximately 1.5hours. An example of a satellite with along period of revolution is the moon.Due to the long distance from earth(ca 385,000 km) the period is about27 days.
The orientation of the orbit withrespect to the earth’s equatorial planemay also be different, i.e. inclinedorbits.
The movements of a satellite are de-termined by the laws of Newton (1642- 1727) and Kepler (1571 - 1630).Applied to satellites Kepler’s laws are:
1 The satellite orbit is an ellipse withthe earth at one focus.
EIK • NORSAT - A • INMARSAT • NORSAT - B
• INTELSAT• INMARSAT• EUTELSAT• TELE-X• THOR OIL RIGS (1976, 1984)
SHIPS (1982)
SVALBARD (1979, 1984)
NITTEDAL • EUTELSAT • TELE-X • THOR
Satellite broadcastingSatellite business communication
(1984)(1986)
(1986)(1989)(1992)
(1976)(1982)(1986, 1989)
Figure 10 The Norwegian satellite involvement; main earth stations and utilized satellites
9
v
Fc
Fg
m
M
r
= velocity of satellite= centrifugal force= gravitational force= mass of satellite= mass of earth= orbital radius
vFc
Fg
mMr
Perigee
Earth
equator
Satellite
ϕ
EquatorialPlane
Descendingnode
(North Pole)Z
Y
X
ω
Ω
i
Ascendingnode
36 000 km
Satellite 3
Satellite 1 Satellite 2
120o 120o
120o
Earth
Geo
statio
nary o
rbit
North Pole
∆VA
36 000 km
200 km
∆VP
low earth orbit
ellipticaltransferorbit
geosynchronousorbit
Earth
Equatorialplane
inclination
N
transfer
orbital plane
Vernal equinox(21 March)
N
N
N N
Winter solstice(21 Dec)
Autumnal equinox(21 Sept)
Sommer solstice(21 June)
X
Interseeting line between the earth´s equatorial plane and the ecliptic
The ecliptic(the earth´s orbit around the sun)
Sun
PerigeeApogee
Earth
Satellite
v
b
b
a a
c
p
ϕ
FF´
r
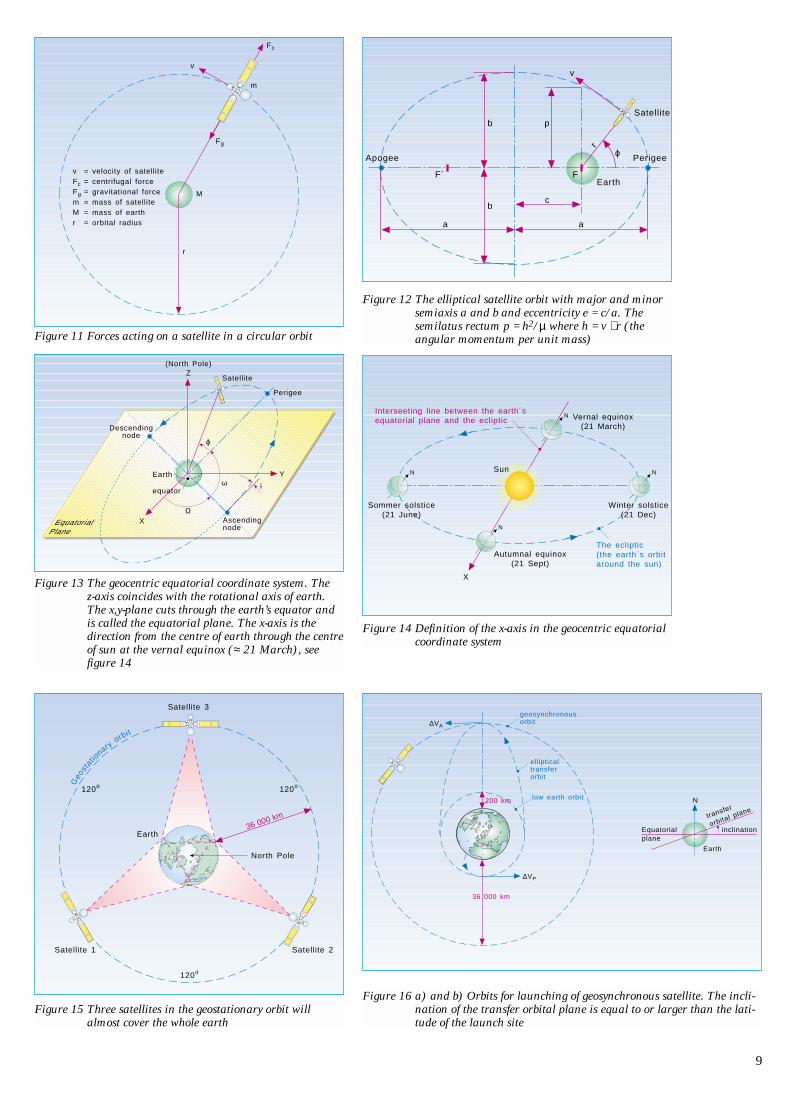
Figure 11 Forces acting on a satellite in a circular orbit
Figure 13 The geocentric equatorial coordinate system. The z-axis coincides with the rotational axis of earth.The x,y-plane cuts through the earth’s equator andis called the equatorial plane. The x-axis is thedirection from the centre of earth through the centreof sun at the vernal equinox (≈ 21 March), seefigure 14
Figure 14 Definition of the x-axis in the geocentric equatorialcoordinate system
Figure 12 The elliptical satellite orbit with major and minorsemiaxis a and b and eccentricity e = c/a. Thesemilatus rectum p = h2/µ where h = v ⋅ r (theangular momentum per unit mass)
Figure 15 Three satellites in the geostationary orbit willalmost cover the whole earth
Figure 16 a) and b) Orbits for launching of geosynchronous satellite. The incli-nation of the transfer orbital plane is equal to or larger than the lati-tude of the launch site
10
where
p = semi-latus rectum =
e = = eccentricity (o < e < l)
a = major semi-axish = v ⋅ r = the angular momentum
per unit mass
The earth is located in F, one of thetwo foci. When the two foci coincide (e= o) the orbit will be a circle. Thepoint closest to earth is called “peri-gee” and the farthest point is called“apogee”. The angle (φ) measuredfrom the perigee to the satellite is cal-led the true anomaly.
The true anomaly, eccentricity andlength of the semi-major axis deter-mine the satellite’s position in the orbi-tal plane. In order to locate the satel-lite in space, we need informationabout the orbit’s orientation. We intro-duce a fixed reference co-ordinate sys-tem called the geocentric equatorialco-ordinate system, figures 13 and 14.This co-ordinate system moves withthe earth around the sun, but it doesnot rotate.
The intersection of the equatorialplane and the orbital plane is calledthe line of nodes. The ascending nodeis the point where the satellite is cros-sing the equatorial plane from south tonorth. The angle between the x-axisand ascending node is called the rightascension (RA) of the ascending node(Ω). The angle between the ascendingnode and perigee (ω) specifies the ori-entation of the ellipse, and is called theargument of perigee. The inclination(i) of the orbital plane is the angle be-tween the equatorial plane and theorbital plane.
The five orbital elements, a, e, Ω, ω,and i, completely define the satellite’sorbit around the earth. These ele-ments are time independent. The lastelement, ϕ, specifies the satellite’sposition in its orbit, and is the onlytime dependent parameter.
For communication satellites there isone orbit which is particularly interes-ting. This is the near circular equato-rial orbit with period of revolutionequal to the rotational period of earth(24 hours). A satellite in this orbit willfollow the earth’s rotation, and for anobserver on earth’s surface, the satel-lite will appear to be “fixed in the sky”.
c
a
h2
µ
This orbit is called the geostationaryorbit (GEO).
The geostationary satellite has aperiod of revolution a little under 24hours, due to the fact that the earthmoves around the sun in one year.This means an extra revolution withrespect to the fixed stars. The periodof a GEO satellite will accordingly be
= 86 164 sec
Using equation (4.6) we can now cal-culate the radius of the geostationaryorbit:
= 42 164 km
The satellite’s height above the earth’ssurface will be:
h = r - Rj = 35 786 km
where Rj = 6 378 km = equator radiusof the earth.
The satellite’s velocity is:
= 3.075 km/sec
From a satellite in the GEO orbitapproximately 42 % of the earth’s sur-face will be visible. Accordingly, with3 satellites in the GEO orbit, we willhave almost full coverage of the earth,except for areas above 81° latitudenorth and south, figure 15.
Our problem with the geostationarysatellites is the transmission delay ofthe radio signal between the earth andthe satellite. Since radio waves propa-gate with the speed of light (300 000km/s) the time delay will be about270 milliseconds to and from the satel-lite. This was in the early days con-sidered to be a major problem forspeech connections via GEO satellites.However, it showed up that the prob-lem was much less than anticipated asmentioned previously.
In the last few years other orbits thanthe geostationary have been reconsi-dered with great interest, especiallylow earth orbits for mobile satelliteservices, and highly inclined ellipticalorbits for broadcasting services, refHovstad/Gutteberg: “Future systemsfor mobile satellite communications”(this issue).
v = 2πr
T
r = µ T
2π
2
1/3
T = 365.25
365.25 +1
⋅24 ⋅60 ⋅60
2 The radius vector to the satellitesweeps out equal areas in equaltimes.
3 The square of the period of revolu-tion is proportional to the cube ofthe orbit’s semi-major axis.
Considering a circular orbit, the forcesacting on the satellite are shown infigure 11.
With reference to figure 11, the gravi-tational force Fg on the satellite isgiven by Newton’s law:
(4.1)
where G is the universal gravitationalconstant.
According to Newton’s general law ofmotion, the centrifugal force is givenby
(4.2)
Counterbalancing of forces, Fc = Fg,gives
(4.3)
or the satellite velocity
(4.4)
The period of orbit, T, is given by
(4.5)
Inserting for the satellite velocity,equation (4.4), the period will be
(4.6)
where µ = G ⋅ M = 398 600 km3/sek2
(Kepler’s constant).
This expression is a mathematical sta-tement of Kepler’s third law. Thisequation applies even if the orbit iselliptical, substituting the radius r withthe semi-major axis a.
An elliptical orbital geometry is shownin figure 12.
The equation describing the orbit inpolar co-ordinates (r, ϕ) is
(4.7)r = p
1+ ecosϕ
T = 2π r3
G ⋅ M= 2π r3
µ
T = 2πr
v
v = G ⋅ M
r
GM ⋅m
r2 = mv2
r
Fc = ma = mv2
r
Fg = GM ⋅m
r2
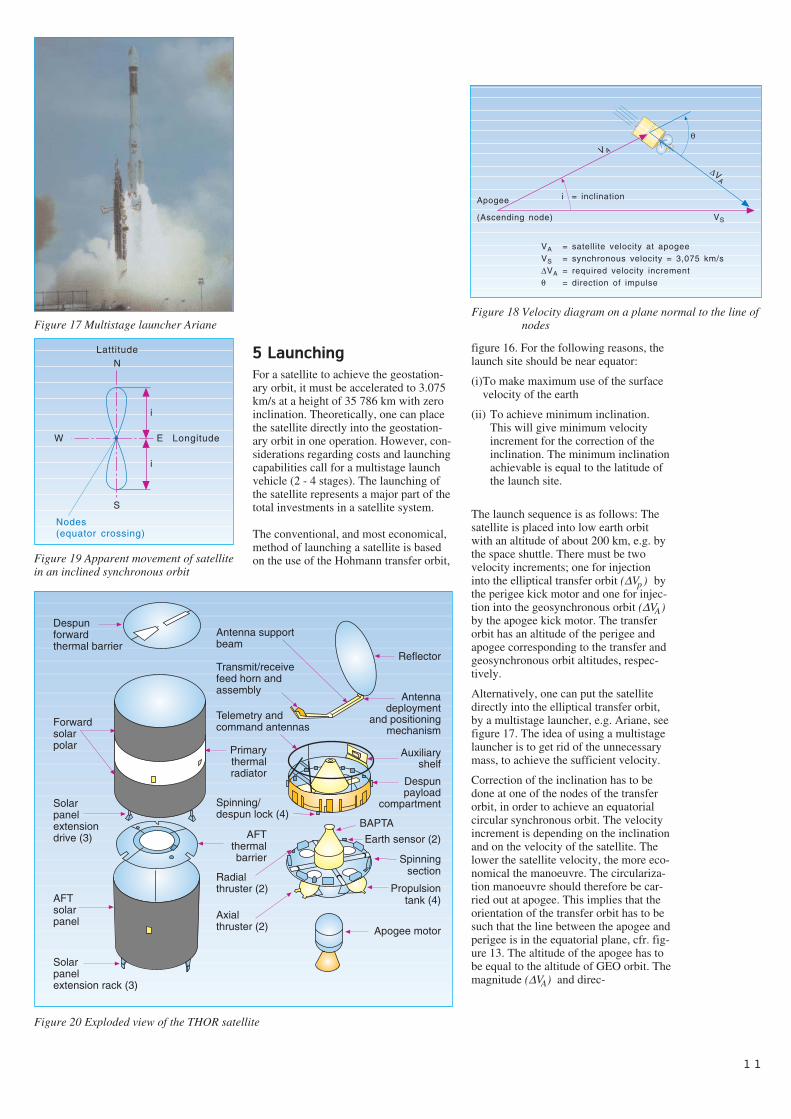
5 Launching
For a satellite to achieve the geostation-ary orbit, it must be accelerated to 3.075km/s at a height of 35 786 km with zeroinclination. Theoretically, one can placethe satellite directly into the geostation-ary orbit in one operation. However, con-siderations regarding costs and launchingcapabilities call for a multistage launchvehicle (2 - 4 stages). The launching ofthe satellite represents a major part of thetotal investments in a satellite system.
The conventional, and most economical,method of launching a satellite is basedon the use of the Hohmann transfer orbit,
figure 16. For the following reasons, thelaunch site should be near equator:
(i)To make maximum use of the surfacevelocity of the earth
(ii) To achieve minimum inclination.This will give minimum velocityincrement for the correction of theinclination. The minimum inclinationachievable is equal to the latitude ofthe launch site.
The launch sequence is as follows: Thesatellite is placed into low earth orbitwith an altitude of about 200 km, e.g. bythe space shuttle. There must be twovelocity increments; one for injectioninto the elliptical transfer orbit (∆Vp ) bythe perigee kick motor and one for injec-tion into the geosynchronous orbit (∆VA)by the apogee kick motor. The transferorbit has an altitude of the perigee andapogee corresponding to the transfer andgeosynchronous orbit altitudes, respec-tively.
Alternatively, one can put the satellitedirectly into the elliptical transfer orbit,by a multistage launcher, e.g. Ariane, seefigure 17. The idea of using a multistagelauncher is to get rid of the unnecessarymass, to achieve the sufficient velocity.
Correction of the inclination has to bedone at one of the nodes of the transferorbit, in order to achieve an equatorialcircular synchronous orbit. The velocityincrement is depending on the inclinationand on the velocity of the satellite. Thelower the satellite velocity, the more eco-nomical the manoeuvre. The circulariza-tion manoeuvre should therefore be car-ried out at apogee. This implies that theorientation of the transfer orbit has to besuch that the line between the apogee andperigee is in the equatorial plane, cfr. fig-ure 13. The altitude of the apogee has tobe equal to the altitude of GEO orbit. Themagnitude (∆VA) and direc-
1 1
Figure 17 Multistage launcher ArianeFigure 18 Velocity diagram on a plane normal to the line of
nodes
Apogee
(Ascending node)
i = inclination
θ
VS
V A
VA
VS
∆VA
θ
= satellite velocity at apogee= synchronous velocity = 3,075 km/s= required velocity increment= direction of impulse
∆VA
Figure 19 Apparent movement of satellitein an inclined synchronous orbit
Nodes(equator crossing)
i
i
S
W
LattitudeN
E Longitude
Despunforwardthermal barrier
Forwardsolarpolar
Solarpanelextensiondrive (3)
AFTsolarpanel
Solarpanelextension rack (3)
Primarythermalradiator
AFTthermalbarrier
Spinning/despun lock (4)
Radialthruster (2)
Axialthruster (2)
Reflector
Antennadeployment
and positioningmechanism
Antenna supportbeam
Transmit/receivefeed horn andassembly
Auxiliaryshelf
Despunpayload
compartment
Telemetry andcommand antennas
BAPTA
Earth sensor (2)
Spinningsection
Propulsiontank (4)
Apogee motor
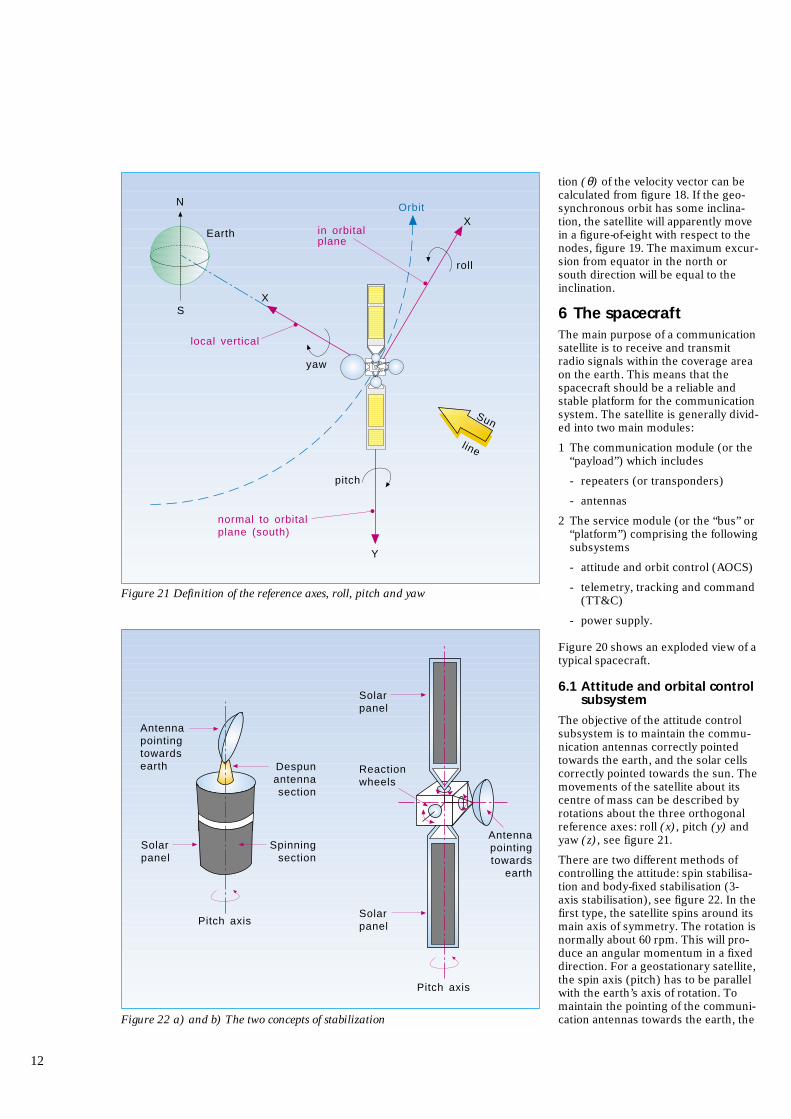
Figure 20 Exploded view of the THOR satellite
tion (θ) of the velocity vector can becalculated from figure 18. If the geo-synchronous orbit has some inclina-tion, the satellite will apparently movein a figure-of-eight with respect to thenodes, figure 19. The maximum excur-sion from equator in the north orsouth direction will be equal to theinclination.
6 The spacecraftThe main purpose of a communicationsatellite is to receive and transmitradio signals within the coverage areaon the earth. This means that thespacecraft should be a reliable andstable platform for the communicationsystem. The satellite is generally divid-ed into two main modules:
1 The communication module (or the“payload”) which includes
- repeaters (or transponders)
- antennas
2 The service module (or the “bus” or“platform”) comprising the followingsubsystems
- attitude and orbit control (AOCS)
- telemetry, tracking and command(TT&C)
- power supply.
Figure 20 shows an exploded view of atypical spacecraft.
6.1 Attitude and orbital controlsubsystem
The objective of the attitude controlsubsystem is to maintain the commu-nication antennas correctly pointedtowards the earth, and the solar cellscorrectly pointed towards the sun. Themovements of the satellite about itscentre of mass can be described byrotations about the three orthogonalreference axes: roll (x), pitch (y) andyaw (z), see figure 21.
There are two different methods ofcontrolling the attitude: spin stabilisa-tion and body-fixed stabilisation (3-axis stabilisation), see figure 22. In thefirst type, the satellite spins around itsmain axis of symmetry. The rotation isnormally about 60 rpm. This will pro-duce an angular momentum in a fixeddirection. For a geostationary satellite,the spin axis (pitch) has to be parallelwith the earth’s axis of rotation. Tomaintain the pointing of the communi-cation antennas towards the earth, the
12
N
Sun
S
Earth
yaw
roll
OrbitX
X
Y
pitch
line
normal to orbitalplane (south)
in orbitalplane
local vertical
Solarpanel
Antennapointingtowardsearth Despun
antennasection
Spinningsection
Solarpanel
Pitch axis
Pitch axis
Solarpanel
Antennapointingtowards
earth
Reactionwheels
Figure 21 Definition of the reference axes, roll, pitch and yaw
Figure 22 a) and b) The two concepts of stabilization
platform containing the antennas hasto rotate in the opposite direction (de-spun). Pitch correction is done byvarying the angular velocity of the des-pin motor, since the rate of change ofangular momentum is proportional tothe torque. Yaw and roll correctionsare made by thrusters mounted atappropriate places on the body. A typi-cal spin-stabilised satellite is shown infigure 20.
To keep the gyroscopic stiffness in abody-fixed stabilised satellite, one mayuse a momentum wheel inside thesatellite. This gives rather moderateantenna pointing. Instead, it is usual touse three reaction wheels spinningaround the three main axes. While themomentum wheel is spinning at highvelocity (about 10 000 rpm), the reac-tion wheels are spinning in both direc-tion around zero speed. By varying thespeed and direction of the reactionwheels, controlling torques can beapplied around all axes. When thewheels reach their maximum speed,they must be unloaded by operatingthrusters on the satellite’s body.A typical body-stabilised satellite isshown in figure 2. For operating thetorque units, it is necessary to obtainthe attitude of the satellite. This isdone by sensors on board the space-craft sensing the direction to the sunand earth. As seen from the geostatio-nary orbit the sun subtends only 0.5°.It is therefore a good source for ob-taining attitude reference. The sunsensor consists of photo cells which
13
Earth
equator
bolometerbeams
α
β
α−β
ω∆t1
ω∆t2
ω
despuncommunication
antenna
Communication(spot) antenna
Commandomni antenna
Telemetryomni antenna
Commandreceiver
DecoderCommand
output
Telemetrytransmitter
EncoderTelemetry
input
Ra
ng
ing
ton
es
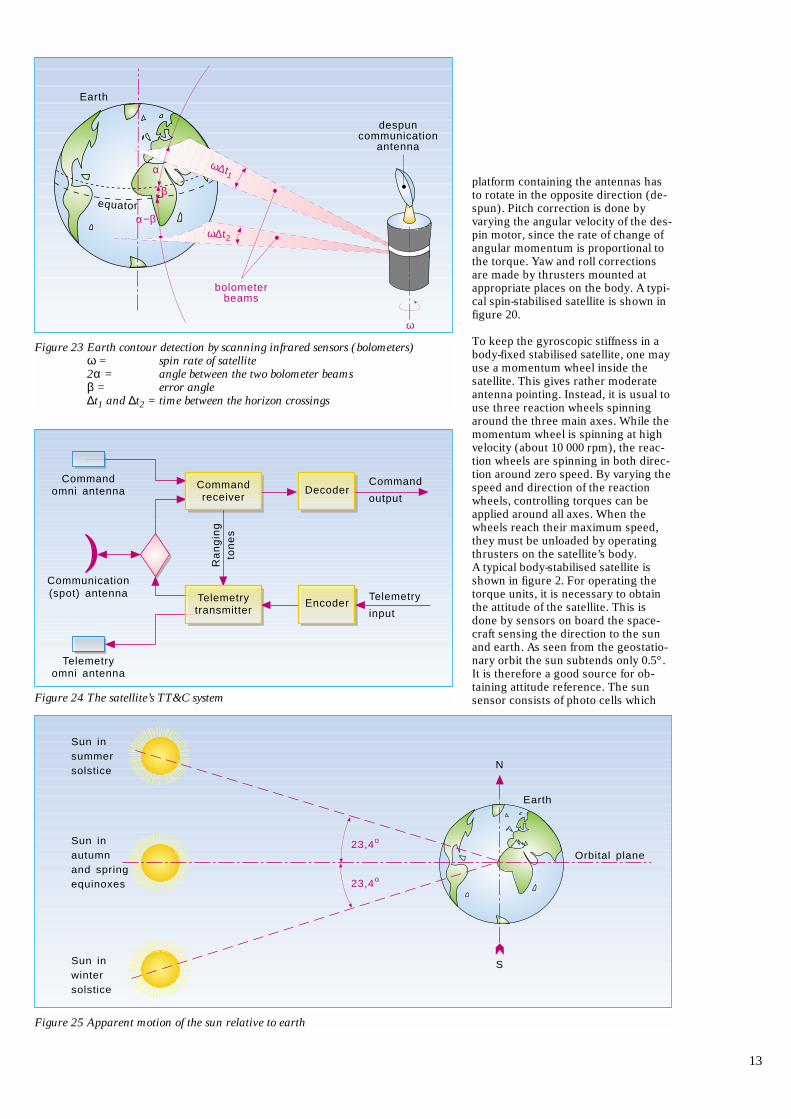
Figure 23 Earth contour detection by scanning infrared sensors (bolometers)ω = spin rate of satellite2α = angle between the two bolometer beamsβ = error angle∆t1 and ∆t2 = time between the horizon crossings
Figure 24 The satellite’s TT&C system
Earth
N
S
Orbital plane23,4o
23,4o
Sun inautumnand springequinoxes
Sun insummersolstice
Sun inwintersolstice
Figure 25 Apparent motion of the sun relative to earth
produce an electric current when illu-minated by the sun.
The earth, seen from the satellite, hasa much larger view angle (17.3°) andits centre cannot directly be mea-sured. However, using infrared detec-tors (bolometers), one can measurethe edge of the earth, due to the diffe-rence in radiation from the cold skyand the warm earth. Infrared detectorscan be used both day and night. If twobolometers are mounted on a spinningspacecraft, as shown in figure 23, thepointing error (β) can be calculatedmeasuring the time between the twohorizon crossings (t1 and t2), knowingthe spin rate (ω) and the angle be-tween the bolometer beams (2α).
On a 3-axis stabilised satellite scan-ning mirrors have to be used, sincethe satellite itself does not spin.
A higher degree of pointing accuracymay be obtained by using a radio bea-con on the earth. In such a system thesatellite antenna is directly locked tothe transmitted radio signal from theearth beacon.
6.2 Telemetry, tracking andcommand (TT&C)
The satellite is supervised and control-led via a dedicated earth station,TT&C station, which in turn is connec-ted to the satellite control centre(SCC). The main tasks of the space-craft management is to control theorbit and attitude of the satellite, moni-tor the “health” status, remaining pro-pulsion fuel and transponder configu-ration, together with steering of anten-nas.
The satellite’s TT&C system is shownin figure 24.
The telemetry subsystem collects datafrom various sensors on board thespacecraft, such as fuel tanks pres-sure, voltages/currents in differentsubsystems, sighting from infraredand sunlight detectors, temperature,etc. The information rate is usuallyless than 1 kbit/s. The data are trans-mitted on a low-power telemetry car-rier using an omnidirectional satelliteantenna during the transfer phaseand/or a spot beam antenna when thesatellite is on station.
The command subsystem is used forremote control of the different func-tions in the satellite. This may includeattitude and orbital manoeuvres, swit-
ching transponders on and off, stee-ring antennas, firing the apogee boostmotor in transfer phase, etc. Whenreceiving a command, the commandsubsystem generates a verification sig-nal, which is sent back via the tele-metry link. After checking, an executesignal is transmitted to the satellite.This prevents inadvertent commands.As in the telemetry link the omniantenna is used during the transferphase, while spot-beams are usedwhen the satellite is in its geostatio-nary position.
The tracking or ranging subsystemdetermines the orbit of the spacecraft.There is a number of techniques thatcan be used. One method is to mea-sure to pointing of the TT&C earthstation antenna towards the satellite,together with the slant range to thesatellite, i.e. the range vector. Therange to the satellite can be measuredby modulating the command carrierwith multiple low frequency tones(“tone ranging”). These tones aredemodulated and remodulated on thetelemetry carrier and received in theTT&C ground station. By comparingthe phase between the transmittedand received tones, the range can becalculated. The highest tone gives thebest accuracy, but several lower tonesresolve the ambiguity.
6.3 Power supply
Solar energy is the only externalenergy source for orbiting satellites.The solar radiation intensity is about1.4 kW/m2. The sun energy is conver-ted to electrical energy by means ofphotovoltic cells (solar panels). Theefficiency of the solar panels is about10 - 15 %. On the spin-stabilised satelli-tes the solar panels form the exteriorof the spacecraft’s body, see figures 20and 22.
One disadvantage of the spin-stabilis-ed satellite is that only 1/3 of totalsolar array is exposed to the sunlight.On the body-stabilised satellite thesolar panels are mounted on twodeployable “wings”, as shown in figure2 and 22. The satellite moves aroundthe earth in 24 hours. For interceptingmaximum solar flux, the solar panelwings have to make one turn per day.They are driven by two separatemotors.
A measure of efficiency is the ratio ofproduced electrical power to the massof satellite. For a spinning satellite this
ratio is about 10 Watts/kg, whereasfor the 3-axis stabilised satellite theratio is about 50 Watts/kg. Thismeans that if we need a satellite withhigh RF output power, we shouldselect a body stabilised satellite. Thedisadvantage is that they are morecomplex.
On-board batteries are needed to pro-duce power during the launch phaseand when the satellite enters the sha-dow of the earth (eclipse). This hap-pens around the equinoxes, and themaximum duration is approximately70 minutes. This is due to the fact thatthe earth’s equatorial plane is inclinedwith an angle of 23.4° with the direc-tion to the sun, see figure 25. Duringthe summer and winter seasons thesatellite is out of the earth’s shadow,figure 26, whereas during the equino-xes the satellite passes through theearth’s shadow once a day for 42 days,figure 27, i.e. the satellite will experi-ence 84 eclipses per year.
6.4 The communication module
The communication subsystem is theprimary system in the satellite. Allother functions in the satellite can beconsidered as supporting activities forthis system. It consists of the receiv-ers, transmitters and the communica-tions antennas. One receive/transmitchain is called a transponder. A satel-lite with 5 transponders is shown sche-matically in figure 28. The buildingblocks are:
- A wide band receiver and a downconverter
- An input multiplexer (IMUX)
- 5 channelised sections including thehigh power amplifiers
- An output multiplexer (OMUX).
The wide band receiver/converteroperates in the whole up-link band,e.g. in one of the common bands
- C-band (5.9 - 6.4 GHz)
- Ku-band (14 - 14.5 GHz)
- Ka-band (17.3 - 18.1 GHz)
or other bands allocated to satellitecommunication.
The frequency conversion could eitherbe single, as in figure 28, or dual. Inthe latter case the first mixer convertsthe frequency down to an intermediatefrequency (IF). After the channel
14

amplification on IF the signal is con-verted up to the down-link frequency,before the last power amplification.This is often done because it is mucheasier to make filters, amplifiers andequalisers at an intermediate fre-quency. The intermediate frequency
can be chosen independently of theup- and down-link frequencies.
The input multiplexer separates theup-link band into individual channelswith a certain bandwidth. For examplecan a 500 MHz wide up-link band beseparated into 12 channels with chan-nel bandwidth of 36 MHz. The chan-
nel bandwidths may also be unequal.The channel amplifier/attenuator setsthe gain (gain-step) of the transponderin order to control the input back-off ofthe TWTAs. This can be done fromthe TT&C station by the up-link com-mand system.
The last high-power amplifier (HPA) isusually a travelling wave tube ampli-fier (TWTA). This amplifier establis-hes the level of the output power,which may be in the range of 10 - 200Watts depending on the application.The TWTA operates near saturation.The input/output characteristic isshown in figure 29. The output multi-plexer combines all the channelsbefore signals are transmitted to theearth by the antenna.
6.5 The satellite communicationantenna
Antennas are used for receiving andtransmitting modulated radio frequentsignals from and to the earth. Themost commonly used antenna in themicrowave frequency band is the para-bolic reflector antenna. The antenna ischaracterised by its radiation patternand the maximum gain, that is theantenna’s capability to concentrate theenergy in one direction.
The design of the satellite antenna isdepending on required coverage area,
15
Figure 27 The satellite passes through the earth shadow at the equinoxes once a day
Figure 26 During summer and winter the satellite is always illuminated
Day
Sun
Geostationary orbitEarth shadow
Night
Earth shadow
Night
Day
Sun
Geostationary orbit
Up-link
frequency f1
Receivingantenna
input filter
Lownoise
amplifier
mixer
Preampli-fier
Local oscillator(∆f=f1-f2)
A
B
C
D
E
Transmitantenna
Down-link
frequency f2
Channelfilter
AutomaticGain Control/Gain Setting
Spare
TravellingWave Tube
amplifier
TWT
TWT
TWT
TWT
A B
CD E
Wide band lownoise receiver with
down converter
Inputmultiplexer
Channelamplifiers
High poweramplifiers
Outputmultiplexer
Figure 28 A satellite with 5 transponders and single frequency conversion

see figure 30. This determines thebeam width of the antenna, usuallytaken as the half-power beam width(or 3 dB beam width). The 3 dB beamwidth is given by
(degrees) (6.1)
where
K = 65 - 75, depending on theantenna aperture field distribu-tion
λ = wavelength
D = diameter of antenna.
The gain of the antenna is proportionalto its area, and is given by
(6.2)
where
η = antenna efficiency (0.5 - 0.8)
A = area of antenna
or in dB:
(6.3)
Obviously the gain and the beamwidth of a reflector antenna are rela-ted. The gain is approximately givenby
(6.4)
where
θ3dB is given in degrees.
Should the service area be the wholeearth, the required beam width wouldbe 17.4° as seen from the geostatio-nary orbit. This corresponds to a satel-lite antenna with 20 dB gain. By in-creasing the size of the satellite anten-na only a small area of the earth is illu-minated. These narrow beams are cal-led “spot beams”. If we should coveran area on earth with a diameter of 300km, the beam width of the antennashould only be 0.5°, with a correspon-ding gain of 50 dB. This means that weneed less power from the HPA in thespot beam to achieve the same fluxdensity on earth as in the global beam.
To express the transmitted power of asatellite, the Equivalent Isotropic Radi-ated Power (EIRP) is used. This issimply the product of output power
G = 30000
θ3dB2
G(dB) =10 log η πD
λ
2
G = η 4πλ2 ⋅ A = η πD
λ
2
θ3dB = K ⋅ λD
16
Output power (dBW)
PmaxSaturated output
Output back-off
Input back-off
Input power (dBW)
Pinat saturation
45 cm 65 cm 210 cm
EIRP: 49 dBW54 dBW
antennadiameter
39 dBW
N Coverage areaθ = θ3dB
equator
Subsatellitepoint17,4
o
θ
Side lobes
Main lobe
Antenna radiation pattern
Figure 29 Input/output characteristic of a TWTA
Figure 31 The preliminary EIRP contours of the THOR satellite and the correspon-ding receiving antenna diameter for TV reception with good quality
Figure 30 Coverage area of the satellite antenna. For global coverage the requiredbeam width is 17.4°
from HPA(Pt ) and satellite antennagain (Gt):
EIRP = Pt ⋅ Gt (6.5)
So instead of plotting coverage con-tours (or gain contours) we can plotEIRP contours. An example is given infigure 31.
A satellite can have more than oneantenna. Modern satellites employseveral antennas, both with global,hemispheric and spot coverage.
As described, the communication pay-load overall can be characterised bythe following parameters:
- the coverage area
- the maximum EIRP
- the input power flux density for satu-ration of the output high poweramplifier
- the channel arrangement or fre-quency plan.
7 The satellite link
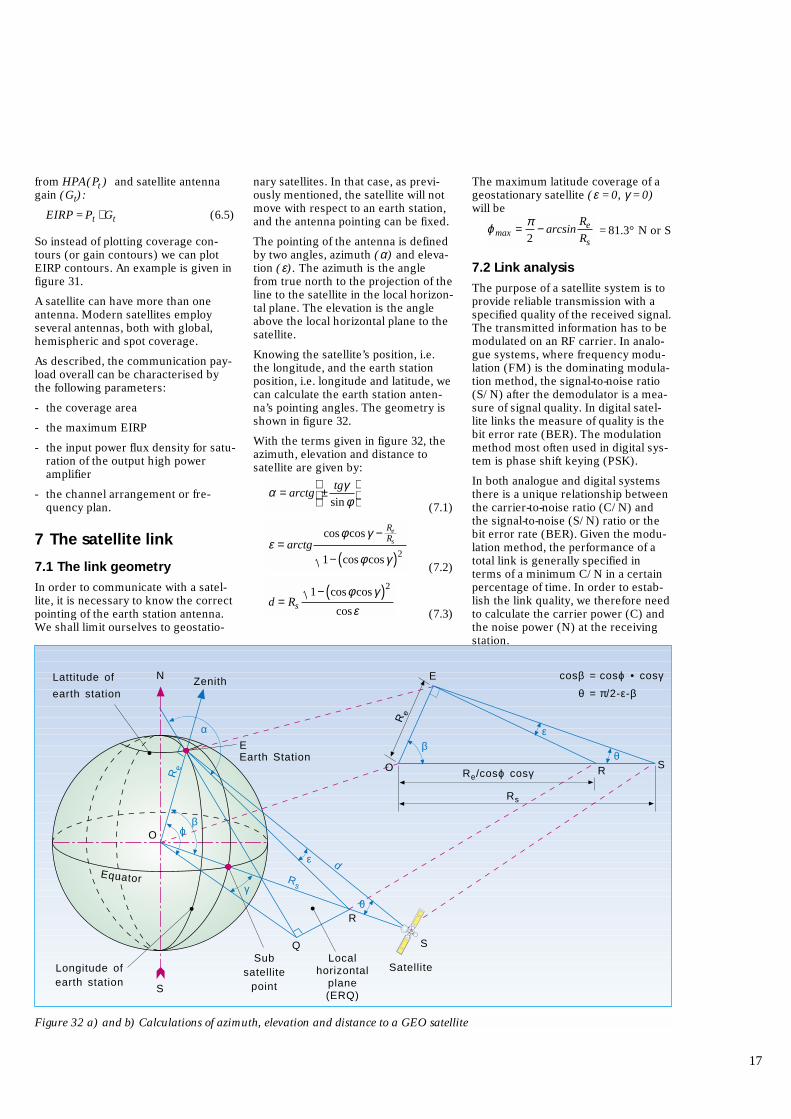
7.1 The link geometry
In order to communicate with a satel-lite, it is necessary to know the correctpointing of the earth station antenna.We shall limit ourselves to geostatio-
nary satellites. In that case, as previ-ously mentioned, the satellite will notmove with respect to an earth station,and the antenna pointing can be fixed.
The pointing of the antenna is definedby two angles, azimuth (α) and eleva-tion (ε). The azimuth is the anglefrom true north to the projection of theline to the satellite in the local horizon-tal plane. The elevation is the angleabove the local horizontal plane to thesatellite.
Knowing the satellite’s position, i.e.the longitude, and the earth stationposition, i.e. longitude and latitude, wecan calculate the earth station anten-na’s pointing angles. The geometry isshown in figure 32.
With the terms given in figure 32, theazimuth, elevation and distance tosatellite are given by:
(7.1)
(7.2)
(7.3)d = Rs
1− cosφcosγ( )2
cosε
ε = arctgcosφcosγ − Re
Rs
1− cosφcosγ( )2
α = arctg ± tgγsinφ
The maximum latitude coverage of ageostationary satellite (ε = 0, γ = 0)will be
= 81.3° N or S
7.2 Link analysis
The purpose of a satellite system is toprovide reliable transmission with aspecified quality of the received signal.The transmitted information has to bemodulated on an RF carrier. In analo-gue systems, where frequency modu-lation (FM) is the dominating modula-tion method, the signal-to-noise ratio(S/N) after the demodulator is a mea-sure of signal quality. In digital satel-lite links the measure of quality is thebit error rate (BER). The modulationmethod most often used in digital sys-tem is phase shift keying (PSK).
In both analogue and digital systemsthere is a unique relationship betweenthe carrier-to-noise ratio (C/N) andthe signal-to-noise (S/N) ratio or thebit error rate (BER). Given the modu-lation method, the performance of atotal link is generally specified interms of a minimum C/N in a certainpercentage of time. In order to estab-lish the link quality, we therefore needto calculate the carrier power (C) andthe noise power (N) at the receivingstation.
ϕ max = π2
− arcsinRe
Rs
17
E
Re
Rs
SRO Re/cosϕ cosγ
ε
θβ
cosϕ • cosγ
π/2-ε-β
cosβ =
θ =
N
S
Equator
O
Zenith
EEarth Station
α
Re
Rs
ε
θγ
βϕ
d
Satellite
Q S
R
Localhorizontal
plane(ERQ)
Subsatellite
point
Longitude ofearth station
Lattitude of
earth station
Figure 32 a) and b) Calculations of azimuth, elevation and distance to a GEO satellite
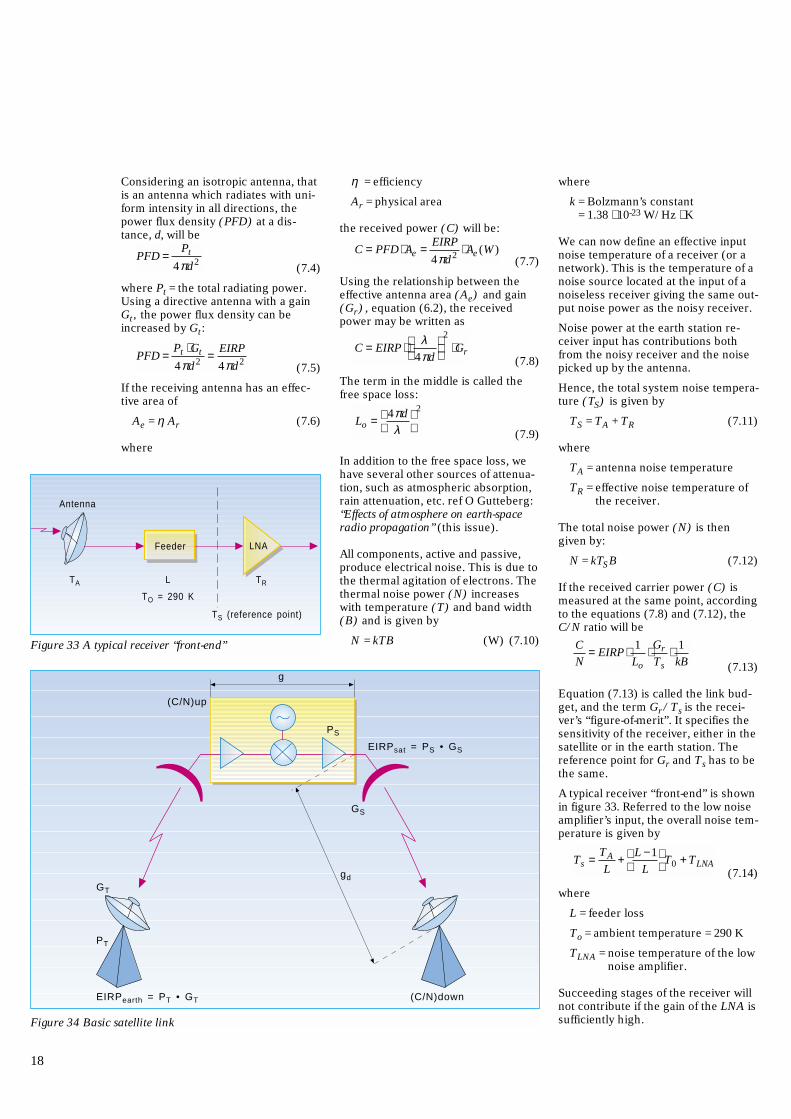
Considering an isotropic antenna, thatis an antenna which radiates with uni-form intensity in all directions, thepower flux density (PFD) at a dis-tance, d, will be
(7.4)
where Pt = the total radiating power.Using a directive antenna with a gainGt , the power flux density can beincreased by Gt :
(7.5)
If the receiving antenna has an effec-tive area of
Ae = η Ar (7.6)
where
PFD =Pt ⋅Gt
4πd2 = EIRP
4πd2
PFD =Pt
4πd2
η = efficiency
Ar = physical area
the received power (C) will be:
(7.7)
Using the relationship between theeffective antenna area (Ae) and gain(Gr), equation (6.2), the receivedpower may be written as
(7.8)
The term in the middle is called thefree space loss:
(7.9)
In addition to the free space loss, wehave several other sources of attenua-tion, such as atmospheric absorption,rain attenuation, etc. ref O Gutteberg:“Effects of atmosphere on earth-spaceradio propagation” (this issue).
All components, active and passive,produce electrical noise. This is due tothe thermal agitation of electrons. Thethermal noise power (N) increaseswith temperature (T) and band width(B) and is given by
N = kTB (W) (7.10)
Lo = 4πd
λ
2
C = EIRP ⋅ λ4πd
2
⋅Gr
C = PFD ⋅ Ae = EIRP
4πd2 ⋅ Ae (W )
where
k = Bolzmann’s constant = 1.38 ⋅ 10-23 W/Hz ⋅ K
We can now define an effective inputnoise temperature of a receiver (or anetwork). This is the temperature of anoise source located at the input of anoiseless receiver giving the same out-put noise power as the noisy receiver.
Noise power at the earth station re-ceiver input has contributions bothfrom the noisy receiver and the noisepicked up by the antenna.
Hence, the total system noise tempera-ture (TS) is given by
TS = TA + TR (7.11)
where
TA = antenna noise temperature
TR = effective noise temperature ofthe receiver.
The total noise power (N) is thengiven by:
N = kTSB (7.12)
If the received carrier power (C) ismeasured at the same point, accordingto the equations (7.8) and (7.12), theC/N ratio will be
(7.13)
Equation (7.13) is called the link bud-get, and the term Gr/ Ts is the recei-ver’s “figure-of-merit”. It specifies thesensitivity of the receiver, either in thesatellite or in the earth station. Thereference point for Gr and Ts has to bethe same.
A typical receiver “front-end” is shownin figure 33. Referred to the low noiseamplifier’s input, the overall noise tem-perature is given by
(7.14)
where
L = feeder loss
To = ambient temperature = 290 K
TLNA = noise temperature of the lownoise amplifier.
Succeeding stages of the receiver willnot contribute if the gain of the LNA issufficiently high.
Ts = TA
L+ L −1
L
T0 + TLNA
C
N= EIRP ⋅ 1
Lo⋅ Gr
Ts⋅ 1
kB
18
EIRPearth = PT • GT
PS
(C/N)up
(C/N)down
EIRPsat = PS • GS
g
gd
PT
GT
GS
Figure 34 Basic satellite link
Feeder LNA
Antenna
TA L
TO = 290 K
TR
TS (reference point)
Figure 33 A typical receiver “front-end”
Instead of giving the noise tempera-ture of a component, the noise figure(F) is often used. This is defined asthe signal-to-noise ratio at the inputdivided by the signal-to-noise ratio atthe output:
(7.15)
If the source noise temperature is atthe standard temperature To = 290 K,then
(7.16)
where
g = gain of the network.
Using the definition of effective inputnoise temperature:
(7.17)
or
T = (F - 1) 290 (7.18)
A satellite system consists of both anup-link and a down-link. Noise on theup-link will also contribute to the over-all noise power received at the earthstation. The basic satellite link isshown in figure 34.
The total received noise power at thereceiving earth station is given by
Nt = Nu ⋅ g ⋅ gd + Nd
where
Nu = noise power on the up-link
Nd = noise power on the down-link
g = total transponder gain
gd = “section gain” on the down-link (free space loss andantenna gains).
The total noise-to-carrier ratio is then
since
and C = Cdown
C
g ⋅gd= Cup
N
C=
Nupggd + Ndown
C
=Nupggd
C+
Ndown
C
=Nup
C / g ⋅gd+
Ndown
C
F =k To + T( )B ⋅g
kToBg=1+ T
To
F =Si
So⋅
No
Ni= 1
g⋅
No
kToB
FS N
S Ni i
o o
= //
then
(7.19)
Using equation (7.19) we can calculatethe total C/N ratio, knowing C/Nratios on the up- and down-link.
If the (C/N)up is more than 10 dBabove (C/N)down, the noise contribu-tion from the up-link to the down-linkis only a few tenths of a dB. Often it isdisregarded in link calculations wherethere is enough power on the up-link.
Knowing the
- location of satellite and earth station
- EIRP and G/T of the satellite
- EIRP of the earth station
- the required quality (C/N)
- the carrier frequencies
- the receiver overall system tempera-ture T (or noise figure F)
- the equivalent noise bandwidth ofthe receiver (B)
we are now able to calculate the recei-ving station’s figure-of-merit (G/T) orreceiving station’s antenna diameter.
C
N= 1
1C / N( )up
+ 1C / N( )down
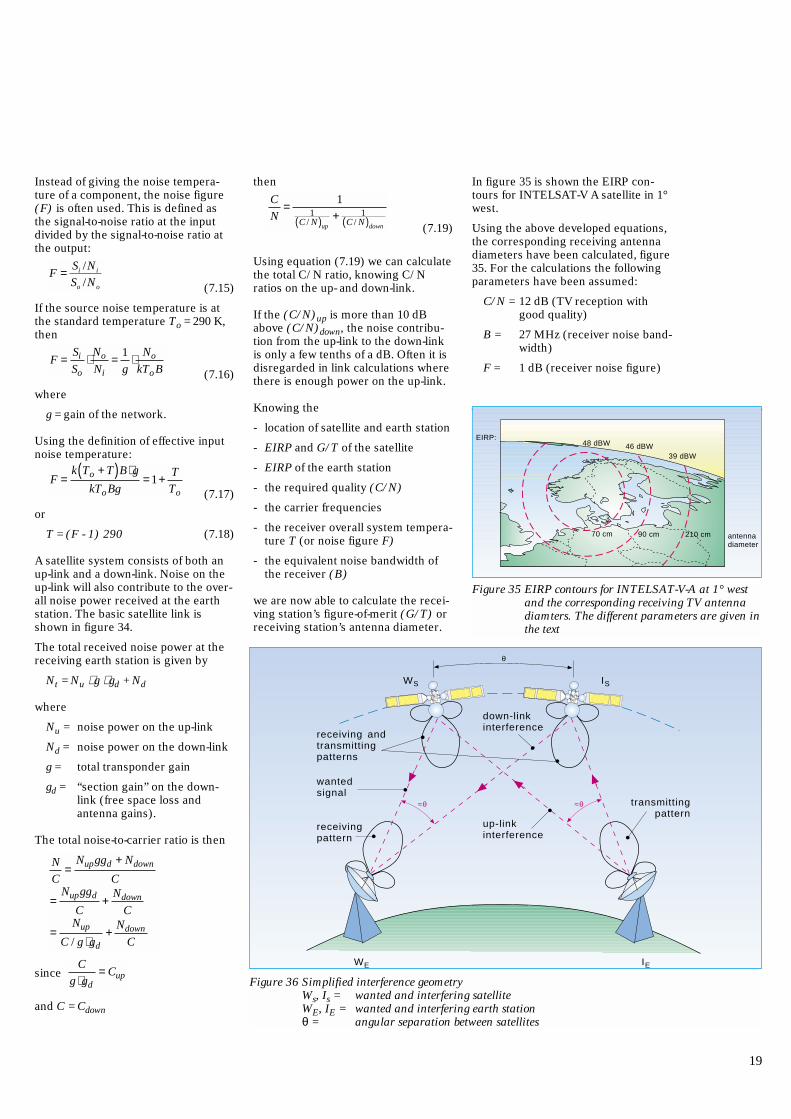
In figure 35 is shown the EIRP con-tours for INTELSAT-V A satellite in 1°west.
Using the above developed equations,the corresponding receiving antennadiameters have been calculated, figure35. For the calculations the followingparameters have been assumed:
C/N = 12 dB (TV reception withgood quality)
B = 27 MHz (receiver noise band-width)
F = 1 dB (receiver noise figure)
19
WS IS
θ
≈θ ≈θ
receiving andtransmittingpatterns
wantedsignal
receivingpattern
down-linkinterference
up-linkinterference
transmittingpattern
WE IE
Figure 36 Simplified interference geometryWs, Is = wanted and interfering satelliteWE, IE = wanted and interfering earth stationθ = angular separation between satellites
Figure 35 EIRP contours for INTELSAT-V-A at 1° westand the corresponding receiving TV antennadiamters. The different parameters are given inthe text
EIRP:
antennadiameter
70 cm 90 cm 210 cm
48 dBW
39 dBW46 dBW
TA = 30 K (antenna temperature,clear sky condition)
L = 0.5 dB (feeder loss)
f = 11.7 GHz (carrier frequency).
Corresponding calculations have beendone for the diameters given in figure31. The noise from the up-link hasbeen disregarded.
In the calculations above we have onlyconsidered additive thermal noise.There are also other sources of degra-dation such as interference from othersatellites and radio links, intermodula-tion from the unlinear transponder,etc. The effect of these sources areoften also treated as additive thermalnoise and the C/I terms should beadded in equation (7.19):
(7.20)
C
N= 1
1C / N( )up
+ 1C / N( )down
+ 1C / I + etc.
Keeping the interference from othersatellites below a certain value will putsevere limits on the minimum diame-ter of the receiving earth station’santenna. Knowing the radiation pat-terns for the satellites and earth sta-tions involved, one can calculate theinterference level. The geometry isshown in figure 36.
In the near future, the interferencefrom other satellites may be the criti-cal factor for the design of earth sta-tion antennas. This is already the casefor certain positions in the geostatio-nary arc over Europe.
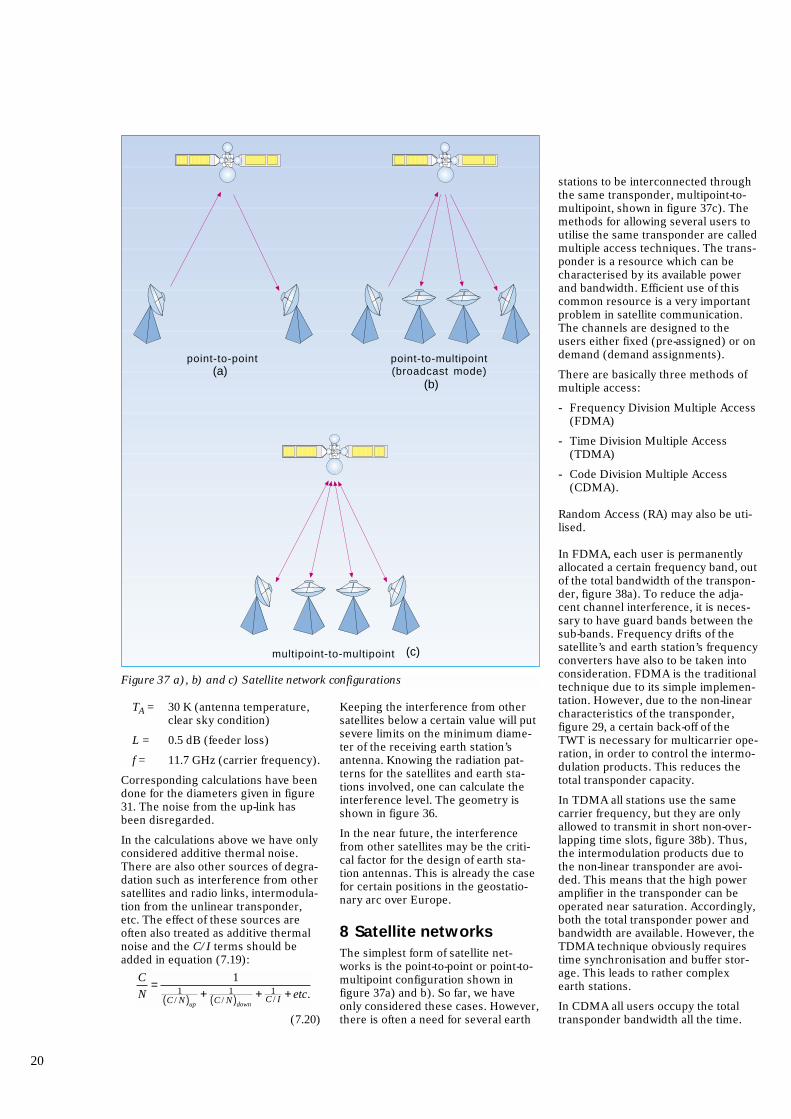
8 Satellite networksThe simplest form of satellite net-works is the point-to-point or point-to-multipoint configuration shown infigure 37a) and b). So far, we haveonly considered these cases. However,there is often a need for several earth
stations to be interconnected throughthe same transponder, multipoint-to-multipoint, shown in figure 37c). Themethods for allowing several users toutilise the same transponder are calledmultiple access techniques. The trans-ponder is a resource which can becharacterised by its available powerand bandwidth. Efficient use of thiscommon resource is a very importantproblem in satellite communication.The channels are designed to theusers either fixed (pre-assigned) or ondemand (demand assignments).
There are basically three methods ofmultiple access:
- Frequency Division Multiple Access(FDMA)
- Time Division Multiple Access(TDMA)
- Code Division Multiple Access(CDMA).
Random Access (RA) may also be uti-lised.
In FDMA, each user is permanentlyallocated a certain frequency band, outof the total bandwidth of the transpon-der, figure 38a). To reduce the adja-cent channel interference, it is neces-sary to have guard bands between thesub-bands. Frequency drifts of thesatellite’s and earth station’s frequencyconverters have also to be taken intoconsideration. FDMA is the traditionaltechnique due to its simple implemen-tation. However, due to the non-linearcharacteristics of the transponder,figure 29, a certain back-off of theTWT is necessary for multicarrier ope-ration, in order to control the intermo-dulation products. This reduces thetotal transponder capacity.
In TDMA all stations use the samecarrier frequency, but they are onlyallowed to transmit in short non-over-lapping time slots, figure 38b). Thus,the intermodulation products due tothe non-linear transponder are avoi-ded. This means that the high poweramplifier in the transponder can beoperated near saturation. Accordingly,both the total transponder power andbandwidth are available. However, theTDMA technique obviously requirestime synchronisation and buffer stor-age. This leads to rather complexearth stations.
In CDMA all users occupy the totaltransponder bandwidth all the time.
20
point-to-point point-to-multipoint(broadcast mode)
multipoint-to-multipoint
Figure 37 a), b) and c) Satellite network configurations
(a)(b)
(c)
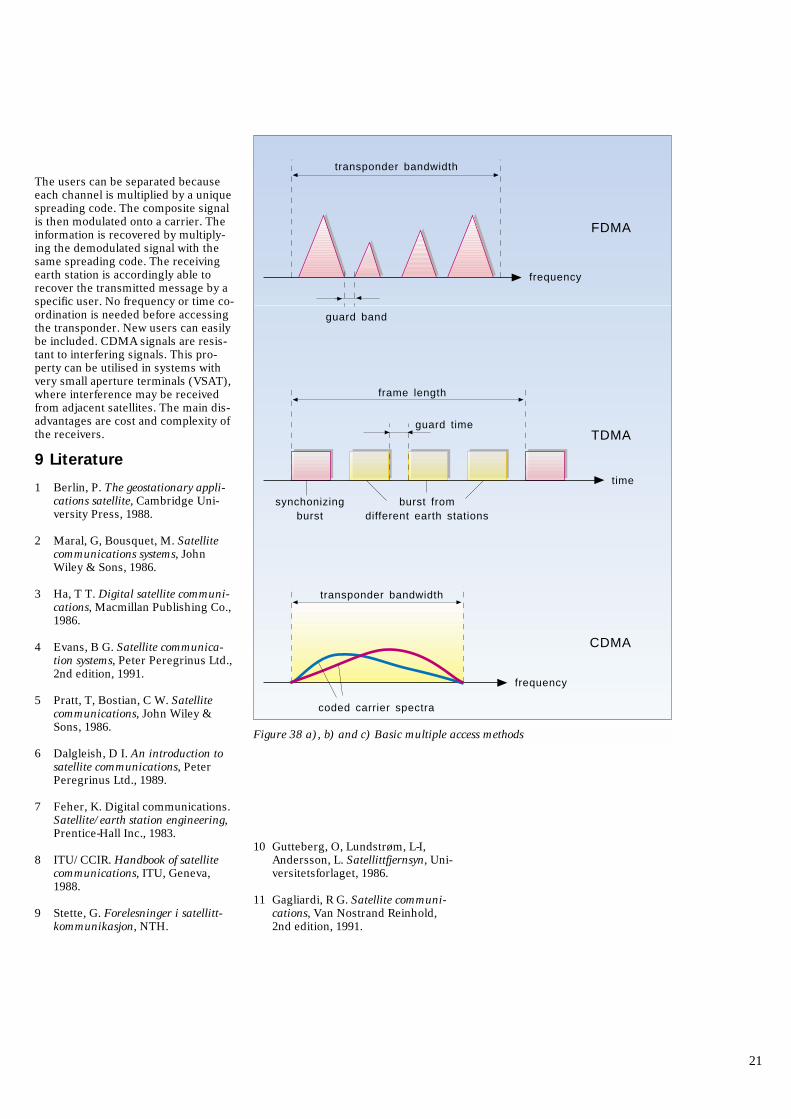
The users can be separated becauseeach channel is multiplied by a uniquespreading code. The composite signalis then modulated onto a carrier. Theinformation is recovered by multiply-ing the demodulated signal with thesame spreading code. The receivingearth station is accordingly able torecover the transmitted message by aspecific user. No frequency or time co-ordination is needed before accessingthe transponder. New users can easilybe included. CDMA signals are resis-tant to interfering signals. This pro-perty can be utilised in systems withvery small aperture terminals (VSAT),where interference may be receivedfrom adjacent satellites. The main dis-advantages are cost and complexity ofthe receivers.
9 Literature
1 Berlin, P. The geostationary appli-cations satellite, Cambridge Uni-versity Press, 1988.
2 Maral, G, Bousquet, M. Satellitecommunications systems, JohnWiley & Sons, 1986.
3 Ha, T T. Digital satellite communi-cations, Macmillan Publishing Co.,1986.
4 Evans, B G. Satellite communica-tion systems, Peter Peregrinus Ltd.,2nd edition, 1991.
5 Pratt, T, Bostian, C W. Satellitecommunications, John Wiley &Sons, 1986.
6 Dalgleish, D I. An introduction tosatellite communications, PeterPeregrinus Ltd., 1989.
7 Feher, K. Digital communications.Satellite/earth station engineering,Prentice-Hall Inc., 1983.
8 ITU/CCIR. Handbook of satellitecommunications, ITU, Geneva,1988.
9 Stette, G. Forelesninger i satellitt-kommunikasjon, NTH.
10 Gutteberg, O, Lundstrøm, L-I,Andersson, L. Satellittfjernsyn, Uni-versitetsforlaget, 1986.
11 Gagliardi, R G. Satellite communi-cations, Van Nostrand Reinhold,2nd edition, 1991.
21
transponder bandwidth
frame length
transponder bandwidth
guard band
frequency
time
frequency
FDMA
TDMA
CDMA
guard time
synchonizingburst
burst fromdifferent earth stations
coded carrier spectra
Figure 38 a), b) and c) Basic multiple access methods
The role of ETSITelecommunications is by nature aninternationally oriented activity, andthere has always been a strong requi-rement for international standardisa-tion. For these purposes some verysuccessful organisations were created,CCITT, Comité Consultatif des Télé-graph et Téléphone, CCIR, ComitéConsultatif des Radio and ITU, TheInternational TelecommunicationsUnion, which forms a part of the Uni-ted Nations system.
The organisations mentioned aboveare global. In addition, a Europeanorganisation was created for post andtelecommunications matters, CEPT,Conference Europeenne des Postes etTélégraphe. Membership of this orga-nisation was limited to the nationalTelecommunications Operators, theTOs.
CEPT carried out standardisationwork in many fields, from postalstamps to the pan-European cellularmobile telephone system, GSM, whichwas named after a special group ofCEPT, Groupe Spécial Mobile. Neit-her manufacturers nor telecommuni-cations users were accepted as mem-bers of this organisation.
With the introduction of data systemsconnected to the telecommunicationssystems it was impossible to keep alltelecommunications activities withinmonopolies. The national networksare in most countries still entrustednational monopolies, whereas specialnetworks, terminal equipment and ser-vices were opened up to competition.
There were now many new players inthe field, and these also wanted tohave a voice in much of the activitiesthat were carried out by CEPT. CEC,the Council of the European Commu-nity, was not too satisfied with thisstate of affairs.
During a fact-finding mission on tele-communications to the United Statesin 1986 it became apparent that tele-communications standards making inEurope had to be substantially reinfor-ced. In 1987 the CEC published itsGreen Paper Telecommunications. Init was floated the idea that a EuropeanTelecommunications Standards Insti-tute (ETSI) had to be created. ETSIshould have participation from manycategories, operators, manufacturers,users, and regulators.In May 1988 theETSI General Assembly met for the
first time, and in July 1988 the firstmeeting of the Technical Assemblywas held.
The structure of ETSIThe main product of ETSI is telecom-munications standards. In addition,where the technology is not mature orstable, and where the need for, orstructure of, a standard is not clear,the issue may be studied by the bodiesof ETSI. In this case the output of thework is an ETR, ETSI TechnicalReport.
Most of the standardisation work iscarried out in one of the twelve Tech-nical Committees, TCs, and in theTechnical Sub Committees, STCs.The TCs are as follows:
NA Network Aspects
BT Business Telecommunications
SPS Signalling, Protocols and Swit-ching
TM Transmission and multiplexing
TE Terminal Equipment
EE Equipment Engineering
RES Radio Equipment and Systems
SMG Special Mobile Group
PS Paging Systems
SES Satellite Earth Stations
ATM Advanced Testing Methods
HF Human Factors
The basis for the work is contributionsfrom the members of the committees,but this is not always sufficient. Thereare also provisions to establish a pro-ject team (PT) to develop a basic docu-ment for further processing in thecommittee system. The PTs can bepaid by ETSI or by external organisati-ons, mostly the CEC and EFTA, theEuropean Free Trade Association.
A PT will usually consist of a smallnumber of members, typically two tothree, who work concentrated on adefined Terms of Reference at theETSI Headquarters in Sophia Antipolisnear Nice.
The structure of ETSsAn ETS (European Telecommunicati-ons Standard) will normally containboth requirements and recommendati-ons. Typically, for a TVRO terminal therequirements should deal with protec-
tion of the environment and cover ele-ments such as:
- mechanical protection of personnel
- electrical safety
- electromagnetic compatibility, i.e.protection of other radio services(terrestrial and satellite), includingEM power emitted by power supply,local oscillator leakage and otherspurious sources.
Recommendations could cover ele-ments which deal with quality
- antenna gain receive patterns
- receive polarisation discrimination
- antenna mechanical capability (poin-ting, polarisation, etc.).
Non-compliance with the recommen-dations will not entail refusal of thetype approval.
The production processfor an ETSThe preparation of a standard can be avery large project. The work is basi-cally done within the STCs, where allETSI members have the opportunityto be represented. It is further basedon voluntary contributions from theparticipants.
The production process up to anapproved European Telecommunica-tions Standard is defined in the Rulesof Procedures of ETSI. The Draft ETSwill be prepared (if necessary by aPT), discussed and agreed in the rele-vant STC, and then submitted forapproval by the TC.
The main steps for the further appro-val process according to the NormalProcedure is as follows:
- Public Enquiry. This will last foranything from 17 to 21 weeks. EachETSI member will then have theopportunity to express their viewson the proposed standard.
- TC Review. The TC will receive thecomments from the Public Enquiry,together with the comments fromthe Standards Management Depart-ment of the ETSI Secretariat. Thereare procedures for resolving dis-agreements among the members ofthe TC, but it is important to notethat the whole work of ETSI isbased on consensus. Consensus ishere defined as the absence of sus-
22
Satellite communications standardisation in EuropeB Y G U N N A R S T E T T E
621.396.946(4)006

tained resistance. If consensus can-not be reached, the minority viewsshall be reported to the TechnicalAssembly.
- Voting. The document, as preparedafter the Public Enquiry, is thensent out for Voting. It is to be notedthat whereas each ETSI memberwill have the opportunity to expresstheir views during the PublicEnquiry, for the Voting processthere is only one vote per country.The vote of each country is weighedas decided by the General Assem-bly.
The results of the Voting process issent to the National Standards Organi-sations, to all the ETSI members andto the relevant TCs and STCs.
There is also a Unified Approval Pro-cedure and an Accelerated UnifiedApproval Procedure, which can beapplied under special circumstances.
ETSs and CTRsETSs are standards, and as suchvoluntary. In the European context wehave a different type of document,CTR, Common Technical Regulations.These are mandatory requirementsthat have to be met for equipment tobe operated within the EC and EFTAcountries.
CTRs are often derived from ETSs, butnot all the components of an ETS arerelevant for a CTR. At the same timethere could also be other require-ments not contained in the ETS thatshould be incorporated in the CTR.
The conversion process from ETS toCTR goes via a Technical Basis forRegulations, TBR, and ETSI is usuallytasked to prepare the TBRs in the rele-vant fields.
As an example, the CEC is now consi-dering TBRs and CTRs to be preparedfor the satellite communications field.As a starting point ETSI has beenrequested to prepare an ETR on thissubject.
TC-SES Technical CommitteeSatellite Earth StationsAt the 4th Technical Assembly of ETSIin Nice, 29 - 30 March 1989, a Techni-cal Committee on Satellite Earth Stati-ons was set up. The basic mission ofthe new TC was to create EuropeanTelecommunications Standards ETSs
in the area defined by its terms of refe-rence, in line with views expressed bythe CEC in its “Green Paper on Satel-lite Communications”:
- to allow significant improvements inthe satellite communications deve-lopment of Europe
- to offer new opportunities to theindustry.
Terms of reference andorganisationThe TC-SES Terms of Reference, asapproved by the ETSI 5th TechnicalAssembly, are as follows:
“The field includes:
- all types of satellite communicationservices and applications, includingmobile
- all types of earth station equipment,especially as concerns Radio Fre-quency Interfaces and Networks
- protocols implemented in earth sta-tions for exchange of information,for connection of network and/oruser terminal equipment, controland monitoring functions.”
The TC-SES is the “primary commit-tee for co-ordinating the position ofETSI on the above aspects, vis-a-visthe standardisation of outside bodies,in particular of International Standardi-sation Organisations (CCIR, CCITT,IEC, etc.) and of the internationalsatellite organisations (EUTELSAT,INTELSAT, INMARSAT).”
The TC-SES is organised in five SubTechnical Committees, STCs:
SES1: General system requirementsfor European satellite networksand earth stations
SES2: Radio Frequency (RF) andIntermediate Frequency (IF)equipment
SES3: Earth Station application/net-work interfaces, and controland monitoring techniques
SES4: Television and sound pro-gramme equipment
SES5: Earth stations for mobile servi-ces
SES2 and SES3 are of “horizontal”nature, i.e. dealing with subjects grou-ped by their technology, whereas
SES1, SES4 and SES5 are of “vertical”nature, dealing with subjects groupedby types of services and/or their sys-tems aspects.
Relations with other organisationsTC-SES is participating actively in thework of CCIR, in particular StudyGroup 4 (Fixed Satellite Services) andTask Group TG 4/2, set to preparerecommendations on VSAT systemsand earth stations.
There is a formalised co-operation be-tween ETSI and the European Broad-casting Union (EBU) on the RF part ofsatellite broadcasting systems andequipment.
TC-SES is actively participating in thework of the new “Ad hoc CCIR/CCITTExperts Group on ISDN/Satellite Mat-ters”, which has been charged withthe revision, on world-wide basis, ofthose CCITT recommendations whichprove to be insufficiently compatiblewith the implementation of satellitelinks in the ISDN.
TC-SES is co-operating with CENE-LEC, the European Committee forElectrotechnical Standards, on TVROterminals, the outdoor unit being theresponsibility of ETSI.
TC-SES Programma ofWorkThe TC-SES part of the present ETSIProgramma of Work is given in theAnnex. It will be noted that the stan-dards are to a large extent based on acompatibility approach with the mainemphasis on preventing interferencebetween different systems.
The Work Programma Items DE/SES-2001 and DE/SES2002 have producedfor Receive Only VSATs and for Trans-mit/Receive VSATs in the 11/14 GHzband as prETS 300 157 and prETS300 158, respectively. These wereapproved by voting in 1992.
Draft standards for the C-band,DE/SES-2004 and DE/SES-2005, havebeen prepared and are ready forPublic Enquiry.
A draft for the ETS for SNG (SatelliteNews Gathering) station, DE/SES-2003, has been prepared by a ProjectTeam, and this is also ready for PublicEnquiry.
23
Standards for control and monitoringof VSAT networks and VSATs, prETS300 161 and prETS 300 160, were alsoapproved by voting in 1992. The inter-connection issues are under prepara-tion by a Project Team.
ETS for TVRO stations for the FSSband was prepared under DE/SES-4001 and is contained in prETS 300158. A similar document for TVROsoperating in the BSS band is ready forVoting.
There are two important continuingactivities. One is to study and monitorradiation limits to/from earth stationequipment. The other one is to moni-tor the compatibility of ISDN ETSswith satellite links.
As mentioned above, standards will bean important element in the prepara-tion of TBRs, Technical Basis forRegulations. The CEC has issued amandate to study and investigate indetail which parts of currently availa-ble standards in the satellite earth sta-tion equipment field match with theessential requirements of the draftSatellite Equipment Directive. TheCTRs shall cover TVROs in FSS andBSS bands, data receive-only, VSATtwo-way, and the mobile low data rateterminals, connected or not connectedto the public telecommunications net-work. All the ETSs mentioned abovewill form a part of this study.
The output of this work, which isentrusted the TC SES, will be an ETR.
Another element of standardisation istest specifications. The creation of theEuropean Single Market of telecom-munications without technical barriersto trade implies harmonised Europeanstandards and a harmonised Europeantesting and certification framework.
The certification authorities and thetesting laboratories in Europe will notbe capable of reaching their objectivesif, among other things, European stan-dards in the area of test specificationsdo not exist.
The CEC has therefore proposed thatETSI through TC SES developETS/ENs for test specifications of theETSs mentioned above for the VSATand TVRO field. The test specifica-tions for VSAT are of global interest.In order to achieve world wide recog-nition of tests performed by differentlaboratories, the CEC has requested
that alignment of the European stan-dards with the global standards cur-rently under development in CCITTshould be ensured.
Case study: Low EarthOrbit (LEO) Communica-tions Satellite Systems
There is a growing interest in thedevelopment and deployment of com-munications systems using satellitesin Low Earth Orbits (LEO), in particu-lar by the US industry. Also, WARC 92has allocated new frequencies formobile satellite systems, also for thesystems using LEO satellites.
The WARC resolved to invite theorgans of the ITU to carry out, as amatter of priority, technical, regulatoryand operational studies to permit theestablishment of standards governingthe low orbit satellite systems so as toensure equitable and standard conditi-ons of access of all countries and toguarantee proper world-wide protec-tion for existing services and systemsin the telecommunication network.
The European Commission has alsotaken an interest in these systems.The CEC is concerned about the situa-tion for European industry, operatorsand users in this area. Following a let-ter from the CEC to the Chairman ofETSI Technical Assembly on stan-dards for such mobile communica-tions systems, the TA decided thatETSI would produce an ETSI Techni-cal Report on the matter. This reportshould try to set down all of the issuesconcerning standardisation, both tech-nical, economical and any other fac-tors.
The issue is now entrusted to TC SES,and it is being studied by a PT . Thestudy should consider some of theproblems raised by the use of the LEOsystems as given below:
- comparative description of the diffe-rent proposed systems
- the role of LEO systems in thefuture telecommunication systems(PCS, FPLMTS)
- protection of other satellite and ter-restrial services
- network access issues and possibi-lity of interworking with public net-works
- compatibility with current terrestrialmobile networks, in particular withthe GSM
- system aspects and network mana-gement issues- the need for Euro-pean standards, and scope andextension of thesestandards.
Future activitiesETSI, as a market oriented organisa-tion, must constantly monitor the needfor new standards within its field. Thepreparation of the work programma isdone within the TCs, where the exper-tise and the contact with the market ispresent.
It is apparent from the TC-SES workplan given in the Annex that it focuseson the “environmental” aspects ofstandardisation, EMC considerations,etc. This approach was agreed at theearly stages of the Committee’s work.One question to be reopened is thepossible need for standards whichinvolve system design. A possible can-didate would be an open 20/30 GHzVSAT standard for Europe, similar tothe GSM standards for cellular sys-tems.
Of increasing importance in the futurewill also be the work on EMC, and oncompatibility between the ISDN stan-dards and satellite links.
24
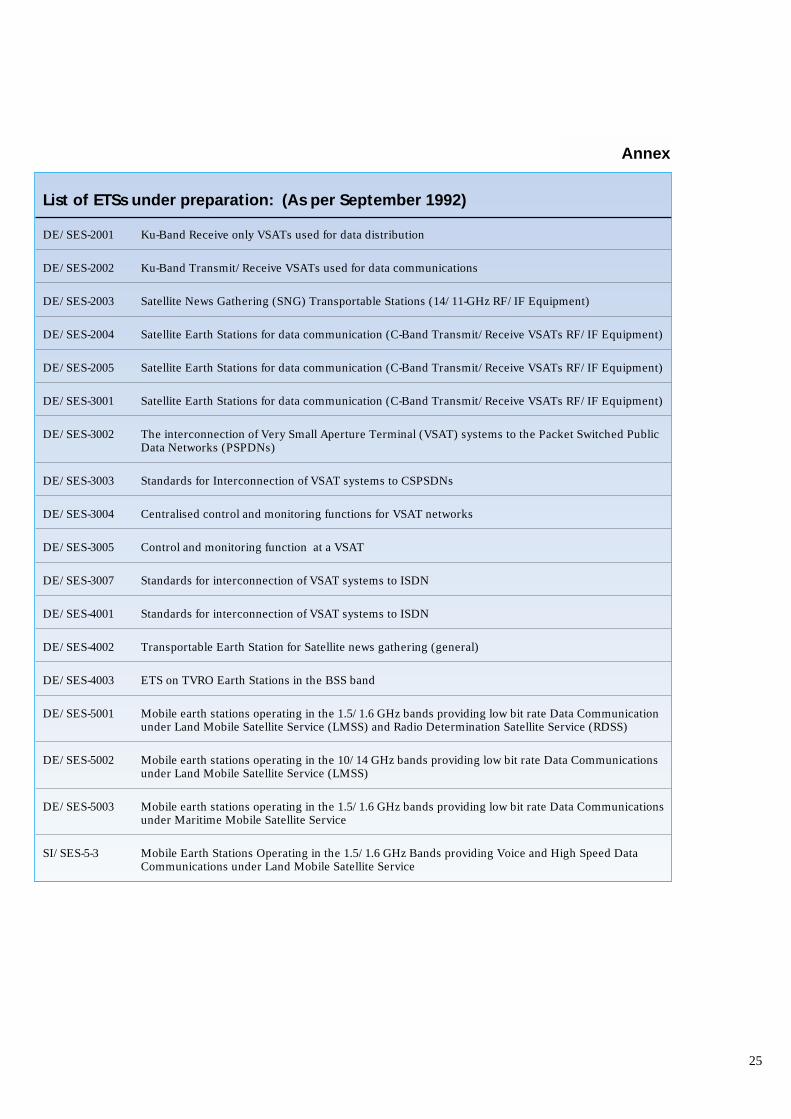
List of ETSs under preparation: (As per September 1992)
DE/SES-2001 Ku-Band Receive only VSATs used for data distribution
DE/SES-2002 Ku-Band Transmit/Receive VSATs used for data communications
DE/SES-2003 Satellite News Gathering (SNG) Transportable Stations (14/11-GHz RF/IF Equipment)
DE/SES-2004 Satellite Earth Stations for data communication (C-Band Transmit/Receive VSATs RF/IF Equipment)
DE/SES-2005 Satellite Earth Stations for data communication (C-Band Transmit/Receive VSATs RF/IF Equipment)
DE/SES-3001 Satellite Earth Stations for data communication (C-Band Transmit/Receive VSATs RF/IF Equipment)
DE/SES-3002 The interconnection of Very Small Aperture Terminal (VSAT) systems to the Packet Switched PublicData Networks (PSPDNs)
DE/SES-3003 Standards for Interconnection of VSAT systems to CSPSDNs
DE/SES-3004 Centralised control and monitoring functions for VSAT networks
DE/SES-3005 Control and monitoring function at a VSAT
DE/SES-3007 Standards for interconnection of VSAT systems to ISDN
DE/SES-4001 Standards for interconnection of VSAT systems to ISDN
DE/SES-4002 Transportable Earth Station for Satellite news gathering (general)
DE/SES-4003 ETS on TVRO Earth Stations in the BSS band
DE/SES-5001 Mobile earth stations operating in the 1.5/1.6 GHz bands providing low bit rate Data Communicationunder Land Mobile Satellite Service (LMSS) and Radio Determination Satellite Service (RDSS)
DE/SES-5002 Mobile earth stations operating in the 10/14 GHz bands providing low bit rate Data Communicationsunder Land Mobile Satellite Service (LMSS)
DE/SES-5003 Mobile earth stations operating in the 1.5/1.6 GHz bands providing low bit rate Data Communicationsunder Maritime Mobile Satellite Service
SI/SES-5-3 Mobile Earth Stations Operating in the 1.5/1.6 GHz Bands providing Voice and High Speed DataCommunications under Land Mobile Satellite Service
25
Annex
Introduction
Norway draws greater benefits fromits space activities than most othercountries. Our geography as well asour maritime activities imply that wehave extensive requirements for com-munication, navigation and earthobservation services. These require-ments are being met to an increasingextent by satellite-based systems.Satellites are also essential in meetingthe demand for comprehensive moni-toring of the global environment.
These user requirements encouragethe development and manufacture ofhigh-technology products and servi-ces. For this reason, our nationalefforts in space activities are of vitalimportance. Such efforts will enable usto exploit the results for industrialgrowth and development of the natio-nal infrastructure, and thus help us tofulfil national goals for economicgrowth and employment. These activi-ties are also of decisive importance forour space research, and they areimportant means of serving our for-eign policy interests.
Norway’s efforts in space are thusbased on user oriented, scientific,industrial and political considerations.
The main objectives for Norwegianspace activities by the year 2000 are toestablish:
- Norwegian industry and otherspace-based business, with an ave-rage rate of growth in national andinternational markets of at least 15 %per annum
- A leading international position inthose industrial areas that havebeen given priority
- Considerable industrial growth innew areas, based on public-sectorR&D efforts in space activities
- Cost-effective space-based systemsthat meet national user require-ments
- A leading international position inthose areas of basic science thathave been given priority
- A leading European position inthose aspects of ground infrastruc-ture for which we have natural geo-graphical or other advantages.
Funding, general strate-gies and main prioritiesThese national objectives have beenestablished by the Norwegian SpaceCentre which has a key responsibility
in initiating, supporting and co-ordina-ting space projects and programmes.Around 55 % of the USD 60 M publicsector funding of Norwegian spaceactivities in 1992 is over the SpaceCentre budget, figure 1. In particularour participation in the EuropeanSpace Agency (ESA), represents amajor part of our space programme.
The Space Centre responsibilitiesinclude:
- Preparing long term plans for Nor-wegian space activities
- Contributing to the development,co-ordination and evaluation of Nor-wegian Space activities
- Planning, funding and following upNorwegian participation in ESA pro-grammes
- Planning, funding and following upnational programmes for the deve-lopment of industrial products, ser-vices and capabilities, for bilateralco-operation and for the develop-ment of applications of earth obser-vation
- Supporting and operating theAndøya Rocket Range and theTromsø Satellite Station.
26
A review of Norwegian space activitiesB Y G E O R G R O S E N B E R G
AbstractNorway has been a full member of the European Space Agency (ESA) since 1987. This membership is used as an effective toolin strengthening and developing Norwegian industry as well as in covering Norwegian space science and user requirements.The Norwegian Space Centre has a key role in this process.
The Space Centre consists of three units:- The head office in Oslo acting as a strategic unit in charge of plans and programmes
- Andøya Rocket Range and Tromsø Satellite Station working as operational units with main emphasis in the space scienceand earth observation areas, respectively.
Six basic activity areas have been identified:- Space science, following up and extending Norwegian traditions in cosmic geophysics and astrophysics through participation
in ESA’s science programme and through the use of sounding rockets and balloons.
- Ground infrastructure, such as Andøya Rocket Range and Tromsø Satellite Station, utilising Norway’s northern location andother advantages. Facilities in the Svalbard area could be of importance in the future.
- Satellite Communications is mainly commercial and is by far the largest sector with a large contribution of Inmarsat relatedproducts and services.
- Satellite navigation and related services in particular based on differential GPS, are also commercialised and are growingrapidly.
- Earth observation with emphasis on near real time services based on radar observations, particularly SAR, is being developedfor maritime surveillance and environmental monitoring. The launch and operation of ERS-1 has been an important step inthis direction.
- Industrial development based on ESA’s programmes for space transportation and space station and with spin-offs to themarine and offshore sectors.
The total turnover of space related products and services from these areas in Norway is growing rapidly and reached a total ofUSD 290 M in 1992.
629.78(481)
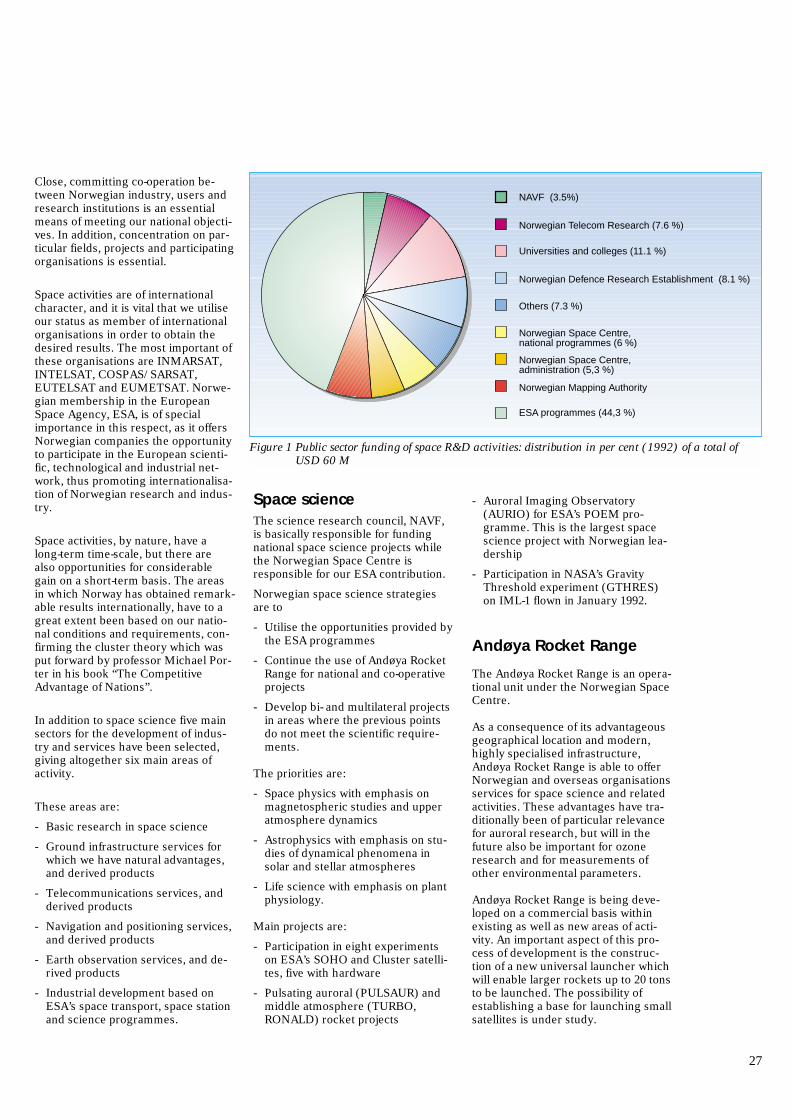
Close, committing co-operation be-tween Norwegian industry, users andresearch institutions is an essentialmeans of meeting our national objecti-ves. In addition, concentration on par-ticular fields, projects and participatingorganisations is essential.
Space activities are of internationalcharacter, and it is vital that we utiliseour status as member of internationalorganisations in order to obtain thedesired results. The most important ofthese organisations are INMARSAT,INTELSAT, COSPAS/SARSAT,EUTELSAT and EUMETSAT. Norwe-gian membership in the EuropeanSpace Agency, ESA, is of specialimportance in this respect, as it offersNorwegian companies the opportunityto participate in the European scienti-fic, technological and industrial net-work, thus promoting internationalisa-tion of Norwegian research and indus-try.
Space activities, by nature, have along-term time-scale, but there arealso opportunities for considerablegain on a short-term basis. The areasin which Norway has obtained remark-able results internationally, have to agreat extent been based on our natio-nal conditions and requirements, con-firming the cluster theory which wasput forward by professor Michael Por-ter in his book “The CompetitiveAdvantage of Nations”.
In addition to space science five mainsectors for the development of indus-try and services have been selected,giving altogether six main areas ofactivity.
These areas are:
- Basic research in space science
- Ground infrastructure services forwhich we have natural advantages,and derived products
- Telecommunications services, andderived products
- Navigation and positioning services,and derived products
- Earth observation services, and de-rived products
- Industrial development based onESA’s space transport, space stationand science programmes.
Space scienceThe science research council, NAVF,is basically responsible for fundingnational space science projects whilethe Norwegian Space Centre isresponsible for our ESA contribution.
Norwegian space science strategiesare to
- Utilise the opportunities provided bythe ESA programmes
- Continue the use of Andøya RocketRange for national and co-operativeprojects
- Develop bi- and multilateral projectsin areas where the previous pointsdo not meet the scientific require-ments.
The priorities are:
- Space physics with emphasis onmagnetospheric studies and upperatmosphere dynamics
- Astrophysics with emphasis on stu-dies of dynamical phenomena insolar and stellar atmospheres
- Life science with emphasis on plantphysiology.
Main projects are:
- Participation in eight experimentson ESA’s SOHO and Cluster satelli-tes, five with hardware
- Pulsating auroral (PULSAUR) andmiddle atmosphere (TURBO,RONALD) rocket projects
- Auroral Imaging Observatory(AURIO) for ESA’s POEM pro-gramme. This is the largest spacescience project with Norwegian lea-dership
- Participation in NASA’s GravityThreshold experiment (GTHRES)on IML-1 flown in January 1992.
Andøya Rocket Range
The Andøya Rocket Range is an opera-tional unit under the Norwegian SpaceCentre.
As a consequence of its advantageousgeographical location and modern,highly specialised infrastructure,Andøya Rocket Range is able to offerNorwegian and overseas organisationsservices for space science and relatedactivities. These advantages have tra-ditionally been of particular relevancefor auroral research, but will in thefuture also be important for ozoneresearch and for measurements ofother environmental parameters.
Andøya Rocket Range is being deve-loped on a commercial basis withinexisting as well as new areas of acti-vity. An important aspect of this pro-cess of development is the construc-tion of a new universal launcher whichwill enable larger rockets up to 20 tonsto be launched. The possibility ofestablishing a base for launching smallsatellites is under study.
27
NAVF (3.5%)
Norwegian Telecom Research (7.6 %)
Universities and colleges (11.1 %)
Norwegian Defence Research Establishment (8.1 %)
Others (7.3 %)
Norwegian Space Centre,national programmes (6 %)
Norwegian Space Centre,administration (5,3 %)
Norwegian Mapping Authority
ESA programmes (44,3 %)
Figure 1 Public sector funding of space R&D activities: distribution in per cent (1992) of a total ofUSD 60 M
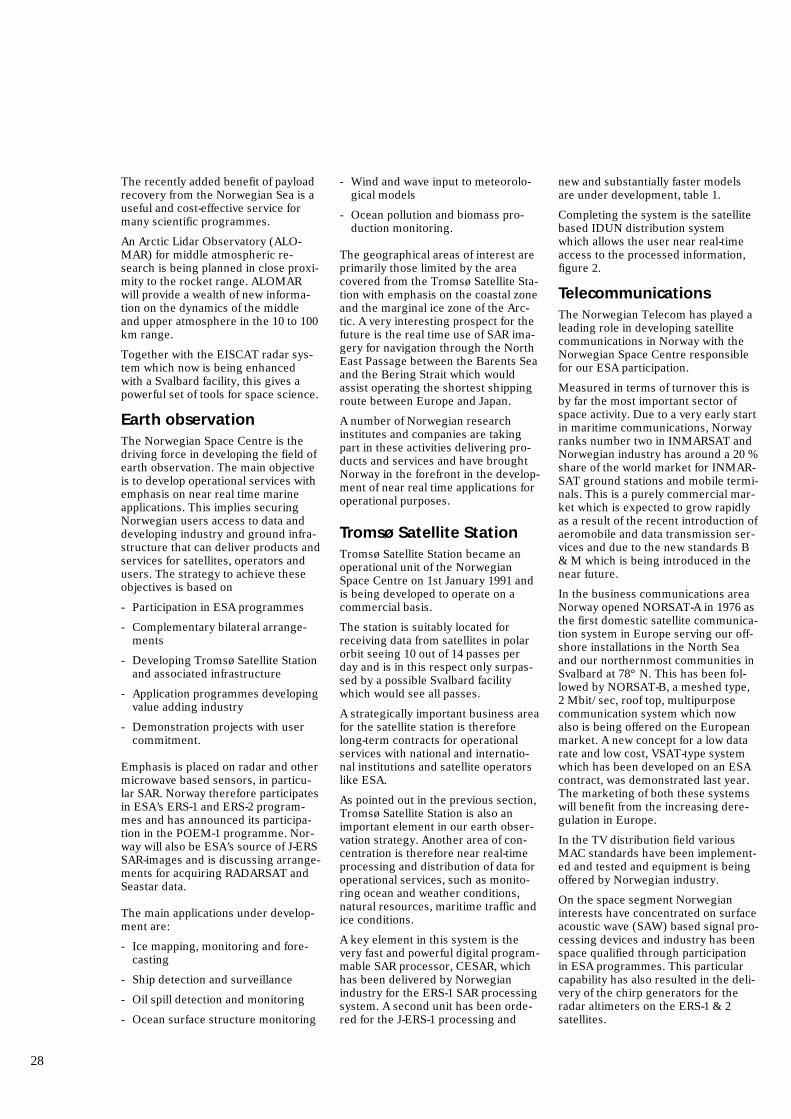
The recently added benefit of payloadrecovery from the Norwegian Sea is auseful and cost-effective service formany scientific programmes.
An Arctic Lidar Observatory (ALO-MAR) for middle atmospheric re-search is being planned in close proxi-mity to the rocket range. ALOMARwill provide a wealth of new informa-tion on the dynamics of the middleand upper atmosphere in the 10 to 100km range.
Together with the EISCAT radar sys-tem which now is being enhancedwith a Svalbard facility, this gives apowerful set of tools for space science.
Earth observationThe Norwegian Space Centre is thedriving force in developing the field ofearth observation. The main objectiveis to develop operational services withemphasis on near real time marineapplications. This implies securingNorwegian users access to data anddeveloping industry and ground infra-structure that can deliver products andservices for satellites, operators andusers. The strategy to achieve theseobjectives is based on
- Participation in ESA programmes
- Complementary bilateral arrange-ments
- Developing Tromsø Satellite Stationand associated infrastructure
- Application programmes developingvalue adding industry
- Demonstration projects with usercommitment.
Emphasis is placed on radar and othermicrowave based sensors, in particu-lar SAR. Norway therefore participatesin ESA’s ERS-1 and ERS-2 program-mes and has announced its participa-tion in the POEM-1 programme. Nor-way will also be ESA’s source of J-ERSSAR-images and is discussing arrange-ments for acquiring RADARSAT andSeastar data.
The main applications under develop-ment are:
- Ice mapping, monitoring and fore-casting
- Ship detection and surveillance
- Oil spill detection and monitoring
- Ocean surface structure monitoring
- Wind and wave input to meteorolo-gical models
- Ocean pollution and biomass pro-duction monitoring.
The geographical areas of interest areprimarily those limited by the areacovered from the Tromsø Satellite Sta-tion with emphasis on the coastal zoneand the marginal ice zone of the Arc-tic. A very interesting prospect for thefuture is the real time use of SAR ima-gery for navigation through the NorthEast Passage between the Barents Seaand the Bering Strait which wouldassist operating the shortest shippingroute between Europe and Japan.
A number of Norwegian researchinstitutes and companies are takingpart in these activities delivering pro-ducts and services and have broughtNorway in the forefront in the develop-ment of near real time applications foroperational purposes.
Tromsø Satellite StationTromsø Satellite Station became anoperational unit of the NorwegianSpace Centre on 1st January 1991 andis being developed to operate on acommercial basis.
The station is suitably located forreceiving data from satellites in polarorbit seeing 10 out of 14 passes perday and is in this respect only surpas-sed by a possible Svalbard facilitywhich would see all passes.
A strategically important business areafor the satellite station is thereforelong-term contracts for operationalservices with national and internatio-nal institutions and satellite operatorslike ESA.
As pointed out in the previous section,Tromsø Satellite Station is also animportant element in our earth obser-vation strategy. Another area of con-centration is therefore near real-timeprocessing and distribution of data foroperational services, such as monito-ring ocean and weather conditions,natural resources, maritime traffic andice conditions.
A key element in this system is thevery fast and powerful digital program-mable SAR processor, CESAR, whichhas been delivered by Norwegianindustry for the ERS-1 SAR processingsystem. A second unit has been orde-red for the J-ERS-1 processing and
new and substantially faster modelsare under development, table 1.
Completing the system is the satellitebased IDUN distribution systemwhich allows the user near real-timeaccess to the processed information,figure 2.
TelecommunicationsThe Norwegian Telecom has played aleading role in developing satellitecommunications in Norway with theNorwegian Space Centre responsiblefor our ESA participation.
Measured in terms of turnover this isby far the most important sector ofspace activity. Due to a very early startin maritime communications, Norwayranks number two in INMARSAT andNorwegian industry has around a 20 %share of the world market for INMAR-SAT ground stations and mobile termi-nals. This is a purely commercial mar-ket which is expected to grow rapidlyas a result of the recent introduction ofaeromobile and data transmission ser-vices and due to the new standards B& M which is being introduced in thenear future.
In the business communications areaNorway opened NORSAT-A in 1976 asthe first domestic satellite communica-tion system in Europe serving our off-shore installations in the North Seaand our northernmost communities inSvalbard at 78° N. This has been fol-lowed by NORSAT-B, a meshed type,2 Mbit/sec, roof top, multipurposecommunication system which nowalso is being offered on the Europeanmarket. A new concept for a low datarate and low cost, VSAT-type systemwhich has been developed on an ESAcontract, was demonstrated last year.The marketing of both these systemswill benefit from the increasing dere-gulation in Europe.
In the TV distribution field variousMAC standards have been implement-ed and tested and equipment is beingoffered by Norwegian industry.
On the space segment Norwegianinterests have concentrated on surfaceacoustic wave (SAW) based signal pro-cessing devices and industry has beenspace qualified through participationin ESA programmes. This particularcapability has also resulted in the deli-very of the chirp generators for theradar altimeters on the ERS-1 & 2satellites.
28
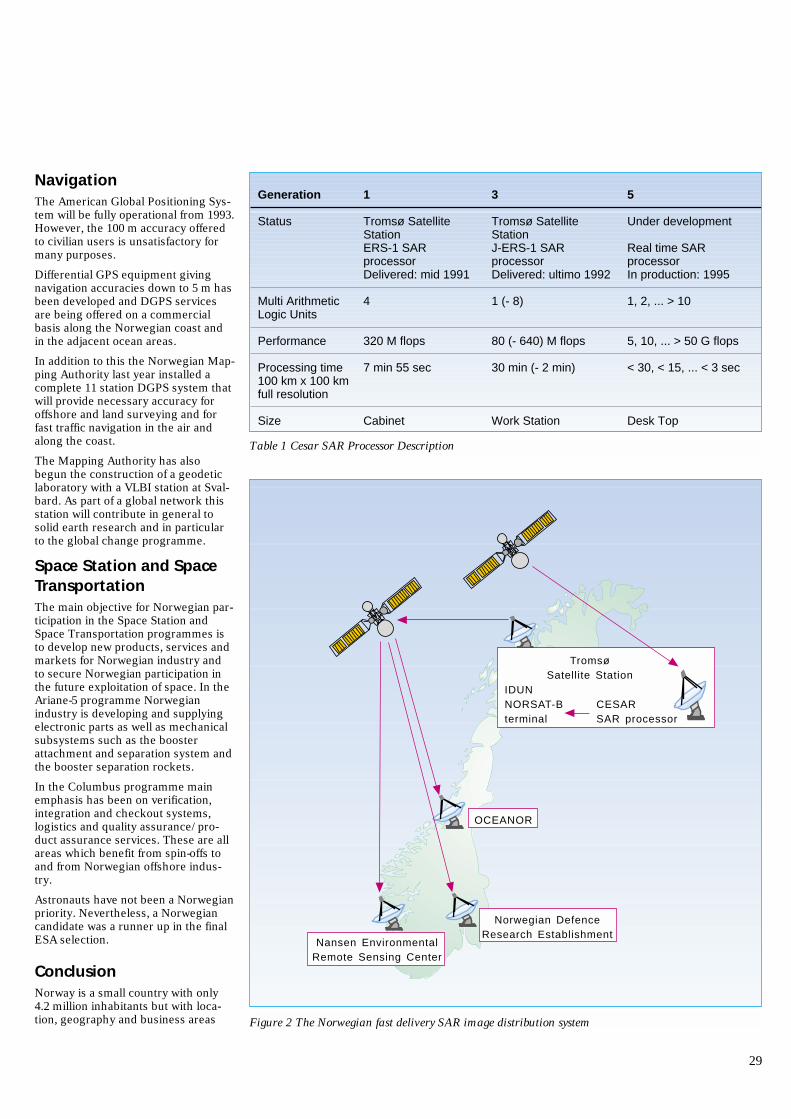
NavigationThe American Global Positioning Sys-tem will be fully operational from 1993.However, the 100 m accuracy offeredto civilian users is unsatisfactory formany purposes.
Differential GPS equipment givingnavigation accuracies down to 5 m hasbeen developed and DGPS servicesare being offered on a commercialbasis along the Norwegian coast andin the adjacent ocean areas.
In addition to this the Norwegian Map-ping Authority last year installed acomplete 11 station DGPS system thatwill provide necessary accuracy foroffshore and land surveying and forfast traffic navigation in the air andalong the coast.
The Mapping Authority has alsobegun the construction of a geodeticlaboratory with a VLBI station at Sval-bard. As part of a global network thisstation will contribute in general tosolid earth research and in particularto the global change programme.
Space Station and SpaceTransportationThe main objective for Norwegian par-ticipation in the Space Station andSpace Transportation programmes isto develop new products, services andmarkets for Norwegian industry andto secure Norwegian participation inthe future exploitation of space. In theAriane-5 programme Norwegianindustry is developing and supplyingelectronic parts as well as mechanicalsubsystems such as the boosterattachment and separation system andthe booster separation rockets.
In the Columbus programme mainemphasis has been on verification,integration and checkout systems,logistics and quality assurance/pro-duct assurance services. These are allareas which benefit from spin-offs toand from Norwegian offshore indus-try.
Astronauts have not been a Norwegianpriority. Nevertheless, a Norwegiancandidate was a runner up in the finalESA selection.
ConclusionNorway is a small country with only4.2 million inhabitants but with loca-tion, geography and business areas
29
Generation 1 3 5
Status Tromsø Satellite Tromsø Satellite Under developmentStation StationERS-1 SAR J-ERS-1 SAR Real time SARprocessor processor processorDelivered: mid 1991 Delivered: ultimo 1992 In production: 1995
Multi Arithmetic 4 1 (- 8) 1, 2, ... > 10Logic Units
Performance 320 M flops 80 (- 640) M flops 5, 10, ... > 50 G flops
Processing time 7 min 55 sec 30 min (- 2 min) < 30, < 15, ... < 3 sec100 km x 100 kmfull resolution
Size Cabinet Work Station Desk Top
TromsøSatellite Station
IDUNNORSAT-Bterminal
CESARSAR processor
Nansen EnvironmentalRemote Sensing Center
Norwegian DefenceResearch Establishment
OCEANOR
Figure 2 The Norwegian fast delivery SAR image distribution system
Table 1 Cesar SAR Processor Description
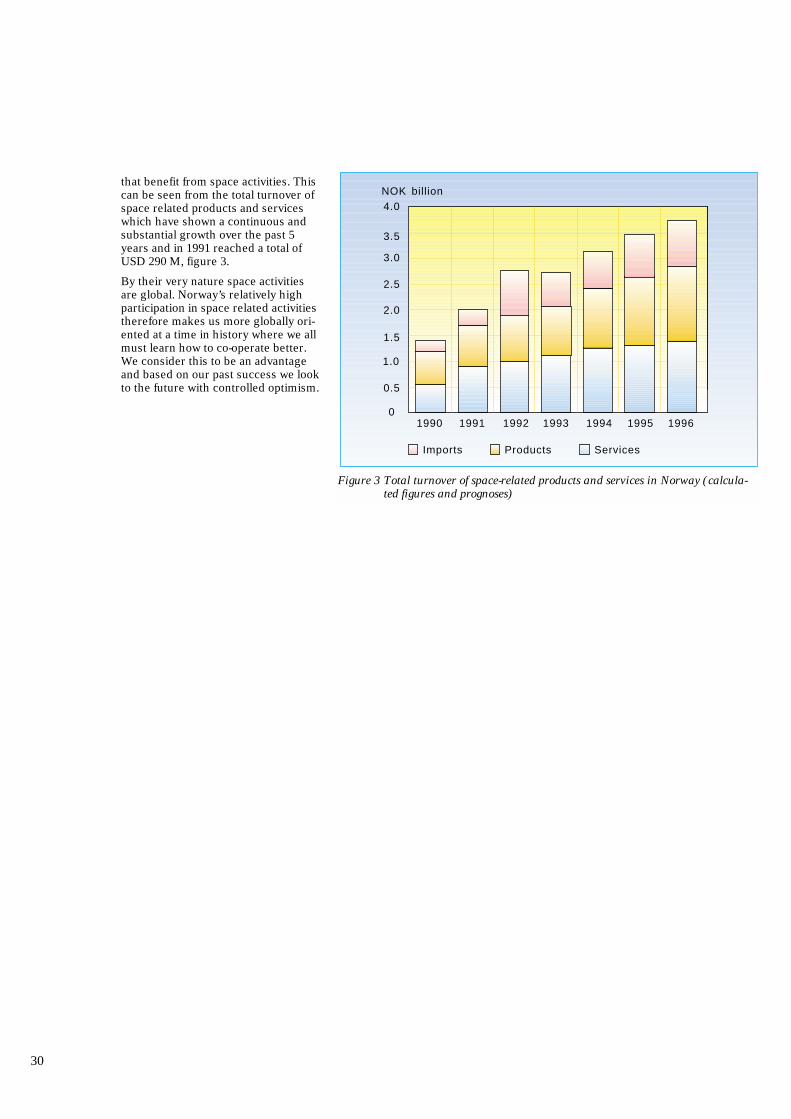
that benefit from space activities. Thiscan be seen from the total turnover ofspace related products and serviceswhich have shown a continuous andsubstantial growth over the past 5years and in 1991 reached a total ofUSD 290 M, figure 3.
By their very nature space activitiesare global. Norway’s relatively highparticipation in space related activitiestherefore makes us more globally ori-ented at a time in history where we allmust learn how to co-operate better.We consider this to be an advantageand based on our past success we lookto the future with controlled optimism.
30
1990
3.5
3.0
2.5
2.0
1.5
1.0
0.5
0
NOK billion
Imports Products Services
1991 1992 1993 1994 1995 1996
4.0
Figure 3 Total turnover of space-related products and services in Norway (calcula-ted figures and prognoses)
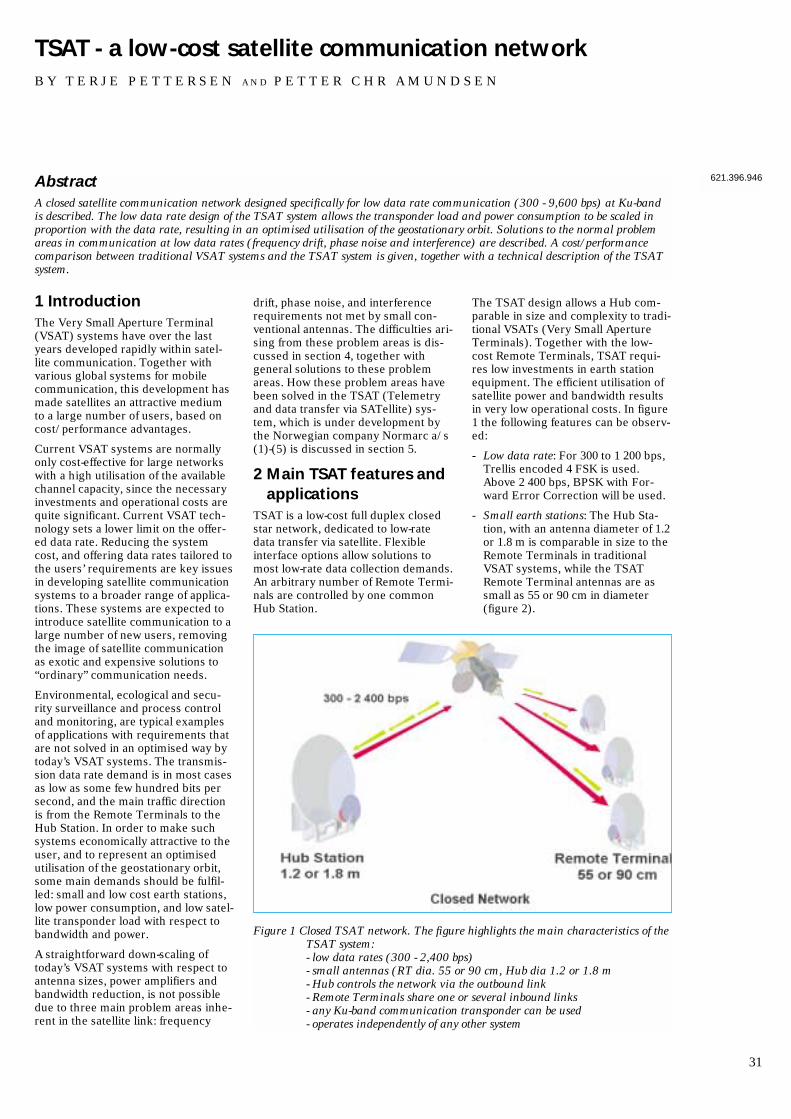
1 IntroductionThe Very Small Aperture Terminal(VSAT) systems have over the lastyears developed rapidly within satel-lite communication. Together withvarious global systems for mobilecommunication, this development hasmade satellites an attractive mediumto a large number of users, based oncost/performance advantages.
Current VSAT systems are normallyonly cost-effective for large networkswith a high utilisation of the availablechannel capacity, since the necessaryinvestments and operational costs arequite significant. Current VSAT tech-nology sets a lower limit on the offer-ed data rate. Reducing the systemcost, and offering data rates tailored tothe users’ requirements are key issuesin developing satellite communicationsystems to a broader range of applica-tions. These systems are expected tointroduce satellite communication to alarge number of new users, removingthe image of satellite communicationas exotic and expensive solutions to“ordinary” communication needs.
Environmental, ecological and secu-rity surveillance and process controland monitoring, are typical examplesof applications with requirements thatare not solved in an optimised way bytoday’s VSAT systems. The transmis-sion data rate demand is in most casesas low as some few hundred bits persecond, and the main traffic directionis from the Remote Terminals to theHub Station. In order to make suchsystems economically attractive to theuser, and to represent an optimisedutilisation of the geostationary orbit,some main demands should be fulfil-led: small and low cost earth stations,low power consumption, and low satel-lite transponder load with respect tobandwidth and power.
A straightforward down-scaling oftoday’s VSAT systems with respect toantenna sizes, power amplifiers andbandwidth reduction, is not possibledue to three main problem areas inhe-rent in the satellite link: frequency
drift, phase noise, and interferencerequirements not met by small con-ventional antennas. The difficulties ari-sing from these problem areas is dis-cussed in section 4, together withgeneral solutions to these problemareas. How these problem areas havebeen solved in the TSAT (Telemetryand data transfer via SATellite) sys-tem, which is under development bythe Norwegian company Normarc a/s(1)-(5) is discussed in section 5.
2 Main TSAT features andapplications
TSAT is a low-cost full duplex closedstar network, dedicated to low-ratedata transfer via satellite. Flexibleinterface options allow solutions tomost low-rate data collection demands.An arbitrary number of Remote Termi-nals are controlled by one commonHub Station.
The TSAT design allows a Hub com-parable in size and complexity to tradi-tional VSATs (Very Small ApertureTerminals). Together with the low-cost Remote Terminals, TSAT requi-res low investments in earth stationequipment. The efficient utilisation ofsatellite power and bandwidth resultsin very low operational costs. In figure1 the following features can be observ-ed:
- Low data rate: For 300 to 1 200 bps,Trellis encoded 4 FSK is used.Above 2 400 bps, BPSK with For-ward Error Correction will be used.
- Small earth stations: The Hub Sta-tion, with an antenna diameter of 1.2or 1.8 m is comparable in size to theRemote Terminals in traditionalVSAT systems, while the TSATRemote Terminal antennas are assmall as 55 or 90 cm in diameter(figure 2).
31
TSAT - a low-cost satellite communication networkB Y T E R J E P E T T E R S E N A N D P E T T E R C H R A M U N D S E N
AbstractA closed satellite communication network designed specifically for low data rate communication (300 - 9,600 bps) at Ku-bandis described. The low data rate design of the TSAT system allows the transponder load and power consumption to be scaled inproportion with the data rate, resulting in an optimised utilisation of the geostationary orbit. Solutions to the normal problemareas in communication at low data rates (frequency drift, phase noise and interference) are described. A cost/performancecomparison between traditional VSAT systems and the TSAT system is given, together with a technical description of the TSATsystem.
621.396.946
Figure 1 Closed TSAT network. The figure highlights the main characteristics of theTSAT system:- low data rates (300 - 2,400 bps)- small antennas (RT dia. 55 or 90 cm, Hub dia 1.2 or 1.8 m- Hub controls the network via the outbound link- Remote Terminals share one or several inbound links- any Ku-band communication transponder can be used- operates independently of any other system
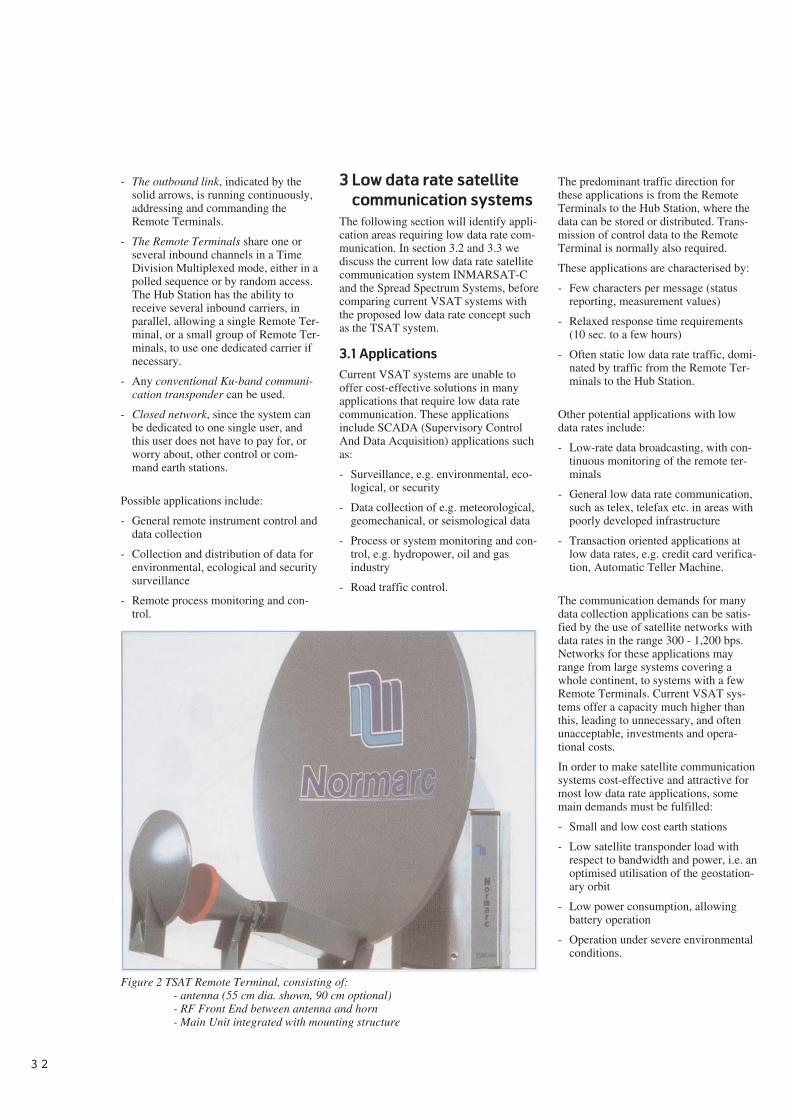
- The outbound link, indicated by thesolid arrows, is running continuously,addressing and commanding theRemote Terminals.
- The Remote Terminals share one orseveral inbound channels in a TimeDivision Multiplexed mode, either in apolled sequence or by random access.The Hub Station has the ability toreceive several inbound carriers, inparallel, allowing a single Remote Ter-minal, or a small group of Remote Ter-minals, to use one dedicated carrier ifnecessary.
- Any conventional Ku-band communi-cation transponder can be used.
- Closed network, since the system canbe dedicated to one single user, andthis user does not have to pay for, orworry about, other control or com-mand earth stations.
Possible applications include:
- General remote instrument control anddata collection
- Collection and distribution of data forenvironmental, ecological and securitysurveillance
- Remote process monitoring and con-trol.
3 Low data rate satellite
communication systems
The following section will identify appli-cation areas requiring low data rate com-munication. In section 3.2 and 3.3 wediscuss the current low data rate satellitecommunication system INMARSAT-Cand the Spread Spectrum Systems, beforecomparing current VSAT systems withthe proposed low data rate concept suchas the TSAT system.
3.1 Applications
Current VSAT systems are unable tooffer cost-effective solutions in manyapplications that require low data ratecommunication. These applicationsinclude SCADA (Supervisory ControlAnd Data Acquisition) applications suchas:
- Surveillance, e.g. environmental, eco-logical, or security
- Data collection of e.g. meteorological,geomechanical, or seismological data
- Process or system monitoring and con-trol, e.g. hydropower, oil and gasindustry
- Road traffic control.
The predominant traffic direction forthese applications is from the RemoteTerminals to the Hub Station, where thedata can be stored or distributed. Trans-mission of control data to the RemoteTerminal is normally also required.
These applications are characterised by:
- Few characters per message (statusreporting, measurement values)
- Relaxed response time requirements(10 sec. to a few hours)
- Often static low data rate traffic, domi-nated by traffic from the Remote Ter-minals to the Hub Station.
Other potential applications with lowdata rates include:
- Low-rate data broadcasting, with con-tinuous monitoring of the remote ter-minals
- General low data rate communication,such as telex, telefax etc. in areas withpoorly developed infrastructure
- Transaction oriented applications atlow data rates, e.g. credit card verifica-tion, Automatic Teller Machine.
The communication demands for manydata collection applications can be satis-fied by the use of satellite networks withdata rates in the range 300 - 1,200 bps.Networks for these applications mayrange from large systems covering awhole continent, to systems with a fewRemote Terminals. Current VSAT sys-tems offer a capacity much higher thanthis, leading to unnecessary, and oftenunacceptable, investments and opera-tional costs.
In order to make satellite communicationsystems cost-effective and attractive formost low data rate applications, somemain demands must be fulfilled:
- Small and low cost earth stations
- Low satellite transponder load withrespect to bandwidth and power, i.e. anoptimised utilisation of the geostation-ary orbit
- Low power consumption, allowingbattery operation
- Operation under severe environmentalconditions.
3 2
Figure 2 TSAT Remote Terminal, consisting of:- antenna (55 cm dia. shown, 90 cm optional)- RF Front End between antenna and horn- Main Unit integrated with mounting structure

Before comparing traditional VSATsystems to low data rate systems,some comments will be given regar-ding existing global systems operatingat low data rates, using INMARSAT-Cas an example, and we also makesome comments on the Spread Spec-trum systems which traditionally haveoffered solutions to the problem areasrelated with low data rate satellitecommunication.
3.2 INMARSAT-C
INMARSAT-C is a global mobile com-munication system operating at L-band, offering data communication at600 bps. The INMARSAT-C terminalsare relatively low-cost, and can oftenwithstand severe weather conditions.However, the INMARSAT-C conceptas a global system requires the use ofcomplex control stations leading to arelatively expensive data transmission.A dedicated VSAT low data rate net-work can therefore compete cost-effec-tively even at low traffic levels.
3.3 Spread spectrum systems
Spread spectrum techniques allowsimple solutions to the problem areasfor low data rate satellite communica-tion mentioned above (6). In these sys-tems, the data is spread over a largefrequency band with a low power den-sity. The total transmitted and recei-ved power is, however, approximatelythe same as in conventional modula-tion schemes. Some current low datarate VSAT systems utilising spreadspectrum with code division multipleaccess (CDMA) have been developed,such as Qualcomm’s “Omnitrack”, andthe eSAT system which is under deve-lopment by Schrack, Austria andSpace Engineering, Italy.
Spread spectrum systems can be cost-effective for a large number of RemoteTerminals with a relatively high utilisa-tion of the available network capacity.An optimum use of the geostationaryorbit for medium and small systems isimpossible, due to the extensive use ofbandwidth inherently required byspread spectrum techniques.
3.4 Comparison between tradi-tional VSATs and TSAT
In table 1, some main characteristicsfor an optimised low data rate collec-tion system such as the TSAT system,are compared with a traditional VSATdata distribution star network. A con-
ventional Ku-band satellite transpon-der is assumed.
In traditional VSAT systems, the pre-dominant message direction is fromthe Hub to the RT. The transponderload for the outbound link is thereforesignificant due to the high data rateand the relatively small RT antennadiameter. This implies that a largenumbers of VSATs must share thesame outbound carrier, in order tobring the space segment cost down toreasonable levels compared with theearth station costs. The low data ratesystem on the other hand, requires avery small fraction of the transpondercapacity. With a small Hub, compar-able to a traditional VSAT in size, com-plexity, and cost, a closed star networkcan be economical even for communi-cation with a few distant sites.
The limiting channel for SCADA appli-cations, however, is normally the
inbound link. Table 1 shows that theinbound link requires a small fractionof the power needed for the outboundlink. The additional transponder loadof a new inbound channel is not signi-ficant.
The use of several inbound frequen-cies will be a flexible, cost-effectiveway of increasing the network capa-city. This feature also allows servicingthe same traffic type with optimisedprotocols on dedicated frequencies,e.g. random access on one frequencyand polling on another frequency.
The low data rates, and the possibleflexibility in communication protocols,imply that cost-effective digital signalprocessors (DSPs) and microproces-sors can be used, together with mode-rate complexity modem and data pro-tocol software.
33
Eb/No for BER 10-5
Rain & impl. margin
Hub antenna diameterRT (VSAT) antenna diameter
Data rateNature of trafficMain traffic dir.
Hub antenna diameterRT (VSAT) antenna diameterData rate
No of power limited carriersHub → RTRT → Hub
Relative transponder costHub → RTRT → Hub
7 dB6 dB
1.2 or 1.8 m55 or 90 cm
0.3 - 2.4 kbpsMostly staticRT → Hub
1.2m55 cm
300 bps
5 00032 000
5 %0.8 %
7 dB6 dB
3 - 10 m1.2 - 3 m
9.6 - 512 kbpsRandom
Hub → RT
5 m1.8 m
64 kbps
240600
100 %40 %
TSAT VSATTypical Parameters
Transponder load example
Table 1 Comparison between TSAT and VSAT systemsThe table shows that the TSAT parameters are scaled proportionally to the datarate. The TSAT Hub size, complexity and cost is comparable to traditionalVSAT terminals. The transponder cost is given relative to the VSAT system out-bound link cost
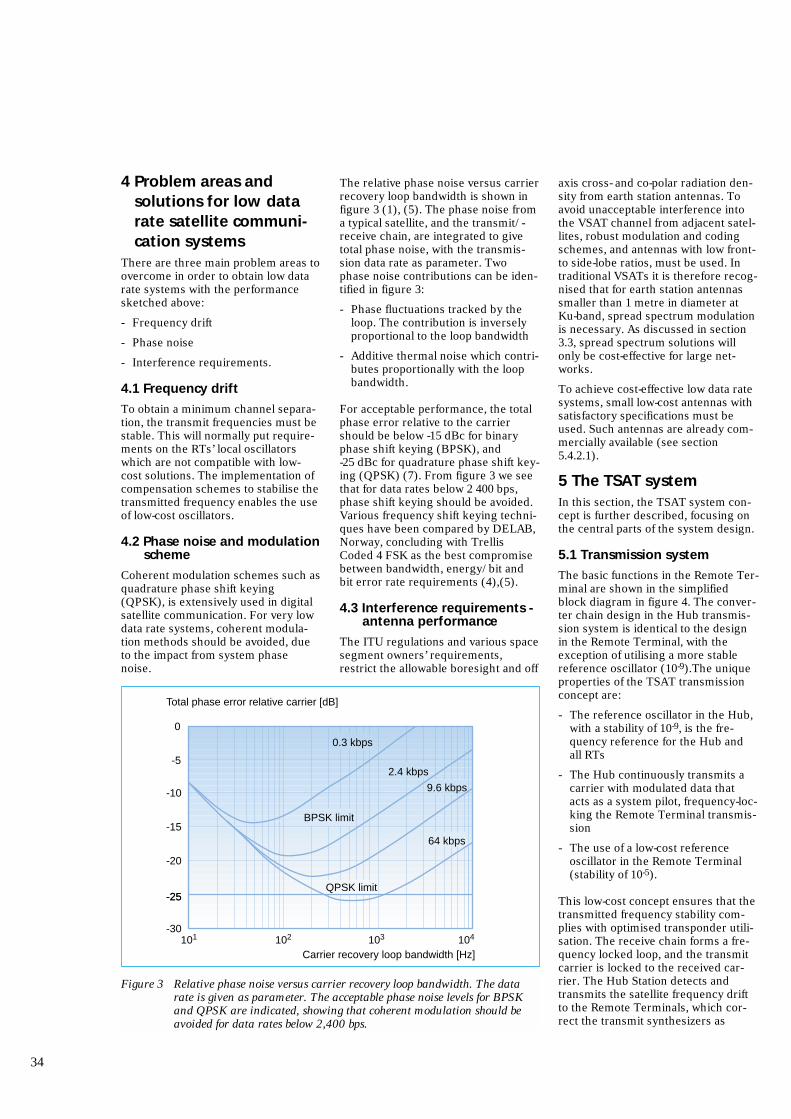
4 Problem areas andsolutions for low datarate satellite communi-cation systems
There are three main problem areas toovercome in order to obtain low datarate systems with the performancesketched above:
- Frequency drift
- Phase noise
- Interference requirements.
4.1 Frequency drift
To obtain a minimum channel separa-tion, the transmit frequencies must bestable. This will normally put require-ments on the RTs’ local oscillatorswhich are not compatible with low-cost solutions. The implementation ofcompensation schemes to stabilise thetransmitted frequency enables the useof low-cost oscillators.
4.2 Phase noise and modulationscheme
Coherent modulation schemes such asquadrature phase shift keying(QPSK), is extensively used in digitalsatellite communication. For very lowdata rate systems, coherent modula-tion methods should be avoided, dueto the impact from system phasenoise.
The relative phase noise versus carrierrecovery loop bandwidth is shown infigure 3 (1), (5). The phase noise froma typical satellite, and the transmit/-receive chain, are integrated to givetotal phase noise, with the transmis-sion data rate as parameter. Twophase noise contributions can be iden-tified in figure 3:
- Phase fluctuations tracked by theloop. The contribution is inverselyproportional to the loop bandwidth
- Additive thermal noise which contri-butes proportionally with the loopbandwidth.
For acceptable performance, the totalphase error relative to the carriershould be below -15 dBc for binaryphase shift keying (BPSK), and -25 dBc for quadrature phase shift key-ing (QPSK) (7). From figure 3 we seethat for data rates below 2 400 bps,phase shift keying should be avoided.Various frequency shift keying techni-ques have been compared by DELAB,Norway, concluding with TrellisCoded 4 FSK as the best compromisebetween bandwidth, energy/bit andbit error rate requirements (4),(5).
4.3 Interference requirements -antenna performance
The ITU regulations and various spacesegment owners’ requirements,restrict the allowable boresight and off
axis cross- and co-polar radiation den-sity from earth station antennas. Toavoid unacceptable interference intothe VSAT channel from adjacent satel-lites, robust modulation and codingschemes, and antennas with low front-to side-lobe ratios, must be used. Intraditional VSATs it is therefore recog-nised that for earth station antennassmaller than 1 metre in diameter atKu-band, spread spectrum modulationis necessary. As discussed in section3.3, spread spectrum solutions willonly be cost-effective for large net-works.
To achieve cost-effective low data ratesystems, small low-cost antennas withsatisfactory specifications must beused. Such antennas are already com-mercially available (see section5.4.2.1).
5 The TSAT systemIn this section, the TSAT system con-cept is further described, focusing onthe central parts of the system design.
5.1 Transmission system
The basic functions in the Remote Ter-minal are shown in the simplifiedblock diagram in figure 4. The conver-ter chain design in the Hub transmis-sion system is identical to the designin the Remote Terminal, with theexception of utilising a more stablereference oscillator (10-9).The uniqueproperties of the TSAT transmissionconcept are:
- The reference oscillator in the Hub,with a stability of 10-9, is the fre-quency reference for the Hub andall RTs
- The Hub continuously transmits acarrier with modulated data thatacts as a system pilot, frequency-loc-king the Remote Terminal transmis-sion
- The use of a low-cost referenceoscillator in the Remote Terminal(stability of 10-5).
This low-cost concept ensures that thetransmitted frequency stability com-plies with optimised transponder utili-sation. The receive chain forms a fre-quency locked loop, and the transmitcarrier is locked to the received car-rier. The Hub Station detects andtransmits the satellite frequency driftto the Remote Terminals, which cor-rect the transmit synthesizers as
34
Figure 3 Relative phase noise versus carrier recovery loop bandwidth. The datarate is given as parameter. The acceptable phase noise levels for BPSKand QPSK are indicated, showing that coherent modulation should beavoided for data rates below 2,400 bps.
OGu 16
0.3 kbps
2.4 kbps
9.6 kbps
64 kbps
-30
-25-25
-20
-15
-10
-5
0
Total phase error relative carrier [dB]
Carrier recovery loop bandwidth [Hz]101 102 103 104
BPSK limit
QPSK limit
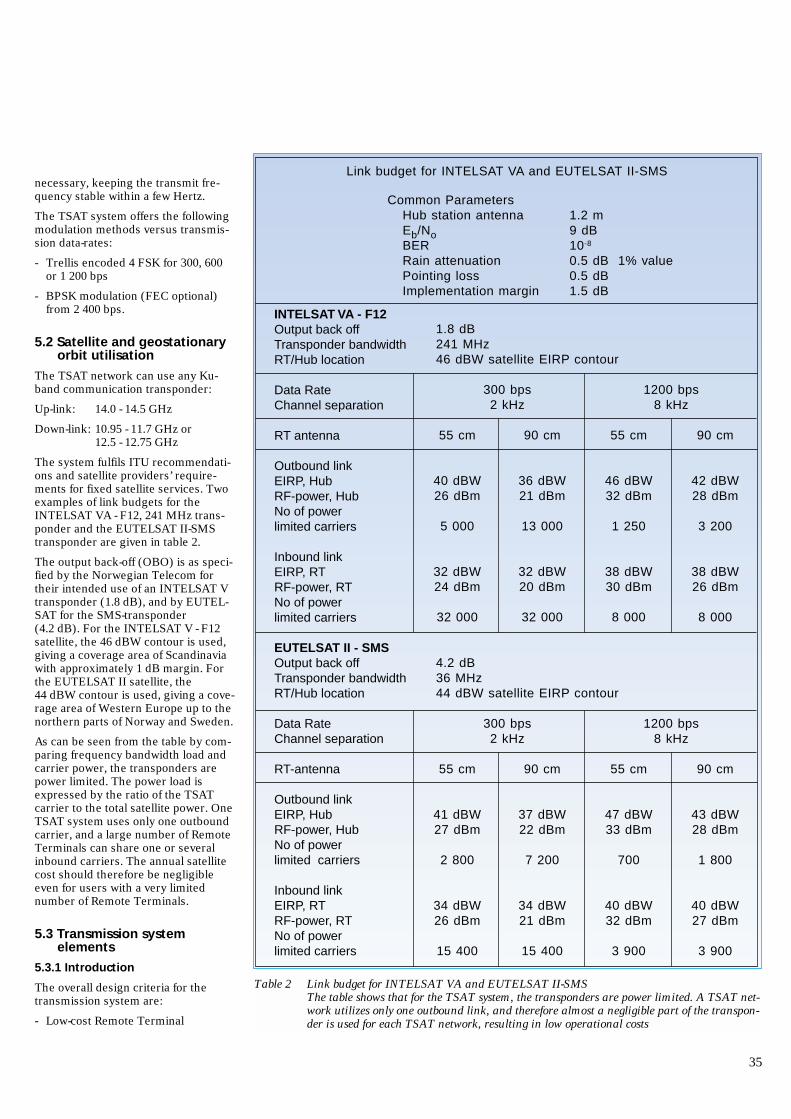
necessary, keeping the transmit fre-quency stable within a few Hertz.
The TSAT system offers the followingmodulation methods versus transmis-sion data-rates:
- Trellis encoded 4 FSK for 300, 600or 1 200 bps
- BPSK modulation (FEC optional)from 2 400 bps.
5.2 Satellite and geostationaryorbit utilisation
The TSAT network can use any Ku-band communication transponder:
Up-link: 14.0 - 14.5 GHz
Down-link: 10.95 - 11.7 GHz or12.5 - 12.75 GHz
The system fulfils ITU recommendati-ons and satellite providers’ require-ments for fixed satellite services. Twoexamples of link budgets for theINTELSAT VA - F12, 241 MHz trans-ponder and the EUTELSAT II-SMStransponder are given in table 2.
The output back-off (OBO) is as speci-fied by the Norwegian Telecom fortheir intended use of an INTELSAT Vtransponder (1.8 dB), and by EUTEL-SAT for the SMS-transponder(4.2 dB). For the INTELSAT V - F12satellite, the 46 dBW contour is used,giving a coverage area of Scandinaviawith approximately 1 dB margin. Forthe EUTELSAT II satellite, the44 dBW contour is used, giving a cove-rage area of Western Europe up to thenorthern parts of Norway and Sweden.
As can be seen from the table by com-paring frequency bandwidth load andcarrier power, the transponders arepower limited. The power load isexpressed by the ratio of the TSATcarrier to the total satellite power. OneTSAT system uses only one outboundcarrier, and a large number of RemoteTerminals can share one or severalinbound carriers. The annual satellitecost should therefore be negligibleeven for users with a very limitednumber of Remote Terminals.
5.3 Transmission systemelements
5.3.1 Introduction
The overall design criteria for thetransmission system are:
- Low-cost Remote Terminal
35
INTELSAT VA - F12Output back offTransponder bandwidthRT/Hub location
Data RateChannel separation
RT antenna
Outbound linkEIRP, HubRF-power, HubNo of powerlimited carriers
Inbound linkEIRP, RTRF-power, RTNo of powerlimited carriers
EUTELSAT II - SMSOutput back offTransponder bandwidthRT/Hub location
Data RateChannel separation
RT-antenna
Outbound linkEIRP, HubRF-power, HubNo of powerlimited carriers
Inbound linkEIRP, RTRF-power, RTNo of powerlimited carriers
Common Parameters
Link budget for INTELSAT VA and EUTELSAT II-SMS
Hub station antennaEb/NoBERRain attenuationPointing lossImplementation margin
1.2 m9 dB10-8
0.5 dB 1% value0.5 dB1.5 dB
1.8 dB241 MHz46 dBW satellite EIRP contour
300 bps2 kHz
1200 bps8 kHz
55 cm
40 dBW26 dBm
5 000
32 dBW24 dBm
32 000
90 cm
36 dBW21 dBm
13 000
32 dBW20 dBm
32 000
55 cm
46 dBW32 dBm
1 250
38 dBW30 dBm
8 000
90 cm
42 dBW28 dBm
3 200
38 dBW26 dBm
8 000
4.2 dB36 MHz44 dBW satellite EIRP contour
300 bps2 kHz
1200 bps8 kHz
55 cm
41 dBW27 dBm
2 800
34 dBW26 dBm
15 400
90 cm
37 dBW22 dBm
7 200
34 dBW21 dBm
15 400
55 cm
47 dBW33 dBm
700
40 dBW32 dBm
3 900
90 cm
43 dBW28 dBm
1 800
40 dBW27 dBm
3 900
Table 2 Link budget for INTELSAT VA and EUTELSAT II-SMSThe table shows that for the TSAT system, the transponders are power limited. A TSAT net-work utilizes only one outbound link, and therefore almost a negligible part of the transpon-der is used for each TSAT network, resulting in low operational costs
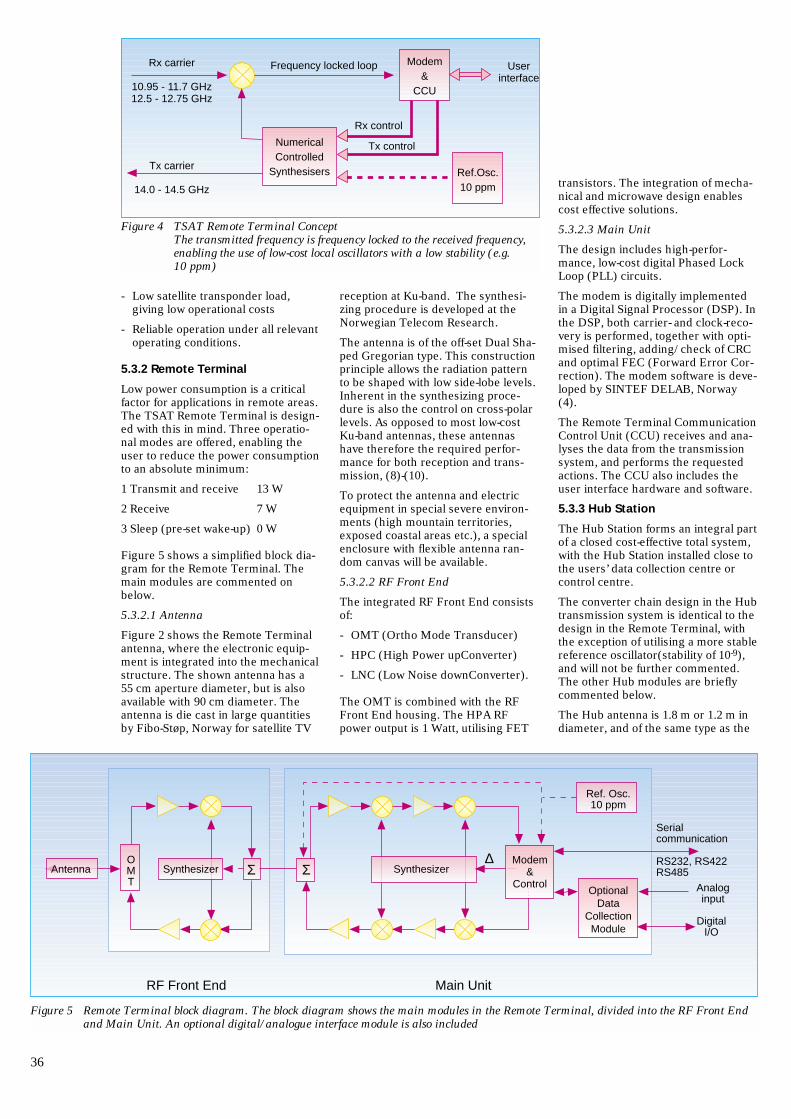
- Low satellite transponder load,giving low operational costs
- Reliable operation under all relevantoperating conditions.
5.3.2 Remote Terminal
Low power consumption is a criticalfactor for applications in remote areas.The TSAT Remote Terminal is design-ed with this in mind. Three operatio-nal modes are offered, enabling theuser to reduce the power consumptionto an absolute minimum:
1 Transmit and receive 13 W
2 Receive 7 W
3 Sleep (pre-set wake-up) 0 W
Figure 5 shows a simplified block dia-gram for the Remote Terminal. Themain modules are commented onbelow.
5.3.2.1 Antenna
Figure 2 shows the Remote Terminalantenna, where the electronic equip-ment is integrated into the mechanicalstructure. The shown antenna has a55 cm aperture diameter, but is alsoavailable with 90 cm diameter. Theantenna is die cast in large quantitiesby Fibo-Støp, Norway for satellite TV
reception at Ku-band. The synthesi-zing procedure is developed at theNorwegian Telecom Research.
The antenna is of the off-set Dual Sha-ped Gregorian type. This constructionprinciple allows the radiation patternto be shaped with low side-lobe levels.Inherent in the synthesizing proce-dure is also the control on cross-polarlevels. As opposed to most low-costKu-band antennas, these antennashave therefore the required perfor-mance for both reception and trans-mission, (8)-(10).
To protect the antenna and electricequipment in special severe environ-ments (high mountain territories,exposed coastal areas etc.), a specialenclosure with flexible antenna ran-dom canvas will be available.
5.3.2.2 RF Front End
The integrated RF Front End consistsof:
- OMT (Ortho Mode Transducer)
- HPC (High Power upConverter)
- LNC (Low Noise downConverter).
The OMT is combined with the RFFront End housing. The HPA RFpower output is 1 Watt, utilising FET
transistors. The integration of mecha-nical and microwave design enablescost effective solutions.
5.3.2.3 Main Unit
The design includes high-perfor-mance, low-cost digital Phased LockLoop (PLL) circuits.
The modem is digitally implementedin a Digital Signal Processor (DSP). Inthe DSP, both carrier- and clock-reco-very is performed, together with opti-mised filtering, adding/check of CRCand optimal FEC (Forward Error Cor-rection). The modem software is deve-loped by SINTEF DELAB, Norway(4).
The Remote Terminal CommunicationControl Unit (CCU) receives and ana-lyses the data from the transmissionsystem, and performs the requestedactions. The CCU also includes theuser interface hardware and software.
5.3.3 Hub Station
The Hub Station forms an integral partof a closed cost-effective total system,with the Hub Station installed close tothe users’ data collection centre orcontrol centre.
The converter chain design in the Hubtransmission system is identical to thedesign in the Remote Terminal, withthe exception of utilising a more stablereference oscillator(stability of 10-9),and will not be further commented.The other Hub modules are brieflycommented below.
The Hub antenna is 1.8 m or 1.2 m indiameter, and of the same type as the
36
NumericalControlled
Synthesisers
Rx carrier
10.95 - 11.7 GHz12.5 - 12.75 GHz
Tx carrier
14.0 - 14.5 GHz
Modem&
CCU
Ref.Osc.10 ppm
Frequency locked loop
Rx control
Tx control
Userinterface
Figure 4 TSAT Remote Terminal ConceptThe transmitted frequency is frequency locked to the received frequency,enabling the use of low-cost local oscillators with a low stability (e.g.10 ppm)
RF Front End
SynthesizerOMT
ΣAntenna SynthesizerΣModem
&Control
∆
Ref. Osc.10 ppm
OptionalData
CollectionModule
Serialcommunication
RS232, RS422RS485
Analoginput
DigitalI/O
Main Unit
Figure 5 Remote Terminal block diagram. The block diagram shows the main modules in the Remote Terminal, divided into the RF Front Endand Main Unit. An optional digital/analogue interface module is also included
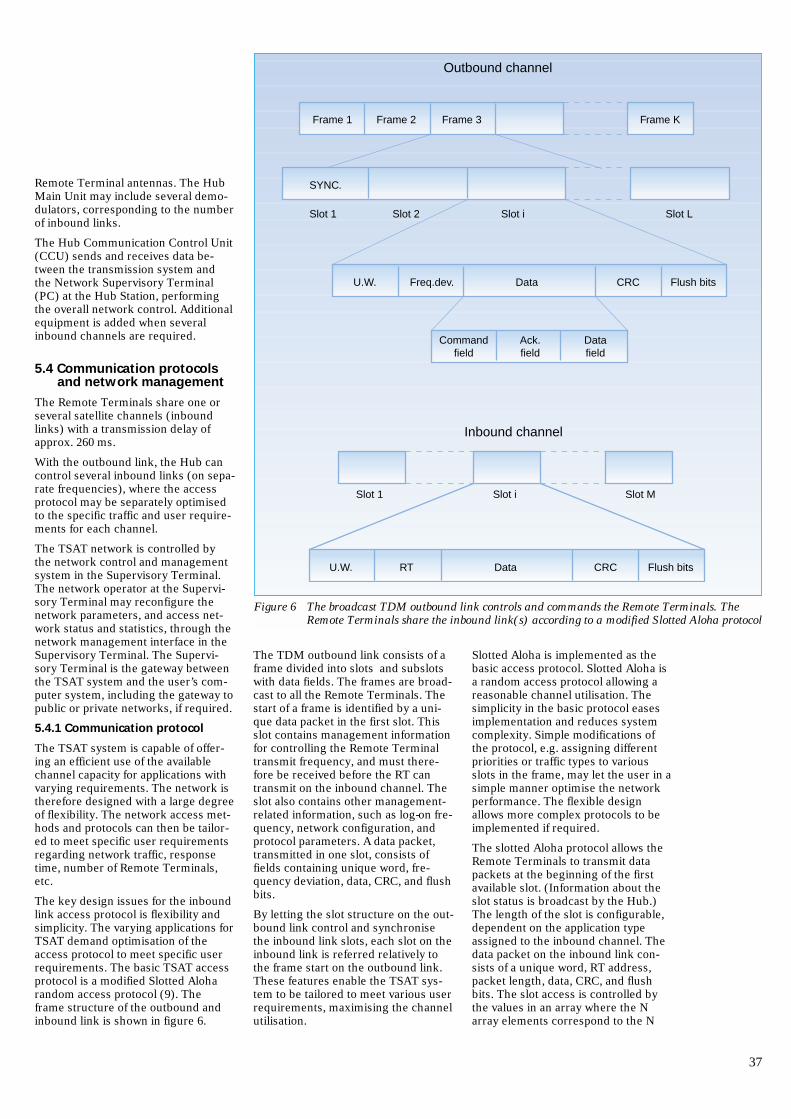
Remote Terminal antennas. The HubMain Unit may include several demo-dulators, corresponding to the numberof inbound links.
The Hub Communication Control Unit(CCU) sends and receives data be-tween the transmission system andthe Network Supervisory Terminal(PC) at the Hub Station, performingthe overall network control. Additionalequipment is added when severalinbound channels are required.
5.4 Communication protocolsand network management
The Remote Terminals share one orseveral satellite channels (inboundlinks) with a transmission delay ofapprox. 260 ms.
With the outbound link, the Hub cancontrol several inbound links (on sepa-rate frequencies), where the accessprotocol may be separately optimisedto the specific traffic and user require-ments for each channel.
The TSAT network is controlled bythe network control and managementsystem in the Supervisory Terminal.The network operator at the Supervi-sory Terminal may reconfigure thenetwork parameters, and access net-work status and statistics, through thenetwork management interface in theSupervisory Terminal. The Supervi-sory Terminal is the gateway betweenthe TSAT system and the user’s com-puter system, including the gateway topublic or private networks, if required.
5.4.1 Communication protocol
The TSAT system is capable of offer-ing an efficient use of the availablechannel capacity for applications withvarying requirements. The network istherefore designed with a large degreeof flexibility. The network access met-hods and protocols can then be tailor-ed to meet specific user requirementsregarding network traffic, responsetime, number of Remote Terminals,etc.
The key design issues for the inboundlink access protocol is flexibility andsimplicity. The varying applications forTSAT demand optimisation of theaccess protocol to meet specific userrequirements. The basic TSAT accessprotocol is a modified Slotted Aloharandom access protocol (9). Theframe structure of the outbound andinbound link is shown in figure 6.
The TDM outbound link consists of aframe divided into slots and subslotswith data fields. The frames are broad-cast to all the Remote Terminals. Thestart of a frame is identified by a uni-que data packet in the first slot. Thisslot contains management informationfor controlling the Remote Terminaltransmit frequency, and must there-fore be received before the RT cantransmit on the inbound channel. Theslot also contains other management-related information, such as log-on fre-quency, network configuration, andprotocol parameters. A data packet,transmitted in one slot, consists offields containing unique word, fre-quency deviation, data, CRC, and flushbits.
By letting the slot structure on the out-bound link control and synchronisethe inbound link slots, each slot on theinbound link is referred relatively tothe frame start on the outbound link.These features enable the TSAT sys-tem to be tailored to meet various userrequirements, maximising the channelutilisation.
Slotted Aloha is implemented as thebasic access protocol. Slotted Aloha isa random access protocol allowing areasonable channel utilisation. Thesimplicity in the basic protocol easesimplementation and reduces systemcomplexity. Simple modifications ofthe protocol, e.g. assigning differentpriorities or traffic types to variousslots in the frame, may let the user in asimple manner optimise the networkperformance. The flexible designallows more complex protocols to beimplemented if required.
The slotted Aloha protocol allows theRemote Terminals to transmit datapackets at the beginning of the firstavailable slot. (Information about theslot status is broadcast by the Hub.)The length of the slot is configurable,dependent on the application typeassigned to the inbound channel. Thedata packet on the inbound link con-sists of a unique word, RT address,packet length, data, CRC, and flushbits. The slot access is controlled bythe values in an array where the Narray elements correspond to the N
37
Frame KFrame 1 Frame 2 Frame 3
SYNC.
Slot 1 Slot 2 Slot i Slot L
U.W. Freq.dev. Data CRC Flush bits
Commandfield
Ack.field
Datafield
Slot 1 Slot i Slot M
U.W. RT Data CRC Flush bits
Outbound channel
Inbound channel
Figure 6 The broadcast TDM outbound link controls and commands the Remote Terminals. TheRemote Terminals share the inbound link(s) according to a modified Slotted Aloha protocol
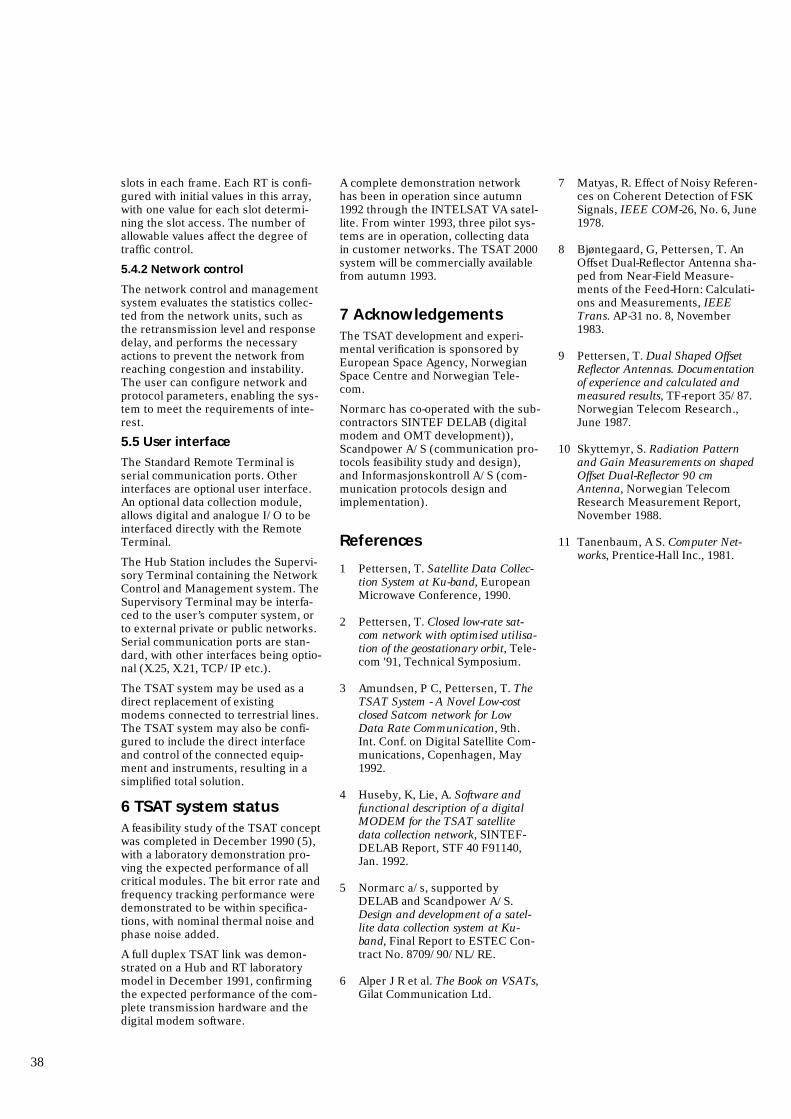
slots in each frame. Each RT is confi-gured with initial values in this array,with one value for each slot determi-ning the slot access. The number ofallowable values affect the degree oftraffic control.
5.4.2 Network control
The network control and managementsystem evaluates the statistics collec-ted from the network units, such asthe retransmission level and responsedelay, and performs the necessaryactions to prevent the network fromreaching congestion and instability.The user can configure network andprotocol parameters, enabling the sys-tem to meet the requirements of inte-rest.
5.5 User interface
The Standard Remote Terminal isserial communication ports. Otherinterfaces are optional user interface.An optional data collection module,allows digital and analogue I/O to beinterfaced directly with the RemoteTerminal.
The Hub Station includes the Supervi-sory Terminal containing the NetworkControl and Management system. TheSupervisory Terminal may be interfa-ced to the user’s computer system, orto external private or public networks.Serial communication ports are stan-dard, with other interfaces being optio-nal (X.25, X.21, TCP/IP etc.).
The TSAT system may be used as adirect replacement of existingmodems connected to terrestrial lines.The TSAT system may also be confi-gured to include the direct interfaceand control of the connected equip-ment and instruments, resulting in asimplified total solution.
6 TSAT system statusA feasibility study of the TSAT conceptwas completed in December 1990 (5),with a laboratory demonstration pro-ving the expected performance of allcritical modules. The bit error rate andfrequency tracking performance weredemonstrated to be within specifica-tions, with nominal thermal noise andphase noise added.
A full duplex TSAT link was demon-strated on a Hub and RT laboratorymodel in December 1991, confirmingthe expected performance of the com-plete transmission hardware and thedigital modem software.
A complete demonstration networkhas been in operation since autumn1992 through the INTELSAT VA satel-lite. From winter 1993, three pilot sys-tems are in operation, collecting datain customer networks. The TSAT 2000system will be commercially availablefrom autumn 1993.
7 AcknowledgementsThe TSAT development and experi-mental verification is sponsored byEuropean Space Agency, NorwegianSpace Centre and Norwegian Tele-com.
Normarc has co-operated with the sub-contractors SINTEF DELAB (digitalmodem and OMT development)),Scandpower A/S (communication pro-tocols feasibility study and design),and Informasjonskontroll A/S (com-munication protocols design andimplementation).
References
1 Pettersen, T. Satellite Data Collec-tion System at Ku-band, EuropeanMicrowave Conference, 1990.
2 Pettersen, T. Closed low-rate sat-com network with optimised utilisa-tion of the geostationary orbit, Tele-com '91, Technical Symposium.
3 Amundsen, P C, Pettersen, T. TheTSAT System - A Novel Low-costclosed Satcom network for LowData Rate Communication, 9th.Int. Conf. on Digital Satellite Com-munications, Copenhagen, May1992.
4 Huseby, K, Lie, A. Software andfunctional description of a digitalMODEM for the TSAT satellitedata collection network, SINTEF-DELAB Report, STF 40 F91140,Jan. 1992.
5 Normarc a/s, supported byDELAB and Scandpower A/S.Design and development of a satel-lite data collection system at Ku-band, Final Report to ESTEC Con-tract No. 8709/90/NL/RE.
6 Alper J R et al. The Book on VSATs,Gilat Communication Ltd.
7 Matyas, R. Effect of Noisy Referen-ces on Coherent Detection of FSKSignals, IEEE COM-26, No. 6, June1978.
8 Bjøntegaard, G, Pettersen, T. AnOffset Dual-Reflector Antenna sha-ped from Near-Field Measure-ments of the Feed-Horn: Calculati-ons and Measurements, IEEETrans. AP-31 no. 8, November1983.
9 Pettersen, T. Dual Shaped OffsetReflector Antennas. Documentationof experience and calculated andmeasured results, TF-report 35/87.Norwegian Telecom Research.,June 1987.
10 Skyttemyr, S. Radiation Patternand Gain Measurements on shapedOffset Dual-Reflector 90 cmAntenna, Norwegian TelecomResearch Measurement Report,November 1988.
11 Tanenbaum, A S. Computer Net-works, Prentice-Hall Inc., 1981.
38
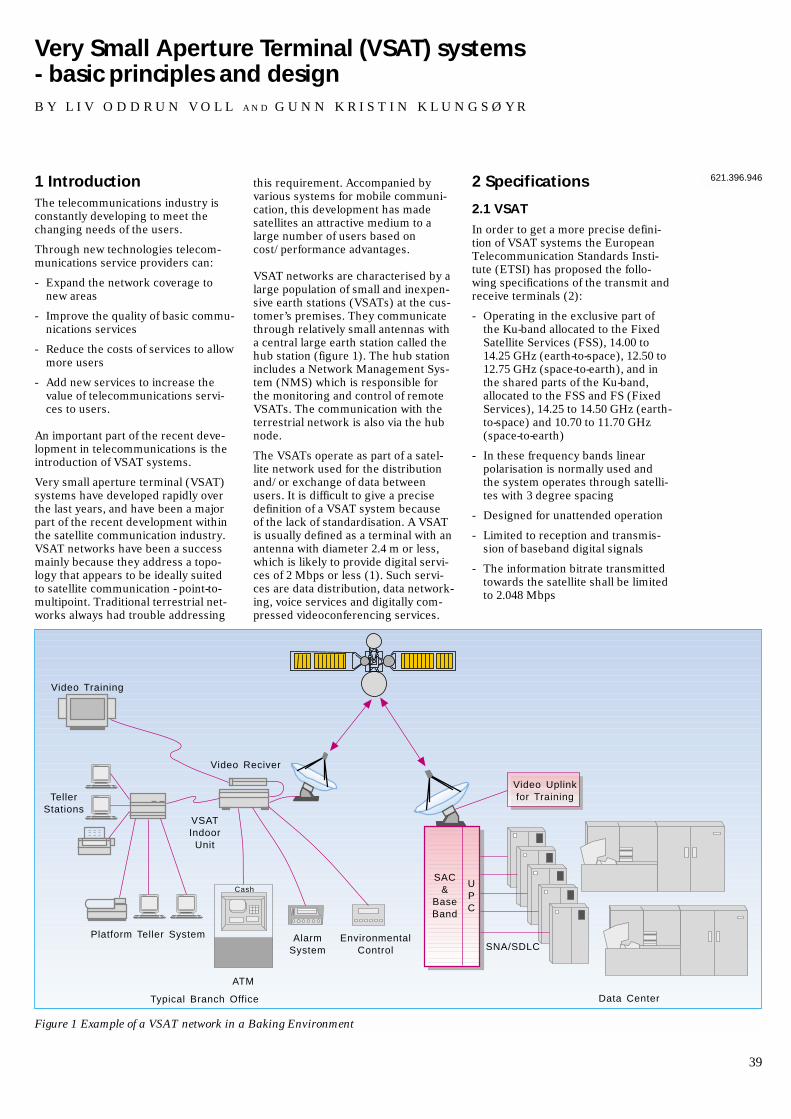
1 IntroductionThe telecommunications industry isconstantly developing to meet thechanging needs of the users.
Through new technologies telecom-munications service providers can:
- Expand the network coverage tonew areas
- Improve the quality of basic commu-nications services
- Reduce the costs of services to allowmore users
- Add new services to increase thevalue of telecommunications servi-ces to users.
An important part of the recent deve-lopment in telecommunications is theintroduction of VSAT systems.
Very small aperture terminal (VSAT)systems have developed rapidly overthe last years, and have been a majorpart of the recent development withinthe satellite communication industry.VSAT networks have been a successmainly because they address a topo-logy that appears to be ideally suitedto satellite communication - point-to-multipoint. Traditional terrestrial net-works always had trouble addressing
this requirement. Accompanied byvarious systems for mobile communi-cation, this development has madesatellites an attractive medium to alarge number of users based oncost/performance advantages.
VSAT networks are characterised by alarge population of small and inexpen-sive earth stations (VSATs) at the cus-tomer’s premises. They communicatethrough relatively small antennas witha central large earth station called thehub station (figure 1). The hub stationincludes a Network Management Sys-tem (NMS) which is responsible forthe monitoring and control of remoteVSATs. The communication with theterrestrial network is also via the hubnode.
The VSATs operate as part of a satel-lite network used for the distributionand/or exchange of data betweenusers. It is difficult to give a precisedefinition of a VSAT system becauseof the lack of standardisation. A VSATis usually defined as a terminal with anantenna with diameter 2.4 m or less,which is likely to provide digital servi-ces of 2 Mbps or less (1). Such servi-ces are data distribution, data network-ing, voice services and digitally com-pressed videoconferencing services.
2 Specifications
2.1 VSAT
In order to get a more precise defini-tion of VSAT systems the EuropeanTelecommunication Standards Insti-tute (ETSI) has proposed the follo-wing specifications of the transmit andreceive terminals (2):
- Operating in the exclusive part ofthe Ku-band allocated to the FixedSatellite Services (FSS), 14.00 to14.25 GHz (earth-to-space), 12.50 to12.75 GHz (space-to-earth), and inthe shared parts of the Ku-band,allocated to the FSS and FS (FixedServices), 14.25 to 14.50 GHz (earth-to-space) and 10.70 to 11.70 GHz(space-to-earth)
- In these frequency bands linearpolarisation is normally used andthe system operates through satelli-tes with 3 degree spacing
- Designed for unattended operation
- Limited to reception and transmis-sion of baseband digital signals
- The information bitrate transmittedtowards the satellite shall be limitedto 2.048 Mbps
39
Very Small Aperture Terminal (VSAT) systems - basic principles and designB Y L I V O D D R U N V O L L A N D G U N N K R I S T I N K L U N G S Ø Y R
621.396.946
UPC
SAC&
BaseBand
Video Uplinkfor Training
SNA/SDLCEnvironmental
ControlAlarm
System
ATM
Cash
Platform Teller System
TellerStations
Video Training
VSATIndoor
Unit
Video Reciver
Data CenterTypical Branch Office
Figure 1 Example of a VSAT network in a Baking Environment
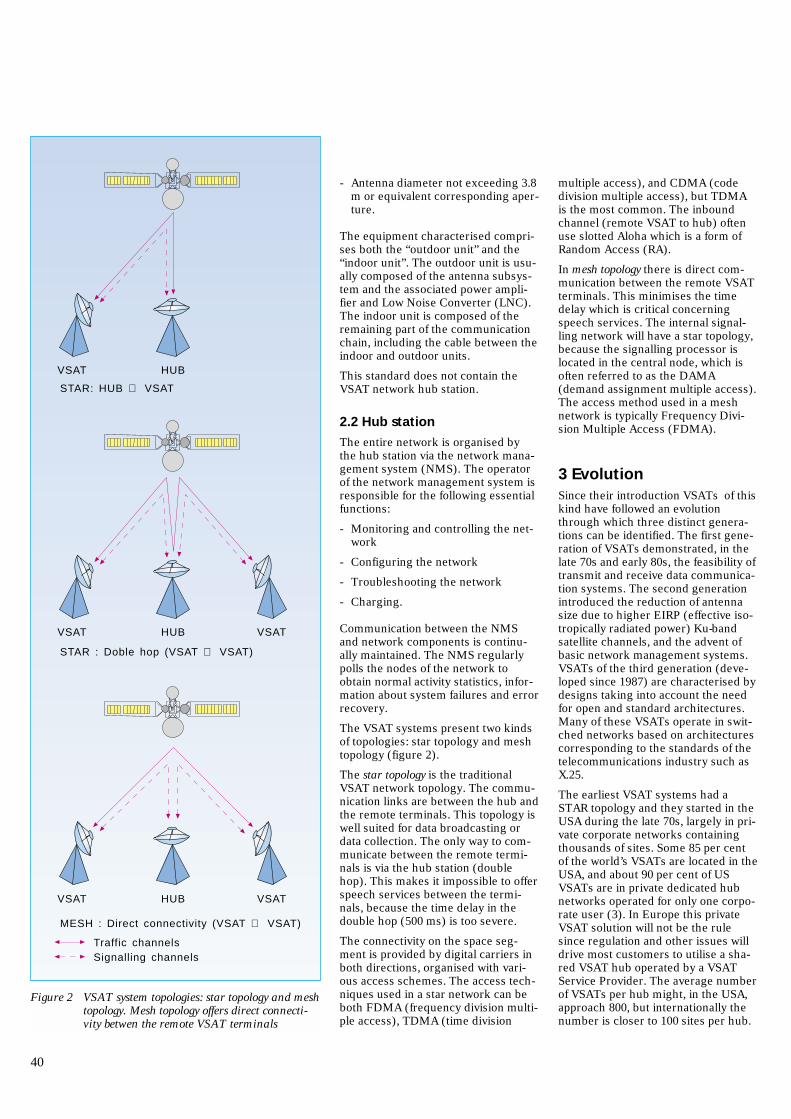
- Antenna diameter not exceeding 3.8m or equivalent corresponding aper-ture.
The equipment characterised compri-ses both the “outdoor unit” and the“indoor unit”. The outdoor unit is usu-ally composed of the antenna subsys-tem and the associated power ampli-fier and Low Noise Converter (LNC).The indoor unit is composed of theremaining part of the communicationchain, including the cable between theindoor and outdoor units.
This standard does not contain theVSAT network hub station.
2.2 Hub station
The entire network is organised bythe hub station via the network mana-gement system (NMS). The operatorof the network management system isresponsible for the following essentialfunctions:
- Monitoring and controlling the net-work
- Configuring the network
- Troubleshooting the network
- Charging.
Communication between the NMSand network components is continu-ally maintained. The NMS regularlypolls the nodes of the network toobtain normal activity statistics, infor-mation about system failures and errorrecovery.
The VSAT systems present two kindsof topologies: star topology and meshtopology (figure 2).
The star topology is the traditionalVSAT network topology. The commu-nication links are between the hub andthe remote terminals. This topology iswell suited for data broadcasting ordata collection. The only way to com-municate between the remote termi-nals is via the hub station (doublehop). This makes it impossible to offerspeech services between the termi-nals, because the time delay in thedouble hop (500 ms) is too severe.
The connectivity on the space seg-ment is provided by digital carriers inboth directions, organised with vari-ous access schemes. The access tech-niques used in a star network can beboth FDMA (frequency division multi-ple access), TDMA (time division
multiple access), and CDMA (codedivision multiple access), but TDMAis the most common. The inboundchannel (remote VSAT to hub) oftenuse slotted Aloha which is a form ofRandom Access (RA).
In mesh topology there is direct com-munication between the remote VSATterminals. This minimises the timedelay which is critical concerningspeech services. The internal signal-ling network will have a star topology,because the signalling processor islocated in the central node, which isoften referred to as the DAMA(demand assignment multiple access).The access method used in a meshnetwork is typically Frequency Divi-sion Multiple Access (FDMA).
3 EvolutionSince their introduction VSATs of thiskind have followed an evolutionthrough which three distinct genera-tions can be identified. The first gene-ration of VSATs demonstrated, in thelate 70s and early 80s, the feasibility oftransmit and receive data communica-tion systems. The second generationintroduced the reduction of antennasize due to higher EIRP (effective iso-tropically radiated power) Ku-bandsatellite channels, and the advent ofbasic network management systems.VSATs of the third generation (deve-loped since 1987) are characterised bydesigns taking into account the needfor open and standard architectures.Many of these VSATs operate in swit-ched networks based on architecturescorresponding to the standards of thetelecommunications industry such asX.25.
The earliest VSAT systems had aSTAR topology and they started in theUSA during the late 70s, largely in pri-vate corporate networks containingthousands of sites. Some 85 per centof the world’s VSATs are located in theUSA, and about 90 per cent of USVSATs are in private dedicated hubnetworks operated for only one corpo-rate user (3). In Europe this privateVSAT solution will not be the rulesince regulation and other issues willdrive most customers to utilise a sha-red VSAT hub operated by a VSATService Provider. The average numberof VSATs per hub might, in the USA,approach 800, but internationally thenumber is closer to 100 sites per hub.
40
VSAT HUB
Traffic channelsSignalling channels
VSAT HUB
STAR: HUB ⇔ VSAT
VSAT
VSAT HUB
MESH : Direct connectivity (VSAT ⇔ VSAT)
VSAT
STAR : Doble hop (VSAT ⇔ VSAT)
Figure 2 VSAT system topologies: star topology and meshtopology. Mesh topology offers direct connecti-vity betwen the remote VSAT terminals
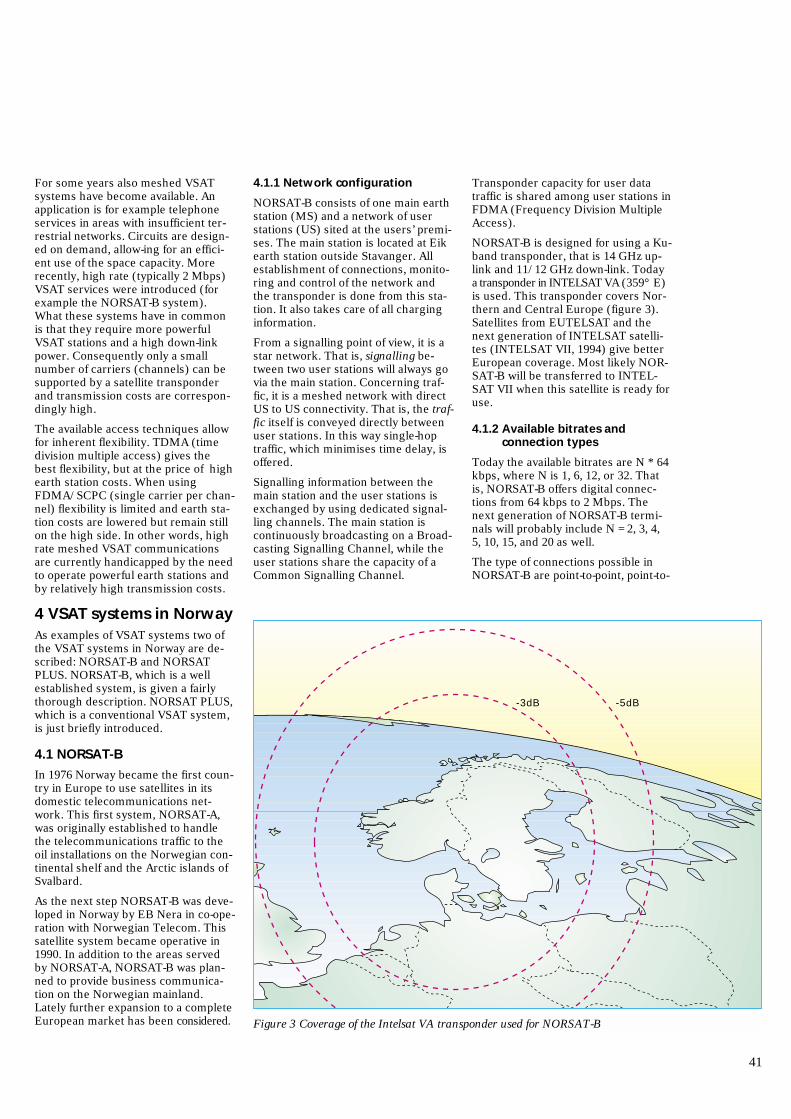
For some years also meshed VSATsystems have become available. Anapplication is for example telephoneservices in areas with insufficient ter-restrial networks. Circuits are design-ed on demand, allow-ing for an effici-ent use of the space capacity. Morerecently, high rate (typically 2 Mbps)VSAT services were introduced (forexample the NORSAT-B system).What these systems have in commonis that they require more powerfulVSAT stations and a high down-linkpower. Consequently only a smallnumber of carriers (channels) can besupported by a satellite transponderand transmission costs are correspon-dingly high.
The available access techniques allowfor inherent flexibility. TDMA (timedivision multiple access) gives thebest flexibility, but at the price of highearth station costs. When usingFDMA/SCPC (single carrier per chan-nel) flexibility is limited and earth sta-tion costs are lowered but remain stillon the high side. In other words, highrate meshed VSAT communicationsare currently handicapped by the needto operate powerful earth stations andby relatively high transmission costs.
4 VSAT systems in NorwayAs examples of VSAT systems two ofthe VSAT systems in Norway are de-scribed: NORSAT-B and NORSATPLUS. NORSAT-B, which is a wellestablished system, is given a fairlythorough description. NORSAT PLUS,which is a conventional VSAT system,is just briefly introduced.
4.1 NORSAT-B
In 1976 Norway became the first coun-try in Europe to use satellites in itsdomestic telecommunications net-work. This first system, NORSAT-A,was originally established to handlethe telecommunications traffic to theoil installations on the Norwegian con-tinental shelf and the Arctic islands ofSvalbard.
As the next step NORSAT-B was deve-loped in Norway by EB Nera in co-ope-ration with Norwegian Telecom. Thissatellite system became operative in1990. In addition to the areas servedby NORSAT-A, NORSAT-B was plan-ned to provide business communica-tion on the Norwegian mainland.Lately further expansion to a completeEuropean market has been considered.
4.1.1 Network configuration
NORSAT-B consists of one main earthstation (MS) and a network of userstations (US) sited at the users’ premi-ses. The main station is located at Eikearth station outside Stavanger. Allestablishment of connections, monito-ring and control of the network andthe transponder is done from this sta-tion. It also takes care of all charginginformation.
From a signalling point of view, it is astar network. That is, signalling be-tween two user stations will always govia the main station. Concerning traf-fic, it is a meshed network with directUS to US connectivity. That is, the traf-fic itself is conveyed directly betweenuser stations. In this way single-hoptraffic, which minimises time delay, isoffered.
Signalling information between themain station and the user stations isexchanged by using dedicated signal-ling channels. The main station iscontinuously broadcasting on a Broad-casting Signalling Channel, while theuser stations share the capacity of aCommon Signalling Channel.
Transponder capacity for user datatraffic is shared among user stations inFDMA (Frequency Division MultipleAccess).
NORSAT-B is designed for using a Ku-band transponder, that is 14 GHz up-link and 11/12 GHz down-link. Todaya transponder in INTELSAT VA (359° E)is used. This transponder covers Nor-thern and Central Europe (figure 3).Satellites from EUTELSAT and thenext generation of INTELSAT satelli-tes (INTELSAT VII, 1994) give betterEuropean coverage. Most likely NOR-SAT-B will be transferred to INTEL-SAT VII when this satellite is ready foruse.
4.1.2 Available bitrates and connection types
Today the available bitrates are N * 64kbps, where N is 1, 6, 12, or 32. Thatis, NORSAT-B offers digital connec-tions from 64 kbps to 2 Mbps. Thenext generation of NORSAT-B termi-nals will probably include N = 2, 3, 4,5, 10, 15, and 20 as well.
The type of connections possible inNORSAT-B are point-to-point, point-to-
41
-3dB -5dB
Figure 3 Coverage of the Intelsat VA transponder used for NORSAT-B
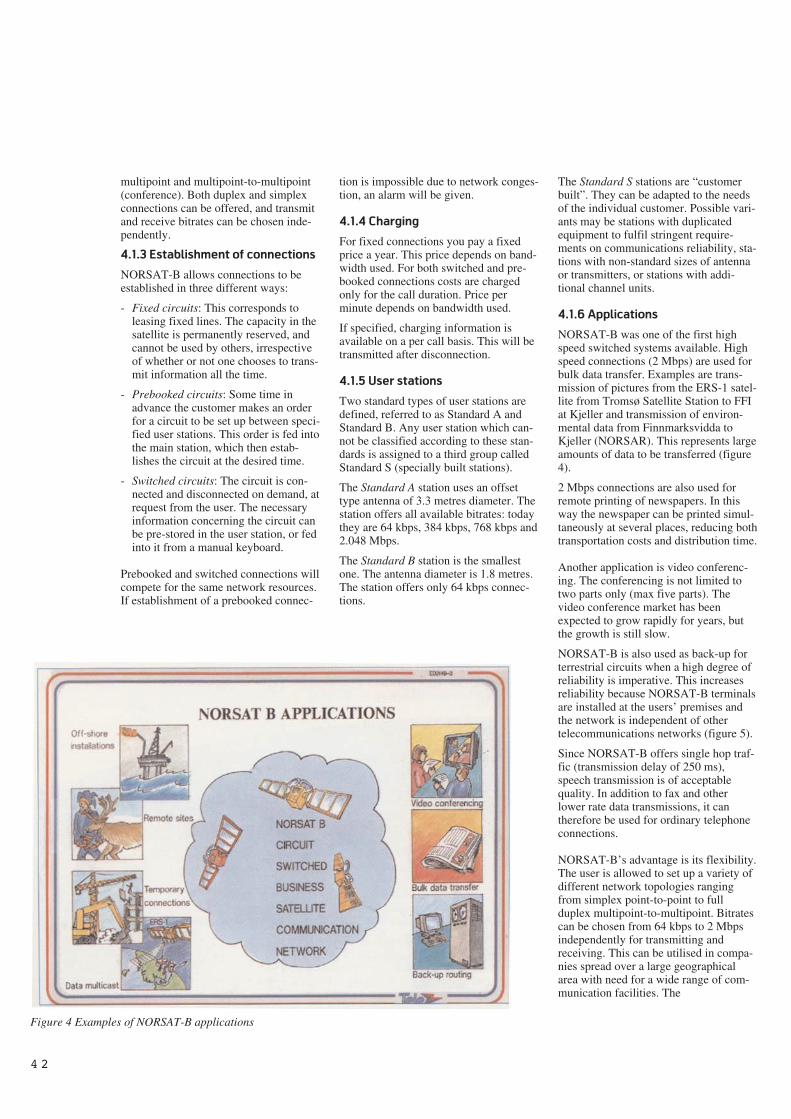
multipoint and multipoint-to-multipoint(conference). Both duplex and simplexconnections can be offered, and transmitand receive bitrates can be chosen inde-pendently.
4.1.3 Establishment of connections
NORSAT-B allows connections to beestablished in three different ways:
- Fixed circuits: This corresponds toleasing fixed lines. The capacity in thesatellite is permanently reserved, andcannot be used by others, irrespectiveof whether or not one chooses to trans-mit information all the time.
- Prebooked circuits: Some time inadvance the customer makes an orderfor a circuit to be set up between speci-fied user stations. This order is fed intothe main station, which then estab-lishes the circuit at the desired time.
- Switched circuits: The circuit is con-nected and disconnected on demand, atrequest from the user. The necessaryinformation concerning the circuit canbe pre-stored in the user station, or fedinto it from a manual keyboard.
Prebooked and switched connections willcompete for the same network resources.If establishment of a prebooked connec-
tion is impossible due to network conges-tion, an alarm will be given.
4.1.4 Charging
For fixed connections you pay a fixedprice a year. This price depends on band-width used. For both switched and pre-booked connections costs are chargedonly for the call duration. Price perminute depends on bandwidth used.
If specified, charging information isavailable on a per call basis. This will betransmitted after disconnection.
4.1.5 User stations
Two standard types of user stations aredefined, referred to as Standard A andStandard B. Any user station which can-not be classified according to these stan-dards is assigned to a third group calledStandard S (specially built stations).
The Standard A station uses an offsettype antenna of 3.3 metres diameter. Thestation offers all available bitrates: todaythey are 64 kbps, 384 kbps, 768 kbps and2.048 Mbps.
The Standard B station is the smallestone. The antenna diameter is 1.8 metres.The station offers only 64 kbps connec-tions.
The Standard S stations are “customerbuilt”. They can be adapted to the needsof the individual customer. Possible vari-ants may be stations with duplicatedequipment to fulfil stringent require-ments on communications reliability, sta-tions with non-standard sizes of antennaor transmitters, or stations with addi-tional channel units.
4.1.6 Applications
NORSAT-B was one of the first highspeed switched systems available. Highspeed connections (2 Mbps) are used forbulk data transfer. Examples are trans-mission of pictures from the ERS-1 satel-lite from Tromsø Satellite Station to FFIat Kjeller and transmission of environ-mental data from Finnmarksvidda toKjeller (NORSAR). This represents largeamounts of data to be transferred (figure4).
2 Mbps connections are also used forremote printing of newspapers. In thisway the newspaper can be printed simul-taneously at several places, reducing bothtransportation costs and distribution time.
Another application is video conferenc-ing. The conferencing is not limited totwo parts only (max five parts). Thevideo conference market has beenexpected to grow rapidly for years, butthe growth is still slow.
NORSAT-B is also used as back-up forterrestrial circuits when a high degree ofreliability is imperative. This increasesreliability because NORSAT-B terminalsare installed at the users’ premises andthe network is independent of othertelecommunications networks (figure 5).
Since NORSAT-B offers single hop traf-fic (transmission delay of 250 ms),speech transmission is of acceptablequality. In addition to fax and otherlower rate data transmissions, it cantherefore be used for ordinary telephoneconnections.
NORSAT-B’s advantage is its flexibility.The user is allowed to set up a variety ofdifferent network topologies rangingfrom simplex point-to-point to fullduplex multipoint-to-multipoint. Bitratescan be chosen from 64 kbps to 2 Mbpsindependently for transmitting andreceiving. This can be utilised in compa-nies spread over a large geographicalarea with need for a wide range of com-munication facilities. The
4 2
Figure 4 Examples of NORSAT-B applications
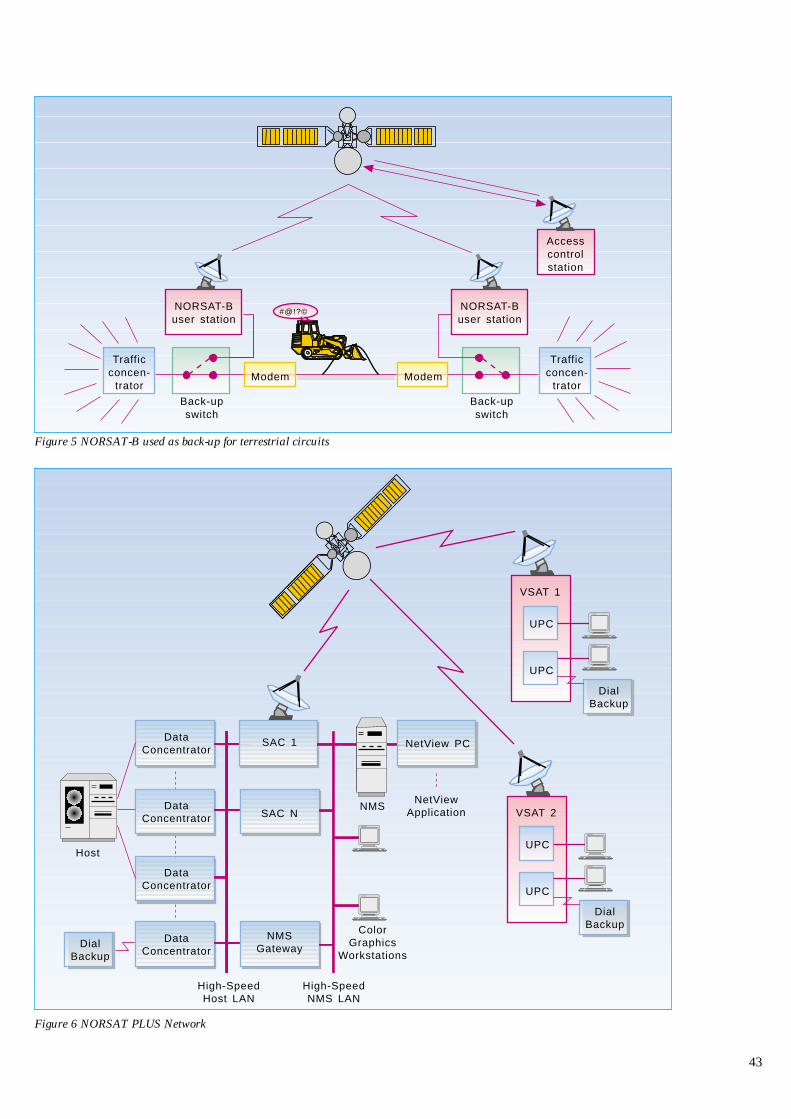
43
Figure 6 NORSAT PLUS Network
DataConcentrator
DataConcentrator
DataConcentrator
DataConcentrator
Host
DialBackup
SAC 1
SAC N
NMSGateway
ColorGraphics
Workstations
NetView PC
UPC
UPC
VSAT 1
DialBackup
UPC
UPC
VSAT 2
DialBackup
NetViewApplicationNMS
High-SpeedHost LAN
High-SpeedNMS LAN
Figure 5 NORSAT-B used as back-up for terrestrial circuits
NORSAT-Buser station
Trafficconcen-
trator
Trafficconcen-
trator
NORSAT-Buser station
ModemModem
Accesscontrolstation
#@!?©
Back-upswitch
Back-upswitch
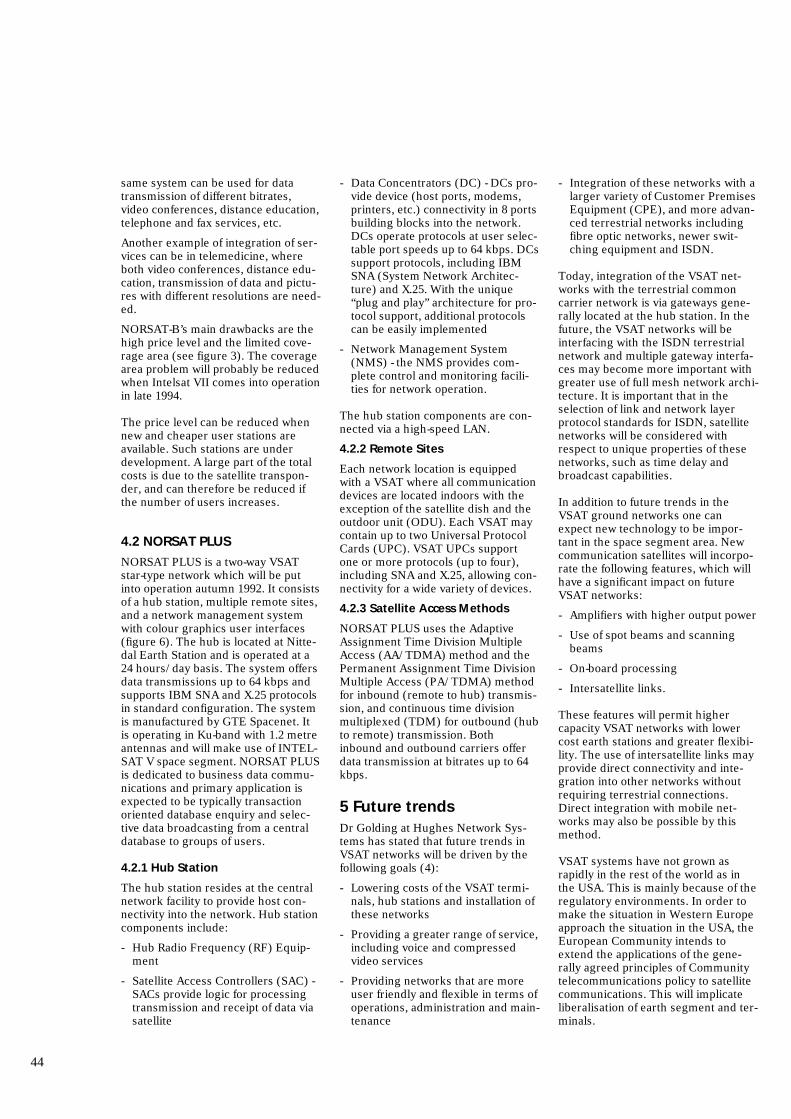
same system can be used for datatransmission of different bitrates,video conferences, distance education,telephone and fax services, etc.
Another example of integration of ser-vices can be in telemedicine, whereboth video conferences, distance edu-cation, transmission of data and pictu-res with different resolutions are need-ed.
NORSAT-B’s main drawbacks are thehigh price level and the limited cove-rage area (see figure 3). The coveragearea problem will probably be reducedwhen Intelsat VII comes into operationin late 1994.
The price level can be reduced whennew and cheaper user stations areavailable. Such stations are underdevelopment. A large part of the totalcosts is due to the satellite transpon-der, and can therefore be reduced ifthe number of users increases.
4.2 NORSAT PLUS
NORSAT PLUS is a two-way VSATstar-type network which will be putinto operation autumn 1992. It consistsof a hub station, multiple remote sites,and a network management systemwith colour graphics user interfaces(figure 6). The hub is located at Nitte-dal Earth Station and is operated at a24 hours/day basis. The system offersdata transmissions up to 64 kbps andsupports IBM SNA and X.25 protocolsin standard configuration. The systemis manufactured by GTE Spacenet. Itis operating in Ku-band with 1.2 metreantennas and will make use of INTEL-SAT V space segment. NORSAT PLUSis dedicated to business data commu-nications and primary application isexpected to be typically transactionoriented database enquiry and selec-tive data broadcasting from a centraldatabase to groups of users.
4.2.1 Hub Station
The hub station resides at the centralnetwork facility to provide host con-nectivity into the network. Hub stationcomponents include:
- Hub Radio Frequency (RF) Equip-ment
- Satellite Access Controllers (SAC) -SACs provide logic for processingtransmission and receipt of data viasatellite
- Data Concentrators (DC) - DCs pro-vide device (host ports, modems,printers, etc.) connectivity in 8 portsbuilding blocks into the network.DCs operate protocols at user selec-table port speeds up to 64 kbps. DCssupport protocols, including IBMSNA (System Network Architec-ture) and X.25. With the unique“plug and play” architecture for pro-tocol support, additional protocolscan be easily implemented
- Network Management System(NMS) - the NMS provides com-plete control and monitoring facili-ties for network operation.
The hub station components are con-nected via a high-speed LAN.
4.2.2 Remote Sites
Each network location is equippedwith a VSAT where all communicationdevices are located indoors with theexception of the satellite dish and theoutdoor unit (ODU). Each VSAT maycontain up to two Universal ProtocolCards (UPC). VSAT UPCs supportone or more protocols (up to four),including SNA and X.25, allowing con-nectivity for a wide variety of devices.
4.2.3 Satellite Access Methods
NORSAT PLUS uses the AdaptiveAssignment Time Division MultipleAccess (AA/TDMA) method and thePermanent Assignment Time DivisionMultiple Access (PA/TDMA) methodfor inbound (remote to hub) transmis-sion, and continuous time divisionmultiplexed (TDM) for outbound (hubto remote) transmission. Bothinbound and outbound carriers offerdata transmission at bitrates up to 64kbps.
5 Future trendsDr Golding at Hughes Network Sys-tems has stated that future trends inVSAT networks will be driven by thefollowing goals (4):
- Lowering costs of the VSAT termi-nals, hub stations and installation ofthese networks
- Providing a greater range of service,including voice and compressedvideo services
- Providing networks that are moreuser friendly and flexible in terms ofoperations, administration and main-tenance
- Integration of these networks with alarger variety of Customer PremisesEquipment (CPE), and more advan-ced terrestrial networks includingfibre optic networks, newer swit-ching equipment and ISDN.
Today, integration of the VSAT net-works with the terrestrial commoncarrier network is via gateways gene-rally located at the hub station. In thefuture, the VSAT networks will beinterfacing with the ISDN terrestrialnetwork and multiple gateway interfa-ces may become more important withgreater use of full mesh network archi-tecture. It is important that in theselection of link and network layerprotocol standards for ISDN, satellitenetworks will be considered withrespect to unique properties of thesenetworks, such as time delay andbroadcast capabilities.
In addition to future trends in theVSAT ground networks one canexpect new technology to be impor-tant in the space segment area. Newcommunication satellites will incorpo-rate the following features, which willhave a significant impact on futureVSAT networks:
- Amplifiers with higher output power
- Use of spot beams and scanningbeams
- On-board processing
- Intersatellite links.
These features will permit highercapacity VSAT networks with lowercost earth stations and greater flexibi-lity. The use of intersatellite links mayprovide direct connectivity and inte-gration into other networks withoutrequiring terrestrial connections.Direct integration with mobile net-works may also be possible by thismethod.
VSAT systems have not grown asrapidly in the rest of the world as inthe USA. This is mainly because of theregulatory environments. In order tomake the situation in Western Europeapproach the situation in the USA, theEuropean Community intends toextend the applications of the gene-rally agreed principles of Communitytelecommunications policy to satellitecommunications. This will implicateliberalisation of earth segment and ter-minals.
44
After the recent development in Eas-tern Europe this has been consideredto be a new and very promising mar-ket for VSAT systems because of thelack of terrestrial networks. ESA(European Space Agency) has studiedthe market opportunities for VSATnetworks in Eastern Europe. Theyconclude that the market for tradi-tional business VSAT (star topology)is limited, but for the so-called “uncon-ventional” VSAT systems (mesh net-works), which offer telephony, themarket appears to be very promising(5).
References
1 Pelton, J N. International VSATApplications and ISDN. IEEE Com-munications Magazine, 60-61, May1989.
2 ETSI. Satellite Earth Stations(SES); Transmit/receive VSATsused for data communications ope-rating in the FSS 11/12/14-GHz-bands. (DE/SES-2002), ETS 300159, February 1992.
3 Mesch, R G. Shared VSAT HubExpectations. VSAT ’91 Conference& European Satellite Users Show,Luxembourg, 5-7 November 1991.
4 Golding, L S. Future Trends inVSAT Networks. IEEE Communi-cations Magazine, 58-59, May 1989.
5 Pinglier, A. Marked opportunitiesfor VSAT networks in EasternEurope. In: Proceedings of The 8thEuropean Satellite Communicati-ons Conference, London, December1991, 129-139.
45
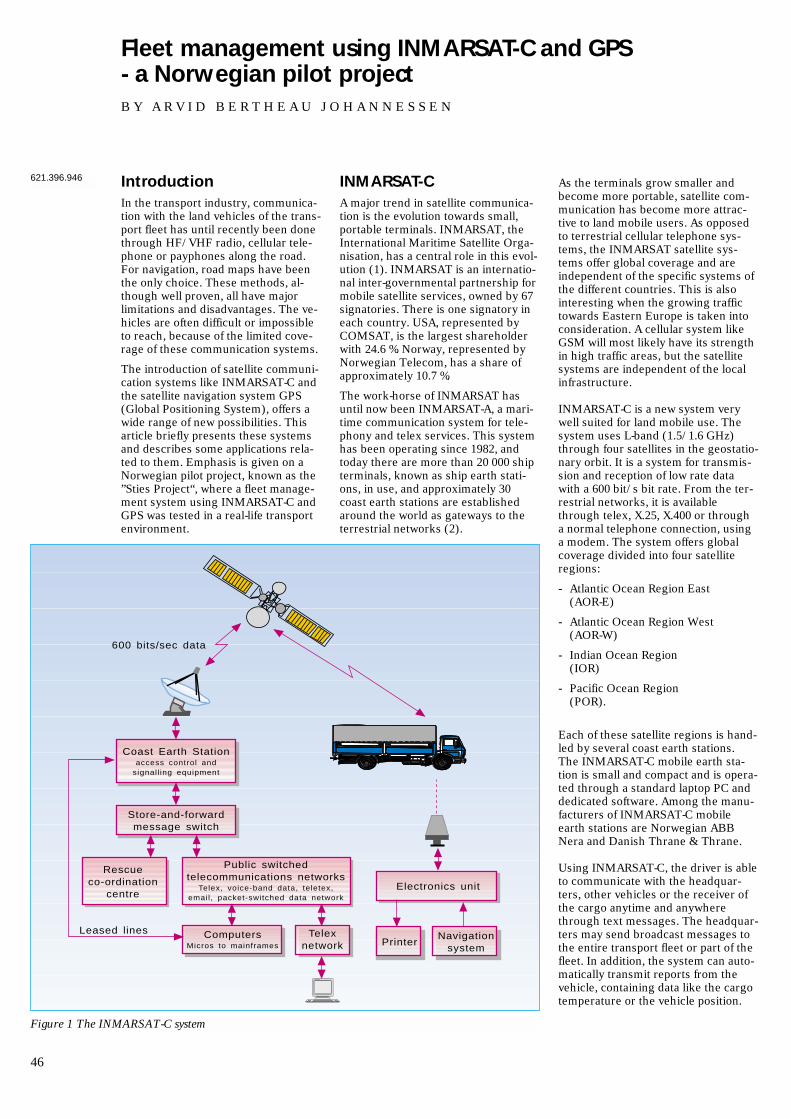
IntroductionIn the transport industry, communica-tion with the land vehicles of the trans-port fleet has until recently been donethrough HF/VHF radio, cellular tele-phone or payphones along the road.For navigation, road maps have beenthe only choice. These methods, al-though well proven, all have majorlimitations and disadvantages. The ve-hicles are often difficult or impossibleto reach, because of the limited cove-rage of these communication systems.
The introduction of satellite communi-cation systems like INMARSAT-C andthe satellite navigation system GPS(Global Positioning System), offers awide range of new possibilities. Thisarticle briefly presents these systemsand describes some applications rela-ted to them. Emphasis is given on aNorwegian pilot project, known as the”Sties Project“, where a fleet manage-ment system using INMARSAT-C andGPS was tested in a real-life transportenvironment.
INMARSAT-CA major trend in satellite communica-tion is the evolution towards small,portable terminals. INMARSAT, theInternational Maritime Satellite Orga-nisation, has a central role in this evol-ution (1). INMARSAT is an internatio-nal inter-governmental partnership formobile satellite services, owned by 67signatories. There is one signatory ineach country. USA, represented byCOMSAT, is the largest shareholderwith 24.6 %. Norway, represented byNorwegian Telecom, has a share ofapproximately 10.7 %.
The work-horse of INMARSAT hasuntil now been INMARSAT-A, a mari-time communication system for tele-phony and telex services. This systemhas been operating since 1982, andtoday there are more than 20 000 shipterminals, known as ship earth stati-ons, in use, and approximately 30coast earth stations are establishedaround the world as gateways to theterrestrial networks (2).
As the terminals grow smaller andbecome more portable, satellite com-munication has become more attrac-tive to land mobile users. As opposedto terrestrial cellular telephone sys-tems, the INMARSAT satellite sys-tems offer global coverage and areindependent of the specific systems ofthe different countries. This is alsointeresting when the growing traffictowards Eastern Europe is taken intoconsideration. A cellular system likeGSM will most likely have its strengthin high traffic areas, but the satellitesystems are independent of the localinfrastructure.
INMARSAT-C is a new system verywell suited for land mobile use. Thesystem uses L-band (1.5/1.6 GHz)through four satellites in the geostatio-nary orbit. It is a system for transmis-sion and reception of low rate datawith a 600 bit/s bit rate. From the ter-restrial networks, it is availablethrough telex, X.25, X.400 or througha normal telephone connection, usinga modem. The system offers globalcoverage divided into four satelliteregions:
- Atlantic Ocean Region East(AOR-E)
- Atlantic Ocean Region West(AOR-W)
- Indian Ocean Region(IOR)
- Pacific Ocean Region(POR).
Each of these satellite regions is hand-led by several coast earth stations.The INMARSAT-C mobile earth sta-tion is small and compact and is opera-ted through a standard laptop PC anddedicated software. Among the manu-facturers of INMARSAT-C mobileearth stations are Norwegian ABBNera and Danish Thrane & Thrane.
Using INMARSAT-C, the driver is ableto communicate with the headquar-ters, other vehicles or the receiver ofthe cargo anytime and anywherethrough text messages. The headquar-ters may send broadcast messages tothe entire transport fleet or part of thefleet. In addition, the system can auto-matically transmit reports from thevehicle, containing data like the cargotemperature or the vehicle position.
46
Fleet management using INMARSAT-C and GPS - a Norwegian pilot projectB Y A R V I D B E R T H E A U J O H A N N E S S E N
621.396.946
Figure 1 The INMARSAT-C system
Coast Earth Stationaccess control and
signall ing equipment
Store-and-forwardmessage switch
Rescueco-ordination
centre
Public switchedtelecommunications networks
Telex, voice-band data, teletex,email, packet-switched data network
ComputersMicros to mainframes
Telexnetwork
Leased lines
Electronics unit
PrinterNavigation
system
600 bits/sec data
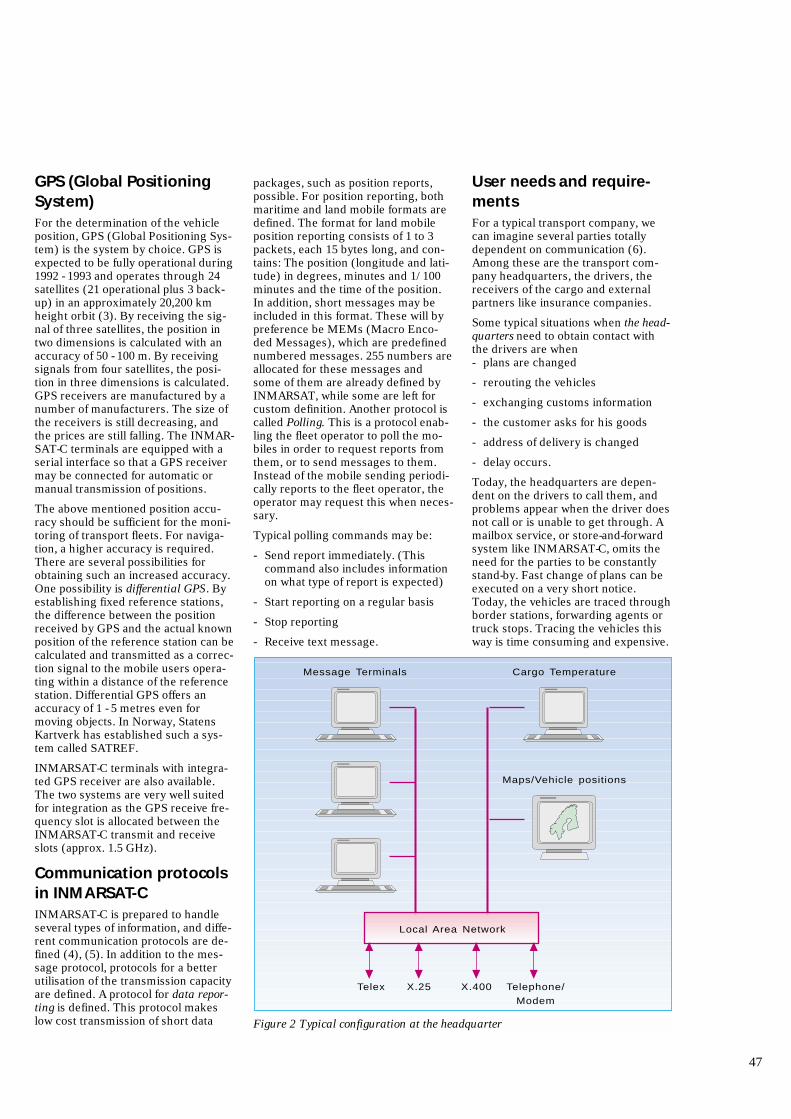
GPS (Global PositioningSystem)For the determination of the vehicleposition, GPS (Global Positioning Sys-tem) is the system by choice. GPS isexpected to be fully operational during1992 - 1993 and operates through 24satellites (21 operational plus 3 back-up) in an approximately 20,200 kmheight orbit (3). By receiving the sig-nal of three satellites, the position intwo dimensions is calculated with anaccuracy of 50 - 100 m. By receivingsignals from four satellites, the posi-tion in three dimensions is calculated.GPS receivers are manufactured by anumber of manufacturers. The size ofthe receivers is still decreasing, andthe prices are still falling. The INMAR-SAT-C terminals are equipped with aserial interface so that a GPS receivermay be connected for automatic ormanual transmission of positions.
The above mentioned position accu-racy should be sufficient for the moni-toring of transport fleets. For naviga-tion, a higher accuracy is required.There are several possibilities forobtaining such an increased accuracy.One possibility is differential GPS. Byestablishing fixed reference stations,the difference between the positionreceived by GPS and the actual knownposition of the reference station can becalculated and transmitted as a correc-tion signal to the mobile users opera-ting within a distance of the referencestation. Differential GPS offers anaccuracy of 1 - 5 metres even formoving objects. In Norway, StatensKartverk has established such a sys-tem called SATREF.
INMARSAT-C terminals with integra-ted GPS receiver are also available.The two systems are very well suitedfor integration as the GPS receive fre-quency slot is allocated between theINMARSAT-C transmit and receiveslots (approx. 1.5 GHz).
Communication protocolsin INMARSAT-CINMARSAT-C is prepared to handleseveral types of information, and diffe-rent communication protocols are de-fined (4), (5). In addition to the mes-sage protocol, protocols for a betterutilisation of the transmission capacityare defined. A protocol for data repor-ting is defined. This protocol makeslow cost transmission of short data
packages, such as position reports,possible. For position reporting, bothmaritime and land mobile formats aredefined. The format for land mobileposition reporting consists of 1 to 3packets, each 15 bytes long, and con-tains: The position (longitude and lati-tude) in degrees, minutes and 1/100minutes and the time of the position.In addition, short messages may beincluded in this format. These will bypreference be MEMs (Macro Enco-ded Messages), which are predefinednumbered messages. 255 numbers areallocated for these messages andsome of them are already defined byINMARSAT, while some are left forcustom definition. Another protocol iscalled Polling. This is a protocol enab-ling the fleet operator to poll the mo-biles in order to request reports fromthem, or to send messages to them.Instead of the mobile sending periodi-cally reports to the fleet operator, theoperator may request this when neces-sary.
Typical polling commands may be:
- Send report immediately. (Thiscommand also includes informationon what type of report is expected)
- Start reporting on a regular basis
- Stop reporting
- Receive text message.
User needs and require-mentsFor a typical transport company, wecan imagine several parties totallydependent on communication (6).Among these are the transport com-pany headquarters, the drivers, thereceivers of the cargo and externalpartners like insurance companies.
Some typical situations when the head-quarters need to obtain contact withthe drivers are when- plans are changed
- rerouting the vehicles
- exchanging customs information
- the customer asks for his goods
- address of delivery is changed
- delay occurs.
Today, the headquarters are depen-dent on the drivers to call them, andproblems appear when the driver doesnot call or is unable to get through. Amailbox service, or store-and-forwardsystem like INMARSAT-C, omits theneed for the parties to be constantlystand-by. Fast change of plans can beexecuted on a very short notice.Today, the vehicles are traced throughborder stations, forwarding agents ortruck stops. Tracing the vehicles thisway is time consuming and expensive.
47
Figure 2 Typical configuration at the headquarter
Local Area Network
Message Terminals Cargo Temperature
Maps/Vehicle positions
Telex X.25 X.400 Telephone/
Modem
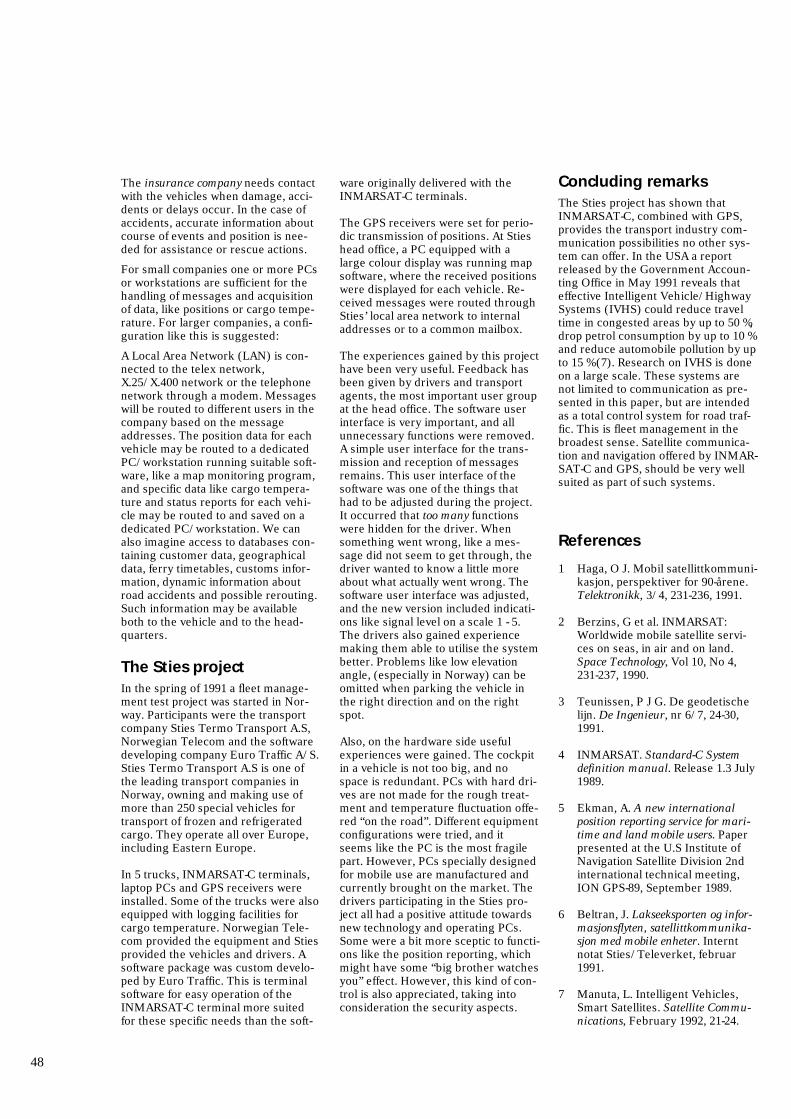
The insurance company needs contactwith the vehicles when damage, acci-dents or delays occur. In the case ofaccidents, accurate information aboutcourse of events and position is nee-ded for assistance or rescue actions.
For small companies one or more PCsor workstations are sufficient for thehandling of messages and acquisitionof data, like positions or cargo tempe-rature. For larger companies, a confi-guration like this is suggested:
A Local Area Network (LAN) is con-nected to the telex network,X.25/X.400 network or the telephonenetwork through a modem. Messageswill be routed to different users in thecompany based on the messageaddresses. The position data for eachvehicle may be routed to a dedicatedPC/workstation running suitable soft-ware, like a map monitoring program,and specific data like cargo tempera-ture and status reports for each vehi-cle may be routed to and saved on adedicated PC/workstation. We canalso imagine access to databases con-taining customer data, geographicaldata, ferry timetables, customs infor-mation, dynamic information aboutroad accidents and possible rerouting.Such information may be availableboth to the vehicle and to the head-quarters.
The Sties projectIn the spring of 1991 a fleet manage-ment test project was started in Nor-way. Participants were the transportcompany Sties Termo Transport A.S,Norwegian Telecom and the softwaredeveloping company Euro Traffic A/S.Sties Termo Transport A.S is one ofthe leading transport companies inNorway, owning and making use ofmore than 250 special vehicles fortransport of frozen and refrigeratedcargo. They operate all over Europe,including Eastern Europe.
In 5 trucks, INMARSAT-C terminals,laptop PCs and GPS receivers wereinstalled. Some of the trucks were alsoequipped with logging facilities forcargo temperature. Norwegian Tele-com provided the equipment and Stiesprovided the vehicles and drivers. Asoftware package was custom develo-ped by Euro Traffic. This is terminalsoftware for easy operation of theINMARSAT-C terminal more suitedfor these specific needs than the soft-
ware originally delivered with theINMARSAT-C terminals.
The GPS receivers were set for perio-dic transmission of positions. At Stieshead office, a PC equipped with alarge colour display was running mapsoftware, where the received positionswere displayed for each vehicle. Re-ceived messages were routed throughSties’ local area network to internaladdresses or to a common mailbox.
The experiences gained by this projecthave been very useful. Feedback hasbeen given by drivers and transportagents, the most important user groupat the head office. The software userinterface is very important, and allunnecessary functions were removed.A simple user interface for the trans-mission and reception of messagesremains. This user interface of thesoftware was one of the things thathad to be adjusted during the project.It occurred that too many functionswere hidden for the driver. Whensomething went wrong, like a mes-sage did not seem to get through, thedriver wanted to know a little moreabout what actually went wrong. Thesoftware user interface was adjusted,and the new version included indicati-ons like signal level on a scale 1 - 5.The drivers also gained experiencemaking them able to utilise the systembetter. Problems like low elevationangle, (especially in Norway) can beomitted when parking the vehicle inthe right direction and on the rightspot.
Also, on the hardware side usefulexperiences were gained. The cockpitin a vehicle is not too big, and nospace is redundant. PCs with hard dri-ves are not made for the rough treat-ment and temperature fluctuation offe-red “on the road”. Different equipmentconfigurations were tried, and itseems like the PC is the most fragilepart. However, PCs specially designedfor mobile use are manufactured andcurrently brought on the market. Thedrivers participating in the Sties pro-ject all had a positive attitude towardsnew technology and operating PCs.Some were a bit more sceptic to functi-ons like the position reporting, whichmight have some “big brother watchesyou” effect. However, this kind of con-trol is also appreciated, taking intoconsideration the security aspects.
Concluding remarksThe Sties project has shown thatINMARSAT-C, combined with GPS,provides the transport industry com-munication possibilities no other sys-tem can offer. In the USA a reportreleased by the Government Accoun-ting Office in May 1991 reveals thateffective Intelligent Vehicle/HighwaySystems (IVHS) could reduce traveltime in congested areas by up to 50 %,drop petrol consumption by up to 10 %and reduce automobile pollution by upto 15 % (7). Research on IVHS is doneon a large scale. These systems arenot limited to communication as pre-sented in this paper, but are intendedas a total control system for road traf-fic. This is fleet management in thebroadest sense. Satellite communica-tion and navigation offered by INMAR-SAT-C and GPS, should be very wellsuited as part of such systems.
References
1 Haga, O J. Mobil satellittkommuni-kasjon, perspektiver for 90-årene.Telektronikk, 3/4, 231-236, 1991.
2 Berzins, G et al. INMARSAT:Worldwide mobile satellite servi-ces on seas, in air and on land.Space Technology, Vol 10, No 4,231-237, 1990.
3 Teunissen, P J G. De geodetischelijn. De Ingenieur, nr 6/7, 24-30,1991.
4 INMARSAT. Standard-C Systemdefinition manual. Release 1.3 July1989.
5 Ekman, A. A new internationalposition reporting service for mari-time and land mobile users. Paperpresented at the U.S Institute ofNavigation Satellite Division 2ndinternational technical meeting,ION GPS-89, September 1989.
6 Beltran, J. Lakseeksporten og infor-masjonsflyten, satellittkommunika-sjon med mobile enheter. Interntnotat Sties/Televerket, februar1991.
7 Manuta, L. Intelligent Vehicles,Smart Satellites. Satellite Commu-nications, February 1992, 21-24.
48
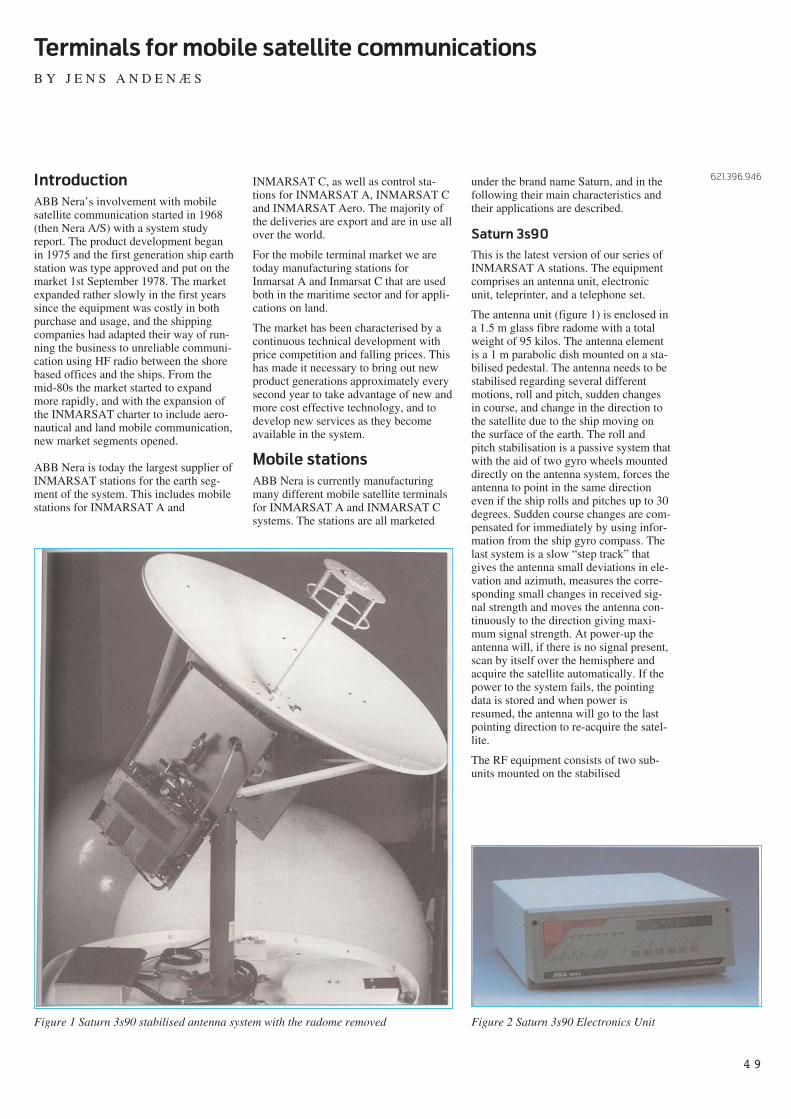
Introduction
ABB Nera’s involvement with mobilesatellite communication started in 1968(then Nera A/S) with a system studyreport. The product development beganin 1975 and the first generation ship earthstation was type approved and put on themarket 1st September 1978. The marketexpanded rather slowly in the first yearssince the equipment was costly in bothpurchase and usage, and the shippingcompanies had adapted their way of run-ning the business to unreliable communi-cation using HF radio between the shorebased offices and the ships. From themid-80s the market started to expandmore rapidly, and with the expansion ofthe INMARSAT charter to include aero-nautical and land mobile communication,new market segments opened.
ABB Nera is today the largest supplier ofINMARSAT stations for the earth seg-ment of the system. This includes mobilestations for INMARSAT A and
INMARSAT C, as well as control sta-tions for INMARSAT A, INMARSAT Cand INMARSAT Aero. The majority ofthe deliveries are export and are in use allover the world.
For the mobile terminal market we aretoday manufacturing stations forInmarsat A and Inmarsat C that are usedboth in the maritime sector and for appli-cations on land.
The market has been characterised by acontinuous technical development withprice competition and falling prices. Thishas made it necessary to bring out newproduct generations approximately everysecond year to take advantage of new andmore cost effective technology, and todevelop new services as they becomeavailable in the system.
Mobile stations
ABB Nera is currently manufacturingmany different mobile satellite terminalsfor INMARSAT A and INMARSAT Csystems. The stations are all marketed
under the brand name Saturn, and in thefollowing their main characteristics andtheir applications are described.
Saturn 3s90
This is the latest version of our series ofINMARSAT A stations. The equipmentcomprises an antenna unit, electronicunit, teleprinter, and a telephone set.
The antenna unit (figure 1) is enclosed ina 1.5 m glass fibre radome with a totalweight of 95 kilos. The antenna elementis a 1 m parabolic dish mounted on a sta-bilised pedestal. The antenna needs to bestabilised regarding several differentmotions, roll and pitch, sudden changesin course, and change in the direction tothe satellite due to the ship moving onthe surface of the earth. The roll andpitch stabilisation is a passive system thatwith the aid of two gyro wheels mounteddirectly on the antenna system, forces theantenna to point in the same directioneven if the ship rolls and pitches up to 30degrees. Sudden course changes are com-pensated for immediately by using infor-mation from the ship gyro compass. Thelast system is a slow “step track” thatgives the antenna small deviations in ele-vation and azimuth, measures the corre-sponding small changes in received sig-nal strength and moves the antenna con-tinuously to the direction giving maxi-mum signal strength. At power-up theantenna will, if there is no signal present,scan by itself over the hemisphere andacquire the satellite automatically. If thepower to the system fails, the pointingdata is stored and when power isresumed, the antenna will go to the lastpointing direction to re-acquire the satel-lite.
The RF equipment consists of two sub-units mounted on the stabilised
4 9
Terminals for mobile satellite communications
B Y J E N S A N D E N Æ S
621.396.946
Figure 1 Saturn 3s90 stabilised antenna system with the radome removed Figure 2 Saturn 3s90 Electronics Unit
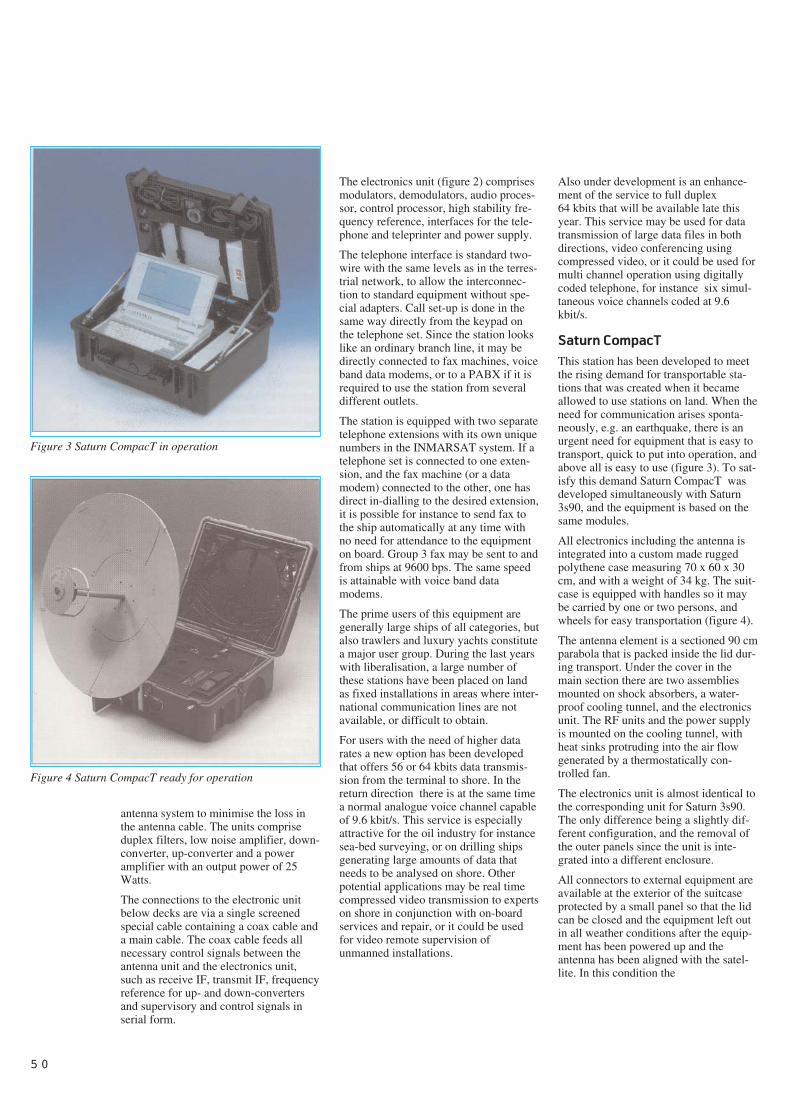
antenna system to minimise the loss inthe antenna cable. The units compriseduplex filters, low noise amplifier, down-converter, up-converter and a poweramplifier with an output power of 25Watts.
The connections to the electronic unitbelow decks are via a single screenedspecial cable containing a coax cable anda main cable. The coax cable feeds allnecessary control signals between theantenna unit and the electronics unit,such as receive IF, transmit IF, frequencyreference for up- and down-convertersand supervisory and control signals inserial form.
The electronics unit (figure 2) comprisesmodulators, demodulators, audio proces-sor, control processor, high stability fre-quency reference, interfaces for the tele-phone and teleprinter and power supply.
The telephone interface is standard two-wire with the same levels as in the terres-trial network, to allow the interconnec-tion to standard equipment without spe-cial adapters. Call set-up is done in thesame way directly from the keypad onthe telephone set. Since the station lookslike an ordinary branch line, it may bedirectly connected to fax machines, voiceband data modems, or to a PABX if it isrequired to use the station from severaldifferent outlets.
The station is equipped with two separatetelephone extensions with its own uniquenumbers in the INMARSAT system. If atelephone set is connected to one exten-sion, and the fax machine (or a datamodem) connected to the other, one hasdirect in-dialling to the desired extension,it is possible for instance to send fax tothe ship automatically at any time withno need for attendance to the equipmenton board. Group 3 fax may be sent to andfrom ships at 9600 bps. The same speedis attainable with voice band datamodems.
The prime users of this equipment aregenerally large ships of all categories, butalso trawlers and luxury yachts constitutea major user group. During the last yearswith liberalisation, a large number ofthese stations have been placed on landas fixed installations in areas where inter-national communication lines are notavailable, or difficult to obtain.
For users with the need of higher datarates a new option has been developedthat offers 56 or 64 kbits data transmis-sion from the terminal to shore. In thereturn direction there is at the same timea normal analogue voice channel capableof 9.6 kbit/s. This service is especiallyattractive for the oil industry for instancesea-bed surveying, or on drilling shipsgenerating large amounts of data thatneeds to be analysed on shore. Otherpotential applications may be real timecompressed video transmission to expertson shore in conjunction with on-boardservices and repair, or it could be usedfor video remote supervision ofunmanned installations.
Also under development is an enhance-ment of the service to full duplex64 kbits that will be available late thisyear. This service may be used for datatransmission of large data files in bothdirections, video conferencing usingcompressed video, or it could be used formulti channel operation using digitallycoded telephone, for instance six simul-taneous voice channels coded at 9.6kbit/s.
Saturn CompacT
This station has been developed to meetthe rising demand for transportable sta-tions that was created when it becameallowed to use stations on land. When theneed for communication arises sponta-neously, e.g. an earthquake, there is anurgent need for equipment that is easy totransport, quick to put into operation, andabove all is easy to use (figure 3). To sat-isfy this demand Saturn CompacT wasdeveloped simultaneously with Saturn3s90, and the equipment is based on thesame modules.
All electronics including the antenna isintegrated into a custom made ruggedpolythene case measuring 70 x 60 x 30cm, and with a weight of 34 kg. The suit-case is equipped with handles so it maybe carried by one or two persons, andwheels for easy transportation (figure 4).
The antenna element is a sectioned 90 cmparabola that is packed inside the lid dur-ing transport. Under the cover in themain section there are two assembliesmounted on shock absorbers, a water-proof cooling tunnel, and the electronicsunit. The RF units and the power supplyis mounted on the cooling tunnel, withheat sinks protruding into the air flowgenerated by a thermostatically con-trolled fan.
The electronics unit is almost identical tothe corresponding unit for Saturn 3s90.The only difference being a slightly dif-ferent configuration, and the removal ofthe outer panels since the unit is inte-grated into a different enclosure.
All connectors to external equipment areavailable at the exterior of the suitcaseprotected by a small panel so that the lidcan be closed and the equipment left outin all weather conditions after the equip-ment has been powered up and theantenna has been aligned with the satel-lite. In this condition the
5 0
Figure 3 Saturn CompacT in operation
Figure 4 Saturn CompacT ready for operation
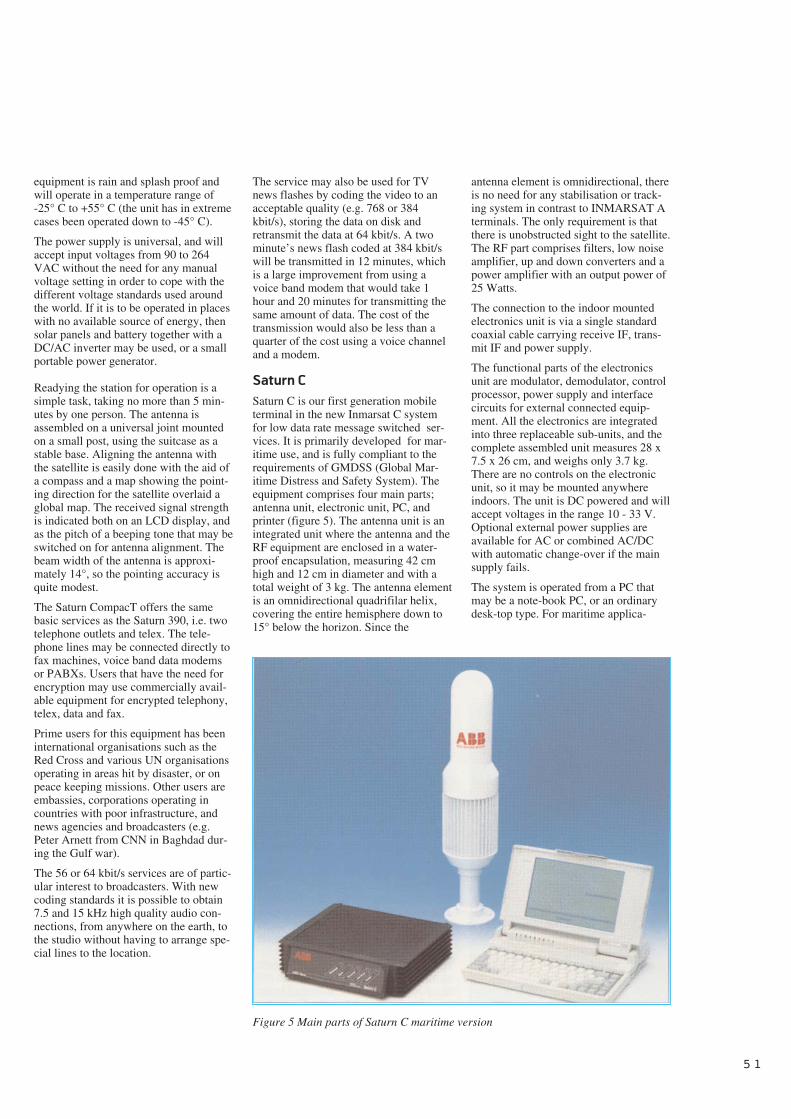
equipment is rain and splash proof andwill operate in a temperature range of -25° C to +55° C (the unit has in extremecases been operated down to -45° C).
The power supply is universal, and willaccept input voltages from 90 to 264VAC without the need for any manualvoltage setting in order to cope with thedifferent voltage standards used aroundthe world. If it is to be operated in placeswith no available source of energy, thensolar panels and battery together with aDC/AC inverter may be used, or a smallportable power generator.
Readying the station for operation is asimple task, taking no more than 5 min-utes by one person. The antenna isassembled on a universal joint mountedon a small post, using the suitcase as astable base. Aligning the antenna withthe satellite is easily done with the aid ofa compass and a map showing the point-ing direction for the satellite overlaid aglobal map. The received signal strengthis indicated both on an LCD display, andas the pitch of a beeping tone that may beswitched on for antenna alignment. Thebeam width of the antenna is approxi-mately 14°, so the pointing accuracy isquite modest.
The Saturn CompacT offers the samebasic services as the Saturn 390, i.e. twotelephone outlets and telex. The tele-phone lines may be connected directly tofax machines, voice band data modemsor PABXs. Users that have the need forencryption may use commercially avail-able equipment for encrypted telephony,telex, data and fax.
Prime users for this equipment has beeninternational organisations such as theRed Cross and various UN organisationsoperating in areas hit by disaster, or onpeace keeping missions. Other users areembassies, corporations operating incountries with poor infrastructure, andnews agencies and broadcasters (e.g.Peter Arnett from CNN in Baghdad dur-ing the Gulf war).
The 56 or 64 kbit/s services are of partic-ular interest to broadcasters. With newcoding standards it is possible to obtain7.5 and 15 kHz high quality audio con-nections, from anywhere on the earth, tothe studio without having to arrange spe-cial lines to the location.
The service may also be used for TVnews flashes by coding the video to anacceptable quality (e.g. 768 or 384kbit/s), storing the data on disk andretransmit the data at 64 kbit/s. A twominute’s news flash coded at 384 kbit/swill be transmitted in 12 minutes, whichis a large improvement from using avoice band modem that would take 1hour and 20 minutes for transmitting thesame amount of data. The cost of thetransmission would also be less than aquarter of the cost using a voice channeland a modem.
Saturn C
Saturn C is our first generation mobileterminal in the new Inmarsat C systemfor low data rate message switched ser-vices. It is primarily developed for mar-itime use, and is fully compliant to therequirements of GMDSS (Global Mar-itime Distress and Safety System). Theequipment comprises four main parts;antenna unit, electronic unit, PC, andprinter (figure 5). The antenna unit is anintegrated unit where the antenna and theRF equipment are enclosed in a water-proof encapsulation, measuring 42 cmhigh and 12 cm in diameter and with atotal weight of 3 kg. The antenna elementis an omnidirectional quadrifilar helix,covering the entire hemisphere down to15° below the horizon. Since the
antenna element is omnidirectional, thereis no need for any stabilisation or track-ing system in contrast to INMARSAT Aterminals. The only requirement is thatthere is unobstructed sight to the satellite.The RF part comprises filters, low noiseamplifier, up and down converters and apower amplifier with an output power of25 Watts.
The connection to the indoor mountedelectronics unit is via a single standardcoaxial cable carrying receive IF, trans-mit IF and power supply.
The functional parts of the electronicsunit are modulator, demodulator, controlprocessor, power supply and interfacecircuits for external connected equip-ment. All the electronics are integratedinto three replaceable sub-units, and thecomplete assembled unit measures 28 x7.5 x 26 cm, and weighs only 3.7 kg.There are no controls on the electronicunit, so it may be mounted anywhereindoors. The unit is DC powered and willaccept voltages in the range 10 - 33 V.Optional external power supplies areavailable for AC or combined AC/DCwith automatic change-over if the mainsupply fails.
The system is operated from a PC thatmay be a note-book PC, or an ordinarydesk-top type. For maritime applica-
5 1
Figure 5 Main parts of Saturn C maritime version
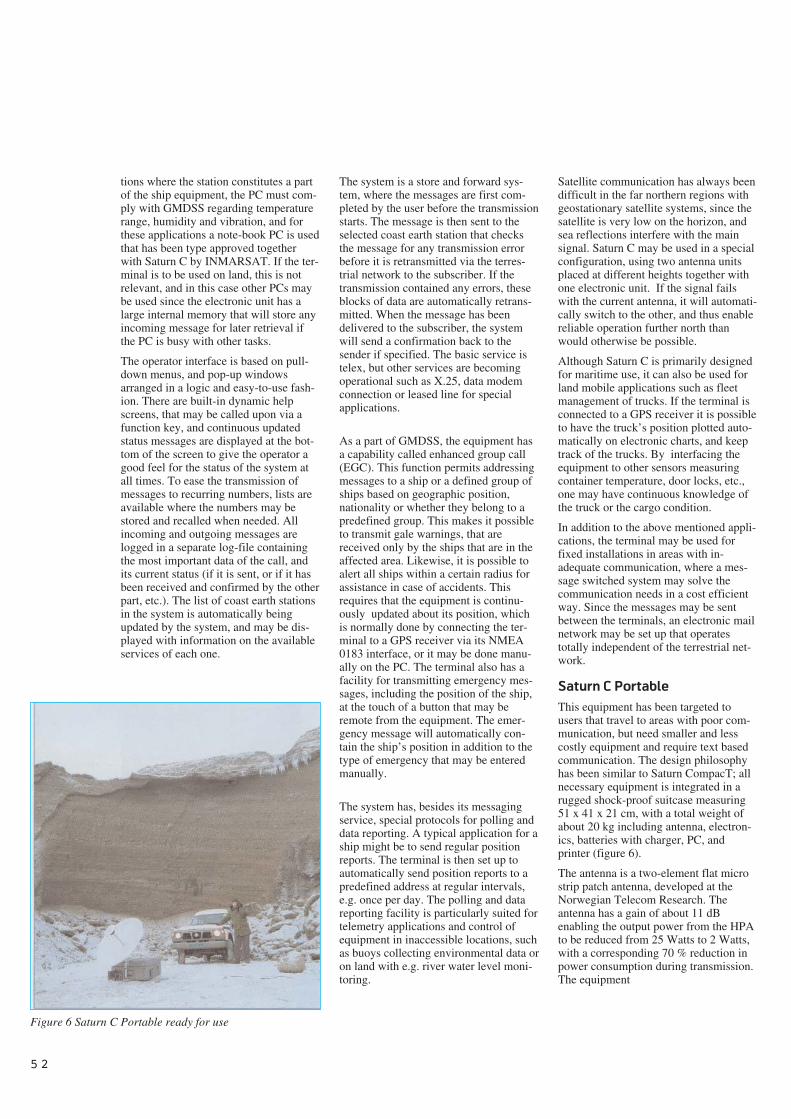
tions where the station constitutes a partof the ship equipment, the PC must com-ply with GMDSS regarding temperaturerange, humidity and vibration, and forthese applications a note-book PC is usedthat has been type approved togetherwith Saturn C by INMARSAT. If the ter-minal is to be used on land, this is notrelevant, and in this case other PCs maybe used since the electronic unit has alarge internal memory that will store anyincoming message for later retrieval ifthe PC is busy with other tasks.
The operator interface is based on pull-down menus, and pop-up windowsarranged in a logic and easy-to-use fash-ion. There are built-in dynamic helpscreens, that may be called upon via afunction key, and continuous updatedstatus messages are displayed at the bot-tom of the screen to give the operator agood feel for the status of the system atall times. To ease the transmission ofmessages to recurring numbers, lists areavailable where the numbers may bestored and recalled when needed. Allincoming and outgoing messages arelogged in a separate log-file containingthe most important data of the call, andits current status (if it is sent, or if it hasbeen received and confirmed by the otherpart, etc.). The list of coast earth stationsin the system is automatically beingupdated by the system, and may be dis-played with information on the availableservices of each one.
The system is a store and forward sys-tem, where the messages are first com-pleted by the user before the transmissionstarts. The message is then sent to theselected coast earth station that checksthe message for any transmission errorbefore it is retransmitted via the terres-trial network to the subscriber. If thetransmission contained any errors, theseblocks of data are automatically retrans-mitted. When the message has beendelivered to the subscriber, the systemwill send a confirmation back to thesender if specified. The basic service istelex, but other services are becomingoperational such as X.25, data modemconnection or leased line for specialapplications.
As a part of GMDSS, the equipment hasa capability called enhanced group call(EGC). This function permits addressingmessages to a ship or a defined group ofships based on geographic position,nationality or whether they belong to apredefined group. This makes it possibleto transmit gale warnings, that arereceived only by the ships that are in theaffected area. Likewise, it is possible toalert all ships within a certain radius forassistance in case of accidents. Thisrequires that the equipment is continu-ously updated about its position, whichis normally done by connecting the ter-minal to a GPS receiver via its NMEA0183 interface, or it may be done manu-ally on the PC. The terminal also has afacility for transmitting emergency mes-sages, including the position of the ship,at the touch of a button that may beremote from the equipment. The emer-gency message will automatically con-tain the ship’s position in addition to thetype of emergency that may be enteredmanually.
The system has, besides its messagingservice, special protocols for polling anddata reporting. A typical application for aship might be to send regular positionreports. The terminal is then set up toautomatically send position reports to apredefined address at regular intervals,e.g. once per day. The polling and datareporting facility is particularly suited fortelemetry applications and control ofequipment in inaccessible locations, suchas buoys collecting environmental data oron land with e.g. river water level moni-toring.
Satellite communication has always beendifficult in the far northern regions withgeostationary satellite systems, since thesatellite is very low on the horizon, andsea reflections interfere with the mainsignal. Saturn C may be used in a specialconfiguration, using two antenna unitsplaced at different heights together withone electronic unit. If the signal failswith the current antenna, it will automati-cally switch to the other, and thus enablereliable operation further north thanwould otherwise be possible.
Although Saturn C is primarily designedfor maritime use, it can also be used forland mobile applications such as fleetmanagement of trucks. If the terminal isconnected to a GPS receiver it is possibleto have the truck’s position plotted auto-matically on electronic charts, and keeptrack of the trucks. By interfacing theequipment to other sensors measuringcontainer temperature, door locks, etc.,one may have continuous knowledge ofthe truck or the cargo condition.
In addition to the above mentioned appli-cations, the terminal may be used forfixed installations in areas with in-adequate communication, where a mes-sage switched system may solve thecommunication needs in a cost efficientway. Since the messages may be sentbetween the terminals, an electronic mailnetwork may be set up that operatestotally independent of the terrestrial net-work.
Saturn C Portable
This equipment has been targeted tousers that travel to areas with poor com-munication, but need smaller and lesscostly equipment and require text basedcommunication. The design philosophyhas been similar to Saturn CompacT; allnecessary equipment is integrated in arugged shock-proof suitcase measuring51 x 41 x 21 cm, with a total weight ofabout 20 kg including antenna, electron-ics, batteries with charger, PC, andprinter (figure 6).
The antenna is a two-element flat microstrip patch antenna, developed at theNorwegian Telecom Research. Theantenna has a gain of about 11 dBenabling the output power from the HPAto be reduced from 25 Watts to 2 Watts,with a corresponding 70 % reduction inpower consumption during transmission.The equipment
5 2
Figure 6 Saturn C Portable ready for use
may be operated without taking theantenna out of the suitcase, since thelid is transparent to the signals. Thelid may be locked in any position, andit is equipped with an elevation indica-tion that facilitates the alignment withthe satellite. Total time needed for set-ting up equipment for operation is lessthan a minute. The beam width of theantenna is 65° in elevation, and 35° inazimuth, which makes the acquisitionof the signal a trivial matter.
If the equipment is to be used in asemi-permanent or permanent loca-tion, the antenna may be remote fromthe other equipment and placed out-doors on a small adjustable foot that isalso packed in the suitcase. The stan-dard length of the supplied cable is5 m which is adequate in most cases,but the antenna may be remote up to100 m using suitable coax.
Power is always a problem with port-able equipment that is to be used allaround the world, and Saturn C istherefore delivered with a universalpower supply that accepts voltages inthe range of 90 to 264 VAC, or fromexternal 12 V battery. The built-inpower supply also supplies the PC andprinter with appropriate power.
Saturn C Scada
Saturn C Scada is not a single configu-ration but covers several different vari-ants dependent on the applications.Fixed installations on land may usethe same directive antenna unit deve-loped for the Saturn C Portable whileapplications at sea, for instance onbuoys, will use the omnidirectionalmaritime antenna. The electronics unitis in both cases the same as is used forthe maritime applications but with thesoftware adapted to SCADA applica-tions using the polling and data repor-ting protocols. These protocols per-forms the transmission of small datapackets at a much lower user chargeand shorter transmission delay com-pared to the normal message proto-cols. This is of great significance forsystems that transmits data maybeseveral times a day for a prolongedtime.
The equipment is normally connectedto a dedicated controller instead of thePC controlling both data loggers, sen-sors and the transmission. Controllersare available that conserve the powerused by the equipment by switchingoff the power when idle and activate
the equipment only when data is to betransmitted. This reduces the size andthe cost of solar panels and batteriesconsiderably. Saturn C was especiallydesigned with low power consumptionin mind and is thus very suitable forthese applications.
Saturn B and Saturn M
These are next generation productsthat have been under development forover a year and will be put into produc-tion next year.
Saturn B is a follow up of Saturn 3s90,and will be developed in both mari-time and transportable versions. Thisis a satellite terminal where all the ser-vices are digitised to expand the capa-city in the system. The antenna sys-tem remains basically the same, and isa stabilised 90 - 100 cm dish. The ser-vices are high quality voice coded at16 kbit/s, fax and data at 9.6 kbit/splus optional high speed data at64 kbit/s. The primary users will bethe same as for Saturn 3s90 andSaturn CompacT.
Saturn M is currently being developedin two variants; maritime and portable.The basic services are medium qualityvoice coded at approximately 4.1kbit/s, fax and data at 2.4 kbit/s. Theantenna size including radome will be60 cm for the maritime version. Thisopens up new user groups that areprevented from using the currentgeneration equipment due to its size.In the maritime sector it can be placedon smaller yachts and fishing vessels,thus greatly expanding the potentialmarket size. A portable variant willhave a weight of 9 kg.
The electronics unit for the stations isextremely compact, with the measuresof 31 x 21 x 7 cm. An important factorfor the reduction in size is an in-housedevelopment of ASICs with approxi-mately 600,000 transistors performingmost of the critical modem functions.
ReflectionsABB Nera’s results and position in theINMARSAT field are relatively rare inNorwegian electronics industry, espe-cially in a field with strong internatio-nal competition from Japan and theUSA. There are no single factor that isthe cause of the success, but rather aset of factors that all contributed to theresults. The foundation was madeearly when both the Norwegian Tele-
com and NTNF realised that satellitecommunication was the way to go forfuture maritime communication, andsupported the initial developments.There was a large home market in theshipping industry, and we had a back-ground in both developing and marke-ting communication equipment to theshipping industry. When the develop-ment projects were established, it waswith a dedicated team with pioneeringspirit and the success has comethrough a continuous strive to utiliseavailable technology to reduce costand to develop new services and inthis way maintaining the competitiveedge.
With the current projects well under-way for next generation digitisedequipment, the basis for a continuousstrong position for ABB Nera in theINMARSAT market in the 90s hasbeen made.
53

“Mobile satellite communication servi-ces provide communications on themove - however you go (by sea, by land,by air), wherever you go (spanning theworld) - with anyone, anywhere andanytime”(Jai Singh, INMARSAT, 1991)
1 IntroductionThe first satellite system for mobilecommunication (for ships), MARISAT,was put into operation in 1976. Thissystem was succeeded by the INMAR-SAT system in 1979. The 1990s willmost probably revolutionise themobile telecommunications services,particularly for personal communica-tion. In this field, satellites will play animportant part because of their uniqueproperties: a potensial large coveragearea and fast establishment of the ser-vice.
2 INMARSATINMARSAT is an international com-pany owned by the member states.The aim is to specify, establish andoperate communication satellites for
mobile services. The company’sincome is made up from hiring outtransponder capacity in the satellites.
INMARSAT has 64 member countries,with one signatory per country. TheNorwegian Telecom represents Nor-way, which is the third largest signa-tory with a share of around 13 %. USAis the largest with 25 %. Denmark andSweden have only 2 % and 1 %, respec-tively. Altogether, Europe owns morethan 50 %.
At present, INMARSAT has 10 satelli-tes in the geostationary orbit. Theycover four areas, see figure 1:
- Atlantic Ocean - East (AOR-E)
- Atlantic Ocean - West (AOR-W)
- Indian Ocean (IOR)
- Pacific Ocean (POR).
The INMARSAT system is made up offour main parts:
- The space segment, comprising thesatellites with their control stations(TT&C) and operational control
- The coastal earth stations (CES),which connects the satellite trans-mission to the national and internati-onal telecommunication network
- The Network co-ordinating stations(NCS), which handles the channelallocation in a coverage area
- Mobile earth station (MES), i.e. theuser terminal.
The Norwegian coastal earth station islocated at Eik, Rogaland. It operatestowards the Indian Ocean as well astowards the Atlantic East.
Several different terminal standardsare employed in the INMARSAT sys-tem, see figure 2. INMARSAT-A hasbeen operative since 1982. It is a relati-vely large terminal (ca. 1 metre para-bolic antenna) which is used for telep-hony (FM), telex and data. INMAR-SAT-B, which is the successor, ismainly like INMARSAT-A, but usesdigital modulation. This will give a bet-ter utilisation of the space segmentand thereby lower prices. INMARSAT-M is a smaller and cheaper terminalwhich uses a lower bit rate for thetelephone channel. Aero is a specialversion for the use in aeroplanes.INMARSAT-C is a low-speed (600bit/s) data message system based on“store-and-forward technique”. Theterminals are equipped with smallomnidirectional antennas.
The INMARSAT system today hasaround 20,000 terminals. The numberof terminals is expected to increasebeyond 70,000 as early as 1993. Thedevelopment is pointing towards com-munication with ever smaller units,like cars and people. This is the rea-son why INMARSAT expects a drama-tic increase in the number of termi-nals, more than a million in the year2000, figure 3.
3 The role of satellites infuture telephony
The end user wants required informa-tion transferred to a receiver in themost practical way, with highest possi-ble quality and at lowest possibleprice. The way in which this is done isirrelevant to the end user. Satellitecommunication is only one means ofmeeting user requirements, and it isjustified only in those cases where thisform of communication can competewith other methods.
54
Future systems for mobile satellite communicationsB Y P E R H O V S T A D A N D O D D G U T T E B E R G
621.396.946
Figure 1 INMARSAT coverage area
35 700 km
178o E
64.5o E
15.5o W
55.5o W
12 7
00 k
m Eik earth station(CES)AOR-E
IOR
POR
IOR
AOR-E
AOR-W
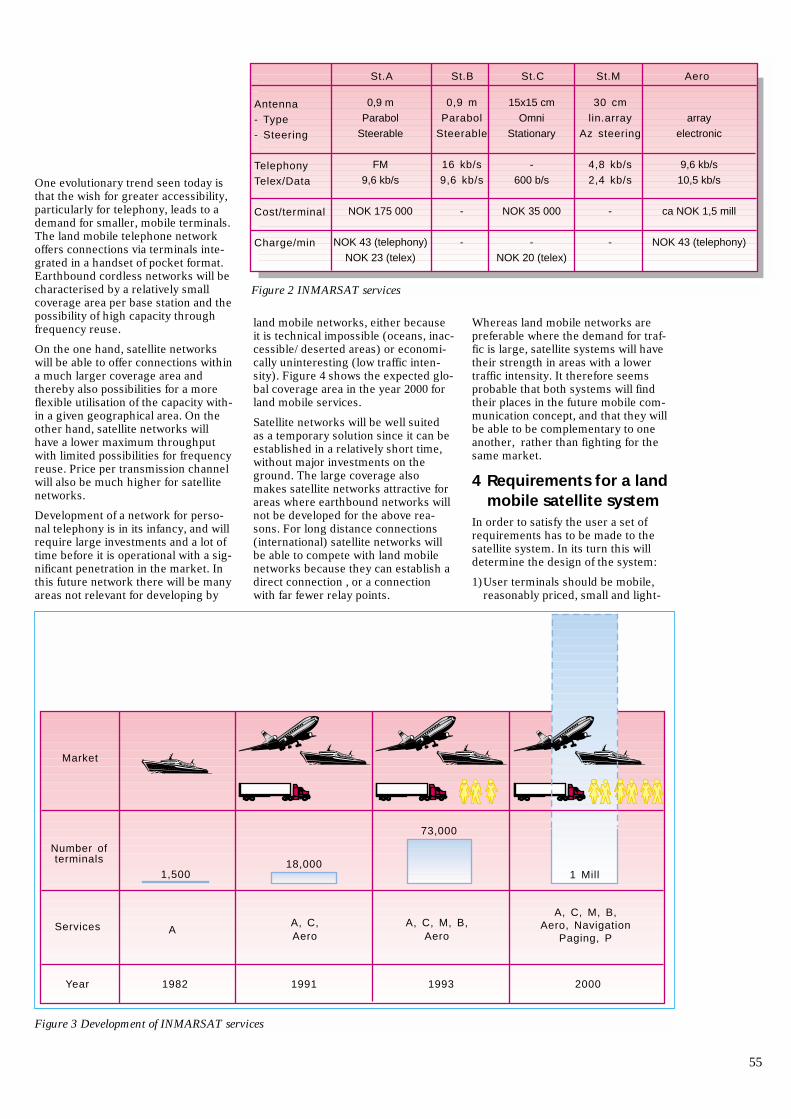
One evolutionary trend seen today isthat the wish for greater accessibility,particularly for telephony, leads to ademand for smaller, mobile terminals.The land mobile telephone networkoffers connections via terminals inte-grated in a handset of pocket format.Earthbound cordless networks will becharacterised by a relatively smallcoverage area per base station and thepossibility of high capacity throughfrequency reuse.
On the one hand, satellite networkswill be able to offer connections withina much larger coverage area andthereby also possibilities for a moreflexible utilisation of the capacity with-in a given geographical area. On theother hand, satellite networks willhave a lower maximum throughputwith limited possibilities for frequencyreuse. Price per transmission channelwill also be much higher for satellitenetworks.
Development of a network for perso-nal telephony is in its infancy, and willrequire large investments and a lot oftime before it is operational with a sig-nificant penetration in the market. Inthis future network there will be manyareas not relevant for developing by
land mobile networks, either becauseit is technical impossible (oceans, inac-cessible/deserted areas) or economi-cally uninteresting (low traffic inten-sity). Figure 4 shows the expected glo-bal coverage area in the year 2000 forland mobile services.
Satellite networks will be well suitedas a temporary solution since it can beestablished in a relatively short time,without major investments on theground. The large coverage alsomakes satellite networks attractive forareas where earthbound networks willnot be developed for the above rea-sons. For long distance connections(international) satellite networks willbe able to compete with land mobilenetworks because they can establish adirect connection , or a connectionwith far fewer relay points.
Whereas land mobile networks arepreferable where the demand for traf-fic is large, satellite systems will havetheir strength in areas with a lowertraffic intensity. It therefore seemsprobable that both systems will findtheir places in the future mobile com-munication concept, and that they willbe able to be complementary to oneanother, rather than fighting for thesame market.
4 Requirements for a landmobile satellite system
In order to satisfy the user a set ofrequirements has to be made to thesatellite system. In its turn this willdetermine the design of the system:
1)User terminals should be mobile,reasonably priced, small and light-
55
Figure 3 Development of INMARSAT services
1,500
Number ofterminals
Services
Year
Market
18,000
73,000
1 Mill
AA, C,Aero
A, C, M, B,Aero
A, C, M, B,Aero, Navigation
Paging, P
1982 1991 1993 2000
Figure 2 INMARSAT services
St.A St.B St.C St.M Aero
Antenna
- Type
- Steering
Telephony
Telex/Data
Cost/terminal
Charge/min
0,9 m
Parabol
Steerable
FM
9,6 kb/s
NOK 175 000
NOK 43 (telephony)
NOK 23 (telex)
0,9 m
Parabol
Steerable
16 kb/s
9,6 kb/s
-
-
15x15 cm
Omni
Stationary
-
600 b/s
NOK 35 000
-
NOK 20 (telex)
30 cm
lin.array
Az steering
4,8 kb/s
2,4 kb/s
-
-
array
electronic
9,6 kb/s
10,5 kb/s
ca NOK 1,5 mill
NOK 43 (telephony)
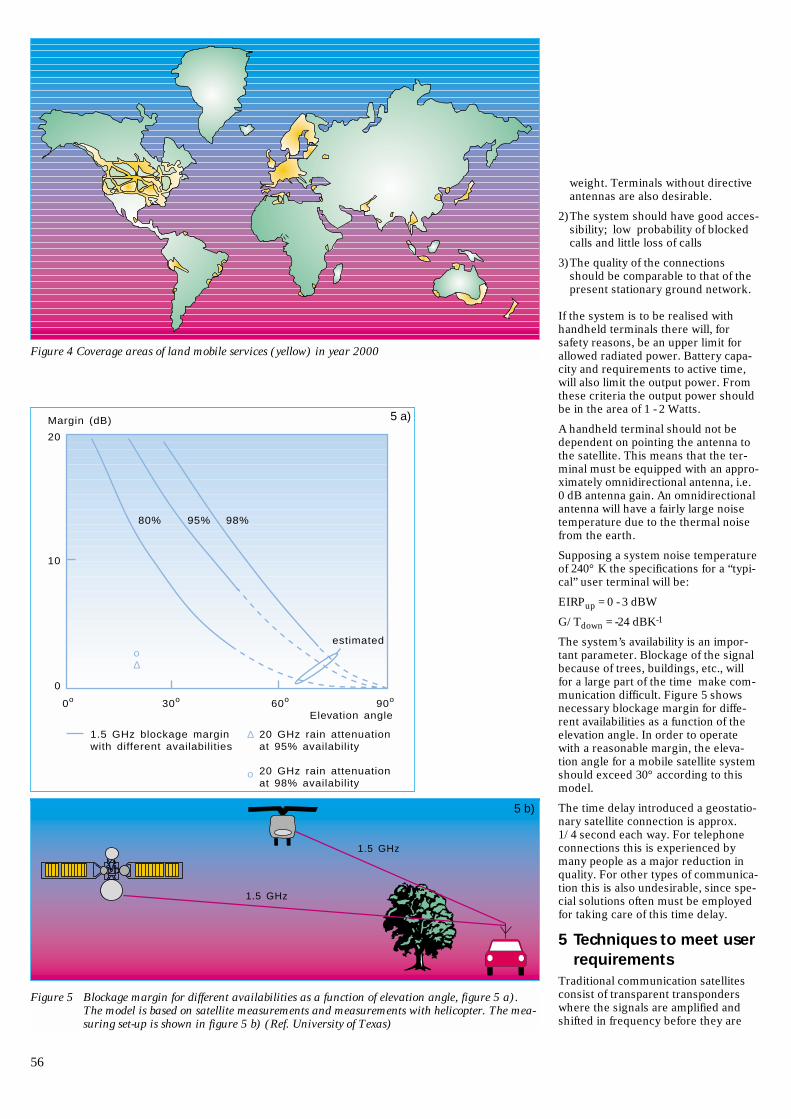
weight. Terminals without directiveantennas are also desirable.
2)The system should have good acces-sibility; low probability of blockedcalls and little loss of calls
3)The quality of the connectionsshould be comparable to that of thepresent stationary ground network.
If the system is to be realised withhandheld terminals there will, forsafety reasons, be an upper limit forallowed radiated power. Battery capa-city and requirements to active time,will also limit the output power. Fromthese criteria the output power shouldbe in the area of 1 - 2 Watts.
A handheld terminal should not bedependent on pointing the antenna tothe satellite. This means that the ter-minal must be equipped with an appro-ximately omnidirectional antenna, i.e.0 dB antenna gain. An omnidirectionalantenna will have a fairly large noisetemperature due to the thermal noisefrom the earth.
Supposing a system noise temperatureof 240° K the specifications for a “typi-cal” user terminal will be:
EIRPup = 0 - 3 dBW
G/Tdown = -24 dBK-1
The system’s availability is an impor-tant parameter. Blockage of the signalbecause of trees, buildings, etc., willfor a large part of the time make com-munication difficult. Figure 5 showsnecessary blockage margin for diffe-rent availabilities as a function of theelevation angle. In order to operatewith a reasonable margin, the eleva-tion angle for a mobile satellite systemshould exceed 30° according to thismodel.
The time delay introduced a geostatio-nary satellite connection is approx.1/4 second each way. For telephoneconnections this is experienced bymany people as a major reduction inquality. For other types of communica-tion this is also undesirable, since spe-cial solutions often must be employedfor taking care of this time delay.
5 Techniques to meet userrequirements
Traditional communication satellitesconsist of transparent transponderswhere the signals are amplified andshifted in frequency before they are
56
Figure 4 Coverage areas of land mobile services (yellow) in year 2000
98%95%80%
0o 30o 60o 90o
0
10
20
Margin (dB)
1.5 GHz blockage marginwith different availabilities
o∆
estimated
∆
ο
20 GHz rain attenuationat 95% availability
20 GHz rain attenuationat 98% availability
Elevation angle
1.5 GHz
1.5 GHz
Figure 5 Blockage margin for different availabilities as a function of elevation angle, figure 5 a).The model is based on satellite measurements and measurements with helicopter. The mea-suring set-up is shown in figure 5 b) (Ref. University of Texas)
5 a)
5 b)
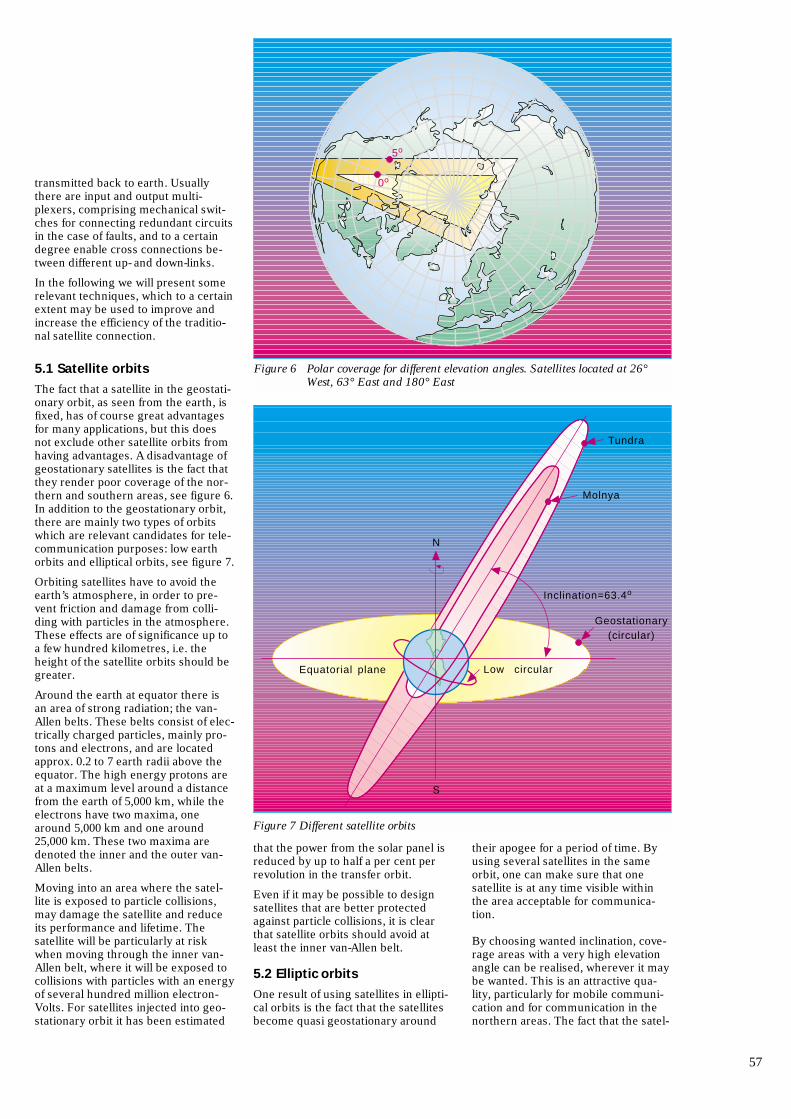
transmitted back to earth. Usuallythere are input and output multi-plexers, comprising mechanical swit-ches for connecting redundant circuitsin the case of faults, and to a certaindegree enable cross connections be-tween different up- and down-links.
In the following we will present somerelevant techniques, which to a certainextent may be used to improve andincrease the efficiency of the traditio-nal satellite connection.
5.1 Satellite orbits
The fact that a satellite in the geostati-onary orbit, as seen from the earth, isfixed, has of course great advantagesfor many applications, but this doesnot exclude other satellite orbits fromhaving advantages. A disadvantage ofgeostationary satellites is the fact thatthey render poor coverage of the nor-thern and southern areas, see figure 6.In addition to the geostationary orbit,there are mainly two types of orbitswhich are relevant candidates for tele-communication purposes: low earthorbits and elliptical orbits, see figure 7.
Orbiting satellites have to avoid theearth’s atmosphere, in order to pre-vent friction and damage from colli-ding with particles in the atmosphere.These effects are of significance up toa few hundred kilometres, i.e. theheight of the satellite orbits should begreater.
Around the earth at equator there isan area of strong radiation; the van-Allen belts. These belts consist of elec-trically charged particles, mainly pro-tons and electrons, and are locatedapprox. 0.2 to 7 earth radii above theequator. The high energy protons areat a maximum level around a distancefrom the earth of 5,000 km, while theelectrons have two maxima, onearound 5,000 km and one around25,000 km. These two maxima aredenoted the inner and the outer van-Allen belts.
Moving into an area where the satel-lite is exposed to particle collisions,may damage the satellite and reduceits performance and lifetime. Thesatellite will be particularly at riskwhen moving through the inner van-Allen belt, where it will be exposed tocollisions with particles with an energyof several hundred million electron-Volts. For satellites injected into geo-stationary orbit it has been estimated
that the power from the solar panel isreduced by up to half a per cent perrevolution in the transfer orbit.
Even if it may be possible to designsatellites that are better protectedagainst particle collisions, it is clearthat satellite orbits should avoid atleast the inner van-Allen belt.
5.2 Elliptic orbits
One result of using satellites in ellipti-cal orbits is the fact that the satellitesbecome quasi geostationary around
their apogee for a period of time. Byusing several satellites in the sameorbit, one can make sure that onesatellite is at any time visible withinthe area acceptable for communica-tion.
By choosing wanted inclination, cove-rage areas with a very high elevationangle can be realised, wherever it maybe wanted. This is an attractive qua-lity, particularly for mobile communi-cation and for communication in thenorthern areas. The fact that the satel-
57
5o
0o
Figure 6 Polar coverage for different elevation angles. Satellites located at 26°West, 63° East and 180° East
Tundra
Molnya
Geostationary(circular)
Low circular
N
S
Equatorial plane
Inclination=63.4o
Figure 7 Different satellite orbits
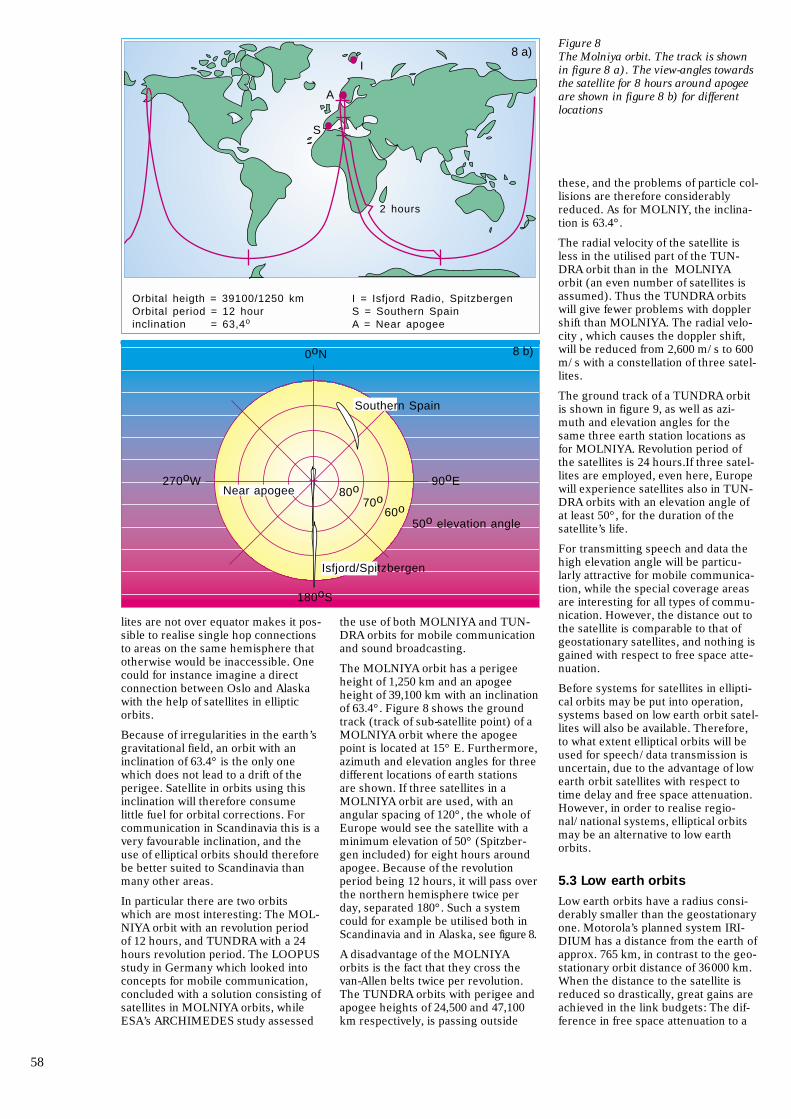
lites are not over equator makes it pos-sible to realise single hop connectionsto areas on the same hemisphere thatotherwise would be inaccessible. Onecould for instance imagine a directconnection between Oslo and Alaskawith the help of satellites in ellipticorbits.
Because of irregularities in the earth’sgravitational field, an orbit with aninclination of 63.4° is the only onewhich does not lead to a drift of theperigee. Satellite in orbits using thisinclination will therefore consumelittle fuel for orbital corrections. Forcommunication in Scandinavia this is avery favourable inclination, and theuse of elliptical orbits should thereforebe better suited to Scandinavia thanmany other areas.
In particular there are two orbitswhich are most interesting: The MOL-NIYA orbit with an revolution periodof 12 hours, and TUNDRA with a 24hours revolution period. The LOOPUSstudy in Germany which looked intoconcepts for mobile communication,concluded with a solution consisting ofsatellites in MOLNIYA orbits, whileESA’s ARCHIMEDES study assessed
the use of both MOLNIYA and TUN-DRA orbits for mobile communicationand sound broadcasting.
The MOLNIYA orbit has a perigeeheight of 1,250 km and an apogeeheight of 39,100 km with an inclinationof 63.4°. Figure 8 shows the groundtrack (track of sub-satellite point) of aMOLNIYA orbit where the apogeepoint is located at 15° E. Furthermore,azimuth and elevation angles for threedifferent locations of earth stationsare shown. If three satellites in aMOLNIYA orbit are used, with anangular spacing of 120°, the whole ofEurope would see the satellite with aminimum elevation of 50° (Spitzber-gen included) for eight hours aroundapogee. Because of the revolutionperiod being 12 hours, it will pass overthe northern hemisphere twice perday, separated 180°. Such a systemcould for example be utilised both inScandinavia and in Alaska, see figure 8.
A disadvantage of the MOLNIYAorbits is the fact that they cross thevan-Allen belts twice per revolution.The TUNDRA orbits with perigee andapogee heights of 24,500 and 47,100km respectively, is passing outside
these, and the problems of particle col-lisions are therefore considerablyreduced. As for MOLNIY, the inclina-tion is 63.4°.
The radial velocity of the satellite isless in the utilised part of the TUN-DRA orbit than in the MOLNIYAorbit (an even number of satellites isassumed). Thus the TUNDRA orbitswill give fewer problems with dopplershift than MOLNIYA. The radial velo-city , which causes the doppler shift,will be reduced from 2,600 m/s to 600m/s with a constellation of three satel-lites.
The ground track of a TUNDRA orbitis shown in figure 9, as well as azi-muth and elevation angles for thesame three earth station locations asfor MOLNIYA. Revolution period ofthe satellites is 24 hours.If three satel-lites are employed, even here, Europewill experience satellites also in TUN-DRA orbits with an elevation angle ofat least 50°, for the duration of thesatellite’s life.
For transmitting speech and data thehigh elevation angle will be particu-larly attractive for mobile communica-tion, while the special coverage areasare interesting for all types of commu-nication. However, the distance out tothe satellite is comparable to that ofgeostationary satellites, and nothing isgained with respect to free space atte-nuation.
Before systems for satellites in ellipti-cal orbits may be put into operation,systems based on low earth orbit satel-lites will also be available. Therefore,to what extent elliptical orbits will beused for speech/data transmission isuncertain, due to the advantage of lowearth orbit satellites with respect totime delay and free space attenuation.However, in order to realise regio-nal/national systems, elliptical orbitsmay be an alternative to low earthorbits.
5.3 Low earth orbits
Low earth orbits have a radius consi-derably smaller than the geostationaryone. Motorola’s planned system IRI-DIUM has a distance from the earth ofapprox. 765 km, in contrast to the geo-stationary orbit distance of 36000 km.When the distance to the satellite isreduced so drastically, great gains areachieved in the link budgets: The dif-ference in free space attenuation to a
58
Figure 8 The Molniya orbit. The track is shownin figure 8 a). The view-angles towardsthe satellite for 8 hours around apogeeare shown in figure 8 b) for differentlocations
Orbital heigth = 39100/1250 kmOrbital period = 12 hourinclination = 63,4o
A
S
I
I = Isfjord Radio, SpitzbergenS = Southern SpainA = Near apogee
2 hours
0oN
90oE270oW
180oS
80o70o
60o50o elevation angle
Southern Spain
Near apogee
Isfjord/Spitzbergen
8 a)
8 b)
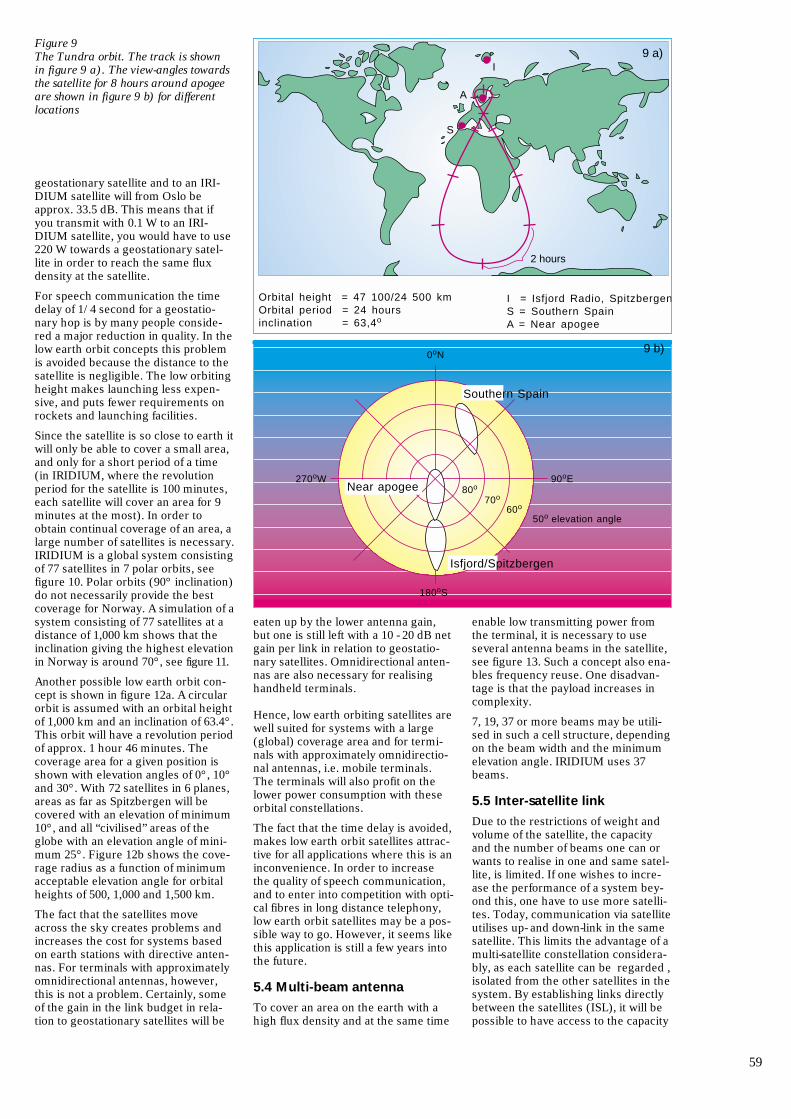
geostationary satellite and to an IRI-DIUM satellite will from Oslo beapprox. 33.5 dB. This means that ifyou transmit with 0.1 W to an IRI-DIUM satellite, you would have to use220 W towards a geostationary satel-lite in order to reach the same fluxdensity at the satellite.
For speech communication the timedelay of 1/4 second for a geostatio-nary hop is by many people conside-red a major reduction in quality. In thelow earth orbit concepts this problemis avoided because the distance to thesatellite is negligible. The low orbitingheight makes launching less expen-sive, and puts fewer requirements onrockets and launching facilities.
Since the satellite is so close to earth itwill only be able to cover a small area,and only for a short period of a time(in IRIDIUM, where the revolutionperiod for the satellite is 100 minutes,each satellite will cover an area for 9minutes at the most). In order toobtain continual coverage of an area, alarge number of satellites is necessary.IRIDIUM is a global system consistingof 77 satellites in 7 polar orbits, seefigure 10. Polar orbits (90° inclination)do not necessarily provide the bestcoverage for Norway. A simulation of asystem consisting of 77 satellites at adistance of 1,000 km shows that theinclination giving the highest elevationin Norway is around 70°, see figure 11.
Another possible low earth orbit con-cept is shown in figure 12a. A circularorbit is assumed with an orbital heightof 1,000 km and an inclination of 63.4°.This orbit will have a revolution periodof approx. 1 hour 46 minutes. Thecoverage area for a given position isshown with elevation angles of 0°, 10°and 30°. With 72 satellites in 6 planes,areas as far as Spitzbergen will becovered with an elevation of minimum10°, and all “civilised” areas of theglobe with an elevation angle of mini-mum 25°. Figure 12b shows the cove-rage radius as a function of minimumacceptable elevation angle for orbitalheights of 500, 1,000 and 1,500 km.
The fact that the satellites moveacross the sky creates problems andincreases the cost for systems basedon earth stations with directive anten-nas. For terminals with approximatelyomnidirectional antennas, however,this is not a problem. Certainly, someof the gain in the link budget in rela-tion to geostationary satellites will be
eaten up by the lower antenna gain,but one is still left with a 10 - 20 dB netgain per link in relation to geostatio-nary satellites. Omnidirectional anten-nas are also necessary for realisinghandheld terminals.
Hence, low earth orbiting satellites arewell suited for systems with a large(global) coverage area and for termi-nals with approximately omnidirectio-nal antennas, i.e. mobile terminals.The terminals will also profit on thelower power consumption with theseorbital constellations.
The fact that the time delay is avoided,makes low earth orbit satellites attrac-tive for all applications where this is aninconvenience. In order to increasethe quality of speech communication,and to enter into competition with opti-cal fibres in long distance telephony,low earth orbit satellites may be a pos-sible way to go. However, it seems likethis application is still a few years intothe future.
5.4 Multi-beam antenna
To cover an area on the earth with ahigh flux density and at the same time
enable low transmitting power fromthe terminal, it is necessary to useseveral antenna beams in the satellite,see figure 13. Such a concept also ena-bles frequency reuse. One disadvan-tage is that the payload increases incomplexity.
7, 19, 37 or more beams may be utili-sed in such a cell structure, dependingon the beam width and the minimumelevation angle. IRIDIUM uses 37beams.
5.5 Inter-satellite link
Due to the restrictions of weight andvolume of the satellite, the capacityand the number of beams one can orwants to realise in one and same satel-lite, is limited. If one wishes to incre-ase the performance of a system bey-ond this, one have to use more satelli-tes. Today, communication via satelliteutilises up- and down-link in the samesatellite. This limits the advantage of amulti-satellite constellation considera-bly, as each satellite can be regarded ,isolated from the other satellites in thesystem. By establishing links directlybetween the satellites (ISL), it will bepossible to have access to the capacity
59
Figure 9 The Tundra orbit. The track is shownin figure 9 a). The view-angles towardsthe satellite for 8 hours around apogeeare shown in figure 9 b) for differentlocations
Orbital height = 47 100/24 500 kmOrbital period = 24 hoursinclination = 63,4o
I = Isfjord Radio, SpitzbergenS = Southern SpainA = Near apogee
I
A
S
2 hours
0oN
90oE270oW
180oS
80o
70o
60o
50o elevation angle
Southern Spain
Isfjord/Spitzbergen
Near apogee
9 b)
9 a)
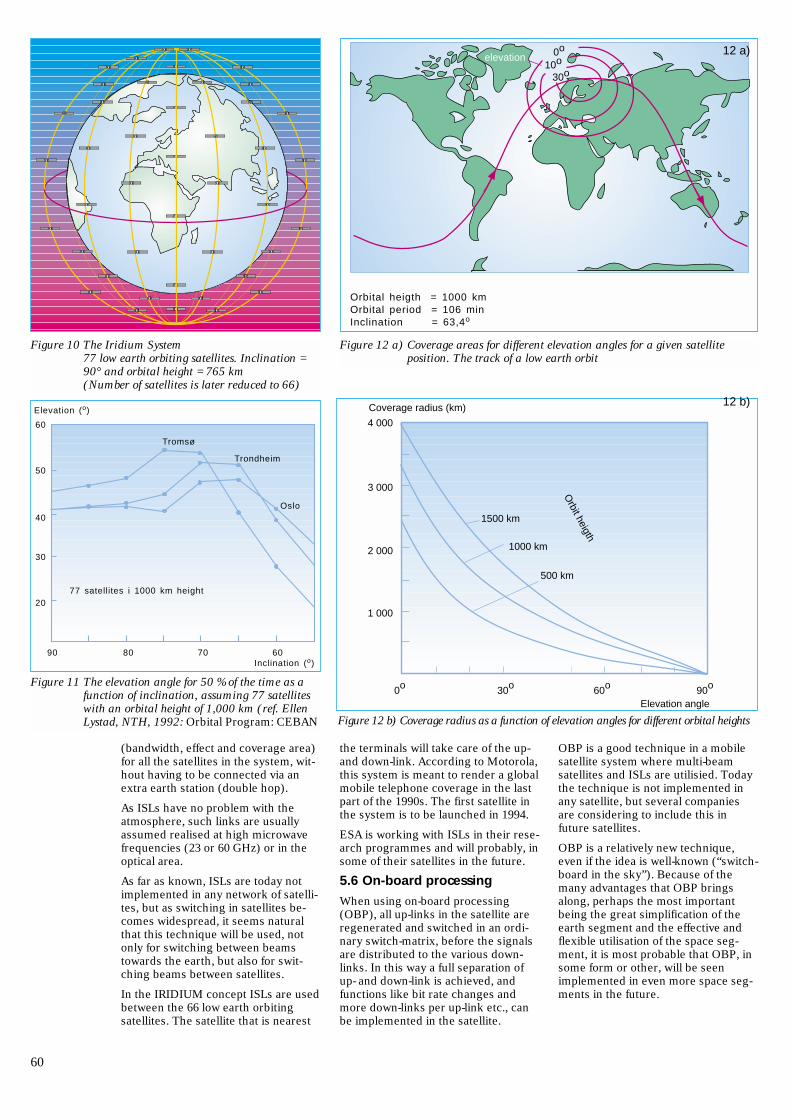
(bandwidth, effect and coverage area)for all the satellites in the system, wit-hout having to be connected via anextra earth station (double hop).
As ISLs have no problem with theatmosphere, such links are usuallyassumed realised at high microwavefrequencies (23 or 60 GHz) or in theoptical area.
As far as known, ISLs are today notimplemented in any network of satelli-tes, but as switching in satellites be-comes widespread, it seems naturalthat this technique will be used, notonly for switching between beamstowards the earth, but also for swit-ching beams between satellites.
In the IRIDIUM concept ISLs are usedbetween the 66 low earth orbitingsatellites. The satellite that is nearest
the terminals will take care of the up-and down-link. According to Motorola,this system is meant to render a globalmobile telephone coverage in the lastpart of the 1990s. The first satellite inthe system is to be launched in 1994.
ESA is working with ISLs in their rese-arch programmes and will probably, insome of their satellites in the future.
5.6 On-board processing
When using on-board processing(OBP), all up-links in the satellite areregenerated and switched in an ordi-nary switch-matrix, before the signalsare distributed to the various down-links. In this way a full separation ofup- and down-link is achieved, andfunctions like bit rate changes andmore down-links per up-link etc., canbe implemented in the satellite.
OBP is a good technique in a mobilesatellite system where multi-beamsatellites and ISLs are utilisied. Todaythe technique is not implemented inany satellite, but several companiesare considering to include this infuture satellites.
OBP is a relatively new technique,even if the idea is well-known (“switch-board in the sky”). Because of themany advantages that OBP bringsalong, perhaps the most importantbeing the great simplification of theearth segment and the effective andflexible utilisation of the space seg-ment, it is most probable that OBP, insome form or other, will be seenimplemented in even more space seg-ments in the future.
60
Figure 10 The Iridium System77 low earth orbiting satellites. Inclination =90° and orbital height = 765 km(Number of satellites is later reduced to 66)
20
30
40
50
60
60708090Inclination (o)
Tromsø
Trondheim
Oslo
Elevation (o)
77 satellites i 1000 km height
Figure 11 The elevation angle for 50 % of the time as afunction of inclination, assuming 77 satelliteswith an orbital height of 1,000 km (ref. EllenLystad, NTH, 1992: Orbital Program: CEBAN
Orbital heigth = 1000 kmOrbital period = 106 minInclination = 63,4o
elevation10o
30o
0o
4 000
3 000
2 000
1 000
0o 30o 60o 90o
1500 km
1000 km
500 km
Coverage radius (km)
Elevation angle
Orbit heigth
Figure 12 b) Coverage radius as a function of elevation angles for different orbital heights
Figure 12 a) Coverage areas for different elevation angles for a given satelliteposition. The track of a low earth orbit
12 a)
12 b)
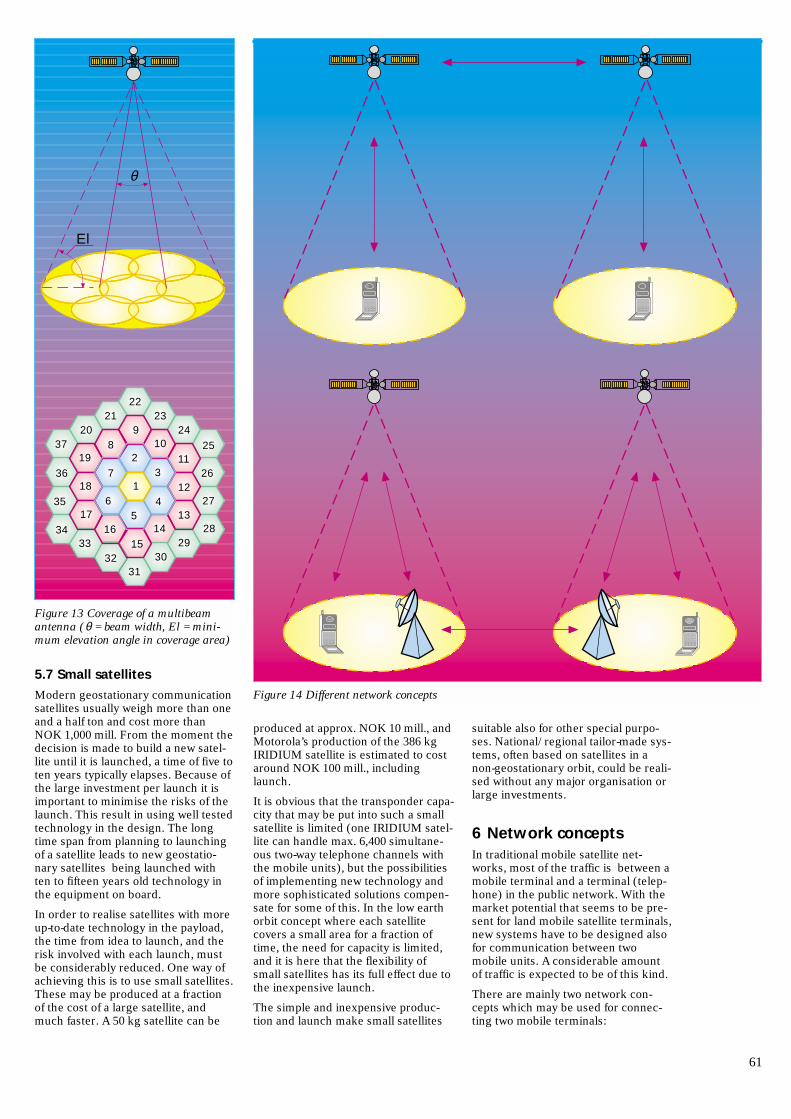
5.7 Small satellites
Modern geostationary communicationsatellites usually weigh more than oneand a half ton and cost more thanNOK 1,000 mill. From the moment thedecision is made to build a new satel-lite until it is launched, a time of five toten years typically elapses. Because ofthe large investment per launch it isimportant to minimise the risks of thelaunch. This result in using well testedtechnology in the design. The longtime span from planning to launchingof a satellite leads to new geostatio-nary satellites being launched withten to fifteen years old technology inthe equipment on board.
In order to realise satellites with moreup-to-date technology in the payload,the time from idea to launch, and therisk involved with each launch, mustbe considerably reduced. One way ofachieving this is to use small satellites.These may be produced at a fractionof the cost of a large satellite, andmuch faster. A 50 kg satellite can be
produced at approx. NOK 10 mill., andMotorola’s production of the 386 kgIRIDIUM satellite is estimated to costaround NOK 100 mill., includinglaunch.
It is obvious that the transponder capa-city that may be put into such a smallsatellite is limited (one IRIDIUM satel-lite can handle max. 6,400 simultane-ous two-way telephone channels withthe mobile units), but the possibilitiesof implementing new technology andmore sophisticated solutions compen-sate for some of this. In the low earthorbit concept where each satellitecovers a small area for a fraction oftime, the need for capacity is limited,and it is here that the flexibility ofsmall satellites has its full effect due tothe inexpensive launch.
The simple and inexpensive produc-tion and launch make small satellites
suitable also for other special purpo-ses. National/regional tailor-made sys-tems, often based on satellites in anon-geostationary orbit, could be reali-sed without any major organisation orlarge investments.
6 Network conceptsIn traditional mobile satellite net-works, most of the traffic is between amobile terminal and a terminal (telep-hone) in the public network. With themarket potential that seems to be pre-sent for land mobile satellite terminals,new systems have to be designed alsofor communication between twomobile units. A considerable amountof traffic is expected to be of this kind.
There are mainly two network con-cepts which may be used for connec-ting two mobile terminals:
61
El
θ
1
23
45
1633
34
35
36
3720
2122
2324
25
26
27
2829
3031
32
17
18
198
910
11
12
1314
15
6
7
Figure 13 Coverage of a multibeamantenna (θ = beam width, El = mini-mum elevation angle in coverage area)
1 1 1 1
1 1 1 1
00 12 10
1 1 1 1
1 1 1 1
00 12 10
1111
1111
00 12 10
1 1 1 1
1 1 1 1
00 12 10
Figure 14 Different network concepts
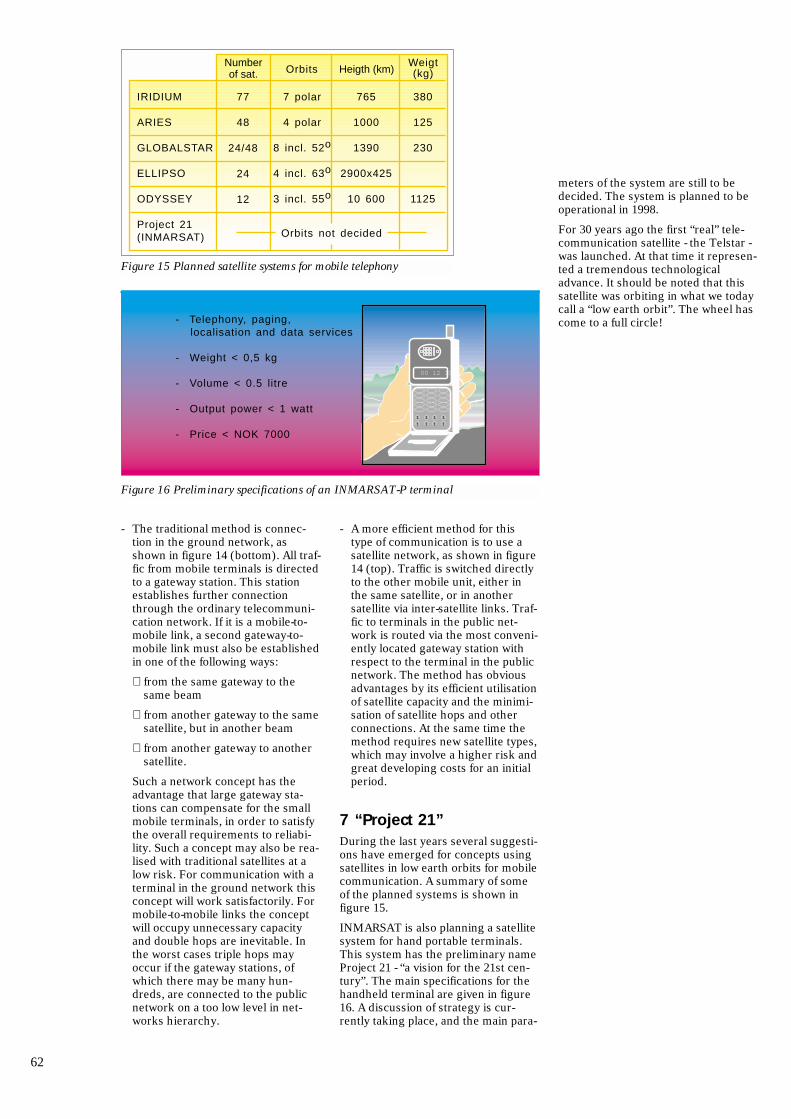
- The traditional method is connec-tion in the ground network, asshown in figure 14 (bottom). All traf-fic from mobile terminals is directedto a gateway station. This stationestablishes further connectionthrough the ordinary telecommuni-cation network. If it is a mobile-to-mobile link, a second gateway-to-mobile link must also be establishedin one of the following ways:
⋅ from the same gateway to thesame beam
⋅ from another gateway to the samesatellite, but in another beam
⋅ from another gateway to anothersatellite.
Such a network concept has theadvantage that large gateway sta-tions can compensate for the smallmobile terminals, in order to satisfythe overall requirements to reliabi-lity. Such a concept may also be rea-lised with traditional satellites at alow risk. For communication with aterminal in the ground network thisconcept will work satisfactorily. Formobile-to-mobile links the conceptwill occupy unnecessary capacityand double hops are inevitable. Inthe worst cases triple hops mayoccur if the gateway stations, ofwhich there may be many hun-dreds, are connected to the publicnetwork on a too low level in net-works hierarchy.
- A more efficient method for thistype of communication is to use asatellite network, as shown in figure14 (top). Traffic is switched directlyto the other mobile unit, either inthe same satellite, or in anothersatellite via inter-satellite links. Traf-fic to terminals in the public net-work is routed via the most conveni-ently located gateway station withrespect to the terminal in the publicnetwork. The method has obviousadvantages by its efficient utilisationof satellite capacity and the minimi-sation of satellite hops and otherconnections. At the same time themethod requires new satellite types,which may involve a higher risk andgreat developing costs for an initialperiod.
7 “Project 21”During the last years several suggesti-ons have emerged for concepts usingsatellites in low earth orbits for mobilecommunication. A summary of someof the planned systems is shown infigure 15.
INMARSAT is also planning a satellitesystem for hand portable terminals.This system has the preliminary nameProject 21 - “a vision for the 21st cen-tury”. The main specifications for thehandheld terminal are given in figure16. A discussion of strategy is cur-rently taking place, and the main para-
meters of the system are still to bedecided. The system is planned to beoperational in 1998.
For 30 years ago the first “real” tele-communication satellite - the Telstar -was launched. At that time it represen-ted a tremendous technologicaladvance. It should be noted that thissatellite was orbiting in what we todaycall a “low earth orbit”. The wheel hascome to a full circle!
62
IRIDIUM
ARIES
GLOBALSTAR
ELLIPSO
ODYSSEY
Project 21(INMARSAT)
7 polar
4 polar
8 incl. 52o
4 incl. 63o
3 incl. 55o
Numberof sat.
77
48
24/48
24
12
Heigth (km)
765
1000
1390
2900x425
10 600
Weigt(kg)
380
125
230
1125
Orbits not decided
Orbits
Figure 15 Planned satellite systems for mobile telephony
- Telephony, paging, localisation and data services
- Weight < 0,5 kg
- Volume < 0.5 litre
- Output power < 1 watt
- Price < NOK 7000
1 1 1 1
1 1 1 1
00 12 10
Figure 16 Preliminary specifications of an INMARSAT-P terminal

1 TopicThe growing demand for transmissioncapacity has forced the satellite tele-communication systems to use fre-quencies above 10 GHz. Systems arenow operating at 11/14 GHz, and theutilisation of 20/30 GHz frequencyband is being planned. At these fre-quencies the radio waves will sufferdegradation through the non-ionisedpart of the atmosphere, i.e. the tropos-phere. Particularly dominant is theattenuation and depolarisation due torain and wet snow. In the high-latitudepart of the Nordic countries, additionalproblems arise due to very low eleva-tion angle to geostationary satellites.
All these factors contribute strongly tothe design criteria for satellite sys-tems, such as
- localisation of earth stations
- r.f power requirements
- antenna sizes
- capacity requirements, etc.
and the technical solutions to be used.
Our main goal in designing satellitesystems, is that all offered servicesmust have the quality and reliabilitythe customers want.
This paper deals with the differentaspects of slant path propagation prob-lems encountered in high latitude re-gions, i.e. elevation angles less than20 degrees, and frequencies above10 GHz.
2 IntroductionNormally a satellite transmission linkis down-link limited. Accordingly, theimportant equation in designing satel-lite systems is:
(1)
where
EIRP = Satellite effective isotropicradiated power
G/T = Earth station “figure-of-merit”k = Bolzmann’s konstantB = Transmission bandwidthLo = Free space lossLa = Additional loss
All terms expressed in dB.
C
N
down
= EIRP + G
T+ 1
k+ 1
B+ Lo + La
The time varying parameters are theadditional loss (La) and the earth sta-tion system noise temperature (T).Earth station antennas without trac-king will also have a decrease in gain(G) due to variations in angle of arri-val.
The major tropospheric propagationfactors that will influence satellite com-munications are;
- absorption due to atmosphericgases
- radio ray bending due to the de-crease in refractive index withheight
- scattering due to atmospheric turbu-lence
- attenuation due to rain
- depolarisation due to rain and snow
- radio noise due to attenuation ingases and rain.
Basic considerations and reviews arefound in [1-4]. In the following chap-ters measurement of the differenteffects will be presented, bearing inmind the system planners’ need forprediction models.
3 Atmospheric absorptionRadio wave absorption is due to gase-ous constituents in the atmosphere,primarily water vapour and oxygen.
In order to calculate the total slantpath attenuation, we need the specificattenuation (γ), and the equivalent
height (h) for water vapour and oxy-gen, see figures 1 and 2.
According to CCIR [4] the equivalentheights are;
ho = 6 km for oxygen for frequen-cies below 50 GHz
hw = 2.2 - 2.5 km for water vapour inthe frequency range 10 - 20GHz
63
Effects of atmosphere on earth-space radio propagationB Y O D D G U T T E B E R G
621.396.946
Figure 2 Parameters for calculating the total slant path atmospheric absorptionθ = elevation angleh = equivalent height of water vapour (hw) and oxygen (ho)Reff = effective earth radius = 8,500 km
to satellite
ho ≈6 km
hw≈2.3 km-2.5 km
Leo
Lewθ
Reff≈8500 km
Figure 1 Specific attenuation due to oxygen and watervapour in the atmosphere [1]
3 105 20 50 100 200 350Frequency (GHz)
PressureSurface tempWater vapourconcentration
: 1Atm: 20oC
:7.5 g/m3
40
20
10
5
2
1
0.5
0.2
0.05
0.02
0.01
0.1
0.005
Specific attenuation (dB/km)
H2O
O2
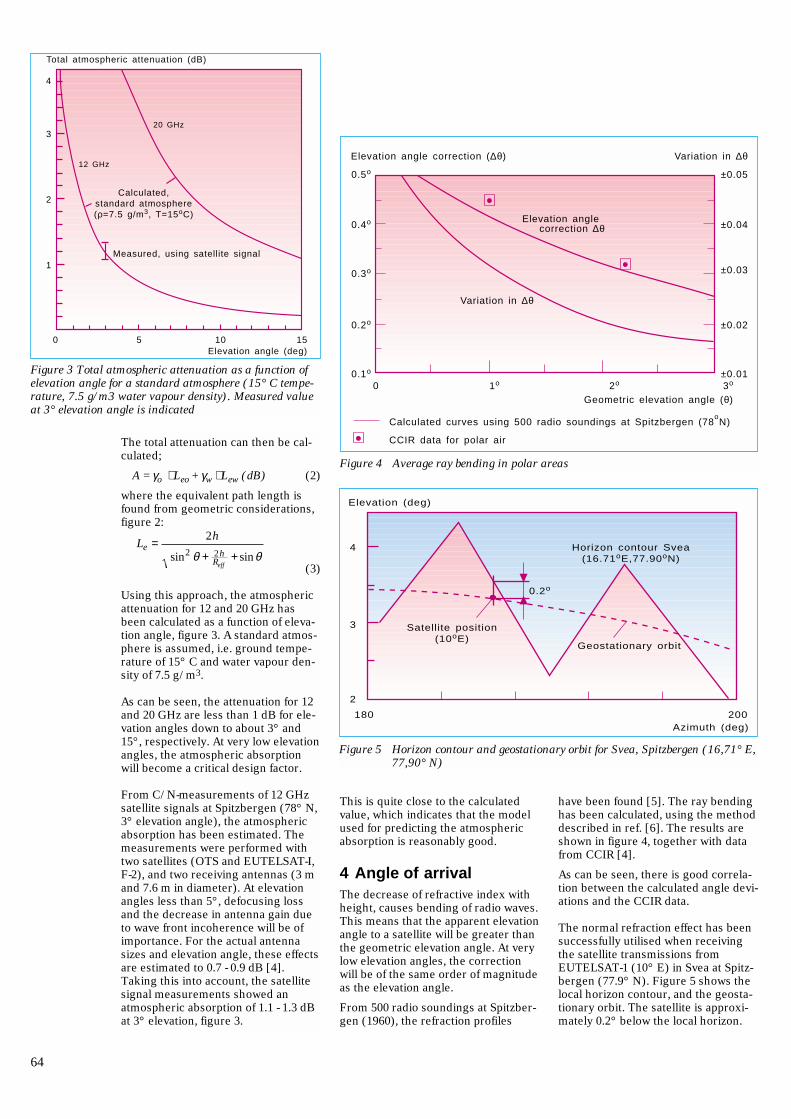
This is quite close to the calculatedvalue, which indicates that the modelused for predicting the atmosphericabsorption is reasonably good.
4 Angle of arrivalThe decrease of refractive index withheight, causes bending of radio waves.This means that the apparent elevationangle to a satellite will be greater thanthe geometric elevation angle. At verylow elevation angles, the correctionwill be of the same order of magnitudeas the elevation angle.
From 500 radio soundings at Spitzber-gen (1960), the refraction profiles
have been found [5]. The ray bendinghas been calculated, using the methoddescribed in ref. [6]. The results areshown in figure 4, together with datafrom CCIR [4].
As can be seen, there is good correla-tion between the calculated angle devi-ations and the CCIR data.
The normal refraction effect has beensuccessfully utilised when receivingthe satellite transmissions fromEUTELSAT-1 (10° E) in Svea at Spitz-bergen (77.9° N). Figure 5 shows thelocal horizon contour, and the geosta-tionary orbit. The satellite is approxi-mately 0.2° below the local horizon.
64
Figure 5 Horizon contour and geostationary orbit for Svea, Spitzbergen (16,71° E,77,90° N)
3
2
4
180 200Azimuth (deg)
Elevation (deg)
Satellite position(10oE)
Geostationary orbit
Horizon contour Svea(16.71oE,77.90oN)
0.2o
Figure 4 Average ray bending in polar areas
0.5o
0.4o
0.3o
0.2o
0.1o
0 1o 2o 3o
±0.05
±0.04
±0.03
±0.02
±0.01
Elevation angle correction (∆θ) Variation in ∆θ
Geometric elevation angle (θ)
Calculated curves using 500 radio soundings at Spitzbergen (78oN)
CCIR data for polar air
Elevation angle correction ∆θ
Variation in ∆θ
Figure 3 Total atmospheric attenuation as a function ofelevation angle for a standard atmosphere (15° C tempe-rature, 7.5 g/m3 water vapour density). Measured valueat 3° elevation angle is indicated
Calculated,standard atmosphere(ρ=7.5 g/m3, T=15oC)
1
2
20 GHz
Measured, using satellite signal
3
4
Total atmospheric attenuation (dB)
0 5 10 15Elevation angle (deg)
12 GHz
The total attenuation can then be cal-culated;
A = γo ⋅ Leo + γw ⋅ Lew (dB) (2)
where the equivalent path length isfound from geometric considerations,figure 2:
(3)
Using this approach, the atmosphericattenuation for 12 and 20 GHz hasbeen calculated as a function of eleva-tion angle, figure 3. A standard atmos-phere is assumed, i.e. ground tempe-rature of 15° C and water vapour den-sity of 7.5 g/m3.
As can be seen, the attenuation for 12and 20 GHz are less than 1 dB for ele-vation angles down to about 3° and15°, respectively. At very low elevationangles, the atmospheric absorptionwill become a critical design factor.
From C/N-measurements of 12 GHzsatellite signals at Spitzbergen (78° N,3° elevation angle), the atmosphericabsorption has been estimated. Themeasurements were performed withtwo satellites (OTS and EUTELSAT-I,F-2), and two receiving antennas (3 mand 7.6 m in diameter). At elevationangles less than 5°, defocusing lossand the decrease in antenna gain dueto wave front incoherence will be ofimportance. For the actual antennasizes and elevation angle, these effectsare estimated to 0.7 - 0.9 dB [4].Taking this into account, the satellitesignal measurements showed anatmospheric absorption of 1.1 - 1.3 dBat 3° elevation, figure 3.
Le = 2h
sin2 θ + 2hReff
+ sinθ
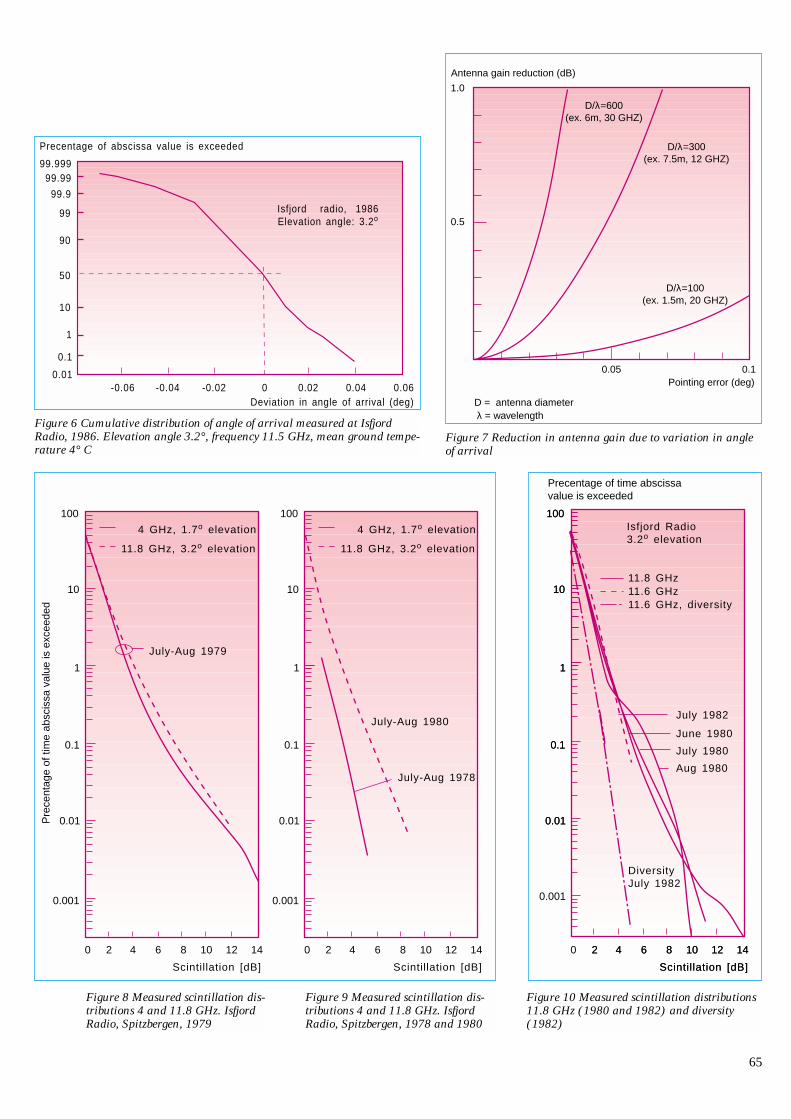
65
Figure 8 Measured scintillation dis-tributions 4 and 11.8 GHz. IsfjordRadio, Spitzbergen, 1979
Figure 9 Measured scintillation dis-tributions 4 and 11.8 GHz. IsfjordRadio, Spitzbergen, 1978 and 1980
Figure 10 Measured scintillation distributions11.8 GHz (1980 and 1982) and diversity(1982)
100
10
1
0.1
0.01
0.001
0 2 4 6 8 10 12 14
Pre
cent
age
of ti
me
absc
issa
val
ue is
exc
eede
d
Scintillation [dB]
July-Aug 1979
100
10
1
0.1
0.01
0.001
0 2 4 6 8 10 12 14
Scintillation [dB]
4 GHz, 1.7o elevation
11.8 GHz, 3.2o elevation
July-Aug 1978
July-Aug 1980
4 GHz, 1.7o elevation
11.8 GHz, 3.2o elevation
Precentage of time abscissavalue is exceeded
100
10
1
0.1
0.01
0 2 4 6 8 10 12 14
Scintillation [dB]
11.8 GHz
100
10
1
0.1
0.01
2 4 6 8 10 12 14
Scintillation [dB]
11.6 GHz11.6 GHz, diversity
Isfjord Radio3.2o elevation
Aug 1980
June 1980
July 1980
July 1982
DiversityJuly 1982
0.001
-0.06 -0.04 -0.02 0 0.02 0.04 0.06
99.99999.99
99.9
99
90
50
10
1
0.1
0.01
Isfjord radio, 1986Elevation angle: 3.2o
Precentage of abscissa value is exceeded
Deviation in angle of arrival (deg)
D/λ=600(ex. 6m, 30 GHZ)
D/λ=300(ex. 7.5m, 12 GHZ)
D/λ=100(ex. 1.5m, 20 GHZ)
0.05 0.1
1.0
0.5
Antenna gain reduction (dB)
Pointing error (deg)
D = antenna diameterλ = wavelength
Figure 6 Cumulative distribution of angle of arrival measured at IsfjordRadio, 1986. Elevation angle 3.2°, frequency 11.5 GHz, mean ground tempe-rature 4° C
Figure 7 Reduction in antenna gain due to variation in angleof arrival
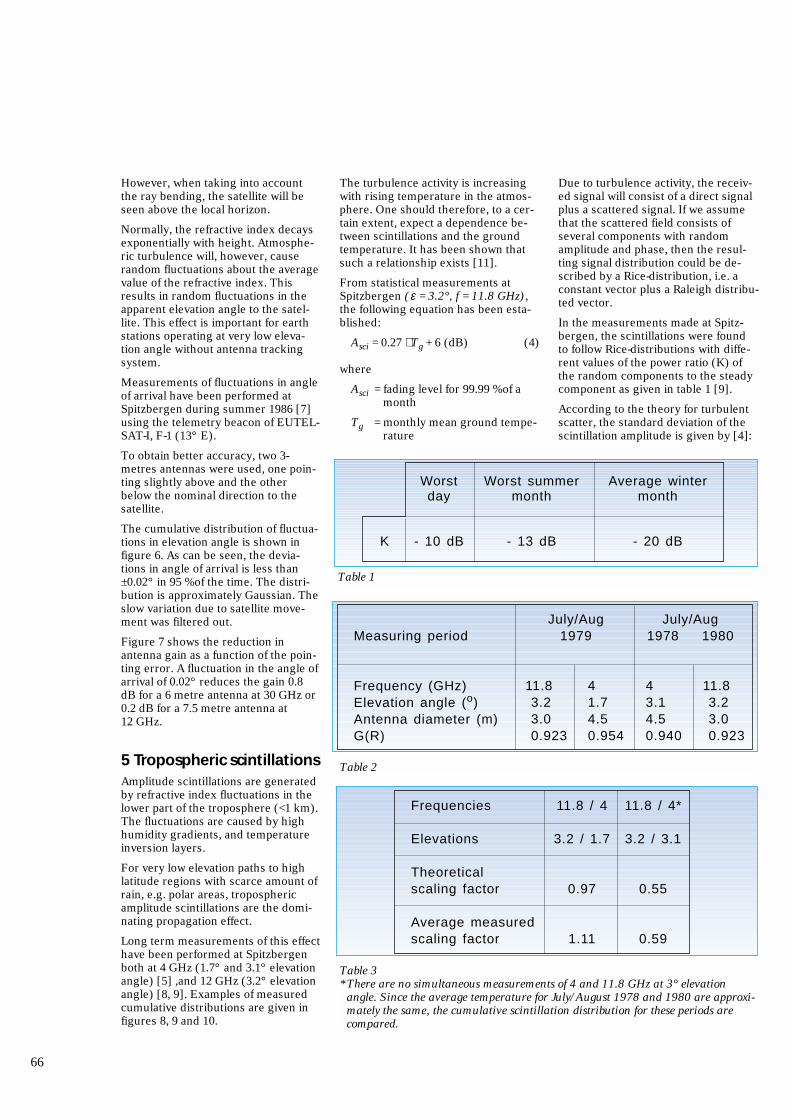
However, when taking into accountthe ray bending, the satellite will beseen above the local horizon.
Normally, the refractive index decaysexponentially with height. Atmosphe-ric turbulence will, however, causerandom fluctuations about the averagevalue of the refractive index. Thisresults in random fluctuations in theapparent elevation angle to the satel-lite. This effect is important for earthstations operating at very low eleva-tion angle without antenna trackingsystem.
Measurements of fluctuations in angleof arrival have been performed atSpitzbergen during summer 1986 [7]using the telemetry beacon of EUTEL-SAT-I, F-1 (13° E).
To obtain better accuracy, two 3-metres antennas were used, one poin-ting slightly above and the otherbelow the nominal direction to thesatellite.
The cumulative distribution of fluctua-tions in elevation angle is shown infigure 6. As can be seen, the devia-tions in angle of arrival is less than±0.02° in 95 % of the time. The distri-bution is approximately Gaussian. Theslow variation due to satellite move-ment was filtered out.
Figure 7 shows the reduction inantenna gain as a function of the poin-ting error. A fluctuation in the angle ofarrival of 0.02° reduces the gain 0.8dB for a 6 metre antenna at 30 GHz or0.2 dB for a 7.5 metre antenna at12 GHz.
5 Tropospheric scintillationsAmplitude scintillations are generatedby refractive index fluctuations in thelower part of the troposphere (<1 km).The fluctuations are caused by highhumidity gradients, and temperatureinversion layers.
For very low elevation paths to highlatitude regions with scarce amount ofrain, e.g. polar areas, troposphericamplitude scintillations are the domi-nating propagation effect.
Long term measurements of this effecthave been performed at Spitzbergenboth at 4 GHz (1.7° and 3.1° elevationangle) [5] ,and 12 GHz (3.2° elevationangle) [8, 9]. Examples of measuredcumulative distributions are given infigures 8, 9 and 10.
The turbulence activity is increasingwith rising temperature in the atmos-phere. One should therefore, to a cer-tain extent, expect a dependence be-tween scintillations and the groundtemperature. It has been shown thatsuch a relationship exists [11].
From statistical measurements atSpitzbergen (ε = 3.2°, f = 11.8 GHz),the following equation has been esta-blished:
Asci = 0.27 ⋅ Tg + 6 (dB) (4)
where
Asci = fading level for 99.99 % of amonth
Tg = monthly mean ground tempe-rature
Due to turbulence activity, the receiv-ed signal will consist of a direct signalplus a scattered signal. If we assumethat the scattered field consists ofseveral components with randomamplitude and phase, then the resul-ting signal distribution could be de-scribed by a Rice-distribution, i.e. aconstant vector plus a Raleigh distribu-ted vector.
In the measurements made at Spitz-bergen, the scintillations were foundto follow Rice-distributions with diffe-rent values of the power ratio (K) ofthe random components to the steadycomponent as given in table 1 [9].
According to the theory for turbulentscatter, the standard deviation of thescintillation amplitude is given by [4]:
66
Measuring period
Frequency (GHz)Elevation angle (o)Antenna diameter (m)G(R)
July/Aug1979
11.8 3.2 3.0 0.923
41.74.50.954
July/Aug1978 1980
11.8 3.2 3.0 0.923
43.14.50.940
Worstday
- 10 dB
Worst summermonth
- 13 dB
Average wintermonth
- 20 dBK
Table 2
Table 1
Frequencies
Elevations
Theoreticalscaling factor
Average measuredscaling factor
11.8 / 4
3.2 / 1.7
0.97
1.11
11.8 / 4*
3.2 / 3.1
0.55
0.59
Table 3*There are no simultaneous measurements of 4 and 11.8 GHz at 3° elevation
angle. Since the average temperature for July/August 1978 and 1980 are approxi-mately the same, the cumulative scintillation distribution for these periods arecompared.
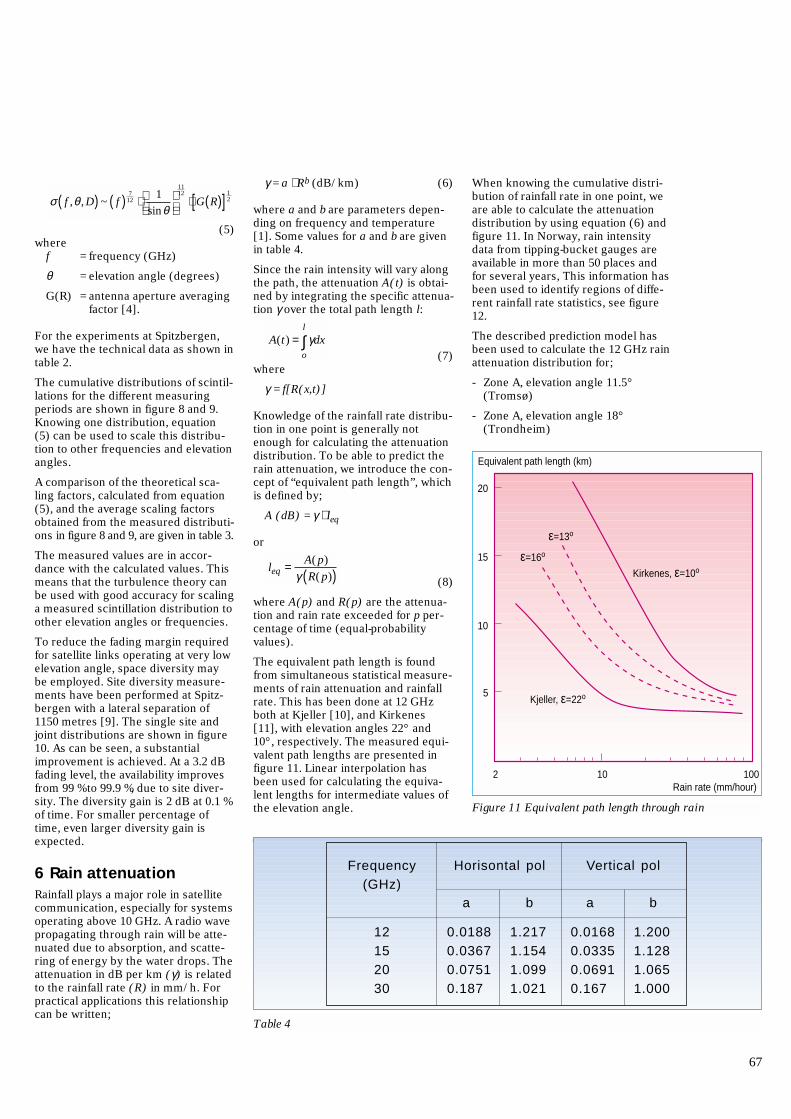
(5)where
f = frequency (GHz)
θ = elevation angle (degrees)
G(R) = antenna aperture averagingfactor [4].
For the experiments at Spitzbergen,we have the technical data as shown intable 2.
The cumulative distributions of scintil-lations for the different measuringperiods are shown in figure 8 and 9.Knowing one distribution, equation(5) can be used to scale this distribu-tion to other frequencies and elevationangles.
A comparison of the theoretical sca-ling factors, calculated from equation(5), and the average scaling factorsobtained from the measured distributi-ons in figure 8 and 9, are given in table 3.
The measured values are in accor-dance with the calculated values. Thismeans that the turbulence theory canbe used with good accuracy for scalinga measured scintillation distribution toother elevation angles or frequencies.
To reduce the fading margin requiredfor satellite links operating at very lowelevation angle, space diversity maybe employed. Site diversity measure-ments have been performed at Spitz-bergen with a lateral separation of1150 metres [9]. The single site andjoint distributions are shown in figure10. As can be seen, a substantialimprovement is achieved. At a 3.2 dBfading level, the availability improvesfrom 99 % to 99.9 %, due to site diver-sity. The diversity gain is 2 dB at 0.1 %of time. For smaller percentage oftime, even larger diversity gain isexpected.
6 Rain attenuationRainfall plays a major role in satellitecommunication, especially for systemsoperating above 10 GHz. A radio wavepropagating through rain will be atte-nuated due to absorption, and scatte-ring of energy by the water drops. Theattenuation in dB per km (γ) is relatedto the rainfall rate (R) in mm/h. Forpractical applications this relationshipcan be written;
σ f ,θ, D( ) ~ f( )7
12 ⋅ 1
sinθ
1112
⋅ G R( )[ ]12
γ = a ⋅ Rb (dB/km) (6)
where a and b are parameters depen-ding on frequency and temperature[1]. Some values for a and b are givenin table 4.
Since the rain intensity will vary alongthe path, the attenuation A(t) is obtai-ned by integrating the specific attenua-tion γ over the total path length l:
(7)where
γ = f[R(x,t)]
Knowledge of the rainfall rate distribu-tion in one point is generally notenough for calculating the attenuationdistribution. To be able to predict therain attenuation, we introduce the con-cept of “equivalent path length”, whichis defined by;
A (dB) = γ ⋅ leq
or
(8)
where A(p) and R(p) are the attenua-tion and rain rate exceeded for p per-centage of time (equal-probabilityvalues).
The equivalent path length is foundfrom simultaneous statistical measure-ments of rain attenuation and rainfallrate. This has been done at 12 GHzboth at Kjeller [10], and Kirkenes[11], with elevation angles 22° and10°, respectively. The measured equi-valent path lengths are presented infigure 11. Linear interpolation hasbeen used for calculating the equiva-lent lengths for intermediate values ofthe elevation angle.
leq = A( p)
γ R( p)( )
A(t) = γdxo
l
∫
When knowing the cumulative distri-bution of rainfall rate in one point, weare able to calculate the attenuationdistribution by using equation (6) andfigure 11. In Norway, rain intensitydata from tipping-bucket gauges areavailable in more than 50 places andfor several years, This information hasbeen used to identify regions of diffe-rent rainfall rate statistics, see figure12.
The described prediction model hasbeen used to calculate the 12 GHz rainattenuation distribution for;
- Zone A, elevation angle 11.5°(Tromsø)
- Zone A, elevation angle 18°(Trondheim)
67
Table 4
12152030
Frequency(GHz)
Horisontal pol
a b
0.01880.03670.07510.187
1.2171.1541.0991.021
Vertical pol
a b
0.01680.03350.06910.167
1.2001.1281.0651.000
Kirkenes, ε=10o
20
ε=13o
ε=16o
Kjeller, ε=22o
15
10
5
2 10 100
Equivalent path length (km)
Rain rate (mm/hour)
Figure 11 Equivalent path length through rain
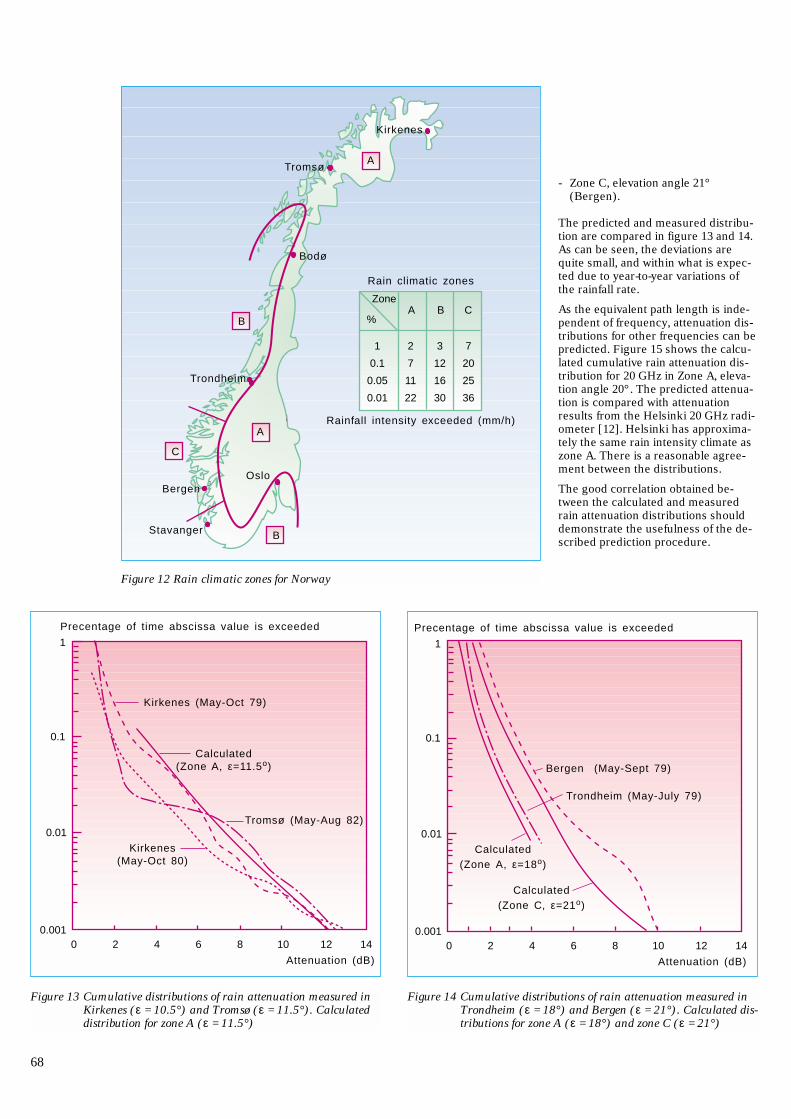
- Zone C, elevation angle 21°(Bergen).
The predicted and measured distribu-tion are compared in figure 13 and 14.As can be seen, the deviations arequite small, and within what is expec-ted due to year-to-year variations ofthe rainfall rate.
As the equivalent path length is inde-pendent of frequency, attenuation dis-tributions for other frequencies can bepredicted. Figure 15 shows the calcu-lated cumulative rain attenuation dis-tribution for 20 GHz in Zone A, eleva-tion angle 20°. The predicted attenua-tion is compared with attenuationresults from the Helsinki 20 GHz radi-ometer [12]. Helsinki has approxima-tely the same rain intensity climate aszone A. There is a reasonable agree-ment between the distributions.
The good correlation obtained be-tween the calculated and measuredrain attenuation distributions shoulddemonstrate the usefulness of the de-scribed prediction procedure.
68
Stavanger
B
C
B
OGu 6
A
Oslo
A
B
Bodø
Kirkenes
Tromsø
Trondheim
Bergen
Zone
%A B C
2
7
11
22
3
12
16
30
7
20
25
36
1
0.1
0.05
0.01
Rain climatic zones
Rainfall intensity exceeded (mm/h)
Figure 12 Rain climatic zones for Norway
Figure 14 Cumulative distributions of rain attenuation measured inTrondheim (ε = 18°) and Bergen (ε = 21°). Calculated dis-tributions for zone A (ε = 18°) and zone C (ε = 21°)
1
0.1
0.01
0.0010 2 4 6 8 10 12 14
Attenuation (dB)
Precentage of time abscissa value is exceeded
Bergen (May-Sept 79)
Calculated(Zone C, ε=21o)
Trondheim (May-July 79)
Calculated(Zone A, ε=18o)
Kirkenes (May-Oct 79)
1
0.1
0.01
0.0010 2 4 6 8 10 12 14
Tromsø (May-Aug 82)
Kirkenes(May-Oct 80)
Calculated(Zone A, ε=11.5o)
Attenuation (dB)
Precentage of time abscissa value is exceeded
Figure 13 Cumulative distributions of rain attenuation measured inKirkenes (ε = 10.5°) and Tromsø (ε = 11.5°). Calculateddistribution for zone A (ε = 11.5°)
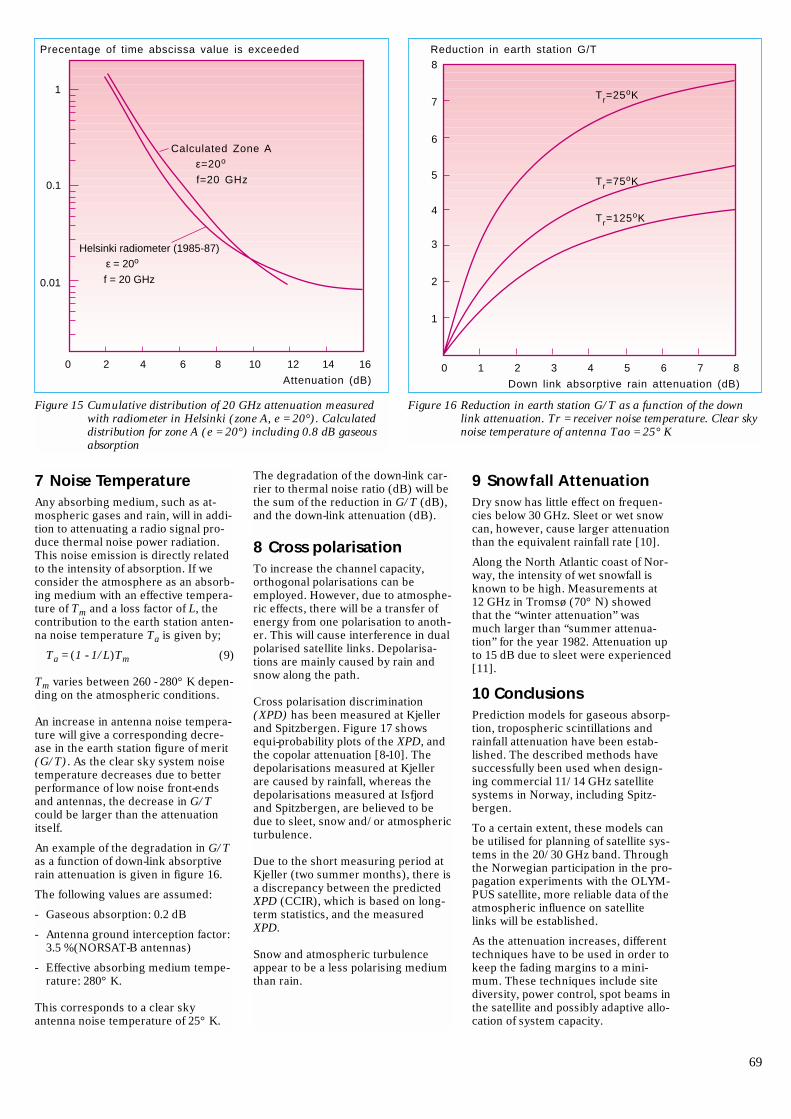
9 Snowfall AttenuationDry snow has little effect on frequen-cies below 30 GHz. Sleet or wet snowcan, however, cause larger attenuationthan the equivalent rainfall rate [10].
Along the North Atlantic coast of Nor-way, the intensity of wet snowfall isknown to be high. Measurements at12 GHz in Tromsø (70° N) showedthat the “winter attenuation” wasmuch larger than “summer attenua-tion” for the year 1982. Attenuation upto 15 dB due to sleet were experienced[11].
10 ConclusionsPrediction models for gaseous absorp-tion, tropospheric scintillations andrainfall attenuation have been estab-lished. The described methods havesuccessfully been used when design-ing commercial 11/14 GHz satellitesystems in Norway, including Spitz-bergen.
To a certain extent, these models canbe utilised for planning of satellite sys-tems in the 20/30 GHz band. Throughthe Norwegian participation in the pro-pagation experiments with the OLYM-PUS satellite, more reliable data of theatmospheric influence on satellitelinks will be established.
As the attenuation increases, differenttechniques have to be used in order tokeep the fading margins to a mini-mum. These techniques include sitediversity, power control, spot beams inthe satellite and possibly adaptive allo-cation of system capacity.
69
Calculated Zone A
ε=20o
f=20 GHz
1
0.1
0.01
0 2 4 6 8 10 12 14
Attenuation (dB)
Precentage of time abscissa value is exceeded
16
Helsinki radiometer (1985-87)
ε = 20o
f = 20 GHz
0
Tr=25oK
Tr=75oK
Tr=125oK
1 2 3 4 5 6 7 8
1
2
3
4
5
6
7
8Reduction in earth station G/T
Down link absorptive rain attenuation (dB)
Figure 15 Cumulative distribution of 20 GHz attenuation measuredwith radiometer in Helsinki (zone A, e = 20°). Calculateddistribution for zone A (e = 20°) including 0.8 dB gaseousabsorption
Figure 16 Reduction in earth station G/T as a function of the downlink attenuation. Tr = receiver noise temperature. Clear skynoise temperature of antenna Tao = 25° K
7 Noise TemperatureAny absorbing medium, such as at-mospheric gases and rain, will in addi-tion to attenuating a radio signal pro-duce thermal noise power radiation.This noise emission is directly relatedto the intensity of absorption. If weconsider the atmosphere as an absorb-ing medium with an effective tempera-ture of Tm and a loss factor of L, thecontribution to the earth station anten-na noise temperature Ta is given by;
Ta = (1 - 1/L)Tm (9)
Tm varies between 260 - 280° K depen-ding on the atmospheric conditions.
An increase in antenna noise tempera-ture will give a corresponding decre-ase in the earth station figure of merit(G/T). As the clear sky system noisetemperature decreases due to betterperformance of low noise front-endsand antennas, the decrease in G/Tcould be larger than the attenuationitself.
An example of the degradation in G/Tas a function of down-link absorptiverain attenuation is given in figure 16.
The following values are assumed:
- Gaseous absorption: 0.2 dB
- Antenna ground interception factor:3.5 % (NORSAT-B antennas)
- Effective absorbing medium tempe-rature: 280° K.
This corresponds to a clear skyantenna noise temperature of 25° K.
The degradation of the down-link car-rier to thermal noise ratio (dB) will bethe sum of the reduction in G/T (dB),and the down-link attenuation (dB).
8 Cross polarisationTo increase the channel capacity,orthogonal polarisations can beemployed. However, due to atmosphe-ric effects, there will be a transfer ofenergy from one polarisation to anoth-er. This will cause interference in dualpolarised satellite links. Depolarisa-tions are mainly caused by rain andsnow along the path.
Cross polarisation discrimination(XPD) has been measured at Kjellerand Spitzbergen. Figure 17 showsequi-probability plots of the XPD, andthe copolar attenuation [8-10]. Thedepolarisations measured at Kjellerare caused by rainfall, whereas thedepolarisations measured at Isfjordand Spitzbergen, are believed to bedue to sleet, snow and/or atmosphericturbulence.
Due to the short measuring period atKjeller (two summer months), there isa discrepancy between the predictedXPD (CCIR), which is based on long-term statistics, and the measuredXPD.
Snow and atmospheric turbulenceappear to be a less polarising mediumthan rain.
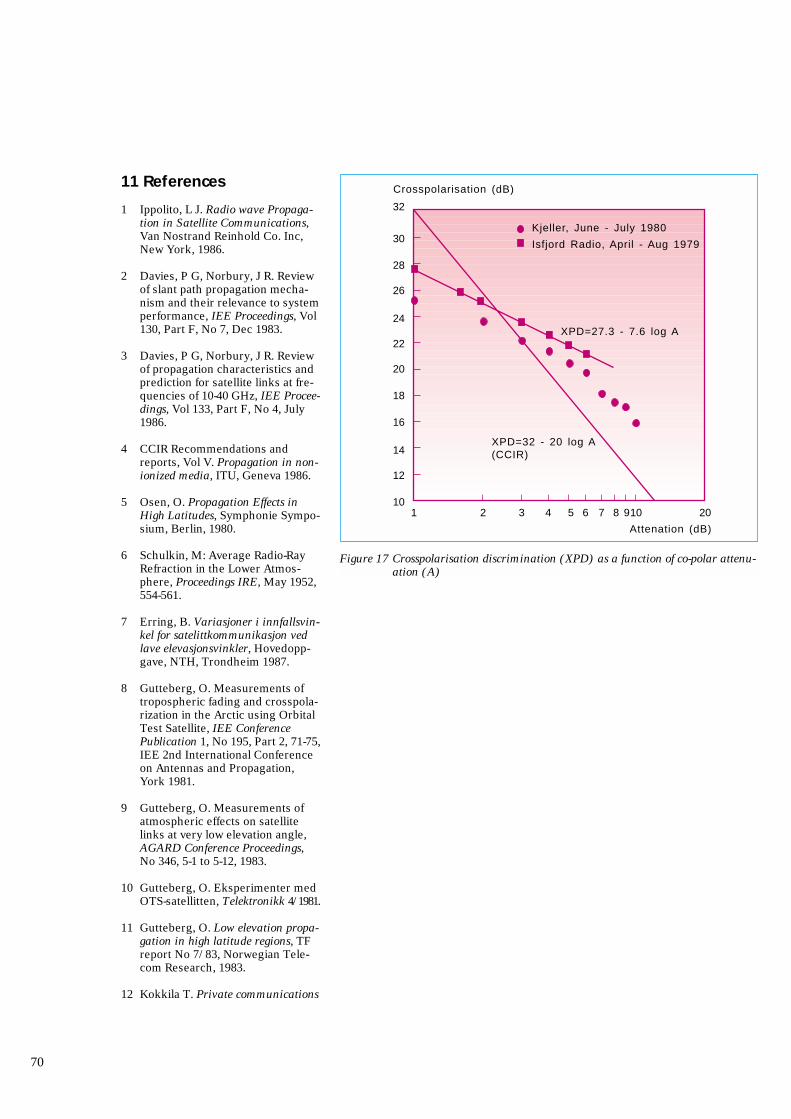
11 References
1 Ippolito, L J. Radio wave Propaga-tion in Satellite Communications,Van Nostrand Reinhold Co. Inc,New York, 1986.
2 Davies, P G, Norbury, J R. Reviewof slant path propagation mecha-nism and their relevance to systemperformance, IEE Proceedings, Vol130, Part F, No 7, Dec 1983.
3 Davies, P G, Norbury, J R. Reviewof propagation characteristics andprediction for satellite links at fre-quencies of 10-40 GHz, IEE Procee-dings, Vol 133, Part F, No 4, July1986.
4 CCIR Recommendations andreports, Vol V. Propagation in non-ionized media, ITU, Geneva 1986.
5 Osen, O. Propagation Effects inHigh Latitudes, Symphonie Sympo-sium, Berlin, 1980.
6 Schulkin, M: Average Radio-RayRefraction in the Lower Atmos-phere, Proceedings IRE, May 1952,554-561.
7 Erring, B. Variasjoner i innfallsvin-kel for satelittkommunikasjon vedlave elevasjonsvinkler, Hovedopp-gave, NTH, Trondheim 1987.
8 Gutteberg, O. Measurements oftropospheric fading and crosspola-rization in the Arctic using OrbitalTest Satellite, IEE ConferencePublication 1, No 195, Part 2, 71-75,IEE 2nd International Conferenceon Antennas and Propagation,York 1981.
9 Gutteberg, O. Measurements ofatmospheric effects on satellitelinks at very low elevation angle,AGARD Conference Proceedings,No 346, 5-1 to 5-12, 1983.
10 Gutteberg, O. Eksperimenter medOTS-satellitten, Telektronikk 4/1981.
11 Gutteberg, O. Low elevation propa-gation in high latitude regions, TFreport No 7/83, Norwegian Tele-com Research, 1983.
12 Kokkila T. Private communications
70
Figure 17 Crosspolarisation discrimination (XPD) as a function of co-polar attenu-ation (A)
1
Attenation (dB)
2 3 4 5 6 7 8 910 20
32
30
28
26
24
22
20
18
16
14
12
10
Crosspolarisation (dB)
Kjeller, June - July 1980
Isfjord Radio, April - Aug 1979
XPD=27.3 - 7.6 log A
XPD=32 - 20 log A(CCIR)
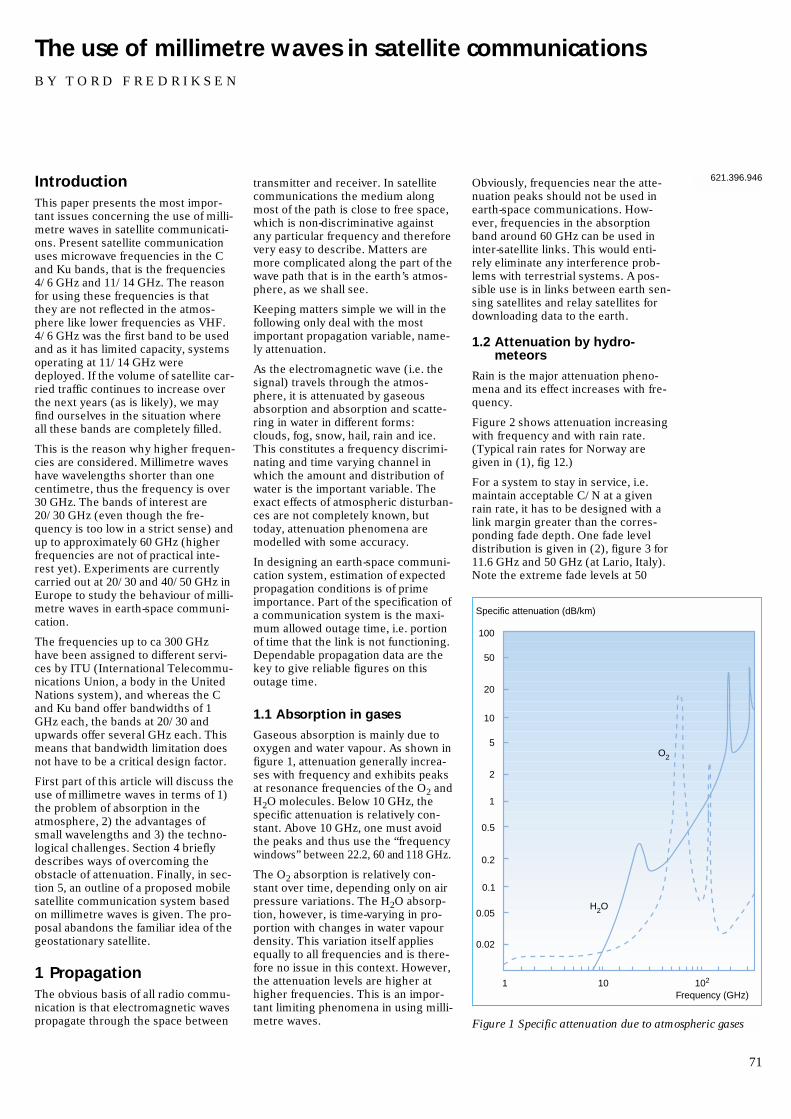
IntroductionThis paper presents the most impor-tant issues concerning the use of milli-metre waves in satellite communicati-ons. Present satellite communicationuses microwave frequencies in the Cand Ku bands, that is the frequencies 4/6 GHz and 11/14 GHz. The reasonfor using these frequencies is thatthey are not reflected in the atmos-phere like lower frequencies as VHF.4/6 GHz was the first band to be usedand as it has limited capacity, systemsoperating at 11/14 GHz weredeployed. If the volume of satellite car-ried traffic continues to increase overthe next years (as is likely), we mayfind ourselves in the situation whereall these bands are completely filled.
This is the reason why higher frequen-cies are considered. Millimetre waveshave wavelengths shorter than onecentimetre, thus the frequency is over 30 GHz. The bands of interest are20/30 GHz (even though the fre-quency is too low in a strict sense) andup to approximately 60 GHz (higherfrequencies are not of practical inte-rest yet). Experiments are currentlycarried out at 20/30 and 40/50 GHz inEurope to study the behaviour of milli-metre waves in earth-space communi-cation.
The frequencies up to ca 300 GHzhave been assigned to different servi-ces by ITU (International Telecommu-nications Union, a body in the UnitedNations system), and whereas the Cand Ku band offer bandwidths of 1GHz each, the bands at 20/30 andupwards offer several GHz each. Thismeans that bandwidth limitation doesnot have to be a critical design factor.
First part of this article will discuss theuse of millimetre waves in terms of 1)the problem of absorption in theatmosphere, 2) the advantages ofsmall wavelengths and 3) the techno-logical challenges. Section 4 brieflydescribes ways of overcoming theobstacle of attenuation. Finally, in sec-tion 5, an outline of a proposed mobilesatellite communication system basedon millimetre waves is given. The pro-posal abandons the familiar idea of thegeostationary satellite.
1 PropagationThe obvious basis of all radio commu-nication is that electromagnetic wavespropagate through the space between
transmitter and receiver. In satellitecommunications the medium alongmost of the path is close to free space,which is non-discriminative againstany particular frequency and thereforevery easy to describe. Matters aremore complicated along the part of thewave path that is in the earth’s atmos-phere, as we shall see.
Keeping matters simple we will in thefollowing only deal with the mostimportant propagation variable, name-ly attenuation.
As the electromagnetic wave (i.e. thesignal) travels through the atmos-phere, it is attenuated by gaseousabsorption and absorption and scatte-ring in water in different forms:clouds, fog, snow, hail, rain and ice.This constitutes a frequency discrimi-nating and time varying channel inwhich the amount and distribution ofwater is the important variable. Theexact effects of atmospheric disturban-ces are not completely known, buttoday, attenuation phenomena aremodelled with some accuracy.
In designing an earth-space communi-cation system, estimation of expectedpropagation conditions is of primeimportance. Part of the specification ofa communication system is the maxi-mum allowed outage time, i.e. portionof time that the link is not functioning.Dependable propagation data are thekey to give reliable figures on thisoutage time.
1.1 Absorption in gases
Gaseous absorption is mainly due tooxygen and water vapour. As shown infigure 1, attenuation generally increa-ses with frequency and exhibits peaksat resonance frequencies of the O2 andH2O molecules. Below 10 GHz, thespecific attenuation is relatively con-stant. Above 10 GHz, one must avoidthe peaks and thus use the “frequencywindows” between 22.2, 60 and 118 GHz.
The O2 absorption is relatively con-stant over time, depending only on airpressure variations. The H2O absorp-tion, however, is time-varying in pro-portion with changes in water vapourdensity. This variation itself appliesequally to all frequencies and is there-fore no issue in this context. However,the attenuation levels are higher athigher frequencies. This is an impor-tant limiting phenomena in using milli-metre waves.
Obviously, frequencies near the atte-nuation peaks should not be used inearth-space communications. How-ever, frequencies in the absorptionband around 60 GHz can be used ininter-satellite links. This would enti-rely eliminate any interference prob-lems with terrestrial systems. A pos-sible use is in links between earth sen-sing satellites and relay satellites fordownloading data to the earth.
1.2 Attenuation by hydro-meteors
Rain is the major attenuation pheno-mena and its effect increases with fre-quency.
Figure 2 shows attenuation increasingwith frequency and with rain rate.(Typical rain rates for Norway aregiven in (1), fig 12.)
For a system to stay in service, i.e.maintain acceptable C/N at a givenrain rate, it has to be designed with alink margin greater than the corres-ponding fade depth. One fade leveldistribution is given in (2), figure 3 for11.6 GHz and 50 GHz (at Lario, Italy).Note the extreme fade levels at 50
71
The use of millimetre waves in satellite communicationsB Y T O R D F R E D R I K S E N
621.396.946
1 10 102
H2O
O2
Frequency (GHz)
Specific attenuation (dB/km)
100
50
20
10
5
2
1
0.5
0.2
0.1
0.05
0.02
Figure 1 Specific attenuation due to atmospheric gases
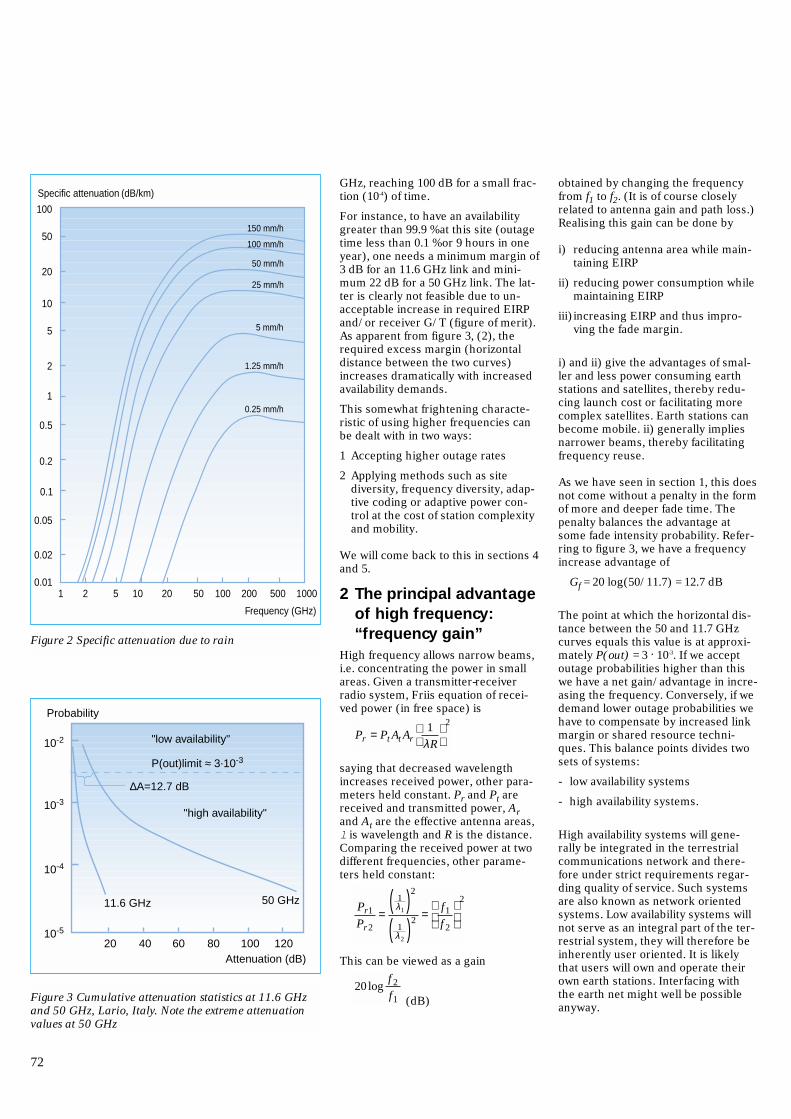
GHz, reaching 100 dB for a small frac-tion (10-4) of time.
For instance, to have an availabilitygreater than 99.9 % at this site (outagetime less than 0.1 % or 9 hours in oneyear), one needs a minimum margin of3 dB for an 11.6 GHz link and mini-mum 22 dB for a 50 GHz link. The lat-ter is clearly not feasible due to un-acceptable increase in required EIRPand/or receiver G/T (figure of merit).As apparent from figure 3, (2), therequired excess margin (horizontaldistance between the two curves)increases dramatically with increasedavailability demands.
This somewhat frightening characte-ristic of using higher frequencies canbe dealt with in two ways:
1 Accepting higher outage rates
2 Applying methods such as sitediversity, frequency diversity, adap-tive coding or adaptive power con-trol at the cost of station complexityand mobility.
We will come back to this in sections 4and 5.
2 The principal advantageof high frequency:“frequency gain”
High frequency allows narrow beams,i.e. concentrating the power in smallareas. Given a transmitter-receiverradio system, Friis equation of recei-ved power (in free space) is
saying that decreased wavelengthincreases received power, other para-meters held constant. Pr and Pt arereceived and transmitted power, Arand At are the effective antenna areas,l is wavelength and R is the distance.Comparing the received power at twodifferent frequencies, other parame-ters held constant:
This can be viewed as a gain
(dB)20 log
f 2
f1
Pr1
Pr2=
1λ1
( )2
1λ 2
( )2 = f1
f 2
2
Pr = Pt At Ar1
λR
2
obtained by changing the frequencyfrom f1 to f2. (It is of course closelyrelated to antenna gain and path loss.)Realising this gain can be done by
i) reducing antenna area while main-taining EIRP
ii) reducing power consumption whilemaintaining EIRP
iii)increasing EIRP and thus impro-ving the fade margin.
i) and ii) give the advantages of smal-ler and less power consuming earthstations and satellites, thereby redu-cing launch cost or facilitating morecomplex satellites. Earth stations canbecome mobile. ii) generally impliesnarrower beams, thereby facilitatingfrequency reuse.
As we have seen in section 1, this doesnot come without a penalty in the formof more and deeper fade time. Thepenalty balances the advantage atsome fade intensity probability. Refer-ring to figure 3, we have a frequencyincrease advantage of
Gf = 20 log(50/11.7) = 12.7 dB
The point at which the horizontal dis-tance between the 50 and 11.7 GHzcurves equals this value is at approxi-mately P(out) = 3 . 10-3. If we acceptoutage probabilities higher than thiswe have a net gain/advantage in incre-asing the frequency. Conversely, if wedemand lower outage probabilities wehave to compensate by increased linkmargin or shared resource techni-ques. This balance points divides twosets of systems:
- low availability systems
- high availability systems.
High availability systems will gene-rally be integrated in the terrestrialcommunications network and there-fore under strict requirements regar-ding quality of service. Such systemsare also known as network orientedsystems. Low availability systems willnot serve as an integral part of the ter-restrial system, they will therefore beinherently user oriented. It is likelythat users will own and operate theirown earth stations. Interfacing withthe earth net might well be possibleanyway.
72
Figure 3 Cumulative attenuation statistics at 11.6 GHzand 50 GHz, Lario, Italy. Note the extreme attenuationvalues at 50 GHz
20
"low availability"
"high availability"
11.6 GHz 50 GHz
∆A=12.7 dB
P(out)limit ≈ 3.10-3
40 60 80 100 120Attenuation (dB)
Probability
10-2
10-3
10-4
10-5
Figure 2 Specific attenuation due to rain
1
Frequency (GHz)
Specific attenuation (dB/km)
2 5 10 20 50 100 200 500 10000.01
150 mm/h
100 mm/h
50 mm/h
25 mm/h
5 mm/h
1.25 mm/h
0.25 mm/h
100
50
20
10
5
2
1
0.5
0.2
0.1
0.05
0.02
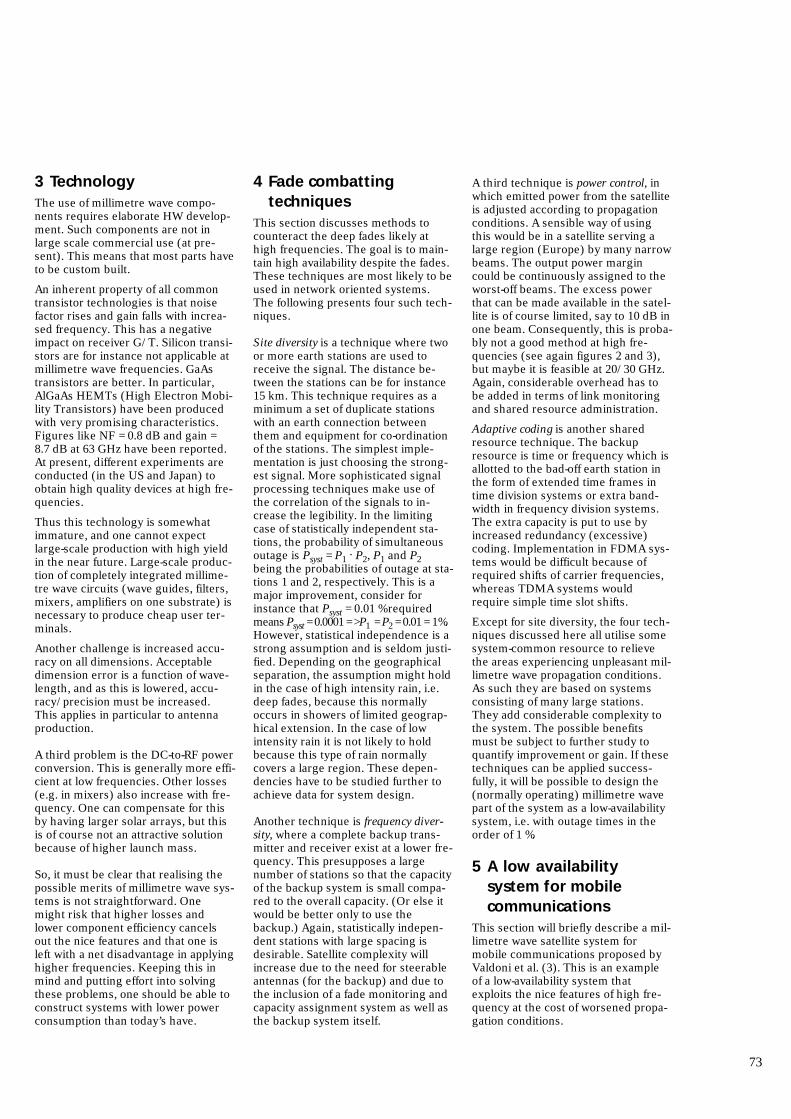
3 TechnologyThe use of millimetre wave compo-nents requires elaborate HW develop-ment. Such components are not inlarge scale commercial use (at pre-sent). This means that most parts haveto be custom built.
An inherent property of all commontransistor technologies is that noisefactor rises and gain falls with increa-sed frequency. This has a negativeimpact on receiver G/T. Silicon transi-stors are for instance not applicable atmillimetre wave frequencies. GaAstransistors are better. In particular,AlGaAs HEMTs (High Electron Mobi-lity Transistors) have been producedwith very promising characteristics.Figures like NF = 0.8 dB and gain = 8.7 dB at 63 GHz have been reported.At present, different experiments areconducted (in the US and Japan) toobtain high quality devices at high fre-quencies.
Thus this technology is somewhatimmature, and one cannot expectlarge-scale production with high yieldin the near future. Large-scale produc-tion of completely integrated millime-tre wave circuits (wave guides, filters,mixers, amplifiers on one substrate) isnecessary to produce cheap user ter-minals.
Another challenge is increased accu-racy on all dimensions. Acceptabledimension error is a function of wave-length, and as this is lowered, accu-racy/precision must be increased.This applies in particular to antennaproduction.
A third problem is the DC-to-RF powerconversion. This is generally more effi-cient at low frequencies. Other losses(e.g. in mixers) also increase with fre-quency. One can compensate for thisby having larger solar arrays, but thisis of course not an attractive solutionbecause of higher launch mass.
So, it must be clear that realising thepossible merits of millimetre wave sys-tems is not straightforward. Onemight risk that higher losses andlower component efficiency cancelsout the nice features and that one isleft with a net disadvantage in applyinghigher frequencies. Keeping this inmind and putting effort into solvingthese problems, one should be able toconstruct systems with lower powerconsumption than today’s have.
4 Fade combattingtechniques
This section discusses methods tocounteract the deep fades likely athigh frequencies. The goal is to main-tain high availability despite the fades.These techniques are most likely to beused in network oriented systems.The following presents four such tech-niques.
Site diversity is a technique where twoor more earth stations are used toreceive the signal. The distance be-tween the stations can be for instance15 km. This technique requires as aminimum a set of duplicate stationswith an earth connection betweenthem and equipment for co-ordinationof the stations. The simplest imple-mentation is just choosing the strong-est signal. More sophisticated signalprocessing techniques make use ofthe correlation of the signals to in-crease the legibility. In the limitingcase of statistically independent sta-tions, the probability of simultaneousoutage is Psyst = P1
. P2, P1 and P2being the probabilities of outage at sta-tions 1 and 2, respectively. This is amajor improvement, consider forinstance that Psyst = 0.01 % requiredmeans Psyst = 0.0001 = >P1 = P2 = 0.01 = 1%.However, statistical independence is astrong assumption and is seldom justi-fied. Depending on the geographicalseparation, the assumption might holdin the case of high intensity rain, i.e.deep fades, because this normallyoccurs in showers of limited geograp-hical extension. In the case of lowintensity rain it is not likely to holdbecause this type of rain normallycovers a large region. These depen-dencies have to be studied further toachieve data for system design.
Another technique is frequency diver-sity, where a complete backup trans-mitter and receiver exist at a lower fre-quency. This presupposes a largenumber of stations so that the capacityof the backup system is small compa-red to the overall capacity. (Or else itwould be better only to use thebackup.) Again, statistically indepen-dent stations with large spacing isdesirable. Satellite complexity willincrease due to the need for steerableantennas (for the backup) and due tothe inclusion of a fade monitoring andcapacity assignment system as well asthe backup system itself.
A third technique is power control, inwhich emitted power from the satelliteis adjusted according to propagationconditions. A sensible way of usingthis would be in a satellite serving alarge region (Europe) by many narrowbeams. The output power margincould be continuously assigned to theworst-off beams. The excess powerthat can be made available in the satel-lite is of course limited, say to 10 dB inone beam. Consequently, this is proba-bly not a good method at high fre-quencies (see again figures 2 and 3),but maybe it is feasible at 20/30 GHz.Again, considerable overhead has tobe added in terms of link monitoringand shared resource administration.
Adaptive coding is another sharedresource technique. The backupresource is time or frequency which isallotted to the bad-off earth station inthe form of extended time frames intime division systems or extra band-width in frequency division systems.The extra capacity is put to use byincreased redundancy (excessive)coding. Implementation in FDMA sys-tems would be difficult because ofrequired shifts of carrier frequencies,whereas TDMA systems wouldrequire simple time slot shifts.
Except for site diversity, the four tech-niques discussed here all utilise somesystem-common resource to relievethe areas experiencing unpleasant mil-limetre wave propagation conditions.As such they are based on systemsconsisting of many large stations.They add considerable complexity tothe system. The possible benefitsmust be subject to further study toquantify improvement or gain. If thesetechniques can be applied success-fully, it will be possible to design the(normally operating) millimetre wavepart of the system as a low-availabilitysystem, i.e. with outage times in theorder of 1 %.
5 A low availabilitysystem for mobilecommunications
This section will briefly describe a mil-limetre wave satellite system formobile communications proposed byValdoni et al. (3). This is an exampleof a low-availability system thatexploits the nice features of high fre-quency at the cost of worsened propa-gation conditions.
73
Operating at 40/45 GHz it will offerfull duplex 64 kbit/s (ISDN 2B+D)with bit error rate 10-6 and 99 % availa-bility. Earth station antennas will bephased arrays of approximate size 22 x 22 cm (Rx) and 6 x 6 cm (Tx), i.e.suitable for integration in cars. Theidea is to supplement terrestrial cellu-lar systems by offering 1) good cove-rage in suburban and rural areas and2) higher bit rates. The main advan-tage of a satellite mobile system over aterrestrial one is that once launched, itserves the complete planned coveragearea, including scarcely populatedareas. The terrestrial system, on theother hand, is built up gradually, onecell at a time, and it is not economicalto deploy stations in many rural areas.
A good space segment would consistof three satellites in highly inclinedorbits. Because millimetre waves areseriously impeded/stopped by obsta-cles in the path, the elevation angleshould be as high as possible, in orderto reduce the probability of obstaclesin the path. Also, high antenna gaineliminates multipath propagation andthus the receiver depends only on thedirect path. Ideally then, the satelliteshould be in zenith. A highly inclinedelliptical orbit like the Molniya orbit((4), figures 7 and 8) gives a quasi sta-tionary satellite near the apogeum for8 hours per revolution of 12 hours.Using three satellites properly phasedin three orbits give continuous cove-rage from near zenith elevations (>60deg.) all over Europe. I repeat herethe orbital parameters:
T = 12 hoursinclination = 63.4 degreesHmax/Hmin = 39,100/1,250 kmH handover = 23,500 kmvisibility = 8 hours.
This will give very high elevationangles, reducing the blocking prob-lems significantly. Besides, attenua-tion in rain and gases, which is propor-tional to the path length through theatmosphere, is also reduced whenelevation increases.
But this orbital constellation entailsnew difficulties compared to geostatio-nary systems. First, there is the zoo-ming effects: As the distance to thesatellite changes, cell size (coveragearea per beam) changes with a factorof 1.7 from handover to apogeum. Thismight necessitate dynamic beam sha-ping in the satellite, which is possible
by electronically steerable antennas.Second, Doppler shift can be in theorder of several hundred kHz. This ismainly caused by satellite, not earthstation, movement and has to be com-pensated in the satellite or earth sta-tion. All this means that both the satel-lite and the earth stations increase incomplexity. This has also been thecase with terrestrial cellular systems.Today’s mobile stations and base sta-tions have very advanced networkaccess procedures and signal proces-sing. In moving to mobile satellite sys-tems, one must expect the complica-tion level to increase further with func-tions like electronic antenna tracking,dynamic beam shaping, new handoverprocedures, dynamic “bandwidth” allo-cation and frequency shift compensa-tion.
ConclusionThe shift upwards in frequency isnecessitated by the congestion ofbands in present use. But, into the bar-gain, millimetre waves have the meritof narrow beams and/or small anten-nas. On the other hand, they experi-ence difficult propagation conditionsand the component technology is in itsadolescence. This may favour systemscompletely different from today’s, forinstance mobile satellite systems ininclined low earth orbits or ellipticalorbits. As with all technology changes,it is not just a simple case of “interpola-ting” on, or “adjusting”, contemporarysystems. We have to expect or evenpave the way for completely new sys-tems.
References
1 Gutteberg, O. Effects of atmos-phere on earth-space radio propa-gation, Telektronikk, 4/92, 63-70.
2 Carassa, F. Application of millime-ter waves to satellite systems, AltaFrequenza, vol LVIII N.5-6, Sept-Dec 1989.
3 Valdoni, F et al. A new millimetrewave satellite system for landmobile communications, EuropeanTransactions on Telecommunica-tions and Related Technologies,ETT vol I-N.5, Sept-Oct 1990.
4 Hovstad, P, Gutteberg, O. Futuresystems for mobile satellite com-munications, Telektronikk, 4/92,54-62.
74
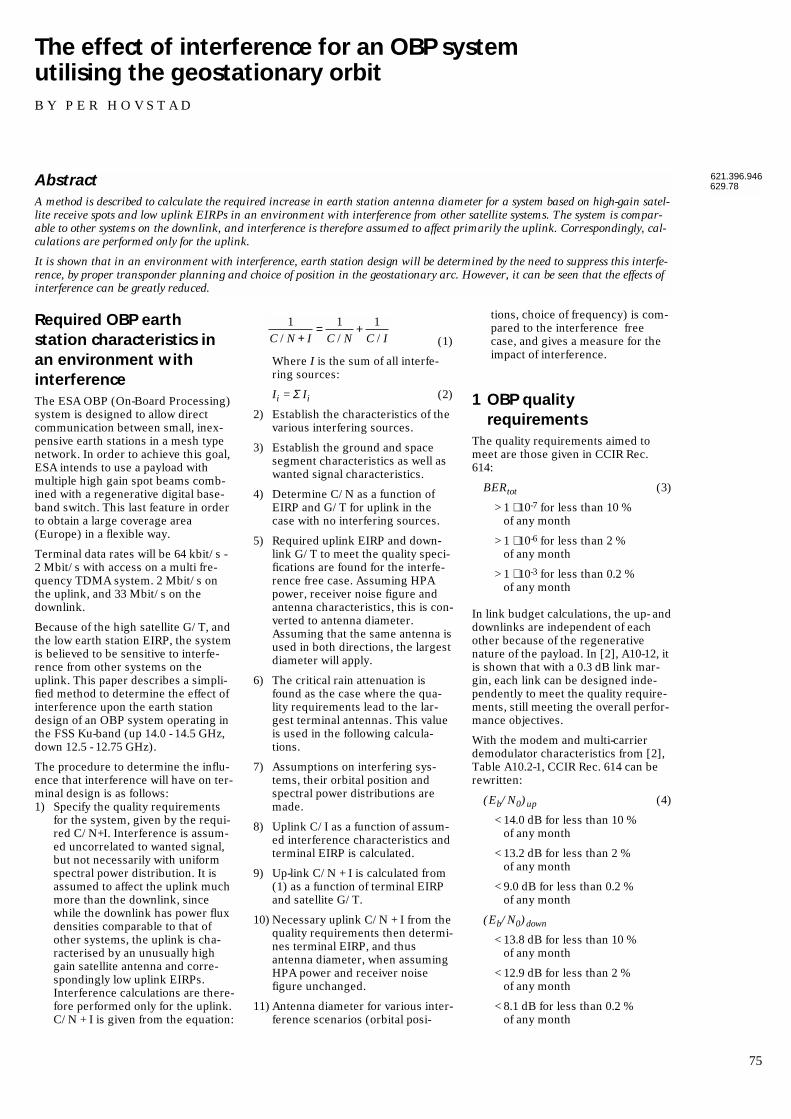
Required OBP earthstation characteristics inan environment withinterferenceThe ESA OBP (On-Board Processing)system is designed to allow directcommunication between small, inex-pensive earth stations in a mesh typenetwork. In order to achieve this goal,ESA intends to use a payload withmultiple high gain spot beams comb-ined with a regenerative digital base-band switch. This last feature in orderto obtain a large coverage area(Europe) in a flexible way.
Terminal data rates will be 64 kbit/s -2 Mbit/s with access on a multi fre-quency TDMA system. 2 Mbit/s onthe uplink, and 33 Mbit/s on thedownlink.
Because of the high satellite G/T, andthe low earth station EIRP, the systemis believed to be sensitive to interfe-rence from other systems on theuplink. This paper describes a simpli-fied method to determine the effect ofinterference upon the earth stationdesign of an OBP system operating inthe FSS Ku-band (up 14.0 - 14.5 GHz,down 12.5 - 12.75 GHz).
The procedure to determine the influ-ence that interference will have on ter-minal design is as follows:1) Specify the quality requirements
for the system, given by the requi-red C/N+I. Interference is assum-ed uncorrelated to wanted signal,but not necessarily with uniformspectral power distribution. It isassumed to affect the uplink muchmore than the downlink, sincewhile the downlink has power fluxdensities comparable to that ofother systems, the uplink is cha-racterised by an unusually highgain satellite antenna and corre-spondingly low uplink EIRPs.Interference calculations are there-fore performed only for the uplink.C/N + I is given from the equation:
(1)
Where I is the sum of all interfe-ring sources:
Ii = Σ Ii (2)
2) Establish the characteristics of thevarious interfering sources.
3) Establish the ground and spacesegment characteristics as well aswanted signal characteristics.
4) Determine C/N as a function ofEIRP and G/T for uplink in thecase with no interfering sources.
5) Required uplink EIRP and down-link G/T to meet the quality speci-fications are found for the interfe-rence free case. Assuming HPApower, receiver noise figure andantenna characteristics, this is con-verted to antenna diameter.Assuming that the same antenna isused in both directions, the largestdiameter will apply.
6) The critical rain attenuation isfound as the case where the qua-lity requirements lead to the lar-gest terminal antennas. This valueis used in the following calcula-tions.
7) Assumptions on interfering sys-tems, their orbital position andspectral power distributions aremade.
8) Uplink C/I as a function of assum-ed interference characteristics andterminal EIRP is calculated.
9) Up-link C/N + I is calculated from(1) as a function of terminal EIRPand satellite G/T.
10) Necessary uplink C/N + I from thequality requirements then determi-nes terminal EIRP, and thusantenna diameter, when assumingHPA power and receiver noisefigure unchanged.
11) Antenna diameter for various inter-ference scenarios (orbital posi-
1
C / N + I= 1
C / N+ 1
C / I
tions, choice of frequency) is com-pared to the interference freecase, and gives a measure for theimpact of interference.
1 OBP qualityrequirements
The quality requirements aimed tomeet are those given in CCIR Rec.614:
BERtot (3)
> 1 ⋅ 10-7 for less than 10 %of any month
> 1 ⋅ 10-6 for less than 2 %of any month
> 1 ⋅ 10-3 for less than 0.2 %of any month
In link budget calculations, the up- anddownlinks are independent of eachother because of the regenerativenature of the payload. In [2], A10-12, itis shown that with a 0.3 dB link mar-gin, each link can be designed inde-pendently to meet the quality require-ments, still meeting the overall perfor-mance objectives.
With the modem and multi-carrierdemodulator characteristics from [2],Table A10.2-1, CCIR Rec. 614 can berewritten:
(Eb/N0)up (4)
< 14.0 dB for less than 10 % of any month
< 13.2 dB for less than 2 % of any month
< 9.0 dB for less than 0.2 % of any month
(Eb/N0)down
< 13.8 dB for less than 10 %of any month
< 12.9 dB for less than 2 %of any month
< 8.1 dB for less than 0.2 %of any month
75
The effect of interference for an OBP system utilising the geostationary orbitB Y P E R H O V S T A D
AbstractA method is described to calculate the required increase in earth station antenna diameter for a system based on high-gain satel-lite receive spots and low uplink EIRPs in an environment with interference from other satellite systems. The system is compar-able to other systems on the downlink, and interference is therefore assumed to affect primarily the uplink. Correspondingly, cal-culations are performed only for the uplink.
It is shown that in an environment with interference, earth station design will be determined by the need to suppress this interfe-rence, by proper transponder planning and choice of position in the geostationary arc. However, it can be seen that the effects ofinterference can be greatly reduced.
621.396.946629.78
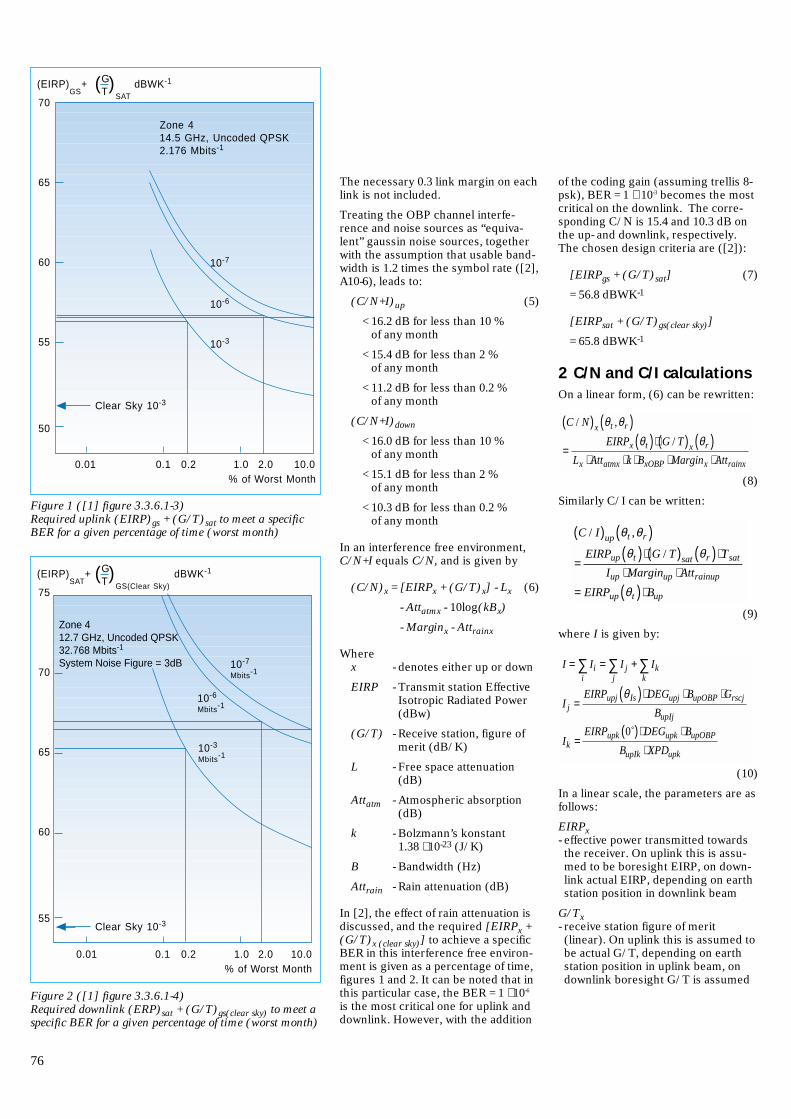
The necessary 0.3 link margin on eachlink is not included.
Treating the OBP channel interfe-rence and noise sources as “equiva-lent” gaussin noise sources, togetherwith the assumption that usable band-width is 1.2 times the symbol rate ([2],A10-6), leads to:
(C/N+I)up (5)
< 16.2 dB for less than 10 % of any month
< 15.4 dB for less than 2 % of any month
< 11.2 dB for less than 0.2 % of any month
(C/N+I)down
< 16.0 dB for less than 10 %of any month
< 15.1 dB for less than 2 % of any month
< 10.3 dB for less than 0.2 % of any month
In an interference free environment,C/N+I equals C/N, and is given by
(C/N)x = [EIRPx + (G/T)x] - Lx (6)
- Attatmx - 10log(kBx)
- Marginx - Attrainx
Wherex - denotes either up or down
EIRP - Transmit station EffectiveIsotropic Radiated Power(dBw)
(G/T) - Receive station, figure ofmerit (dB/K)
L - Free space attenuation(dB)
Attatm - Atmospheric absorption(dB)
k - Bolzmann’s konstant 1.38 ⋅ 10-23 (J/K)
B - Bandwidth (Hz)
Attrain - Rain attenuation (dB)
In [2], the effect of rain attenuation isdiscussed, and the required [EIRPx +(G/T)x (clear sky)] to achieve a specificBER in this interference free environ-ment is given as a percentage of time,figures 1 and 2. It can be noted that inthis particular case, the BER = 1 ⋅ 10-6
is the most critical one for uplink anddownlink. However, with the addition
of the coding gain (assuming trellis 8-psk), BER = 1 ⋅ 10-3 becomes the mostcritical on the downlink. The corre-sponding C/N is 15.4 and 10.3 dB onthe up- and downlink, respectively.The chosen design criteria are ([2]):
[EIRPgs + (G/T)sat] (7)
= 56.8 dBWK-1
[EIRPsat + (G/T)gs(clear sky)]
= 65.8 dBWK-1
2 C/N and C/I calculationsOn a linear form, (6) can be rewritten:
(8)
Similarly C/I can be written:
(9)
where I is given by:
(10)
In a linear scale, the parameters are asfollows:
EIRPx- effective power transmitted towardsthe receiver. On uplink this is assu-med to be boresight EIRP, on down-link actual EIRP, depending on earthstation position in downlink beam
G/Tx- receive station figure of merit(linear). On uplink this is assumed tobe actual G/T, depending on earthstation position in uplink beam, ondownlink boresight G/T is assumed
I = Iii∑ = I j
j∑ + Ik
k∑
I j =EIRPupj θIs( ) ⋅ DEGupj ⋅ BupOBP ⋅Grscj
BupIj
Ik =EIRPupk 0˚( ) ⋅ DEGupk ⋅ BupOBP
BupIk ⋅ XPDupk
C / I( )up θt ,θr( )
=EIRPup θt( ) ⋅ G / T( )sat θr( ) ⋅Tsat
Iup ⋅ Marginup ⋅ Attrainup
= EIRPup θt( ) ⋅ Bup
C / N( )x θt ,θr( )=
EIRPx θt( ) ⋅ G / T( )x θr( )Lx ⋅ Attatmx ⋅k ⋅ BxOBP ⋅ Marginx ⋅ Attrainx
76
Figure 2 ([1] figure 3.3.6.1-4)Required downlink (ERP)sat + (G/T)gs(clear sky) to meet aspecific BER for a given percentage of time (worst month)
75
70
65
60
55
0.01 0.1 1.00.2 2.0% of Worst Month
(EIRP)SAT
+ ( )GT GS(Clear Sky)
dBWK-1
10-3
Mbits-1
Clear Sky 10-3
Zone 412.7 GHz, Uncoded QPSK32.768 Mbits-1
System Noise Figure = 3dB 10-7
Mbits-1
10-6
Mbits-1
10.0
Figure 1 ([1] figure 3.3.6.1-3)Required uplink (EIRP)gs + (G/T)sat to meet a specificBER for a given percentage of time (worst month)
70
65
60
55
50
0.01 0.1 1.00.2 2.0% of Worst Month
(EIRP)GS
+ ( )GT SAT
dBWK-1
10-3
10-7
10-6
Clear Sky 10-3
Zone 414.5 GHz, Uncoded QPSK2.176 Mbits-1
10.0
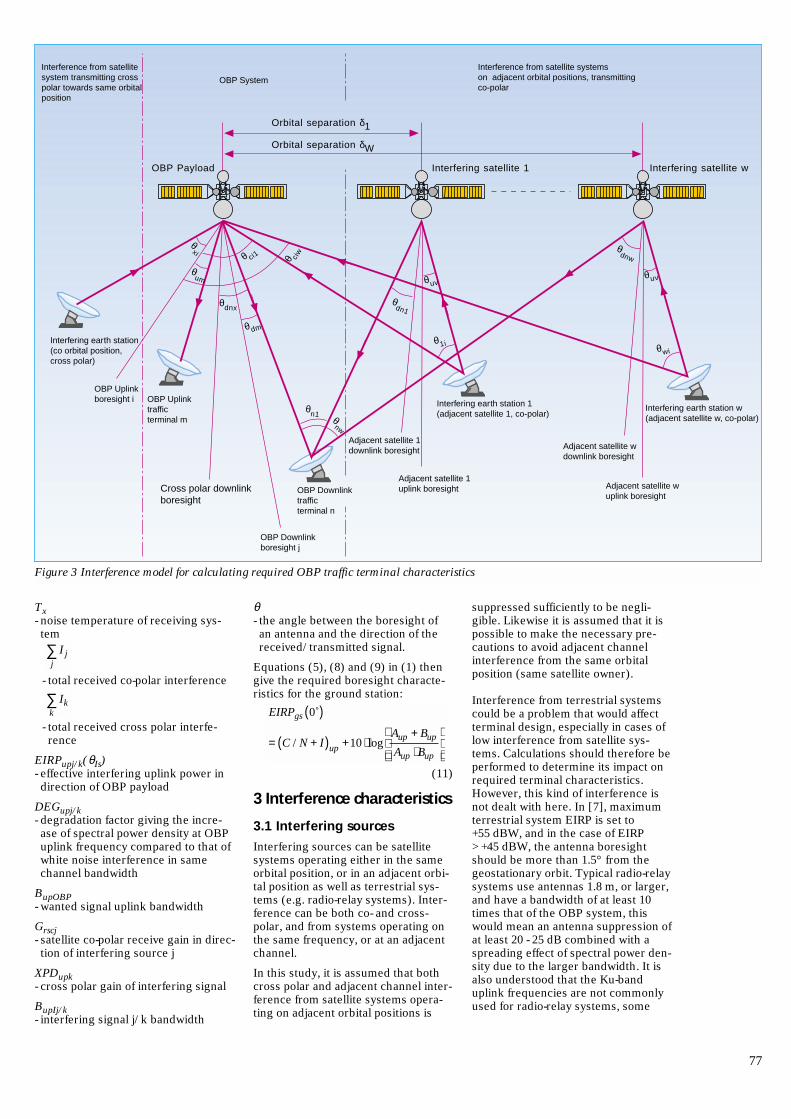
Tx- noise temperature of receiving sys-tem
- total received co-polar interference
- total received cross polar interfe-rence
EIRPupj/k(θIs)- effective interfering uplink power indirection of OBP payload
DEGupj/k- degradation factor giving the incre-ase of spectral power density at OBPuplink frequency compared to that ofwhite noise interference in samechannel bandwidth
BupOBP- wanted signal uplink bandwidth
Grscj- satellite co-polar receive gain in direc-tion of interfering source j
XPDupk- cross polar gain of interfering signal
BupIj/k- interfering signal j/k bandwidth
Ikk∑
I jj
∑
θ- the angle between the boresight ofan antenna and the direction of thereceived/transmitted signal.
Equations (5), (8) and (9) in (1) thengive the required boresight characte-ristics for the ground station:
(11)
3 Interference characteristics
3.1 Interfering sources
Interfering sources can be satellitesystems operating either in the sameorbital position, or in an adjacent orbi-tal position as well as terrestrial sys-tems (e.g. radio-relay systems). Inter-ference can be both co- and cross-polar, and from systems operating onthe same frequency, or at an adjacentchannel.
In this study, it is assumed that bothcross polar and adjacent channel inter-ference from satellite systems opera-ting on adjacent orbital positions is
EIRPgs 0˚( )
= C / N + I( )up +10 ⋅ logAup + Bup
Aup ⋅ Bup
suppressed sufficiently to be negli-gible. Likewise it is assumed that it ispossible to make the necessary pre-cautions to avoid adjacent channelinterference from the same orbitalposition (same satellite owner).
Interference from terrestrial systemscould be a problem that would affectterminal design, especially in cases oflow interference from satellite sys-tems. Calculations should therefore beperformed to determine its impact onrequired terminal characteristics.However, this kind of interference isnot dealt with here. In [7], maximumterrestrial system EIRP is set to+55 dBW, and in the case of EIRP> +45 dBW, the antenna boresightshould be more than 1.5° from thegeostationary orbit. Typical radio-relaysystems use antennas 1.8 m, or larger,and have a bandwidth of at least 10times that of the OBP system, thiswould mean an antenna suppression ofat least 20 - 25 dB combined with aspreading effect of spectral power den-sity due to the larger bandwidth. It isalso understood that the Ku-banduplink frequencies are not commonlyused for radio-relay systems, some
77
OBP Payload Interfering satellite 1 Interfering satellite w
θxi
θum
θdm
θdnx
θ ci1 θ ciw
θdn1
θuv
θ1i
θn1 θnw
θuv
θdnw
θwiInterfering earth station(co orbital position,cross polar)
OBP Uplinkboresight i OBP Uplink
trafficterminal m
Cross polar downlinkboresight
OBP Downlinkboresight j
Adjacent satellite 1uplink boresight
Adjacent satellite 1downlink boresight
Interfering earth station 1(adjacent satellite 1, co-polar)
Adjacent satellite wdownlink boresight
Adjacent satellite wuplink boresight
Interfering earth station w(adjacent satellite w, co-polar)
Interference from satellitesystem transmitting crosspolar towards same orbitalposition
OBP Downlinktrafficterminal n
Orbital separation δ1
Orbital separation δW
OBP System
Interference from satellite systemson adjacent orbital positions, transmittingco-polar
Figure 3 Interference model for calculating required OBP traffic terminal characteristics
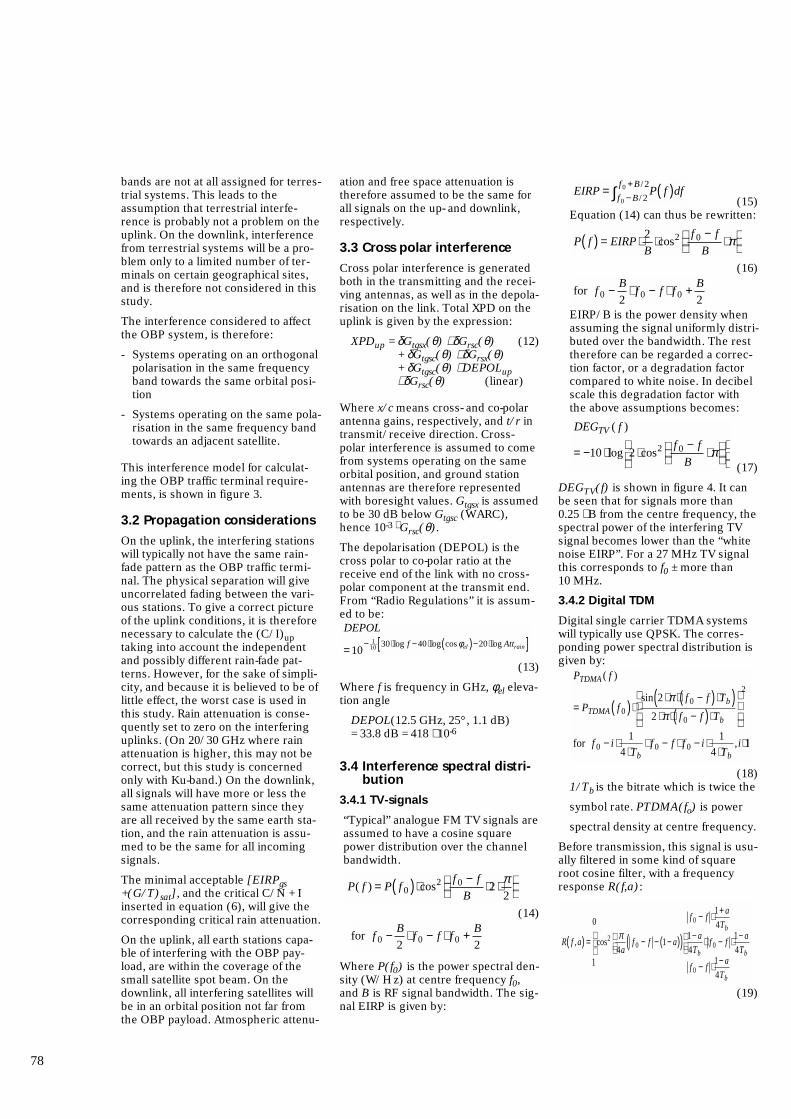
bands are not at all assigned for terres-trial systems. This leads to theassumption that terrestrial interfe-rence is probably not a problem on theuplink. On the downlink, interferencefrom terrestrial systems will be a pro-blem only to a limited number of ter-minals on certain geographical sites,and is therefore not considered in thisstudy.
The interference considered to affectthe OBP system, is therefore:
- Systems operating on an orthogonalpolarisation in the same frequencyband towards the same orbital posi-tion
- Systems operating on the same pola-risation in the same frequency bandtowards an adjacent satellite.
This interference model for calculat-ing the OBP traffic terminal require-ments, is shown in figure 3.
3.2 Propagation considerations
On the uplink, the interfering stationswill typically not have the same rain-fade pattern as the OBP traffic termi-nal. The physical separation will giveuncorrelated fading between the vari-ous stations. To give a correct pictureof the uplink conditions, it is thereforenecessary to calculate the (C/I)uptaking into account the independentand possibly different rain-fade pat-terns. However, for the sake of simpli-city, and because it is believed to be oflittle effect, the worst case is used inthis study. Rain attenuation is conse-quently set to zero on the interferinguplinks. (On 20/30 GHz where rainattenuation is higher, this may not becorrect, but this study is concernedonly with Ku-band.) On the downlink,all signals will have more or less thesame attenuation pattern since theyare all received by the same earth sta-tion, and the rain attenuation is assu-med to be the same for all incomingsignals.
The minimal acceptable [EIRPgs+(G/T)sat], and the critical C/N + Iinserted in equation (6), will give thecorresponding critical rain attenuation.
On the uplink, all earth stations capa-ble of interfering with the OBP pay-load, are within the coverage of thesmall satellite spot beam. On thedownlink, all interfering satellites willbe in an orbital position not far fromthe OBP payload. Atmospheric attenu-
ation and free space attenuation istherefore assumed to be the same forall signals on the up- and downlink,respectively.
3.3 Cross polar interference
Cross polar interference is generatedboth in the transmitting and the recei-ving antennas, as well as in the depola-risation on the link. Total XPD on theuplink is given by the expression:
XPDup = δGtgsx(θ) ⋅ δGrsc(θ) (12)+ δGtgsc(θ) ⋅ δGrsx(θ)+ δGtgsc(θ) ⋅ DEPOLup⋅ δGrsc(θ) (linear)
Where x/c means cross- and co-polarantenna gains, respectively, and t/r intransmit/receive direction. Cross-polar interference is assumed to comefrom systems operating on the sameorbital position, and ground stationantennas are therefore representedwith boresight values. Gtgsx is assumedto be 30 dB below Gtgsc (WARC),hence 10-3 ⋅ Grsc(θ).
The depolarisation (DEPOL) is thecross polar to co-polar ratio at thereceive end of the link with no cross-polar component at the transmit end.From “Radio Regulations” it is assum-ed to be:
(13)
Where f is frequency in GHz, φel eleva-tion angle
DEPOL(12.5 GHz, 25°, 1.1 dB) = 33.8 dB = 418 ⋅ 10-6
3.4 Interference spectral distri-bution
3.4.1 TV-signals
“Typical” analogue FM TV signals areassumed to have a cosine squarepower distribution over the channelbandwidth.
(14)
Where P(f0) is the power spectral den-sity (W/H z) at centre frequency f0,and B is RF signal bandwidth. The sig-nal EIRP is given by:
for f 0 − B
2⟨ f 0 − f ⟨ f 0 + B
2
P( f ) = P f 0( ) ⋅cos2 f 0 − f
B⋅2 ⋅ π
2
DEPOL
=10− 1
10 30⋅log f −40⋅log cos φel( )−20⋅log Attrain[ ]
78
(15)Equation (14) can thus be rewritten:
(16)
EIRP/B is the power density whenassuming the signal uniformly distri-buted over the bandwidth. The resttherefore can be regarded a correc-tion factor, or a degradation factorcompared to white noise. In decibelscale this degradation factor withthe above assumptions becomes:
(17)
DEGTV(f) is shown in figure 4. It canbe seen that for signals more than0.25 ⋅ B from the centre frequency, thespectral power of the interfering TVsignal becomes lower than the “whitenoise EIRP”. For a 27 MHz TV signalthis corresponds to f0 ± more than10 MHz.
3.4.2 Digital TDM
Digital single carrier TDMA systemswill typically use QPSK. The corres-ponding power spectral distribution isgiven by:
(18)1/Tb is the bitrate which is twice the
symbol rate. PTDMA(fo) is power
spectral density at centre frequency.
Before transmission, this signal is usu-ally filtered in some kind of squareroot cosine filter, with a frequencyresponse R(f,a):
(19)
R f ,a( ) =
0
cos2 π4a
f 0 − f − 1− a( )( )
1
f 0 − f ⟩ 1+ a
4Tb1− a
4Tb⟨ f 0 − f ⟨ 1− a
4Tb
f 0 − f ⟨ 1− a
4Tb
PTDMA ( f )
= PTDMA f 0( ) ⋅sin 2 ⋅π⋅ f 0 − f( ) ⋅Tb( )
2 ⋅π⋅ f 0 − f( ) ⋅Tb
2
for f 0 − i ⋅ 1
4 ⋅Tb⟨ f 0 − f ⟨ f 0 − i ⋅ 1
4 ⋅Tb,i⟩1
DEGTV ( f )
= −10 ⋅ log 2 ⋅cos2 f 0 − f
B⋅π
for f 0 − B
2⟨ f 0 − f ⟨ f 0 + B
2
P f( ) = EIRP ⋅ 2
B⋅cos2 f 0 − f
B⋅π
EIRP = P f( )dff0 −B / 2
f0 +B / 2∫
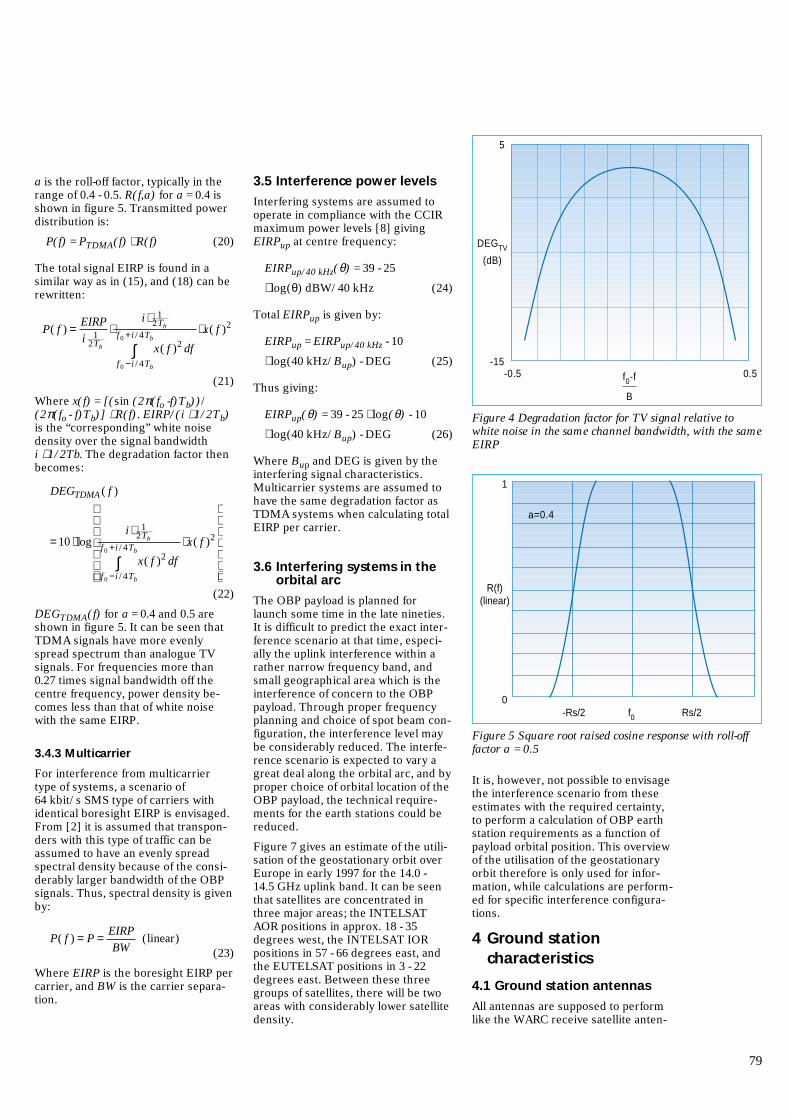
a is the roll-off factor, typically in therange of 0.4 - 0.5. R(f,a) for a = 0.4 isshown in figure 5. Transmitted powerdistribution is:
P(f) = PTDMA(f) ⋅ R(f) (20)
The total signal EIRP is found in asimilar way as in (15), and (18) can berewritten:
(21)
Where x(f) = [(sin (2π(fo -f)Tb))/(2π(fo - f)Tb)] ⋅ R(f). EIRP/(i ⋅ 1/2Tb)is the “corresponding” white noisedensity over the signal bandwidthi ⋅ 1/2Tb. The degradation factor thenbecomes:
(22)
DEGTDMA(f) for a = 0.4 and 0.5 areshown in figure 5. It can be seen thatTDMA signals have more evenlyspread spectrum than analogue TVsignals. For frequencies more than0.27 times signal bandwidth off thecentre frequency, power density be-comes less than that of white noisewith the same EIRP.
3.4.3 Multicarrier
For interference from multicarriertype of systems, a scenario of64 kbit/s SMS type of carriers withidentical boresight EIRP is envisaged.From [2] it is assumed that transpon-ders with this type of traffic can beassumed to have an evenly spreadspectral density because of the consi-derably larger bandwidth of the OBPsignals. Thus, spectral density is givenby:
(23)
Where EIRP is the boresight EIRP percarrier, and BW is the carrier separa-tion.
P( f ) = P = EIRP
BW(linear)
DEGTDMA ( f )
=10 ⋅ logi ⋅ 1
2Tb
f0 −i / 4Tb
f0 +i / 4Tb
∫ x( f )2 df
⋅ x( f )2
P( f ) = EIRP
i 12Tb
⋅i ⋅ 1
2Tb
f0 −i / 4Tb
f0 +i / 4Tb
∫ x( f )2 df
⋅ x( f )2
3.5 Interference power levels
Interfering systems are assumed tooperate in compliance with the CCIRmaximum power levels [8] givingEIRPup at centre frequency:
EIRPup/40 kHz(θ) = 39 - 25
⋅ log(θ) dBW/40 kHz (24)
Total EIRPup is given by:
EIRPup = EIRPup/40 kHz - 10
⋅ log(40 kHz/Bup) - DEG (25)
Thus giving:
EIRPup(θ) = 39 - 25 ⋅ log(θ) - 10
⋅ log(40 kHz/Bup) - DEG (26)
Where Bup and DEG is given by theinterfering signal characteristics.Multicarrier systems are assumed tohave the same degradation factor asTDMA systems when calculating totalEIRP per carrier.
3.6 Interfering systems in theorbital arc
The OBP payload is planned forlaunch some time in the late nineties.It is difficult to predict the exact inter-ference scenario at that time, especi-ally the uplink interference within arather narrow frequency band, andsmall geographical area which is theinterference of concern to the OBPpayload. Through proper frequencyplanning and choice of spot beam con-figuration, the interference level maybe considerably reduced. The interfe-rence scenario is expected to vary agreat deal along the orbital arc, and byproper choice of orbital location of theOBP payload, the technical require-ments for the earth stations could bereduced.
Figure 7 gives an estimate of the utili-sation of the geostationary orbit overEurope in early 1997 for the 14.0 -14.5 GHz uplink band. It can be seenthat satellites are concentrated inthree major areas; the INTELSATAOR positions in approx. 18 - 35degrees west, the INTELSAT IORpositions in 57 - 66 degrees east, andthe EUTELSAT positions in 3 - 22degrees east. Between these threegroups of satellites, there will be twoareas with considerably lower satellitedensity.
It is, however, not possible to envisagethe interference scenario from theseestimates with the required certainty,to perform a calculation of OBP earthstation requirements as a function ofpayload orbital position. This overviewof the utilisation of the geostationaryorbit therefore is only used for infor-mation, while calculations are perform-ed for specific interference configura-tions.
4 Ground stationcharacteristics
4.1 Ground station antennas
All antennas are supposed to performlike the WARC receive satellite anten-
79
-0.5 f0-f
B
0.5-15
5
DEGTV
(dB)
Figure 4 Degradation factor for TV signal relative towhite noise in the same channel bandwidth, with the sameEIRP
1
0
R(f)(linear)
-Rs/2 Rs/2f0
a=0.4
Figure 5 Square root raised cosine response with roll-offfactor a = 0.5
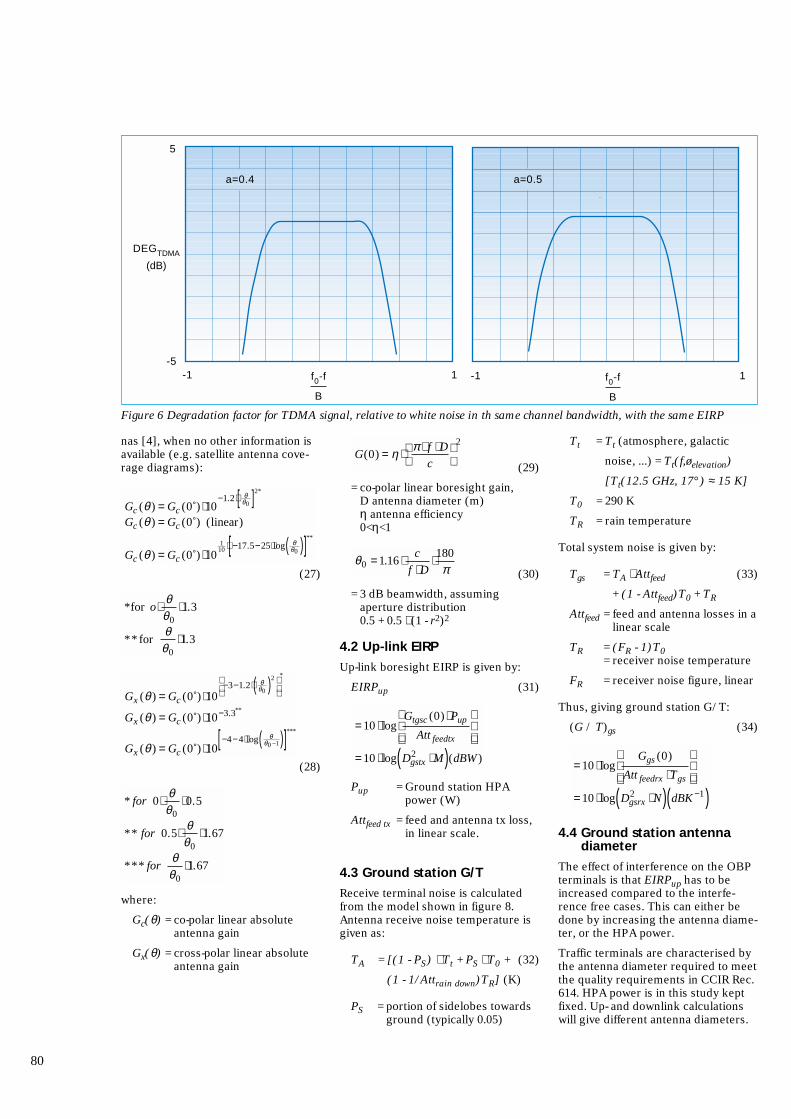
nas [4], when no other information isavailable (e.g. satellite antenna cove-rage diagrams):
(27)
(28)
where:
Gc(θ) = co-polar linear absoluteantenna gain
Gx(θ) = cross-polar linear absoluteantenna gain
* for 0⟨ θθ0
⟨ 0.5
** for 0.5⟨ θθ0
⟨1.67
*** forθθ0
⟩1.67
Gx (θ ) = Gc (0˚) ⋅10−3−1.2⋅ θ
θ0( )2
*
Gx (θ ) = Gc (0˚) ⋅10−3.3**
Gx (θ ) = Gc (0˚) ⋅10−4−4⋅log θ
θ0 −1( )[ ]***
*for o⟨ θθ0
⟨1.3
** forθθ0
⟩1.3
Gc (θ ) = Gc (0˚) ⋅10−1.2⋅ θ
θ0[ ]2*
Gc (θ ) = Gc (0˚) (linear)
Gc (θ ) = Gc (0˚) ⋅101
10 ⋅ −17.5−25⋅log θθ0( )[ ]**
(29)
= co-polar linear boresight gain,D antenna diameter (m)η antenna efficiency0<η<1
(30)
= 3 dB beamwidth, assumingaperture distribution0.5 + 0.5 ⋅ (1 - r2)2
4.2 Up-link EIRP
Up-link boresight EIRP is given by:
EIRPup (31)
Pup = Ground station HPApower (W)
Attfeed tx = feed and antenna tx loss,in linear scale.
4.3 Ground station G/T
Receive terminal noise is calculatedfrom the model shown in figure 8.Antenna receive noise temperature isgiven as:
TA = [(1 - PS) ⋅ Tt + PS ⋅ T0 + (32)
(1 - 1/Attrain down)TR] (K)
PS = portion of sidelobes towardsground (typically 0.05)
=10 ⋅ logGtgsc (0) ⋅ Pup
Att feedtx
=10 ⋅ log Dgstx2 ⋅ M( )(dBW )
θ0 =1.16 ⋅ c
f ⋅ D⋅ 180
π
G(0) = η ⋅ π⋅ f ⋅ D
c
2 Tt = Tt (atmosphere, galactic
noise, ...) = Tt(f,øelevation)
[Tt(12.5 GHz, 17°) ≈ 15 K]
T0 = 290 K
TR = rain temperature
Total system noise is given by:
Tgs = TA ⋅ Attfeed (33)
+ (1 - Attfeed)T0 + TR
Attfeed = feed and antenna losses in alinear scale
TR = (FR - 1)T0= receiver noise temperature
FR = receiver noise figure, linear
Thus, giving ground station G/T:
(G / T)gs (34)
4.4 Ground station antennadiameter
The effect of interference on the OBPterminals is that EIRPup has to beincreased compared to the interfe-rence free cases. This can either bedone by increasing the antenna diame-ter, or the HPA power.
Traffic terminals are characterised bythe antenna diameter required to meetthe quality requirements in CCIR Rec.614. HPA power is in this study keptfixed. Up- and downlink calculationswill give different antenna diameters.
=10 ⋅ logGgs (0)
Att feedrx ⋅Tgs
=10 ⋅ log Dgsrx2 ⋅ N( ) dBK −1( )
80
f0-f
B
-1 1
DEGTDMA
(dB)
-5
5
a=0.4
5
-1 f0-f
B
1
a=0.5
Figure 6 Degradation factor for TDMA signal, relative to white noise in th same channel bandwidth, with the same EIRP
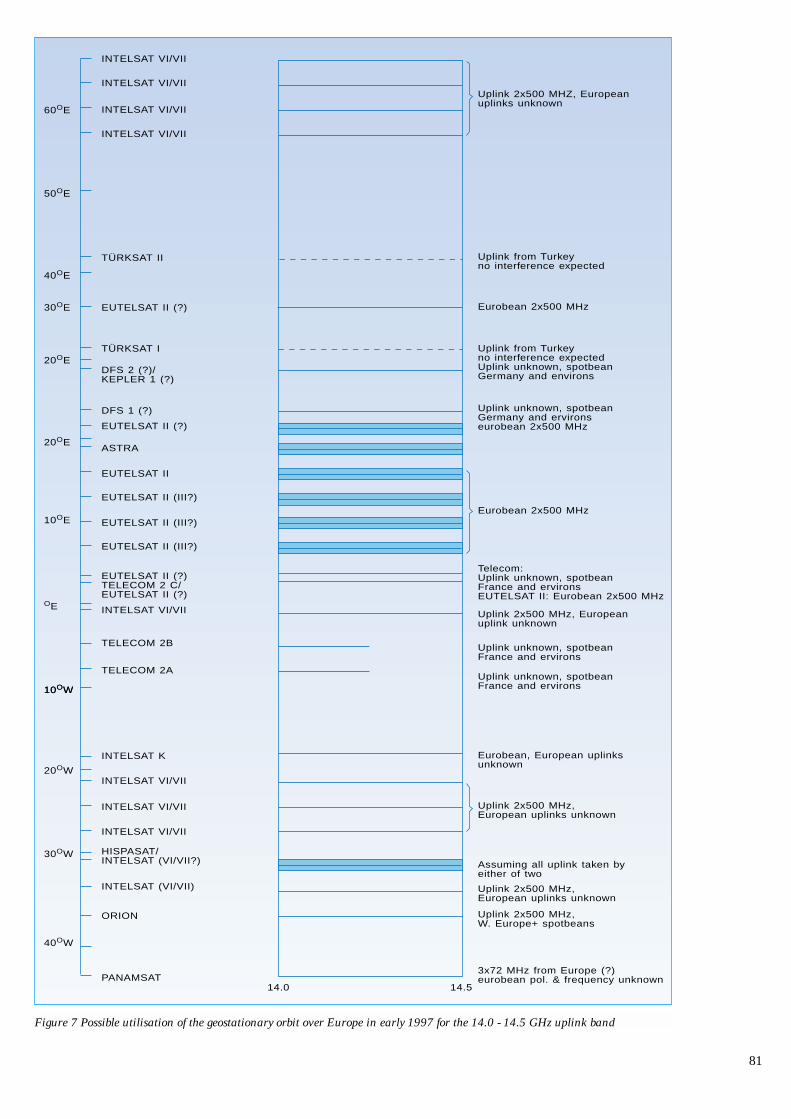
81
50OE
40OE
30OE
20OE
20OE
10OE
OE
10OW10OW
20OW
30OW
40OW
60OE
INTELSAT VI/VII
INTELSAT VI/VII
INTELSAT VI/VII
INTELSAT VI/VII
TÜRKSAT II
EUTELSAT II (?)
TÜRKSAT I
DFS 2 (?)/KEPLER 1 (?)
DFS 1 (?)
EUTELSAT II (?)
ASTRA
EUTELSAT II
EUTELSAT II (III?)
EUTELSAT II (III?)
EUTELSAT II (III?)
EUTELSAT II (?)TELECOM 2 C/EUTELSAT II (?)
INTELSAT VI/VII
TELECOM 2B
TELECOM 2A
INTELSAT VI/VII
INTELSAT K
INTELSAT VI/VII
INTELSAT VI/VII
HISPASAT/INTELSAT (VI/VII?)
INTELSAT (VI/VII)
ORION
PANAMSAT14.0 14.5
Uplink 2x500 MHZ, Europeanuplinks unknown
Uplink from Turkeyno interference expected
Eurobean 2x500 MHz
Uplink from Turkeyno interference expectedUplink unknown, spotbeanGermany and environs
Uplink unknown, spotbeanGermany and ervironseurobean 2x500 MHz
Eurobean 2x500 MHz
Telecom:Uplink unknown, spotbeanFrance and ervironsEUTELSAT II: Eurobean 2x500 MHz
Uplink 2x500 MHz, Europeanuplink unknown
Uplink unknown, spotbeanFrance and ervirons
Uplink unknown, spotbeanFrance and ervirons
Eurobean, European uplinks unknown
Uplink 2x500 MHz,European uplinks unknown
Assuming all uplink taken byeither of two
Uplink 2x500 MHz,European uplinks unknown
Uplink 2x500 MHz,W. Europe+ spotbeans
3x72 MHz from Europe (?)eurobean pol. & frequency unknown
Figure 7 Possible utilisation of the geostationary orbit over Europe in early 1997 for the 14.0 - 14.5 GHz uplink band
The largest one will give the minimalacceptable diameter.
Equation (31) can be rewritten to givethe required uplink antenna diameter:
(35)Where required EIRPup is given byequation (11).
Similarly, the downlink antenna dia-meter can be found from equation (34)to be:
(36)Where required (G/T)gs is given bythe clear sky interference free condi-tions in (7).
To characterise the OBP traffic termi-nal requirements, minimum antennadiameter should be determined for allthe interference cases found appli-cable. Space segment characteristics,and all other ground station characte-ristics, should be kept the samethroughout the study.
5 Assumptions for calcu-lating OBP terminalcharacteristics
Assumptions are mainly those given in [2].
5.1 OBP signal and propagationcharacteristics
fup = 14.5 GHz
fdown = 12.5 GHz
n = 1.2 n = bandwidth/-symbol rate
BupOBP = 1.2 MHz 2 Mbit/s QPSK
Dgsrx = 1
M⋅10
110 G / T( )gs
12
Dgstx = 1
M⋅10
110 EIRPup
12
m( )
C/(N+I)up = 15.4 dB
Attrainup = 1.1 dB Rain attenua-tion correspon-ding to criticalC/(N+I)
Margin = 0.3 dB
Lup = 207.1 dB
Ldown = 206.0 dB
Attatmup = 0.3 dB
Attatmdown = 0.2 dB
5.2 OBP payload assumptions
G/T = 9 dBK-1 Edge of coverageG/T
EIRP = 44.7 dBW Down-link bore-sight EIRP per car-rier
Grsc eoc = 36 dB Edge of coveragereceive gain
Attfeedrx = 1.5 dB Receive feed loss
Ts = (Grsc eoc)/(Attfeedrx G/T)(linear)
= 355 K Satellite noise tempe-rature
5.3 OBP terminal assumptions
n = 0.65 Antenna efficiency
Pup = 12 W HPA power
Attfeedtx = 1 dB
Attfeedrx = 1 dB
5.4 Interference characteristics
δGrsc = 0 dB Interfering sources inboresight
δGrsx = 0 dB
XPD = 26.2 dB
Bup TV = 27 MHz TV signal bandwidth
Bup TDMA = 72 MHz 120 Mbit/sQPSK, n = 1.2
Bup multi = 64 kHz Channel separa-tion SCPC system
f0 adj = f0 OBP Adjacent satelliteinterference atcentre frequency
f0 XPD TV= fO OBP + 18 MHz Cross polar TV
interference cen-tre frequency,(Assuming stag-gered transpon-ders/36 MHztransp.)
f0 XPD TDMA= f0 OBP + 36 MHz Cross polar
TDMA interfe-rence centre fre-quency, (72 MHztransp.)
DEGTV = 3 dB Degradation fac-tor relative towhite noise withsame EIRP insame channelbandwidth. (seechap. 3.4)
DEGTDMA = 1.5 dB
Grsc b = 42 dB Satellite boresightreceive gain,interfering sour-ces in boresight.
This means that off axis EIRP is deter-mined by:
EIRPup (θ) (37)
= 64.3 - 25 ⋅ log(θ) (dBW)for TV
= 70.1 - 25 ⋅ log(θ) (dBW)for TDMA
= 39.5 - 25 ⋅ log(θ) (dBW) per carrier for multicarrier
= 54.5 - 25 ⋅ log(θ) (dBW) total within OBP uplink (100 % fill)
Multicarrier systems may typically usesmall earth stations with a limitednumber of carriers per station. In [2] atypical SMS carrier is seen to have aboresight EIRP of 52 dBW per64 kbit/s carrier. If it is assumed thatan 1.8 metre antenna with a radiationdiagram, as shown in figure 9, is usedfor these transmissions, the off axisEIRP will be:
EIRPup(θ) (38)
= 29 - 25 ⋅ log(θ) (dBW) percarrier for multicarrier
= 44 - 25 ⋅ log(θ) (dBW) totalwithin OBP uplink (100 % fill)
This latter estimate of multicarrierearth station off axis EIRP appears tobe more realistic, calculations shouldalso be performed with these values,giving approximately 10 dB lowerinterference levels than maximum per-missible level from CCIR.
Since it is shown that CCIR limits maygive unrealistic high off axis EIRPs formulticarrier, this may also be the casefor TV and TDMA. Calculations for
82
T r, Att rain
Feed lossReceiver
FR
Figure 8 Model for calculating ground station noise tem-perature
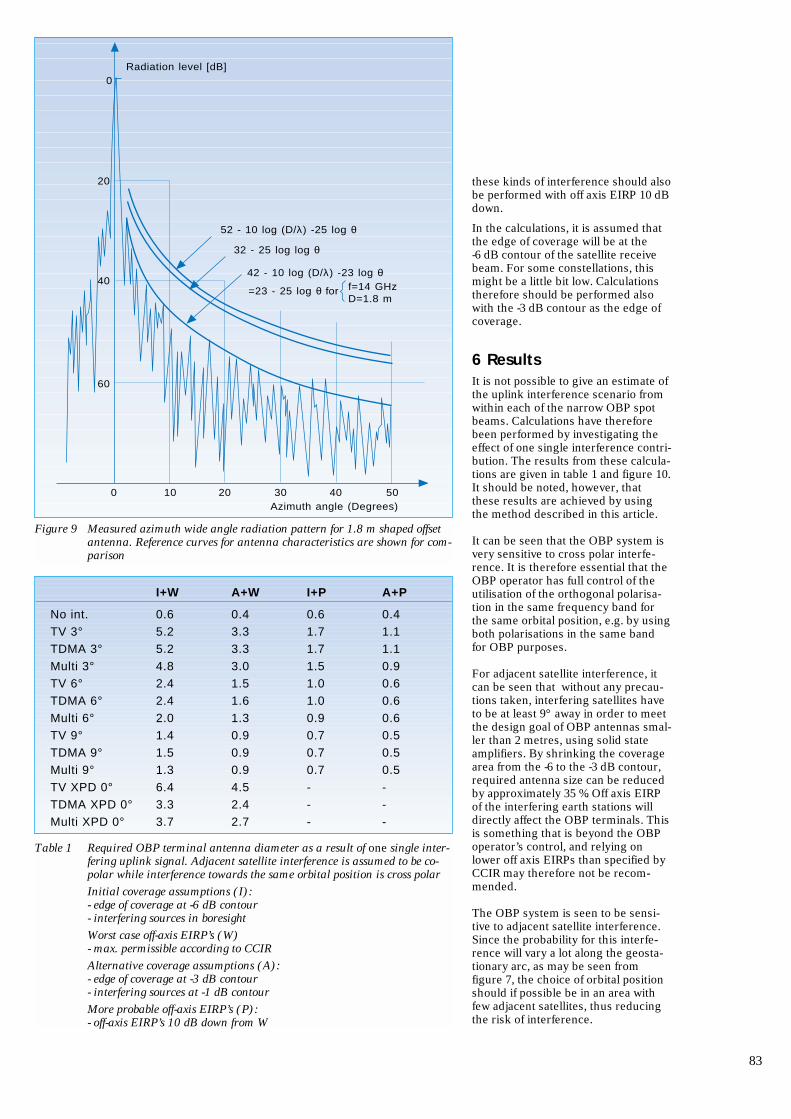
these kinds of interference should alsobe performed with off axis EIRP 10 dBdown.
In the calculations, it is assumed thatthe edge of coverage will be at the-6 dB contour of the satellite receivebeam. For some constellations, thismight be a little bit low. Calculationstherefore should be performed alsowith the -3 dB contour as the edge ofcoverage.
6 ResultsIt is not possible to give an estimate ofthe uplink interference scenario fromwithin each of the narrow OBP spotbeams. Calculations have thereforebeen performed by investigating theeffect of one single interference contri-bution. The results from these calcula-tions are given in table 1 and figure 10.It should be noted, however, thatthese results are achieved by usingthe method described in this article.
It can be seen that the OBP system isvery sensitive to cross polar interfe-rence. It is therefore essential that theOBP operator has full control of theutilisation of the orthogonal polarisa-tion in the same frequency band forthe same orbital position, e.g. by usingboth polarisations in the same bandfor OBP purposes.
For adjacent satellite interference, itcan be seen that without any precau-tions taken, interfering satellites haveto be at least 9° away in order to meetthe design goal of OBP antennas smal-ler than 2 metres, using solid stateamplifiers. By shrinking the coveragearea from the -6 to the -3 dB contour,required antenna size can be reducedby approximately 35 %. Off axis EIRPof the interfering earth stations willdirectly affect the OBP terminals. Thisis something that is beyond the OBPoperator’s control, and relying onlower off axis EIRPs than specified byCCIR may therefore not be recom-mended.
The OBP system is seen to be sensi-tive to adjacent satellite interference.Since the probability for this interfe-rence will vary a lot along the geosta-tionary arc, as may be seen fromfigure 7, the choice of orbital positionshould if possible be in an area withfew adjacent satellites, thus reducingthe risk of interference.
83
0 10 20 30 40 50Azimuth angle (Degrees)
0
20
40
60
Radiation level [dB]
52 - 10 log (D/λ) -25 log θ
32 - 25 log log θ
42 - 10 log (D/λ) -23 log θf=14 GHzD=1.8 m
=23 - 25 log θ for
Figure 9 Measured azimuth wide angle radiation pattern for 1.8 m shaped offsetantenna. Reference curves for antenna characteristics are shown for com-parison
I+W A+W I+P A+P
No int. 0.6 0.4 0.6 0.4TV 3° 5.2 3.3 1.7 1.1TDMA 3° 5.2 3.3 1.7 1.1Multi 3° 4.8 3.0 1.5 0.9TV 6° 2.4 1.5 1.0 0.6TDMA 6° 2.4 1.6 1.0 0.6Multi 6° 2.0 1.3 0.9 0.6TV 9° 1.4 0.9 0.7 0.5TDMA 9° 1.5 0.9 0.7 0.5Multi 9° 1.3 0.9 0.7 0.5TV XPD 0° 6.4 4.5 - -TDMA XPD 0° 3.3 2.4 - -Multi XPD 0° 3.7 2.7 - -
Table 1 Required OBP terminal antenna diameter as a result of one single inter-fering uplink signal. Adjacent satellite interference is assumed to be co-polar while interference towards the same orbital position is cross polarInitial coverage assumptions (I):- edge of coverage at -6 dB contour- interfering sources in boresightWorst case off-axis EIRP’s (W)- max. permissible according to CCIRAlternative coverage assumptions (A):- edge of coverage at -3 dB contour- interfering sources at -1 dB contourMore probable off-axis EIRP’s (P):- off-axis EIRP’s 10 dB down from W
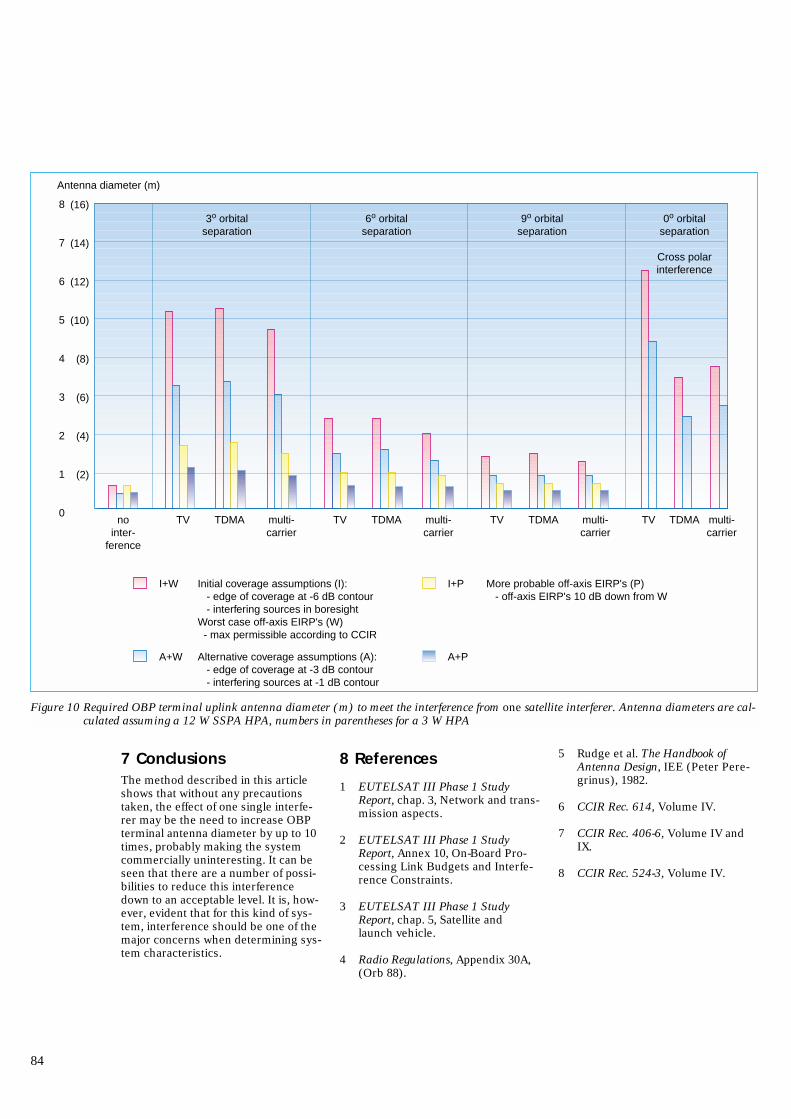
7 ConclusionsThe method described in this articleshows that without any precautionstaken, the effect of one single interfe-rer may be the need to increase OBPterminal antenna diameter by up to 10times, probably making the systemcommercially uninteresting. It can beseen that there are a number of possi-bilities to reduce this interferencedown to an acceptable level. It is, how-ever, evident that for this kind of sys-tem, interference should be one of themajor concerns when determining sys-tem characteristics.
8 References
1 EUTELSAT III Phase 1 StudyReport, chap. 3, Network and trans-mission aspects.
2 EUTELSAT III Phase 1 StudyReport, Annex 10, On-Board Pro-cessing Link Budgets and Interfe-rence Constraints.
3 EUTELSAT III Phase 1 StudyReport, chap. 5, Satellite andlaunch vehicle.
4 Radio Regulations, Appendix 30A,(Orb 88).
5 Rudge et al. The Handbook ofAntenna Design, IEE (Peter Pere-grinus), 1982.
6 CCIR Rec. 614, Volume IV.
7 CCIR Rec. 406-6, Volume IV andIX.
8 CCIR Rec. 524-3, Volume IV.
84
nointer-
ference
TV TDMA multi-carrier
TV TDMA multi-carrier
TV TDMA multi-carrier
TV TDMA multi-carrier
8
7
6
5
4
3
2
1
0
(16)
(14)
(12)
(10)
(8)
(6)
(4)
(2)
Antenna diameter (m)
I+W Initial coverage assumptions (I): - edge of coverage at -6 dB contour - interfering sources in boresightWorst case off-axis EIRP's (W) - max permissible according to CCIR
A+W Alternative coverage assumptions (A): - edge of coverage at -3 dB contour - interfering sources at -1 dB contour
I+P More probable off-axis EIRP's (P) - off-axis EIRP's 10 dB down from W
A+P
3o orbitalseparation
6o orbitalseparation
9o orbitalseparation
0o orbitalseparation
Cross polarinterference
Figure 10 Required OBP terminal uplink antenna diameter (m) to meet the interference from one satellite interferer. Antenna diameters are cal-culated assuming a 12 W SSPA HPA, numbers in parentheses for a 3 W HPA
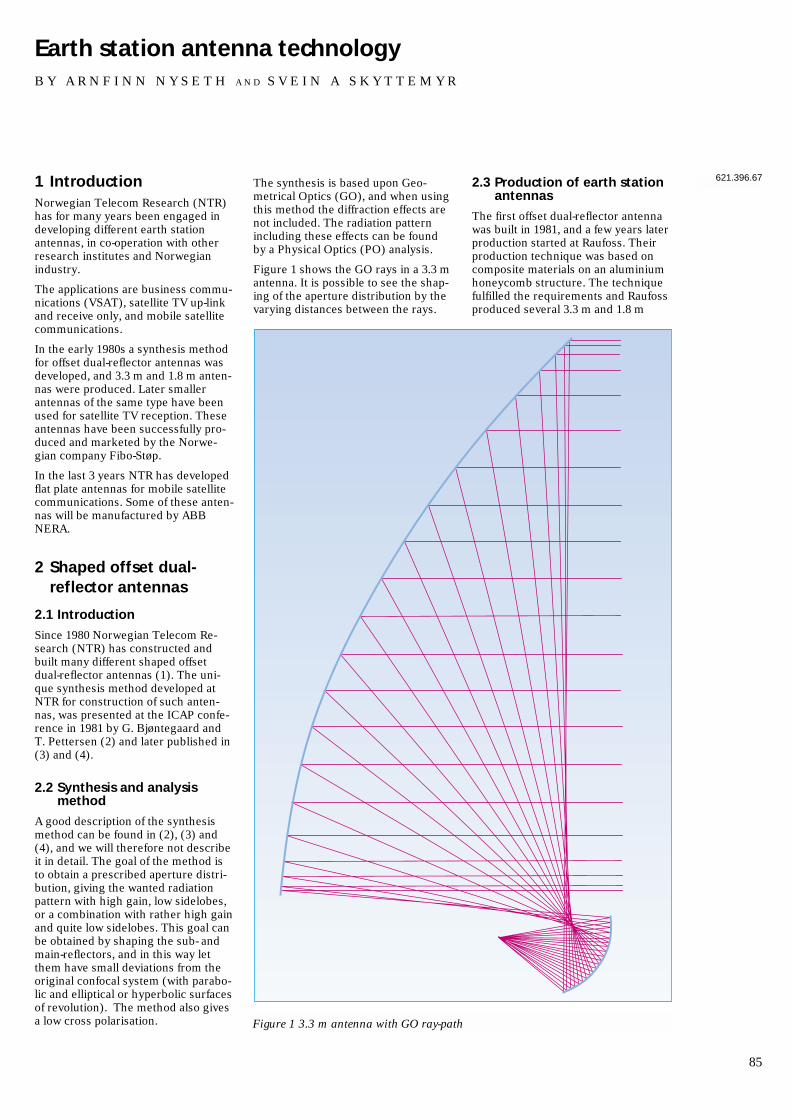
1 IntroductionNorwegian Telecom Research (NTR)has for many years been engaged indeveloping different earth stationantennas, in co-operation with otherresearch institutes and Norwegianindustry.
The applications are business commu-nications (VSAT), satellite TV up-linkand receive only, and mobile satellitecommunications.
In the early 1980s a synthesis methodfor offset dual-reflector antennas wasdeveloped, and 3.3 m and 1.8 m anten-nas were produced. Later smallerantennas of the same type have beenused for satellite TV reception. Theseantennas have been successfully pro-duced and marketed by the Norwe-gian company Fibo-Støp.
In the last 3 years NTR has developedflat plate antennas for mobile satellitecommunications. Some of these anten-nas will be manufactured by ABBNERA.
2 Shaped offset dual-reflector antennas
2.1 Introduction
Since 1980 Norwegian Telecom Re-search (NTR) has constructed andbuilt many different shaped offsetdual-reflector antennas (1). The uni-que synthesis method developed atNTR for construction of such anten-nas, was presented at the ICAP confe-rence in 1981 by G. Bjøntegaard andT. Pettersen (2) and later published in(3) and (4).
2.2 Synthesis and analysismethod
A good description of the synthesismethod can be found in (2), (3) and(4), and we will therefore not describeit in detail. The goal of the method isto obtain a prescribed aperture distri-bution, giving the wanted radiationpattern with high gain, low sidelobes,or a combination with rather high gainand quite low sidelobes. This goal canbe obtained by shaping the sub- andmain-reflectors, and in this way letthem have small deviations from theoriginal confocal system (with parabo-lic and elliptical or hyperbolic surfacesof revolution). The method also givesa low cross polarisation.
The synthesis is based upon Geo-metrical Optics (GO), and when usingthis method the diffraction effects arenot included. The radiation patternincluding these effects can be foundby a Physical Optics (PO) analysis.
Figure 1 shows the GO rays in a 3.3 mantenna. It is possible to see the shap-ing of the aperture distribution by thevarying distances between the rays.
2.3 Production of earth stationantennas
The first offset dual-reflector antennawas built in 1981, and a few years laterproduction started at Raufoss. Theirproduction technique was based oncomposite materials on an aluminiumhoneycomb structure. The techniquefulfilled the requirements and Raufossproduced several 3.3 m and 1.8 m
85
Earth station antenna technologyB Y A R N F I N N N Y S E T H A N D S V E I N A S K Y T T E M Y R
621.396.67
Figure 1 3.3 m antenna with GO ray-path
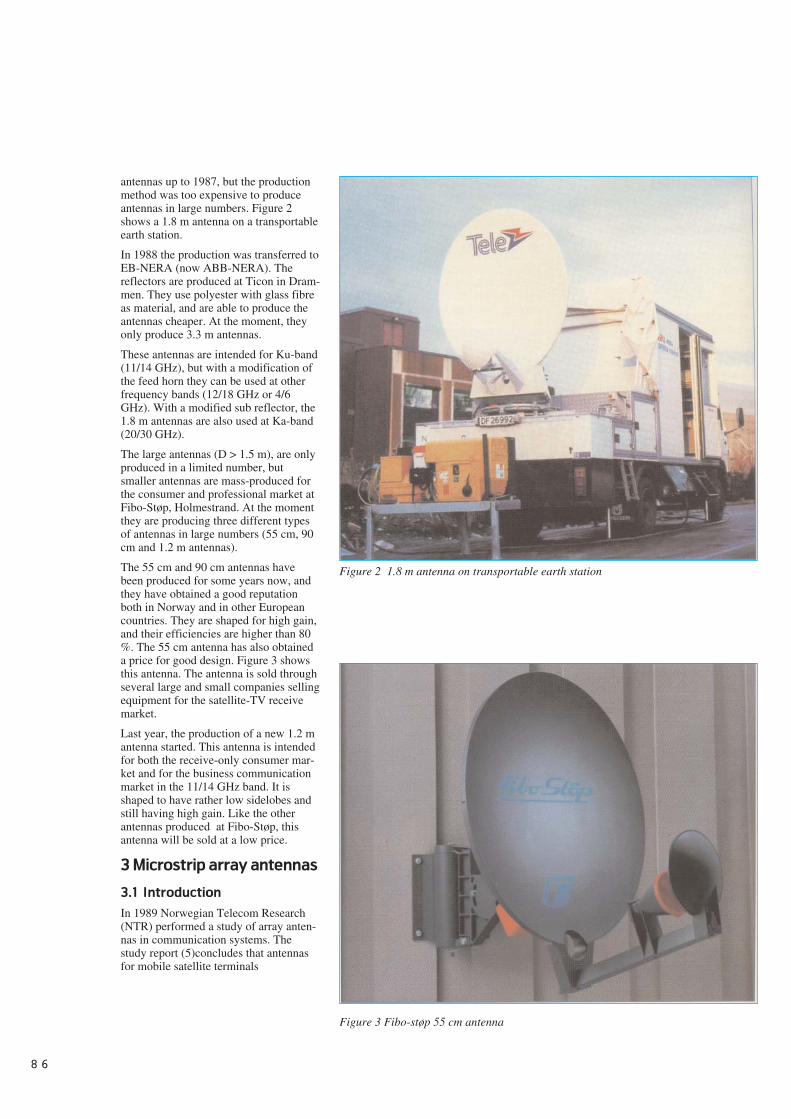
antennas up to 1987, but the productionmethod was too expensive to produceantennas in large numbers. Figure 2shows a 1.8 m antenna on a transportableearth station.
In 1988 the production was transferred toEB-NERA (now ABB-NERA). Thereflectors are produced at Ticon in Dram-men. They use polyester with glass fibreas material, and are able to produce theantennas cheaper. At the moment, theyonly produce 3.3 m antennas.
These antennas are intended for Ku-band(11/14 GHz), but with a modification ofthe feed horn they can be used at otherfrequency bands (12/18 GHz or 4/6GHz). With a modified sub reflector, the1.8 m antennas are also used at Ka-band(20/30 GHz).
The large antennas (D > 1.5 m), are onlyproduced in a limited number, butsmaller antennas are mass-produced forthe consumer and professional market atFibo-Støp, Holmestrand. At the momentthey are producing three different typesof antennas in large numbers (55 cm, 90cm and 1.2 m antennas).
The 55 cm and 90 cm antennas havebeen produced for some years now, andthey have obtained a good reputationboth in Norway and in other Europeancountries. They are shaped for high gain,and their efficiencies are higher than 80%. The 55 cm antenna has also obtaineda price for good design. Figure 3 showsthis antenna. The antenna is sold throughseveral large and small companies sellingequipment for the satellite-TV receivemarket.
Last year, the production of a new 1.2 mantenna started. This antenna is intendedfor both the receive-only consumer mar-ket and for the business communicationmarket in the 11/14 GHz band. It isshaped to have rather low sidelobes andstill having high gain. Like the otherantennas produced at Fibo-Støp, thisantenna will be sold at a low price.
3 Microstrip array antennas
3.1 Introduction
In 1989 Norwegian Telecom Research(NTR) performed a study of array anten-nas in communication systems. Thestudy report (5)concludes that antennasfor mobile satellite terminals
8 6
Figure 2 1.8 m antenna on transportable earth station
Figure 3 Fibo-støp 55 cm antenna
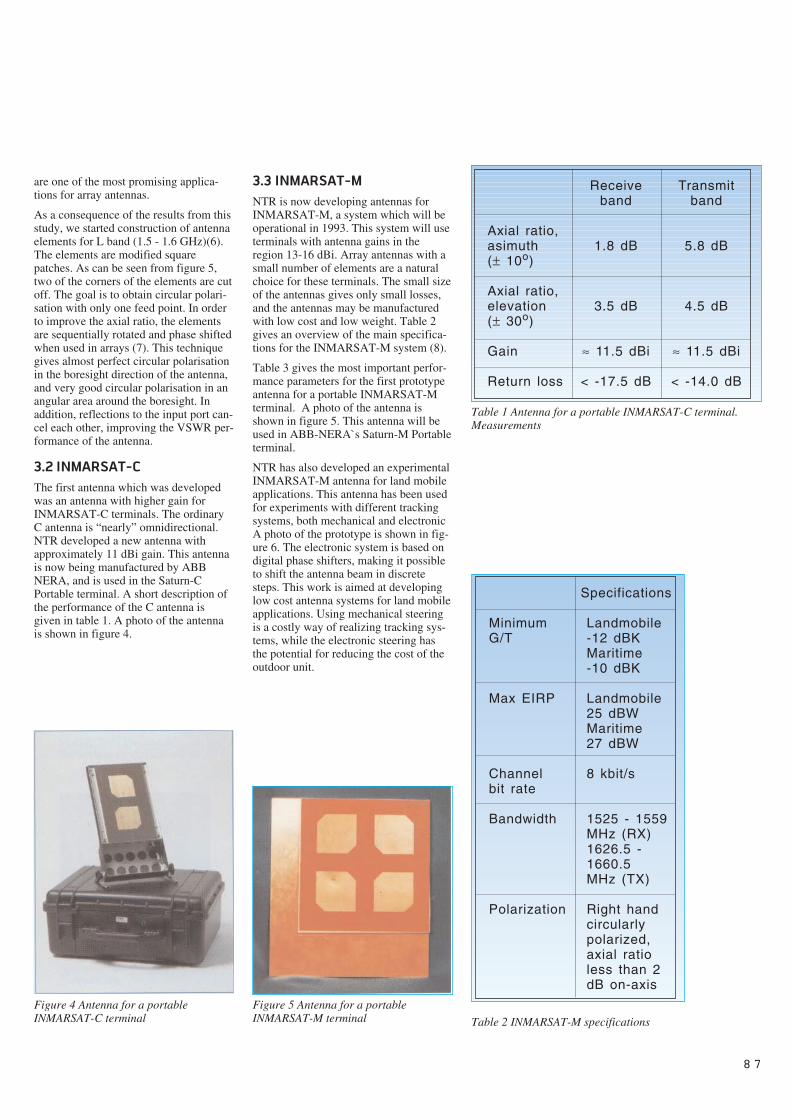
are one of the most promising applica-tions for array antennas.
As a consequence of the results from thisstudy, we started construction of antennaelements for L band (1.5 - 1.6 GHz)(6).The elements are modified squarepatches. As can be seen from figure 5,two of the corners of the elements are cutoff. The goal is to obtain circular polari-sation with only one feed point. In orderto improve the axial ratio, the elementsare sequentially rotated and phase shiftedwhen used in arrays (7). This techniquegives almost perfect circular polarisationin the boresight direction of the antenna,and very good circular polarisation in anangular area around the boresight. Inaddition, reflections to the input port can-cel each other, improving the VSWR per-formance of the antenna.
3.2 INMARSAT-C
The first antenna which was developedwas an antenna with higher gain forINMARSAT-C terminals. The ordinaryC antenna is “nearly” omnidirectional.NTR developed a new antenna withapproximately 11 dBi gain. This antennais now being manufactured by ABBNERA, and is used in the Saturn-CPortable terminal. A short description ofthe performance of the C antenna isgiven in table 1. A photo of the antennais shown in figure 4.
3.3 INMARSAT-M
NTR is now developing antennas forINMARSAT-M, a system which will beoperational in 1993. This system will useterminals with antenna gains in theregion 13-16 dBi. Array antennas with asmall number of elements are a naturalchoice for these terminals. The small sizeof the antennas gives only small losses,and the antennas may be manufacturedwith low cost and low weight. Table 2gives an overview of the main specifica-tions for the INMARSAT-M system (8).
Table 3 gives the most important perfor-mance parameters for the first prototypeantenna for a portable INMARSAT-Mterminal. A photo of the antenna isshown in figure 5. This antenna will beused in ABB-NERA`s Saturn-M Portableterminal.
NTR has also developed an experimentalINMARSAT-M antenna for land mobileapplications. This antenna has been usedfor experiments with different trackingsystems, both mechanical and electronicA photo of the prototype is shown in fig-ure 6. The electronic system is based ondigital phase shifters, making it possibleto shift the antenna beam in discretesteps. This work is aimed at developinglow cost antenna systems for land mobileapplications. Using mechanical steeringis a costly way of realizing tracking sys-tems, while the electronic steering hasthe potential for reducing the cost of theoutdoor unit.
8 7
Receiveband
1.8 dB
3.5 dB
≈ 11.5 dBi
< -17.5 dB
Axial ratio,asimuth(± 10o)
Axial ratio,elevation(± 30o)
Gain
Return loss
Transmitband
5.8 dB
4.5 dB
≈ 11.5 dBi
< -14.0 dB
Table 1 Antenna for a portable INMARSAT-C terminal.Measurements
Landmobile-12 dBKMaritime-10 dBK
Landmobile25 dBWMaritime27 dBW
8 kbit/s
1525 - 1559MHz (RX)1626.5 -1660.5MHz (TX)
Right handcircularlypolarized,axial ratioless than 2dB on-axis
MinimumG/T
Max EIRP
Channelbit rate
Bandwidth
Polarization
Specifications
Table 2 INMARSAT-M specifications
Figure 4 Antenna for a portableINMARSAT-C terminal
Figure 5 Antenna for a portableINMARSAT-M terminal
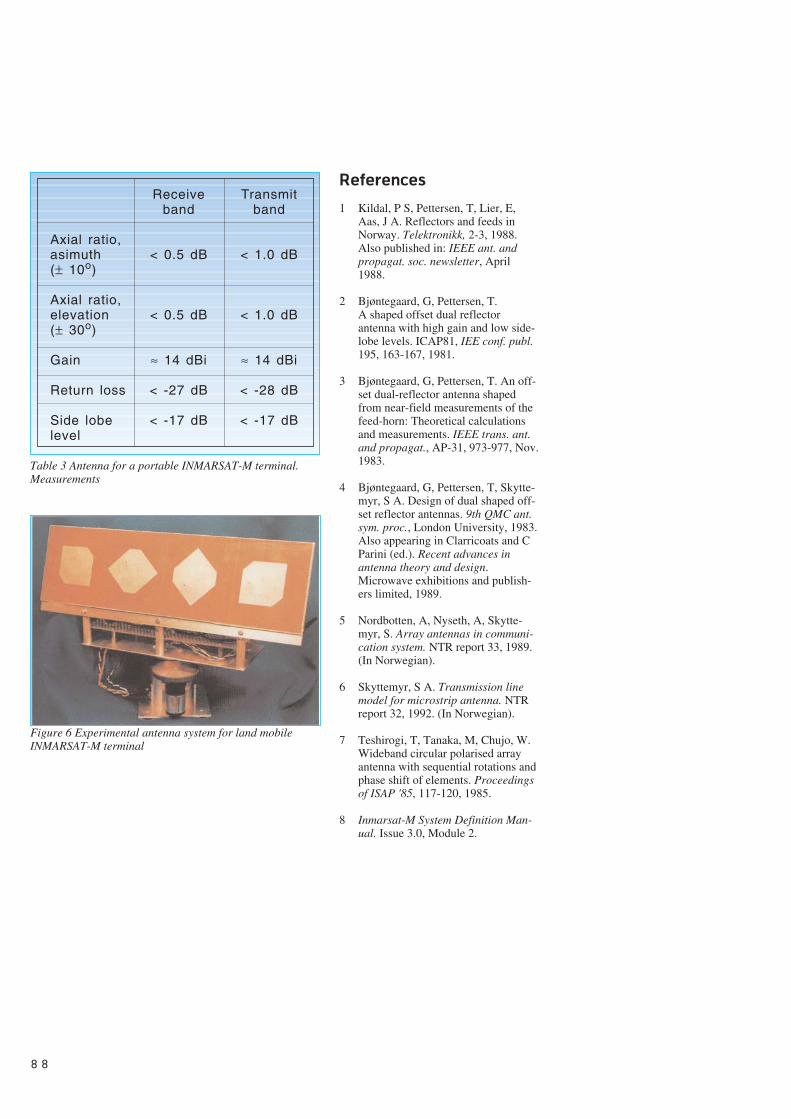
References
1 Kildal, P S, Pettersen, T, Lier, E,Aas, J A. Reflectors and feeds inNorway. Telektronikk, 2-3, 1988.Also published in: IEEE ant. andpropagat. soc. newsletter, April1988.
2 Bjøntegaard, G, Pettersen, T.A shaped offset dual reflectorantenna with high gain and low side-lobe levels. ICAP81, IEE conf. publ.195, 163-167, 1981.
3 Bjøntegaard, G, Pettersen, T. An off-set dual-reflector antenna shapedfrom near-field measurements of thefeed-horn: Theoretical calculationsand measurements. IEEE trans. ant.and propagat., AP-31, 973-977, Nov.1983.
4 Bjøntegaard, G, Pettersen, T, Skytte-myr, S A. Design of dual shaped off-set reflector antennas. 9th QMC ant.sym. proc., London University, 1983.Also appearing in Clarricoats and CParini (ed.). Recent advances inantenna theory and design.Microwave exhibitions and publish-ers limited, 1989.
5 Nordbotten, A, Nyseth, A, Skytte-myr, S. Array antennas in communi-cation system. NTR report 33, 1989.(In Norwegian).
6 Skyttemyr, S A. Transmission linemodel for microstrip antenna. NTRreport 32, 1992. (In Norwegian).
7 Teshirogi, T, Tanaka, M, Chujo, W.Wideband circular polarised arrayantenna with sequential rotations andphase shift of elements. Proceedingsof ISAP '85, 117-120, 1985.
8 Inmarsat-M System Definition Man-ual. Issue 3.0, Module 2.
8 8
Figure 6 Experimental antenna system for land mobileINMARSAT-M terminal
Receiveband
< 0.5 dB
< 0.5 dB
≈ 14 dBi
< -27 dB
< -17 dB
Axial ratio,asimuth(± 10o)
Axial ratio,elevation(± 30o)
Gain
Return loss
Side lobelevel
Transmitband
< 1.0 dB
< 1.0 dB
≈ 14 dBi
< -28 dB
< -17 dB
Table 3 Antenna for a portable INMARSAT-M terminal.Measurements