Embed Size (px)
DESCRIPTION
Satellite Products (and in situ): Intercomparison and Assessment GCW Advisory Group Meeting. Reykjavik, 23-24 January, 2014. Product Intercomparison and Assessment. - PowerPoint PPT Presentation
Citation preview
Polar Space
Task Group
Satellite Products (and in situ):Intercomparison and Assessment
GCW Advisory Group Meeting
Reykjavik,23-24 January, 2014

Polar Space
Task Group
GCW Advisory Meeting, 23-Jan-14 2
Product Intercomparison and Assessment
• Intercomparison required to assess product quality (uncertainty, bias, error correlation), and to isolate algorithm/methodological weaknesses
• Intercomparison of sat. products with independent external reference measurements (in-situ, airborne, etc) – validation, characterisation of errors, estimate of absolute biases, sources of
uncertainty etc.• Intercomparisons amongst different satellite products
– to establish relative biases and range of uncertainty• Intercomparison must be a continuous process
– to evaluate spectral content of errors – Evaluate rate of change of product uncertainties (e.g. contributed by
instrument ageing, orbit degradation, switch to redundant instrument chains, etc.)

Polar Space
Task Group
GCW Advisory Meeting, 23-Jan-14 3
Why?
• Multiple-satellite, multiple-instrument products are ultimately needed to construct robust, long-term climate records (ECVs)
• Product intercomparison need not be seen as a means to single out the best methodology, instrument, or data product.
• It is the best means to establish the strengths and weaknesses of all product data types (e.g. microwave/optical; or coverage/spatial resolution)
• It is the only basis for merging independently produced fundamental data records into ECVs

Polar Space
Task Group
GCW Advisory Meeting, 23-Jan-14 4
A Recipe for Intercomparison
• Generate Level playing field (agreed best practices/intercomparison standards or guidelines)
• Establish Temporal/Spatial coincidence of different products• Select key Areas for Intercomparison, based on locations of GCW
Reference Sites, or other independent validation datasets (e.g. airborne data)
• Assemble knowledge on spatial resolution limitations (e.g. impact of product gridding)
• Assemble knowledge on spectral content of time-series of temporally averaged products (e.g. impact of temporal averaging, impact of illumination geometry from successive orbits)
• Assemble necessary ancillary data for common use by all participants (e.g. DEMs, land cover maps; and common land/snow/ice masks);

Polar Space
Task Group
GCW Advisory Meeting, 23-Jan-14 5
Intercomparison Examples
• Independent non-Cryosphere example– GHRSST: Global High Resolution Sea Surface
Temperature product• ESA Climate Change Initiative example
– Ice Sheets– Sea ice
• ESA GCW Contribution: – SnowPEX: Snow product intercomparison exercise

Polar Space
Task Group
GCW Advisory Meeting, 23-Jan-14 6
Global High Resolution Sea Surface Temperature (GHRSST- VC)
• CEOS GHRSST-Virtual Constellation is an example – it is a multi-agency, multi-satellite, multi-institutional product intercomparison framework, and produces a merged product from polar orbiting + geostationary satellites using both optical and microwave data
• Its foundation is common standards and product uncertainty estimation, validation, and product intercomparison
• Use of Diagnostic Data Sets - DDS (i.e. regional intercomparisons)
• Publication of error statistics (fundamental to data use and assimilation into models)

Polar Space
Task Group
• Polar infrared has high accuracy & spatial resolution • Geostationary infrared has high temporal
resolution• Microwave Polar orbiting has all-weather capability
DataMerging
• In situ data provide reality in all weather conditions
GHRSST Builds on EO complementarities…

Polar Space
Task Group
GCW Advisory Meeting, 23-Jan-14 9
GHRSST Diagnostic Data Sets (DDS)
See: http://www.hrdds.net/
Purpose: • monitoring and assessing the quality of a product through statistical
analysis and/or comparison with other data sources• evaluating and intercomparing different geophysical inversion algorithms• collecting and cumulating various parameters over a small area to observe
a specific phenomenon• crossing different sources of data for synergy applications
Approach:• Archive subsets of independent L2 (geophysical products with
uncertainties) and ancillary data• Collect at 250 sites across the global ocean• Common format & grid• Open access via FTP and OPeNDAP• Python Plotting tools allow interactive RT statistical or timeseries plotting
to isolate errors, and compare with ancillary data

Polar Space
Task Group
GCW Advisory Meeting, 23-Jan-14 10
DDS examples
AMSR-E vs ATSR Regional Biases (oC) All data compared in regional DDS (oC)
Investigate source of origin of bias using ancillary data

Polar Space
Task Group
GCW Advisory Meeting, 23-Jan-14 11
CCI: Ice Sheets
• Examples courtesy of R. Forsberg and the ESA CCI Ice Sheet consortium
• See e.g. Levinsen et al. (2013).ESA’s Ice Sheets CCI: validation and inter-comparison of surface elevation changes derived from laser and radar altimetry over Jakobshavn Isbræ,Greenland – Round Robin results. The Cryosphere Discuss., 7, 5433–5460, 2013, doi:10.5194/tcd-7-5433-2013

Polar Space
Task Group
CCI Products Overview
ESA’s CCI_ice_sheet Project will provide selected, consistent, easy-to-use selected ECV’s for Greenland, based mainly on ESA EO data (radar altimetry and SAR)
Coverage of ECVs, based on user requirements
ECV Product Spatial resolution
Temporal resolution
Period Spatial and temporal coverage, first 3-yr phase
Surface Elevation Change (SEC)
5 km grid 4 per year 1991-present
All ice sheet, 1991-20125-year running means
Ice Velocity(IV) 500 m grid 1 per year* 1991-
present
Coastal margin (winter 1995/96 and summer 2008)Timeseries on Jakobshavn and Upernavik isbræ; North Greenland interior drainage basin (winter 1991/92)
Calving Front Location (CFL)
250 m shapefile 4 per year 1991-
present
19 named major glaciers(some glaciers sampled yearly, depending on data availability)
Grounding Line Location (GLL)
250 m shapefile 1 per year 1991-
present
Petermann, Hagen and 79-Fjord Glaciers
* After CCI phase 1

Polar Space
Task Group
Example of first phase ECV data coverage:Ice Velocity from SAR interferometry:Coastal regions, northern basin, and timeSeries on Jakobshavn and Upernavik Glaciers
Key regions for ECV validation from independentsatellite, airborne and surface data (background image: Ice velocities from SAR, from I. Joughin)
Products – intercomparison areas

Polar Space
Task Group
• Ice velocity and grounding lines determined by SAR feature tracking and interferometry
• Three methods - complementary error characteristics:
- Speckle tracking- D-InSAR- MAI (multi-aperture interferometry)Speckle tracking implemented in DTU-SUSIE Area Accu
-racy Sensors Method
Ice sheet interior
<10 m/y
ERS SAR
Calibration with balance velocitiesD-InSAR and MAI techniques
Ice sheet margin
10 to 30
m/yr
ERS SAR, ASAR, PALSAR
Calibration with stationary control points on bedrock.Speckle-tracking (highest accuracy) and feature-tracking (lowest accuracy)
Ice Velocity Products & Methods
Petermann Glacier IV (ERS, 1995/96)

Polar Space
Task Group
Envisat 2002-12CCI RT+XO algorithm(preliminary)
ICESat 2003-9
(colour scale -4 to 1 m)
Jakobshavn sectorof icesheet - example
SEC: Envisat vs IceSat

Polar Space
Task Group
Two algorithms for ENVISAT 2002-12: cross-over (XO) and repeat track (RT)
XO(Nersc)
RT(DTU)
ColourScales-0.8 -> 0.2 m/yr
Surface Elevation Change (SEC)
Polar Space
Task Group
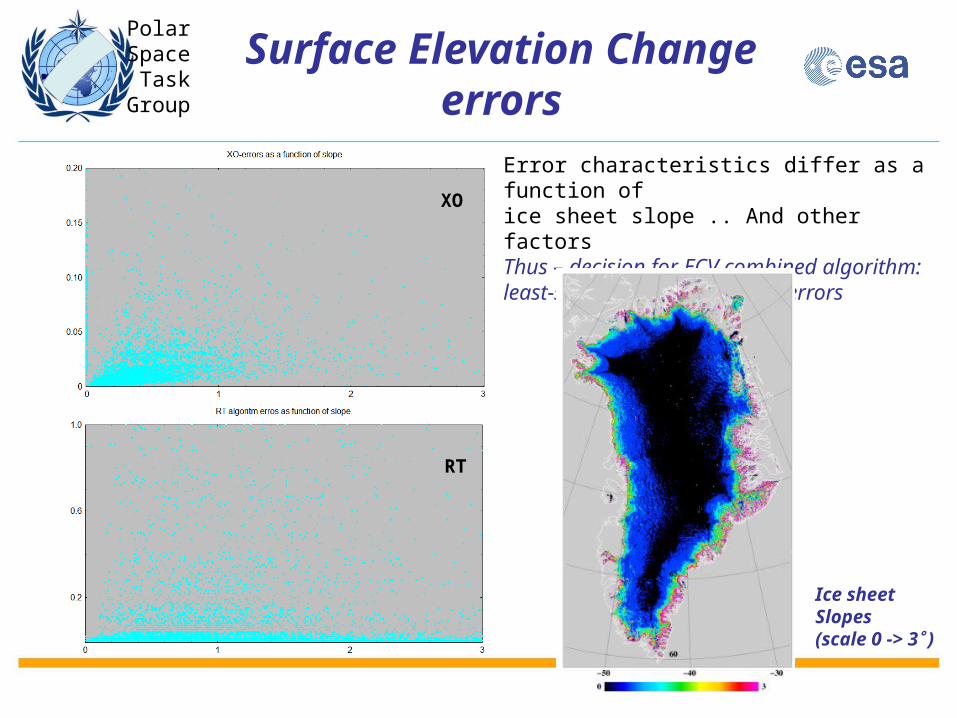
Error characteristics differ as a function ofice sheet slope .. And other factorsThus – decision for ECV combined algorithm: least-squares collocation with errors
XO
RT
Ice sheetSlopes(scale 0 -> 3 )
Surface Elevation Change errors

Polar Space
Task Group
SECEnvisat2002-12(m/yr)
Trenderror(m/yr)
SEC merged product

Polar Space
Task Group
ESA CCI: Sea ice
• Leif Toudal Pedersen, DMI• Natalia Ivanova, NERSC• Roberto Saldo, DTU• Georg Heygster, U-Bremen• Rasmus Tonboe, DMI• Thomas Lavergne, Met Norway• Marko Mäkynen, FMI• Stefan Kern, U-Hamburg• Contributions from • Ludovic Brucker, NASA• Mohammed Shokr, Environment,
Canada
Intercomparisons required to establish sea ice concentration (SIC) as an ECV

Polar Space
Task Group
Intercomparison Data Package
• Accurate reference data (SIC=0 and SIC=1)• Collocated microwave brightness temperatures from:
– SMMR (NSIDC)– SSMI (Eumetsat CM-SAF)– AMSR-E (NSIDC)
• Co-located NWP ancillary data (ERA Interim)

Polar Space
Task Group
The Algorithms
• A total of 25+ algorithms were implemented and tested
• Most were algorithms published over the last 30 years
• Some were very simple• Some were combinations
(such as averages) of others
Algorithm ChannelsNear90_lin 90HVNear90GHz 90HV
P90 90HVASI_NoWeather 90HV
combo3 (NRL+N90)/2Bootstrap_p 37HV
combo7 (CF+N90)/2P37/NRL 37HVcombo4 (NRL+N90+CF)/3combo2 (CF+NT+N90)/3
PR 37HV+19HVP18 19HVP10 10HV
combo8 (CF+N90*CF)/(1+CF)NASA_Team 37V+19HV
Bristol 37HV+19Vcombo5 (CF+N90*CF**2)/(1+CF**2)
osisaf 37HV+19VBootstrap_f 37V+19V
CalVal 37V+19VUMass_AES 37V+19V
TUD 90HV+37V+19VNORSEX 37V+19Vcombo1 (CF+NT)/2combo6 (CF+N90*CF**3)/(1+CF**3)
One_channel 6H

Polar Space
Task Group
Ice concentration MY-fraction Ice temperature ”Error”
SSTWater Vapour Cloud liquid water Wind Speed
AMSR - February 4, 2006

Polar Space
Task Group
Algorithm comparison, SIC=15%, AMSR, no WF
Near 90GHz
Near 90GHz l
in, dyn ASI
P90
(NRL+
N90Lin)/2
(CF+
N90L)/2
(NRL+
CF+N90Lin
)/3
Bootstrap
P (CP)
P37
(NT+
CF+N90Lin
)/3EC
ICEP18 PR
Bristo
l
NASA Team 2
(CF+
N90L*CF)/
(1+C
F)
NASA Team (N
T)
OSISAF-2
OSISAF
(NT+
CF)/2 P10
(CF+
N90L*CF*
*2)/(1+C
F**2
)
(CF+
N90L*CF*
*3)/(1+C
F**3
)
OSISAF-3
UMas
s-AES TU
D
NORSEXCalV
al
Bootstrap
F (C
F)
One chan
nel (6H)
IOM
ASA IR
T0
5
10
15
20
25
30
35
Major noise from:CLWWVWS

Polar Space
Task Group
Algorithm comparison, SIC=85%
PRP18
P37P10
Bootstrap
P
(NRL+
N90Lin)/2 P90
Near 90GHz l
in, dyn
IOM
ASA IR
T
Bootstrap
F
CalVal
UMas
s-AES TU
D
NORSEX
Near 90GHz
NASA Team
One chan
nel (6H)
ASI
(NRL+
CF+N90Lin
)/3EC
ICE
(CF+
N90L*CF*
*3)/(1+C
F**3
)
(CF+
N90L)/2
(CF+
N90L*CF*
*2)/(1+C
F**2
)
(CF+
N90L*CF)/
(1+C
F)
(NT+
CF+N90Lin
)/3
Bristo
l
OSISAF
OSISAF-2
OSISAF-3
(NT+
CF)/2
NASA Team 2
0
5
10
15
20
25
30
35
Variability in snow properties is the major uncertainty

Polar Space
Task Group
GCW Advisory Meeting, 23-Jan-14 25
SnowPEX
SATELLITE SNOW PRODUCTS INTERCOMPARISON AND EVALUATION EXERCISE
ENVISAT MERIS 22 März 2011
A contribution to WMO Global Cryosphere Watch and WCRP CLiC
Proposal submitted to ESA Attn. B. Bojkov / Sensor Performance, Products and Algorithms
under the Lead of Thomas Nagler, ENVEO
Consortium:
Planned Project Start: Q1 2014 Duration: 24 Months

Polar Space
Task Group
26
SnowPEX Objectives
The primary objectives are
• Intercompare and evaluate global / hemispheric (pre) operational snow products derived from different EO sensors and generated by means of different algorithms, assessing the product quality by objective means.
• Evaluate and intercompare temporal trends of seasonal snow parameters from various EO based products in order to achieve well-founded uncertainty estimates for climate change monitoring.
• Elaborate recommendations and needs for further improvements in monitoring seasonal snow parameters from EO data.
GCW Advisory Meeting, 23-Jan-14
SnowPEX aims to bring together scientists and institutions of seasonal snow pack monitoring for assessing the quality of current satellite-based snow products derived from EO data, and working out guidelines for improvement.
The project will support the setup of a consolidated operational satellite snow observation system for the Global Cryosphere Watch Initiative of the WMO and help to improve the snow cover data base for climate monitoring, as addressed by the WCRP-CliC programme
Polar Space
Task Group
GCW Advisory Meeting, 23-Jan-14 27
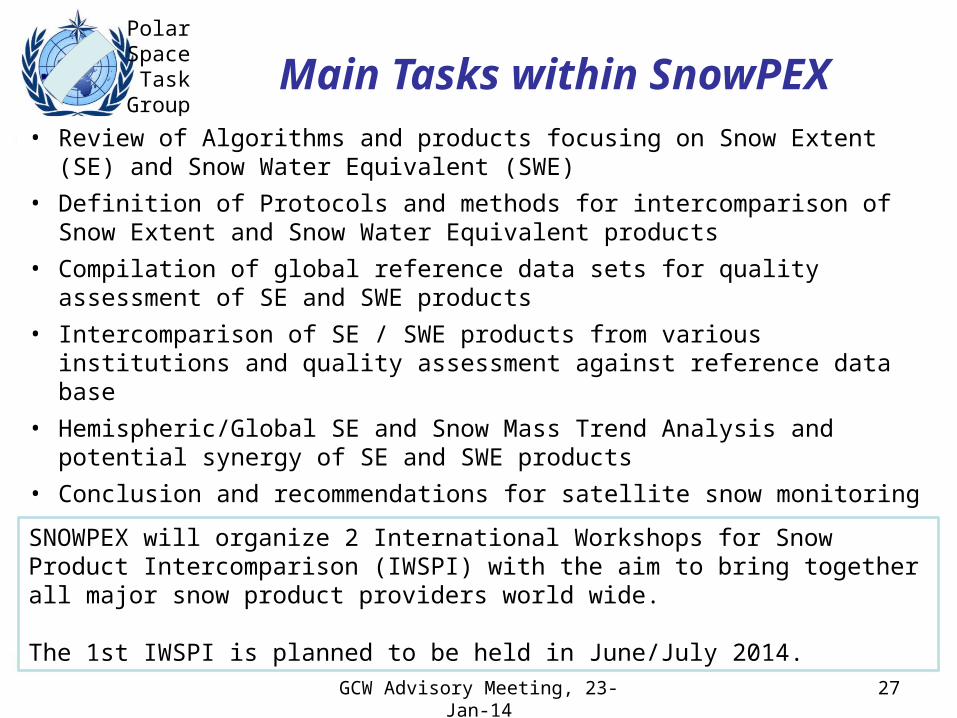
Main Tasks within SnowPEX• Review of Algorithms and products focusing on Snow Extent (SE) and Snow Water
Equivalent (SWE) • Definition of Protocols and methods for intercomparison of Snow Extent and Snow Water
Equivalent products• Compilation of global reference data sets for quality assessment of SE and SWE products• Intercomparison of SE / SWE products from various institutions and quality assessment
against reference data base• Hemispheric/Global SE and Snow Mass Trend Analysis and potential synergy of SE and
SWE products• Conclusion and recommendations for satellite snow monitoring
SNOWPEX will organize 2 International Workshops for Snow Product Intercomparison (IWSPI) with the aim to bring together all major snow product providers world wide.
The 1st IWSPI is planned to be held in June/July 2014.

Polar Space
Task Group
GCW Advisory Meeting, 23-Jan-14 28
Discussion
Intercomparisons fundamental to Space Agencies – but also a critical pathway to comparing the in-situ with space based observations (upscaling/downscaling)• How to expand on example of SnowWatch tracker – for RT
status of cryosphere?• Shall this kind of development remain in domain of
independent financing?• How to nurture future new efforts under GCW? – for other
cryosphere components such as permafrost• Combine model output (analysis/forecast update) with in-
situ/sat products in a tracker like environment?– Seeing the benefit...