Embed Size (px)
Citation preview

Satellite Thermal Remote
Sensing of Boiling Springs
Lake
Jeff PedeltyNASA Goddard Space Flight CenterGoddard Center for Astrobiology

Overview
• Work in progress• Description of sensors
– Landsat 7’s ETM+– TERRA’s ASTER
• Acquisitions of Boiling Springs Lake
• Temperature determinations & issues
• Future aerial thermal remote sensing
ASTER: October 19, 2002

Landsat 7 ETM+• Landsat 7 launched April 1999• ETM+ is the Enhanced Thematic Mapper Plus• 16-day repeat cycle• ~15% duty cycle• Conterminous US imaged each overpass
– Approximately 10:30AM acquisition
• Single thermal band (10.4-12.5)• 60m spatial resolution across 185km area• Data purchased from USGS EROS Data Center ($250 for new acquisitions, $600 < 5/31/2003)

Landsat 7 acquisitions of BSL
• Goal was to acquire seasonal sampling at reasonable cost
• Scan Line Corrector failure in May 2003 introduced luck into acquisition process– Jan 12, 2005 (gap)– Feb 11, 2004– May 20, 2005– August 21, 2004– August 24, 2005 (gap)– October 12, 2002 (free)
Thermal: Feb 2004Jan 2005
True Color

Landsat atmospheric correction
• Upwelling thermal emission includes atmospheric contribution and attenuation
• Requires local meteorology (e.g. NOAA’s National Center Environmental Prediction) + radiative transfer (MODTRAN)
• LTOA = T + Lu + (1 - ) Ld
• http://atmcor.gsfc.nasa.gov is a utility to determine , Lu and Ld for each acquisition– Barsi (GSFC), Schott (RIT), Hook/Palluconi (JPL)
• Output is land surface temperature (T)• Vicarious calibration campaigns suggest ~1-2K accuracy

Landsat Temperature Results
Date Lup Ldown Peak T
Feb 2004
0.91 0.55 0.94 26
May 2005
0.81 1.24 2.08 35
Aug 2004
0.75 2.04 3.32 42
Oct 2002
0.91 0.64 1.10 35

ASTER instrument
• On EOS TERRA mission (launched 12/99)• Joint US / Japan instrument (JPL)• “Zoom Lens” of TERRA• 15m Vis/NIR, 30m SWIR, 90m Thermal IR
– Total of 14 bands, 5 in the thermal infrared
• <16 day repeat cycle• 60km swath• Sophisticated multi-band temperature and emissivity retrieval algorithms
• Extensive vicarious calibration campaigns

ASTER’s Spectral Bands

ASTER coverage
<100% coverage: but 925,661 Scenes observed as of 9 Feb 2005

ASTER Acquisitions of Lassen
Volcano Monitoring Project (http://www.volcano.si.edu/gvp/volcano/index.htm)
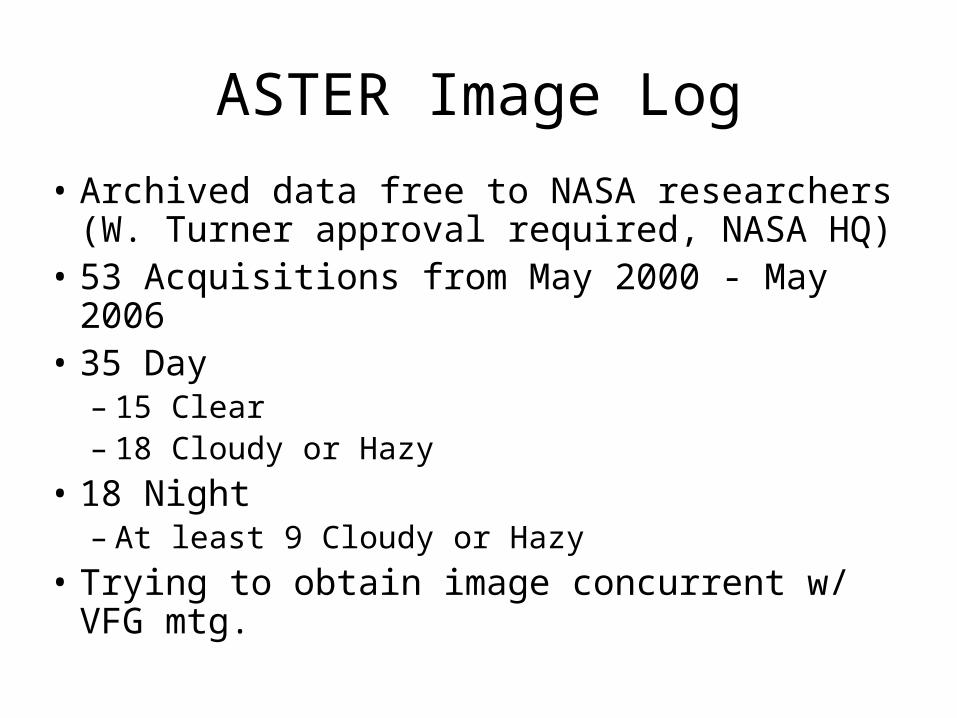
ASTER Image Log
• Archived data free to NASA researchers (W. Turner approval required, NASA HQ)
• 53 Acquisitions from May 2000 - May 2006
• 35 Day– 15 Clear– 18 Cloudy or Hazy
• 18 Night– At least 9 Cloudy or Hazy
• Trying to obtain image concurrent w/ VFG mtg.

Sample ASTER ImagesOctober 19, 2002
Bands 321 False Color
BSL ZoomBands 321
BSL ZoomTemperature

ASTER Day Temperatures(Removing 2 hazy dates)
Date Within Year
Temperature
15
20
25
30
35
40
45
50
1/1 2/20 4/11 5/31 7/20 9/8 10/28 12/17

ASTER Day/Night Results
Date Within Year
Temperature
15
20
25
30
35
40
45
50
1/1 2/20 4/11 5/31 7/20 9/8 10/28 12/17

Issues with ASTER Temperatures
• Spillover to ground?– Point spread function is not rectangular– Peak pixel does not measure just lake.– Lower ground temperatures may be bringing down lake temperatures. Perhaps indicated in night data?
• Shadowing?– Lower sun angle in winter could result in shadowing of hotter parts of the lake.
– Night data indicate this is not a major issue.
• Other unknown systematic effects?

Aerial Thermal Remote Sensing
• QWIP detector developed at GSFC– Quantum Well Infrared Photoconductor
• 1024 x 1024 GaAs array• 4 bands in thermal IR (T and retrieval)
• Investigating aerial (or even hillside) data collection at BSL later this summer/fall
• Data collection in winter could validate the ASTER/Landsat temperature trends.

Sample QWIP Image

Multispectral Thermal Imager (MTI)
• DOE technology development mission• Launched ca 2000• “Point and Shoot” mission, ~10 scenes/day• 20m resolution thermal data (~5m and ~10m)– Highest resolution thermal imaging from space
• Operated ~2 years, now in storage on orbit
• No acquisitions of Lassen/BSL, but Yellowstone data do exist and I have some in hand.– Perhaps of interest to others

ASTER Imaging Opportunities
• ASTER needs to be tasked to take specific images
• I have requested an allocation with NASA HQ under the name of NAI ViFoG
• See me if ASTER data would be useful for any upcoming field campaigns.

Backup