Embed Size (px)
Citation preview

R. VERMUNT, E. SPAANS, AND F. ZORGE
S A T I S F A C T I O N , H A P P I N E S S A N D W E L L - B E I N G
O F D U T C H S T U D E N T S
(Received 13 July, 1987)
ABSTRACT. Applying Multiple Discrepancies Theory (MDT), the well-being of Dutch students was measured.
To test relevant portions of MDT a questionnaire, originally developed by Michalos, was administered to a group of students at Leiden University, the Netherlands.
It turned out that the cognitive structure of the satisfaction with life domains consisted of three dimensions: (1) a personal control (psychological distance) dimen- sion; (2) a materialistic-nonmaterialistic dimension; and (3) an interpersonal-mental dimension.
Scores of satisfaction with the life domains explain 50% of the variance of the scores of satisfaction with life-as-a-whole. While scores of dissatisfaction (discontent) with the life domains explain 60% of the variance of dissatisfaction with life-as-a-whole.
The results show next that the discrepancy between the situation one has and the situation one aspires to is the most important discrepancy in explaining satisfaction scores, as was predicted by the hierarchical model. There are, however, deviations from the general pattern of findings: The influence of the best experience up till now is smaller than in the 1985 Canadian study. Past expectations and personal needs are stronger determinants of aspiration level in the Dutch studY than in the Canadian study. In general the results confirm the assumptions of MDT.
1. INT RODUCT ION
In the past phi losophers were convinced of a strong relationship
be tween objective welfare and subjective well-being.
El iminat ion of pover ty by increasing material resources was per-
ceived as the most efficient way to increase the satisfaction and
happiness of people. It was after Wor ld War II that scientists became
aware of the idea that a close relationship between welfare and
well-being did not fit with reality. Increase in welfare was accompanied by an even faster increase in alienation, drug abuse, suicide-attempts
and dissatisfaction. In addition, people with high educat ion and status did no t appear to be more satisfied than people with low educat ion and
status.
There was a growing search for theoretical models to explain these
Social Indicators Research 21 (1989) 1--33. �9 1989 by Kluwer Academic Publishers.
R. V E R M U N T E T AL.
findings. The work of Campbell, Converse and Rodgers (1976), Andrews and Withey (1976) and Michalos (1980, 1982, 1983, 1985) has provided the necessary theoretical framework and data bases stemming from it.
The most important difference between the old models and the new ones is that satisfaction with life-as-a-whole could far better be explained by the way people perceive and evaluate their life and different aspects of it than by emphasizing the objective quality of the different aspects of life.
In quality-of-life research, as it has been conducted in the United States and Canada since the seventies, two different but complementary approaches can be distinguished. The first approach is based on the assumption that individuals tend to divide their lives into separate but related aspects (called domains), such as work, marriage, family and so on. Further it was assumed that individuals combine their feelings of satisfaction with each of these aspects into an overall feeling of well- being.
Research starting from this approach is designed to determine:
- - the most important domains individuals distinguish in their life; - - the relationships among feelings of satisfaction with each of the
domains; -- the influence of satisfaction with each of the domains on satisfaction
and happiness with life-as-a-whole; - - the rule combining the domain satisfactions with satisfaction and
happiness with life-as-a-whole.
The second approach starts from the assumption that feelings of satisfaction and happiness are dependent on the way individuals perceive and evaluate aspects of their life in relation to important standards. Research starting from the second approach is aimed at determining how perceived discrepancies between a person's present life and different comparison standards separately and in combination influence satisfaction.
In the present research both approaches have been applied to explain satisfaction and happiness of freshmen at Leiden University, The Netherlands. Using Multiple Discrepancies Theory (MDT) and the

WELL-BEING OF DUTCH STUDENTS
measurement instrument based on it (Michalos, 1985) we will test major parts of MDT on a Dutch (student) sample.
1.1. The Theory of Well-Being
It is assumed that several independent factors underlie feelings of well-being. Campbell (1981) distinguishes 'affective experiences', 'satis- faction' and 'tension'. Emmons and Diener (1985) distinguish 'positive affect', 'negative affect' and 'satisfaction'. Andrews and Withey (1976) mention the factors 'cognitive evaluations' and 'affect'. All agree that feelings of well-being are composed of a cognitive-evaluative factor (satisfaction) and an affective factor (happiness). The correlation between satisfaction and happiness is high but not perfect.
A major difference between satisfaction and happiness is that happiness is more dependent on the momentary situation than satisfac- tion and more sensitive to sudden changes in mood.
Because of the greater stability of feelings of satisfaction compared to those of happiness, satisfaction was, in previous research projects, measured with respect to different aspects of life, while happiness has been measured exclusively in relation to life-as-a-whole. In the present project satisfaction has been measured in the tradition of quality-of-life research, but also in the tradition of relative deprivation theory (Crosby, 1982).
Asking for the amount of satisfaction individuals experience is asking for a taken-for-granted phenomenon. It is quite natural for individuals to think about their lives in terms of satisfaction and not in terms of dissatisfaction or discontent. Asking individuals about dissatisfaction, discontent or their grievances makes individuals more conscious of the relatively unpleasant aspects in their lives. We therefore ask subjects to indicate their satisfaction with several domains of life and with life-as-a- whole, as well as their discontent with the domains and life-as-a-whole.
The relationship between satisfaction and happiness is rather strong. Correlations between scores on satisfaction and happiness lie between 0.50 and 0.67. Satisfaction and happiness have much in common, but there are aIso differences. To find out what kind of differences there are between both concepts we applied 12 bipolar adjectives from the semantic differential technique (Osgood, Suci and Tannenbaum, 1957).

4 R. V E R M U N T ET AL.
We expected a strong relationship between subjects' scores on the evaluative dimension and satisfaction scores, and a weak relationship between scores on the evaluative dimension and happiness scores. We expected these relationships because happiness can be conceived of as the result of an affective process and should correlate low with the scores on the evaluative dimension in the semantic space. Satisfaction, on the other hand, is mainly the result of a cognitive evaluation process and should therefore correlate highly with the evaluative dimension.
1.2. The Theoretical Model
Campbell et al. (1976) developed a model of satisfaction and happiness based on the following assumptions:
1. A person reacts to the environment as he or she perceives it and not to the objective environment. The perception will be influenced by the person's values, expectations, personality characteristics, demographic characteristics and so on.
2. Feelings of satisfaction (and happiness) are a function of the perception of the present situation. The perception of the present situation will be affected by rules, expectations and so on, but also by objective characteristics of the environment.
3. The amount of satisfaction the person experiences in the present situation is a function of the perceived discrepancy between the present situation and the situation the person uses as comparison standard (the situation the person was in in the past, the situation the person feels he deserves and so on).
4. There exist a general human impulse to maximize feelings of satisfaction and happiness.
5. Changes in the amount of satisfaction (or happiness) the person experiences may be a consequence of: -- changes in the objective life circumstances of the person; -- changes in the situation as perceived by the person; -- changes in psychological perspective (i.e. comparison standard)
the person uses to evaluate the situation. 6. Feelings of satisfaction with a domain of life are partly determined
by the perceived attributes of the domains.

WELL-BEING OF DUTCH STUDENTS
These assumptions are the basis of the studies within the two ap- proaches of quality-of-life research: the domain-satisfaction approach and the discrepancy approach.
1.2.1. The domain satisfaction approach. The domain satisfaction approach starts from the assumption that overall satisfaction (and/or happiness) is related to the feelings of satisfaction and dissatisfaction people have with several domains of life. Research on 'life-concerns' (Andrews and Withey, 1976) showed that structural analysis of a great many life-aspects revealed three clusters of domains (Campbell et al., 1976)
- - the first cluster represents satisfaction with domains related to important primary groups (family, marriage, friendship);
- - the second cluster represents satisfaction with domains related to transaction with the environment (work, educational level);
- - the third cluster represents satisfaction with domains related to Jess personal aspects of the environment (e.g. transportation, neighbourhood).
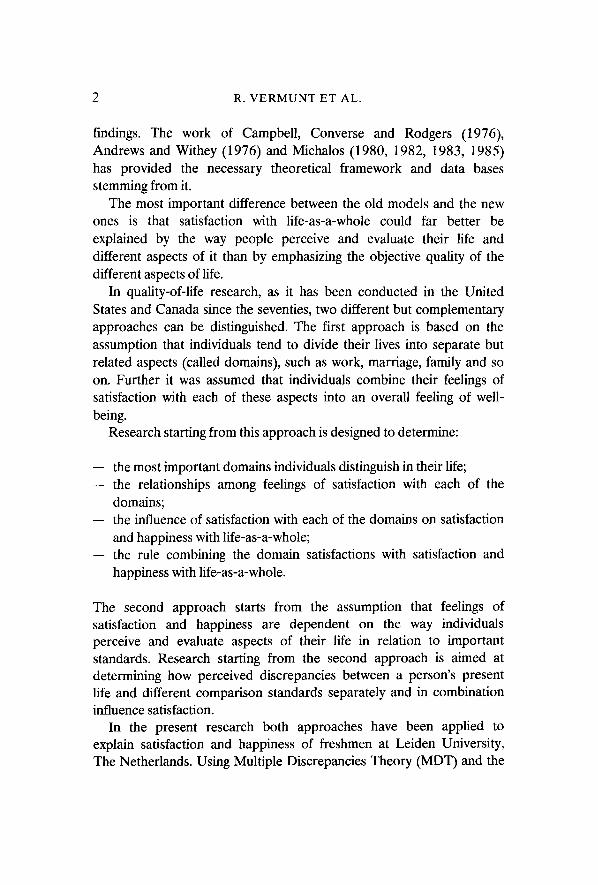
The perceptual structure of satisfaction with life domains could almost completely be maintained although samples from different populations were drawn. For example, in a study on a Dutch sample, the perceptual structure consisted of domains of the first cluster and a combination of the second and third cluster (Andrews and Inglehart, 1979). In Figure 1 this structure is presented.
In the present research the relationship between feelings of satisfac- tion with life-as-a-whole and satisfaction with several life domains for a homogeneous population of Dutch students will be analysed.
A second issue of the relationship between domain evaluations and evaluations with life-as-a-whole concerns the (curve) linearity of the relationship and the mathematical rule to relate the domain satisfac- tions at best with satisfaction with life-as-a-whole.
The (curve) linearity of the relationship has been analysed by comparing the linear association measurement with the non-linear association measurement of the relationship of each of the domain evaluations with the evaluation of life-as-a-whole. The results showed (Andrews and Withey, 1976; Campbell et al., 1976; Michalos, 1980)
R. V E R M U N T ET AL.
G - - . x j . - / \ ,, !
\ / I I /
XX / ~ /1
Fig. 1. Perceptual structure of Dutch respondents (from Andrews and Inglehart, 1979, p. 84).
that the relationship is in fact a linear one. Comparing the results of multiple regression analysis (revealing the linear component) and multiple classification analysis (revealing the linear and the non-linear component), showed that the coefficients were 0.54 and 0.56 respec- tively. The small difference of 0.02 means that only 2% more variance in satisfaction with life-as-a-whole scores could be explained by applying the linear as well as the non-linear component (Campbell et al., 1976). Their results were confirmed in several replication studies by Andrews and Withey (1976), and Michalos (1981, 1982, 1983). We also expect that in the Dutch sample the linear relationship will be prevalent.
A third point of the relationship between evaluation of the domains and evaluation of life-as-a-whole concerns the application of equal or different weights to the scores of the domain satisfaction variables. In other words, can satisfaction with life-as-a-whole be better explained by simply adding the scores of the domain satisfaction variables, or by a weighted summation of the scores? A weighted sum is more in line with previous results than an unweighted sum: from research on the per- ceptual structure of domain satisfactions it could be shown that scores of certain domain satisfaction variables are more strongly correlated with scores of satisfaction with life-as-a-whole than satisfaction scores of other domains. Campbell et aL (1976) conclude from their data that satisfaction with life-as-a-whole could best be explained by applying a weighted sum of the domain satisfaction scores, although the improve-

WELL-BEING OF DUTCH STUDENTS
ment was only 4%. (5% in the study of Andrews and Withey, 1976). From studies of Michalos (1980, 1983) it could be shown that the average covariance between the scores of the domain evaluation variables was 0.59. Michalos' finding supports, therefore, the use of the weighted summation model to relate domain satisfaction scores to scores of satisfaction with life-as-a-whole.
The kind and amount of domain evaluations to optimally explain the evaluation of life-as-a-whole have also been subjects of research. From the analysis of different datasets, Andrews and Withey (1976) conclude that the best prediction of satisfaction with life-as-a-whole can be achieved by applying heterogeneous sets of domains. The reported data came, however, from heterogeneous populations and the question is whether the same results can be found in a highly homogeneous population such as the Dutch student population.
It is also plausible to suppose that subjects differ in the way they weigh the domain evaluations to come to an overall evaluation.
Satisfaction with life-as-a-whole will also be influenced by demog- raphic characteristics of persons. The influence of these kinds of variables, such as sex, age, ethnicity, educational level, and income, has been found to be rather small. Abbey and Andrews (1985) found that the relationship between demographic characteristics and satisfaction with life-as-a-whole was rather weak. They concluded that in general less than 15% of the variance in scores of satisfaction with life-as-a- whole could be explained by demographic variables. From several studies by Michalos (1980, 1982, 1983, 1985) it can be shown that demographic variables explain less than 10% of the variance of the scores of satisfaction with life-as-a-whole.
Two exceptions on these general findings have been found. Davis, Fine-Davis, and Meehan (1982) and Campbell (1981) showed that satisfaction with income, financial situation and standard of living increases with increases in the status of the respondents in these domains. Age is positively correlated with satisfaction with all aspects of life, except health.
In the preceding paragraphs several studies have been examined to discover the relationships between domain satisfaction and satisfaction with life-as-a-whole. Most studies did find results which are for the most part in agreement with each other. There were exceptions

R. VERMUNT ET AL.
however. In interpreting these differences one should keep in mind that the several research projects were carried out on different populations, on different domains of life and at different periods of time.
The issues mentioned in this paragraph, which are important issues in quality-of-life research, will be the subject of analysis in the present study with data from a homogeneous population of Dutch students.
1.2.2. The discrepancy approach. Several studies have shown that satisfaction with one's profession, educational level and housing is in general higher among persons with respectively a low income, a low educational level and bad housing than among persons with relatively high income, high educational level and good housing (Andrews and Withey, 1976). Pettigrew (1968) points to another example of such findings: the increasing dissatisfaction of the negro population in the U.S. in the sixties, despite a substantial increase in their social and material status.
Several sociological and social psychological theories have been applied to account for these findings. Michalos (1980, 1983, 1985) mentioned the following theories used in quality-of-life studies: theories of cognitive dissonance, aspiration-level theories, social comparison theories, need theories, (social) learning theories, expected-value theo- ties, and equity theories. These theories explain satisfaction as a function of the perceived or existing discrepancy between the present situation and the situation(s) with which the individual compares his/her present situation. The comparison standards most often used by subjects are: expectations from the past, future expectations, aspira- tions, the perceived situation of others, needs, personal experiences in the past, and personal values.
Studies which use the discrepancy between the present and an expected situation to explain feelings of (dis)satisfaction include the studies from Stouffer et al. (1949) and several studies by Festinger (1957). However, studies from Campbell et al. (1976) and Michalos (1983, 1985) have shown that the discrepancy between what one expects and what one has is not always useful in explaining feelings of satisfaction.
The discrepancy between the situation one aspires to and the present situation is one of the most influential factors in determining safisfac-

WELL-BEING OF DUTCH STUDENTS 9
tion. In several studies the importance of the goal-achievement gap has been confirmed, Michalos (1983) mentions 24 publications in which the goal-achievement gap was confirmed for different domains of life; see also the studies from Andrews and Withey (1976) and Campbell et al. (1976). Outside the quality-of-life realm several studies have also confirmed the goal-achievement gap hypothesis (Hyman, 1968, Patchen, 1968, 1976, Thibaut and Kelley, 1976, Atkinson and Feather, 1966, Crosby, 1982).
The influence of the discrepancy between the present situation and the situation of significant others on satisfaction has been studied by Campbell et al. (1976), Andrews and Withey (1976), Emmons and Diener (1985) and Michalos (1980, 1982, 1983). The social com- parison hypothesis has also been confirmed by studies in the relative deprivation realm (Crosby, 1982; Runciman, 1966; Patchen, 1961, 1968 and Pettigrew, 1968).
Studies stressing the discrepancy between what one has and what one needs as a determinant of the feelings of satisfaction have been made by Andrews and Withey (1976) and Michalos (1980, 1982, 1983 and 1985).
From several studies (Campbell et al., 1976; Michalos, 1980, 1982, 1983, 1985; Patchen, 1961, 1968; Runciman, 1968; Crosby, 1982; Austin, 1977) it can be inferred that people use more than one standard with which to compare their present situation.
Most of these studies are not systematically set up, however, so that results can hardly be compared. Campbell et al. (1976) and Michalos (1985) used an integrated model in which several discrepancy measures were applied to account for the feelings of satisfaction.
The integrated model starts from the assumption that satisfaction is influenced primarily by the discrepancy between the present situation and the situation to which one aspires; the aspiration-achievement gap is influenced by other discrepancies, such as the discrepancy between the present situation and the situation of significant others, the situation one deserves, the situation one needs, the best situation until now.
In one study Michalos (1980) tested this hierarchical model against a concurrent model in which satisfaction was predicted directly from the discrepancies, using measures for satisfaction, the goal-achievement gap, situation of others and best situation until now. In all twelve

10 R. V E R M U N T ET AL.
domains the results showed that the hierarchical model had the highest Beta-weights between aspiration and satisfaction. And the Beta-weights between the other discrepancies and the aspiration discrepancy were higher than the Beta-weights between these same discrepancies and satisfaction. The results of the path-analysis confirmed the superiority of the hierarchical model over the concurrent model.
Because of the need for a more complex model, in which more than one or two factors are used to explain satisfaction and happiness, MDT was developed (Michalos, 1985). MDT consists of six basic hypotheses:
1. Satisfaction (from self-reports) is a function of the perceived dis- crepancy between what one has and: -- what one aspires to, -- what relevant others have, - - the best situation one has had in the past, -- what one expected three years ago to have now, -- what one expects to have in the future (over five years), - - what one deserves, - - what one needs.
2. All perceived discrepancies, except the discrepancy between what one has and what one aspires to are a function of objectively measurable discrepancies, which may have a direct influence on satisfaction and behavior.
3. The perceived discrepancy between what one has and what one aspires to is a mediating variable between all other discrepancies and satisfaction.
4. The urge to get and/or to maintain satisfaction motivates human behavior in direct proportion to the perceived, expected levels of satisfaction.
5. All perceived discrepancies, satisfaction and behavior are influenced directly and indirectly by age, educational level, ethnicity, income, self-esteem and social support (the so-called conditioners).
6. Objectively measurable discrepancies are influenced by human behavior and the conditioners.
The six basic hypotheses had not been used in one study, but had been confirmed in several different studies. It was Michalos (1985) who tested the relative salience and the mutual relationships of the different
W E L L - B E I N G OF D U T C H STUDENTS 11
gap-theoretical explanations of satisfaction. In general, the results of Michalos' study are in agreement with the basic hypotheses of MDT. However the relative salience of the comparison standards may vary among categories of people and cultures.
The aim of the present study is to try to show that MDT can be applied to explain satisfaction of people in another culture (Dutch), and to identify the relative salience of the comparison standards.
2. M E T H O D
To test relevant portions of MDT a questionnaire, originally developed by Michalos, was translated into Dutch, complemented with some questions, and delivered to a group of students at Leiden University.
2.1. The Questionnaire
2.1.1. Personal characteristics. The questionnaire started with questions about sex, age, income, education and ethnicity of the subjects: moder- ator variables in MDT.
Income was measured by asking subjects whether they have paid activities outside their study and if so, for how many hours a week they perform these activities. In the Dutch system of financing, students who have a job outside their study do not necessarily have a higher income than students who do not have a job outside their study. Moreover improving or complementing their financial situation need not be the only and/or most important reason for having a paid job: students may have a paid job because of interest in the job, because they want to increase working experience or because of some intrinsic reward from the job. For these reasons we deviated from the original measurement of income by Michalos.
Educational level was measured by asking students first how long they had been studying at Leiden University and second their major course of study. For the last question the alternatives were: Faculty of Medicine, Faculty of Arts, Faculty of Law, Faculty of Social Sciences and Faculty of Natural Sciences. In the course of gathering the data it turned out that only students of the Faculty of Social Sciences and Faculty of Arts had the opportunity to fill out the questionnaire.

12 R. V E R M U N T E T A L.
Therefore we divided the students in terms of their faculty as well as in terms of their subfaculty (Psychology, Political Science).
Ethnicity was measured by asking respondents their country of birth. This question and others were of interest only for cross-cultural com- parison and were omitted from our analyses. The conditioner variables 'self-esteem' and 'social support' were not operationalized in the present study.
2.1.2. Satisfaction and happiness. The next part of the questionnaire consisted of questions concerning the evaluation of the present life in terms of satisfaction/dissatisfaction. (Dis)satisfaction was asked for 12 domains of life and for life-as-a-whole. Evaluation of the present life of the respondents in terms of happiness was only measured for life-as- a-whole.
To measure the feelings of satisfaction and happiness of respondents with their present situation, 7-point rating scales were used. The rating scales ran from 'a strong negative evaluation of the present situation'(l) to 'a strong positive evaluation of the present situation'(7). The scale also contained an off-scale category, called 'no opinion'(8) for respond- ents who didn't know the answer, for whom the answer was not applicable, who had no opinion about the subject matter, etc.
The evaluation of life-as-a-whole concerned an overall evaluation of the present life of the respondents. The evaluation with different aspects of life concerned the domains of health, money, family-rela- tions, paid job, friendship, housing, partner, leisure time, ideology, self-esteem, transportation and education.
Evaluation of life-as-a-whole and of the 12 domains of life in terms of satisfaction was measured twice, first in terms of (dis)satisfaction. The question asked was: 'How satisfied or dissatisfied are you with the following aspects of life/or life-as-a-whole'? The rating scale ran from (1)'terrible' to (7)'delighted' (Andrews and Withey, 1976; Campbell et al., 1976). The second measure was in terms of discontent. The question asked was: 'Did you during the last year experience feelings of discontent very often, or not often for the following aspects/life- as-a-whole'? The scale ran from (1)'nearly never discontent' to (7)'very often discontent' (Crosby, 1982). To avoid interference with the
WELL-BEING OF DUTCH STUDENTS 13
original scale the discontent-measure was positioned at the end of the questionnaire.
Evaluation of life-as-a-whole in terms of happiness was measured with one question: 'Do you evaluate your life-as-a-whole as very unhappy/very happy?
The perceived discrepancies between the present situation of the respondents and the comparison situations were also measured directly with a 7 point rating scale and an 'off-scale' category (8). The dis- crepancies were measured for each of the twelve domains and for life- as-a-whole.
The first discrepancy was the one between the present situation and the situation one aspires to. The question was: 'Does your present life correspond not at all (1) or does it correspond completely with life you wish'(7)?
The next discrepancy concerned the one between the present situa- tion and the situation of an average person of the same age and sex. The question was: 'Is your present life, compared with the life others lead far below average (1) or far above average (7)?
In the same way the discrepancies between the present life and (3) the life one is entitled to, (4) the life one needs, (5) the life one expected three years ago, (6) the life one expects in 5 years, and (7) the best experiences up till now, were measured.
The last page of the questionnaire consisted of bipolair adjectives (Osgood et al., 1957) measuring the connotative meaning of life. The adjectives were: pleasant-unpleasant, bound-unbound, fast-slow, dull- fascinating, full-empty, calm-excited, meaningsless-meaningful, limited- unlimited, dynamic-static, complete-incomplete, monotonous-varied, gives me hardly any chance-gives me all possible chances.
2.2. The Pretest
After the questionnaire was prepared a pretest was conducted. The main aim of the pretest was to ascertain that the concepts, construction of sentences and descriptions of concepts used in the questionnaire were comprehended by respondents. Five students, representatives of the population from which the sample was drawn, were asked to fill out

14 R. V E R M U N T ET AL.
the questionnaire and to answer some questions about the questionnaire. The main comments concerned the descriptions of terms in the instruc- tion part of the questionnaire. Some descriptions were changed based on the comments. The questions and introductions for answering the questions produced no problems.
2.3. Questionnaire Administration
The questionnaire was delivered to three groups during class meetings. The first group involved political science students, the second group students of the arts and the third group psychology students. For all the groups the same procedure was applied. Students who participated were asked to sit next to each other with one chair in between.
In a short introduction the experimenter explained the purpose of the study and relevance of the topic, and told the respondents to read carefully the instructions before starting to answer the questions. In the meantime two assistants delivered the questionnaire to the respondents. The students then completed the questions.
The two assistants went to the exit door of the classroom where they received the filled-out questionnaires.
3. R E S U L T S
3.1. Sample Results
The realised sample consists of 377, mostly Dutch students (97%), 46% male and 54% female; two respondents did not answer this question. Age of respondents ranged from 18 to 55 years; 14% (52 respondents) were 18 years old; 32% (121) were 19 years old; 16% (60) were 20 years old; 13% (50) were 21 years old and 24% (90) were older than 21. Three respondents were of unknown age. 88% (331) of the respondents were not married; 68% (256) had no paid job, 12% (44) worked one day a week and 3% worked more than 5 days a week (probably evening students), 66 students did not answer this question. 83% (311) of the students were studying one year or less at Leiden University, 17% (63) longer than one year; 3 respondents did not answer this question. 39% of the respondents were Political Science

WELL-BEING OF DUTCH STUDENTS 15
students, 36% students of the faculty of Arts and 25% Psychology students.
3.2. Demographic Variables
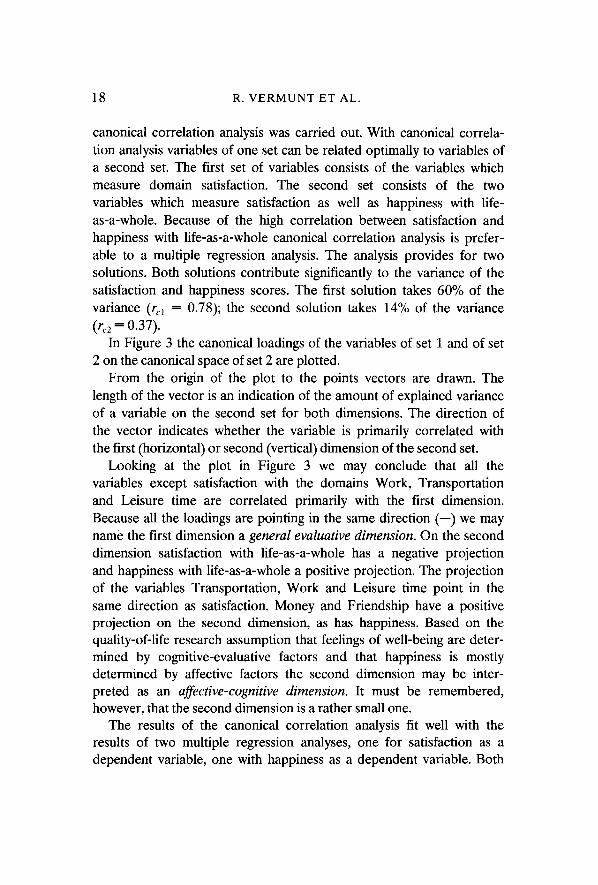
The relationships among the demographic variables has been studied with HOMALS: A Homogeneity-analysis with Alternating Least Squares (Girl, 1983). A homogeneity-analysis is an application of principal components analysis on nominal variables. Two (or more) variables are said to be related as respondents in one category of a variable all (or almost all) are in a category of a second variable. Categories of variables are placed as points in n-dimensional space and the 'distance' between category-points is an indication of the relation- ship between the categories. This is described as quantifying the categories. The dimensions in space cannot be interpreted as linear combinations of variables: it concerns the analysis of nominal variables. A plot of category quantirlcations of the variables, gives an indication of the relationship between variables.
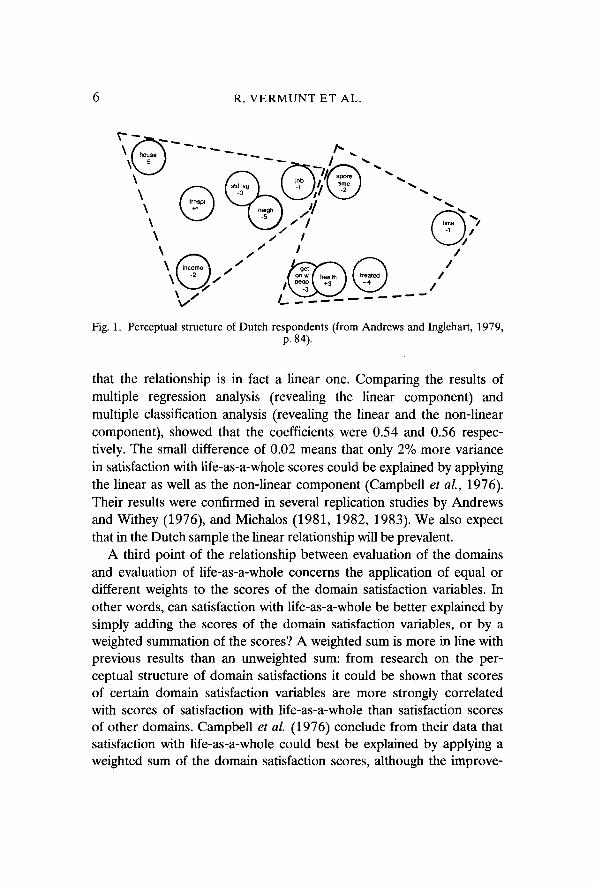
In Figure 2 category quantifications of the variables Sex, Age, Work, and Faculty are presented.
Figure 2 shows for example that Faculty and Sex are related. More female than male students are studying Psychology (and Arts): more male than female students are studying Political Science: The category- point female lies rather close to the category-point Psychology; the category-point male lies close to the category-point Political Science. Together with x 2 values between variables, Figure 2 gives a straight- forward overview of the (non-linear) relationships among nominal variables.
3.3. Domain Satisfaction and Satisfaction with Life-As-A-Whole
In the evaluation of the domains of life and life-as-a-whole respondents showed a positive bias. The majority of respondents scored in the categories 5, 6 or 7. The categories 1, 2 and 3 have very small frequencies. Therefore the values of the categories are recoded: the scales run from unsatisfied (1), to neutral (2), satisfied (3), very satisfied (4) and delighted (5). The variable mean has been substituted for a

16 R. V E R M U N T E T A L .
2.00
1.0
- 1 . 0
- 1.0
.k ~< -/.
k k
k k "/-
r
~ ~
~ i > [ ' - ~
. "
0 1.0 2.0
0 0 0 Sex - - Age + + + Kind of job - - - - Faculty
Fig. 2. Category quantifications for the variables sex, age, kind of job, faculty.
score o f 8 (no opinion) . The m e a n sat isfact ion-score with life-as-a- w h o l e shows that respondents are rather satisfied with their lives ( m s =
3.14; s.d. -- 0 .958 , m o d u s = 3; n -- 372) . The happiness scores s h o w an even m o r e posit ive picture ( m h ~ 3.21; s.d. = 1.04; m o d u s --- 4; n = 376). The m e a n sat is fact ion-scores of the 12 domains are posit ive too. R e s p o n d e n t s are mos t satisfied with Heal th and Partner (m ---- 3.6) and least satisfied with W o r k ( m ---- 2.6) and Transportat ion ( m = 2.7).
The s.d.'s o f satisfaction scores of the domains are nearly similar,
W E L L - B E I N G OF D U T C H S T U D E N T S 17
except for Partner. This means that respondents do not differ much from each other in their evaluations of the several aspects of their fives.
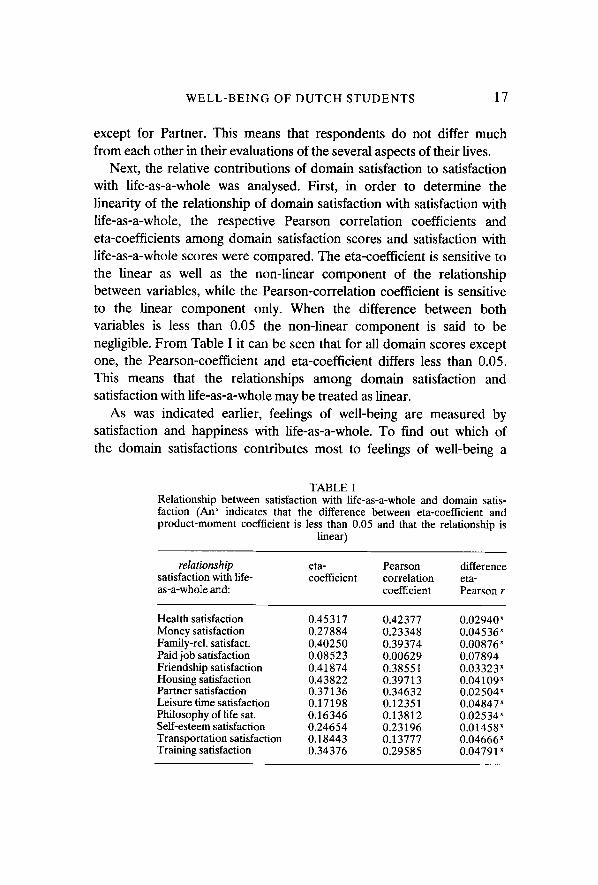
Next, the relative contributions of domain satisfaction to satisfaction with life-as-a-whole was analysed. First, in order to determine the linearity of the relationship of domain satisfaction with satisfaction with fife-as-a-whole, the respective Pearson correlation coefficients and eta-coefficients among domain satisfaction scores and satisfaction with life-as-a-whole scores were compared. The eta-coefficient is sensitive to the linear as well as the non-linear component of the relationship between variables, while the Pearson-correlation coefficient is sensitive to the linear component only. When the difference between both variables is less than 0.05 the non-linear component is said to be negligible. From Table I it can be seen that for all domain scores except one, the Pearson-coefficient and eta-coefficient differs less than 0.05. This means that the relationships among domain satisfaction and satisfaction with fife-as-a-whole may be treated as linear.
As was indicated earlier, feelings of well-being are measured by satisfaction and happiness with life-as-a-whole. To find out which of the domain satisfactions contributes most to feelings of well-being a
TABLE I Relationship between satisfaction with life-as-a-whole and domain satis- faction (An ~ indicates that the difference between eta-coefficient and product-moment coefficient is less than 0.05 and that the relationship is
linear)
relationship eta- Pearson difference satisfaction with life- coefficient correlation eta- as-a-whole and: coefficient Pearson r
Health satisfaction 0.45317 0.42377 0.02940 x Money satisfaction 0.27884 0.23348 0.04536 x Family-rel. satisfact. 0.40250 0.39374 0.00876 Paid job satisfaction 0.08523 0.00629 0.07894 Friendship satisfaction 0.41874 0.38551 0.03323 x Housing satisfaction 0.43822 0.39713 0.04109 x Partner satisfaction 0.37136 0.34632 0.02504 x Leisure time satisfaction 0.17198 0.12351 0.04847 x Philosophy of life sat. 0.16346 0.13812 0.02534 x Self-esteem satisfaction 0.24654 0.23196 0.01458 x Transportation satisfaction 0.18443 0.13777 0.04666 x Training satisfaction 0.34376 0.29585 0.04791 x
18 R. V E R M U N T ET AL.
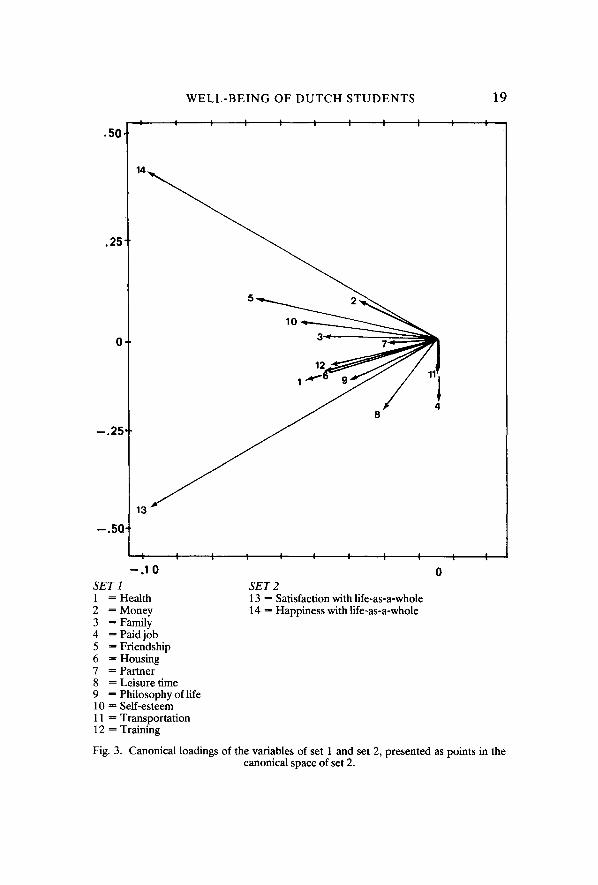
canonical correlation analysis was carried out. With canonical correla- tion analysis variables of one set can be related optimally to variables of a second set. The first set of variables consists of the variables which measure domain satisfaction. The second set consists of the two variables which measure satisfaction as well as happiness with life- as-a-whole. Because of the high correlation between satisfaction and happiness with life-as-a-whole canonical correlation analysis is prefer- able to a multiple regression analysis. The analysis provides for two solutions. Both solutions contribute significantly to the variance of the satisfaction and happiness scores. The first solution takes 60% of the variance (rc1 -- 0.78); the second solution takes 14% of the variance (re2---- 0.37).
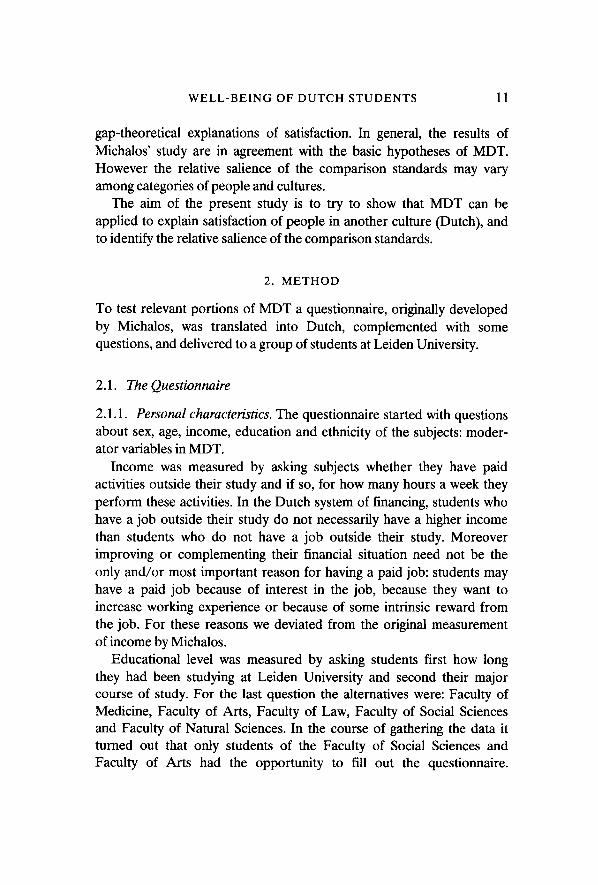
In Figure 3 the canonical loadings of the variables of set 1 and of set 2 on the canonical space of set 2 are plotted.
From the origin of the plot to the points vectors are drawn. The length of the vector is an indication of the amount of explained variance of a variable on the second set for both dimensions. The direction of the vector indicates whether the variable is primarily correlated with the first (horizontal) or second (vertical) dimension of the second set.
Looking at the plot in Figure 3 we may conclude that all the variables except satisfaction with the domains Work, Transportation and Leisure time are correlated primarily with the first dimension. Because all the loadings are pointing in the same direction (--) we may name the first dimension a general evaluative dimension. On the second dimension satisfaction with life-as-a-whole has a negative projection and happiness with life-as-a-whole a positive projection. The projection of the variables Transportation, Work and Leisure time point in the same direction as satisfaction. Money and Friendship have a positive projection on the second dimension, as has happiness. Based on the quality-of-life research assumption that feelings of well-being are deter- mined by cognitive-evaluative factors and that happiness is mostly determined by affective factors the second dimension may be inter- preted as an affective-cognitive dimension. It must be remembered, however, that the second dimension is a rather small one.
The results of the canonical correlation analysis fit well with the results of two multiple regression analyses, one for satisfaction as a dependent variable, one with happiness as a dependent variable. Both
W E L L - B E I N G O F D U T C H S T U D E N T S 19
.50,
.25
0 '
- . 2 5 ~
- - . 50 -
t t - . I 0
S E T 1 1 = Health 2 = Money 3 = Family 4 = Paid job 5 = Friendship 6 = Housing 7 = Partner 8 = Leisure time 9 = Philosophy of life 10 = Self-esteem 11 = Transportation 12 = Training
-- ; ; i I ! I I I I i i
14
5 2
12 1
13 ~ 8 )r 4
| i i i i I I I I
S E T 2 13 = Satisfaction with life-as-a-whole 14 = Happiness with life-as-a-whole
Fig. 3. Canonical loadings of the variables of set 1 and set 2, presented as points in the canonical space of set 2.

20 R. VERMUNT ET AL.
types of analyses indicate that satisfaction with Friendship contributes most to overall satisfaction and happiness.
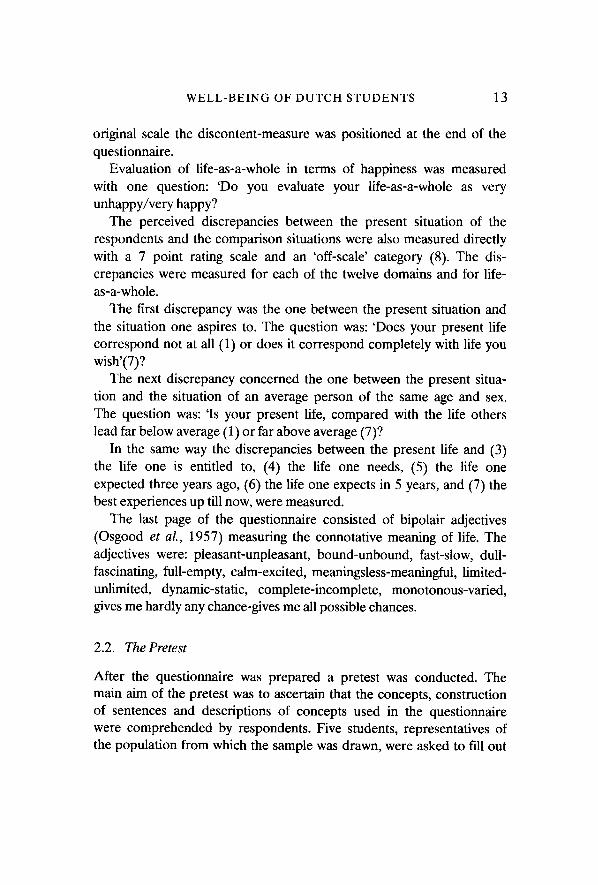
The cognitive structure of satisfaction with the 12 domains of life and satisfaction with life-as-a-whole will be analysed by means of principal components analysis by alternating least squares (Princals; Girl, 1983). Princals is an extension of classical principal component analysis, in that, in the same analysis, nominal, ordinal as well as interval data can be handled. Princals needs fewer dimensions to reach a good fit than classical analysis, and a plot of the component loadings of the variables in two-dimensional space can be shown, as is done in Figure 4. The length of a vector gives an indication of the amount of the explained variance of a variable and the angle between vectors of the same length is an indication of the relationship between variables.
The first dimension explains 25% of the variance, the second dimen- sion 12%. The first (horizontal) dimension is mostly characterised by satisfaction with life-as-a-whole, Friendship, Self-esteem, Leisure time, all things of immaterial nature over which we have some control. Lowest loadings on this dimension are the domains Work, Transporta- tion and Money, material things over which we have far less control. The first group of variables lies a small psychological distance from the person, the second group a rather great psychological distance. On the second dimension the material demands of life have positive loadings, while the immaterial domains have negative loadings. Figure 4 shows also that the material domains of life have a strong mutual relationship. The immaterial aspects of life are related strongly too, while both groups of domains have hardly any relationship.
3.4. The Comparison Standards and Satisfaction with Life-As-A-Whole
The second approach of quality-of-life research is concerned with the processes which underly satisfaction and happiness with the domains and with life-as-a-whole. In MDT seven standards of comparison are used, each of which explains a part of the variance of the satisfaction scores. The aim of this section is to show which standard of comparison has the most important contribution in explaining satisfaction with the domains and with life-as-a-whole.

W E L L - B E I N G O F D U T C H S T U D E N T S 21
.50
- . 2 5
~.. ' : : ', I i I I I I 11
2~ 4
6
12
13
10
I ~ I 5 1 I I I I I I I
- - . 7 5 - - . 5 0 - - . 2 5 0
1 = Health; 2 = Money; 3 = Family; 4 = Paid job; 5 = Friendship; 6 = Housing; 7 = Partner; 8 = Leisure time; 9 = Philosophy of life; 10 = Self-esteem; 11 = Transportation; 12 = Training; 13 = Satisfaction with life-as-a-whole.
Fig. 4. Plot of the component loadings of the variables in the first and second dimension of the three-dimensional Princals-solution.
From the theoretical introduction, MDT assumes that the perceived discrepancies between the present situation and the ones compared with it are responsible for the amount of satisfaction. The compared situations are:

22 R. V E R M U N T E T AL.
- - the situation one aspires to (Aspiration) - - the (perceived) situation of others (Other) - - the situation one needs (Need) - - the situation one expected in the (Past)
past to have now - - the situation one expects to have in (Future)
the future - - the best situation until now (Best) - - the situation one deserves (Deserving).
The (recoded) scale runs from 1: worse, to 5: much better. In Table II the mean discrepancy scores of the seven situations for
the twelve domains and for life-as-a-whole are presented. Respondents perceive the smallest discrepancy between their situation and the situation they aspire to have. They perceive the greatest discrepancy between their situation and the situation they need. The greatest discrepancy has been experienced between their present situation and the situation they need for the domain Work. Overall the discrepancies are rather small.
To determine the contributions of each of the discrepancies to scores
TABLE II Mean discrepancy scores of the twelve domains of life and of life-as-a-whole for seven
comparison standards. (The higher the score the smaller the discrepancy.)
DOMAIN Aspiration Other Deserving Need Past Future Best Mean
Health 4.0 2.8 2.1 1.9 2.1 2.0 1.8 2.4 Money 3.0 2.4 2.2 1.8 2.1 2.2 2.0 2.2 Family 3.8 2.8 2.1 2.0 2.1 2.0 2.0 2.4 Paid job 2.6 2.1 2.0 1.6 1.8 2.4 1.9 2.1 Friendship 3.8 2.7 2.1 1.8 2.3 2.0 2.2 2.4 Housing 3.1 2.7 2.2 1.9 2.1 2.2 2.0 2.3 Partner 3.5 3.0 2.2 1.8 2.4 2.2 2.3 2.5 Leisure time 3.5 2.7 2.2 1.9 2.1 2.1 2.1 2.4 Philosophy of life 4.0 3.1 2.2 2.0 2.4 2.1 2.3 2.6 Self-esteem 3.5 2.6 2.0 1.8 2.3 2.0 2.2 2.3 Transportation 3.1 2.3 2.1 1.8 1.9 2.2 2.0 2.2 Training 3.7 3.4 2.3 1.9 2.5 2.2 2.5 2.6
Mean scores 3.5 2.7 2.1 1.8 2.2 2.1 2.1 2.4
Life-as-a-whole 3.5 3.0 2.1 1.8 2.3 2.0 2.2 2.4

WELL-BEING OF DUTCH STUDENTS 23
of satisfaction with each of the domains and with life-as-a-whole, multiple regression analyses were carried out.
In Table III the standardised beta-weights are presented, which are significant at the 5% level and which in absolute terms are greater than 0.05.
It may be seen from Table III that the perceived discrepancy between the present situation and the situation one aspires to con- tributes most to the satisfaction scores. Except for the domain Partner all the standardized beta-weights of Aspiration are greater than the beta-weights of each of the other discrepancies.
Because the "goal-achievement-gap" makes the most important contribution to the scores on the satisfaction variables and because the "goal-achievement-gap" is relatively small (Table II), the high satisfaction scores reported earlier can be explained. The second most important contributor to the satisfaction scores is the discrepancy between the present situation and the (perceived) situation of others. Other im- portant contributors to satisfaction are the discrepancy between the present situation and the situation one needs, and the discrepancy between the situation one expected in the past to have now. The contribution of the other discrepancies: Deserving, Future and Best are negligible. Table III shows also that respondents use on the average three or four comparison standards at the same time to evaluate the domains of life. For the evaluation of life-as-a-whole respondents use on the average five comparison standards. These results are in agree- ment with the first basic hypothesis of MDT. To test the basic hypothe- sis that Aspiration is an intermediate variable between the other discrepancies, and satisfaction with the domains and with life-as-a- whole, a second group of multiple regression analyses was carried out. In these analyses the dependent variable is the discrepancy between the present situation and the situation one aspires to. From Tables III and IV it can be inferred that the standard beta-weights between the discrepancies and Aspiration (Table IV) are greater than the respective beta weights between the discrepancies and the satisfactions (Table III). This result forms a strong indication that Aspiration is indeed a mediating variable between satisfaction and the other discrepancies.
As one can see from Table III, MDT fits best for the domains Transportation and Housing. For both domains more than 62% of the

to
TA
BL
E
III
Bet
a w
eig
hts
b
etw
een
d
iscr
epan
cy
sco
res
of
the
com
par
iso
n
stan
dar
ds
wit
h
do
mai
n
sati
sfac
tio
n
and
sa
tisf
acti
on
/hap
pin
ess
wit
h
life
-as-
a-w
ho
le
as d
epen
den
t v
aria
ble
s
Sat
isfa
ctio
n
Asp
irat
ion
O
ther
D
eser
vin
g
Nee
d
Pas
t F
utu
re
Bes
t R
2
wit
h
X~
<
Hea
lth
0
.56
92
0
.20
32
.
..
.
0.0
97
4
Mo
ney
0
.43
56
0
.16
41
--
0
.22
92
0
.11
59
--
--
F
amil
y
0.4
77
2
0.2
93
9
--
--
0.1
38
3
--
--
Pai
d j
ob
0
.29
31
0
.23
73
--
0
.09
31
--
--
0
.16
15
F
rien
dsh
ip
0.4
62
6
0.1
99
7
--
0.1
22
9
0.1
37
1
--
--
Ho
usi
ng
0
.50
71
0
.18
66
--
0
.16
94
0
.12
62
--
--
Par
tner
0
.27
05
0
.38
64
--
--
0
.07
83
--
--
L
eisu
re
tim
e 0
.51
67
0
.20
43
.
..
.
0.0
79
7
0.0
90
3
Phi
l. o
f li
fe
0.4
49
4
0.2
18
0
--
0.0
79
3
0.1
54
6
--
--
Sel
f-es
teem
0
.42
39
0
.31
51
--
0
.08
68
--
--
--
Tra
nsp
ort
atio
n
0.5
17
7
0.1
84
1
--
0.1
00
6
0.1
24
8
--
--
Tra
inin
g
0.5
47
5
0.2
06
8
--
--
0.1
14
3
--
--
Lif
e as
-a-w
ho
le
0.4
82
9
0.1
89
9
0.0
98
2
--
0.1
17
0
--
--
Hap
pin
ess
0.3
67
0
0.2
00
5
0.0
86
3
0.1
70
9
0.1
42
4
--
--
0.6
04
78
0
.58
61
3
0.5
94
43
0
.32
46
4
0.5
95
66
0
.62
35
1
0.5
28
05
0.5
49
68
0
.47
56
7
0.5
74
98
0
.62
50
7
0.5
53
27
0
.50
13
8
0.4
75
38
;Z
,-]
>

W E L L - B E I N G O F D U T C H S T U D E N T S 2 5
T A B L E I V
Beta weights between Aspiration discrepancy as dependent variable and the six discrepancies as independent variables.
Aspiration Other Deserving Need Past Future Best R 2
discrepancy concerning
Health 0 . 3 1 2 7 - - 0 . 3 4 8 5 0 . 1 5 1 9 - - - - 0 . 4 1 7 7 3
Money 0 . 3 1 1 5 - - 0 . 2 6 1 6 0 . 1 6 8 3 - - - - 0 . 3 8 5 6 4
F a m i l y 0 . 3 5 7 0 - - 0 . 4 3 4 7 0 . 0 8 8 7 - - - - 0 . 4 3 4 1 2
P a i d j o b 0 . 1 3 0 2 0 . 1 3 0 3 0 . 3 8 5 0 - - - - - - 0 . 3 1 4 2 4
Friendship 0 . 4 0 7 1 - - 0 . 3 1 3 1 0 . 1 0 9 4 - - - - 0 . 4 9 1 8 3
Housing 0 . 3 5 5 8 - - 0 . 2 3 8 3 - - - - - - 0 . 3 2 3 7 7
Partner 0 . 4 8 5 2 - - 0 . 1 9 0 9 0 . 1 2 0 2 - - - - 0 . 5 9 8 3 7
Leisure time 0 . 4 5 1 2 - - 0 . 1 2 3 7 - - - - 0 . 1 0 0 3 0 . 3 8 6 2 9
P h i l . o f l i f e 0 . 3 1 6 2 - - 0 . 2 5 5 2 - - - - - - 0 . 2 2 8 7 6
Self-esteem 0 . 4 0 8 7 - - 0 . 1 3 5 2 0 . 1 1 0 3 - - - - 0 . 3 6 1 2 1
Transportation 0 . 2 5 3 6 - - 0 . 2 1 9 4 0 . 2 0 9 5 - - - - 0 . 3 6 3 5 4
Training 0 . 2 9 0 5 - - 0 . 2 1 3 6 0 . 1 7 5 2 - - 0 . 1 4 5 3 0 . 3 4 2 4 3
L i f e a s - a - w h o l e 0 . 2 3 3 3 - - 0 . 2 9 4 6 - - - - 0 . 0 9 7 4 0 . 2 7 5 8 4
variance in the satisfaction scores can be explained. The smallest fit is for the domains Work (32.5%) and Philosophy of life (47.6%). The discrepancies explain all-together 50% of the variance of satisfaction with life-as-a-whole.
Although demographic variables have only a small influence on satisfaction with life-as-a-whole, the results of multiple regression analyses between discrepancies and satisfaction with life-as-a-whole are different for male and female respondents. Male respondents use on the average 4 and female respondents use on the average 3 discrepancies to evaluate life-as-a-whole. The discrepancy between their present situa- tion and the situation which they deserve is more important for male than female respondents. The discrepancy between their present situa- tion and the situation they need is more important for female than male respondents.
3.5. Auxiliary Results
The foregoing analyses have been carried out with satisfaction with life-as-a-whole or with domain satisfactions as dependent variables. Based on research on relative deprivation (Crosby, 1982), in the
26 R. VERMUNT ET AL.
present study we have also used another kind of operationalisation of well-being, i.e., discontent (grievance). The subjects were asked to indicate how many times during the last year they have experienced discontent in each domain, as well as with life-as-a-whole. The results indicate that the order of the domains in explaining variance in reported satisfaction is the same as the order of the domains in explaining variance in reported discontent. But the amount of variance explained by taking discontent as the measure of well-being is 10% higher than by taking satisfaction as the measure of well-being.
4. DISCUSSION
4.1. Sampling, Reliability and Validity
The respondents cooperating in the present study were students at Leiden University, with main courses (faculties) in Arts and Social Sciences. The respondents were not drawn at random from the total population of freshmen. With respect to age, sex, and activities outside their study we are, on good grounds, convinced that the group of respondents does not deviate much from the total population of freshmen at Leiden University.
The reliability and validity of the applied measures was investigated in other studies. In Atkinson (1982) results from a large number of reliability-analysis studies are compared. The mean alpha-coefficient of the applied measures of the Delighted-Terrible-scale was 0.70 (Atkinson, 1982, p. 115). Besides the satisfaction data, Atkinson reported data from the objective situation of the respondents on the twelve domains on two different occasions. The differences in satisfac- tion were related to differences in objective situation. From the test- retest data it could be inferred that the test-retest coefficient was significantly higher for respondents without change in their objective situation compared with respondents who experienced large changes in their objective situation. These differences in test-retest coefficients may be conceived as an indication of the reliability of the satisfaction scales. The D-T-scale, which was applied in the present study with only a small modification, turned out to be the most valid measurement of satisfac- tion with life-as-a-whole and with aspects of life (Andrews and Withey,

WELL-BEING OF DUTCH STUDENTS 27
1976). One must be careful, however. In a recent study, Schwarz et al. (1987) could show that satisfaction with life-as-a-whole was influenced by mood, while satisfaction with aspects of life was not.
Reliability data for the discrepancy measures are not reported in the literature. In order to achieve reliability scores for discrepancy measures a test-retest method should be applied too. Validity scores for the discrepancy measures could be achieved by asking respondents their evaluation of the present situation and (independently) their evaluation of the situation they desire, they are entitled to, etc., and relate the difference data with data in which the difference is explicitly asked (as is done in the present study). In order to avoid errors due to fatique symptoms etc. a quasi-experimental design could be applied.
Because of the fact that in the present study an accurate translation of the English version of the questionnaire has been made, the above mentioned information about reliability and validity may be applied to the data of the present questionnaire.
4.2. Satisfaction and the Domains of Life
Respondents are more often satisfied than dissatisfied with their life and with important aspects of it. The mean satisfaction scores on the (recoded) 5-point scale are not below the value of 2.5. The value of these findings can only be settled by comparing them with answers of respondents in other cultures/countries. Such a comparison is beyond the scope of the present study. Satisfaction scores at the twelve domains matches rather well with the overall satisfaction score. Evaluation of life-as-a-whole in terms of satisfaction and happiness is almost identical to the mean evaluation of the twelve domains.
Satisfaction scores, however, are not the same for the twelve domains. Respondents are most satisfied with their Health, Partner, Friendship and Philosophy of life. In other words, the students are most satisfied with those aspects of life which encompass the smallest circle of their social environment and with the least obligations society poses on them.
Respondents are less satisfied with those aspects of life like uni- versity Training, Family relations, Leisure time activities, Housing and Self-esteem. Those are aspects of life which reflect societal obligations,
28 R. V E R M U N T E T AL.
a strong feeling of responsibility and competition. Respondents are least satisfied with life domains like Money, Paid job, and Transportation. These are aspects of life which confront the respondents with their deprived situation and with discomfort in their life.
The mean satisfaction scores for the domains reflect fairly well the objective situation of respondents. We have no objective information, but it is rather well-known that the jobs students do have a lot of inconveniences and that reward is low. Most students have no car and have to rely on public transport, which is often inconvenient and rather expensive. Their income is low, housing is expensive, and expenditures which were low in the past have increased sharply, such as expenditures for participating in sports, buying books, etc. The main reason for the rise in costs is the decrease in financial support from the government for sports, books, etc.
On the other hand, most students are healthy, have friends and some have a partner. The discomforts of student life are compensated for by satisfactory intimate relationships.
The bivariate relationships between each of the domain satisfaction variables and the life-as-a-whole satisfaction variable is a linear one, except for the relationship between satisfaction with Paid job and life- as-a-whole. The difference between the Pearson correlation coefficient and eta coefficient is more than 0.05, which is an indication of a non-linear relationship. A difference of 0.08, however, is not a big difference, so that we, overall, may speak of a linear relationship between domain variables and the life-as-a-whole variable. It should be added that scores on satisfaction with Paid job does not correlate with scores on satisfaction with life-as-a-whole, nor with happiness.
In agreement with earlier findings (Campbell et al., 1976; Headey, 1981; Michalos, 1980, Andrews and Withey, 1976) we have shown that the weighted linear-additive model explains more variance than the unweighted linear model, 50% against 32%. The difference of 18% is much greater than the 5% Andrews and Withey (1976) found. The difference of 13% may be due to the greater homogeneity of our sample compared with Andrews and Withey's sample. In a homogenous sample the weights of the variables can be determined more accurately. Applying discontent as a measure of well-being instead of satisfaction increases the amount of explained variance 10%. This is not a small

WELL-BEING OF DUTCH STUDENTS 29
difference: It was assumed in the Introduction that asking respondents to indicate the times they experienced discomfort or grievance might more easily trigger a process of reflection and thinking about their present situation than the question about satisfaction. It is therefore advisable to explore the use of discontent as a measure of well-being in future studies.
From the results of the canonical analysis of the domain satisfaction variables with the variables satisfaction and happiness with life-as- a-whole, it can be inferred that the domain Friendship contributes most to the scores of well-being; Serf-esteem, Health, Family-relations, Housing, Education, Ideology, Money, Leisure-time expenditures, and Partner have a substantial but decreasing contribution to the scores of well-being. This finding has been corroborated by multiple regression using the domain satisfaction variables with satisfaction and happiness with life-as-a-whole.
From the canonical analysis it may also be inferred that satisfaction and happiness have a lot in common in predicting feelings of well- being, but they are also different. On the second dimension the loadings of satisfaction and happiness are opposites. The difference between satisfaction and happiness is confirmed by the results of multiple regression analyses. For example, the domain Money makes a greater contribution explaining scores of happiness than explaining scores of satisfaction. One may assume that happiness is determined more by momentary situations in the life of respondents than satisfaction. This aspect of happiness refers to the affective component of happiness. Trying to get more evidence for this interpretation, the variables happiness and satisfaction were related to bipolair adjectives. The hypothesis that happiness scores would correlate lower than satisfaction scores with scores on the Evaluation dimension was not confirmed. Happiness as well as satisfaction are both most strongly related to the pleasure-non-pleasure bipolair adjective. The fact that the present findings are in disagreement with earlier results (Emmons and Diener, 1985; Campbell, 1981; Andrews and Withey, 1976) may be due to the rather low validity of the semantic differential measure or to the (homogeneous) sample of respondents: most of the respondents per- ceived no difference between satisfaction and happiness in terms of the semantic dimensions.

30 R. V E R M U N T ET AL.
The perceptual or cognitive structure underlying satisfaction with the several domains may be summarized in three dimensions: a personal control (psychological distance) dimension, a materialistic--non- materialistic dimension and an interpersonal-mental dimension. The personal control dimension is the most important organizing principle respondents used to determine their feelings of satisfaction with the domains. Domains with relatively high personal control are Self-esteem, Family-relations, Friendships; domains with relatively low personal control are Money, Work and Transportation.
It is interesting to note that the above mentioned division in domains in terms of personal control or psychological distance fits well with previous findings (Andrews and Inglehart, 1979).
In previous research, however, the second and third dimensions, although not unimportant ones in terms of explained variance, could not be interpreted. The present research shows two relatively easily interpretable dimensions. Another difference concerns the position of the domains Partner, Family-relations and Health. In the present study Partner and Family-relations do not have a central position, while Health has no unique position, contrary to previous findings (Campbell et al., 1976; Andrews and Withey, 1976).
4.3. Satisfaction and Discrepancies
Within the second approach to explaining feelings of satisfaction, MDT is considered the most highly developed theory. The several 'gap'- theoretical explanations of satisfaction are integrated in one model. The model is based on six basic hypotheses, which constitute Multiple Discrepancies Theory. In the present study three basic hypotheses have been tested, 1, 3 and 5.
The discrepancies respondents have indicated are small for the several domains as well as for life-as-a-whole. The relatively biggest discrepancies have been indicated for the material aspects of Life, Money, Transportation and Paid job.
On the whole, it has been shown that the discrepancy between the present situation and the situation one strives for is the smallest one. The present situation of the respondents seems to correspond well with

WELL-BEING OF DUTCH STUDENTS 31
the situation they aspire to. The largest discrepancy has been experi- enced between the present situation and what they need. It is difficult to say whether these discrepancies reflect 'real' needs.
Data from the multiple regression analyses have shown, in agreement with the first hypothesis, that respondents 'used' on the average three or four comparison standards, with which they compare their present situation. The most important standard was the aspiration level. From a second multiple regression analysis could be inferred that the discrep- ancy between the present situation and the situation one aspires to is the intermediate variable between other standards and the satisfaction variable. These and related data are in agreement with the third hypoth- esis of MDT. There are, however, small deviations from the general pattern of findings. The influence of the best experience up to now as a standard for evaluation of the present situation is smaller than in Michalos' (1985) study. Past expectations and personal needs on the other hand are stronger determinants of the aspiration/achievement gap in the Dutch study than in the Canadian study.
4.4. Demographic Variables
It is interesting to note the difference between male and female respondents concerning the salience of entitlement- and need-discrep- ancies in explaining feelings of satisfaction. The discrepancy between the present situation and the situation they feel they are entitled to is relatively important for males, and the discrepancy between the present situation and the situation they need is relatively important for females.
One interpretation of this difference is offered by social justice research. Cohen (1987) observed that female subjects conceive of justice from the point of view of 'to care for', whereas male subjects have a strong tendency to conceive of justice in terms of rights and entitlements.
The influence of other demographic variables on perceived discrep- ancies and on feelings of satisfaction is small in the present study. The main factor accounting for this effect is, in our opinion, the homogeneity of the sample with respect to demographic variables, except, of course, sex.
32 R. VERMUNT ET AL.
BIBLIOGRAPHY
Abbey, A. and Andrews, F. M.: 1985, 'Modeling the psychological determinants of life quality', Social Indicators Research 16, 1--34.
Andrews, F. M. and Inglehart, R. F.: 1979, 'The structure of subjective well-being in nine western societies', Social Indicators Research 6, 73--90.
Andrews, F. M. and Withey, S. B.: 1976, Social Indicators of Well-Being, New York: Plenum Press.
Atkinson, J. W. and Feather, N. T. (eds.): 1966, A Theory of Achievement Motivation, New York: John Wiley & Sons, Inc.
Atkinson, T.: 1982, 'The stability and validity of quality of life measures', Social Indicators Research 10, 113--132.
Austin, W.: 1977, 'Equity theory and social comparison processes', in J. M. Suls and R. L. Miller (eds.), Social Comparison Processes; Theoretical and Empirical Perspec- tives, London: Hemisphere Publishing Company, 279--294.
Campbell, A.: 1981, The Sense of Well-Being in America, New York: McGraw-Hill. Campbell, A. and Converse, P. E.: 1972, 'Aspiration, satisfaction and fulfilment', in A.
Campbell and P. E. Converse (eds.), The Human Meaning of Social Change, New York: Russell Sage Foundation, 441--466.
Campbell, A., Converse, P. E., and Rodgers, W. L.: 1976, The Quality of American Life, New York: Russell Sage Foundation.
Cohen, R. (in press), 'Membership, intergroup relations and justice', in R. Vermunt and H. Steensma (eds.), Social Justice in Human Relations, New York: Plenum Press.
Crosby, F. J.: 1982, Relative Deprivation and Working Women, Oxford: Oxford University Press.
Davis, E. E., Fine-Davis, M., and Meehan, G.: 1982, 'Demographic determinants of perceived well-being in eight European countries', Social Indicators Research 10, 342--358.
Emmons, R. A. and Diener, E.: 1985, 'Factors predicting satisfaction judgements: A comparative examination', Social Indicators Research 16, 157-- 167.
Festinger, L.: 1957, A Theory of Cognitive Dissonance, Evanston, IlL: Row, Peterson & Company.
Girl, A.: 1983, Princals User's Guide, Department of Datatheory, University of Leiden, Leiden.
Headey, B.: 1981, 'The quality of life in Australia', Social Indicators Research 9, 147--165.
Hyman, H. H.: 1968, 'The psychology of status', in H. H. Hyman and E. D. Singer (eds.), Reading in Reference Group Theory and Research, New York: The Free Press, 147--165.
Michalos, A. C.: 1980, 'Satisfaction and happiness', Social Indicators Research 8, 385--422.
Michalos, A. C.: 1982, 'The satisfaction and happiness of some senior citizens in rural Ontario', Social Indicators Research 11, 1--30.
Michalos, A. C.: 1983, 'Satisfaction and happiness in a rural northern resource com- munity', Social Indicators Research 13,225--252.
Michalos, A. C.: 1985, 'Multiple discrepancies theory (MDT)', Social Indicators Re- search 16,347--413.
Michalos, A. C.: 1986, 'Gobal report on student well-being: Applications of multiple discrepancies theory (MDT)', Social Indicators Research -- Progress Report, Boston: D. Reidel Publishing Company.
Osgood, Ch.E., Suci, G. J., and Tannenbaum, P. H.: 1957, The Measurement of Meaning, University of Illinois Press, IlL
W E L L - B E I N G OF DUTCH STUDENTS 33
Patchen, M.: 1961, The Choice of Wage Comparisons, Englewood Cliffs, N.J.: Prentice- Hail.
Patchen, M.: 1968, 'A conceptual framework and some empirical data regarding com- parisons of social rewards', in H. H. Hyman and E. D. Singer (eds.), Readings in Reference Group Theory and Research, New York: The Free Press, 166--184.
Patchen, M.: 1968, 'The effects of reference groups standards on job satisfaction', in H. H. Hyman and E. D. Singer (eds.), Readings in Reference Group Theory and Research, The Free Press, New York, pp. 325--338.
Pettigrew, T.: 1968, 'Actual gains and psychological losses', in H. H. Hyman and E. D. Singer (eds.), Readings in Reference Group Theory and Research, New York: The Free Press, 339--349.
Runciman, W. G.: 1968, 'Problems of research on relative deprivation', in H. H. Hyman and E. D. Singer (eds.), Readings in Reference Group Theory and Research, New York: The Free Press, 69--76.
Schwartz, N., Strack, F., Kommer, D., and Wagner, D.: 1987, 'Soccer, room and the quality of your life: Mood effects on judgments of satisfaction with life in general and with specific domains', European Journal of Social Psychology 17(1).
Stouffer, S. A. et ai.: 1949, The American Soldier (vol. 1), Princeton, N_I.: Princeton University Press.
Thibaut, J. W. and Kelley, H. H.: 1959, The Social Psychology of Groups, New York: John Wiley & Sons, Inc.
Department of Psychology, University of Leiden, Hooigracht 15, 2312 KM Leiden, The Netherlands.