Embed Size (px)
Citation preview
21 ACRES MAPPING
GROUPSatori Johnson, Rainer Oviir, Sam Shupe
BES 318
Winter 2010
WUniversity of
Washington Bothell
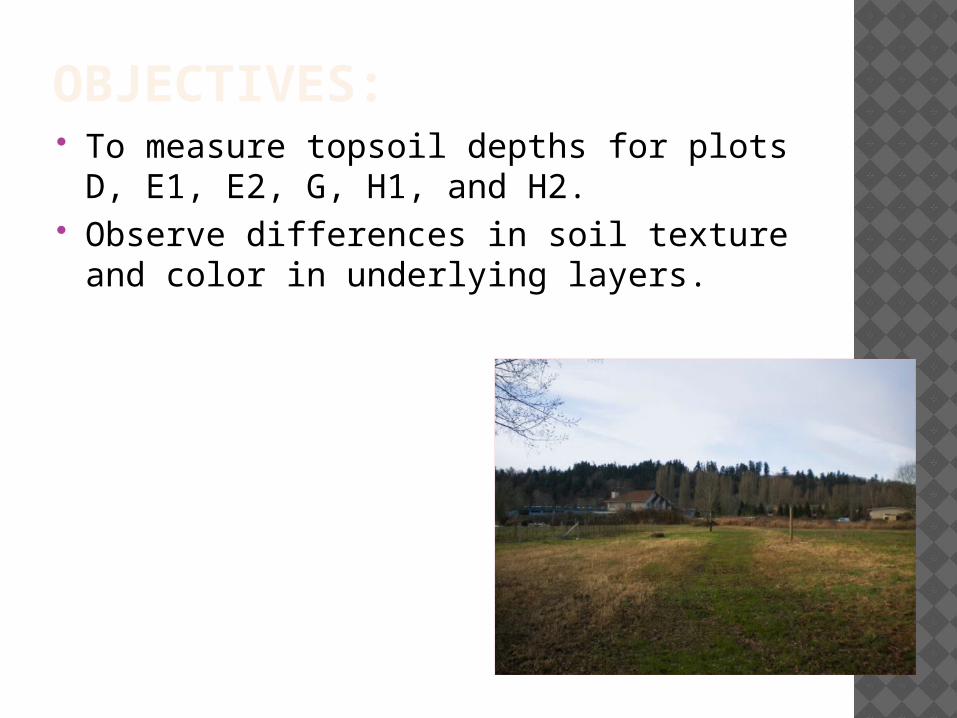
OBJECTIVES: To measure topsoil depths for plots D,
E1, E2, G, H1, and H2. Observe differences in soil texture and
color in underlying layers.
METHODS & PROCEDURES
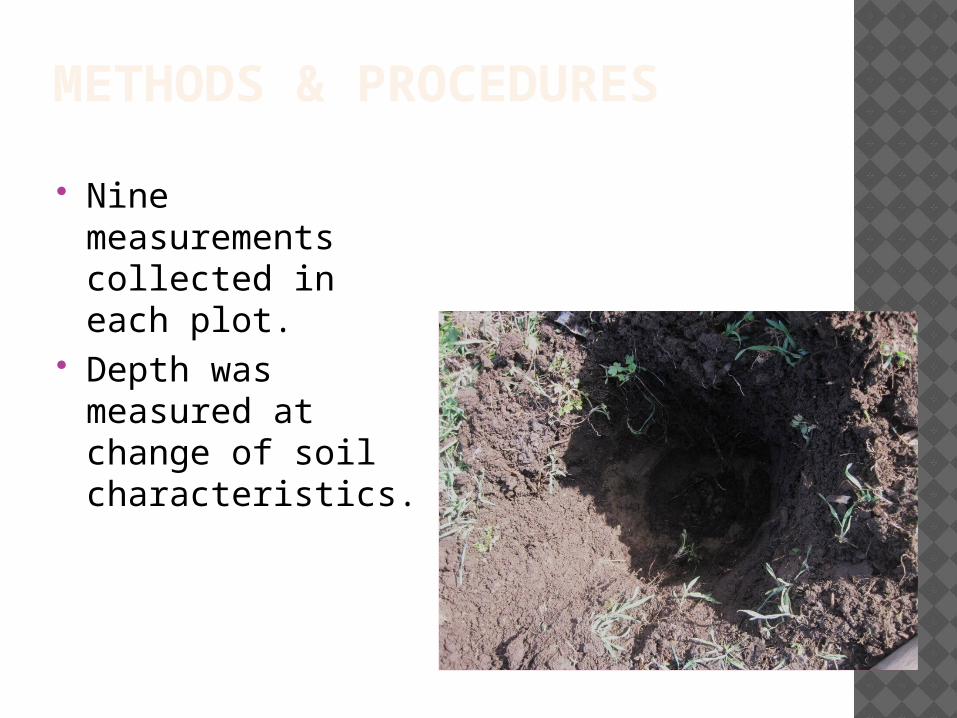
Nine measurements collected in each plot.
Depth was measured at change of soil characteristics.
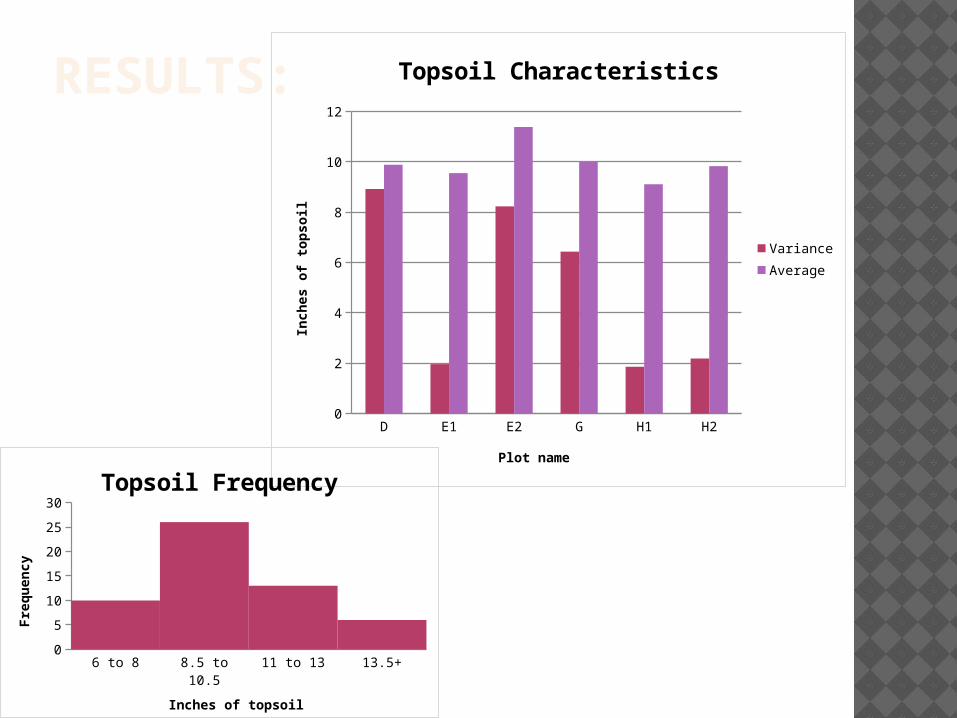
RESULTS:
D E1 E2 G H1 H20
2
4
6
8
10
12
Topsoil Characteristics
VarianceAverage
Plot name
Inches o
f to
psoil
6 to 8 8.5 to 10.5 11 to 13 13.5+0
5
10
15
20
25
30
Topsoil Frequency
Inches of topsoil
Fre
quency
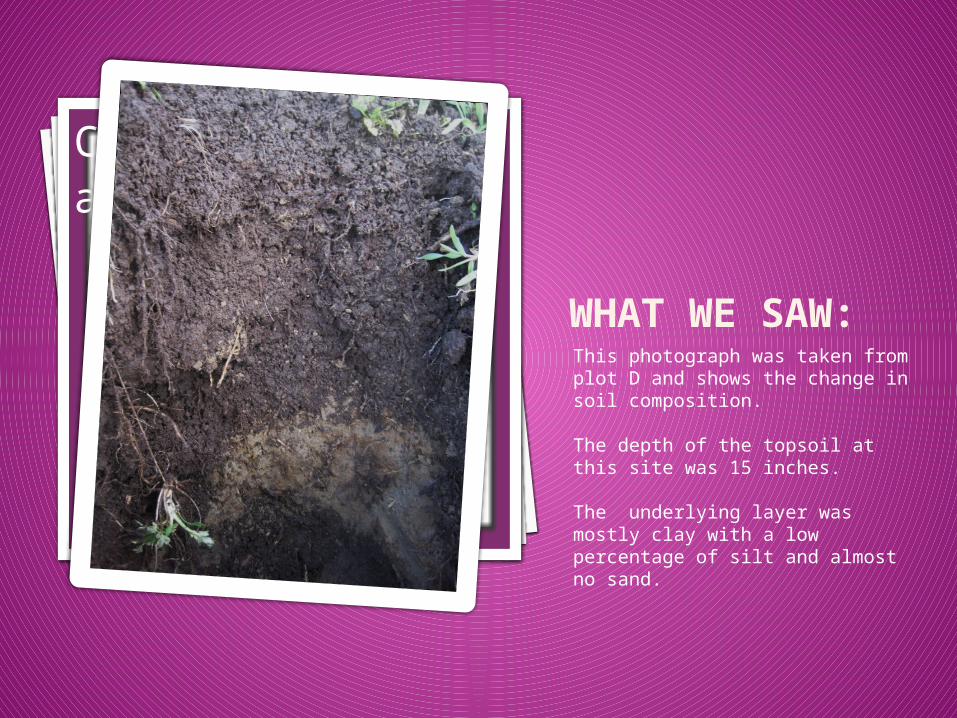
WHAT WE SAW:This photograph was taken from plot D and shows the change in soil composition.
The depth of the topsoil at this site was 15 inches.
The underlying layer was mostly clay with a low percentage of silt and almost no sand.
Click icon to add picture
THE BIG PICTURE: Topsoil depth was greater than
expected Information useful for planning crop
plantings Soil composition in layers below
topsoil were diverse and changed drastically from one site to the next.
LIMITATIONS AND FUTURE RECOMMENDATIONS: Limitations:
Research errors – inaccurate measurements
Measurements were taken one week apart
Future work: Cross-reference
findings with data obtained by infiltration rates group, soil hydraulic properties group, and soil nutrients and organic matter group
Conduct more comprehensive soil profile analysis.

21 ACRES’ EDUCATION DIRECTOR, DAVE MUEHLEISEN
21 ACRES STAFF & VOLUNTEERSDR. ROBERT TURNER
Acknowledgements: