Embed Size (px)
DESCRIPTION
Tropical cyclogenesis frequency simulated by CMIP3 climate models and multi-model based future projection. International Workshop on Advancement of Typhoon Track Forecast Technique (December 2, 2009). Satoru YOKOI 1 , Y. N. TAKAYABU 1,2 , J. C. L. CHAN 3 - PowerPoint PPT Presentation
Citation preview
International Workshop on Advancement of Typhoon Track Forecast Technique (Nov. 30-Dec. 2, 2009)1 / 21
Satoru YOKOI1, Y. N. TAKAYABU1,2, J. C. L. CHAN3
1: CCSR, University of Tokyo, Japan 2: JAMSTEC, Japan, 3: City U. Hong Kong, China
Tropical cyclogenesis frequency simulated by
CMIP3 climate models and multi-model based
future projection
International Workshop on Advancement of Typhoon Track Forecast Technique
(December 2, 2009)
International Workshop on Advancement of Typhoon Track Forecast Technique (Nov. 30-Dec. 2, 2009)2 / 21
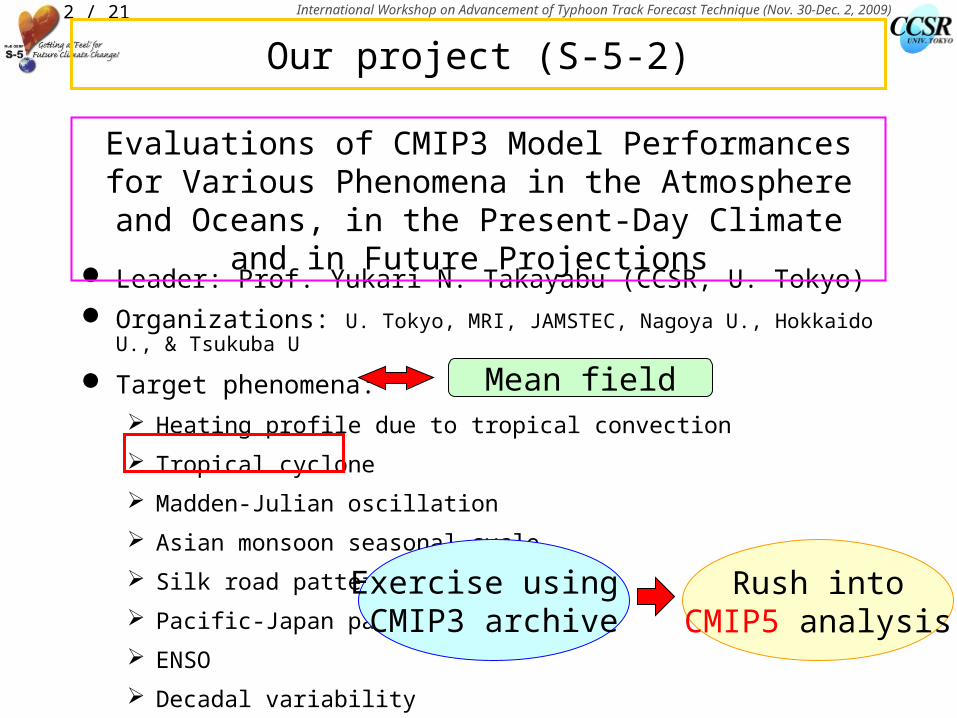
Our project (S-5-2)
Leader: Prof. Yukari N. Takayabu (CCSR, U. Tokyo)
Organizations: U. Tokyo, MRI, JAMSTEC, Nagoya U., Hokkaido U., & Tsukuba U
Target phenomena:
Heating profile due to tropical convection
Tropical cyclone
Madden-Julian oscillation
Asian monsoon seasonal cycle
Silk road pattern
Pacific-Japan pattern
ENSO
Decadal variability
Evaluations of CMIP3 Model Performances for Various Phenomena in the Atmosphere and Oceans, in the
Present-Day Climate and in Future Projections
Exercise using CMIP3 archive
Rush intoCMIP5 analysis
Mean field
International Workshop on Advancement of Typhoon Track Forecast Technique (Nov. 30-Dec. 2, 2009)3 / 21
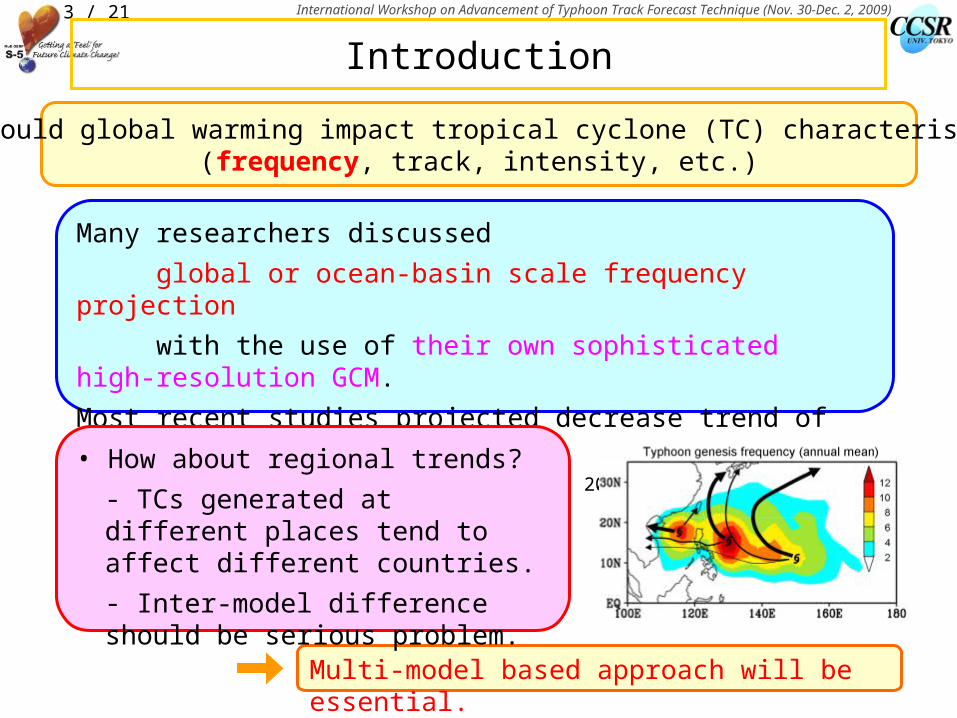
Introduction
How would global warming impact tropical cyclone (TC) characteristics?(frequency, track, intensity, etc.)
Many researchers discussed
global or ocean-basin scale frequency projection
with the use of their own sophisticated high-resolution GCM.
Most recent studies projected decrease trend of global TC number. (e.g. Sugi et al. 2002; McDonald et al. 2005; Oouchi et al. 2006; Bengtsson et al. 2007)
Multi-model based approach will be essential.
• How about regional trends?
- TCs generated at different places tend to affect different countries.
- Inter-model difference should be serious problem.
International Workshop on Advancement of Typhoon Track Forecast Technique (Nov. 30-Dec. 2, 2009)4 / 21
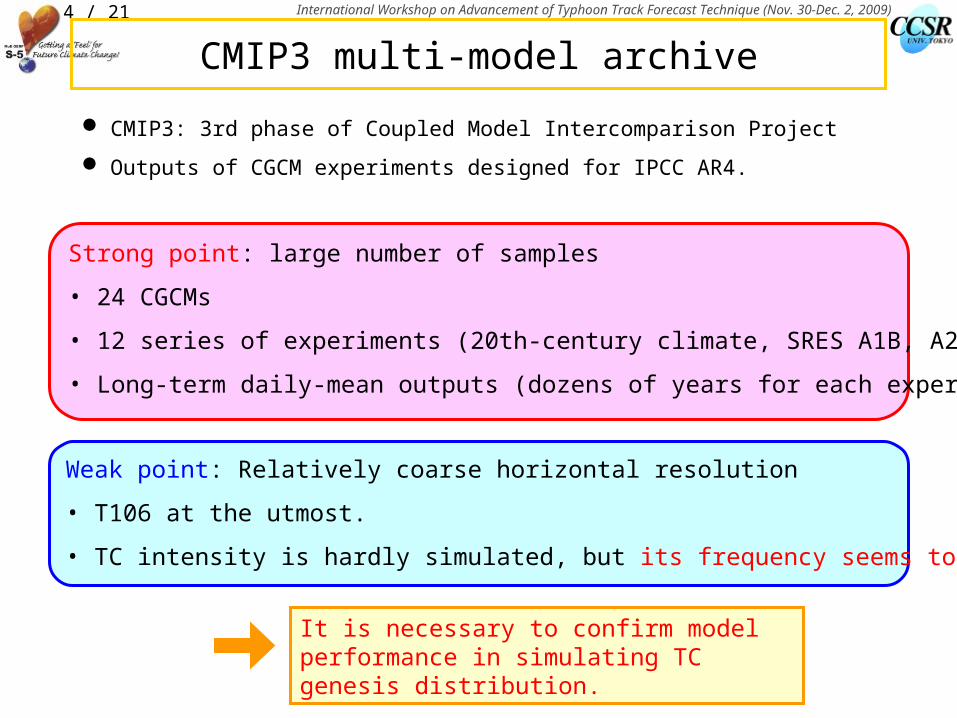
CMIP3 multi-model archive
CMIP3: 3rd phase of Coupled Model Intercomparison Project
Outputs of CGCM experiments designed for IPCC AR4.
Strong point: large number of samples
• 24 CGCMs
• 12 series of experiments (20th-century climate, SRES A1B, A2, and B1, etc.)
• Long-term daily-mean outputs (dozens of years for each experiment)
Weak point: Relatively coarse horizontal resolution
• T106 at the utmost.
• TC intensity is hardly simulated, but its frequency seems to be possible.
It is necessary to confirm model performance in simulating TC genesis distribution.
International Workshop on Advancement of Typhoon Track Forecast Technique (Nov. 30-Dec. 2, 2009)5 / 21
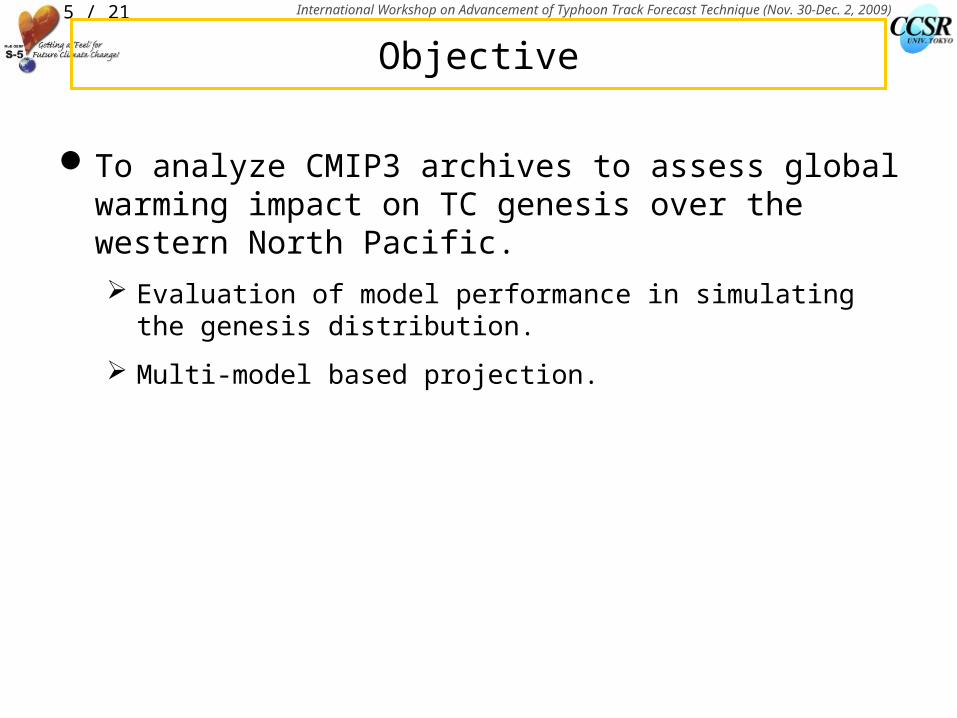
Objective
To analyze CMIP3 archives to assess global warming impact on TC genesis over the western North Pacific.
Evaluation of model performance in simulating the genesis distribution.
Multi-model based projection.
International Workshop on Advancement of Typhoon Track Forecast Technique (Nov. 30-Dec. 2, 2009)6 / 21
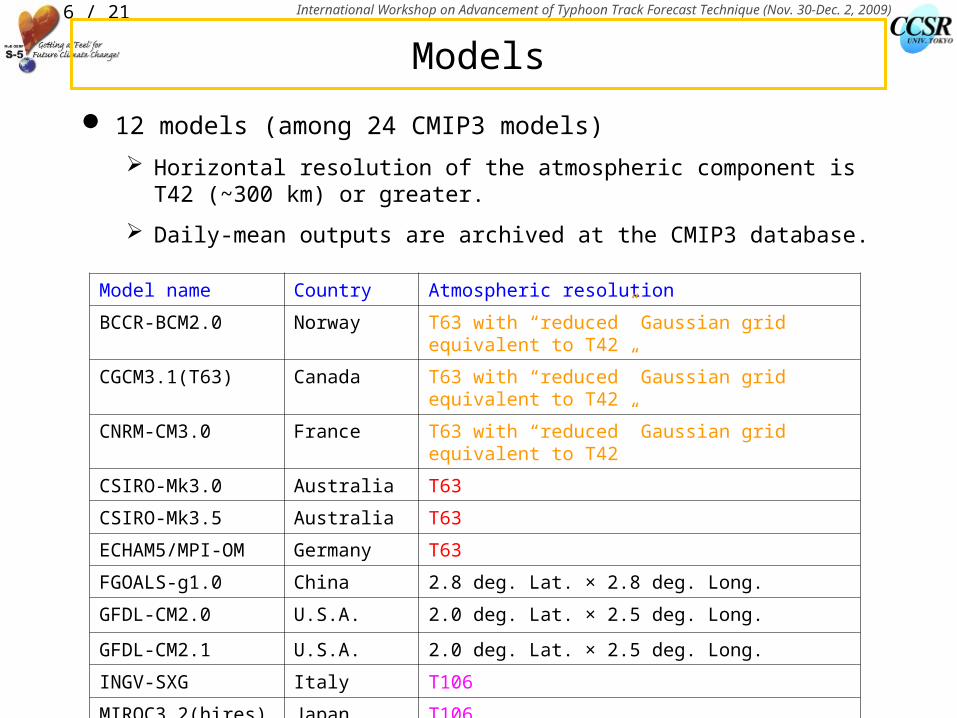
Models
12 models (among 24 CMIP3 models)
Horizontal resolution of the atmospheric component is T42 (~300 km) or greater.
Daily-mean outputs are archived at the CMIP3 database.
Model name Country Atmospheric resolution
BCCR-BCM2.0 Norway T63 with “reduced” Gaussian grid equivalent to T42
CGCM3.1(T63) Canada T63 with “reduced” Gaussian grid equivalent to T42
CNRM-CM3.0 France T63 with “reduced” Gaussian grid equivalent to T42
CSIRO-Mk3.0 Australia T63
CSIRO-Mk3.5 Australia T63
ECHAM5/MPI-OM Germany T63
FGOALS-g1.0 China 2.8 deg. Lat. × 2.8 deg. Long.
GFDL-CM2.0 U.S.A. 2.0 deg. Lat. × 2.5 deg. Long.
GFDL-CM2.1 U.S.A. 2.0 deg. Lat. × 2.5 deg. Long.
INGV-SXG Italy T106
MIROC3.2(hires) Japan T106
MRI-CGCM2.3.2 Japan T42
International Workshop on Advancement of Typhoon Track Forecast Technique (Nov. 30-Dec. 2, 2009)7 / 21
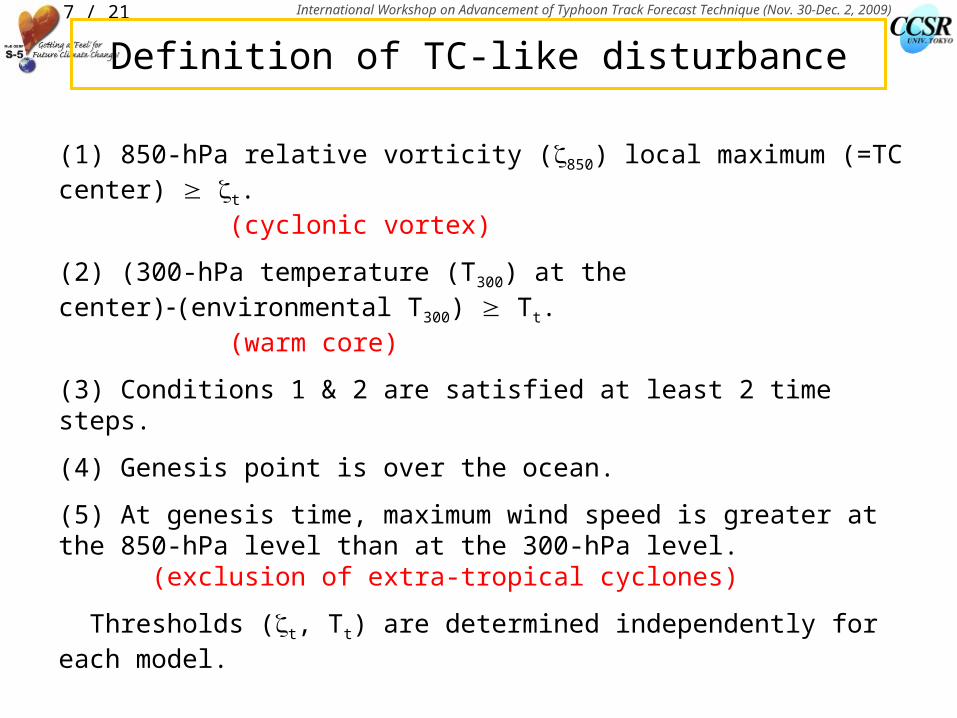
Definition of TC-like disturbance
(1) 850-hPa relative vorticity (850) local maximum (=TC center) t. (cyclonic vortex)
(2) (300-hPa temperature (T300) at the center)(environmental T300) Tt. (warm core)
(3) Conditions 1 & 2 are satisfied at least 2 time steps.
(4) Genesis point is over the ocean.
(5) At genesis time, maximum wind speed is greater at the 850-hPa level than at the 300-hPa level.
(exclusion of extra-tropical cyclones)
Thresholds (t, Tt) are determined independently for each model.
International Workshop on Advancement of Typhoon Track Forecast Technique (Nov. 30-Dec. 2, 2009)8 / 21
Evaluation of model performance- 20th-century experiment -
International Workshop on Advancement of Typhoon Track Forecast Technique (Nov. 30-Dec. 2, 2009)9 / 21
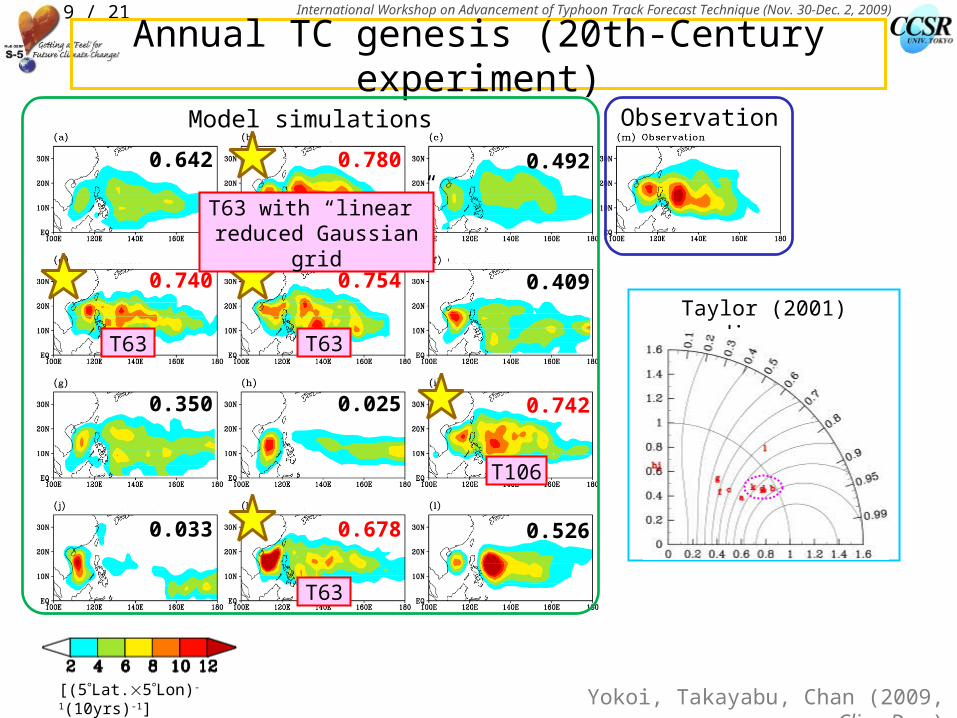
Annual TC genesis (20th-Century experiment)
Taylor (2001) diagram
0.642 0.780 0.492
0.740 0.754 0.409
0.350 0.025 0.742
0.033 0.678 0.526
[(5Lat.5Lon)-1(10yrs)-1] Yokoi, Takayabu, Chan (2009, Clim. Dyn.)
Model simulations Observation
T63 with “linear” reduced Gaussian grid
T63 T63
T63
T106
International Workshop on Advancement of Typhoon Track Forecast Technique (Nov. 30-Dec. 2, 2009)10 / 21
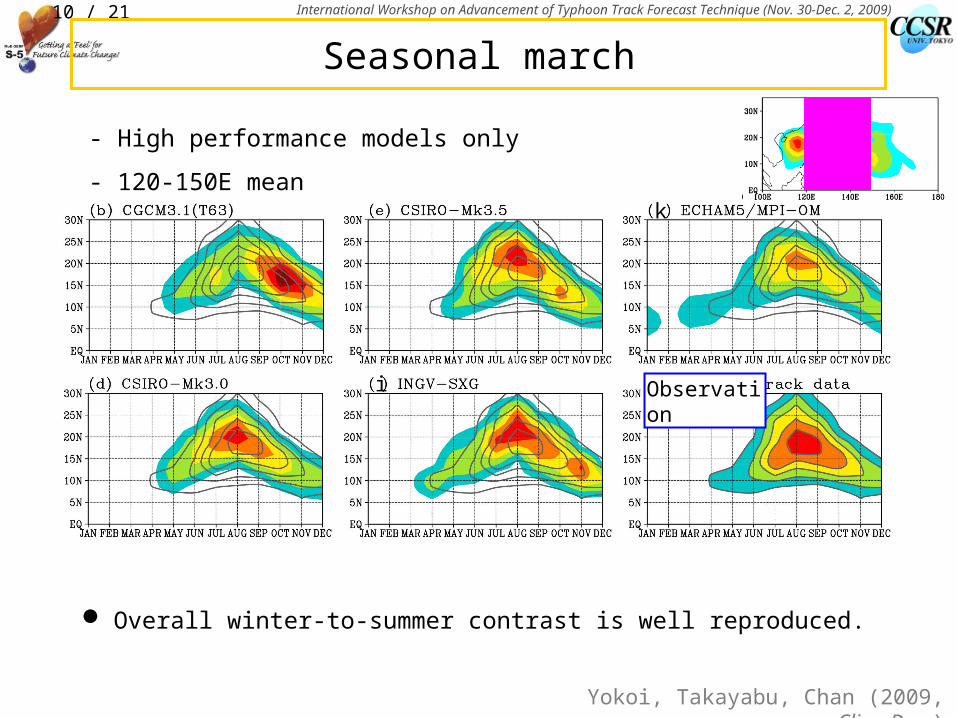
Seasonal march
Overall winter-to-summer contrast is well reproduced.
i
k
Observation
- High performance models only
- 120-150E mean
Yokoi, Takayabu, Chan (2009, Clim. Dyn.)
International Workshop on Advancement of Typhoon Track Forecast Technique (Nov. 30-Dec. 2, 2009)11 / 21
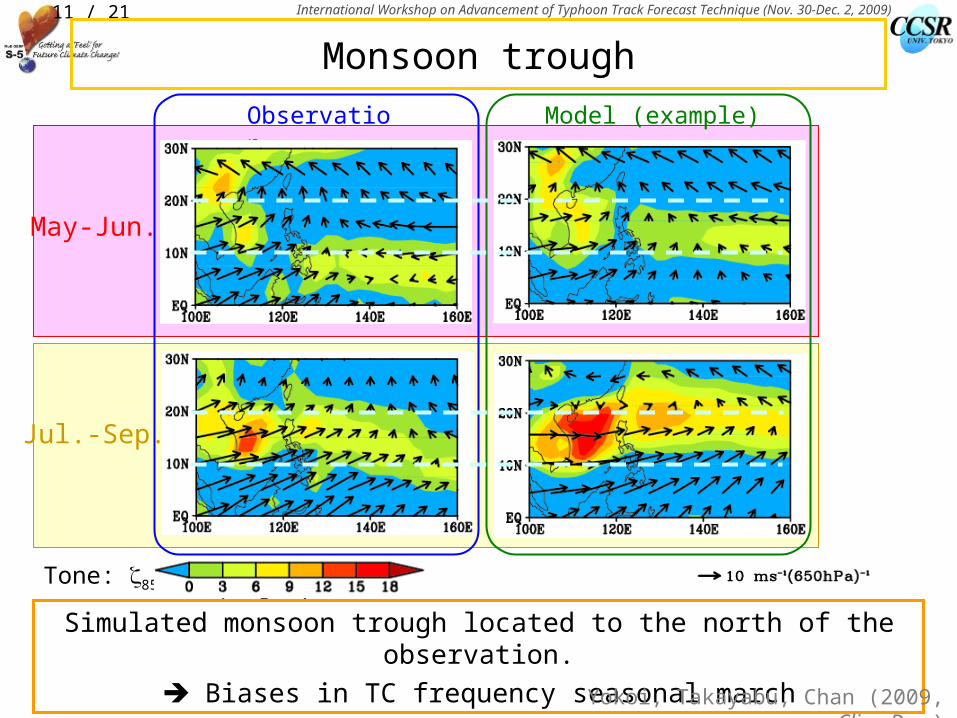
Monsoon trough
May-Jun.
Jul.-Sep.
Model (example)Observation
Tone: 850 Vector: vertical shear
Simulated monsoon trough located to the north of the observation.
Biases in TC frequency seasonal marchYokoi, Takayabu, Chan (2009, Clim. Dyn.)

International Workshop on Advancement of Typhoon Track Forecast Technique (Nov. 30-Dec. 2, 2009)12 / 21
Seasonal migration of monsoon trough
Monsoon trough migrates northward during April–August, and retreats southward during August–December.
The trough simulated by five star models migrate northward too fast in early summer, and reaches too north during mature summer.
850-hPa relative vorticity in 120–150E
Observation
Yokoi, Takayabu, Chan (2009, Clim. Dyn.)
International Workshop on Advancement of Typhoon Track Forecast Technique (Nov. 30-Dec. 2, 2009)13 / 21
Multi-model based projection
International Workshop on Advancement of Typhoon Track Forecast Technique (Nov. 30-Dec. 2, 2009)14 / 21
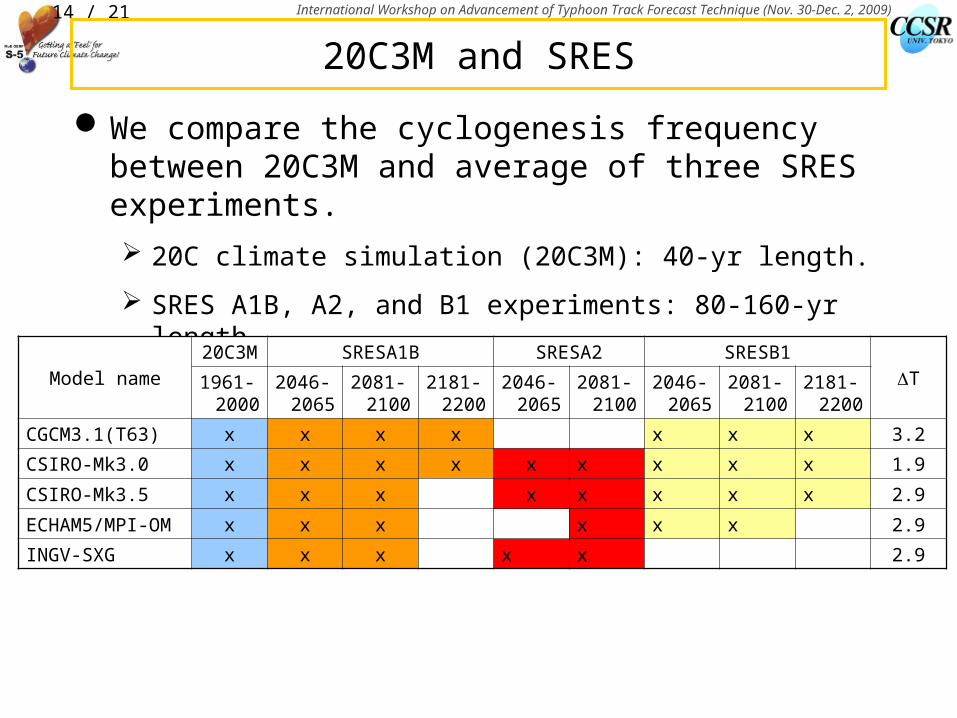
20C3M and SRES
We compare the cyclogenesis frequency between 20C3M and average of three SRES experiments.
20C climate simulation (20C3M): 40-yr length.
SRES A1B, A2, and B1 experiments: 80-160-yr length.
Model name
20C3M SRESA1B SRESA2 SRESB1
T1961-2000
2046-2065
2081-2100
2181-2200
2046-2065
2081-2100
2046-2065
2081-2100
2181-2200
CGCM3.1(T63) x x x x x x x 3.2
CSIRO-Mk3.0 x x x x x x x x x 1.9
CSIRO-Mk3.5 x x x x x x x x 2.9
ECHAM5/MPI-OM x x x x x x 2.9
INGV-SXG x x x x x 2.9
International Workshop on Advancement of Typhoon Track Forecast Technique (Nov. 30-Dec. 2, 2009)15 / 21
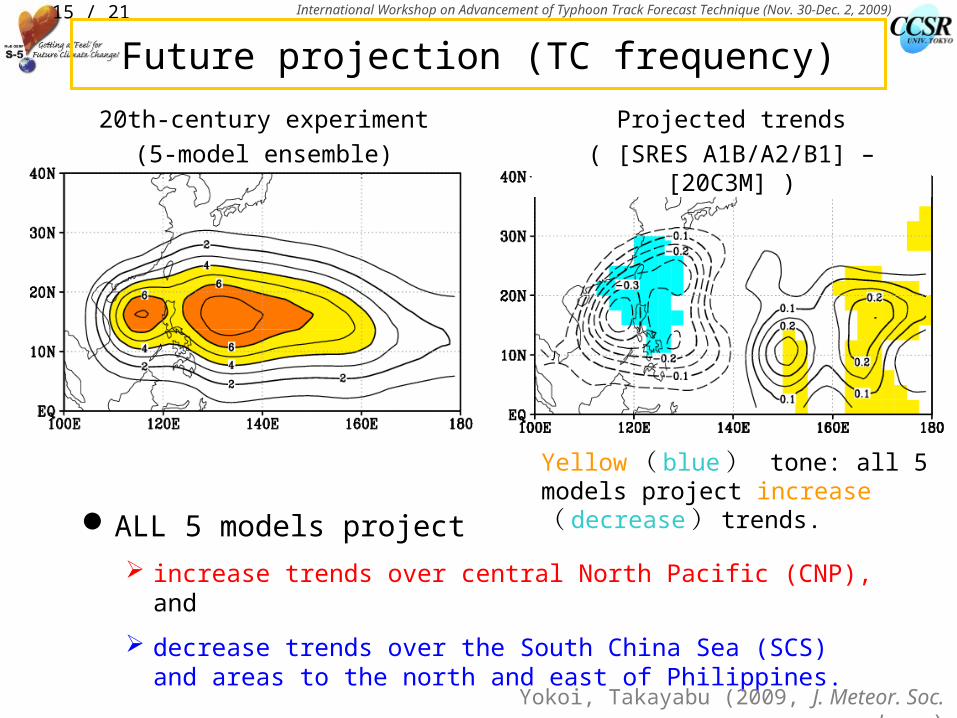
Future projection (TC frequency)
ALL 5 models project
increase trends over central North Pacific (CNP), and
decrease trends over the South China Sea (SCS) and areas to the north and east of Philippines.
20th-century experiment
(5-model ensemble)
Projected trends
( [SRES A1B/A2/B1] – [20C3M] )
Yellow ( blue ) tone: all 5 models project increase ( decrease ) trends.
Yokoi, Takayabu (2009, J. Meteor. Soc. Japan)
International Workshop on Advancement of Typhoon Track Forecast Technique (Nov. 30-Dec. 2, 2009)16 / 21
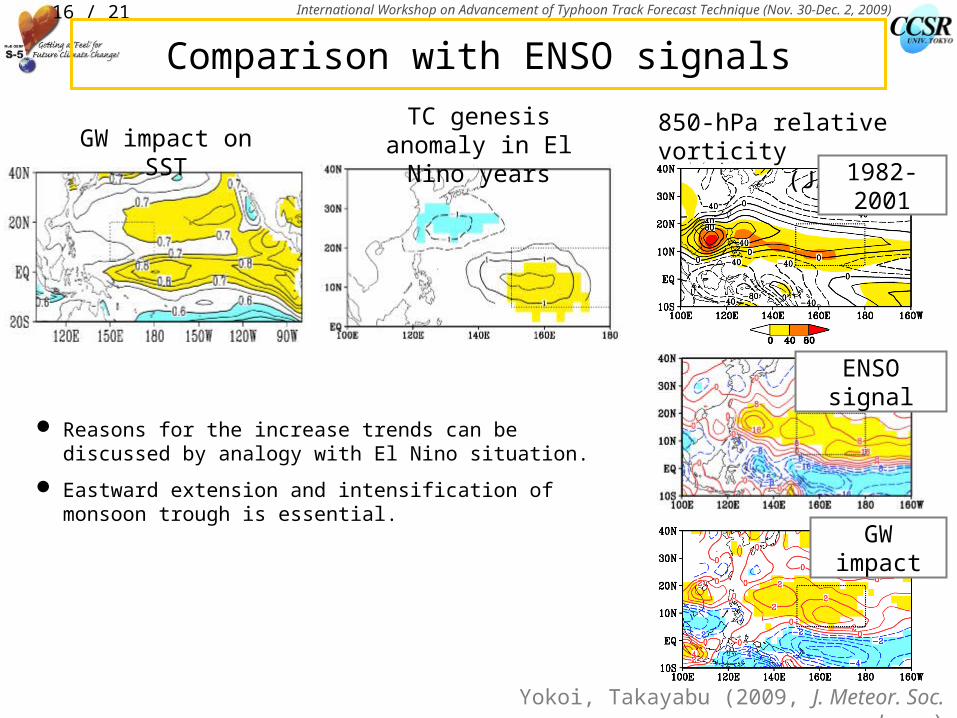
Comparison with ENSO signals
Reasons for the increase trends can be discussed by analogy with El Nino situation.
Eastward extension and intensification of monsoon trough is essential.
TC genesis anomaly in El Nino yearsGW impact on SST
Yokoi, Takayabu (2009, J. Meteor. Soc. Japan)
850-hPa relative vorticity (JASON)
1982-2001
ENSO signal
GW impact
International Workshop on Advancement of Typhoon Track Forecast Technique (Nov. 30-Dec. 2, 2009)17 / 21
Yokoi, Takayabu (2009, J. Meteor. Soc. Japan)
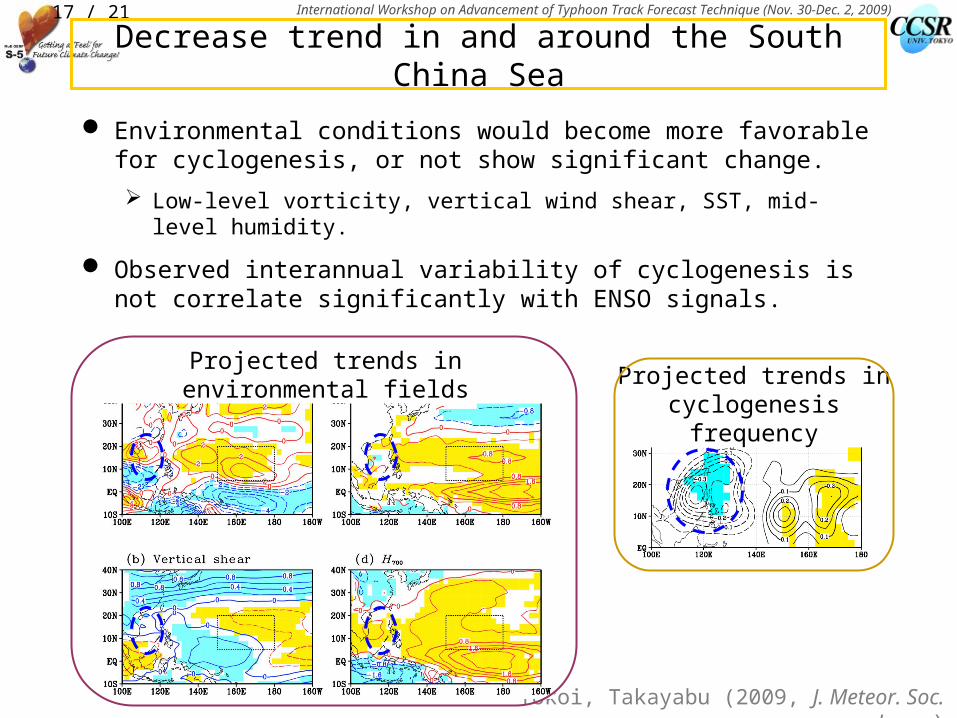
Decrease trend in and around the South China Sea
Environmental conditions would become more favorable for cyclogenesis, or not show significant change.
Low-level vorticity, vertical wind shear, SST, mid-level humidity.
Observed interannual variability of cyclogenesis is not correlate significantly with ENSO signals.
Projected trends in environmental fieldsProjected trends in
cyclogenesis frequency
International Workshop on Advancement of Typhoon Track Forecast Technique (Nov. 30-Dec. 2, 2009)18 / 21
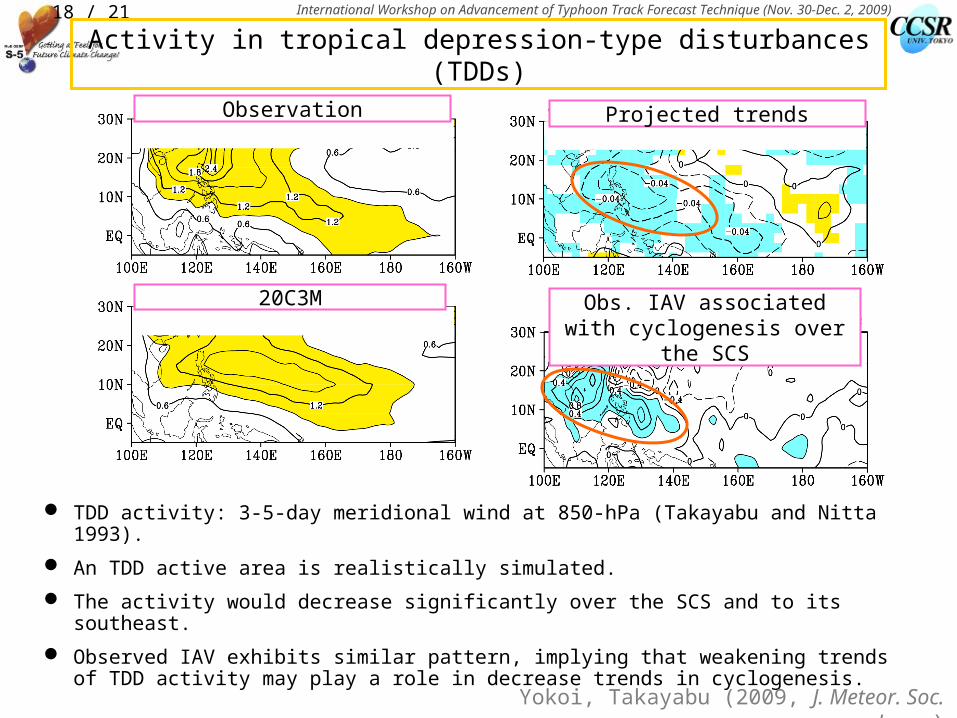
Activity in tropical depression-type disturbances (TDDs)
TDD activity: 3-5-day meridional wind at 850-hPa (Takayabu and Nitta 1993).
An TDD active area is realistically simulated.
The activity would decrease significantly over the SCS and to its southeast.
Observed IAV exhibits similar pattern, implying that weakening trends of TDD activity may play a role in decrease trends in cyclogenesis.
Observation
20C3M
Projected trends
Obs. IAV associated with cyclogenesis over the SCS
Yokoi, Takayabu (2009, J. Meteor. Soc. Japan)
International Workshop on Advancement of Typhoon Track Forecast Technique (Nov. 30-Dec. 2, 2009)19 / 21
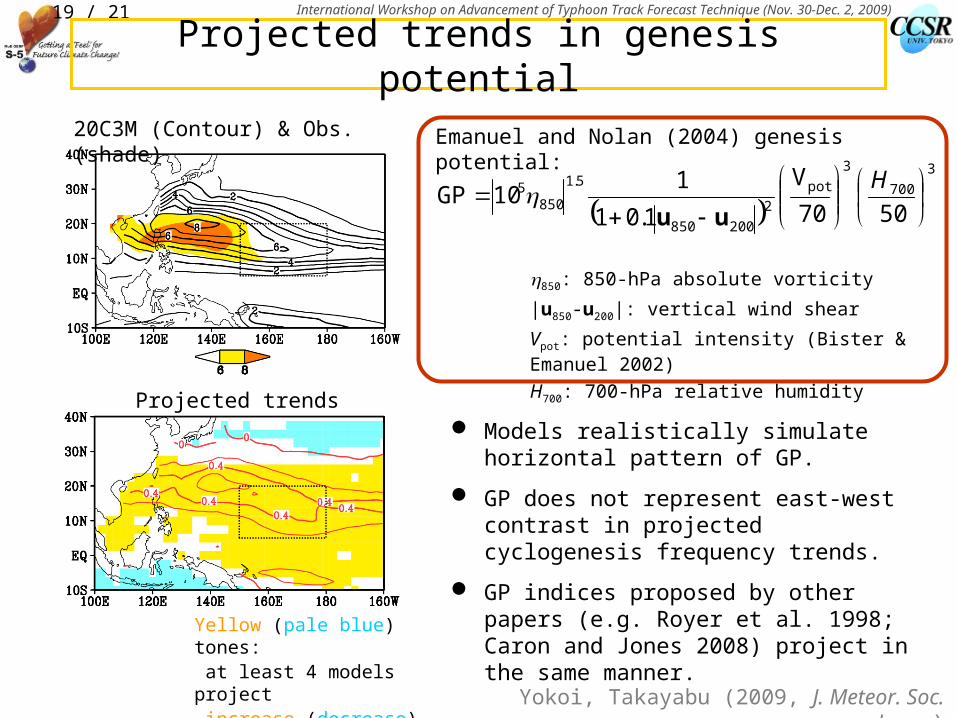
Projected trends in genesis potential
Models realistically simulate horizontal pattern of GP.
GP does not represent east-west contrast in projected cyclogenesis frequency trends.
GP indices proposed by other papers (e.g. Royer et al. 1998; Caron and Jones 2008) project in the same manner.
20C3M (Contour) & Obs. (shade)
Projected trends
Yellow (pale blue) tones: at least 4 models project increase (decrease) trends.
3
700
3
pot
2
200850
5.1
8505
50
70
V
1.01
110GP
H
uu
Emanuel and Nolan (2004) genesis potential:
850: 850-hPa absolute vorticity
|u850-u200|: vertical wind shear
Vpot: potential intensity (Bister & Emanuel 2002)
H700: 700-hPa relative humidity
Yokoi, Takayabu (2009, J. Meteor. Soc. Japan)
International Workshop on Advancement of Typhoon Track Forecast Technique (Nov. 30-Dec. 2, 2009)20 / 21
Summary
Five CMIP3 models realistically simulate horizontal distribution in tropical cyclogenesis over the western North Pacific.
ALL of the five models project increase trends of cyclogenesis over the central North Pacific and decrease trends over the South China Sea and regions east of Philippines.
The former increase trends are primarily attributable to projected eastward extension and intensification of the monsoon trough.
The latter decrease trends are associated with weakening trends in activity of tropical depression-type disturbances.
References:
Yokoi, Takayabu, and Chan (2009, Climate Dynamics, 33, 665–683)
Yokoi, and Takayabu (2009, Journal of the Meteorological Society of Japan, 87, 525-538.

International Workshop on Advancement of Typhoon Track Forecast Technique (Nov. 30-Dec. 2, 2009)21 / 21
Future research
Trends in occurrence frequency
Is it completely explained by trends in genesis frequency?
Improvement of genesis potential index to make it applicable to global warming problem.


![Pointwise HSIC: A Linear-Time Kernelized Co-occurrence ...yokoi/docs/yokoi-phsic-slide...Pointwise HSIC: A Linear-Time Kernelized Co-occurrence Norm for Sparse Linguistic Expressions[EMNLP2018]](https://img.pdfslide.net/doc/110x75/60ea8bad015b200d936ab56e/pointwise-hsic-a-linear-time-kernelized-co-occurrence-yokoidocsyokoi-phsic-slide.jpg)