Embed Size (px)
Citation preview
1June 21, 2016
ECONOMICS
SAUDI ARABIA
JUNE 21, 2016
TABLE OF CONTENTS
CONTACTS
Research
Marwan S. Barakat(961-1) [email protected]
Jamil H. Naayem(961-1) [email protected]
Salma Saad Baba(961-1) [email protected]
Fadi A. Kanso(961-1) [email protected]
Gerard H. Arabian(961-1) [email protected]
Farah N. Nahlawi(961-1) [email protected]
Executive Summary 1
Introduction 2
Economic Conditions 4
Real Sector 4
External Sector 7
Public Sector 8
Financial Sector 9
Concluding Remarks 16
The Saudi Arabia Economic Report can be accessed via internet at the following web address: http://www.bankaudigroup.com
SAUDI ARABIA ECONOMIC REPORTON THE VERGE OF DRASTIC STRUCTURAL REFORMS AMID RISING MACRO VULNERABILITIES
• The decline in international oil prices starting to adversely affect the Kingdom’s economy Saudi Arabia’s real GDP growth reported 3.4% in 2015 but is set to slow to 1.2% in 2016 according to the International Monetary Fund, the lowest level since the 2009 global financial turmoil. The economic slowdown is seeing the light on the back of a stabilization of oil production at around 10.2 million bbl/day and a substantial deceleration of non-oil activity. While the oil sector GDP is decelerating significantly based on slower growth in Saudi crude production, the non-oil sector is moderating further as it is impacted by the negative spillover effects from the collapsing oil revenues and the recent reductions in subsidies and as the economic slowdown weighs on business and consumer confidence alike.
• A record high fiscal deficit leading the way towards drastic budgetary reformsSaudi Arabia’s fiscal performance in 2015 was underpinned by a sharp fall in public revenues, reaching its lowest level since 2009 amidst lower oil revenues, and a reduction in public expenditures for the first time since 2002, on the back of fiscal reform measures leading to lower current and capital expenditures, with more reforms in the pipeline at the horizon. Accordingly, a record high fiscal deficit was registered in 2015 (US$ 99.4 billion), to account for 15.4% of GDP. The deficit was mainly financed by large drawdown of net foreign assets and increased domestic debt issuance, as net government domestic debt issuance amounted to US$ 26 billion, bringing total gross public debt to 5.8% of GDP at end-2015, from 1.6% of GDP at end-2014.
• Net contractions in monetary aggregates along with extended falls in SAMA’s reservesSaudi monetary conditions were marked by rising inflationary pressures during the first four months of 2016, in addition to first-time net contractions in broader money supply within the context of tighter domestic liquidity in an era of low oil prices, and extended declines in SAMA’s foreign assets for the second consecutive year as the Kingdom continued to draw upon its foreign reserves to finance its budget deficit. The cost of living index increased by 4.3% on average during the first four months of 2016 after rising by 2.2% on average in 2015, mainly driven by a shy oil price recovery since January 2016 and more than 50% reduction in petrol subsidies at end-December 2015. Money supply in its broadest sense (M3) contracted by 0.3% during the first four months of 2016 to reach US$ 472 billion, after rising by a mere 2.6% in 2015.
• Banking activity drivers slowing down but sector well placed to cope with tough operating conditionsSaudi Arabia’s banking sector saw a further slowdown in its activity growth throughout 2015 and the first four months of this year amidst an overall weaker economic momentum due to dwindling oil prices and the ensuing effects on the government’s finances and private sector activity. Measured by total assets of banks operating in the Kingdom, sector activity grew by 3.6% in 2015 and by a tiny 0.2% in the first four months of 2016 to reach the equivalent of US$ 590.0 billion at end-April 2016. This represents a marked slowdown after strong growth rates in the previous few years. The sector yet remains well capitalized with a strong asset quality and decent profitability.
• Extended price declines in equity market, bond prices up tracking US Treasuries moveSaudi capital markets were marked during the first five months of 2016 by extended equity price declines for the third consecutive year along with a fall in activity and turnover ratio given a weak investor sentiment in a protracted era of low oil prices. The fixed income market saw mostly upward price movements so far in 2016, after dipping in the red in 2015, mainly tracking US Treasuries move, while the cost of insuring debt recorded small year-to-date expansions. In fact, the Saudi Tadawul ended the first five months of 2016 on a negative note, as reflected by a 6.7% fall in The Tadawul All-Share Index (TASI) to close at 6,448.42 at end-May 2016, extending the downward trajectory traced since 2014. At the level of the cost of insuring debt, Saudi Arabia’s five-year CDS spreads expanded by 14 bps during the first five months of 2016 to reach 170 bps at end-May 2016, following an 89 bps expansion in 2015.
Bank Audi sal - Group Research Department - Bank Audi Plaza - Bab Idriss - PO Box 11-2560 - Lebanon - Tel: 961 1 994 000 - email: [email protected]
2June 21, 2016
ECONOMICS
SAUDI ARABIA
JUNE 21, 2016
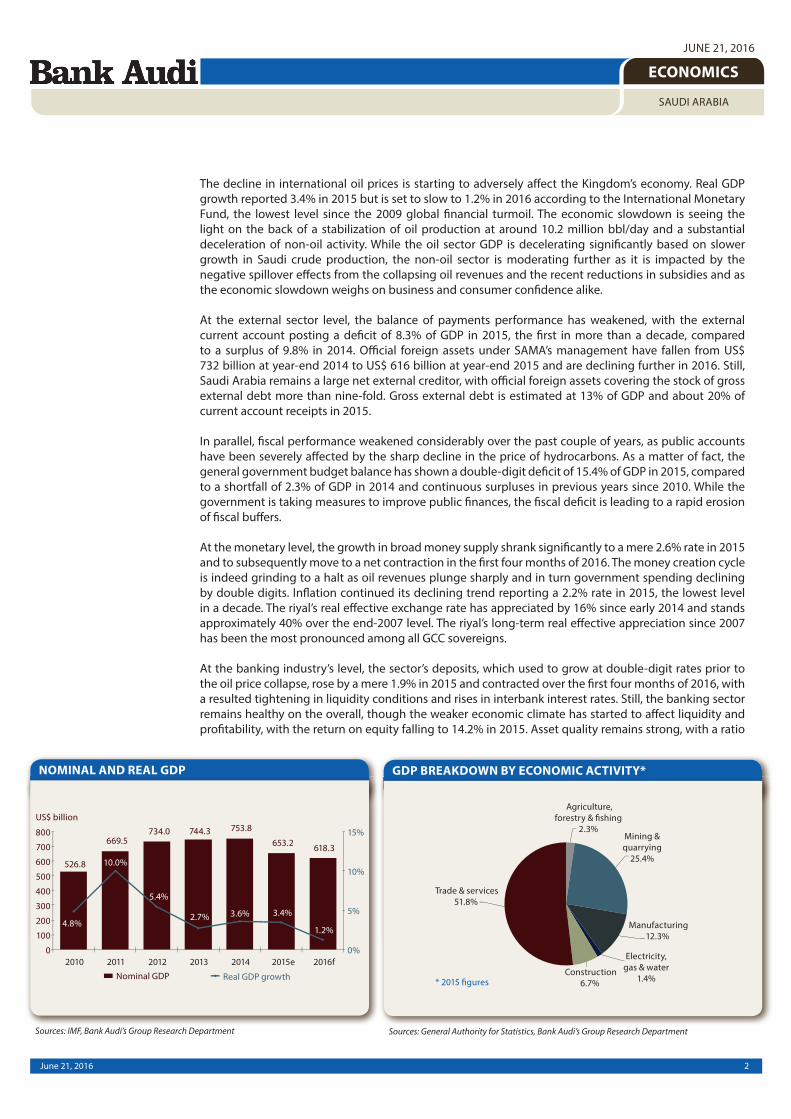
The decline in international oil prices is starting to adversely affect the Kingdom’s economy. Real GDP growth reported 3.4% in 2015 but is set to slow to 1.2% in 2016 according to the International Monetary Fund, the lowest level since the 2009 global financial turmoil. The economic slowdown is seeing the light on the back of a stabilization of oil production at around 10.2 million bbl/day and a substantial deceleration of non-oil activity. While the oil sector GDP is decelerating significantly based on slower growth in Saudi crude production, the non-oil sector is moderating further as it is impacted by the negative spillover effects from the collapsing oil revenues and the recent reductions in subsidies and as the economic slowdown weighs on business and consumer confidence alike.
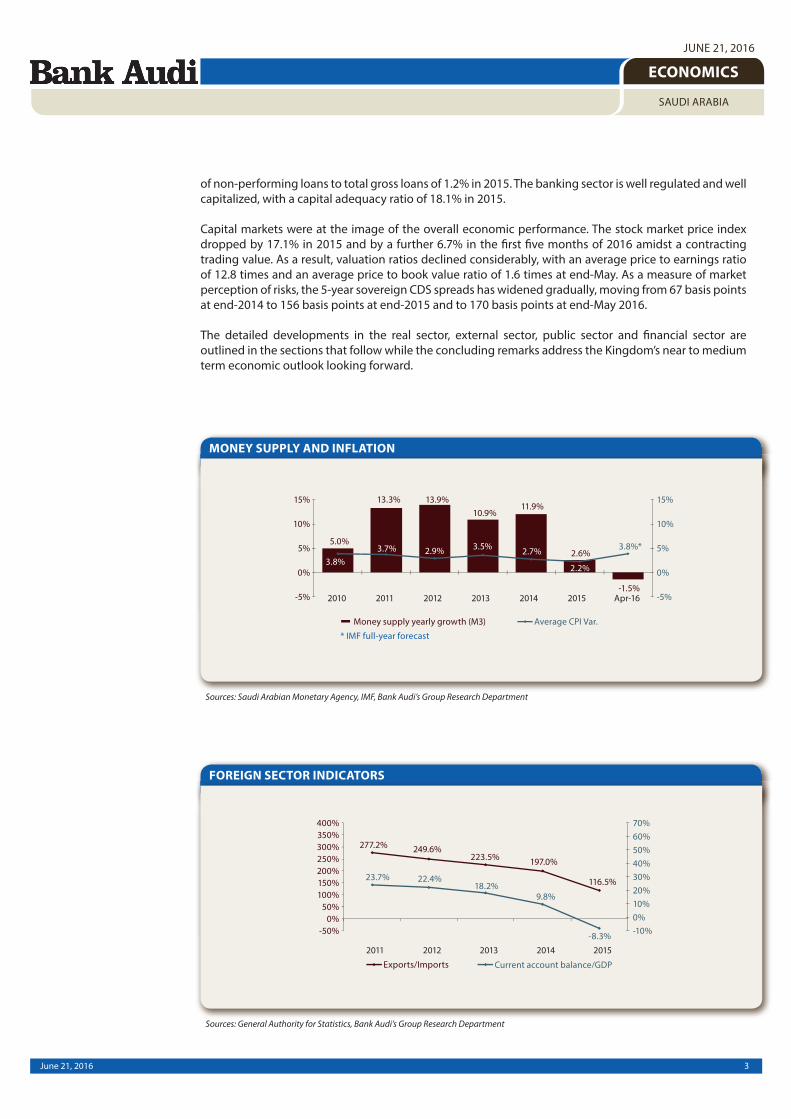
At the external sector level, the balance of payments performance has weakened, with the external current account posting a deficit of 8.3% of GDP in 2015, the first in more than a decade, compared to a surplus of 9.8% in 2014. Official foreign assets under SAMA’s management have fallen from US$ 732 billion at year-end 2014 to US$ 616 billion at year-end 2015 and are declining further in 2016. Still, Saudi Arabia remains a large net external creditor, with official foreign assets covering the stock of gross external debt more than nine-fold. Gross external debt is estimated at 13% of GDP and about 20% of current account receipts in 2015.
In parallel, fiscal performance weakened considerably over the past couple of years, as public accounts have been severely affected by the sharp decline in the price of hydrocarbons. As a matter of fact, the general government budget balance has shown a double-digit deficit of 15.4% of GDP in 2015, compared to a shortfall of 2.3% of GDP in 2014 and continuous surpluses in previous years since 2010. While the government is taking measures to improve public finances, the fiscal deficit is leading to a rapid erosion of fiscal buffers.
At the monetary level, the growth in broad money supply shrank significantly to a mere 2.6% rate in 2015 and to subsequently move to a net contraction in the first four months of 2016. The money creation cycle is indeed grinding to a halt as oil revenues plunge sharply and in turn government spending declining by double digits. Inflation continued its declining trend reporting a 2.2% rate in 2015, the lowest level in a decade. The riyal’s real effective exchange rate has appreciated by 16% since early 2014 and stands approximately 40% over the end-2007 level. The riyal’s long-term real effective appreciation since 2007 has been the most pronounced among all GCC sovereigns.
At the banking industry’s level, the sector’s deposits, which used to grow at double-digit rates prior to the oil price collapse, rose by a mere 1.9% in 2015 and contracted over the first four months of 2016, with a resulted tightening in liquidity conditions and rises in interbank interest rates. Still, the banking sector remains healthy on the overall, though the weaker economic climate has started to affect liquidity and profitability, with the return on equity falling to 14.2% in 2015. Asset quality remains strong, with a ratio
Sources: IMF, Bank Audi’s Group Research Department Sources: General Authority for Statistics, Bank Audi’s Group Research Department
NOMINAL AND REAL GDP GDP BREAKDOWN BY ECONOMIC ACTIVITY*
3June 21, 2016
ECONOMICS
SAUDI ARABIA
JUNE 21, 2016
of non-performing loans to total gross loans of 1.2% in 2015. The banking sector is well regulated and well capitalized, with a capital adequacy ratio of 18.1% in 2015.
Capital markets were at the image of the overall economic performance. The stock market price index dropped by 17.1% in 2015 and by a further 6.7% in the first five months of 2016 amidst a contracting trading value. As a result, valuation ratios declined considerably, with an average price to earnings ratio of 12.8 times and an average price to book value ratio of 1.6 times at end-May. As a measure of market perception of risks, the 5-year sovereign CDS spreads has widened gradually, moving from 67 basis points at end-2014 to 156 basis points at end-2015 and to 170 basis points at end-May 2016.
The detailed developments in the real sector, external sector, public sector and financial sector are outlined in the sections that follow while the concluding remarks address the Kingdom’s near to medium term economic outlook looking forward.
Sources: General Authority for Statistics, Bank Audi’s Group Research Department
Sources: Saudi Arabian Monetary Agency, IMF, Bank Audi’s Group Research Department
FOREIGN SECTOR INDICATORS
MONEY SUPPLY AND INFLATION
4June 21, 2016
ECONOMICS
SAUDI ARABIA
JUNE 21, 2016
1. ECONOMIC CONDITIONS1.1. REAL SECTOR
1.1.1. Hydrocarbon Sector
Kingdom adamant on maintaining global oil market share
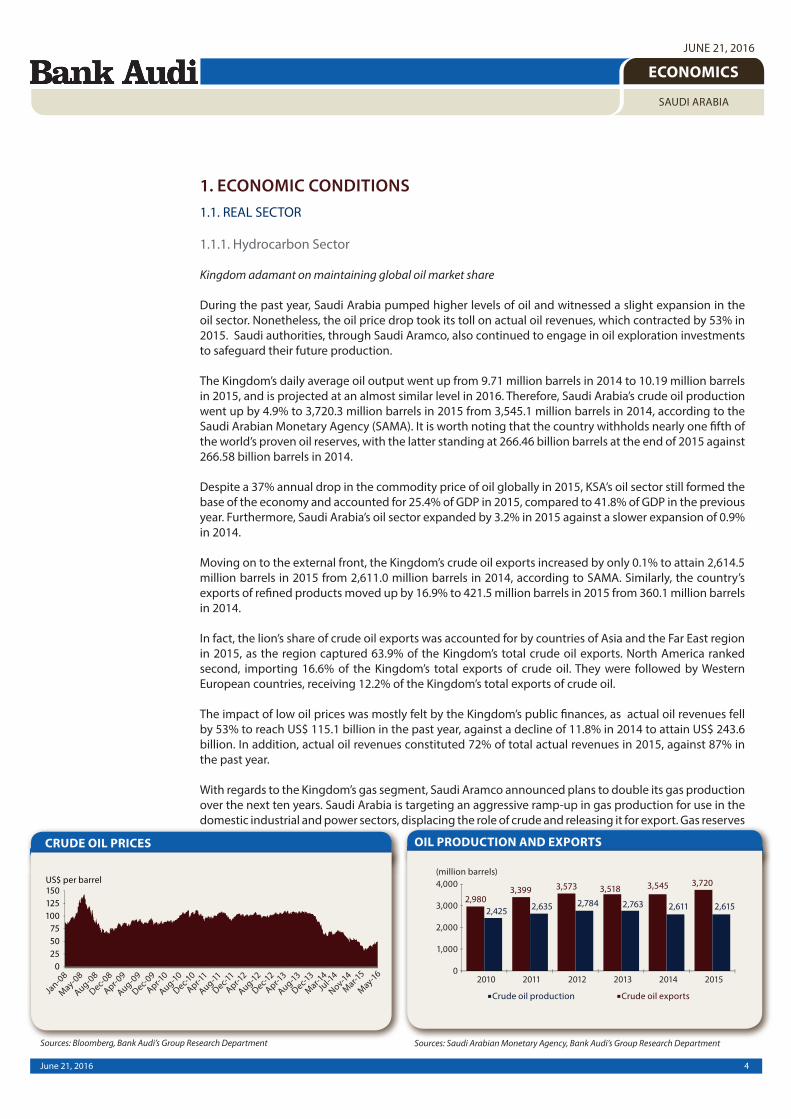
During the past year, Saudi Arabia pumped higher levels of oil and witnessed a slight expansion in the oil sector. Nonetheless, the oil price drop took its toll on actual oil revenues, which contracted by 53% in 2015. Saudi authorities, through Saudi Aramco, also continued to engage in oil exploration investments to safeguard their future production.
The Kingdom’s daily average oil output went up from 9.71 million barrels in 2014 to 10.19 million barrels in 2015, and is projected at an almost similar level in 2016. Therefore, Saudi Arabia’s crude oil production went up by 4.9% to 3,720.3 million barrels in 2015 from 3,545.1 million barrels in 2014, according to the Saudi Arabian Monetary Agency (SAMA). It is worth noting that the country withholds nearly one fifth of the world’s proven oil reserves, with the latter standing at 266.46 billion barrels at the end of 2015 against 266.58 billion barrels in 2014.
Despite a 37% annual drop in the commodity price of oil globally in 2015, KSA’s oil sector still formed the base of the economy and accounted for 25.4% of GDP in 2015, compared to 41.8% of GDP in the previous year. Furthermore, Saudi Arabia’s oil sector expanded by 3.2% in 2015 against a slower expansion of 0.9% in 2014.
Moving on to the external front, the Kingdom’s crude oil exports increased by only 0.1% to attain 2,614.5 million barrels in 2015 from 2,611.0 million barrels in 2014, according to SAMA. Similarly, the country’s exports of refined products moved up by 16.9% to 421.5 million barrels in 2015 from 360.1 million barrels in 2014.
In fact, the lion’s share of crude oil exports was accounted for by countries of Asia and the Far East region in 2015, as the region captured 63.9% of the Kingdom’s total crude oil exports. North America ranked second, importing 16.6% of the Kingdom’s total exports of crude oil. They were followed by Western European countries, receiving 12.2% of the Kingdom’s total exports of crude oil.
The impact of low oil prices was mostly felt by the Kingdom’s public finances, as actual oil revenues fell by 53% to reach US$ 115.1 billion in the past year, against a decline of 11.8% in 2014 to attain US$ 243.6 billion. In addition, actual oil revenues constituted 72% of total actual revenues in 2015, against 87% in the past year.
With regards to the Kingdom’s gas segment, Saudi Aramco announced plans to double its gas production over the next ten years. Saudi Arabia is targeting an aggressive ramp-up in gas production for use in the domestic industrial and power sectors, displacing the role of crude and releasing it for export. Gas reserves p g g p
OIL PRODUCTION AND EXPORTS
Sources: Saudi Arabian Monetary Agency, Bank Audi’s Group Research Department
CRUDE OIL PRICES
Sources: Bloomberg, Bank Audi’s Group Research Department
5June 21, 2016
ECONOMICS
SAUDI ARABIA
JUNE 21, 2016
increased by 1.2% to 303.3 trillion standard cubic feet by end-2015, against 299.7 trillion standard cubic feet by end-2014. Gas production in the country also reached an estimated 118.7 billion cubic metres (bcm) in 2015, and would rise to 131.1 bcm in 2016, according to BMI Research.
Saudi Arabia’s total domestic consumption of refined products (crude oil and natural gas) increased by 4.6% to 1,586.5 million barrels in 2015 from 1,516.8 million barrels in 2014, according to SAMA. In fact, a breakdown of the relative shares of total domestic consumption shows that natural gas accounted for 39.6% of total consumption, followed by diesel (17.9%), crude oil (13.2%), gasoline (12.9%) and fuel oil (9.2%).
The Kingdom recently approved the National Transformation Plan (NTP), a key part of a blueprint to prepare the country for the post-oil era. Nonetheless, the country, through Saudi Aramco, is not only focusing on boosting output from currently discovered fields but it is continuing to invest in its exploration activities in order to safeguard future production. Amid the global oil price slump, international oil companies made deep cuts in their exploration budgets, but Saudi Aramco made five new oil and gas discoveries in 2015 including one offshore and two in the Rub al Khali. It also discovered several new accumulations within existing fields. Similarly, the company maintained its investment in shale gas, with more development work undertaken in northern Saudi Arabia and the Jafurah Basin in the east of the Kingdom. Moreover, the failure to reach an agreement on a coordinated output freeze between key OPEC and non-OPEC producers in April 2016 prompted Saudi Arabia to raise its production from 10.2 million barrels per day (b/d) to 10.3 million b/d.
With the latter taking place alongside an expected continuity in the Kingdom’s oil strategy of increasing market share, the hydrocarbons sector would continue playing a pivotal role in the country’s economy this year. It is important that Saudi Arabia implements the NTP’s economic and social reforms designed to lessen the Kingdom’s dependence on oil exports, amid lower overall liquidity as a result of lower oil prices.
1.1.2. Non-hydrocarbon Sector
Growth in the sectoral activity at a relatively slower pace
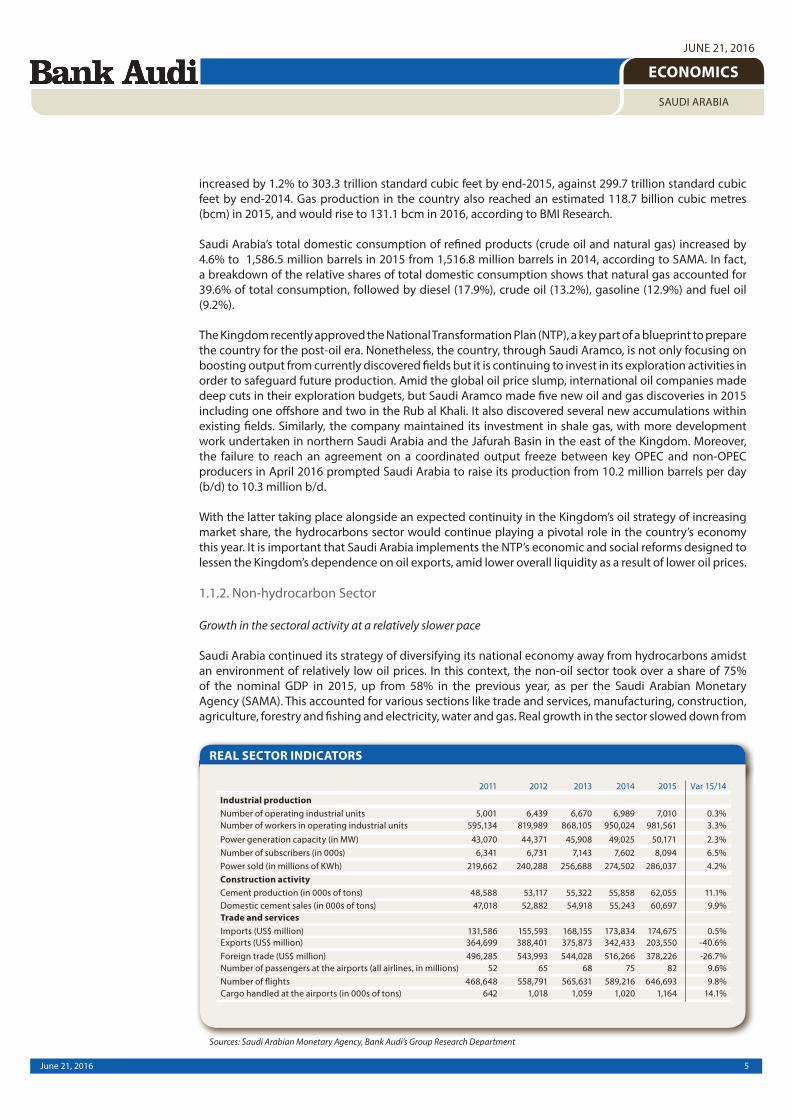
Saudi Arabia continued its strategy of diversifying its national economy away from hydrocarbons amidst an environment of relatively low oil prices. In this context, the non-oil sector took over a share of 75% of the nominal GDP in 2015, up from 58% in the previous year, as per the Saudi Arabian Monetary Agency (SAMA). This accounted for various sections like trade and services, manufacturing, construction, agriculture, forestry and fishing and electricity, water and gas. Real growth in the sector slowed down from
REAL SECTOR INDICATORS
Sources: Saudi Arabian Monetary Agency, Bank Audi’s Group Research Department
6June 21, 2016
ECONOMICS
SAUDI ARABIA
JUNE 21, 2016
4.8% in 2014 to 3.1% in 2015 triggered by a lower growth pace in both the sector’s private component whose growth slowed down from 5.4% in 2014 to 3.4% in 2015 and public component whose growth fell from 3.7% to 2.5% over the same period.
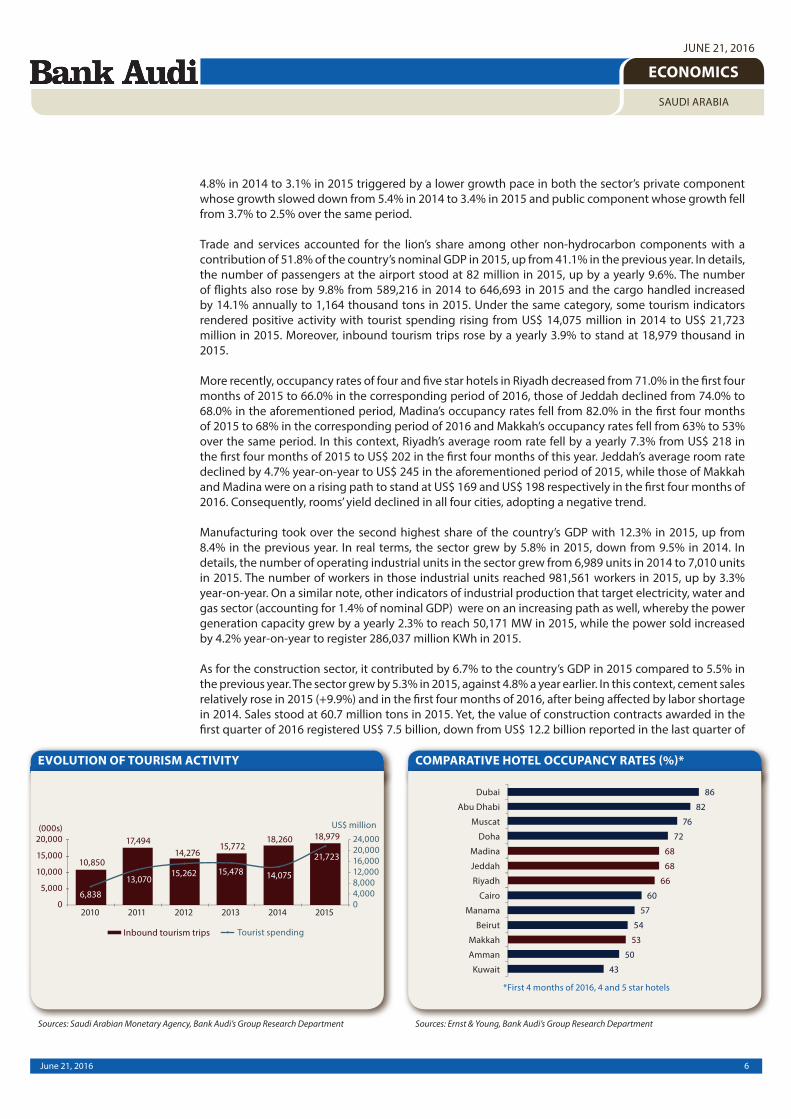
Trade and services accounted for the lion’s share among other non-hydrocarbon components with a contribution of 51.8% of the country’s nominal GDP in 2015, up from 41.1% in the previous year. In details, the number of passengers at the airport stood at 82 million in 2015, up by a yearly 9.6%. The number of flights also rose by 9.8% from 589,216 in 2014 to 646,693 in 2015 and the cargo handled increased by 14.1% annually to 1,164 thousand tons in 2015. Under the same category, some tourism indicators rendered positive activity with tourist spending rising from US$ 14,075 million in 2014 to US$ 21,723 million in 2015. Moreover, inbound tourism trips rose by a yearly 3.9% to stand at 18,979 thousand in 2015.
More recently, occupancy rates of four and five star hotels in Riyadh decreased from 71.0% in the first four months of 2015 to 66.0% in the corresponding period of 2016, those of Jeddah declined from 74.0% to 68.0% in the aforementioned period, Madina’s occupancy rates fell from 82.0% in the first four months of 2015 to 68% in the corresponding period of 2016 and Makkah’s occupancy rates fell from 63% to 53% over the same period. In this context, Riyadh’s average room rate fell by a yearly 7.3% from US$ 218 in the first four months of 2015 to US$ 202 in the first four months of this year. Jeddah’s average room rate declined by 4.7% year-on-year to US$ 245 in the aforementioned period of 2015, while those of Makkah and Madina were on a rising path to stand at US$ 169 and US$ 198 respectively in the first four months of 2016. Consequently, rooms’ yield declined in all four cities, adopting a negative trend.
Manufacturing took over the second highest share of the country’s GDP with 12.3% in 2015, up from 8.4% in the previous year. In real terms, the sector grew by 5.8% in 2015, down from 9.5% in 2014. In details, the number of operating industrial units in the sector grew from 6,989 units in 2014 to 7,010 units in 2015. The number of workers in those industrial units reached 981,561 workers in 2015, up by 3.3% year-on-year. On a similar note, other indicators of industrial production that target electricity, water and gas sector (accounting for 1.4% of nominal GDP) were on an increasing path as well, whereby the power generation capacity grew by a yearly 2.3% to reach 50,171 MW in 2015, while the power sold increased by 4.2% year-on-year to register 286,037 million KWh in 2015.
As for the construction sector, it contributed by 6.7% to the country’s GDP in 2015 compared to 5.5% in the previous year. The sector grew by 5.3% in 2015, against 4.8% a year earlier. In this context, cement sales relatively rose in 2015 (+9.9%) and in the first four months of 2016, after being affected by labor shortage in 2014. Sales stood at 60.7 million tons in 2015. Yet, the value of construction contracts awarded in the first quarter of 2016 registered US$ 7.5 billion, down from US$ 12.2 billion reported in the last quarter of
COMPARATIVE HOTEL OCCUPANCY RATES (%)* EVOLUTION OF TOURISM ACTIVITY
Sources: Ernst & Young, Bank Audi’s Group Research DepartmentSources: Saudi Arabian Monetary Agency, Bank Audi’s Group Research Department
7June 21, 2016
ECONOMICS
SAUDI ARABIA
JUNE 21, 2016
2015. This decrease highlights relatively tough economic conditions for the construction industry. Oil and gas was the main contributing sector, whereby it accounted for 47% of the awarded contracts, followed by hospitality with 21% and residential real estate with 16%. On another note, the Eastern province region captured the highest share of the value of awarded contracts. They covered mega projects associated with oil and gas, power, and residential real estate sectors. The Madinah region came in next with a 13% share, which was mainly due to projects awarded by private companies in the hospitality sector, besides the continued focus on improving the infrastructure of the power sector.
In conclusion, Saudi Arabia continued its diversification strategy with its non-hydrocarbon sector encountering growth in most of its indicators though at a relatively slower pace reflecting tough overall economic conditions.
1.2. EXTERNAL SECTOR
Current account balance under pressure amidst falling oil prices
As crude oil prices continued posting declines in 2015, Saudi Arabia’s external position was directly impacted. In fact, the Kingdom’s balance of payments performance regressed as the external current account recorded a deficit of 8.3% of GDP in 2015, compared to a surplus of 9.8% in 2014.
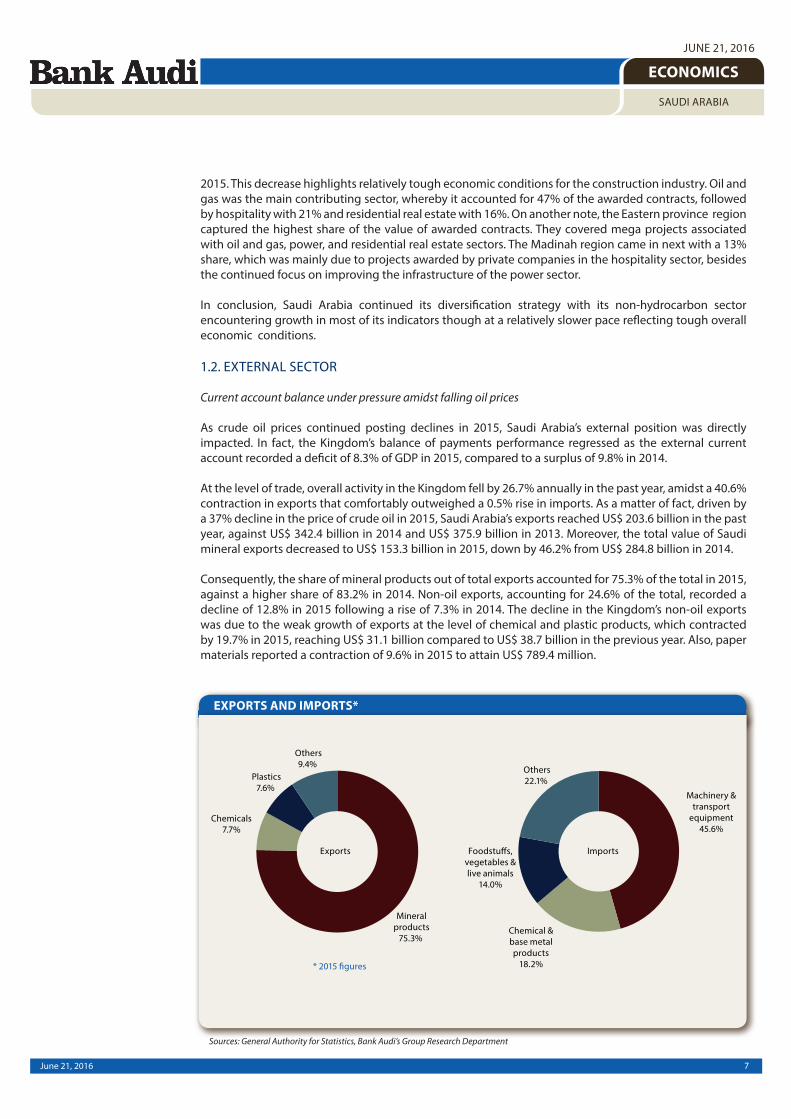
At the level of trade, overall activity in the Kingdom fell by 26.7% annually in the past year, amidst a 40.6% contraction in exports that comfortably outweighed a 0.5% rise in imports. As a matter of fact, driven by a 37% decline in the price of crude oil in 2015, Saudi Arabia’s exports reached US$ 203.6 billion in the past year, against US$ 342.4 billion in 2014 and US$ 375.9 billion in 2013. Moreover, the total value of Saudi mineral exports decreased to US$ 153.3 billion in 2015, down by 46.2% from US$ 284.8 billion in 2014.
Consequently, the share of mineral products out of total exports accounted for 75.3% of the total in 2015, against a higher share of 83.2% in 2014. Non-oil exports, accounting for 24.6% of the total, recorded a decline of 12.8% in 2015 following a rise of 7.3% in 2014. The decline in the Kingdom’s non-oil exports was due to the weak growth of exports at the level of chemical and plastic products, which contracted by 19.7% in 2015, reaching US$ 31.1 billion compared to US$ 38.7 billion in the previous year. Also, paper materials reported a contraction of 9.6% in 2015 to attain US$ 789.4 million.
EXPORTS AND IMPORTS*
Sources: General Authority for Statistics, Bank Audi’s Group Research Department
8June 21, 2016
ECONOMICS
SAUDI ARABIA
JUNE 21, 2016
Moving on to imports, they amounted to US$ 174.7 billion in 2015, rising by 0.5% from 2014, during which they increased by 3.3%. While almost all imports’ categories posted positive growth, the breakdown of imports showed that the marginal rise in imports was attributed to stronger growth in imports of foodstuffs (+5.8% annually), jewelry (+13.4%), and wood and textiles (+7.2%).
The deceleration in exports, along with a rise in imports, led the trade surplus to shrink by 82.9% in 2015. Overall, the current account balance in Saudi Arabia recorded a shift from a surplus of US$ 73.9 billion in 2014 to a deficit of US$ 53.6 billion in 2015.
Last but not least, Saudi Arabia is expected to post a negative current account balance in 2016 (of US$ 63.1 billion as per IMF estimates, the equivalent of 10.2% of GDP), although the country’s trade balance would continue to record net surpluses. This scenario is estimated to take place amid persistently low oil prices and in spite of the Kingdom aiming to free itself from oil dependence.
1.3. PUBLIC SECTOR
A record high fiscal deficit leading the way towards drastic budgetary reforms
Saudi Arabia’s fiscal performance in 2015 was underpinned by a sharp fall in public revenues, reaching its lowest level since 2009 amidst lower oil revenues, and a reduction in public expenditures for the first time since 2002, on the back of fiscal measures leading to lower current and capital expenditures. Accordingly, a record high fiscal deficit was registered in 2015, well exceeding budgeted figures.
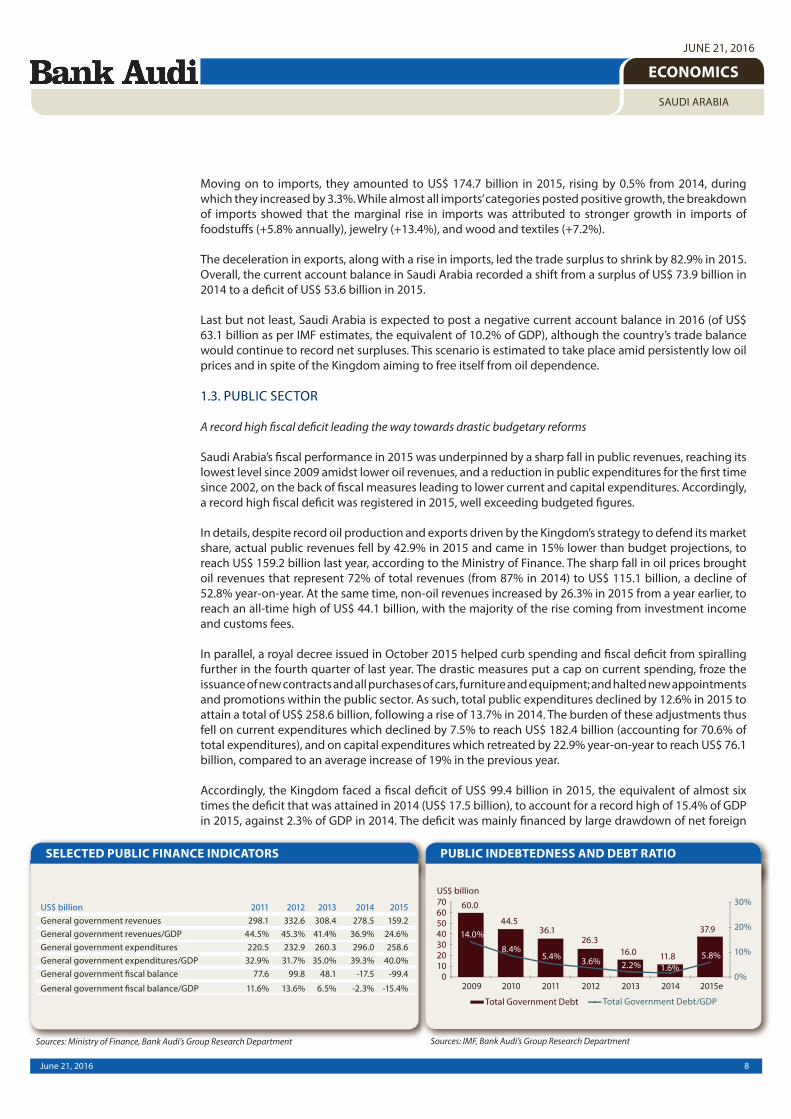
In details, despite record oil production and exports driven by the Kingdom’s strategy to defend its market share, actual public revenues fell by 42.9% in 2015 and came in 15% lower than budget projections, to reach US$ 159.2 billion last year, according to the Ministry of Finance. The sharp fall in oil prices brought oil revenues that represent 72% of total revenues (from 87% in 2014) to US$ 115.1 billion, a decline of 52.8% year-on-year. At the same time, non-oil revenues increased by 26.3% in 2015 from a year earlier, to reach an all-time high of US$ 44.1 billion, with the majority of the rise coming from investment income and customs fees.
In parallel, a royal decree issued in October 2015 helped curb spending and fiscal deficit from spiralling further in the fourth quarter of last year. The drastic measures put a cap on current spending, froze the issuance of new contracts and all purchases of cars, furniture and equipment; and halted new appointments and promotions within the public sector. As such, total public expenditures declined by 12.6% in 2015 to attain a total of US$ 258.6 billion, following a rise of 13.7% in 2014. The burden of these adjustments thus fell on current expenditures which declined by 7.5% to reach US$ 182.4 billion (accounting for 70.6% of total expenditures), and on capital expenditures which retreated by 22.9% year-on-year to reach US$ 76.1 billion, compared to an average increase of 19% in the previous year.
Accordingly, the Kingdom faced a fiscal deficit of US$ 99.4 billion in 2015, the equivalent of almost six times the deficit that was attained in 2014 (US$ 17.5 billion), to account for a record high of 15.4% of GDP in 2015, against 2.3% of GDP in 2014. The deficit was mainly financed by large drawdown of net foreign
Sources: Ministry of Finance, Bank Audi’s Group Research Department Sources: IMF, Bank Audi’s Group Research Department
SELECTED PUBLIC FINANCE INDICATORS PUBLIC INDEBTEDNESS AND DEBT RATIO

9June 21, 2016
ECONOMICS
SAUDI ARABIA
JUNE 21, 2016
assets and increased domestic debt issuance, as net government domestic debt issuance amounted to US$ 26 billion, bringing total gross public debt to 5.8% of GDP at end-2015, from 1.6% of GDP at end-2014.
Looking ahead, the 2016 budget confirms the government’s fiscal consolidation stance, with a projected fiscal deficit of US$ 87 billion (or 14.1% of GDP in 2016), down by 12.5% compared to the 2015 level. On the revenue side, the budget highlights the efforts to diversify away from oil-related sources (in line with the Kingdom’s National Vision 2030), as new measures will be stepped up within the context of low oil prices, although modest in scope. The 2016 budget outlined plans to introduce new taxes on tobacco and soft drinks. The budget projects that total revenues could reach US$ 137 billion, yet almost 14% lower than 2015 actual revenues. Introducing value added tax (VAT) is also in the pipeline, although VAT is unlikely to be introduced before 2018, and at a low rate of around 5%.
However, the major focus of the fiscal adjustments will be on capital expenditures, with transport and building projects (including a proposed Mecca Metro network) being delayed or cancelled. In addition, the government will delay some military acquisitions, reduce foreign aid and make cuts to the US$ 6 billion foreign scholarship program for Saudi students. As such, the budget points towards belt-tightening measures, with spending forecast at US$ 224 billion, almost 13% lower than actual spending levels in 2015. Expenditure reductions are likely to affect almost all sectors, but most notably municipal services, health and social development, and education. Moreover, in its 2016 budget, the Ministry of Finance laid out additional retrenchment measures, including reducing subsidies on electricity, water and fuel. It is worth mentioning that the cabinet has announced in December 2015 a 50% increase in petrol prices, and raised natural gas and water prices sharply soon afterwards.
Amid this unprecedented economic downturn and being aware of the need to protect its reserve stocks, Saudi Arabia plans to tap international debt markets for the first time as early as September and set up a bond program to finance its fiscal deficit, after securing an oversubscribed US$ 10 billion loan with a syndicate of foreign banks in April 2016. As a result, total gross public debt is expected to soar from a negligible 5.8% of GDP in 2015 to 17.2% of GDP in 2016 and 25.8% of GDP in 2017, as per the IMF.
1.4. FINANCIAL SECTOR
1.4.1. Monetary Situation
Net contractions in monetary aggregates along with extended falls in SAMA’s reserves
Saudi monetary conditions were marked by rising inflationary pressures during the first four months of 2016 with the IMF expecting the cost of living index to reach in 2016 its highest level since 2010, in addition to first-time net contractions in broader money supply within the context of tighter domestic liquidity in an era of low oil prices, and extended declines in SAMA’s foreign assets for the second consecutive year as the Kingdom continued to draw upon its foreign reserves to finance its budget deficit.
In details, the cost of living index increased by 4.3% on average during the first four months of 2016 after rising by 2.2% on average in 2015, mainly driven by a shy oil price recovery since January 2016 and more than 50% reduction in petrol subsidies at end-December 2015, in addition to doubling customs fees on tobacco products in March 2016. The breakdown of the cost of living index by category during the first four months of 2016 shows that the transport segment rose by 12.6% on average, followed by the tobacco segment with + 10.9%, the housing, water, electricity, gas, and other fuels segment with +8.1%, the health segment with +5.9%, the education segment with +5.4%, the clothing and footwear with +4.8%, the furnishings, household equipment & routine household maintenance segment with +2.2%, the miscellaneous goods and services segment with +2.0%, the communication segment with +1.1%, the food and non-alcoholic beverages segment with +1.0% and the recreation and culture segment with +0.2%.
The Saudi riyal remained pegged to the US dollar at SR 3.75/US$ 1, despite speculation over currency devaluation that was mainly triggered by an oil rout and exacerbated by changes in SAMA’s governorship. Under such conditions, the new Governor reiterated recently that SAMA would keep the currency peg to the US dollar, supported by its monetary tools, one of which is its foreign reserves.
10June 21, 2016
ECONOMICS
SAUDI ARABIA
JUNE 21, 2016
Given the peg, SAMA lifted in December 2015 its reverse repo rate by 25 bps, from 0.25% to 0.50%, which marked its first increase since June 2009. This followed a US interest rate hike by 25 bps for the first time in almost a decade in December 2015. Yet, SAMA left its repo rate unchanged at 2.0% since January 2009.
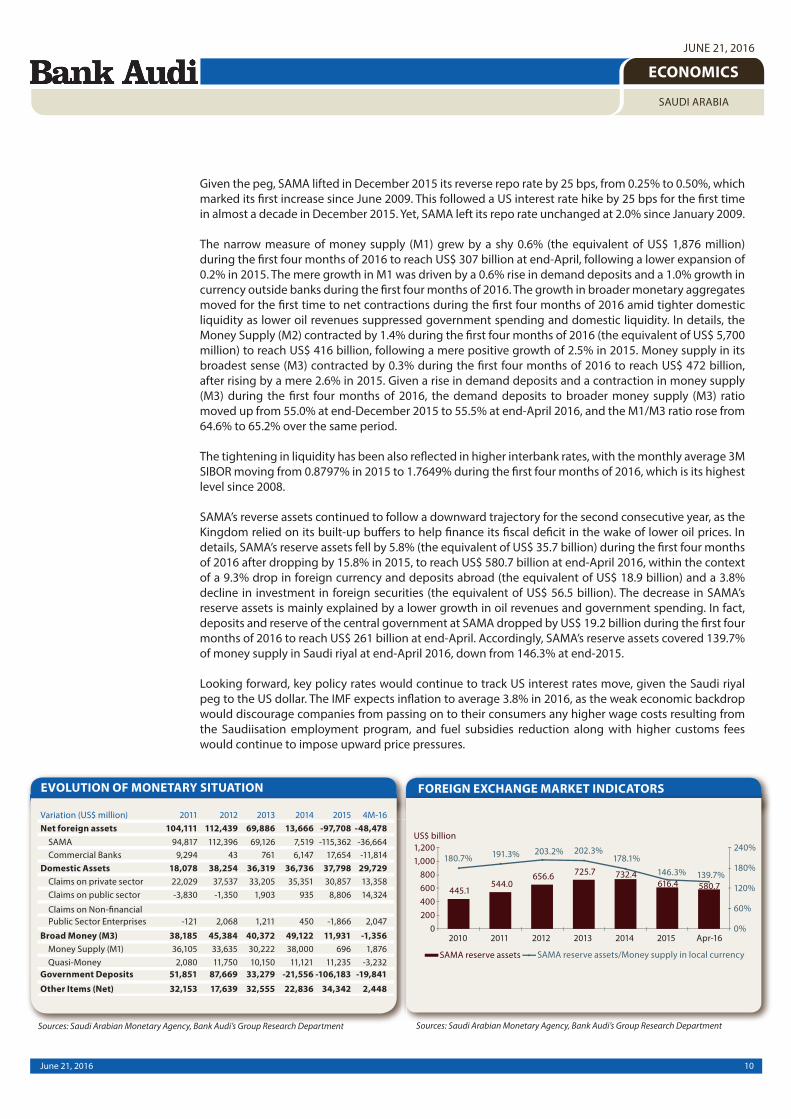
The narrow measure of money supply (M1) grew by a shy 0.6% (the equivalent of US$ 1,876 million) during the first four months of 2016 to reach US$ 307 billion at end-April, following a lower expansion of 0.2% in 2015. The mere growth in M1 was driven by a 0.6% rise in demand deposits and a 1.0% growth in currency outside banks during the first four months of 2016. The growth in broader monetary aggregates moved for the first time to net contractions during the first four months of 2016 amid tighter domestic liquidity as lower oil revenues suppressed government spending and domestic liquidity. In details, the Money Supply (M2) contracted by 1.4% during the first four months of 2016 (the equivalent of US$ 5,700 million) to reach US$ 416 billion, following a mere positive growth of 2.5% in 2015. Money supply in its broadest sense (M3) contracted by 0.3% during the first four months of 2016 to reach US$ 472 billion, after rising by a mere 2.6% in 2015. Given a rise in demand deposits and a contraction in money supply (M3) during the first four months of 2016, the demand deposits to broader money supply (M3) ratio moved up from 55.0% at end-December 2015 to 55.5% at end-April 2016, and the M1/M3 ratio rose from 64.6% to 65.2% over the same period.
The tightening in liquidity has been also reflected in higher interbank rates, with the monthly average 3M SIBOR moving from 0.8797% in 2015 to 1.7649% during the first four months of 2016, which is its highest level since 2008.
SAMA’s reverse assets continued to follow a downward trajectory for the second consecutive year, as the Kingdom relied on its built-up buffers to help finance its fiscal deficit in the wake of lower oil prices. In details, SAMA’s reserve assets fell by 5.8% (the equivalent of US$ 35.7 billion) during the first four months of 2016 after dropping by 15.8% in 2015, to reach US$ 580.7 billion at end-April 2016, within the context of a 9.3% drop in foreign currency and deposits abroad (the equivalent of US$ 18.9 billion) and a 3.8% decline in investment in foreign securities (the equivalent of US$ 56.5 billion). The decrease in SAMA’s reserve assets is mainly explained by a lower growth in oil revenues and government spending. In fact, deposits and reserve of the central government at SAMA dropped by US$ 19.2 billion during the first four months of 2016 to reach US$ 261 billion at end-April. Accordingly, SAMA’s reserve assets covered 139.7% of money supply in Saudi riyal at end-April 2016, down from 146.3% at end-2015.
Looking forward, key policy rates would continue to track US interest rates move, given the Saudi riyal peg to the US dollar. The IMF expects inflation to average 3.8% in 2016, as the weak economic backdrop would discourage companies from passing on to their consumers any higher wage costs resulting from the Saudiisation employment program, and fuel subsidies reduction along with higher customs fees would continue to impose upward price pressures.
EVOLUTION OF MONETARY SITUATION
Sources: Saudi Arabian Monetary Agency, Bank Audi’s Group Research Department
FOREIGN EXCHANGE MARKET INDICATORS
Sources: Saudi Arabian Monetary Agency, Bank Audi’s Group Research Department
11June 21, 2016
ECONOMICS
SAUDI ARABIA
JUNE 21, 2016
1.4.2. Banking Activity
Activity drivers further slowing down but sector well placed to cope with tough operating conditions
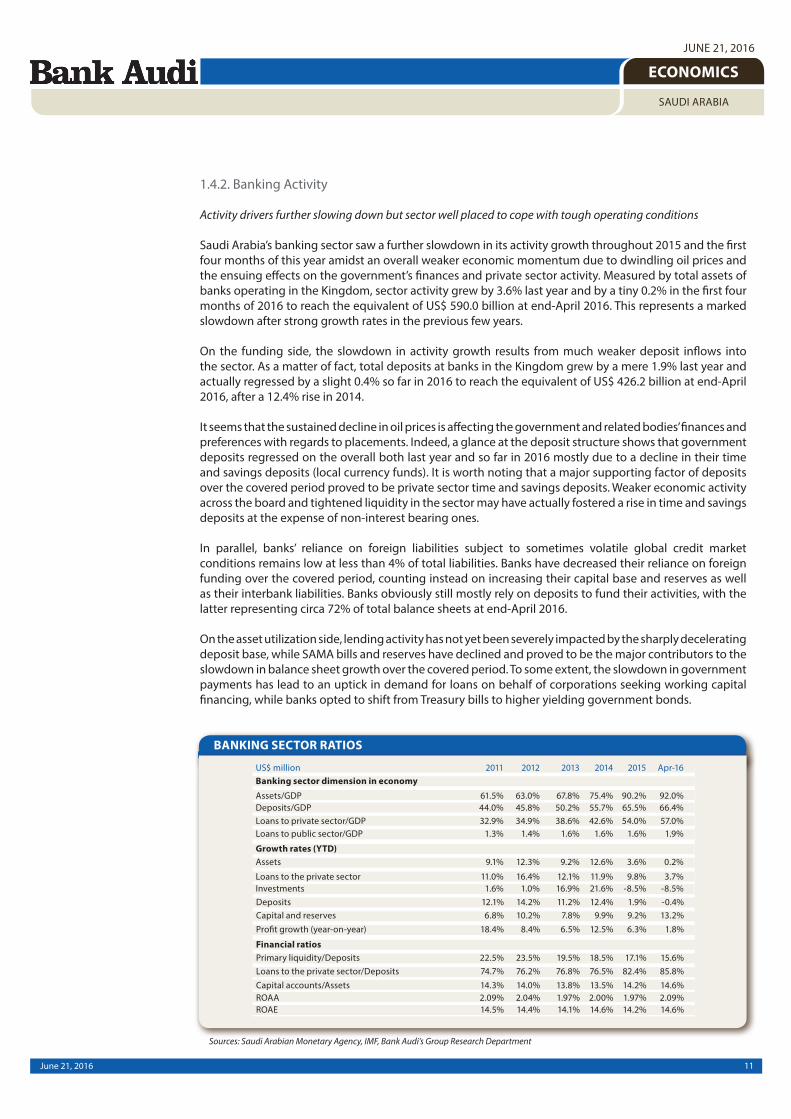
Saudi Arabia’s banking sector saw a further slowdown in its activity growth throughout 2015 and the first four months of this year amidst an overall weaker economic momentum due to dwindling oil prices and the ensuing effects on the government’s finances and private sector activity. Measured by total assets of banks operating in the Kingdom, sector activity grew by 3.6% last year and by a tiny 0.2% in the first four months of 2016 to reach the equivalent of US$ 590.0 billion at end-April 2016. This represents a marked slowdown after strong growth rates in the previous few years.
On the funding side, the slowdown in activity growth results from much weaker deposit inflows into the sector. As a matter of fact, total deposits at banks in the Kingdom grew by a mere 1.9% last year and actually regressed by a slight 0.4% so far in 2016 to reach the equivalent of US$ 426.2 billion at end-April 2016, after a 12.4% rise in 2014.
It seems that the sustained decline in oil prices is affecting the government and related bodies’ finances and preferences with regards to placements. Indeed, a glance at the deposit structure shows that government deposits regressed on the overall both last year and so far in 2016 mostly due to a decline in their time and savings deposits (local currency funds). It is worth noting that a major supporting factor of deposits over the covered period proved to be private sector time and savings deposits. Weaker economic activity across the board and tightened liquidity in the sector may have actually fostered a rise in time and savings deposits at the expense of non-interest bearing ones.
In parallel, banks’ reliance on foreign liabilities subject to sometimes volatile global credit market conditions remains low at less than 4% of total liabilities. Banks have decreased their reliance on foreign funding over the covered period, counting instead on increasing their capital base and reserves as well as their interbank liabilities. Banks obviously still mostly rely on deposits to fund their activities, with the latter representing circa 72% of total balance sheets at end-April 2016.
On the asset utilization side, lending activity has not yet been severely impacted by the sharply decelerating deposit base, while SAMA bills and reserves have declined and proved to be the major contributors to the slowdown in balance sheet growth over the covered period. To some extent, the slowdown in government payments has lead to an uptick in demand for loans on behalf of corporations seeking working capital financing, while banks opted to shift from Treasury bills to higher yielding government bonds.
BANKING SECTOR RATIOS
Sources: Saudi Arabian Monetary Agency, IMF, Bank Audi’s Group Research Department
12June 21, 2016
ECONOMICS
SAUDI ARABIA
JUNE 21, 2016
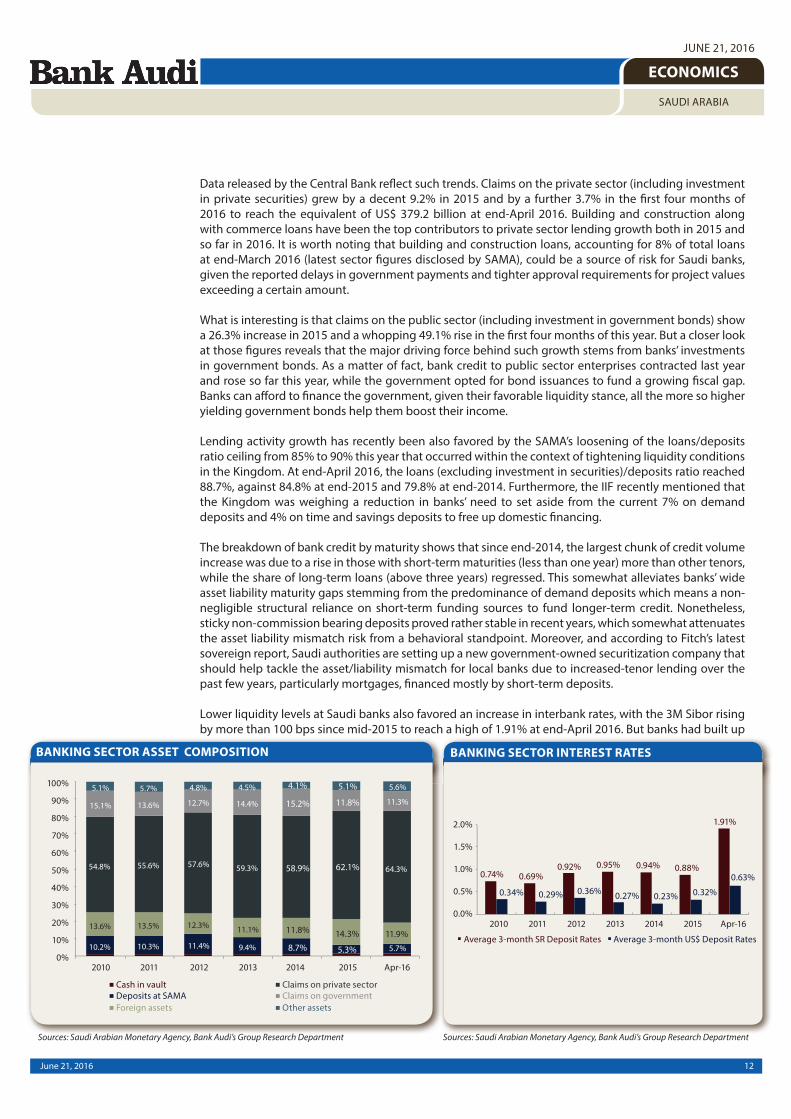
Data released by the Central Bank reflect such trends. Claims on the private sector (including investment in private securities) grew by a decent 9.2% in 2015 and by a further 3.7% in the first four months of 2016 to reach the equivalent of US$ 379.2 billion at end-April 2016. Building and construction along with commerce loans have been the top contributors to private sector lending growth both in 2015 and so far in 2016. It is worth noting that building and construction loans, accounting for 8% of total loans at end-March 2016 (latest sector figures disclosed by SAMA), could be a source of risk for Saudi banks, given the reported delays in government payments and tighter approval requirements for project values exceeding a certain amount.
What is interesting is that claims on the public sector (including investment in government bonds) show a 26.3% increase in 2015 and a whopping 49.1% rise in the first four months of this year. But a closer look at those figures reveals that the major driving force behind such growth stems from banks’ investments in government bonds. As a matter of fact, bank credit to public sector enterprises contracted last year and rose so far this year, while the government opted for bond issuances to fund a growing fiscal gap. Banks can afford to finance the government, given their favorable liquidity stance, all the more so higher yielding government bonds help them boost their income.
Lending activity growth has recently been also favored by the SAMA’s loosening of the loans/deposits ratio ceiling from 85% to 90% this year that occurred within the context of tightening liquidity conditions in the Kingdom. At end-April 2016, the loans (excluding investment in securities)/deposits ratio reached 88.7%, against 84.8% at end-2015 and 79.8% at end-2014. Furthermore, the IIF recently mentioned that the Kingdom was weighing a reduction in banks’ need to set aside from the current 7% on demand deposits and 4% on time and savings deposits to free up domestic financing.
The breakdown of bank credit by maturity shows that since end-2014, the largest chunk of credit volume increase was due to a rise in those with short-term maturities (less than one year) more than other tenors, while the share of long-term loans (above three years) regressed. This somewhat alleviates banks’ wide asset liability maturity gaps stemming from the predominance of demand deposits which means a non-negligible structural reliance on short-term funding sources to fund longer-term credit. Nonetheless, sticky non-commission bearing deposits proved rather stable in recent years, which somewhat attenuates the asset liability mismatch risk from a behavioral standpoint. Moreover, and according to Fitch’s latest sovereign report, Saudi authorities are setting up a new government-owned securitization company that should help tackle the asset/liability mismatch for local banks due to increased-tenor lending over the past few years, particularly mortgages, financed mostly by short-term deposits.
Lower liquidity levels at Saudi banks also favored an increase in interbank rates, with the 3M Sibor rising by more than 100 bps since mid-2015 to reach a high of 1.91% at end-April 2016. But banks had built up
BANKING SECTOR ASSET COMPOSITION
Sources: Saudi Arabian Monetary Agency, Bank Audi’s Group Research Department
BANKING SECTOR INTEREST RATES
Sources: Saudi Arabian Monetary Agency, Bank Audi’s Group Research Department

13June 21, 2016
ECONOMICS
SAUDI ARABIA
JUNE 21, 2016
some liquidity buffers in previous years, mostly consisting of cash and placements at the Central Bank and banks, in addition to government Treasury bills, and that ensure an adequate liquidity position on the overall. The primary liquidity ratio, measured as the ratio of reserves and placements with banks in the Kingdom and abroad to total deposits, reached 15.6% at end-April 2016, down from 17.1% at end-2015 and 18.5% at end-2014 due to lower other deposits with SAMA and placements with branches and banks abroad this year. But when including relatively liquid government securities, the ratio rises to a relatively decent 28.4% at end-April 2016.
On the asset quality front, metrics remain more than favorable. The non-performing loans to total loans ratio remains among the lowest in the world, standing at 1.2% at end-2015. NPLs are more than fully provisioned, as evidenced by a negative NPLs net of provisions to total capital ratio of -3.7%. It is yet true that within the current environment, asset quality risks are skewed to the downside, and that banks are exposed to borrower concentration risks. But the SAMA has lately set stricter regulations on single-borrower concentrations whereby its cap will be gradually lowered to 15% of capital and reserves from 25% by 2019. In parallel, Saudi banks continue to benefit from comfortable capital buffers, with the regulatory capital to risk-weighted assets ratio at 18.1% at end-2015, the bulk of which is composed of Tier 1 capital (Tier 1 ratio of 16.2%), well above Basle III and SAMA requirements.
Last but not least, Saudi banks saw a gradual slowdown in their bottom line growth in light of weaker economic momentum across the board, but their profitability ratios remain adequate. Indeed, net profits of the sector, which used to grow at 12.5% in 2014 prior to the oil slump, grew by a mere 6.3% in 2015 and by a yearly 1.8% in the first four months of 2016. Still, the positive growth can be attributed to positive lending activity growth coupled with comfortable margins on the back of a low-cost deposit base, benign provisioning levels so far and balance sheet liquidity optimization due to growing high-yielding investments and higher asset yields driven by the upward re-pricing of the Sibor and switch from Treasury bills to government bonds. Profitability ratios still remain favorable, with the annualized return on average assets and on average equity respectively standing at 2.1% and 14.6% in the first four months of 2016.
1.4.3. Equity and Bond Markets
Extended price declines in equity market, bond prices up tracking US Treasuries move
Saudi capital markets were marked during the first five months of 2016 by extended equity price declines for the third consecutive year along with a fall in activity and turnover ratio given a weak investor sentiment in a protracted era of low oil prices. The fixed income market saw mostly upward price movements so far in 2016, after dipping in the red in 2015, mainly tracking US Treasuries move, while the cost of insuring debt recorded small year-to-date expansions.
In details, the Saudi Tadawul ended the first five months of 2016 on a negative note, as reflected by a 6.7% fall in The Tadawul All-Share Index (TASI) to close at 6,448.42 at end-May 2016, extending the downward trajectory traced since 2014, despite a monthly price rebound registered in April 2016 after the Deputy Crown Prince announced a far-reaching economic reform plan.
The Saudi Tadawul was actually marked by a weaker investor sentiment over the first five months of 2016 on lingering concerns over an extended fiscal deficit eroding the Kingdom’s fiscal buffers in an era of lower oil prices and the failure of the world’s largest oil producers to reach an agreement on capping production. This sentiment prevailed despite an oil price recovery during the first few months of 2016, with Brent prices hovering around US$ 50 per barrel at end-May, marking a year-to-date increase of 19.3% amid some global supply disruptions and bets that oil prices might have bottomed out.
It is worth mentioning that Saudi equities pursued a downward trajectory during the first five months of 2016 despite relatively cheaper market pricing ratios. In fact, Saudi stocks traded at a P/E of 12.8x at end-May 2016 as compared to a P/E of 13.8x at end-December 2015 and 14.0x at end-December 2014, and at P/BV of 1.6x at end-May 2016 versus a P/BV of 1.7x at end-December 2015 and 2.0x at end-December 2014.
14June 21, 2016
ECONOMICS
SAUDI ARABIA
JUNE 21, 2016
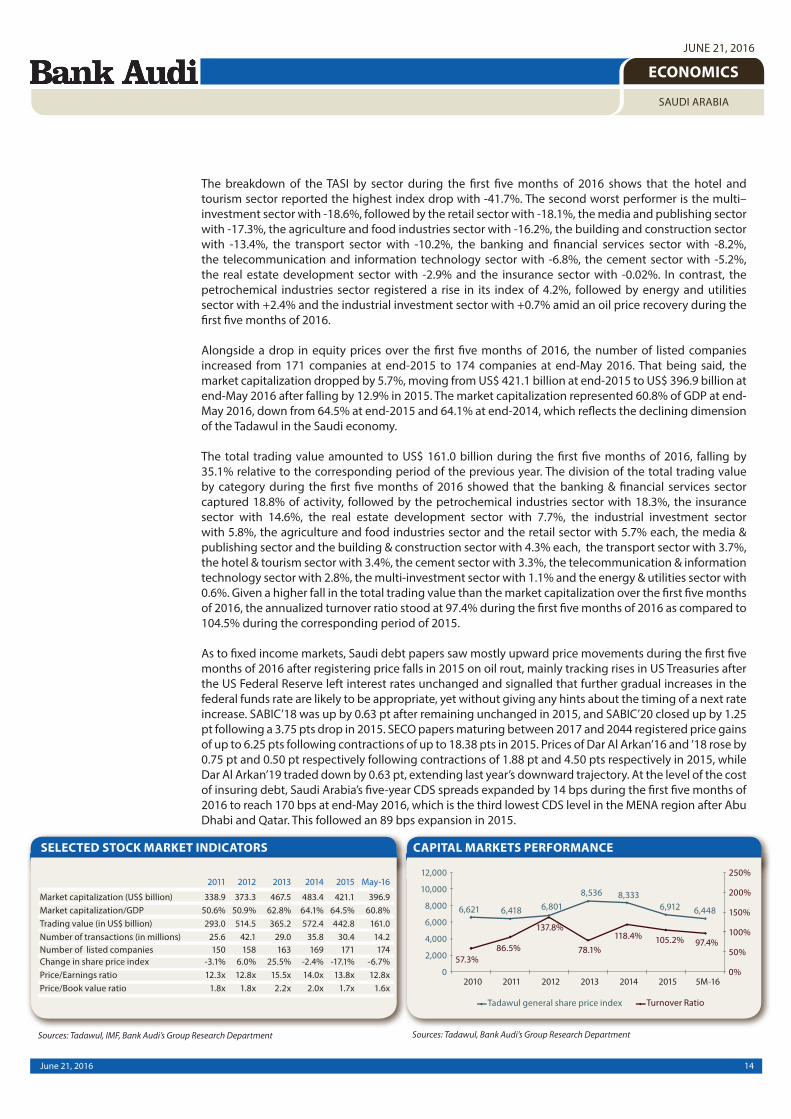
The breakdown of the TASI by sector during the first five months of 2016 shows that the hotel and tourism sector reported the highest index drop with -41.7%. The second worst performer is the multi–investment sector with -18.6%, followed by the retail sector with -18.1%, the media and publishing sector with -17.3%, the agriculture and food industries sector with -16.2%, the building and construction sector with -13.4%, the transport sector with -10.2%, the banking and financial services sector with -8.2%, the telecommunication and information technology sector with -6.8%, the cement sector with -5.2%, the real estate development sector with -2.9% and the insurance sector with -0.02%. In contrast, the petrochemical industries sector registered a rise in its index of 4.2%, followed by energy and utilities sector with +2.4% and the industrial investment sector with +0.7% amid an oil price recovery during the first five months of 2016.
Alongside a drop in equity prices over the first five months of 2016, the number of listed companies increased from 171 companies at end-2015 to 174 companies at end-May 2016. That being said, the market capitalization dropped by 5.7%, moving from US$ 421.1 billion at end-2015 to US$ 396.9 billion at end-May 2016 after falling by 12.9% in 2015. The market capitalization represented 60.8% of GDP at end-May 2016, down from 64.5% at end-2015 and 64.1% at end-2014, which reflects the declining dimension of the Tadawul in the Saudi economy.
The total trading value amounted to US$ 161.0 billion during the first five months of 2016, falling by 35.1% relative to the corresponding period of the previous year. The division of the total trading value by category during the first five months of 2016 showed that the banking & financial services sector captured 18.8% of activity, followed by the petrochemical industries sector with 18.3%, the insurance sector with 14.6%, the real estate development sector with 7.7%, the industrial investment sector with 5.8%, the agriculture and food industries sector and the retail sector with 5.7% each, the media & publishing sector and the building & construction sector with 4.3% each, the transport sector with 3.7%, the hotel & tourism sector with 3.4%, the cement sector with 3.3%, the telecommunication & information technology sector with 2.8%, the multi-investment sector with 1.1% and the energy & utilities sector with 0.6%. Given a higher fall in the total trading value than the market capitalization over the first five months of 2016, the annualized turnover ratio stood at 97.4% during the first five months of 2016 as compared to 104.5% during the corresponding period of 2015.
As to fixed income markets, Saudi debt papers saw mostly upward price movements during the first five months of 2016 after registering price falls in 2015 on oil rout, mainly tracking rises in US Treasuries after the US Federal Reserve left interest rates unchanged and signalled that further gradual increases in the federal funds rate are likely to be appropriate, yet without giving any hints about the timing of a next rate increase. SABIC’18 was up by 0.63 pt after remaining unchanged in 2015, and SABIC’20 closed up by 1.25 pt following a 3.75 pts drop in 2015. SECO papers maturing between 2017 and 2044 registered price gains of up to 6.25 pts following contractions of up to 18.38 pts in 2015. Prices of Dar Al Arkan’16 and ’18 rose by 0.75 pt and 0.50 pt respectively following contractions of 1.88 pt and 4.50 pts respectively in 2015, while Dar Al Arkan’19 traded down by 0.63 pt, extending last year’s downward trajectory. At the level of the cost of insuring debt, Saudi Arabia’s five-year CDS spreads expanded by 14 bps during the first five months of 2016 to reach 170 bps at end-May 2016, which is the third lowest CDS level in the MENA region after Abu Dhabi and Qatar. This followed an 89 bps expansion in 2015.
SELECTED STOCK MARKET INDICATORS
Sources: Tadawul, IMF, Bank Audi’s Group Research Department
CAPITAL MARKETS PERFORMANCE
Sources: Tadawul, Bank Audi’s Group Research Department
15June 21, 2016
ECONOMICS
SAUDI ARABIA
JUNE 21, 2016
In an era of low oil prices exerting pressures on the Kingdom’s fiscal and external balances, Saudi Arabia saw several rating cuts during the first five months of 2016. Standard & Poor’s lowered in February 2016 its unsolicited long-term and short-term foreign currency and local currency sovereign credit ratings on the Kingdom of Saudi Arabia to “A-/A-2” from “A+/A-1”, with “stable” outlook, and affirmed these ratings in April 2016. S&P said that the ratings on Saudi Arabia are supported by its strong external and fiscal stock positions, which the international credit rating agency expects would be maintained despite significant current account and fiscal deficits. The ratings are constrained by underdeveloped public institutions, lower GDP per capita relative to similarly rated sovereigns, and limited monetary flexibility.
Also, Fitch downgraded in April 2016 Saudi Arabia’s long-term foreign and local currency IDR to “AA-” from “AA”, with “negative” outlook. The downgrade reflects Fitch’s oil price assumptions for 2016 and 2017 of US$ 35 per barrel and US$ 45 per barrel, respectively, with major negative implications for Saudi Arabia’s fiscal and external balances and further slowdown in real GDP growth.
Moody’s downgraded in May 2016 the KSA’s long-term issuer ratings to “A1” from “Aa3” and assigned a “stable” outlook. The downgrade reflects Moody’s view that lower oil prices have led to a material deterioration in KSA’s credit profile. A combination of lower growth, higher debt levels and smaller domestic and external buffers leave the Kingdom less well positioned to weather future shocks. The “stable” outlook indicates that, at this lower rating level, risks are broadly balanced, as per Moody’s.
Amid shrinking oil revenues pressuring the Kingdom’s finances, Saudi Arabia recently unveiled plans to sell its first bond in international capital markets as the Kingdom tackles a widening budget deficit caused by cheap oil prices. This followed a US$ 9 billion bond sale by Qatar in May 2016, which attracted orders of US$ 23 billion. Also, Saudi Aramco is working with JPMorgan Chase & Co., HSBC Holdings and Riyad Bank on the company’s first sale of Islamic bonds. Saudi Arabian Airlines (Saudia) appointed HSBC as the lead arranger for a SR 5 billion Sukuk issue that would be used to finance fleet expansion. Finally, Sipchem hired Riyad Bank and NCB Capital to manage a Sukuk sale.
16June 21, 2016
ECONOMICS
SAUDI ARABIA
JUNE 21, 2016
2. CONCLUDING REMARKS
Having said that, what is the outlook of the Saudi economy looking forward amid fiscal austerity, flattish oil output and declining investment? Beyond the rising imbalances exposed by the oil revenue slump, growth is also set to fall away, as the rationalization of public spending, the main channel to convert the Kingdom’s oil wealth into economic development, is affecting the outlook for business sentiment at large. In place of the 5% plus growth rate of the boom era, it is widely believed that trend growth in the current oil price environment could be as low as 1%, which underlines a weak pace of expansion that is inadequate to meet the rising demand for jobs, infrastructure houses and services guaranteed by its overwhelmingly youthful demography. Weak growth would require the authorities to limit the influx or reduce the number of foreign workers, particularly unskilled labor, to stem growing national unemployment.
At the fiscal level, the government budget is likely to remain under pressure over the short to medium term despite recent measures to control expenditures and lower subsidies. In fact, the demand for public services such as health and education, as well as subsidies on electricity and water, increases quickly, in line with rapid population growth, while pressures on the revenue side are set to increase in view of the budget’s dependence on declining oil revenues. Despite the fall in oil prices, hydrocarbons accounted for 72% of central government revenues, 75% of merchandise exports and 25% of GDP in 2015.
In an arena of rising macro vulnerabilities, it is economic necessity that leads us to believe that the Kingdom may be heading toward a substantial phase of structural economic adjustment. Within this context, the Kingdom launched its National Vision 2030 intended to gradually free the country from its oil dependence. Vision 2030 calls for, among others, the sale of 5% of Saudi Aramco within 2 years, a doubling of non-oil exports, a massive increase in mining activity by 2020 and a rapid build-up in renewable energy generation. Vision 2030 actually sets out the goal of an adequately bold and far-reaching transformation of the Saudi Arabian economy to diversify growth, reduce the dependence on oil, increase the role of the private sector and create more jobs for nationals. To ensure the success of forthcoming supporting policies, the reforms will have to be properly prioritized and sequenced, and the appropriate pace of implementation adequately assessed.
At the monetary level, monetary policy remains constrained by the peg to the US dollar, although this provides an important nominal anchor. Despite speculation about devaluation amid rising economic distortions, a change in the peg remains significantly unlikely. It is widely believed that the exchange rate peg to the US dollar continues to serve Saudi Arabia well given the structure of the economy at large. Inflation-wise, tighter domestic liquidity will ensure minimal demand-side price pressures. At the banking level, credit growth is likely to contract further, given the strong correlation between oil prices, government spending and credit growth. While asset quality is likely to deteriorate, it would not endanger the system solvency, owing to countercyclical buffers the regulator has imposed in recent years.
To appropriately assess the Saudi macro outlook, it is important to look at the positive drivers and risk factors. At the level of positive drivers, we mention the substantial hydrocarbon reserves and oil export capacity, the low albeit rising public and external debt metrics, the persistently high external liquidity and the sound banking system with prudent regulation. At the level of risk factors, we mention the overreliance on oil windfalls and associated structural fiscal vulnerabilities, the relatively high unemployment, the challenging demographic profile and long term socio-economic issues, the institutional weaknesses and geopolitical risk factors. Despite growing challenges for the Kingdom, we believe persistent opportunities still outpace emerging threats at the horizon.
Finally, while the emerging structural measures are likely to help contain challenges, the IMF recommended in its 2016 Article IV mission’s report finalized recently a gradually rising role of the private sector in the Kingdom’s economy through privatization and private public partnerships, reforms to further reinforce the business environment and attract foreign investment, notwithstanding the support of capital markets development at large. In parallel, a gradual but sizeable fiscal adjustment undoubtedly needs to continue and be sustained with the aim of achieving a balanced budget over the medium-term.
17June 21, 2016
ECONOMICS
SAUDI ARABIA
JUNE 21, 2016
DISCLAIMER
The content of this publication is provided as general information only and should not be taken as an advice to invest or engage in any form of financial or commercial activity. Any action that you may take as a result of information in this publication remains your sole responsibility. None of the materials hereinconstitute offers or solicitations to purchase or sell securities, your investment decisions should not be made based upon the information herein. Although Bank Audi Sal considers the content of this publication reliable, it shall have no liability for its content and makes no warranty, representation or guarantee as to its accuracy or completeness.
Bank Audi sal - Group Research Department - Bank Audi Plaza - Bab Idriss - PO Box 11-2560 - Lebanon - Tel: 961 1 994 000 - email: [email protected]