Embed Size (px)
Citation preview
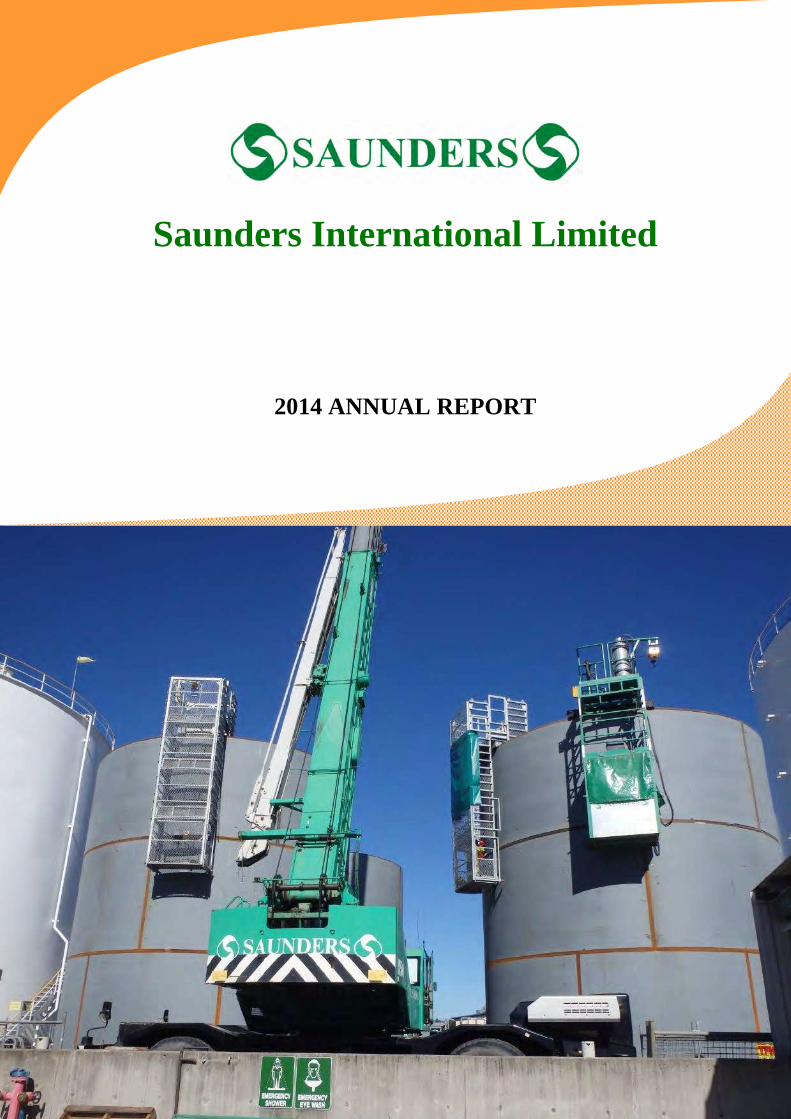
Saunders International Limited
2014 ANNUAL REPORT
Saunders International Limited
ABN 14 050 287 431
2014 ANNUAL REPORT
CONTENTS
1. Letter to Shareholders ................................................................................... 1
2. Board of Directors .......................................................................................... 2
3. Business Profile and 2014 Clients ................................................................. 3
4. Directors’ Report ............................................................................................ 4
5. Auditor’s Independence Declaration ........................................................... 11
6. Independent Audit Report ........................................................................... 12
7. Directors’ Declaration .................................................................................. 14
8. Statement of Comprehensive Income ......................................................... 15
9. Statement of Financial Position ................................................................... 16
10. Statement of Changes in Equity .................................................................. 17
11. Statement of Cash Flows ............................................................................ 18
12. Notes to the Financial Statements .............................................................. 19
13. Corporate Governance ................................................................................ 36
14. Additional Stock Exchange Information ...................................................... 37
15. Corporate Directory ..................................................................................... 38
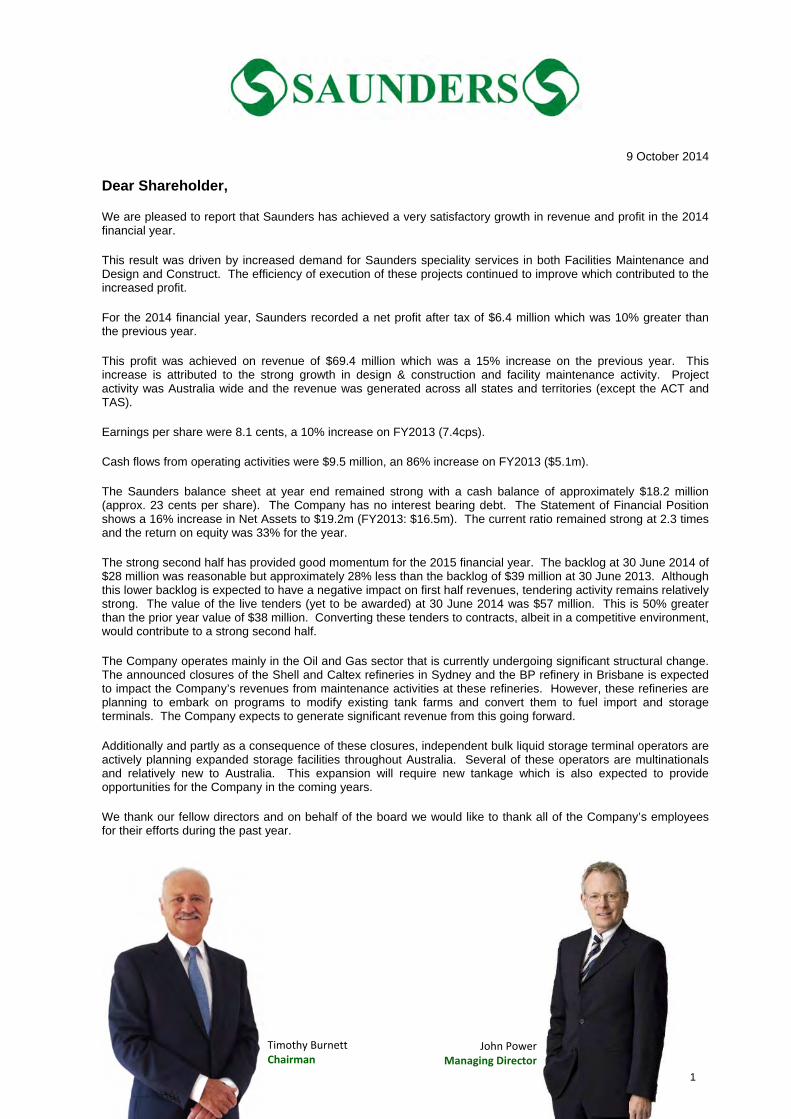
9 October 2014
Dear Shareholder,
We are pleased to report that Saunders has achieved a very satisfactory growth in revenue and profit in the 2014 financial year.
This result was driven by increased demand for Saunders speciality services in both Facilities Maintenance and Design and Construct. The efficiency of execution of these projects continued to improve which contributed to the increased profit.
For the 2014 financial year, Saunders recorded a net profit after tax of $6.4 million which was 10% greater than the previous year.
This profit was achieved on revenue of $69.4 million which was a 15% increase on the previous year. This increase is attributed to the strong growth in design & construction and facility maintenance activity. Project activity was Australia wide and the revenue was generated across all states and territories (except the ACT and TAS).
Earnings per share were 8.1 cents, a 10% increase on FY2013 (7.4cps).
Cash flows from operating activities were $9.5 million, an 86% increase on FY2013 ($5.1m).
The Saunders balance sheet at year end remained strong with a cash balance of approximately $18.2 million (approx. 23 cents per share). The Company has no interest bearing debt. The Statement of Financial Position shows a 16% increase in Net Assets to $19.2m (FY2013: $16.5m). The current ratio remained strong at 2.3 times and the return on equity was 33% for the year.
The strong second half has provided good momentum for the 2015 financial year. The backlog at 30 June 2014 of $28 million was reasonable but approximately 28% less than the backlog of $39 million at 30 June 2013. Although this lower backlog is expected to have a negative impact on first half revenues, tendering activity remains relatively strong. The value of the live tenders (yet to be awarded) at 30 June 2014 was $57 million. This is 50% greater than the prior year value of $38 million. Converting these tenders to contracts, albeit in a competitive environment, would contribute to a strong second half.
The Company operates mainly in the Oil and Gas sector that is currently undergoing significant structural change. The announced closures of the Shell and Caltex refineries in Sydney and the BP refinery in Brisbane is expected to impact the Company’s revenues from maintenance activities at these refineries. However, these refineries are planning to embark on programs to modify existing tank farms and convert them to fuel import and storage terminals. The Company expects to generate significant revenue from this going forward.
Additionally and partly as a consequence of these closures, independent bulk liquid storage terminal operators are actively planning expanded storage facilities throughout Australia. Several of these operators are multinationals and relatively new to Australia. This expansion will require new tankage which is also expected to provide opportunities for the Company in the coming years.
We thank our fellow directors and on behalf of the board we would like to thank all of the Company’s employees for their efforts during the past year.
Timothy Burnett Chairman
John Power Managing Director
1
Saunders International Limited2014 Annual Report
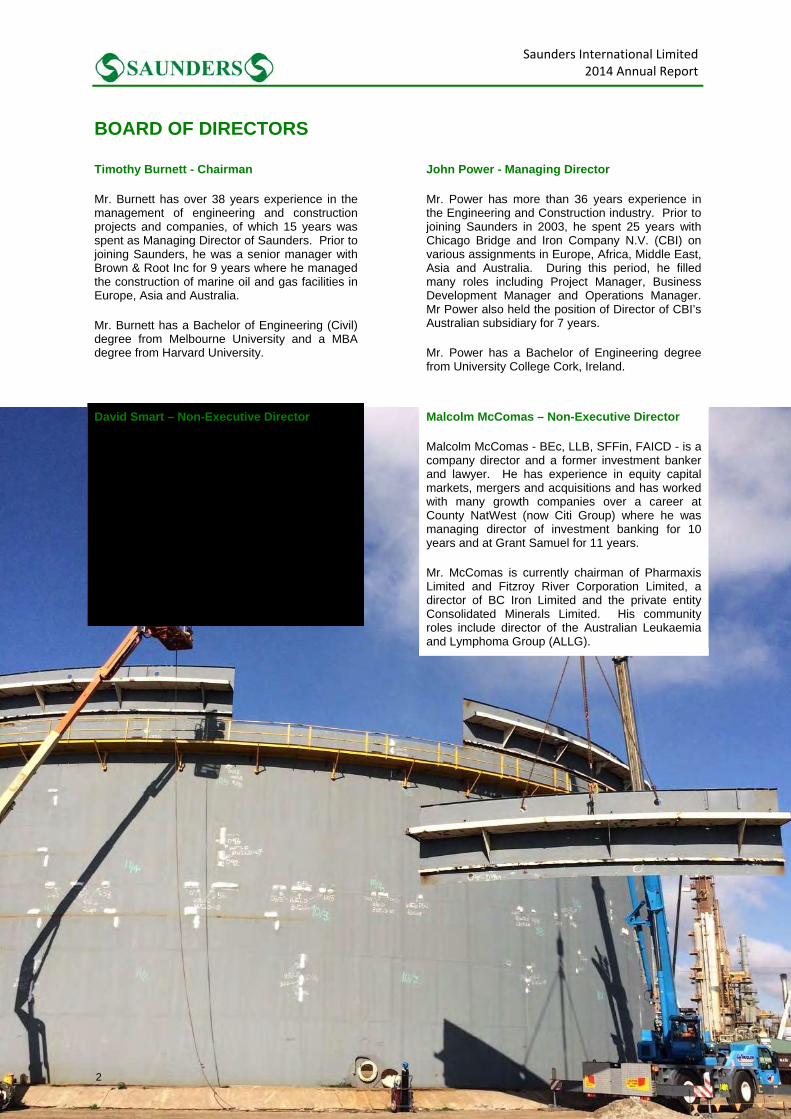
BOARD OF DIRECTORS
Timothy Burnett - Chairman
Mr. Burnett has over 38 years experience in the management of engineering and construction projects and companies, of which 15 years was spent as Managing Director of Saunders. Prior to joining Saunders, he was a senior manager with Brown & Root Inc for 9 years where he managed the construction of marine oil and gas facilities in Europe, Asia and Australia.
Mr. Burnett has a Bachelor of Engineering (Civil) degree from Melbourne University and a MBA degree from Harvard University.
John Power - Managing Director
Mr. Power has more than 36 years experience in the Engineering and Construction industry. Prior to joining Saunders in 2003, he spent 25 years with Chicago Bridge and Iron Company N.V. (CBI) on various assignments in Europe, Africa, Middle East, Asia and Australia. During this period, he filled many roles including Project Manager, Business Development Manager and Operations Manager. Mr Power also held the position of Director of CBI’s Australian subsidiary for 7 years.
Mr. Power has a Bachelor of Engineering degree from University College Cork, Ireland.
David Smart – Non-Executive Director
Over the past 34 years, Mr. Smart has held various finance, company secretary and board positions with several listed industrial companies. Prior to joining Metal Manufactures Ltd as Finance Director, Mr. Smart held the positions of Treasurer and CFO of Tubemakers Australia Ltd. He was also involved in the listing of eServ Global Ltd in 2000 and was a director from 2000 to 2013.
Mr. Smart has a Bachelor of Commerce (Accounting) degree and a MBA from the University of New South Wales.
Malcolm McComas – Non-Executive Director
Malcolm McComas - BEc, LLB, SFFin, FAICD - is a company director and a former investment banker and lawyer. He has experience in equity capital markets, mergers and acquisitions and has worked with many growth companies over a career at County NatWest (now Citi Group) where he was managing director of investment banking for 10 years and at Grant Samuel for 11 years.
Mr. McComas is currently chairman of Pharmaxis Limited and Fitzroy River Corporation Limited, a director of BC Iron Limited and the private entity Consolidated Minerals Limited. His community roles include director of the Australian Leukaemia and Lymphoma Group (ALLG).
2
Saunders International Limited2014 Annual Report
BUSINESS PROFILE
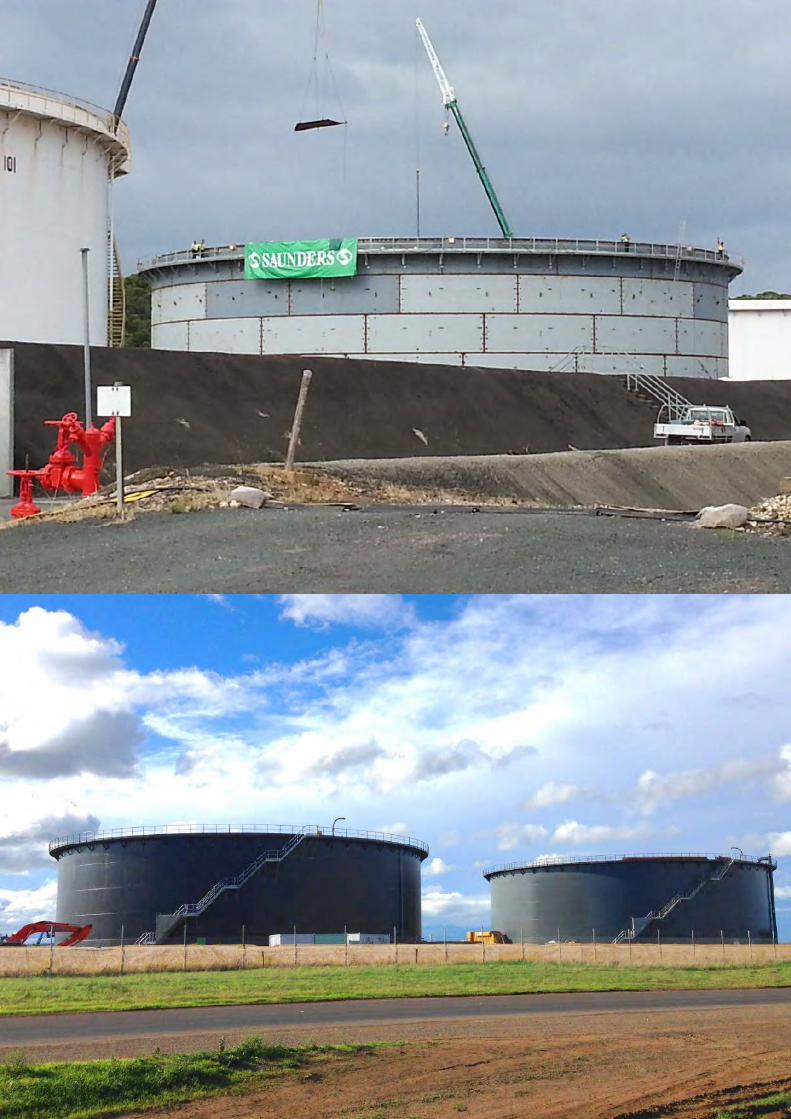
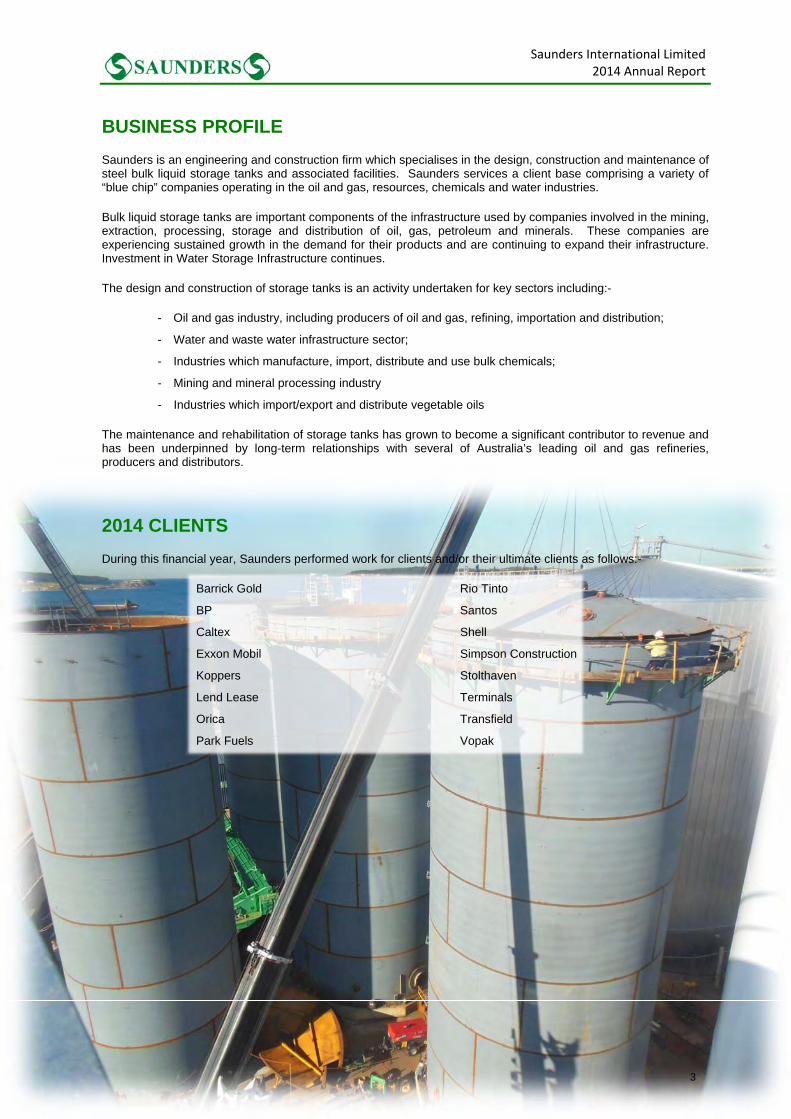
Saunders is an engineering and construction firm which specialises in the design, construction and maintenance of steel bulk liquid storage tanks and associated facilities. Saunders services a client base comprising a variety of “blue chip” companies operating in the oil and gas, resources, chemicals and water industries.
Bulk liquid storage tanks are important components of the infrastructure used by companies involved in the mining, extraction, processing, storage and distribution of oil, gas, petroleum and minerals. These companies are experiencing sustained growth in the demand for their products and are continuing to expand their infrastructure. Investment in Water Storage Infrastructure continues.
The design and construction of storage tanks is an activity undertaken for key sectors including:-
- Oil and gas industry, including producers of oil and gas, refining, importation and distribution;
- Water and waste water infrastructure sector;
- Industries which manufacture, import, distribute and use bulk chemicals;
- Mining and mineral processing industry
- Industries which import/export and distribute vegetable oils
The maintenance and rehabilitation of storage tanks has grown to become a significant contributor to revenue and has been underpinned by long-term relationships with several of Australia’s leading oil and gas refineries, producers and distributors.
2014 CLIENTS
During this financial year, Saunders performed work for clients and/or their ultimate clients as follows:-
Barrick Gold Rio Tinto
BP Santos
Caltex Shell
Exxon Mobil Simpson Construction
Koppers Stolthaven
Lend Lease Terminals
Orica Transfield
Park Fuels Vopak
3
Saunders International LimitedDirectors’ Report
DIRECTORS’ REPORT
The Directors present their report on Saunders International Limited (“Saunders” or “Company”) for the year ended 30 June 2014 and the independent audit report thereon.
DIRECTORS
The following persons are directors of Saunders International Limited and have been during the financial year and until the date of this report, unless otherwise noted.
Timothy Burnett
John Power
David Smart
Malcolm McComas
COMPANY SECRETARY
Steven Dadich B.Com. C.A. 19yrs Financial, Auditing, Secretarial experience
PRINCIPAL ACTIVITIES
During the financial year, the principal activities of Saunders were design, construction and maintenance of steel storage tanks and the project management of ancillary facilities.
REVIEW OF OPERATIONS
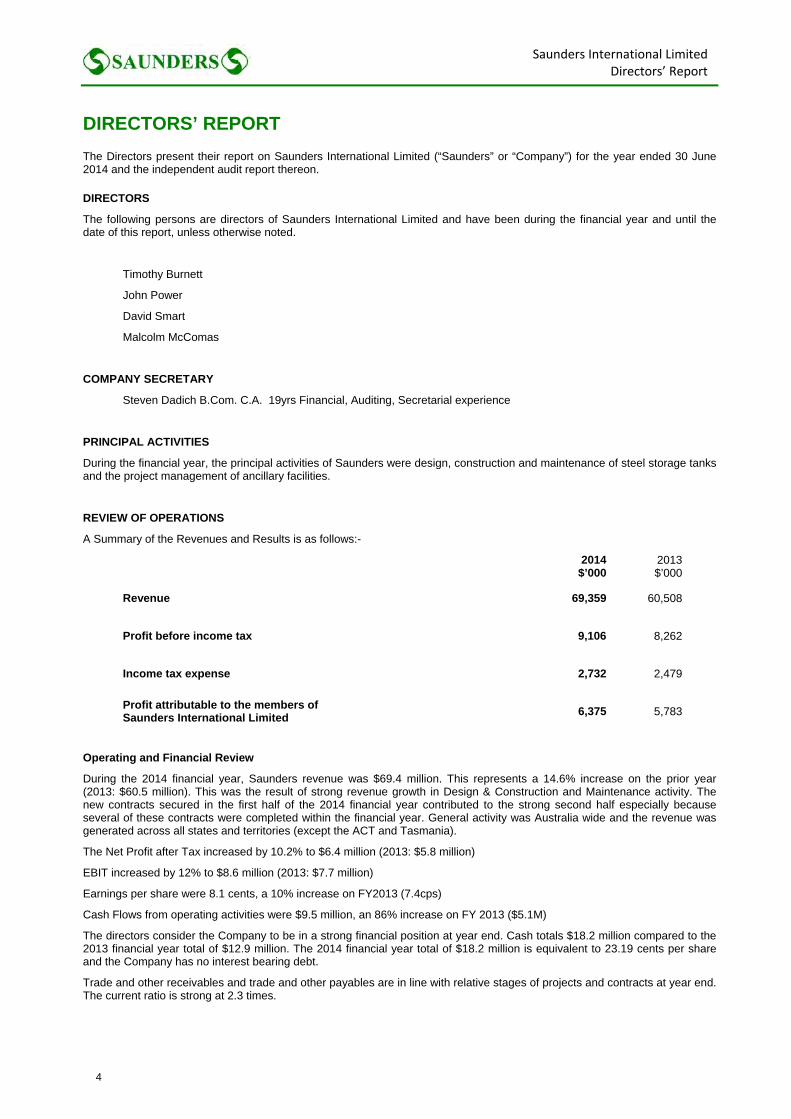
A Summary of the Revenues and Results is as follows:-
2014 $’000
2013 $’000
Revenue 69,359 60,508
Profit before income tax 9,106 8,262
Income tax expense 2,732 2,479
Profit attributable to the members of Saunders International Limited
6,375 5,783
Operating and Financial Review
During the 2014 financial year, Saunders revenue was $69.4 million. This represents a 14.6% increase on the prior year (2013: $60.5 million). This was the result of strong revenue growth in Design & Construction and Maintenance activity. The new contracts secured in the first half of the 2014 financial year contributed to the strong second half especially because several of these contracts were completed within the financial year. General activity was Australia wide and the revenue was generated across all states and territories (except the ACT and Tasmania).
The Net Profit after Tax increased by 10.2% to $6.4 million (2013: $5.8 million)
EBIT increased by 12% to $8.6 million (2013: $7.7 million)
Earnings per share were 8.1 cents, a 10% increase on FY2013 (7.4cps)
Cash Flows from operating activities were $9.5 million, an 86% increase on FY 2013 ($5.1M)
The directors consider the Company to be in a strong financial position at year end. Cash totals $18.2 million compared to the 2013 financial year total of $12.9 million. The 2014 financial year total of $18.2 million is equivalent to 23.19 cents per share and the Company has no interest bearing debt.
Trade and other receivables and trade and other payables are in line with relative stages of projects and contracts at year end. The current ratio is strong at 2.3 times.
4
Saunders International LimitedDirectors’ Report
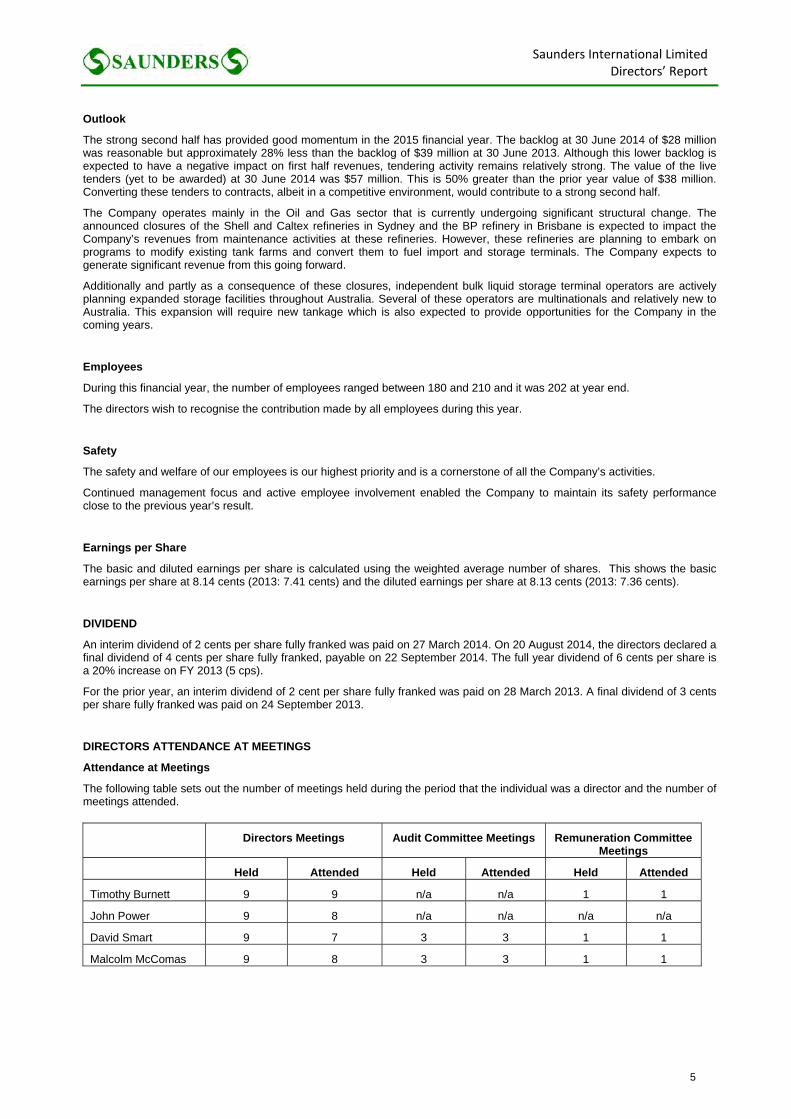
Outlook
The strong second half has provided good momentum in the 2015 financial year. The backlog at 30 June 2014 of $28 million was reasonable but approximately 28% less than the backlog of $39 million at 30 June 2013. Although this lower backlog is expected to have a negative impact on first half revenues, tendering activity remains relatively strong. The value of the live tenders (yet to be awarded) at 30 June 2014 was $57 million. This is 50% greater than the prior year value of $38 million. Converting these tenders to contracts, albeit in a competitive environment, would contribute to a strong second half.
The Company operates mainly in the Oil and Gas sector that is currently undergoing significant structural change. The announced closures of the Shell and Caltex refineries in Sydney and the BP refinery in Brisbane is expected to impact the Company’s revenues from maintenance activities at these refineries. However, these refineries are planning to embark on programs to modify existing tank farms and convert them to fuel import and storage terminals. The Company expects to generate significant revenue from this going forward.
Additionally and partly as a consequence of these closures, independent bulk liquid storage terminal operators are actively planning expanded storage facilities throughout Australia. Several of these operators are multinationals and relatively new to Australia. This expansion will require new tankage which is also expected to provide opportunities for the Company in the coming years.
Employees
During this financial year, the number of employees ranged between 180 and 210 and it was 202 at year end.
The directors wish to recognise the contribution made by all employees during this year.
Safety
The safety and welfare of our employees is our highest priority and is a cornerstone of all the Company’s activities.
Continued management focus and active employee involvement enabled the Company to maintain its safety performance close to the previous year’s result.
Earnings per Share
The basic and diluted earnings per share is calculated using the weighted average number of shares. This shows the basic earnings per share at 8.14 cents (2013: 7.41 cents) and the diluted earnings per share at 8.13 cents (2013: 7.36 cents).
DIVIDEND
An interim dividend of 2 cents per share fully franked was paid on 27 March 2014. On 20 August 2014, the directors declared a final dividend of 4 cents per share fully franked, payable on 22 September 2014. The full year dividend of 6 cents per share is a 20% increase on FY 2013 (5 cps).
For the prior year, an interim dividend of 2 cent per share fully franked was paid on 28 March 2013. A final dividend of 3 cents per share fully franked was paid on 24 September 2013.
DIRECTORS ATTENDANCE AT MEETINGS
Attendance at Meetings
The following table sets out the number of meetings held during the period that the individual was a director and the number of meetings attended.
Directors Meetings Audit Committee Meetings Remuneration Committee Meetings
Held Attended Held Attended Held Attended
Timothy Burnett 9 9 n/a n/a 1 1
John Power 9 8 n/a n/a n/a n/a
David Smart 9 7 3 3 1 1
Malcolm McComas 9 8 3 3 1 1
5
Saunders International LimitedDirectors’ Report
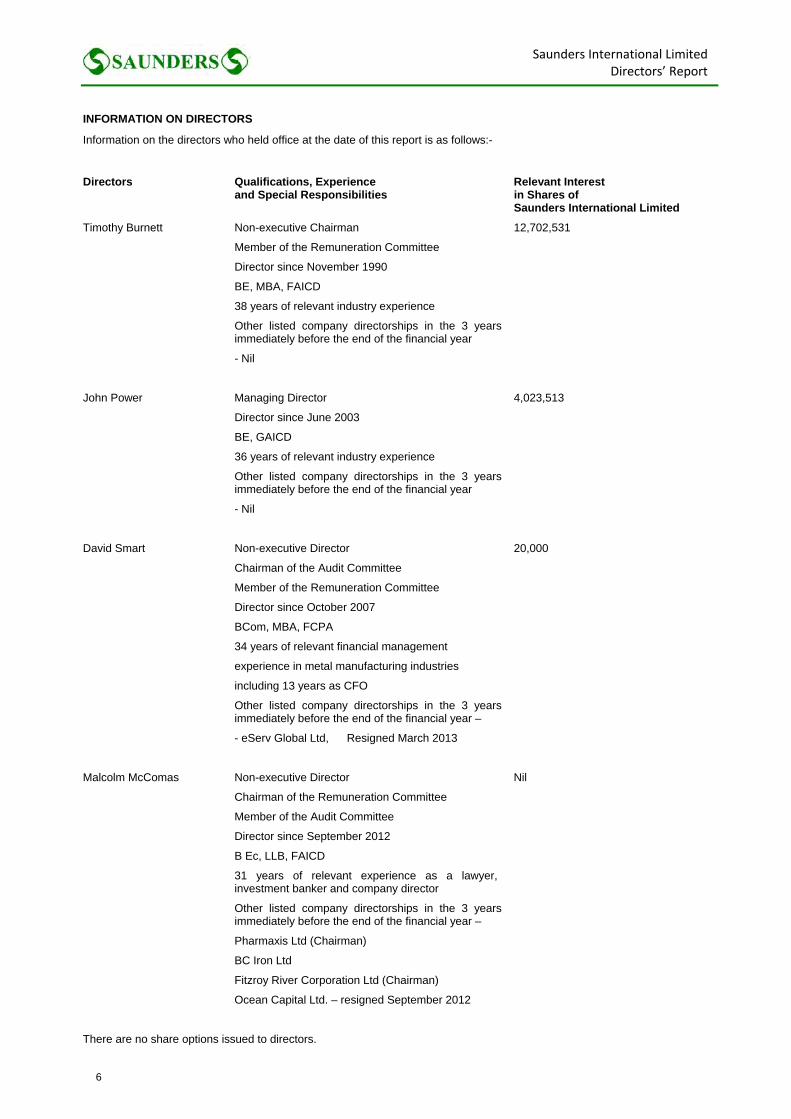
INFORMATION ON DIRECTORS
Information on the directors who held office at the date of this report is as follows:-
Directors Qualifications, Experience Relevant Interest and Special Responsibilities in Shares of Saunders International Limited
Timothy Burnett Non-executive Chairman 12,702,531
Member of the Remuneration Committee
Director since November 1990
BE, MBA, FAICD
38 years of relevant industry experience
Other listed company directorships in the 3 years immediately before the end of the financial year
- Nil
John Power Managing Director 4,023,513
Director since June 2003
BE, GAICD
36 years of relevant industry experience
Other listed company directorships in the 3 years immediately before the end of the financial year
- Nil
David Smart Non-executive Director 20,000
Chairman of the Audit Committee
Member of the Remuneration Committee
Director since October 2007
BCom, MBA, FCPA
34 years of relevant financial management
experience in metal manufacturing industries
including 13 years as CFO
Other listed company directorships in the 3 years immediately before the end of the financial year –
- eServ Global Ltd, Resigned March 2013
Malcolm McComas Non-executive Director Nil
Chairman of the Remuneration Committee
Member of the Audit Committee
Director since September 2012
B Ec, LLB, FAICD
31 years of relevant experience as a lawyer, investment banker and company director
Other listed company directorships in the 3 years immediately before the end of the financial year –
Pharmaxis Ltd (Chairman)
BC Iron Ltd
Fitzroy River Corporation Ltd (Chairman)
Ocean Capital Ltd. – resigned September 2012
There are no share options issued to directors.
6
Saunders International LimitedDirectors’ Report
REMUNERATION REPORT
This remuneration report, which forms part of the directors’ report, sets out information about the remuneration of Saunders International Limited directors and its key management personnel for the financial year ended 30 June 2014.
Remuneration Policy
The board of directors review and approve remuneration of the non-executive directors, the managing director and key management personnel.
Non-executive Directors
Non-executive directors are paid fees and where applicable compulsory superannuation contributions are made on their behalf. The current fees are based on the level of fees for comparable listed companies and were reviewed during the year.
The non-executive directors do not have options and have not participated in the Employee Share Plan.
Managing Director
The managing director is remunerated on salary package basis which is a component of a formal employment contract. The salary package is considered to be appropriate for the experience and expertise needed for the position and is comparable to other similar sized companies and business units of larger companies. The salary package contains a fixed component and a variable bonus component. The bonus is based on an annual performance appraisal as conducted by the remuneration committee of the board of directors. The performance is measured against a range of objectives set annually by the board. The important objectives are safety, quality, personnel development, quantitative Company financial performance and measurement of key project performance indicators.
Key Management Personnel
Key management personnel are remunerated on salary packages which are considered appropriate for the positions they hold and their experience. The remuneration includes a variable bonus which is determined annually based upon Company and individual performance.
Long Term Incentive
The board of directors has considered the issue of long term incentive as a component of the remuneration of directors and key management personnel.
As of the date of this report, two of the directors and all of the executive officers own substantial numbers of shares in the Company. Key management personnel, who are not directors, collectively own approximately 1.85 million shares. In addition, other employees own approximately 1.4 million shares and have an interest in 635,000 shares under the Employee Share Plan.
The breadth and depth of share ownership fosters an alignment of objectives between shareholders and directors and management of the Company. For this reason the board of directors have decided that a separate Long Term Incentive component of remuneration is not required at this time.
7
Saunders International LimitedDirectors’ Report
Key Terms of Employment Contracts
The company has entered into a new executive service agreement with John Power as Managing Director and Chief Executive Officer effective 1 July 2013. The remuneration component of the new agreement is more in line with relevant industry comparables. The variable component (Performance Bonus) can range anywhere between 0% to 50% of the fixed component based on performance measured against a range of key performance indicators and targets, set annually by the directors. The attainment of realistically achievable performance and targets on a weighted average measure would result in a bonus of 25% of the fixed component and bonus above and below this would result from overall superior or poorer performance. The executive service agreement contains the following key terms:-
Term: Fixed term expiring on 30 June 2014, thereafter subject to six months notice
Annual Salary: Total fixed remuneration of $480,000
Performance Bonus: Variable, ranging from 0% to 50% of total fixed annual remuneration, based on performance measured against a range of key performance indicators
Notice Period: Six months notice after the expiry of the fixed term
Executive officers are employed under ongoing employment arrangements. Their employment thus entails one month’s notice. This is considered appropriate because they have many years of service with the Company and are shareholders of the Company.
Relationship between Remuneration Policy and Company Performance
The remuneration of executive officers contains an annual cash bonus. The total cash bonus paid in a year is closely related to and determined by the current profit levels of the company.
Executive officers remuneration is aligned with the long term company performance via the shareholdings that these individuals retain in the Company.
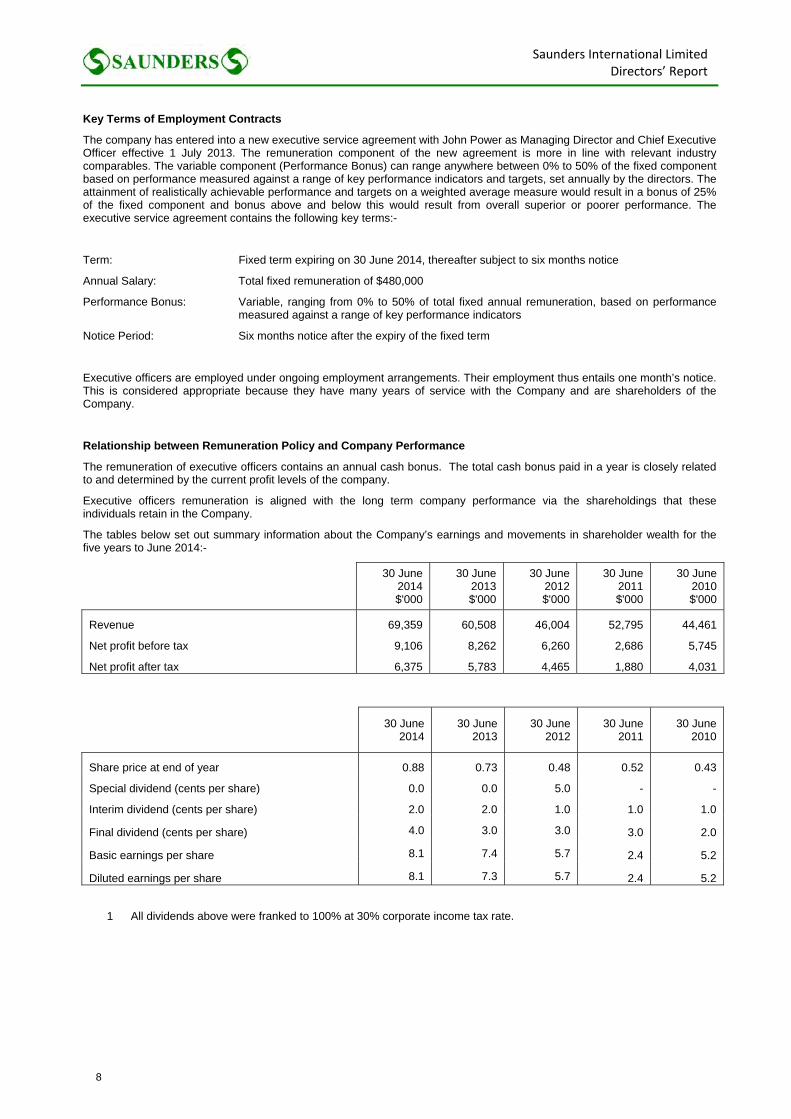
The tables below set out summary information about the Company’s earnings and movements in shareholder wealth for the five years to June 2014:-
30 June 2014 $'000
30 June 2013 $'000
30 June 2012 $'000
30 June 2011 $'000
30 June 2010 $'000
Revenue 69,359 60,508 46,004 52,795 44,461
Net profit before tax 9,106 8,262 6,260 2,686 5,745
Net profit after tax 6,375 5,783 4,465 1,880 4,031
30 June 2014
30 June 2013
30 June 2012
30 June 2011
30 June 2010
Share price at end of year 0.88 0.73 0.48 0.52 0.43
Special dividend (cents per share) 0.0 0.0 5.0 - -
Interim dividend (cents per share) 2.0 2.0 1.0 1.0 1.0
Final dividend (cents per share) 4.0 3.0 3.0 3.0 2.0
Basic earnings per share 8.1 7.4 5.7 2.4 5.2
Diluted earnings per share 8.1 7.3 5.7 2.4 5.2
1 All dividends above were franked to 100% at 30% corporate income tax rate.
8
Saunders International LimitedDirectors’ Report
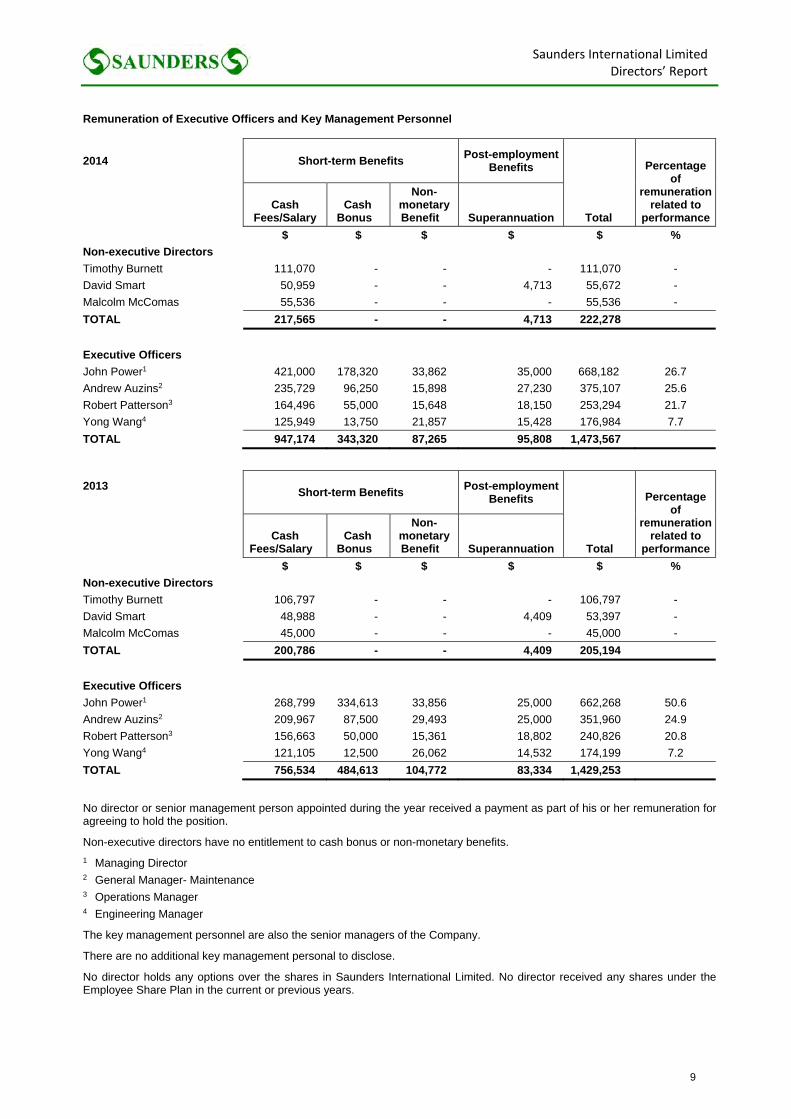
Remuneration of Executive Officers and Key Management Personnel
2014 Short-term Benefits Post-employment
Benefits
Total
Percentage of
remuneration related to
performance Cash
Fees/Salary Cash
Bonus
Non-monetary Benefit Superannuation
$ $ $ $ $ %
Non-executive Directors
Timothy Burnett 111,070 - - - 111,070 -
David Smart 50,959 - - 4,713 55,672 -
Malcolm McComas 55,536 - - - 55,536 -
TOTAL 217,565 - - 4,713 222,278
Executive Officers
John Power1 421,000 178,320 33,862 35,000 668,182 26.7
Andrew Auzins2 235,729 96,250 15,898 27,230 375,107 25.6
Robert Patterson3 164,496 55,000 15,648 18,150 253,294 21.7
Yong Wang4 125,949 13,750 21,857 15,428 176,984 7.7
TOTAL 947,174 343,320 87,265 95,808 1,473,567
2013
Short-term Benefits Post-employment
Benefits
Total
Percentage of
remuneration related to
performance Cash
Fees/Salary Cash
Bonus
Non-monetary Benefit Superannuation
$ $ $ $ $ %
Non-executive Directors
Timothy Burnett 106,797 - - - 106,797 -
David Smart 48,988 - - 4,409 53,397 -
Malcolm McComas 45,000 - - - 45,000 -
TOTAL 200,786 - - 4,409 205,194
Executive Officers
John Power1 268,799 334,613 33,856 25,000 662,268 50.6
Andrew Auzins2 209,967 87,500 29,493 25,000 351,960 24.9
Robert Patterson3 156,663 50,000 15,361 18,802 240,826 20.8
Yong Wang4 121,105 12,500 26,062 14,532 174,199 7.2
TOTAL 756,534 484,613 104,772 83,334 1,429,253
No director or senior management person appointed during the year received a payment as part of his or her remuneration for agreeing to hold the position.
Non-executive directors have no entitlement to cash bonus or non-monetary benefits.
1 Managing Director 2 General Manager- Maintenance 3 Operations Manager 4 Engineering Manager
The key management personnel are also the senior managers of the Company.
There are no additional key management personal to disclose.
No director holds any options over the shares in Saunders International Limited. No director received any shares under the Employee Share Plan in the current or previous years.
9

Saunders International LimitedDirectors’ Report
Changes in State of Affairs
There was no significant change in the state of affairs of the Company during the financial year.
Subsequent Events
There has not been any matter or circumstance, not already disclosed, occurring subsequent to the end of the financial year that has significantly affected, or may significantly affect, the operations of the Company, the results of those operations, or the state of affairs of the Company in future financial years.
Future Developments
Disclosure of other information regarding likely developments in the operations of the Company in future financial years and the expected results of those operations is likely to result in unreasonable prejudice to the Company. Accordingly, this information has not been disclosed in this report.
Indemnification of Officers and Auditors
During the financial year, the Company paid a premium in respect of a contract insuring the directors of the Company, the company secretary, and all executive officers of the Company and of any related body corporate against a liability incurred as such a director, secretary or executive officer to the extent permitted by the Corporations Act 2001. The contract of insurance prohibits disclosure of the nature of the liability and the amount of the premium.
The Company has not otherwise, during or since the end of the financial year, except to the extent permitted by law, indemnified or agreed to indemnify an officer or auditor of the company or of any related body corporate against a liability incurred as such an officer or auditor.
Non-audit Services
Details of amounts paid or payable to the auditor for non-audit services are outlined in note 24 to the financial statements. During this financial year there were no amounts paid or payable for non-audit services.
Auditor’s Independence Declaration
The auditor’s independence declaration is included on page 9 of the annual report.
Rounding Off of Amounts
The Company is a company of the kind referred to in ASIC Class Order 98/0100, dated 10 July 1998, and in accordance with that Class Order amounts in the directors’ report and the financial statements are rounded off to the nearest thousand dollars, unless otherwise indicated.
This directors’ report is signed in accordance with a resolution of directors made pursuant to s298(2) of the Corporations Act 2001.
On behalf of the Directors
John Power Director Sydney, 20 August 2014
10
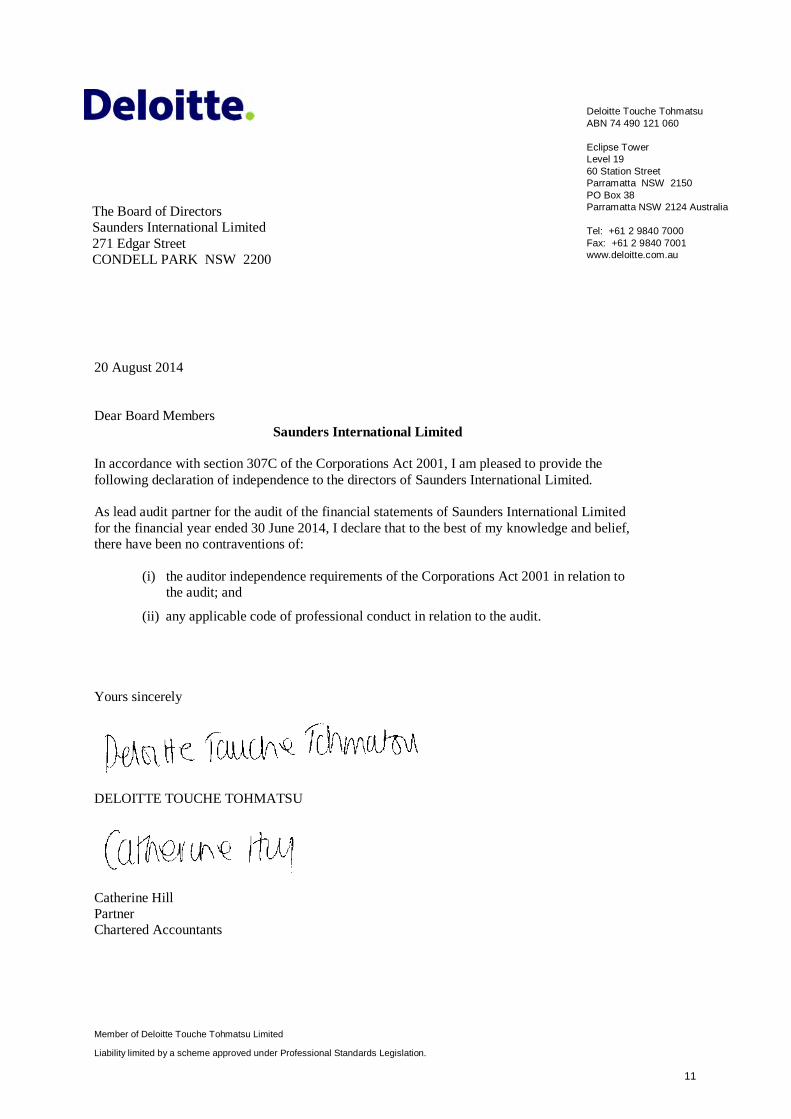
Member of Deloitte Touche Tohmatsu Limited
Liability limited by a scheme approved under Professional Standards Legislation.
Deloitte Touche Tohmatsu ABN 74 490 121 060 Eclipse Tower Level 19 60 Station Street Parramatta NSW 2150 PO Box 38 Parramatta NSW 2124 Australia Tel: +61 2 9840 7000 Fax: +61 2 9840 7001 www.deloitte.com.au
20 August 2014
Dear Board Members
Saunders International Limited
In accordance with section 307C of the Corporations Act 2001, I am pleased to provide the
following declaration of independence to the directors of Saunders International Limited.
As lead audit partner for the audit of the financial statements of Saunders International Limited
for the financial year ended 30 June 2014, I declare that to the best of my knowledge and belief,
there have been no contraventions of:
(i) the auditor independence requirements of the Corporations Act 2001 in relation to
the audit; and
(ii) any applicable code of professional conduct in relation to the audit.
Yours sincerely
DELOITTE TOUCHE TOHMATSU
Catherine Hill
Partner
Chartered Accountants
The Board of Directors
Saunders International Limited
271 Edgar Street
CONDELL PARK NSW 2200
11
12
13
Saunders International LimitedDirector’s Declaration
Directors’ Declaration
The directors declare that:-
(a) in the directors’ opinion, there are reasonable grounds to believe that the company will be able to pay its debts as and when they become due and payable;
(b) in the directors’ opinion the attached financial statements are in compliance with International Financial Reporting Standard, as stated in note 1 to the financial statements;
(c) in the directors’ opinion, the attached financial statements and notes thereto are in accordance with the Corporations Act 2001, including compliance with accounting standards and giving a true and fair view of the financial position and performance of the company, and
(d) the directors have been given the declarations required by s.295A of the Corporations Act 2001.
Signed in accordance with a resolution of the directors made pursuant to s295(5) of the Corporations Act 2001.
On behalf of the Directors
John Power Director Sydney, 20 August 2014
14
Saunders International LimitedStatement of Profit or Loss and Other Comprehensive Income
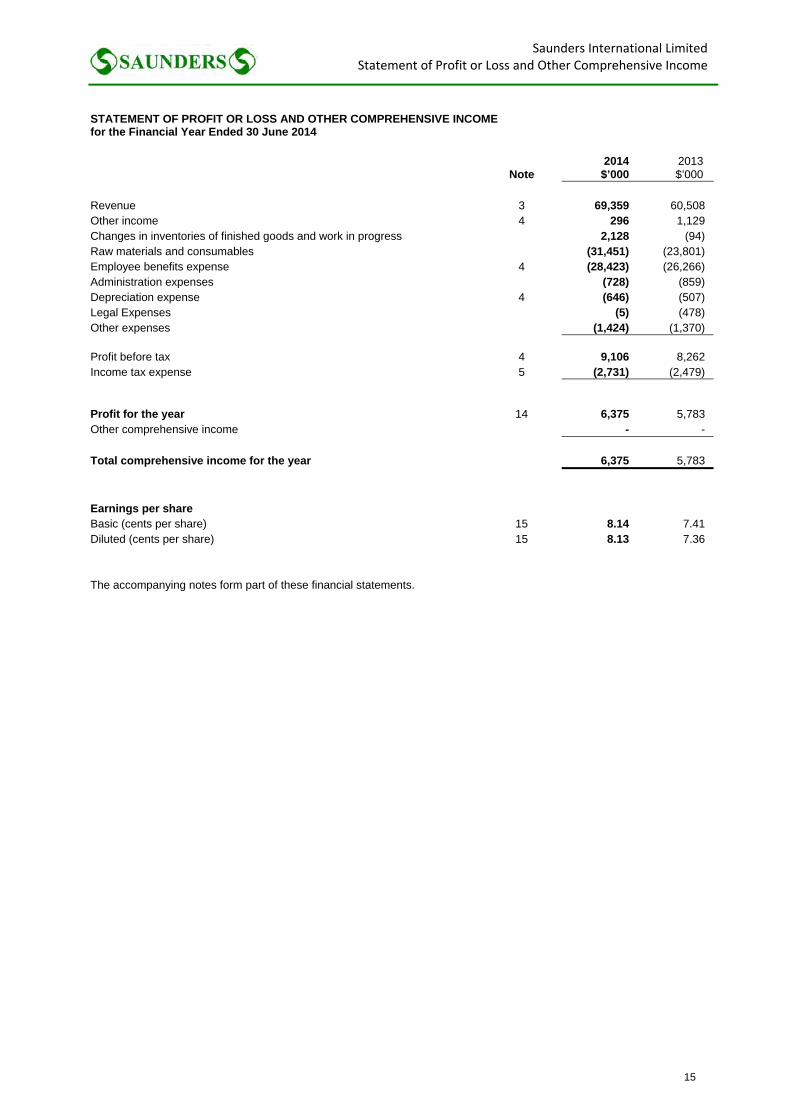
STATEMENT OF PROFIT OR LOSS AND OTHER COMPREHENSIVE INCOME for the Financial Year Ended 30 June 2014
Note 2014 $’000
2013 $’000
Revenue 3 69,359 60,508 Other income 4 296 1,129 Changes in inventories of finished goods and work in progress 2,128 (94) Raw materials and consumables (31,451) (23,801) Employee benefits expense 4 (28,423) (26,266) Administration expenses (728) (859) Depreciation expense 4 (646) (507) Legal Expenses (5) (478) Other expenses (1,424) (1,370) Profit before tax 4 9,106 8,262 Income tax expense 5 (2,731) (2,479) Profit for the year 14 6,375 5,783 Other comprehensive income - -
Total comprehensive income for the year 6,375 5,783
Earnings per share Basic (cents per share) 15 8.14 7.41 Diluted (cents per share) 15 8.13 7.36 The accompanying notes form part of these financial statements.
15
Saunders International LimitedStatement of Financial Position
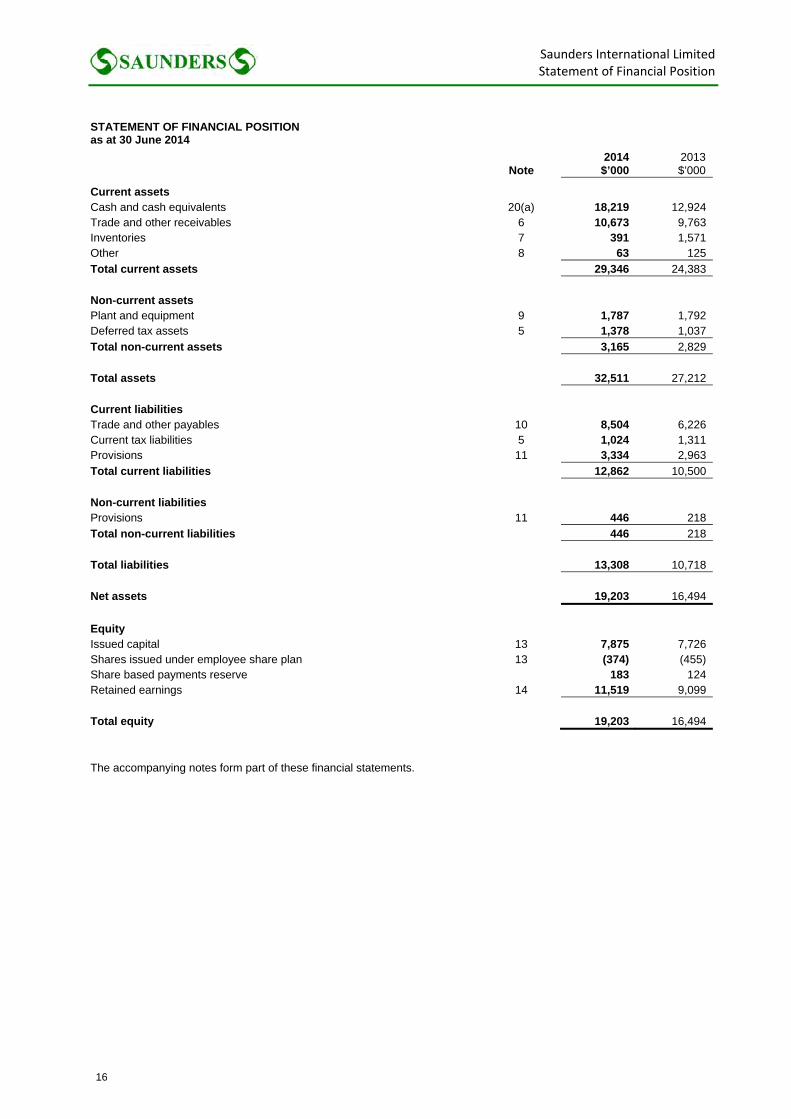
STATEMENT OF FINANCIAL POSITION as at 30 June 2014
Note
2014 $’000
2013 $’000
Current assets Cash and cash equivalents 20(a) 18,219 12,924 Trade and other receivables 6 10,673 9,763 Inventories 7 391 1,571 Other 8 63 125
Total current assets 29,346 24,383
Non-current assets Plant and equipment 9 1,787 1,792 Deferred tax assets 5 1,378 1,037
Total non-current assets 3,165 2,829
Total assets 32,511 27,212
Current liabilities Trade and other payables 10 8,504 6,226 Current tax liabilities 5 1,024 1,311 Provisions 11 3,334 2,963
Total current liabilities 12,862 10,500
Non-current liabilities Provisions 11 446 218
Total non-current liabilities 446 218
Total liabilities 13,308 10,718
Net assets 19,203 16,494
Equity Issued capital 13 7,875 7,726 Shares issued under employee share plan 13 (374) (455) Share based payments reserve 183 124 Retained earnings 14 11,519 9,099
Total equity 19,203 16,494
The accompanying notes form part of these financial statements.
16
Saunders International LimitedStatement of Changes in Equity
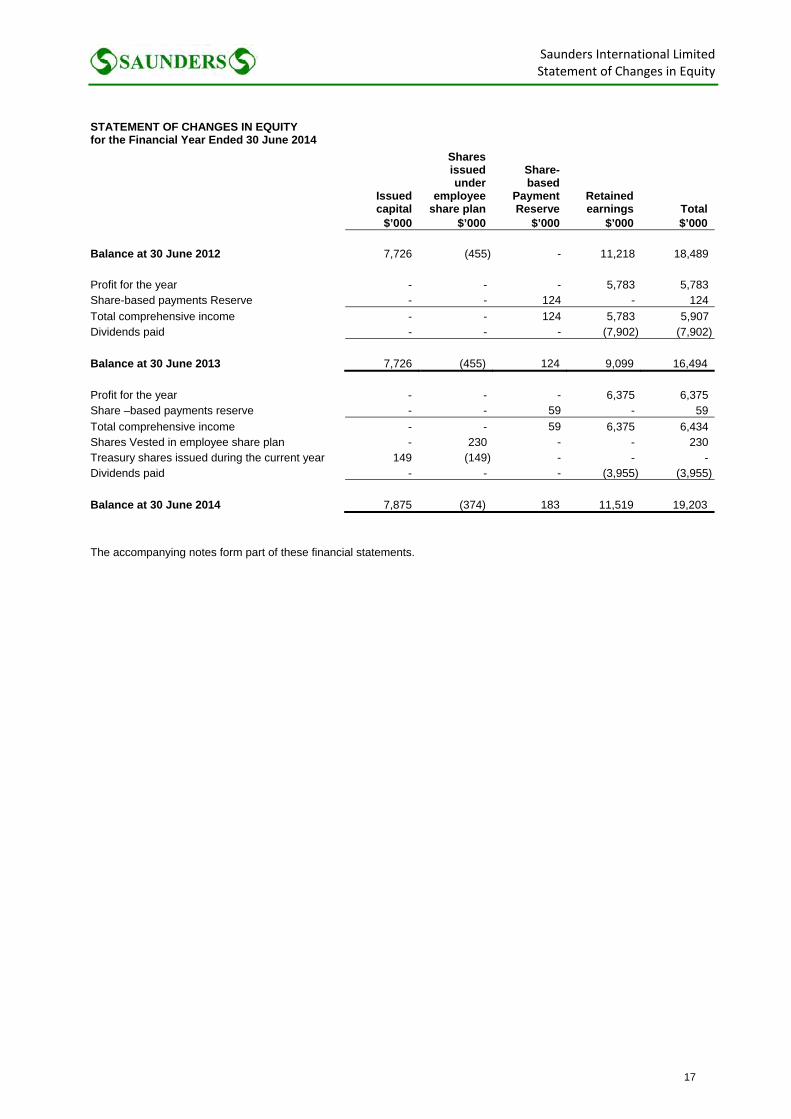
STATEMENT OF CHANGES IN EQUITY for the Financial Year Ended 30 June 2014
Issued capital
Shares issued under
employee share plan
Share-based
Payment Reserve
Retained earnings Total
$’000 $’000 $’000 $’000 $’000 Balance at 30 June 2012 7,726 (455) - 11,218 18,489 Profit for the year - - - 5,783 5,783Share-based payments Reserve - - 124 - 124
Total comprehensive income - - 124 5,783 5,907Dividends paid - - - (7,902) (7,902)
Balance at 30 June 2013 7,726 (455) 124 9,099 16,494
Profit for the year - - - 6,375 6,375Share –based payments reserve - - 59 - 59
Total comprehensive income - - 59 6,375 6,434Shares Vested in employee share plan - 230 - - 230Treasury shares issued during the current year 149 (149) - - -Dividends paid - - - (3,955) (3,955)
Balance at 30 June 2014 7,875 (374) 183 11,519 19,203
The accompanying notes form part of these financial statements.
17
Saunders International LimitedStatement of Cash Flows
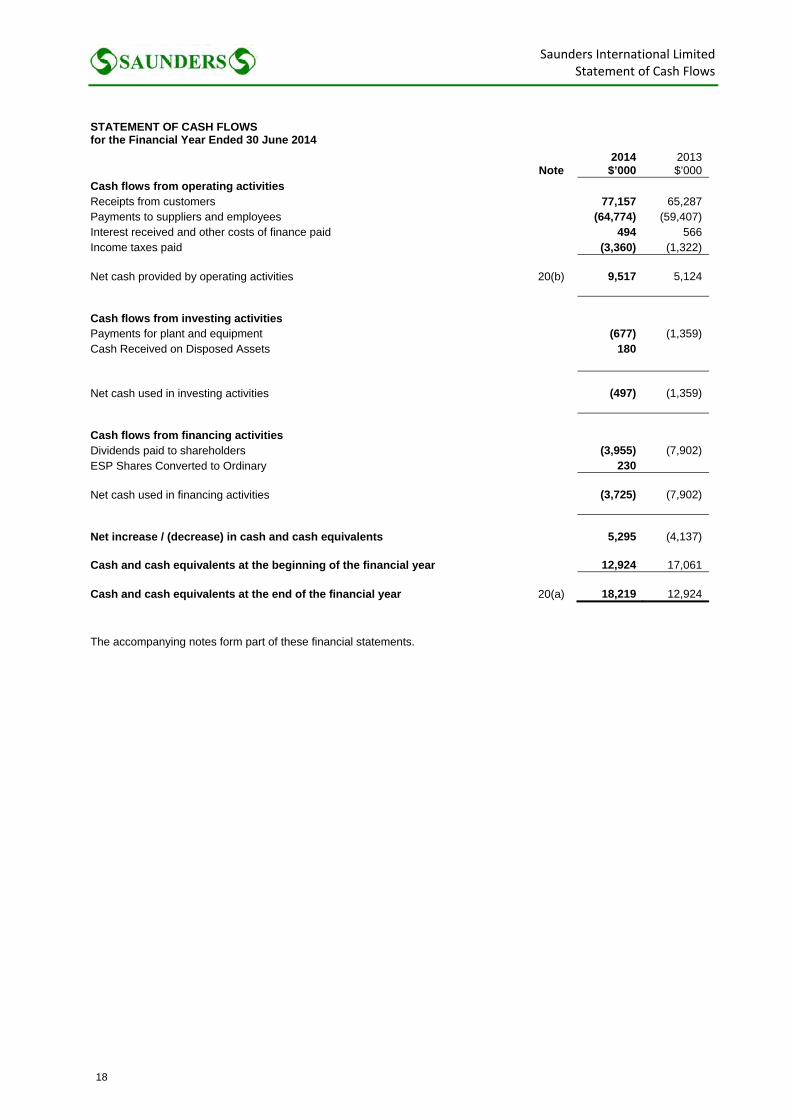
STATEMENT OF CASH FLOWS for the Financial Year Ended 30 June 2014
Note 2014 $’000
2013 $’000
Cash flows from operating activities Receipts from customers 77,157 65,287 Payments to suppliers and employees (64,774) (59,407) Interest received and other costs of finance paid 494 566 Income taxes paid (3,360) (1,322) Net cash provided by operating activities 20(b) 9,517 5,124 Cash flows from investing activities Payments for plant and equipment (677) (1,359) Cash Received on Disposed Assets 180 Net cash used in investing activities (497) (1,359) Cash flows from financing activities Dividends paid to shareholders (3,955) (7,902) ESP Shares Converted to Ordinary 230 Net cash used in financing activities (3,725) (7,902) Net increase / (decrease) in cash and cash equivalents 5,295 (4,137) Cash and cash equivalents at the beginning of the financial year 12,924 17,061 Cash and cash equivalents at the end of the financial year 20(a) 18,219 12,924
The accompanying notes form part of these financial statements.
18
Saunders International Limited Notes to the Financial Statements
1. SUMMARY OF ACCOUNTING POLICIES
Statement of Compliance
The financial statements are general purpose financial statements which have been prepared in accordance with the Corporations Act 2001, Accounting Standards and Interpretations, and comply with other requirements of the law.
For the purpose of preparing the financial statements, the company is a for-profit entity.
Accounting Standards include Australian equivalents to International Financial Reporting Standards (‘A-IFRS’). Compliance with A-IFRS ensures that the financial statements and notes of the company comply with International Financial Reporting Standards (‘IFRS’).
The financial statements were authorised for issue by the directors on 20 August 2014.
Basis of Preparation
The financial statements have been prepared on the basis of historical cost. Cost is based on the fair values of the consideration given in exchange for goods and services. All amounts are presented in Australian dollars, unless otherwise noted.
The company is a company of the kind referred to in ASIC Class Order 98/0100, dated 10 July 1998, and in accordance with that Class Order amounts in the financial statements are rounded off to the nearest thousand dollars, unless otherwise indicated.
Critical Accounting Judgements and Key Sources of Estimation Uncertainty
In the application of the Company’s accounting policies, management is required to make judgments, estimates and assumptions about carrying values of assets and liabilities that are not readily apparent from other sources. The estimates and associated assumptions are based on historical experience and other factors that are considered to be relevant. Actual results may differ from these estimates.
The estimates and underlying assumptions are reviewed on an ongoing basis. Revisions to accounting estimates are recognised in the period in which the estimate is revised if the revision affects only that period, or in the period of the revision and future periods if the revision affects both current and future periods. Refer to note 2 for a discussion of critical judgements in applying the entity’s accounting policies, and key sources of estimation uncertainty.
Standards and Interpretations adopted with no effect on Financial Statements
The following new and revised Standards and Interpretations have also been adopted in these financial statements. Their adoption has not had any significant impact on the amounts reported in these financial statements but may affect the accounting for future transactions or arrangements.
Amendments to AASB 101 ‘ Presentation of Financial Statements’
The amendments (part of AASB 2012-5 ‘Further Amendments to Australian Accounting Standards arising from Annual Improvements 2009-2011 Cycle’) requires an entity that changes accounting policies retrospectively, or makes a retrospective restatement or reclassification to present a statement of financial position as at the beginning of the preceding period (third statement of financial position), when the retrospective application, restatement or reclassification has a material effect on the information in the third statement of financial position. The related notes to the third statement of financial position are not required to be disclosed.
AASB 2011-4 ‘Amendments to Australian Accounting Standards to Remove Individual Key Management Personnel Disclosure Requirements’
This standard removes the individual key management personnel disclosure requirements in AASB 124 ‘Related Party Disclosures’. As a result Saunders only discloses the key management personnel compensation in total and for each of the categories required in AASB 124. In the current year the individual key management personnel disclosure previously required by AASB 124 is now disclosed in the remuneration report due to an amendment to Corporations Regulations 2001 issued in June 2013.
19
Saunders International Limited Notes to the Financial Statements
AASB 119 ‘Employee Benefits’ (2011) and AASB 2011-10 ‘Amendments to Australian Accounting Standards arising from AASB 119 (2011)’
In the current year, Saunders has applied AASB 119 (as revised in 2011) ‘Employee Benefits’ and the related consequential amendments for the first time. AASB 119 (as revised in 2011) changes the accounting for defined benefit plans and termination benefits. The most significant change relates to the accounting for changes in defined benefit obligations and plan assets. The amendments require the recognition of changes in defined benefit obligations and in the fair value of plan assets when they occur, and hence eliminate the ‘corridor approach’ permitted under the previous version of AASB 119 and accelerate the recognition of past service costs. All actuarial gains and losses are recognised immediately through other comprehensive income in order for the net pension asset or liability recognised in the consolidated statement of financial position to reflect the full value of the plan deficit or surplus. Furthermore, the interest cost and expected return on plan assets used in the previous version of AASB 119 are replaced with a ‘net interest’ amount under AASB 119 (as revised in 2011), which is calculated by applying the discount rate to the net defined benefit liability or asset. These changes have had an impact on the amounts recognised in profit or loss and other comprehensive income in prior years (see the tables below for details). In addition, AASB 119 (as revised in 2011) introduces certain changes in the presentation of the defined benefit cost including more extensive disclosures.
(a) Cash and Cash Equivalents
Cash comprises cash on hand and demand deposits. Cash equivalents are short-term, highly liquid investments that are readily convertible to known amounts of cash and which are subject to an insignificant risk of changes in value.
Bank overdrafts are shown within borrowings in current liabilities in the statement of financial position.
(b) Construction Contracts
When the outcome of a construction contract can be estimated reliably, revenue and costs are recognised by reference to the stage of completion of the contract activity at the statement of financial position date, as measured by the proportion of that contract costs incurred for work performed to date in relation to the estimated total contract costs, except where this would not be representative of the stage of completion. Variations in contract work, claims and incentive payments are included to the extent that they have been agreed with the customer.
Where the outcome of a construction contract cannot be estimated reliably, contract revenue is recognised to the extent of contract costs incurred that it is probable will be recoverable. Contract costs are recognised as expenses in the period in which they are incurred.
When it is probable that total contract costs will exceed total contract revenue, the expected loss is recognised as an expense immediately.
(c) Employee Benefits
A liability is recognised for benefits accruing to employees in respect of wages and salaries, annual leave, long service leave, and sick leave when it is probable that settlement will be required and they are capable of being measured reliably.
Liabilities recognised in respect of employee benefits expected to be settled within 12 months, are measured at their nominal values using the remuneration rate expected to apply at the time of settlement.
Liabilities recognised in respect of employee benefits which are not expected to be settled within 12 months are measured as the present value of the estimated future cash outflows to be made by the Company in respect of services provided by employees up to reporting date.
Defined contribution plans
Contributions to defined contribution superannuation plans are expensed when incurred.
20
Saunders International Limited Notes to the Financial Statements
(d) Income Tax
Current Tax
Current tax is calculated by reference to the amount of income taxes payable or recoverable in respect of the taxable profit or tax loss for the period. It is calculated using tax rates and tax laws that have been enacted or substantively enacted by reporting date. Current tax for current and prior periods is recognised as a liability (or asset) to the extent that it is unpaid (or refundable).
Deferred Tax
Deferred tax is recognised on temporary differences between the tax base of an asset or liability and its carrying amount in the financial statements. The tax base of an asset or liability is the amount attributed to that asset or liability for tax purposes.
In principle, deferred tax liabilities are recognised for all taxable temporary differences. Deferred tax assets are recognised to the extent that it is probable that sufficient taxable amounts will be available against which deductible temporary differences or unused tax losses and tax offsets can be utilised. However, deferred tax assets and liabilities are not recognised if the temporary differences giving rise to them arise from the initial recognition of assets and liabilities (other than as a result of a business combination) which affects neither taxable income nor accounting profit. Furthermore, a deferred tax liability is not recognised in relation to taxable temporary differences arising from the initial recognition of goodwill.
Deferred tax assets and liabilities are measured at the tax rates that are expected to apply to the period(s) when the asset and liability giving rise to them are realised or settled, based on tax rates (and tax laws) that have been enacted or substantively enacted by reporting date. The measurement of deferred tax liabilities and assets reflects the tax consequences that would follow from the manner in which the Company expects, at the reporting date, to recover or settle the carrying amount of its assets and liabilities.
Deferred tax assets and liabilities are offset when they relate to income taxes levied by the same taxation authority and the company intends to settle its current tax assets and liabilities on a net basis.
Current and Deferred Tax for the Period
Current and deferred tax is recognised as an expense or income in profit and loss, except when it relates to items credited or debited directly to equity, in which case the deferred tax is also recognised directly in equity, or where it arises from the initial accounting for a business combination, in which case it is taken into account in the determination of goodwill or excess.
(e) Inventories
Inventories are valued at the lower of cost and net realisable value. Costs are assigned to inventory on a first in first out basis. Net realisable value represents the estimated selling price less all estimated costs of completion and costs necessary to make the sale.
(f) Leased Assets
Leases are classified as finance leases when the terms of the lease transfer substantially all the risks and rewards incidental to ownership of the leased asset to the lessee. All other leases are classified as operating leases.
Operating lease payments are recognised as an expense on a straight-line basis over the lease term, except where another systematic basis is more representative of the time pattern in which economic benefits from the leased asset are consumed. Contingent rentals arising under operating leases are recognised as an expense in the period in which they are incurred.
(g) Plant and Equipment
Plant and equipment, leasehold improvements and equipment under finance lease are stated at cost less accumulated depreciation and impairment. Note 9 provides more detail. Cost includes expenditure that is directly attributable to the acquisition of the item. In the event that settlement of all or part of the purchase consideration is deferred, cost is determined by discounting the amounts payable in the future to their present value as at the date of acquisition.
Depreciation is provided on plant and equipment. Depreciation is calculated on a straight line basis so as to write off the net cost over its expected useful life to its estimated residual value. Leasehold improvements are depreciated over the period of the lease or estimated useful life, whichever is the shorter, using the straight line method. The estimated useful lives, residual values and depreciation method are reviewed at the end of each annual reporting period, with the effect of any changes recognised on a prospective basis.
The following estimated useful lives are used in the calculation of depreciation:-
Plant and Equipment 3 – 20 years
Office Furniture and Equipment 3 – 7 years
21
Saunders International Limited Notes to the Financial Statements
(h) Provisions
Provisions are recognised when the Company has a present obligation (legal or constructive) as a result of a past event, it is probable that the Company will be required to settle the obligation, and a reliable estimate can be made of the amount of the obligation.
The amount recognised as a provision is the best estimate of the consideration required to settle the present obligation at reporting date, taking into account the risks and uncertainties surrounding the obligation. Where a provision is measured using the cashflows estimated to settle the present obligation, its carrying amount is the present value of those cashflows.
When some or all of the economic benefits required to settle a provision are expected to be recovered from a third party, the receivable is recognised as an asset if it is virtually certain that reimbursement will be received and the amount of the receivable can be measured reliably.
Onerous contracts
An onerous contract is considered to exist where the company has a contract under which the unavoidable cost of meeting the contractual obligations exceed the economic benefits estimated to be received. Present obligations arising under onerous contracts are recognised as a provision to the extent that the present obligation exceeds the economic benefits estimated to be received.
(i) Financial Instruments issued by the Company
Debt and equity instruments
Debt and equity instruments are classified as either liabilities or as equity in accordance with the substance of the contractual arrangement. An equity instrument is any contract that evidences a residual interest in the assets of an entity after deducting all of its liabilities. Equity instruments issued by the Company are recorded at the proceeds received, net of direct issue costs.
(j) Revenue
Revenue is measured at the fair value of the consideration received or receivable.
Rendering of services
Revenue from a contract to provide services is recognised by reference to the stage of completion of the contract. Revenue from time and material contracts is recognised at the contractual rates as labour hours are derived and direct expenses incurred.
Revenue from construction contracts is recognised in accordance with the accounting policy outlined in note 1(b).
Dividend and interest revenue
Dividend revenue is recognised on a receivable basis. Interest revenue is recognised on a time proportionate basis that takes into account the effective yield on the financial asset.
(k) Goods and Services Tax
Revenues, expenses and assets are recognised net of the amount of goods and services tax (GST), except:
i. where the amount of GST incurred is not recoverable from the taxation authority, it is recognised as part of the cost of acquisition of an asset or as part of an item of expense; or
ii. for receivables and payables which are recognised inclusive of GST.
The net amount of GST recoverable from, or payable to, the taxation authority is included as part of receivables or payables.
Cash flows are included in the statement of cash flows on a gross basis. The GST component of cash flows arising from investing and financing activities which is recoverable from, or payable to, the taxation authority is classified as operating cash flows.
22
Saunders International Limited Notes to the Financial Statements
(l) Financial Assets
Loans and receivables
Trade receivables, loans and other receivables are recorded at amortised cost less impairment.
(m) Impairment of Assets
At each reporting date, the entity reviews the carrying amounts of its tangible assets to determine whether there is any indication that those assets have suffered an impairment loss. If any such indication exists, the recoverable amount of the asset is estimated in order to determine the extent of the impairment loss (if any). Where the asset does not generate cash flows that are independent from other assets, the company estimates the recoverable amount of the cash-generating unit to which the asset belongs.
Recoverable amount is the higher of fair value less costs to sell and value in use. In assessing value in use, the estimated future cash flows are discounted to their present value using a pre-tax discount rate that reflects current market assessments of the time value of money and the risks specific to the asset for which the estimates of future cash flows have not been adjusted.
If the recoverable amount of an asset (or cash-generating unit) is estimated to be less than its carrying amount, the carrying amount of the asset (cash-generating unit) is reduced to its recoverable amount. An impairment loss is recognised in profit or loss immediately, unless the relevant asset is carried at fair value, in which case the impairment loss is treated as a revaluation decrease.
Where an impairment loss subsequently reverses, the carrying amount of the asset (cash-generating unit) is increased to the revised estimate of its recoverable amount, but only to the extent that the increased carrying amount does not exceed the carrying amount that would have been determined had no impairment or loss been recognised for the asset (cash-generating unit) in prior years. A reversal of an impairment loss is recognised in profit or loss immediately, unless the relevant asset is carried at fair value, in which case the reversal of the impairment loss is treated as a revaluation increase.
(n) Contributed Equity
Ordinary shares are classified as equity.
Incremental costs directly attributable to the issue of new shares are shown in equity as a deduction, net of tax. Incremental costs directly attributable to the issue of new shares for the acquisition of a business are not included in the cost of the acquisition as part of the purchase consideration.
(o) Share Based Payments
Equity-settled share-based payments with employees and others providing similar services are measured at the fair value of the equity instrument at the grant date. Fair value is measured by use of a Black-Scholes-Mertin model, which requires the input of highly subjective assumptions.
The fair value determined at the grant date of the equity-settled share-based payments is expensed on a straight-line basis over the vesting period, based on the Company’s estimate of shares that will eventually vest.
Equity-settled share-based payment transactions with other parties are measured at the fair value of the goods and services received, except where the fair value cannot be estimated reliably, in which case they are measured at the fair value of the equity instruments granted, measured at the date the entity obtains the goods or the counterparty renders the service.
For cash-settled share-based payments, a liability equal to the portion of the goods or services received is recognised at the current fair value determined at each reporting date.
(p) Adoption of new and revised Accounting Standards
At the date of authorisation of the financial statements, the Standards and Interpretations listed below were in issue but not yet effective. The reported results and position of the Company will not change on adoption of these pronouncements as currently there are no transactions that will be materially impacted by these pronouncements. Adoption of these pronouncements may however, result in changes to information currently disclosed in the financial statement. The Company does not intend to adopt any of these pronouncements before their effective dates.
At the date of authorisation of the financial report, a number of Standards and Interpretations were in issue but not yet effective.
23
Saunders International Limited Notes to the Financial Statements
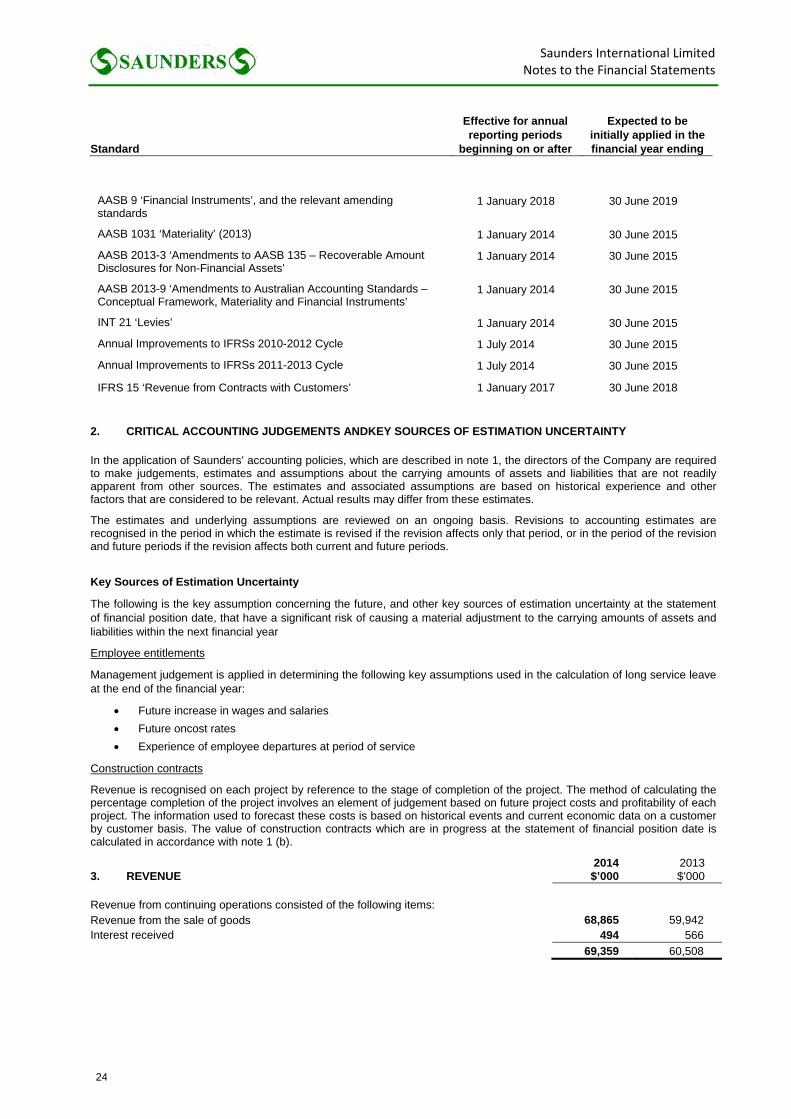
Standard
Effective for annual reporting periods
beginning on or after
Expected to be initially applied in the financial year ending
AASB 9 ‘Financial Instruments’, and the relevant amending standards
1 January 2018 30 June 2019
AASB 1031 ‘Materiality’ (2013) 1 January 2014 30 June 2015
AASB 2013-3 ‘Amendments to AASB 135 – Recoverable Amount Disclosures for Non-Financial Assets’
1 January 2014 30 June 2015
AASB 2013-9 ‘Amendments to Australian Accounting Standards – Conceptual Framework, Materiality and Financial Instruments’
1 January 2014 30 June 2015
INT 21 ‘Levies’ 1 January 2014 30 June 2015
Annual Improvements to IFRSs 2010-2012 Cycle 1 July 2014 30 June 2015
Annual Improvements to IFRSs 2011-2013 Cycle 1 July 2014 30 June 2015
IFRS 15 ‘Revenue from Contracts with Customers’ 1 January 2017 30 June 2018
2. CRITICAL ACCOUNTING JUDGEMENTS ANDKEY SOURCES OF ESTIMATION UNCERTAINTY
In the application of Saunders’ accounting policies, which are described in note 1, the directors of the Company are required to make judgements, estimates and assumptions about the carrying amounts of assets and liabilities that are not readily apparent from other sources. The estimates and associated assumptions are based on historical experience and other factors that are considered to be relevant. Actual results may differ from these estimates.
The estimates and underlying assumptions are reviewed on an ongoing basis. Revisions to accounting estimates are recognised in the period in which the estimate is revised if the revision affects only that period, or in the period of the revision and future periods if the revision affects both current and future periods.
Key Sources of Estimation Uncertainty
The following is the key assumption concerning the future, and other key sources of estimation uncertainty at the statement of financial position date, that have a significant risk of causing a material adjustment to the carrying amounts of assets and liabilities within the next financial year
Employee entitlements
Management judgement is applied in determining the following key assumptions used in the calculation of long service leave at the end of the financial year:
Future increase in wages and salaries
Future oncost rates
Experience of employee departures at period of service
Construction contracts
Revenue is recognised on each project by reference to the stage of completion of the project. The method of calculating the percentage completion of the project involves an element of judgement based on future project costs and profitability of each project. The information used to forecast these costs is based on historical events and current economic data on a customer by customer basis. The value of construction contracts which are in progress at the statement of financial position date is calculated in accordance with note 1 (b).
3. REVENUE
2014 $’000
2013 $’000
Revenue from continuing operations consisted of the following items: Revenue from the sale of goods 68,865 59,942 Interest received 494 566
69,359 60,508
24

Saunders International Limited Notes to the Financial Statements
4. PROFIT FOR THE YEAR
2014 $’000
2013 $’000
Other income Proceeds of settlement of contractual dispute - 1,000 Discounts and rebates 153 129 Profit on sale of asset 143 -
296 1,129
Profit before tax has been arrived at after charging the following expenses: Cost of sales 57,746 50,162 Depreciation
Plant and equipment 595 467 Office furniture and equipment 51 40
646 507
Operating lease rental expenses:
Lease payments 1,155 1,227
Employee benefits expense: Post employment benefits 2,375 2,132 Employee Share Plan 59 124 Salary and wages 23,658 22,440 Other benefits 2,331 1,570
28,423 26,266
25
Saunders International Limited Notes to the Financial Statements
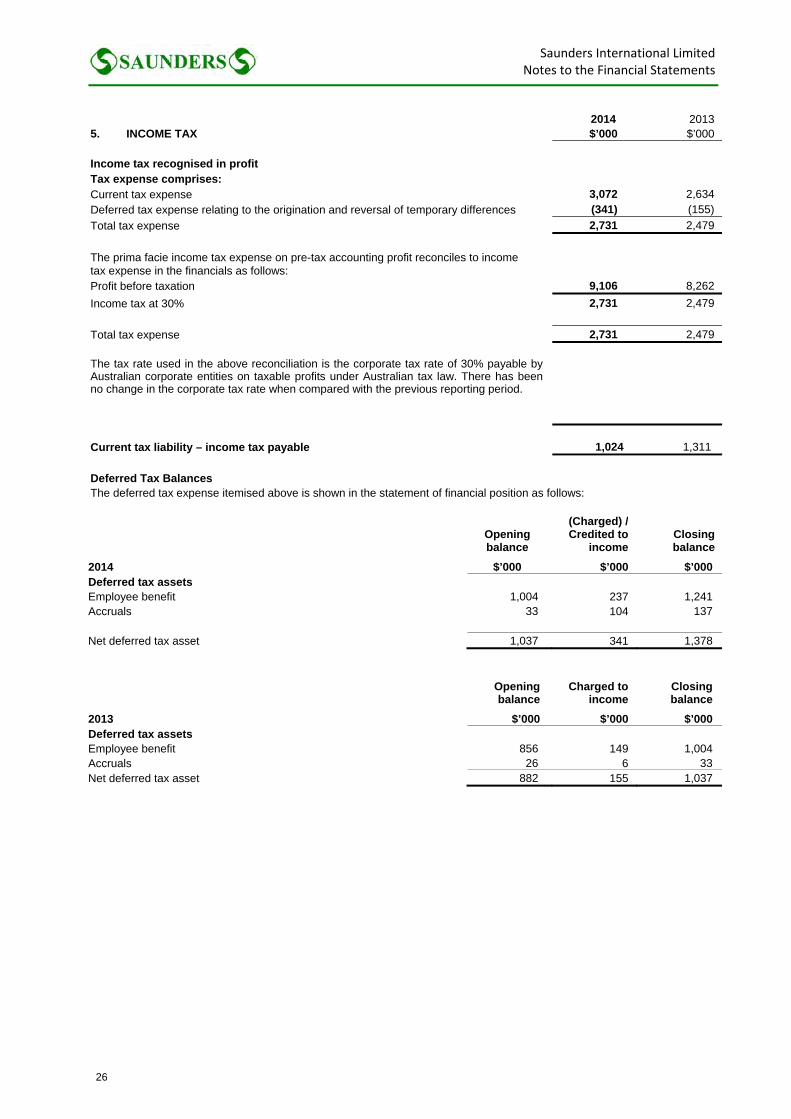
5. INCOME TAX
2014 $’000
2013 $’000
Income tax recognised in profit Tax expense comprises: Current tax expense 3,072 2,634 Deferred tax expense relating to the origination and reversal of temporary differences (341) (155)
Total tax expense 2,731 2,479
The prima facie income tax expense on pre-tax accounting profit reconciles to income tax expense in the financials as follows: Profit before taxation 9,106 8,262
Income tax at 30% 2,731 2,479
Total tax expense 2,731 2,479 The tax rate used in the above reconciliation is the corporate tax rate of 30% payable by Australian corporate entities on taxable profits under Australian tax law. There has been no change in the corporate tax rate when compared with the previous reporting period.
Current tax liability – income tax payable 1,024 1,311
Deferred Tax Balances The deferred tax expense itemised above is shown in the statement of financial position as follows:
Opening balance
(Charged) / Credited to
income Closing balance
2014 $’000 $’000 $’000 Deferred tax assets Employee benefit 1,004 237 1,241 Accruals 33 104 137 Net deferred tax asset 1,037 341 1,378
Opening balance
Charged to income
Closing balance
2013 $’000 $’000 $’000 Deferred tax assets Employee benefit 856 149 1,004 Accruals 26 6 33 Net deferred tax asset 882 155 1,037
26
Saunders International Limited Notes to the Financial Statements
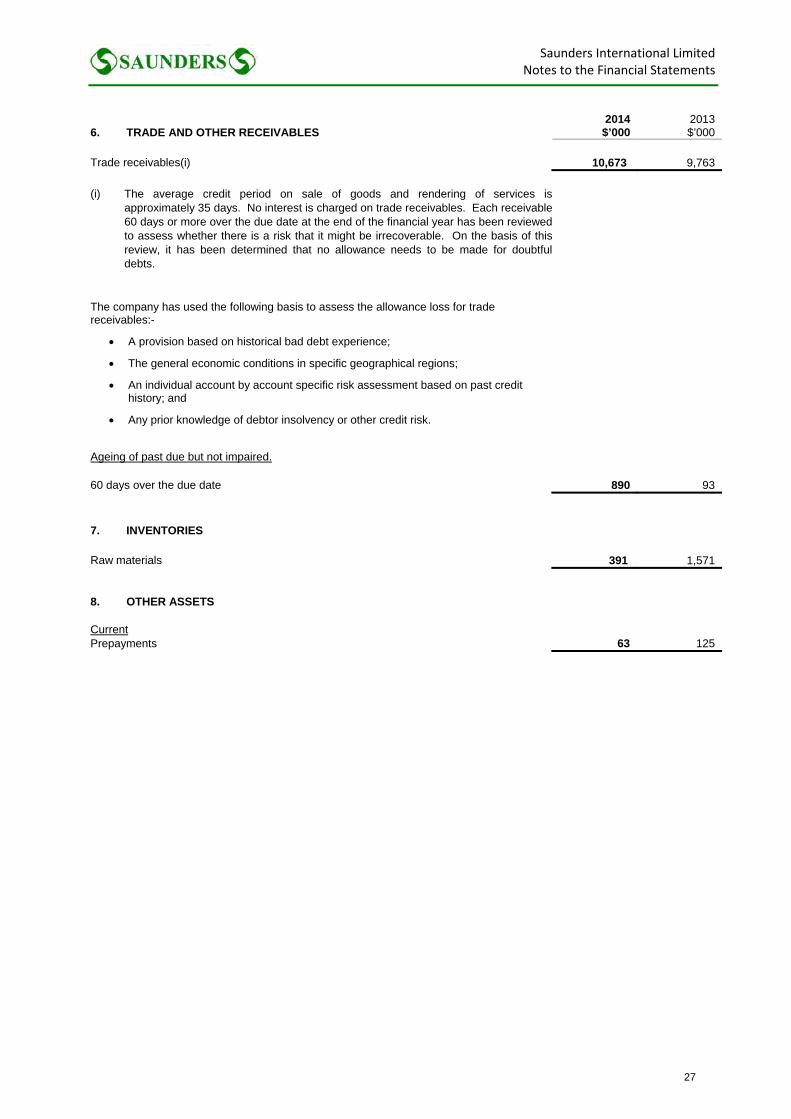
6. TRADE AND OTHER RECEIVABLES 2014 $’000
2013 $’000
Trade receivables(i) 10,673 9,763
(i) The average credit period on sale of goods and rendering of services is
approximately 35 days. No interest is charged on trade receivables. Each receivable 60 days or more over the due date at the end of the financial year has been reviewed to assess whether there is a risk that it might be irrecoverable. On the basis of this review, it has been determined that no allowance needs to be made for doubtful debts.
The company has used the following basis to assess the allowance loss for trade receivables:-
A provision based on historical bad debt experience;
The general economic conditions in specific geographical regions;
An individual account by account specific risk assessment based on past credit history; and
Any prior knowledge of debtor insolvency or other credit risk.
Ageing of past due but not impaired. 60 days over the due date 890 93
7. INVENTORIES Raw materials 391 1,571 8. OTHER ASSETS Current Prepayments 63 125
27
Saunders International Limited Notes to the Financial Statements
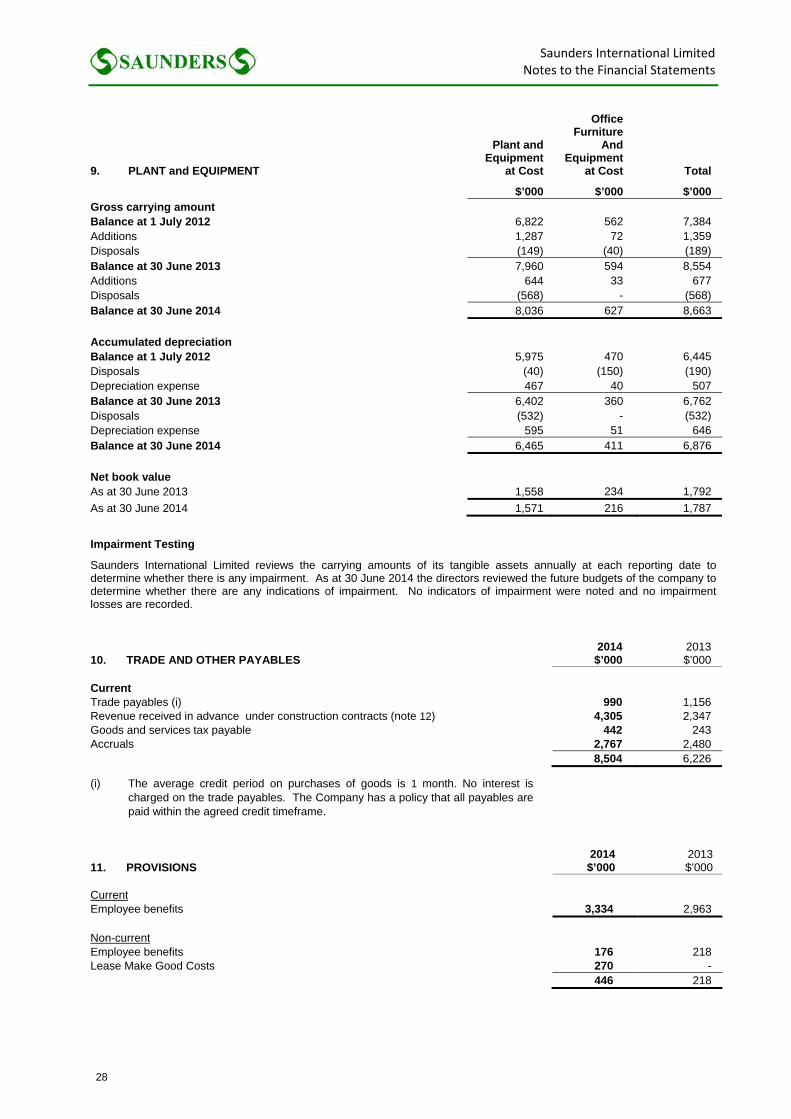
9. PLANT and EQUIPMENT
Plant and Equipment
at Cost
Office Furniture
And Equipment
at Cost Total
$’000 $’000 $’000 Gross carrying amount Balance at 1 July 2012 6,822 562 7,384 Additions 1,287 72 1,359 Disposals (149) (40) (189) Balance at 30 June 2013 7,960 594 8,554 Additions 644 33 677 Disposals (568) - (568) Balance at 30 June 2014 8,036 627 8,663
Accumulated depreciation Balance at 1 July 2012 5,975 470 6,445 Disposals (40) (150) (190) Depreciation expense 467 40 507 Balance at 30 June 2013 6,402 360 6,762 Disposals (532) - (532) Depreciation expense 595 51 646 Balance at 30 June 2014 6,465 411 6,876
Net book value As at 30 June 2013 1,558 234 1,792
As at 30 June 2014 1,571 216 1,787
Impairment Testing
Saunders International Limited reviews the carrying amounts of its tangible assets annually at each reporting date to determine whether there is any impairment. As at 30 June 2014 the directors reviewed the future budgets of the company to determine whether there are any indications of impairment. No indicators of impairment were noted and no impairment losses are recorded.
10. TRADE AND OTHER PAYABLES 2014 $’000
2013 $’000
Current Trade payables (i) 990 1,156 Revenue received in advance under construction contracts (note 12) 4,305 2,347 Goods and services tax payable 442 243 Accruals 2,767 2,480 8,504 6,226
(i) The average credit period on purchases of goods is 1 month. No interest is charged on the trade payables. The Company has a policy that all payables are paid within the agreed credit timeframe.
11. PROVISIONS 2014 $’000
2013 $’000
Current Employee benefits 3,334 2,963 Non-current Employee benefits 176 218 Lease Make Good Costs 270 - 446 218
28
Saunders International Limited Notes to the Financial Statements
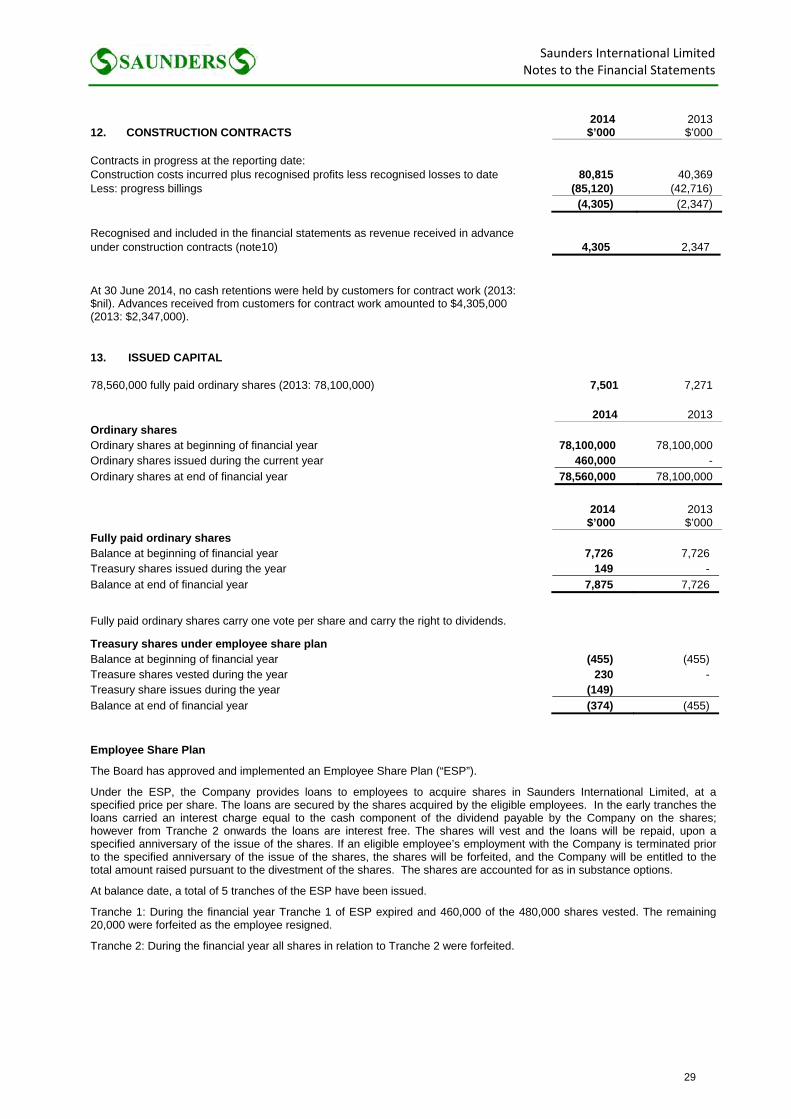
12. CONSTRUCTION CONTRACTS 2014 $’000
2013 $’000
Contracts in progress at the reporting date: Construction costs incurred plus recognised profits less recognised losses to date 80,815 40,369 Less: progress billings (85,120) (42,716) (4,305) (2,347) Recognised and included in the financial statements as revenue received in advance under construction contracts (note10) 4,305 2,347
At 30 June 2014, no cash retentions were held by customers for contract work (2013: $nil). Advances received from customers for contract work amounted to $4,305,000 (2013: $2,347,000). 13. ISSUED CAPITAL
78,560,000 fully paid ordinary shares (2013: 78,100,000) 7,501 7,271 2014 2013 Ordinary shares Ordinary shares at beginning of financial year 78,100,000 78,100,000 Ordinary shares issued during the current year 460,000 -
Ordinary shares at end of financial year 78,560,000 78,100,000
2014 $’000
2013 $’000
Fully paid ordinary shares Balance at beginning of financial year 7,726 7,726 Treasury shares issued during the year 149 -
Balance at end of financial year 7,875 7,726
Fully paid ordinary shares carry one vote per share and carry the right to dividends.
Treasury shares under employee share plan Balance at beginning of financial year (455) (455) Treasure shares vested during the year 230 - Treasury share issues during the year (149)
Balance at end of financial year (374) (455)
Employee Share Plan
The Board has approved and implemented an Employee Share Plan (“ESP”).
Under the ESP, the Company provides loans to employees to acquire shares in Saunders International Limited, at a specified price per share. The loans are secured by the shares acquired by the eligible employees. In the early tranches the loans carried an interest charge equal to the cash component of the dividend payable by the Company on the shares; however from Tranche 2 onwards the loans are interest free. The shares will vest and the loans will be repaid, upon a specified anniversary of the issue of the shares. If an eligible employee’s employment with the Company is terminated prior to the specified anniversary of the issue of the shares, the shares will be forfeited, and the Company will be entitled to the total amount raised pursuant to the divestment of the shares. The shares are accounted for as in substance options.
At balance date, a total of 5 tranches of the ESP have been issued.
Tranche 1: During the financial year Tranche 1 of ESP expired and 460,000 of the 480,000 shares vested. The remaining 20,000 were forfeited as the employee resigned.
Tranche 2: During the financial year all shares in relation to Tranche 2 were forfeited.
29
Saunders International Limited Notes to the Financial Statements
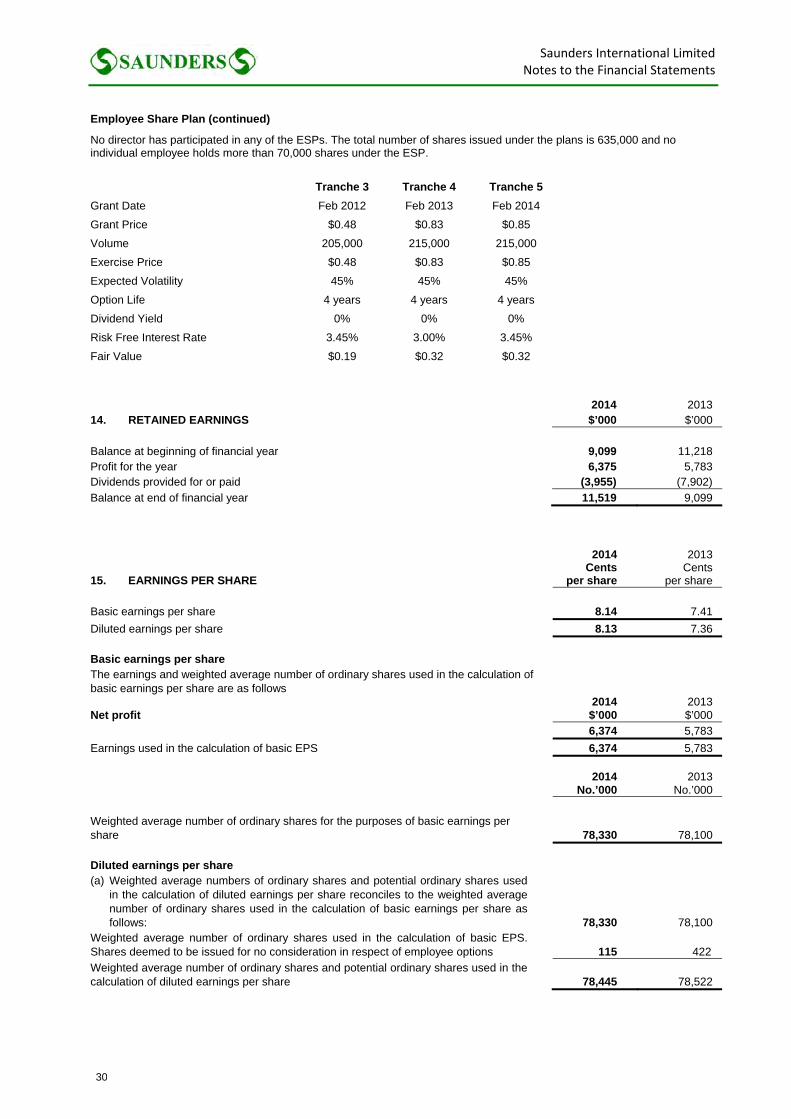
Employee Share Plan (continued)
No director has participated in any of the ESPs. The total number of shares issued under the plans is 635,000 and no individual employee holds more than 70,000 shares under the ESP.
Tranche 3 Tranche 4 Tranche 5
Grant Date Feb 2012 Feb 2013 Feb 2014
Grant Price $0.48 $0.83 $0.85
Volume 205,000 215,000 215,000
Exercise Price $0.48 $0.83 $0.85
Expected Volatility 45% 45% 45%
Option Life 4 years 4 years 4 years
Dividend Yield 0% 0% 0%
Risk Free Interest Rate 3.45% 3.00% 3.45%
Fair Value $0.19 $0.32 $0.32
2014 2013 14. RETAINED EARNINGS $’000 $’000
Balance at beginning of financial year 9,099 11,218 Profit for the year 6,375 5,783 Dividends provided for or paid (3,955) (7,902)
Balance at end of financial year 11,519 9,099
15. EARNINGS PER SHARE
2014 Cents
per share
2013 Cents
per share Basic earnings per share 8.14 7.41
Diluted earnings per share 8.13 7.36 Basic earnings per share The earnings and weighted average number of ordinary shares used in the calculation of basic earnings per share are as follows
Net profit 2014 $’000
2013 $’000
6,374 5,783
Earnings used in the calculation of basic EPS 6,374 5,783
2014
No.’000 2013
No.’000 Weighted average number of ordinary shares for the purposes of basic earnings per share 78,330 78,100 Diluted earnings per share (a) Weighted average numbers of ordinary shares and potential ordinary shares used
in the calculation of diluted earnings per share reconciles to the weighted average number of ordinary shares used in the calculation of basic earnings per share as follows: 78,330 78,100
Weighted average number of ordinary shares used in the calculation of basic EPS. Shares deemed to be issued for no consideration in respect of employee options 115 422
Weighted average number of ordinary shares and potential ordinary shares used in the calculation of diluted earnings per share 78,445 78,522
30
Saunders International Limited Notes to the Financial Statements
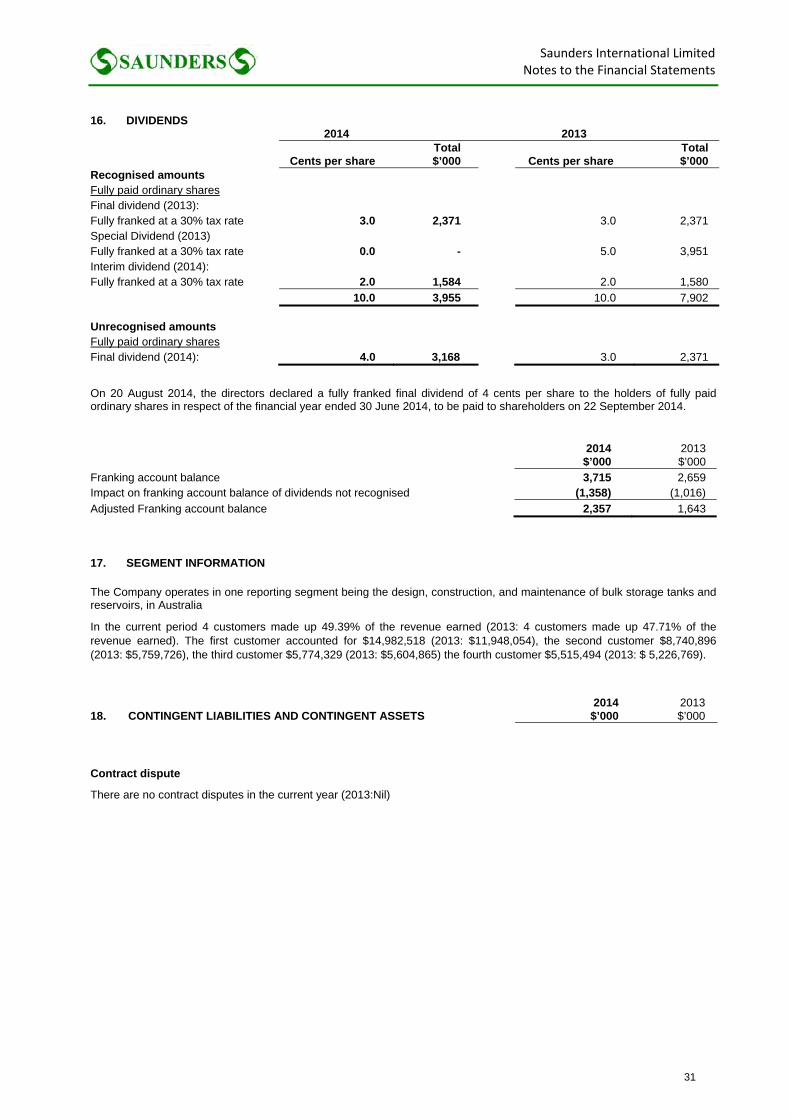
16. DIVIDENDS 2014 2013
Cents per share Total $’000 Cents per share
Total$’000
Recognised amounts Fully paid ordinary shares Final dividend (2013): Fully franked at a 30% tax rate 3.0 2,371 3.0 2,371 Special Dividend (2013) Fully franked at a 30% tax rate 0.0 - 5.0 3,951 Interim dividend (2014): Fully franked at a 30% tax rate 2.0 1,584 2.0 1,580
10.0 3,955 10.0 7,902 Unrecognised amounts Fully paid ordinary shares Final dividend (2014): 4.0 3,168 3.0 2,371
On 20 August 2014, the directors declared a fully franked final dividend of 4 cents per share to the holders of fully paid ordinary shares in respect of the financial year ended 30 June 2014, to be paid to shareholders on 22 September 2014.
2014 $’000
2013 $’000
Franking account balance 3,715 2,659 Impact on franking account balance of dividends not recognised (1,358) (1,016)
Adjusted Franking account balance 2,357 1,643 17. SEGMENT INFORMATION
The Company operates in one reporting segment being the design, construction, and maintenance of bulk storage tanks and reservoirs, in Australia
In the current period 4 customers made up 49.39% of the revenue earned (2013: 4 customers made up 47.71% of the revenue earned). The first customer accounted for $14,982,518 (2013: $11,948,054), the second customer $8,740,896 (2013: $5,759,726), the third customer $5,774,329 (2013: $5,604,865) the fourth customer $5,515,494 (2013: $ 5,226,769).
18. CONTINGENT LIABILITIES AND CONTINGENT ASSETS 2014 $’000
2013 $’000
Contract dispute
There are no contract disputes in the current year (2013:Nil)
31
Saunders International Limited Notes to the Financial Statements
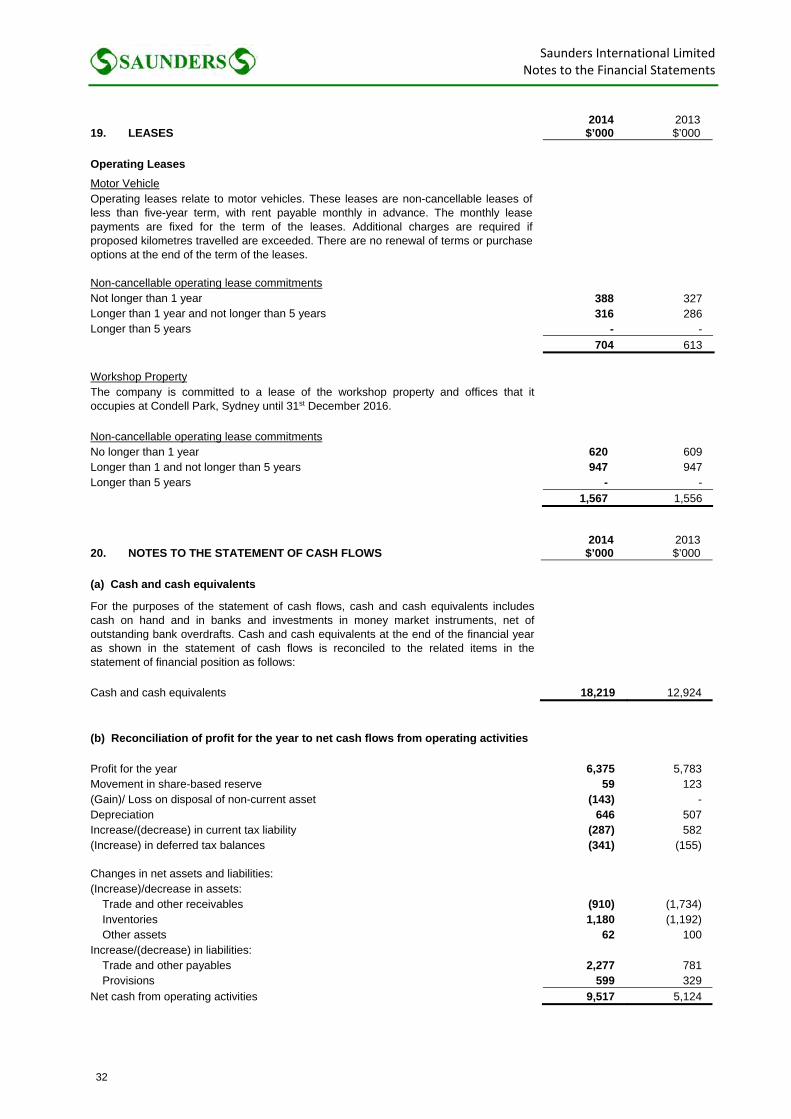
19. LEASES 2014 $’000
2013 $’000
Operating Leases
Motor Vehicle Operating leases relate to motor vehicles. These leases are non-cancellable leases of less than five-year term, with rent payable monthly in advance. The monthly lease payments are fixed for the term of the leases. Additional charges are required if proposed kilometres travelled are exceeded. There are no renewal of terms or purchase options at the end of the term of the leases. Non-cancellable operating lease commitments Not longer than 1 year 388 327 Longer than 1 year and not longer than 5 years 316 286 Longer than 5 years - - 704 613
Workshop Property The company is committed to a lease of the workshop property and offices that it occupies at Condell Park, Sydney until 31st December 2016. Non-cancellable operating lease commitments No longer than 1 year 620 609 Longer than 1 and not longer than 5 years 947 947 Longer than 5 years - -
1,567 1,556
20. NOTES TO THE STATEMENT OF CASH FLOWS 2014 $’000
2013 $’000
(a) Cash and cash equivalents
For the purposes of the statement of cash flows, cash and cash equivalents includes cash on hand and in banks and investments in money market instruments, net of outstanding bank overdrafts. Cash and cash equivalents at the end of the financial year as shown in the statement of cash flows is reconciled to the related items in the statement of financial position as follows: Cash and cash equivalents 18,219 12,924 (b) Reconciliation of profit for the year to net cash flows from operating activities Profit for the year
6,375 5,783
Movement in share-based reserve 59 123 (Gain)/ Loss on disposal of non-current asset (143) - Depreciation 646 507 Increase/(decrease) in current tax liability (287) 582 (Increase) in deferred tax balances (341) (155) Changes in net assets and liabilities: (Increase)/decrease in assets:
Trade and other receivables (910) (1,734) Inventories 1,180 (1,192) Other assets 62 100
Increase/(decrease) in liabilities: Trade and other payables 2,277 781 Provisions 599 329
Net cash from operating activities 9,517 5,124
32
Saunders International Limited Notes to the Financial Statements
20. NOTES TO THE STATEMENT OF CASH FLOWS (continued) (c) Financing facilities The Company’s principal financing facilities for the provision of bank guarantees as described in note 20 is secured by a fixed and floating charge over the assets of the Company.
Amount used 3,347 5,116 Amount unused 3,653 1,884
7,000 7,000
21. FINANCIAL INSTRUMENTS
The Company has three significant categories of financial instruments which are described below together with the policies and risk management processes which the Company utilises:
(a) Cash and cash equivalents
The Company deposits its cash and cash equivalents with Australian banks. Funds can be deposited in cheque accounts, cash management accounts and term deposits. The policy is to utilise at least two Australian banks for cash management accounts and term deposits. The policy with term deposits is to provide for liquidity with a range of maturities up to 6 months.
(b) Debtors and credit risk management
The Company has a credit risk policy to protect against the risk of debtor default. The majority of the Company’s debtors are long term customers and are multinational oil and gas companies, government authorities and large Australian corporations where the credit risk is considered to be low. New customers are assessed for credit risk using credit references and reports from credit agencies as necessary.
(c) Bank guarantees
The Company has a preference to provide bank guarantees to customers in lieu of the cash retention required under contracts. This preference is pursued subject to specific contract requirements and the Company’s bank facility requirements.
Capital risk management
The company’s capital structure currently consists of equity and retained earnings and there is no long term debt or short term debt. The operating cash flows of the company are used to finance short term capital. The capital risk management is continuously reviewed as the Company has surplus cash available for investment.
Categories of financial instruments
Financial assets 2014 $’000
2013 $’000
Loans and receivables 10,673 9,763 Cash and cash equivalents 18,219 12,924 28,892 22,687 Financial liabilities Trade payables and accruals 4,199 3,879
Financial risk management objectives
The company’s exposure to market risk mainly arising from interest rate risk, is disclosed (including currency risk, fair value interest rate risk and price risk) and cash flow interest rate risk is disclosed in the interest rate sensitivity analysis below. Credit risk is monitored monthly through continuous management of the ongoing projects.
33
Saunders International Limited Notes to the Financial Statements
21. FINANCIAL INSTRUMENTS (continued)
Liquidity risk management
Ultimate responsibility for liquidity risk management rests with the board of directors, who have built an appropriate liquidity risk management framework for the management of the Company’s short, medium and long-term liquidity management requirements. The Company manages liquidity risk by continually monitoring and maintaining adequate banking facilities. Cashflows are monitored and matched to the maturity profiles of financial assets and liabilities.
Liquidity and interest risk tables
The following tables detail the Company’s remaining contractual maturity for its non-derivative financial assets and liabilities. The tables have been drawn up based on the undiscounted cash flows of financial assets and liabilities based on the earliest date on which the Company can be required to receive or pay. The table includes both interest and principal cash flows.
Weighted average effective
interest rate Less than 1
month 1 to 3 months 3 months to 2
years
% $’000 $’000 $’000
2014
Financial assets
Cash and cash equivalents 3.63% 7,848 10,371 -
Trade receivables - 6,517 4,156 -
Financial liabilities
Trade payables and accruals - 4,199 - -
2013
Financial assets
Cash and cash equivalents 4.11% 10,824 2,100 -
Trade receivables - 5,117 4,553 93
Financial liabilities
Trade payables and accruals - 3,879 - -
Interest rate sensitivity analysis
The sensitivity analysis below has been determined based on exposure to interest rates for cash and cash equivalents that were subject to interest rate fluctuations at the reporting date. At reporting date, if interest rates had been 1% higher or lower and all other variables were held constant, the Company’s profit or loss would increase or decrease by $155,716 (2013: $149,928).
Fair value of financial instruments
No financial asset or financial liability is held at fair value. The directors consider the fair value of the financial assets and financials liabilities to approximate their carrying amounts.
22. DIRECTORS ANDKEY MANAGEMENT PERSONNEL COMPENSATION
The board of directors approves on an annual basis the amounts of compensation for directors and key management personnel with reference to the company’s performance and general compensation levels in equivalent companies and industries.
Remuneration of Directors and Key Management Personnel
2014
2013
Short-term employee benefits 1,595,324 1,547,091 Post-employment benefits 100,521 87,743
1,695,845 1,634,834
34
Saunders International Limited Notes to the Financial Statements
23. RELATED PARTY TRANSACTIONS
The Company leases a property containing its workshop and offices from a company ultimately beneficially owned by some directors and key management personnel of the Company. The details of this lease are contained in Note 19. These directors and key management personnel have interest in the related party company as follows:
Timothy Burnett 34% Other key management personnel 4%
The rental rate for the first half of the year was evaluated to be market rental as assessed by a Certified Practicing Valuer on 1 January 2012 plus CPI adjustment. The rental rate for the second half of the year was the market rental as assessed by a Certified Practicing Valuer on 1 January 2014. Rent paid during the year amounted to $600,959 (2013: $595,197).The increase over 2013 was due to the above mentioned CPI and the new market rate adjustments.
24. REMUNERATION OF AUDITOR
2014
2013
Audit or review of the financial report 113,000 109,000 113,000 109,000
The auditor of Saunders International Limited is Deloitte Touche Tohmatsu.
25. SUBSEQUENT EVENTS
There has not been any matter or circumstance occurring subsequent to the end of the financial year that has significantly affected, or may significantly affect, the operations of the company, the results of those operations, or the state of affairs of the company in future financial years.
26. ADDITIONAL COMPANY INFORMATION
General Information
Saunders International Limited is incorporated and operating in Australia.
Saunders International Limited’s registered office and its principal place of business is as follows:
Registered office Principal place of business
271 Edgar Street 271 Edgar Street
Condell Park NSW 2200 Condell Park NSW 2200
Tel: (02) 9792 2444 Tel: (02) 9792 2444
35

Saunders International Limited2014 Annual Report
CORPORATE GOVERNANCE
The Board of Saunders has adopted a suite of Corporate Governance Practices to ensure that the Company is effectively directed and managed, risks are identified, monitored and assessed, and appropriate disclosures made.
In developing and adopting the Practices, the Board considered the third addition of the ASX Corporate Governance Principles and Recommendations. The Board incorporates the Principles and Recommendations into its Practices to the extent that they are appropriate, taking into account the Company’s size, activities and resources.
The Board has adopted the following Charters Policies and Codes:-
The Board Charter
The Board Charter sets out matters relating to the responsibilities of the Board and its directors and matters relating to the composition of the Board and appointment of directors. The Board Charter can be found on the Company’s website at www.saunders-international.com.au/investors.htm
Board Committees and their Charters
In order to better manage its responsibilities, the Board has established an Audit and Risk Committee and a Remuneration Committee. Each committee has adopted a Charter approved by the Board. The Charters can be found on the Company’s website at www.saunders-international.com.au/investors.htm
Policies and Codes of Conduct
The Company has adopted a number of Policies and Codes of Conduct as follows:-
Securities Trading Policy – Directors and Senior Executives
Shareholder Communication Policy
Continuous Disclosure Policy
Code of Conduct for Directors and Senior Executives
Copies of these documents can be found on the Company’s website at www.saunders-international.com.au/investors.htm
ASX Corporate Governance Principles and Recommendations
The Company reports on an annual basis its compliance and/or reasons for non-compliance with the third edition of the ASX Corporate Governance Principles and Recommendations. The current report can be found on the Company’s website at www.saunders-international.com.au/investors.htm
36
Saunders International Limited2014 Annual Report
ADDITIONAL STOCK EXCHANGE INFORMATION As at 10 OCTOBER 2014
NUMBER OF HOLDERS OF EQUITY SECURITIES
Ordinary Share Capital
There are 78,560,000 fully paid ordinary shares held by 968 individual shareholders. In addition, there are 635,000 shares issued to employees under the Employee Share Purchase Plans (ESP). These ESP shares are not included for the purposes of calculating the totals and percentages used in this section. There are no options issued.
SUBSTANTIAL SHAREHOLDERS
Shareholder No. of Shares Percentage
Desmond Bryant 22,514,587 28.66%
Timothy Burnett 9,702,531 12.35%
DISTRIBUTION OF SHAREHOLDERS
Range Number of Holders
1 – 1,000 47
1,001 – 5,000 203
5,001 – 10,000 207
10,001 – 100,000 440
101,000 and over 71
TOTAL 968
THE TWENTY LARGEST REGISTERED HOLDERS
Name No. of Shares Percentages 1. MR. DESMOND BRYANT 22,211,587 28.27% 2. TIVOLICO PTYLTD 5,711,262 7.27% 3. MARLOT PTY LTD 3,991,269 5.08% 4. CITICORP NOMINEES PTY LIMITED 3,073,448 3.91% 5. HSBC CUSTODY NOMINEES (AUSTRALIA) LIMITED A/C 3 3,041,857 3.87% 6. MR. JOHN POWER 3,023,513 3.85% 7. J.P. MORGAN NOMINEES AUSTRALIA LIMITED 2,670,149 3.40% 8. MRS. KARYN MAY MCCLELLAND 1,215,366 1.55% 8. SAGIMO HOLDINGS PTY LTD 1,215,366 1.55% 9. PEAKHURST RESEARCH SERVICES PTY LTD <ELLER SUPER FUND> 1,075,700 1.37% 10. NATIONAL NOMINEES LIMITED 1,065,440 1.36% 11. DONALD CANT PTY LTD 865,000 1.10% 12. MR. TREVOR ROSS KENNEDY 796,976 1.01% 13. MR. ROBERT GRABURN PATTERSON 652,142 0.83% 14. PARMELIA PTY LTD <REILLY FAMILY SUPER FUND A/C> 566,003 0.72% 15. IMAJ PTY LTD <SUPER FUND A/C> 517,056 0.66% 16. MR. ANDREW AUZINS + MRS. BRIGITTE AUZINS <AUZINS FAMILY
TRUST> 443,842 0.56%
17. MR. FREDERICK JOHN RICHARDS 400,000 0.51% 18. MR. IAN MCDONALD TAYLOR + MRS. ELSIE JEAN TAYLOR 365,000 0.46% 19. MR. DESMOND JAMES BRYANT <DESMOND BRYANT FAMILY A/C> 303,000 0.39% 20. HSBC CUSTODY NOMINEES (AUSTRALIA) LIMITED 300,000 0.38% 20. TALSTON PTY LTD <J.P. CORNISH P/L S/FUND A/C> 300,000 0.38%
Top 20 Shareholders 53,803,976 68.48%
37
Saunders International Limited2014 Annual Report
CORPORATE DIRECTORY
Saunders International Limited
ABN 14 050 287 431
Board of DirectorsTimothy Burnett, Chairman John Power, Managing Director David Smart, Director Malcolm McComas, Director SecretarySteven Dadich AuditorsDeloitte Touche Tohmatsu The Barrington Level 10, 10 Smith Street Parramatta NSW 2150 Principal BankerCommonwealth Bank Corporate Financial Services Level 1, 430 Forest Road Hurstville NSW 2220 Registered Office and Principal Administrative Office271 Edgar Street Condell Park NSW 2200 Telephone (02) 9792 2444 Facsimile (02) 9771 2640 Share RegisterLink Market Services Limited Level 12, 680 George Street Sydney NSW 2000 Telephone (02) 8280 7111 Stock Exchange ListingAustralian Securities Exchange 20 Bridge Street Sydney NSW 2000 Internet Web Sitewww.saunders-international.com.au [email protected]
38

Saunders International Limited2014 Annual Report
39

40