Embed Size (px)
Citation preview

Saving Energy Through Better Products and Appliances
A report on analysis, aims and indicative standards for energy efficient products 2009 - 2030 December 2009
www.defra.gov.uk
1
Department for Environment, Food and Rural Affairs Nobel House 17 Smith Square London SW1P 3JR Telephone 020 7238 6000 Website: www.defra.gov.uk © Crown copyright 2010 Copyright in the typographical arrangement and design rests with the Crown. This publication (excluding the royal arms and departmental logos) may be re-used free of charge in any format or medium provided that it is re-used accurately and not used in a misleading context. The material must be acknowledged as crown copyright and the title of the publication specified. Information about this publication is available from: Sustainable Energy-using Products Team Defra Zone 5D Ergon House c/o 17 Smith Square SW1P 3JR Email: [email protected] This document is available on the Defra website: http://www.defra.gov.uk/corporate/consult/energy-using-products/index.htm Published by the Department for Environment, Food and Rural Affairs

2
Contents
Executive summary.............................................................................. 3
1: Introduction........................................................................................ 5
2: Context.............................................................................................. 7
3: Product Area Coverage..................................................................... 16
4: Policy Overview................................................................................. 18
5: Delivering Savings through Product Policy........................................
26
Annex 1: Introduction to Product Area Annexes.................................. 30
Annex 2: Consumer Electronic Products............................................. 33
Annex 3: Domestic Appliances Products............................................. 43
Annex 4: Domestic Central Heating Systems...................................... 52
Annex 5: Domestic Lighting Products.................................................. 62
Annex 6: Air Conditioning Products..................................................... 69
Annex 7: Information and Communication Technology Products....... 79
Annex 8: Motors & circulators.............................................................. 91
Annex 9: Commercial Refrigeration..................................................... 103
Annex 10: Non-domestic Lighting Products........................................... 111
Annex 11: Servers and Data Centres (Overview).................................. 122
Annex 12: Domestic Cooking Appliances (Overview)........................... 125
Annex 13: Motor-driven systems (Overview)......................................... 128
Annex 14: Non-Domestic Heating (Overview) ...................................... 131
Annex 15: Other product areas (Overview) ..........................................
134
Appendix I: Analysis of policy scenarios................................................ 137

3
Executive summary
A. The Rationale for Product Policy Appliances that use energy, such as white goods, lighting, televisions, heating and cooling systems and electric motors contribute significantly to the UK‟s CO2 emissions: around a third of the UK‟s greenhouse gas emissions result from the use of Energy using Products, in our homes, offices and in industry. By removing the worst products from the market and promoting the sales of the best products emissions and energy bills are reduced significantly. Government and businesses do this through various means and, taken together, these “product policies” are examined in this document. Such interventions allow Government to deliver CO2 emission reductions with no compromise and no overall cost to the UK economy - combining delivery of substantial emission reductions with the generation of billions of pounds of benefits to the UK. The calculations we have made in developing this document indicate net benefits to UK society of £26 billion (£41 billion in benefits, against a cost of £15 billion) over the period 2009 – 2030 will be possible, as a result of these policies, and at a cost: benefit ratio of 1:3. We have where applicable taken into account the Heat Replacement effect (see footnote 16 pg 14) we have not taken into account the “rebound effect”, when consumers save money only to spend this on other goods and services which themselves have an effect on the CO2 emission reductions. However we know how difficult this can be to measure and continue to invest in research on the role of behaviours and how these can be built into our policies. This document discusses the role of product policy in the context of the UK‟s wider energy saving policies. It provides a high-level overview of product policy in the UK and is supported by nine annexes describing specific groups of energy-using products. The impacts of policies on energy demand for these product groups are compared with the Government‟s aim to reduce greenhouse gas emissions as set out in the Climate Change Act 2008 and the 2050 Pathways Report, published in July 20101. The analyses set out in this document take into account a number of comments received in response to a public consultation held between December 2009 and March 2010.
B. Overview of policy measures
This analysis takes a number of policy measures into account:
Minimum standards which require that all products meet mandatory energy efficiency levels, in particular the European Union‟s standards set under the Eco-design for Energy-using Products Directive (these minimum standards are projected to account for the largest share of savings);
Labelling which informs consumers of the relative energy efficiency of products, allowing them to choose more energy efficient products. This also incentivises manufacturers to develop products which are more energy efficient than the minimum standards require;
1 http://www.decc.gov.uk/en/content/cms/what_we_do/lc_uk/2050/2050.aspx

4
Obligations on energy suppliers have encouraged energy suppliers to work towards reducing the amount of energy that people use in their homes. This includes encouraging people to use more energy-efficient products;
Fiscal: tax incentives for energy efficient products; and
Market instruments: put a price on carbon emissions, which creates an incentive to control them.
C. Policy Gap
Projected policies will deliver substantial savings (in the order of 24 MtCO2 per annum), exceeding government's current aims. There is, however, potential to double savings (an additional 24MtCO2 annual savings) against the baseline set in the 2007 Energy White Paper, by using the most energy-efficient technologies available (Best Available Technologies (BAT)). Further savings could be achieved by consumer behaviour-focused policies. Note that the 24MtCO2 of savings delivered from current projections cited above, assesses progress against an EWP 2007 baseline, whereas the remainder of this document generally provides analysis from a 2009 baseline.
A number of policy options are available to bridge this „gap‟ between the savings achievable between the projected policies and those that would arise if BAT is used by everyone. These focus around building upon, and extending, existing policy mechanisms and supporting technological innovation in energy-using products. Moreover, complementary policies focussed on encouraging responsible, energy-saving consumer behaviour, avoiding the potential for a "rebound effect" whereby financial savings are spent on more consumption, are possible.
5
1. Introduction Appliances and products that use energy, such as white goods, lighting, televisions, heating and cooling systems and electric motors contribute significantly to the UK‟s CO2 emissions. The Government has objectives to reduce these impacts, which includes the removal of the worst products from the market and promoting the sales of the most-efficient products. This document considers all these policies and interventions holistically as “product policies.” Defra has, on a regular basis, updated its evidence base, which covers a large number of domestic and non-domestic energy-using product groups. This document assesses the UK‟s progress towards meeting its objectives to save CO2 through the implementation of effective product policy, and where future efforts should be focused. It sets out the Government‟s current performance standards (also referred to as „Government Standards‟) for energy-using products, projected from the present day to 2030. Government, business and consumers should aim to deliver and use products that meet the performance levels set out in the standards. This overview report presents a cross-cutting analysis of product policy for the UK. Information about policies affecting specific product areas is set out in nine product-specific annexes and five shorter annexes for products not yet subject to policies.
The 2008 Climate Change Act legally binds the UK Government to reduce greenhouse gas emissions (carbon dioxide and the other greenhouse gases covered by the Kyoto Protocol2) by at least 80% by 2050, compared to 1990 levels. In order to do this, the Climate Change Act established a budgeting system that requires Government to set binding limits on UK emissions for each successive five year period, beginning 2008-2012, and requires at least a 34% reduction against a 1990 baseline by 2020. The role of energy-using product policy in the context of wider energy saving commitments is discussed in this document. Most recent projections specify in which areas the largest energy savings are expected, and where more effort will be required both to 2020, and beyond. Future priorities for Government in this area are discussed. The main body of the document is supported by:
nine annexes covering the key background and performance standards for specific product groups
five shorter annexes on product areas for which the Government intends to gather further evidence to enable the development of additional policies; and
a series of Government Standards Briefing Notes (GSBNs) which provide further detail on product area assumptions, policies and scenarios; these are available on the Defra website (http://efficient-products.defra.gov.uk/cms/market-transformation-programme )
2 Methane, nitrous oxide, hydrofluorocarbons, perfluorocarbons and sulphur hexafluoride.
6
The data and modelling underpinning the analysis in this document has been informed by a public consultation held between December 2009 and March 2010, input into which has informed revisions in a number of areas. Data held by the Market Transformation Programme are outlined in the number of Government Standards Briefing Notes which are available on line as a complement to this document.
Existing evidence and Information on the ownership and usage of many domestic products has recently been added to by data collected by the online survey on the „Act on CO2‟ website between 2007 and 2009. Over 100,000 surveys where completed by UK citizens and MTP has worked to analyse these to verify the conclusions of existing sources of evidence.
Further, additional research has been conducted, or is ongoing, such as a joint Defra-DECC commissioned UK Household Energy Consumption survey and a DECC commissioned study “How Trends in Appliances Affect Domestic CO2 Emissions: A Review of Home and Garden Appliances”.

7
2. Context
2.1 Policy Context
Product policy as described in this document is part of the UK's climate change mitigation strategy. This section outlines the policy context within which that strategy operates.
On 23 January 2008 the European Commission put forward a far-reaching package of proposals that will deliver on the European Union's ambitious commitments to fight climate change and promote renewable energy up to 2020 and beyond. In December 2008 the European Parliament and Council reached an agreement on the package that will help transform Europe into a low-carbon economy and increase its energy security. The EU is committed to reducing its overall emissions to at least 20% below 1990 levels by 2020, and is ready to scale up this reduction to as much as 30% under a new global climate change agreement when other developed countries make comparable efforts. It has also set itself the target of increasing the share of renewables in energy use to 20% by 2020. The „Climate action and renewable energy package‟ sets out the contribution expected from each Member State to meeting these targets and proposes a series of measures to help achieve them.3
In the UK, the Climate Change Act 2008 establishes a legally-binding target to reduce the UK‟s greenhouse gas emissions to at least 80% below 1990 levels by 2050, through action at home and abroad, with an interim target requiring reductions of at least 34% below 1990 levels by 2020. The Coalition Government supports this target. If the EU moves to a more ambitious target for 2020 we would expect the UK to amend its 2020 target, along with the second and third carbon budgets, to reflect this. Furthermore, the Government has to set the level of the fourth carbon budget (2023 – 2027) by June 2011. It will therefore be important to consider where additional emissions savings from Energy-using Products could play a key role.
Policies that increase the efficiency of energy-using products do, and will continue to play a large part in moving the UK closer to successfully meeting its targets at the lowest cost, and have helped to establish the UK as a leader in Europe in this area.
Product policy has been moving up the agenda in the UK. The UK‟s 2005 Sustainable Development Strategy – Securing the Future4 tackled the topic of Sustainable Consumption and Production (SCP), setting out three key aims:
- Better products and services with improved environmental performance.
- Cleaner, more efficient production processes which strengthen competitiveness.
- Shifts in consumption towards goods and services with lower environmental impacts.
The Coalition Government continues to support this EU approach to reducing CO2 emissions through various policies including product policy. In particular the setting of Minimum Energy Performance standards (MEPs) and Labelling standards
3 http://ec.europa.eu/environment/climat/climate_action.htm
4 www.defra.gov.uk/sustainable/government/publications/uk-strategy

8
implementing measures that are consistent with the evidence developed by Government as part of this report. And through stakeholder engagement in both EU and UK and the EuP stakeholder forums ensure that any new MEPs and/or Labelling standards will be based on a robust evidence base, cost and benefits and UK (and EU) Impact Assessments. In particular, the effect on small and medium sized enterprises, showing that there are net benefits to UK overall and that UK businesses are not disproportionally affected, that the proposed measures should not have any significant negative impact on consumers in particular the affordability and life cycle cost of the product nor any significant negative impact on Industry‟s competitiveness and that admin burdens to businesses are always minimised. Further, the work is seen to support the economic recovery. The Government‟s work on energy-using products relates mainly to improving the performance of products and services. It also has significant effects on shifting consumption towards goods with lower environmental impacts, in particular considering the impacts of products throughout their whole life-cycle, considering issues such as waste and recycling, transportation and manufacturing.
The 2007 Energy White Paper (EWP) estimated that raising product standards could reduce annual emissions by between 1 and 3 million tonnes of carbon (MtC)5 by 2020 (3.7 to 11 MtCO2 per year). The EWP set out a range of measures aimed at reducing the energy consumption of products, systems and services. The scope of product policy measures and the projections of their impacts have significantly expanded since 2007, and the 2009 Low Carbon Transition Plan reinforced the role that product policy has in carbon reduction, against a projected business-as-usual baseline.
The Government aims to regularly consult on its analysis of how the performance of energy-using products will need to improve over future years, including proposals for product standards and targets to phase out the least efficient products. This regular review process ensures that new evidence, including that relating to recent market changes and the introduction of new technologies, is considered. The Government held its first consultation on this topic in 2007, and published its revised Government Standards in 2008. This document builds upon this first set of standards and has been revised in light of consultation between December 2009 and March 2010. It takes into account new evidence and policy developments since 2007. These regular updates of the Government‟s evidence base ensures ever improving robustness of data, which enables the Government to continually deliver ambitious, innovative evidence-driven policies which will enable the UK to meet – and exceed - its emission reduction commitments.
Improved product sustainability needs to become the normal consideration for the mainstream market. This will be a challenge for manufacturing and retail sectors, but is also to be seen as a major business opportunity. During manufacturing, distribution and retail processes, improved efficiency in the use of a wide range of resources (energy, water, and waste) will drive down business costs, whilst reducing environmental impacts. Moreover, first mover advantage opportunities exist for businesses who anticipate increasing requirements on sustainability, and who design and market products that satisfy changing consumer demands.
5 Using the Department for Business, Innovation and Skills figures for carbon content of electricity
9
Finally, consumers will benefit significantly from improvements in the efficiency and performance of appliances. Year on year savings to household energy and water bills add up to a significant net benefit for the UK as a whole as well as individual households and businesses.
2.2 The role of Product Policy
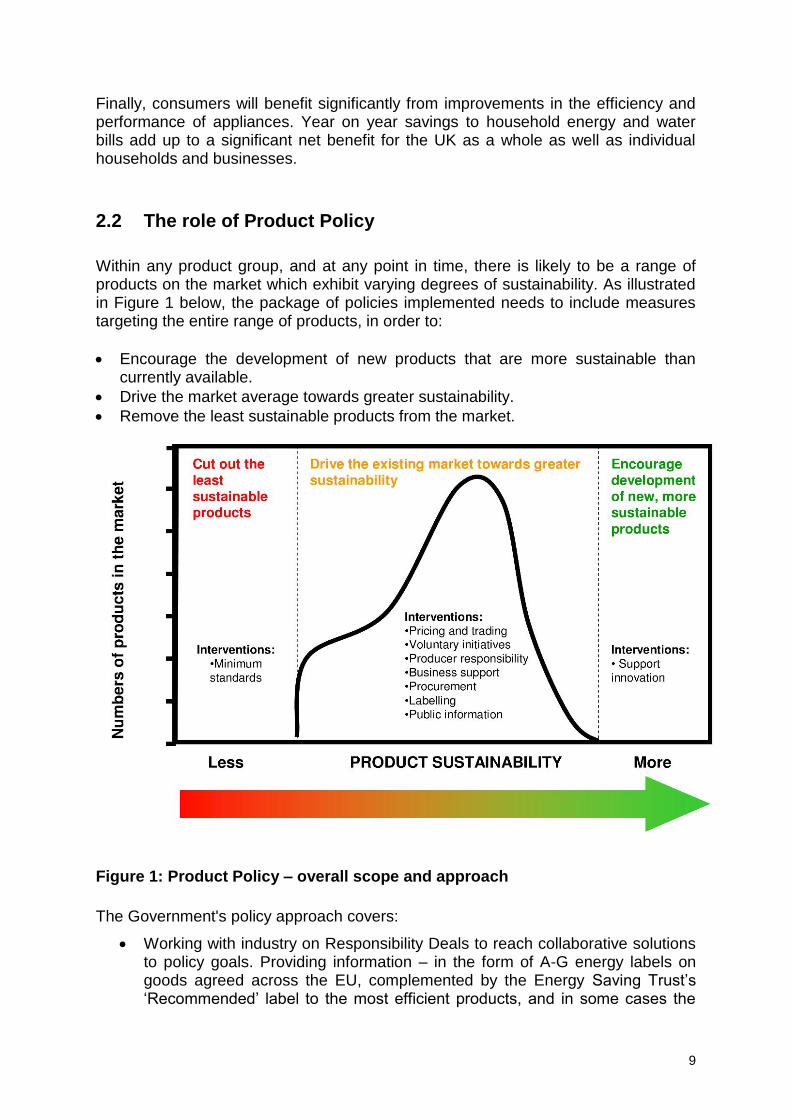
Within any product group, and at any point in time, there is likely to be a range of products on the market which exhibit varying degrees of sustainability. As illustrated in Figure 1 below, the package of policies implemented needs to include measures targeting the entire range of products, in order to:
Encourage the development of new products that are more sustainable than currently available.
Drive the market average towards greater sustainability.
Remove the least sustainable products from the market.
Figure 1: Product Policy – overall scope and approach
The Government's policy approach covers:
Working with industry on Responsibility Deals to reach collaborative solutions to policy goals. Providing information – in the form of A-G energy labels on goods agreed across the EU, complemented by the Energy Saving Trust‟s „Recommended‟ label to the most efficient products, and in some cases the

10
Eco-label for products that meet the standards across a wider range of environmental criteria (not just energy related), as well as through consumer campaigns.
Setting minimum energy performance standards across the EU, alongside UK Building Regulations, and measures to stimulate uptake by households.
Some fiscal/market based incentives, such as Enhanced Capital Allowances, the Climate Change Agreements on major energy using industries, and the Carbon Reduction Commitment tackling the buildings‟ energy performance of medium and large companies, and the public sector.
Product policy provides UK business and consumers with an easy and financially beneficial opportunity to reduce their resource consumption and CO2 emissions. The adoption and implementation of minimum energy performance standards ensures that the poor-performing products are removed from the UK market, so that all available products meet a reasonable minimum level of environmental performance.
Product information harmonised across the EU, such as energy labels, enable consumers and business to make an informed choice about the purchase of products, and select those with an environmental performance exceeding the required minimum standards. Further policy tools used to transform the market for energy-using products include the promotion of the best products by energy suppliers; marketing of energy-efficient products; and voluntary agreements with retailers and manufacturers of products.
Product policy allows Government to deliver CO2 emission reductions and is one of the rare policy options that combine delivering a very substantial emission reduction with generating billions of pounds of benefits to the UK through reduced energy bills. Policy scenario impact calculations undertaken for the analysis underpinning this document project net benefits to UK society of £26 billion (£41 billion in benefits, against a cost of £15 billion over the period 2009 – 2030).
The products currently affected by product policy or for which policy measures are being considered constitute more than 50% of all UK (non-transport) energy use. This accounts for almost all domestic electricity and gas consumption, and around ⅔ of all non-domestic electricity consumption.

11
Figure 2 Coverage of Defra analysis6
2.3 Attributing Product Policy Impacts
The 2008 Climate Change Act (CCA) legally binds the UK Government to reduce carbon emissions (carbon dioxide and other greenhouse gases) by 80% by 2050, compared to 1990 levels. In order to do this, the Climate Change Act set out a budgeting system that requires the Government to set carbon budgets for successive five year periods, beginning 2008-2012, and requires a 34% reduction against a 1990 baseline by 2020. Since 2009 the carbon budgets have been allocated to the key climate change policies and each government department is required to track progress (of their policies) against these carbon budgets. Product policy is a major contributor to emission reduction targets and it is therefore necessary to allocate product policy impacts to the contributing policies so that emission reductions can be attributed to the relevant policies and carbon budget packages. The key reason for assessing attribution of individual policies that contribute to delivering overall product energy efficiency savings, is in order that we don‟t overstate the total emissions reduction potential at an aggregate UK level, given the complex policy landscape.
Savings achieved as a result of Government policies are required to be divided into various packages. An order of attribution must be adhered to so that double counting is avoided. Accordingly, this analysis has split the policy impacts:
by Defra-led and non-Defra-led;
6 Department of Energy & Climate Change (DECC) figures from www.decc.gov.uk/en/content/cms/statistics/statistics.aspx
12
between the different carbon budget packages (Non-energy intensive business and public sector (NEIB); Energy Intensive Business (EIB); Domestic Energy Efficiency (DEE); and Unconstrained (all sectors not covered by one of the packages)); and
between traded (electricity) and non-traded (other fuels) sectors.
The split between Defra-led policies and Non-Defra led policies is as follows:
EuP (Defra)
EU Energy Labelling (Defra)
ENERGY STAR(Defra)
Any voluntary domestic initiatives (e.g. retailer initiative) (Defra)
Public procurement (Defra)
CERT/ Supplier Obligation (SO) (DECC)
Building Regulations, EPBD, Code for Sustainable Homes etc (DCLG/BSD)7
EST initiatives (including EST Recommended (ESTR)) 8
ECAs (Treasury and Carbon Trust)
Any voluntary non-domestic/business measures e.g. CRC or CCA
In accordance with the LCTP, savings achieved as a result of Government policies have been divided into various packages and attributed in line with the carbon budgets methodology. Table 1A shows the attribution of savings by Defra product areas to product policy and the carbon budget packages identified in the 2009 Low Carbon Transition Plan; whereas Table 1B shows the attribution of savings to principle policies. These breakdowns are illustrative and provisional at the time of writing and may be revised when more work has been carried out in this area by Government departments.
7 For England & Wales Building Regulations, EPBD, Code for Sustainable Homes etc (DCLG). For
Scotland Building Regulations, EPBD (Building Standards Division). 8 These are enabling policies; no independent impact is assumed for these

13
Table 1A. Overview of attribution of savings to packages by Defra product area9
Package
Pro
du
ct P
olic
y
Savi
ngs
(Un
con
stra
ined
)
(Led
by
Def
ra)
Do
me
stic
Ener
gy E
ffic
ien
cy
Pac
kage
(N
ot
led
by
Def
ra)
No
n-E
ner
gy
Inte
nsi
ve
Bu
sin
ess
Pac
kage
(N
EIB
)
(CR
C)
(No
t le
d b
y
Def
ra)
E
ner
gy In
ten
sive
Bu
sin
ess
Pac
kage
(EI
B)
(CC
A)
Un
con
stra
ined
(Oth
er)
(No
t le
d
by
Def
ra)
Product Area Total Emissions Savings in 2020 (MtCO2)
Domestic consumer electronics 2.0 2.0 0.0 0.0 0.0 0.0
Domestic appliances 0.8 0.6 0.2 0.0 0.0 0.0
Domestic heating 5.7 3.7 1.9 0.0 0.0 0.0
Domestic lighting 0.5 0.5 0.0 0.0 0.0 0.0
Domestic ICT 0.9 0.9 0.0 0.0 0.0 0.0
Non-Domestic ICT 0.2 0.2 0.0 0.0 0.0 0.0
Non-domestic refrigeration 1.6 1.2 0.0 0.1 0.1 0.2
Non Domestic Motors* 0.0 0.0 0.0 0.0 0.0 0.0
Air conditioning 1.1 0.7 0.0 0.1 0.0 0.3
Non-domestic lighting 1.6 1.1 0.0 0.1 0.0 0.4
Total 14.3 10.9 2.1 0.2 0.2 0.8 *savings in A/C and Non-Domestic Refrigeration The figures presented in Table 1A indicate that 14.3MtCO2 will be saved in 2020 per annum (attributable to all government policy, 10.9MTCO2 of which are drawn from Defra led initiatives), based on the Policy Scenario, relative to the 2009 reference baseline.
Table 1B. Overview of policy splits by Defra product area10
EuP
Directive Energy
Labelling ENERGY
STAR CERT/S
O
Building Regs Part L ECA Other
Product Area % Split of Energy Savings
Domestic consumer electronics 72% 27%
1%
Domestic appliances 49% 28%
23% Domestic heating 66%
3% 29%
2%
Domestic lighting 100% Domestic ICT 39%
60% Non-domestic ICT 40%
60%
Non-domestic refrigeration 77%
6% 17% Non-Domestic Motors 75%
7% 19%
Air conditioning 65%
29% 6% Non-domestic lighting 70%
20% 10%
9 The packages described here are in line with the carbon budgets methodology as set out at Annex A
of LCTP Analytical Annex 10
As for table 1A These breakdowns are illustrative and provisional at the time of writing and may be revised when more work has been carried out in this area by Government departments.

14
2.4 Headline results
Overview savings resulting from the policies outlined in this document, presented in Table 1 (based on the 2020 totals in Table 1A), amount to 22TWh electricity and 24TWh fuels (gas and oil) by 2020 and 38TWh electricity and 42TWh fuels by 2030. This results in annual gross11 CO2 emission reductions from all policies of 14MtCO2 by 2020 and 25MtCO2 by 2030. Net cost savings are projected to materialise as a result of these policies, amounting to £26 billion (discounted) over the period 2009 - 2030. Further details are provided in Section 5.
Table 1. Summary overview of projected savings from anticipated product policy12
2020 2030
Domestic Non-
Domestic Domestic
Non-Domestic
Annual Electricity Savings TWh
Traded 10.6 11.2 19.5 18.8
Annual Fuel Savings Non
Traded 26.1 -1.7 44.7 -2.4
Annual CO2 Emission Reductions
Mt CO2
(gross)
Traded 4.6 4.8 8.4 8.1
Non-Traded
5.2 -0.4 9.5 -0.5
The average cost of delivering emission reductions through product policy is negative. This means that product policy actually results in a financial benefit for the UK as a whole. It has been calculated that cost-effectiveness of savings13, covering all policies covered in this document, ranges from -£103 to -£61 per tonne CO2 (the range between the most cost effective product area and least cost effective product area) in the traded sector14 and £14per tonne CO2 in the non-traded sector15. These savings are partially offset by (cost-effective) increases in heating energy demand, due to the heat replacement effect16.
11
Gross CO2 emission reductions indicate that the Heat Replacement Effect is not taken into account. 12
These measures are estimated to reduce non-traded sector emissions on the basis of (i) assumptions on the level of EU minimum standards for boilers and (ii) a revision to cover the expected heat replacement effect, affecting both the domestic and non-domestic sectors. 13
These cost-effectiveness figures relate to the largest impact of the policy - either on electricity or fuels. In addition, there is a much smaller impact on the use of other sources of energy, which sometimes offsets part of the cost-effectiveness due to the Heat Replacement Effect (see footnote 19 below). 14
Carbon emissions eligible for trading under the EU Emissions Trading System (essentially covers all emissions from electricity generated in the UK) 15
Carbon emissions not included in the EU Emissions Trading System (essentially emissions from all fuels other than electricity) 16
The heat replacement effect (HRE) implies that savings in the energy demand for appliances will be partially offset by increases in heating energy demand, as inefficient appliances produce heat that is
15
Savings in the traded and non-traded sectors have different implications for Government climate change policy. These different impacts are implicit in the analysis and are taken into account in the presentation of costs and benefits of the policies in this document. However, traded and non-traded sector impacts are not discussed in detail in this overview17.
These numbers clearly indicate that product policy is one of the best options available to the UK for delivering its greenhouse gas emission reduction commitments through the EU Emissions Trading System and otherwise. More efficient products result in significant financial benefits to consumers and business, as well as delivering CO2 emission reductions at a net financial benefit.
partially beneficial during the heating season. Further information about this is available in Market Transformation Programme (MTP) Briefing Note BNXS05, available online at http://efficient-products.defra.gov.uk/cms/market-transformation-programme/ 17
More detailed information is available in the Government Standard Briefing Notes, available at http://efficient-products.defra.gov.uk/cms/market-transformation-programme/

16
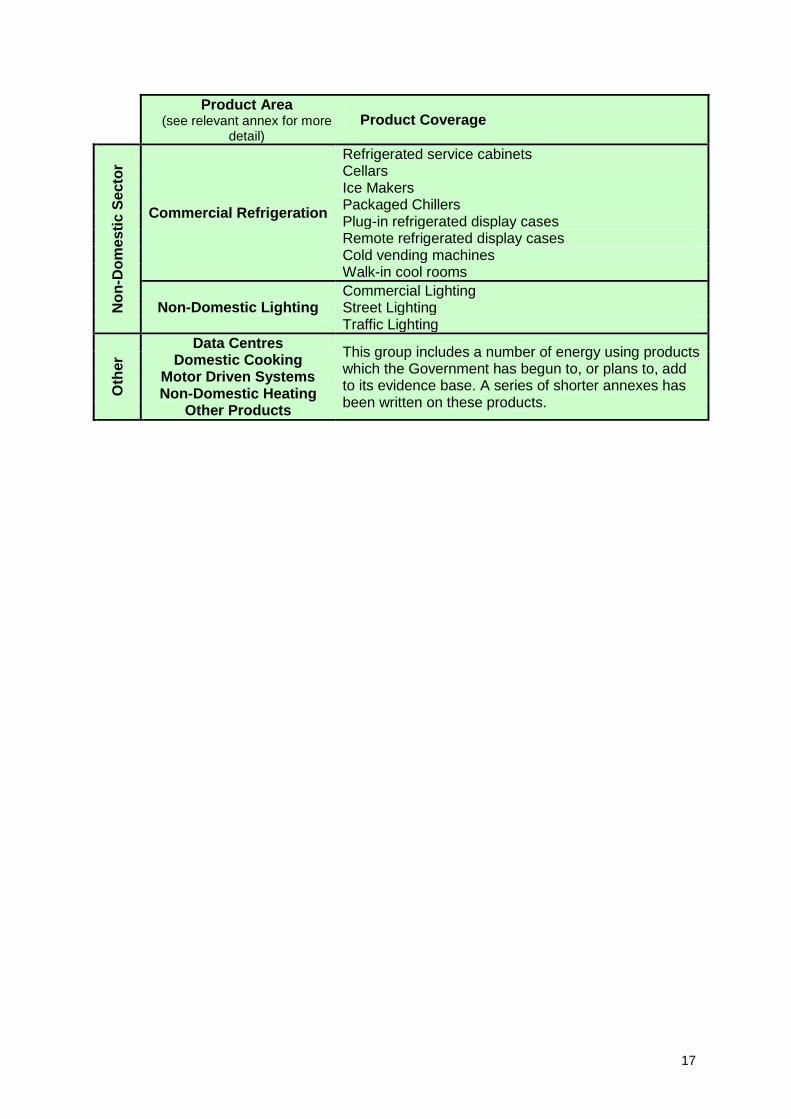
3. Product Area Coverage The table below lists the energy-using products considered in this document and elaborated upon in the nine product area annexes. This list does not cover all energy-using products. The Government is continually seeking to broaden its evidence base to include new products. Further details can be found in the „Other Products‟ annex.
Product Area 18
(see relevant annex for more detail)
Product Coverage
Do
me
sti
c S
ecto
r
Consumer Electronics
Televisions
Power Supply Units
Set top boxes
Video players and recorders
Games Consoles
Domestic Appliances
Domestic Cold Appliances (refrigerators, fridge-freezers, upright freezers and chest freezers)
Domestic Laundry (washing machines, tumble driers and washer-driers)
Domestic Dishwashers
Domestic Heating
Gas Boilers
Oil Boilers
Alternative electric systems (heat pumps)
Alternative gas systems
Alternative biomass systems Electric water heaters
Heating system controls (e.g. thermostats and radiator valves)
Domestic Lighting Internal & external domestic lighting
Do
me
sti
c &
No
n-D
om
es
tic
Air Conditioning
Chillers Air handling units (AHUs) Close control units Ducted split units Fan coil units Indoor units Mini split units Moveable (portable) units Rooftop units Window and through-the-wall units
Information & Communication
Technology
Desktop & Laptop personal computers Imaging Equipment Monitors
Motors & Circulators
AC Induction Motors Permanent magnet motors Other motors Domestic circulators Non-Domestic circulators
18
*Standby and relevant off mode losses are covered across relevant product areas
17
Product Area
(see relevant annex for more detail)
Product Coverage N
on
-Do
me
sti
c S
ecto
r
Commercial Refrigeration
Refrigerated service cabinets Cellars Ice Makers Packaged Chillers Plug-in refrigerated display cases Remote refrigerated display cases Cold vending machines Walk-in cool rooms
Non-Domestic Lighting Commercial Lighting Street Lighting Traffic Lighting
Oth
er
Data Centres This group includes a number of energy using products which the Government has begun to, or plans to, add to its evidence base. A series of shorter annexes has been written on these products.
Domestic Cooking Motor Driven Systems Non-Domestic Heating
Other Products
18
4. Policy Overview
In order to assess how much impact the range of product policies has had and will continue to have, assumptions have been made about the historical and projected impacts of various policies. This section provides a breakdown of the policies affecting different product areas, what these policies actually do – or propose to do - and how the analysis undertaken accounts for their impacts. The policy impacts are broken down in different ways in order to comply with guidance issued by DECC. This includes how policy impacts affect the traded and non-traded sectors (those capped by the EU Emissions Trading Scheme, i.e. electricity, and those outside it, for example gas and oil), the targets for significant climate change policies and the five-year carbon budgets. Finally, the impacts of these policies are assessed, and their relative contributions to UK climate change targets are discussed. Further detail of policy impacts at the product area level can be found in the product area annexes to this document.
4.1 Definition of Scenarios
This document presents four scenarios in order to keep its analysis simple and clear, encourage comment and scrutiny from interested parties, and illustrate the potential impacts of the Government's market transformation strategies.
The scenarios fall into two categories:
1. Broadly, counterfactual scenarios are scenarios with fixed formally signed-off policies and projected market-purchased technologies. These are scenarios used as baselines or references for the purpose of comparison. They project how the market would evolve if no new policies were introduced after a relevant date.
2. Comparative scenarios are the scenarios being compared against the counterfactual scenarios. The Policy Scenario allows comparison of the situation where certain anticipated policies are introduced. The Best Available Technology Scenario projects the readily available maximum technological potential and thus establishes an upper boundary for policy potential.
Counterfactual scenarios (baselines and references)
The EWP-2007 Baseline Scenario provides a baseline against which progress towards the 2007 Energy White Paper baseline can be established. This scenario shows the energy consumption of energy-using products, comparable to projections developed at the time of publication of the Energy White Paper 2007. It assumes that only the policies in place at the time of EWP publication have been implemented, and does not take account of any policies planned or implemented after that date. This baseline takes account of improved knowledge of sales and stock and the impact of recently agreed measures such as the latest revision of CERT and
19
ENERGY STAR. It does not, however, include measures already agreed under the Energy-using Products Directive (EuP).
The Reference Scenario (set in the 2009 Low Carbon Transition Plan (LCTP)) will, in future, be two separate scenarios. Both the LCTP Baseline Scenario and the Reference Scenario are projections of what is likely to happen to the energy consumption of each product area if no new product policies were agreed after July 2009. These are both counterfactual scenarios but the Reference Scenario will, in future, change to include newly agreed policies in future iterations of Government Standards whereas the LCTP Baseline Scenario will not.
The Reference Scenario is a projection of what is likely to happen to the energy consumption of each product area if no new policies are implemented. All currently agreed policies which were formally signed-off before July 2009 are included in this Reference Scenario.
The LCTP Baseline Scenario is a counterfactual corrected for variables i.e. stock, sales and usage data, both for the past performance and future projections. It will change as a result of updated projections of those variables but not as a result of the addition of new policies.
Currently, the results of the two scenarios are the same. However, in future they will differ as newly agreed and formerly signed off policies will be added to the Reference Scenario but no new policies will be added to the LCTP Baseline scenario which will remain fixed at July 2009.
The difference between the EWP-2007 Baseline and the Reference Scenario is, therefore, the savings attributable to product policy introduced since the 2007 Energy White Paper. These are fixed and will not change.
Comparative scenarios (policy and technology)
The Policy Scenario is a projection of what will happen if a defined set of additional product-specific and related cross-cutting policies are implemented. The policies in the Policy Scenario have not yet been agreed or funded but represent those policies which are expected to be introduced as well as likely future revisions to existing policies and, in some cases, novel but realistic policy options. These policies aim to improve the average efficiency of products in the stock through a variety of mechanisms (e.g. minimum standards, product information and labelling, procurement, incentives) and thus reduce energy consumption and CO2 emissions resulting from these products.
As product policy is considered within the context of climate change policy, the UK Government considers policies with a net UK cost, in 2020, of up to around £16 per tonne of CO2 saved (compared to the Reference Scenario). The ambition level, at a minimum, matches the Least Life Cycle Cost (LLCC)19 level to society of increased energy efficiency of products.
19
The Least Life Cycle Cost approach aims to optimise the additional cost of making products more energy efficient against the reduced running cost (due to lower energy use during the product's lifetime). It aims to optimise the total cost of purchasing a (sometimes more expensive) product and the (usually lower) energy costs over the lifetime of the product. This ensures that requirements can be set at levels that maximise benefits to consumers and society.
20
The Best Available Technology (BAT) Scenario is a hypothetical projection of what will happen if the best available technologies on the (current and future) market are bought or installed from now on.
The best available technologies are defined as the most efficient, or lowest energy consuming technologies available on the market, or those which are close to market (where the development stage is completed, but not necessary available as a designed product). This scenario does not account for the costs or practicalities of moving the entire market to the most efficient technologies. It is intended to present an upper limit of the maximum savings currently available from switching to more efficient technologies, and a benchmark for the ambition level of product policies.
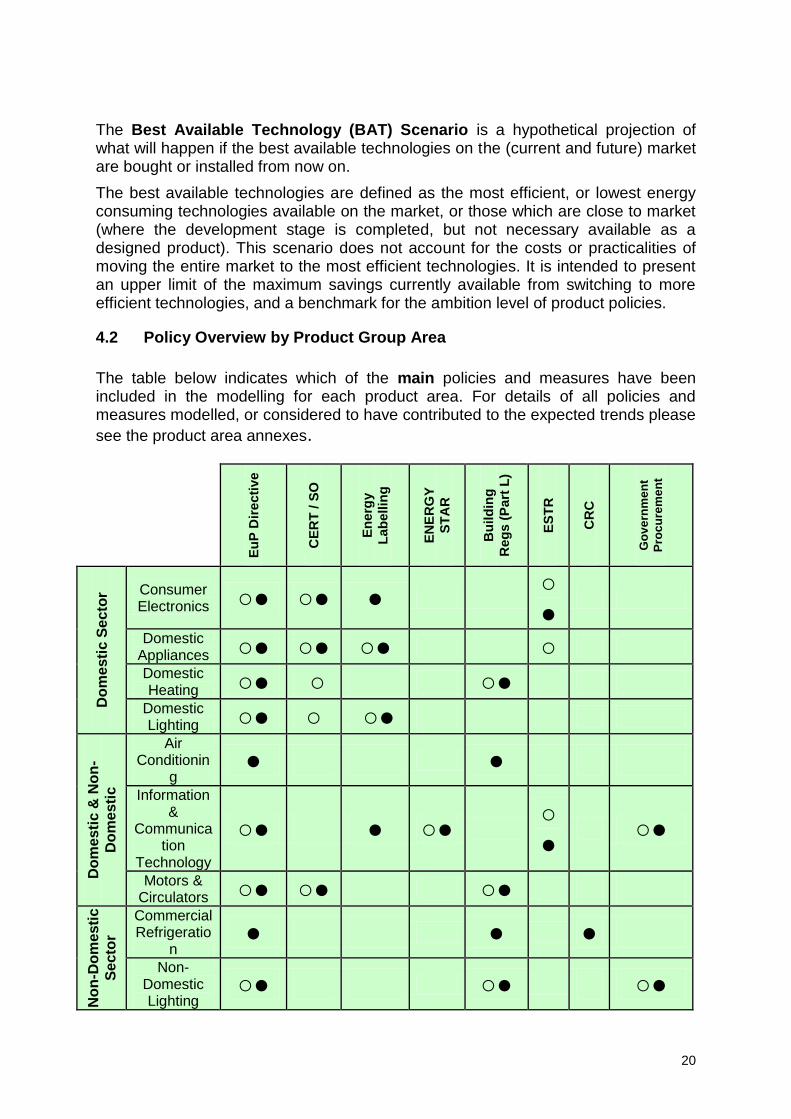
4.2 Policy Overview by Product Group Area
The table below indicates which of the main policies and measures have been included in the modelling for each product area. For details of all policies and measures modelled, or considered to have contributed to the expected trends please
see the product area annexes.
Eu
P D
ire
cti
ve
CE
RT
/ S
O
En
erg
y
Lab
ellin
g
EN
ER
GY
ST
AR
Bu
ild
ing
Reg
s (
Part
L)
ES
TR
CR
C
Go
ve
rnm
en
t
Pro
cu
rem
en
t
Do
me
sti
c S
ecto
r Consumer Electronics ○● ○● ●
○●
Domestic Appliances ○● ○● ○● ○
Domestic Heating ○● ○ ○●
Domestic Lighting ○● ○ ○●
Do
me
sti
c &
No
n-
Do
me
sti
c
Air Conditionin
g ● ●
Information &
Communication
Technology
○● ● ○● ○●
○●
Motors & Circulators ○● ○● ○●
No
n-D
om
esti
c
Se
cto
r
Commercial Refrigeratio
n ● ● ●
Non-Domestic Lighting
○● ○● ○●

21
○ Reference Scenario
● Policy Scenario
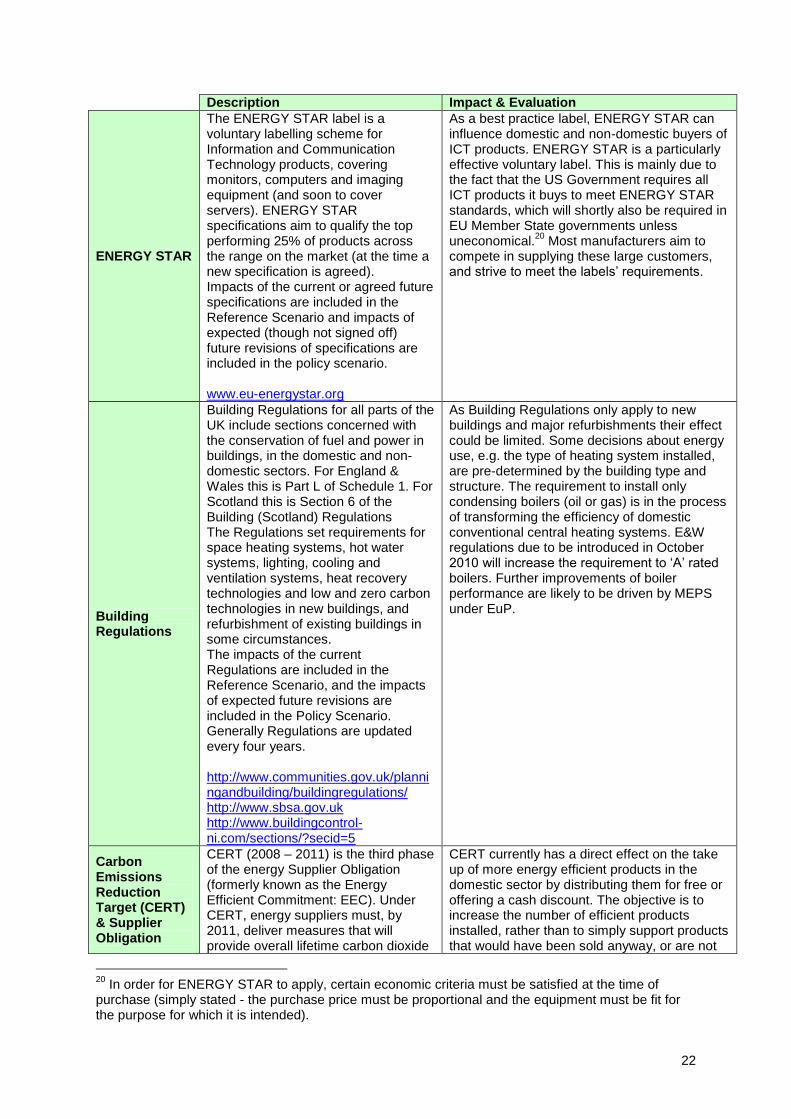
4.3 Policy Descriptions
Description Impact & Evaluation
Implementing Measures under the Energy-using Products Directive (EuP)
Implementing Measures established under this European Union Framework Directive establish mandatory performance standards for a variety of energy-using products. To date these have been a mixture of Minimum Energy Performance Standards (MEPs) and other aspects relating to energy (e.g. automatic switching to a lower energy mode after a given time period without interaction). In 2008 and early 2009, Regulations where passed on External Power Supply Units (ESPUs), Simple Set-top Boxes (SSTBs), Tertiary Lighting products, Non-Directional Domestic Lighting products, Domestic Cold Appliances, Televisions and Motors and Circulators. The impacts of these measures have been included in the Reference Scenario. Measures for other products expected from July 2009 onwards are included in the Policy Scenario. http://ec.europa.eu/enterprise/eco_design/index_en.htm
As mostly a legal requirement the EuP Directive is expected to have a direct and significant effect. The regulations introduced to date have been relatively ambitious and stringent and are expected to cause a significant improvement in the energy performance of products. A wide number of products are currently, or expected to be, covered by the Directive. An additional benefit of the EuP Directive is that, although the minimum energy performance standards (MEPs) only apply within Europe, they may benefit other markets where mass produced international products are sold. This has, however, not been taken into account in the cost benefit analysis undertaken.
Mandatory Energy Labelling
This European Union Directive establishes mandatory energy labels for a variety of energy-using products. Energy labels exist for fridges and freezers, washing machines, driers, dishwashers, ovens, air conditioners and most lamps (not those including reflectors). The impacts of these labels have been included in the Reference Scenario. Revisions of existing labels and labels for new products expected in 2010 and beyond, are included in the Policy Scenario. http://ec.europa.eu/energy/efficiency/labelling/labelling_en.htm
Where energy labels are already established, products have demonstrated steady improvement through the energy label class tiers. It is sometimes suggested that this effect is only partially due to consumers being influenced by the lower energy demand of more efficient products at the point of sale, and that, in addition:
Consumers have tended to associate A-rating with quality;
Financial support for A-rated goods has been available under the Energy Efficient Commitment (EEC);
Retailers and manufacturers have pushed A-rated goods as part of their business and environmental plans.
Combined with the expectation that labelling performance criteria are expected to continue rising, all of these factors are likely to continue to influence sales of more efficient products.
22
Description Impact & Evaluation
ENERGY STAR
The ENERGY STAR label is a voluntary labelling scheme for Information and Communication Technology products, covering monitors, computers and imaging equipment (and soon to cover servers). ENERGY STAR specifications aim to qualify the top performing 25% of products across the range on the market (at the time a new specification is agreed). Impacts of the current or agreed future specifications are included in the Reference Scenario and impacts of expected (though not signed off) future revisions of specifications are included in the policy scenario. www.eu-energystar.org
As a best practice label, ENERGY STAR can influence domestic and non-domestic buyers of ICT products. ENERGY STAR is a particularly effective voluntary label. This is mainly due to the fact that the US Government requires all ICT products it buys to meet ENERGY STAR standards, which will shortly also be required in EU Member State governments unless uneconomical.
20 Most manufacturers aim to
compete in supplying these large customers, and strive to meet the labels‟ requirements.
Building Regulations
Building Regulations for all parts of the UK include sections concerned with the conservation of fuel and power in buildings, in the domestic and non-domestic sectors. For England & Wales this is Part L of Schedule 1. For Scotland this is Section 6 of the Building (Scotland) Regulations The Regulations set requirements for space heating systems, hot water systems, lighting, cooling and ventilation systems, heat recovery technologies and low and zero carbon technologies in new buildings, and refurbishment of existing buildings in some circumstances. The impacts of the current Regulations are included in the Reference Scenario, and the impacts of expected future revisions are included in the Policy Scenario. Generally Regulations are updated every four years. http://www.communities.gov.uk/planningandbuilding/buildingregulations/ http://www.sbsa.gov.uk http://www.buildingcontrol-ni.com/sections/?secid=5
As Building Regulations only apply to new buildings and major refurbishments their effect could be limited. Some decisions about energy use, e.g. the type of heating system installed, are pre-determined by the building type and structure. The requirement to install only condensing boilers (oil or gas) is in the process of transforming the efficiency of domestic conventional central heating systems. E&W regulations due to be introduced in October 2010 will increase the requirement to „A‟ rated boilers. Further improvements of boiler performance are likely to be driven by MEPS under EuP.
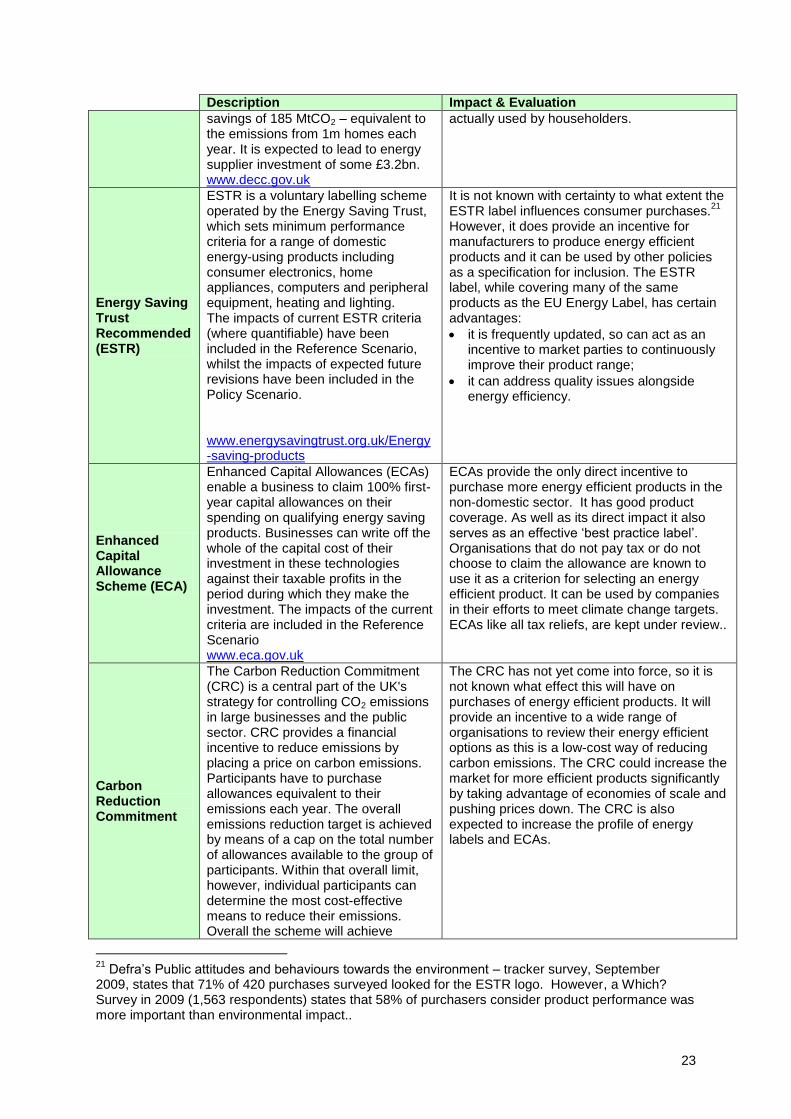
Carbon Emissions Reduction Target (CERT) & Supplier Obligation
CERT (2008 – 2011) is the third phase of the energy Supplier Obligation (formerly known as the Energy Efficient Commitment: EEC). Under CERT, energy suppliers must, by 2011, deliver measures that will provide overall lifetime carbon dioxide
CERT currently has a direct effect on the take up of more energy efficient products in the domestic sector by distributing them for free or offering a cash discount. The objective is to increase the number of efficient products installed, rather than to simply support products that would have been sold anyway, or are not
20
In order for ENERGY STAR to apply, certain economic criteria must be satisfied at the time of purchase (simply stated - the purchase price must be proportional and the equipment must be fit for the purpose for which it is intended).
23
Description Impact & Evaluation
savings of 185 MtCO2 – equivalent to the emissions from 1m homes each year. It is expected to lead to energy supplier investment of some £3.2bn. www.decc.gov.uk
actually used by householders.
Energy Saving Trust Recommended (ESTR)
ESTR is a voluntary labelling scheme operated by the Energy Saving Trust, which sets minimum performance criteria for a range of domestic energy-using products including consumer electronics, home appliances, computers and peripheral equipment, heating and lighting. The impacts of current ESTR criteria (where quantifiable) have been included in the Reference Scenario, whilst the impacts of expected future revisions have been included in the Policy Scenario. www.energysavingtrust.org.uk/Energy-saving-products
It is not known with certainty to what extent the ESTR label influences consumer purchases.
21
However, it does provide an incentive for manufacturers to produce energy efficient products and it can be used by other policies as a specification for inclusion. The ESTR label, while covering many of the same products as the EU Energy Label, has certain advantages:
it is frequently updated, so can act as an incentive to market parties to continuously improve their product range;
it can address quality issues alongside energy efficiency.
Enhanced Capital Allowance Scheme (ECA)
Enhanced Capital Allowances (ECAs) enable a business to claim 100% first-year capital allowances on their spending on qualifying energy saving products. Businesses can write off the whole of the capital cost of their investment in these technologies against their taxable profits in the period during which they make the investment. The impacts of the current criteria are included in the Reference Scenario www.eca.gov.uk
ECAs provide the only direct incentive to purchase more energy efficient products in the non-domestic sector. It has good product coverage. As well as its direct impact it also serves as an effective „best practice label‟. Organisations that do not pay tax or do not choose to claim the allowance are known to use it as a criterion for selecting an energy efficient product. It can be used by companies in their efforts to meet climate change targets. ECAs like all tax reliefs, are kept under review..
Carbon Reduction Commitment
The Carbon Reduction Commitment (CRC) is a central part of the UK's strategy for controlling CO2 emissions in large businesses and the public sector. CRC provides a financial incentive to reduce emissions by placing a price on carbon emissions. Participants have to purchase allowances equivalent to their emissions each year. The overall emissions reduction target is achieved by means of a cap on the total number of allowances available to the group of participants. Within that overall limit, however, individual participants can determine the most cost-effective means to reduce their emissions. Overall the scheme will achieve
The CRC has not yet come into force, so it is not known what effect this will have on purchases of energy efficient products. It will provide an incentive to a wide range of organisations to review their energy efficient options as this is a low-cost way of reducing carbon emissions. The CRC could increase the market for more efficient products significantly by taking advantage of economies of scale and pushing prices down. The CRC is also expected to increase the profile of energy labels and ECAs.
21
Defra‟s Public attitudes and behaviours towards the environment – tracker survey, September 2009, states that 71% of 420 purchases surveyed looked for the ESTR logo. However, a Which? Survey in 2009 (1,563 respondents) states that 58% of purchasers consider product performance was more important than environmental impact..

24
Description Impact & Evaluation
emissions reductions of at least 4MtCO2 per year by 2020. The impacts of CRC are modelled in the Policy Scenario. www.decc.gov.uk/en/content/cms/what_we_do/lc_uk/crc/crc.aspx
Government Procurement
Through setting mandatory and voluntary requirements for central government departments and guidelines or criteria for energy-using products purchased by the wider public sector, Government Procurement plays a role in ensuring that where possible efficient products are used. The impacts of current criteria (where quantifiable) have been included in the Reference Scenario, whilst the impacts of expected future revisions have been included in the Policy Scenario.
The public sector owns and operates a significant proportion of energy-using products with a corresponding potential to increase product standards. Government procurement policy has potential to significantly increase the market for more efficient products.
Other policies
Other Government policies which may influence energy-using products include
22:
Consumer focused pro-environmental campaigns
Climate Change Agreements (CCAs)
Code for Sustainable Homes
EU Codes of Conduct
International collaboration – including the IEA 4E implementing agreement
Labelling of building energy efficiency (implementing the European Union Energy Performance of Building Directive)
Scheduled introduction of smart metering
Zero Carbon Homes Initiative
Community Energy Saving Programme (CESP) focussing on energy (mainly boilers), insulation measures and energy advice at a community level.
Most of these policies increase awareness of both the advantages of energy efficiency and the availability of energy efficient products to meet them. As well as having some effect in their own right they support, and are supported by, the other policies discussed.
Test standards (policy support)
The establishment of agreed, robust test standards to measure the energy efficiency performance of products, acts as a supportive tool to ensure the effectiveness of the policies and measures employed. Coupled with effective compliance monitoring, test
Test standards have no direct savings effect but robust standards are essential for all the other policies listed. Internationally agreed standards decrease costs for manufacturers and improve the prospects for international agreements and for positive spill over effects into other jurisdictions.
22
A further policy, the Renewable Heat Incentive, is likely to have an effect, on domestic heating, in particular in encouraging the use of alternative technologies (eg solar, biomass, heat pumps._The policy was in the process of being developed when this analysis was undertaken and therefore the effect of this policy was not taken into account. Equally policies currently in development (such as for example, the Green Deal) have not been taken into consideration in this analysis..

25
Description Impact & Evaluation
standards play an important underpinning role in energy-using product policy.

26
5. Delivering Savings through Product Policy
5.1 Savings in the Policy Scenario
Future policies will deliver substantial savings, reaching annual savings of 24MtCO2 by 2020 (compared to the EWP-2007 baseline), as illustrated by the Policy Scenario. As described in Section 3, savings in the Policy Scenario are achievable by harnessing, among others, the following main types of policies and measures:
Minimum product performance standards
Energy labelling
Working with the supply chain, via voluntary agreements and supplier obligations
UK Government incentives or subsidies for energy-efficient products
UK Government procurement of energy-efficient products The savings under the Policy Scenario will only be achieved if the package of policies on which it is based is effectively implemented. Accordingly, in order to ensure that the current and future targets continue to be met, the Government will investigate options for accessing the policy gap. The challenge is therefore two-fold: firstly, to ensure that the appropriate policies are implemented in order to attain the projected savings under the Policy Scenario; and further to identify what additional actions and measures are required to access savings beyond those achievable in the Policy Scenario. The majority of savings under the Policy Scenario are expected to be delivered via the EuP Directive. There are two main risks with this. The first is that for those individual product measures not yet agreed, proposed performance standards may not be as ambitious as possible, given that these are the result of negotiations amongst 27 different Member States in the EU. Conversely, where strong evidence of a cost-effective saving potential is available, there may be scope to push for higher minimum performance standards. Part of the purpose of this document is to build on and strengthen the current evidence base to identify where further savings can be made. In particular, over a quarter of the projected savings are due to the prospective EuP measure in the area of domestic heating. Accordingly, ensuring that the standards are set at the appropriate level, in areas where large savings potential have been identified, will be a key focus during forthcoming negotiations (on EuP) in the EU. The second risk is that across all EuP measures compliance may be low. To this end, in late 2009, the Government appointed a market surveillance authority for the UK, tasked with the essential role of compliance checking and enforcing requirements for energy-using products. The UK Market Surveillance Authority is administered by the National Measurement Office, and provides a strong compliance regime to ensure that standards set are achieved. This takes place against the

27
background of increasing attention for compliance checking and enforcement of requirements in the EU.
5.2 The Policy Gap
As outlined in the Appendix, the Best Available Technology Scenario delivers an additional 24MtCO2 in 2020 and 21MtCO2 in 2030 over the savings available in the Policy Scenario. The BAT scenario demonstrates that there is potential for further savings through using the best currently available technology. The difference between the two scenarios is called the „policy gap‟, representing the additional savings potential for which there are currently no specific policies planned. Given that the EU Emissions Trading Scheme (ETS) is firmly in place for the foreseeable future, and that trading schemes appear to be the most effective solution to reach binding global CO2 reductions for an externality that requires international coordination, it is assumed that such mechanisms are likely, if anything, to increase in the future. The UK Government CO2e analysis is typically carried out on this basis, making a distinction between emissions covered by the EU ETS and those that are not, in order that the specific effects are analysed accurately. This document does not specifically separate out emissions covered by the EU ETS and those that are not, but these effects are nevertheless implicit in the analysis presented in this document. In terms of wider targets (namely the 34% reduction in greenhouse gases by 2020, compared to 1990, required under the Climate Change Act 2008), the Policy and BAT Scenarios show that product policy has an important role in achieving these overall reductions in a highly cost-effective manner. Although there are other sectors, such as transport, contributing to this broader target, savings from energy-using products are relatively quick and easy to deliver and the policies are amongst the most cost-effective available: the more that can be achieved in this sector and the sooner this happens, the more time there will be for progress to be made in other „harder to access‟ areas. Each product annex identifies some technology options for further savings, as well as barriers hindering their implementation. Government will investigate supporting or mandating policies, which can be developed to bring forward these savings. The longer-term target is to reduce greenhouse gas emissions by at least 80% below 1990 levels by 2050: current emissions for energy-using products are similar to 1990 levels (emissions having fallen initially – mainly due to the „dash for gas‟23 – and then increased back to 1990 levels). Accordingly, far more substantial savings, from all policies including product policy, are required to meet this target. The BAT scenario, the most ambitious one, again plays a critical role in achieving these overall reductions in a highly cost-effective manner.
23
A large increase in the demand for gas was experienced in the 1990s. This was a result of advancements in technology, decline in wholesale gas prices and newly privatised energy companies vying for footholds in the market. As a consequence of this transition, carbon emissions fell for a period.
28
The Government has set an overall climate change target for 2050 but has not yet set out the specific policies that will be required to deliver it24. In order to assess the potential size of the challenge ahead, however, the amount of savings required to meet an 80% reduction in emissions resulting from products has been calculated. These savings would amount to more than six times those projected to be delivered over the period 2009 – 2030, in absolute terms (and larger in relative terms). Whilst good progress has been made in delivering savings through product policy to date, this serves to underline the importance of accessing the policy gap and beyond. Combined with a robust evidence base, frequent assessment of the savings achieved and the further savings which can be accessed, as made public in this Government Standards analysis, will assist the Government to develop continually ambitious and innovative policies in response to more stretching ambition in the future. Accessing the additional savings in the policy gap will require an increase in the level of ambition for existing measures and policies as well as the introduction of new policies and a broadening of product coverage. Pushing for higher minimum performance standards under future EuP measures and revisions will be important in removing the least efficient products from the market („market push‟), but potentially more challenging to achieve since it is not directly under the Government‟s control, requiring agreement amongst the EU Member States. Hence, there is also a need for a strong focus on more ambitious UK-specific „market pull‟ policies that encourage the purchase of more efficient products, such as subsidies and procurement. More ambitious energy label criteria would support these policies and provide an additional incentive towards higher performing products. It is clear that further development of product policy, extending into new areas and employing new approaches, is necessary in order to achieve the challenging targets. For example, the development of “smart grid25” approaches in the future will create a need for appliances to be made “smart” so that consumers or other parties can easily integrate their demand profile with the needs of the system, and so reduce both costs and carbon emissions (e.g. through the more effective utilisation of renewable or locally produced energy). Product policy has a role to play through endorsing the development of smart products that can respond to remote signals to adjust power consumption, resulting in an instantaneous automated „Demand Side Response‟ to assist balancing of a future power system. This has the potential to reduce the costs of managing power system stability and reduce carbon emissions if proven and installed on a large scale. Smart metering deployment to residential customers (as announced by the Government) may also lead to active management of demand for loads such as cooling, through the introduction of time of use tariffs or remote switching.
24
2050 Roadmap http://www.decc.gov.uk/en/content/cms/what_we_do/lc_uk/lc_uk.aspx 25
A smart grid is an electricity network that can intelligently integrate the actions of all users connected to it – generators, consumers and those that do both – in order to efficiently deliver sustainable, economic and secure electricity supplies. (European Technology Platform on Smart Grids)

29
New policies will also be essential – the nine product area annexes include some suggestions for potential new policies, but more will be required to achieve the 2050 climate change target. Further savings can also be achieved by addressing other factors: for example, the role of behavioural change is a major influencing factor on consumer usage patterns of energy-using products. This factor‟s potential has been harnessed to some extent in the domestic sector, but there are likely to be further positive benefits of developing behavioural change measures alongside product policies in both the domestic and non-domestic sectors. This will assist in avoiding the potential for a "rebound effect". In addition, Government is investigating the effects of life-cycle, balancing the waste and economic effects of earlier or later product replacement with the energy efficiency benefits. Technological innovation is also a key factor: by encouraging industry to continuously innovate; present uncertainty can be transformed into real future opportunities. Through further research and development into more efficient energy-using products, industry can develop savings far beyond those presented in the current BAT scenario, introducing new, as yet unforeseen efficient technologies on the market.
30
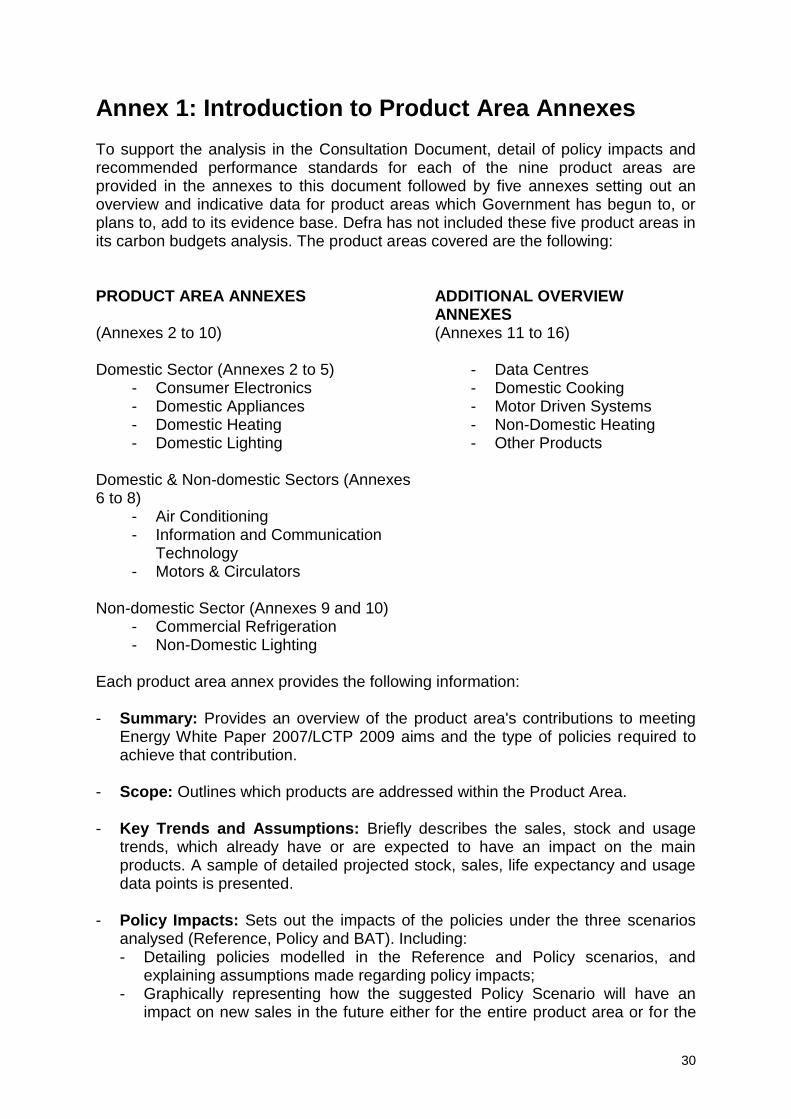
Annex 1: Introduction to Product Area Annexes To support the analysis in the Consultation Document, detail of policy impacts and recommended performance standards for each of the nine product areas are provided in the annexes to this document followed by five annexes setting out an overview and indicative data for product areas which Government has begun to, or plans to, add to its evidence base. Defra has not included these five product areas in its carbon budgets analysis. The product areas covered are the following: PRODUCT AREA ANNEXES ADDITIONAL OVERVIEW
ANNEXES (Annexes 2 to 10) (Annexes 11 to 16) Domestic Sector (Annexes 2 to 5) - Data Centres
- Consumer Electronics - Domestic Cooking - Domestic Appliances - Motor Driven Systems - Domestic Heating - Non-Domestic Heating - Domestic Lighting - Other Products
Domestic & Non-domestic Sectors (Annexes 6 to 8)
- Air Conditioning - Information and Communication
Technology
- Motors & Circulators Non-domestic Sector (Annexes 9 and 10)
- Commercial Refrigeration - Non-Domestic Lighting
Each product area annex provides the following information: - Summary: Provides an overview of the product area's contributions to meeting
Energy White Paper 2007/LCTP 2009 aims and the type of policies required to achieve that contribution.
- Scope: Outlines which products are addressed within the Product Area. - Key Trends and Assumptions: Briefly describes the sales, stock and usage
trends, which already have or are expected to have an impact on the main products. A sample of detailed projected stock, sales, life expectancy and usage data points is presented.
- Policy Impacts: Sets out the impacts of the policies under the three scenarios analysed (Reference, Policy and BAT). Including: - Detailing policies modelled in the Reference and Policy scenarios, and
explaining assumptions made regarding policy impacts; - Graphically representing how the suggested Policy Scenario will have an
impact on new sales in the future either for the entire product area or for the
31
most energy-using product in the product area (similar information for other products in the area, with tables of average performance standards, can be found in the relevant Key Outputs Government Standards Briefing Note);
- Providing headline data on the cost-effectiveness of the policy package. Each Product Area Annex is supported by a set of Government Standards Briefing Notes, which provide further detail of the assumptions and figures used in modelling each product comprised within a product area. These can be accessed on the Defra website http://efficient-products.defra.gov.uk/cms/market-transformation-programme/
The modelling approach
Data presented in the main body of this consultation document and in the product annexes is based on a series of models developed and maintained by the Market Transformation Programme on behalf of the Government. The modelling approach used is mainly based upon a stock turnover model, where the number of products in use, expected growth or decline of that number in future years and product lifetime form the basis for calculating how the installed stock in any one year is composed of products sold in current and previous years. This data provide the basis for analysis and scenario building to quantify the current and future environmental performance of products, and the likely effects of various policies and changes in the market. This analysis allows the Government to assess the expected impact of different policy options over time and decide on adequate performance standards for energy-using products.
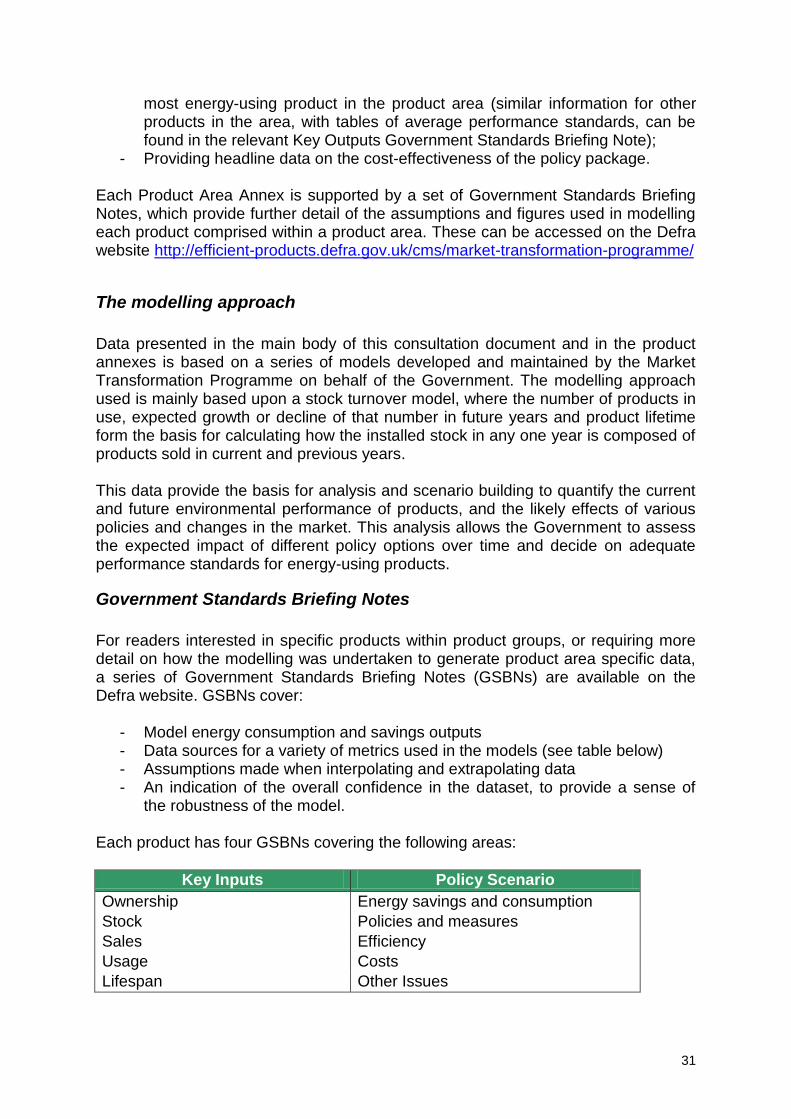
Government Standards Briefing Notes
For readers interested in specific products within product groups, or requiring more detail on how the modelling was undertaken to generate product area specific data, a series of Government Standards Briefing Notes (GSBNs) are available on the Defra website. GSBNs cover:
- Model energy consumption and savings outputs - Data sources for a variety of metrics used in the models (see table below) - Assumptions made when interpolating and extrapolating data - An indication of the overall confidence in the dataset, to provide a sense of
the robustness of the model. Each product has four GSBNs covering the following areas:
Key Inputs Policy Scenario
Ownership Energy savings and consumption
Stock Policies and measures
Sales Efficiency
Usage Costs
Lifespan Other Issues
32
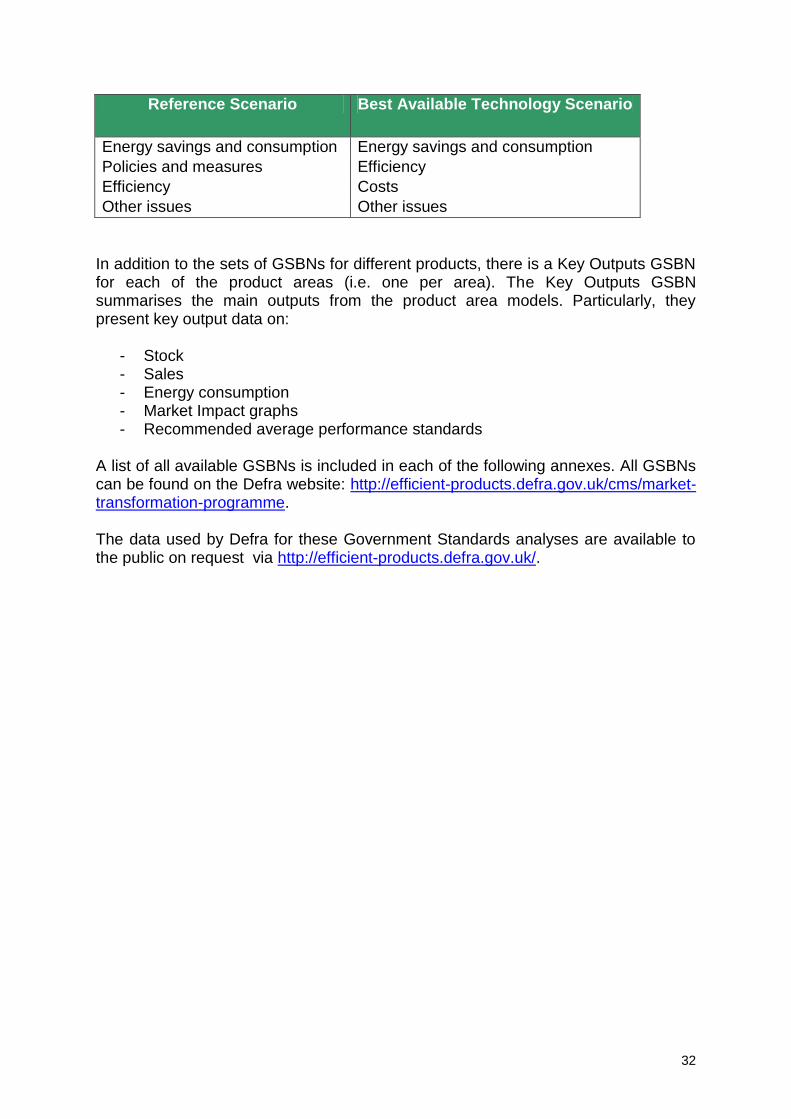
Reference Scenario Best Available Technology Scenario
Energy savings and consumption Energy savings and consumption
Policies and measures Efficiency
Efficiency Costs
Other issues Other issues
In addition to the sets of GSBNs for different products, there is a Key Outputs GSBN for each of the product areas (i.e. one per area). The Key Outputs GSBN summarises the main outputs from the product area models. Particularly, they present key output data on:
- Stock - Sales - Energy consumption - Market Impact graphs - Recommended average performance standards
A list of all available GSBNs is included in each of the following annexes. All GSBNs can be found on the Defra website: http://efficient-products.defra.gov.uk/cms/market-transformation-programme. The data used by Defra for these Government Standards analyses are available to the public on request via http://efficient-products.defra.gov.uk/.
33
Annex 2: Consumer Electronic Products
1. Summary
It is expected that energy consumption due to consumer electronics (CE) will increase by 5% (1.11TWh) between now and 2020 without further policy intervention. Through implementation of cost beneficial policies, energy consumption in 2020 can be reduced by 24% (5.28TWh). The key policies projected to have an impact on this area are the EuP Directive and EU Energy Label. In addition, possible developments in the Energy Saving Trust Recommended and EU Codes of Conduct may also have an impact. In summary, it is projected that:
Market transformation in this area can be delivered via minor technical modifications of products.
This will require future revisions of established government policies.
The policy package outlined in this document will help exceed EWP-2007 and LCTP aims.
2. Scope
This annex addresses the following domestic consumer electronics products:
Televisions (TV)
External Power supply units (ePSU)
Set top boxes (STB) o Simple set top boxes (SSTB) o Complex set top boxes (CSTB)
Video players and recorders (VR)
Game Consoles (GC) Defra is considering the future addition of video projectors, home theatre/audio systems and internet routers to the products in this sector. Furthermore, over time, it is expected that consumer electronics products will merge with those in the ICT category.
3. Key Trends & Assumptions
Development cycles for CE products are short and getting shorter. Many products become obsolete before they are worn out. This stimulates upgrading and early replacement. Televisions Televisions account for the largest share of the energy used by the CE group of products (40% of total CE consumption in 2009). The number of televisions in households is expected to rise from 59.5 million to 72.2 million (by 21%) between
34
2009 and 2020. Average on-time for the main television in the home is expected to decrease from 4.9 hr/day to 4.2 hr/day, due to improvements in auto power down. In addition, there is an increasing demand for larger screens, which are made possible by improvements in picture quality (such as high definition) and are gradually becoming more affordable. The increase in energy consumption resulting from larger screens and more stock, is offset by improvements in screen efficiencies and shorter on-times.26 The interaction of these trends means that there is expected to be a decline in total TV energy consumption of 5% by 2020. External power supply units Energy consumption of external power supply units is expected to increase by 51% to 7.58TWh in 2020. This increase will be due to a number of factors. The number of products in use is expected to increase by 19%, from 185 million to 220 million in 2020 as a greater variety of multi-functional and portable products are marketed. Moreover, products with greater functionality will become increasingly common as battery capacity increases allowing current performance levels (e.g. speed of operation) to be maintained. This will result in higher overall energy consumption of power supplies used to recharge the batteries27. Devices such as routers and digital photo frames are expected to be left on for extended periods, further increasing energy consumption of the power units which supply them. The overall energy used by external power supplies has decreased in recent years since their efficiency has been improving faster than the increase caused by more products being sold that use them. Minimum ecodesign requirements are due to take effect in 2010, and these are likely to further raise efficiency levels toward their ceiling level. There will, therefore, be less scope to further improve efficiency moving forward. Power supplies currently account for 24% of the energy used in the CE sector, second only to TVs Set top boxes Set top boxes (STBs) account for 18% of total CE energy consumption. This figure is increasing as a result of the digital switchover and increasing prevalence of recording functions in STBs, which increase power consumption and usage time. There are two main types of set top box, simple and complex. Simple set top boxes (SSTBs) allow access to free digital channels, whilst complex boxes (CSTBs) provide access to exclusive subscriber (paid for) content. Both simple and complex set top boxes may have the optional feature of recording TV to an internal hard disk drive, but would not record onto removable media (see VRs). The stock of simple set top boxes has grown as a response to Freeview digital TV channel availability. Almost all UK households now receive digital TV either through a new digital TV with integrated receiver or a set top box used with an older analogue TVs. Digital tuners are becoming standard in new TVs. As the older TV stock is replaced, there will be little further need for the most basic standalone simple
26
Over the next few years, new backlighting technologies and variable brightness control are expected to double efficiency of liquid crystal display (LCD) televisions. Major re-engineering of plasma TV technology is also likely to lead to a doubling of plasma efficiency in a similar timeframe. Beyond 2011, new display technologies are projected to enable further improvements in efficiency. 27
Increased battery capacity allows for increased functionality for same battery life. Assuming similar charge regimes, power supplies will need to be more powerful to recharge larger capacity batteries.

35
set top boxes28. SSTBs will therefore be relegated to older, secondary TVs which have not been replaced. An ecodesign power requirement for simple set top boxes is due to come into effect in 2010 (2012 for boxes with recording functions). There is evidence that a very large number of STBs are never placed in standby after the TV has been switched off. The "auto power down" ecodesign requirement will therefore result in significant energy savings. Since the market is relatively short lived and very cost sensitive, there will be very little incentive to improve power consumption beyond this. Complex set top boxes are expected to persist, as more consumers switch to subscription TV services for more advanced functionality and exclusive subscriber content - therefore simple STBs will become the minority market by 2020. The total number of STBs in use is expected to have increased by 13%, from 31 million to 35 million in 2020 mainly as a result of complex STBs being connected to secondary TVs. As a result, energy is projected to increase from 3.69TWh to 4.58TWh (by 24%) in 2020. New features and functionality are also likely to be introduced to CSTBs faster than SSTBs and it is expected that by 2015/16 almost all STBs connected to the primary TV will have recording functions. Video players and recorders Video players and recorders are distinct from set top boxes, whose primary function is the reception of broadcasting (but may also record to an internal hard disk drive). STBs with removable media are, however, considered video recorders for the purposes of this document. Within the video recorder group are media players and recorders using, for example, video cassette, DVD, Blu-ray and/or hard disk drives. This market until recently has been stable, and almost exclusively comprised of DVD players. The number of video recorders in use, and the energy consumption of these products is currently peaking, accounting for 15% of total CE energy, and 13% of total CE products in use. TV recording functions are now being performed by set top boxes with hard disk drives, but it is not possible to archive recorded TV from the hard drive. Accordingly, there is still likely to be a small market for recording on removable storage (DVD/Blu-ray). Blu-ray video recorders have much storage higher capacity and video quality, and are backward compatible, so will eventually replace DVDs. In parallel, most video recorders will eventually be replaced with newer, internet connected devices, including CSTBs, which will access downloadable video. Many of these devices will be very simple, requiring very little power beyond the hard drive. Video recorder stock is expected to fall by 43%, from 44 million to 25 million, and energy consumption by 75%, from 3.10TWh to 0.78TWh, in 2020 as a result of video recorders switching to hard drive storage and replacement by STBs. Game consoles Game console energy consumption is currently small at 3% of total CE consumption. This is, however, the fastest growing CE product type.
28
Except for recording functions where those are not available with the TV integrated receiver

36
Future projections in energy and stock are high, shifting from 0.63TWh to 1.63TWh (158%) and 18 million to 30 million (65%), respectively, by 2020. This is due to the frequency of multiple ownership and growth in casual "gamers" which is driving game consoles into the mainstream, to become a product in the majority of households. Product convergence across product groupings There are trends toward convergence of product functionalities, whereby a game console for example may have functions that would traditionally be found in a personal computer or DVD player. Conversely, there are also trends to expand the number of product types into niches such as netbooks and tablets and create new use patterns. The energy impacts of increased product convergence/expansion into the future cannot be accounted for with any degree of certainty, as there are so many directions this may take (positive or negative energy impacts).29 Modelling inputs
Stock (‘000) Sales (‘000) Average life expectancy
(years)
Usage in most energy consuming power
mode30
(hours / year)
2009 2020 2009 2020 2009 2020 2009 2020
ePSU 185,000 220,000 52,800
58,900 4.1 4.3 1,754 2,083
STB 31,000 35,000 6,300 7,400 5.3 5.0 5,509 4,663
TV 59,000 72,000 8,700 8,800 8.6 8.6 1,350 1,270
VR 44,000 25,000 7,400 4,700 4.7 5.3 471 1,701
GC 18,000 30,000 4,700 5,500 5.5 5.5 156 156
Total31
338,000 383,000 79,900 85,200 5.1* 5.3* 1,778* 1,992*
* Figures not totals, but sales weighted averages.
4. Policy Impacts
The following graph shows the Government‟s projections for energy use by the consumer electronic products addressed in the domestic sector.
29
Defra is currently undertaking a study to understand how products are used, and can adapt models to
convergence/expansion trends as these become clearer. 30
Further detail on ePSU, STB, TV, VR and GC usage data, across all modes and products, can be found in Key Input
Government Standards Briefing Notes (GSBNs). 31
In some cases, figures do not total due to rounding
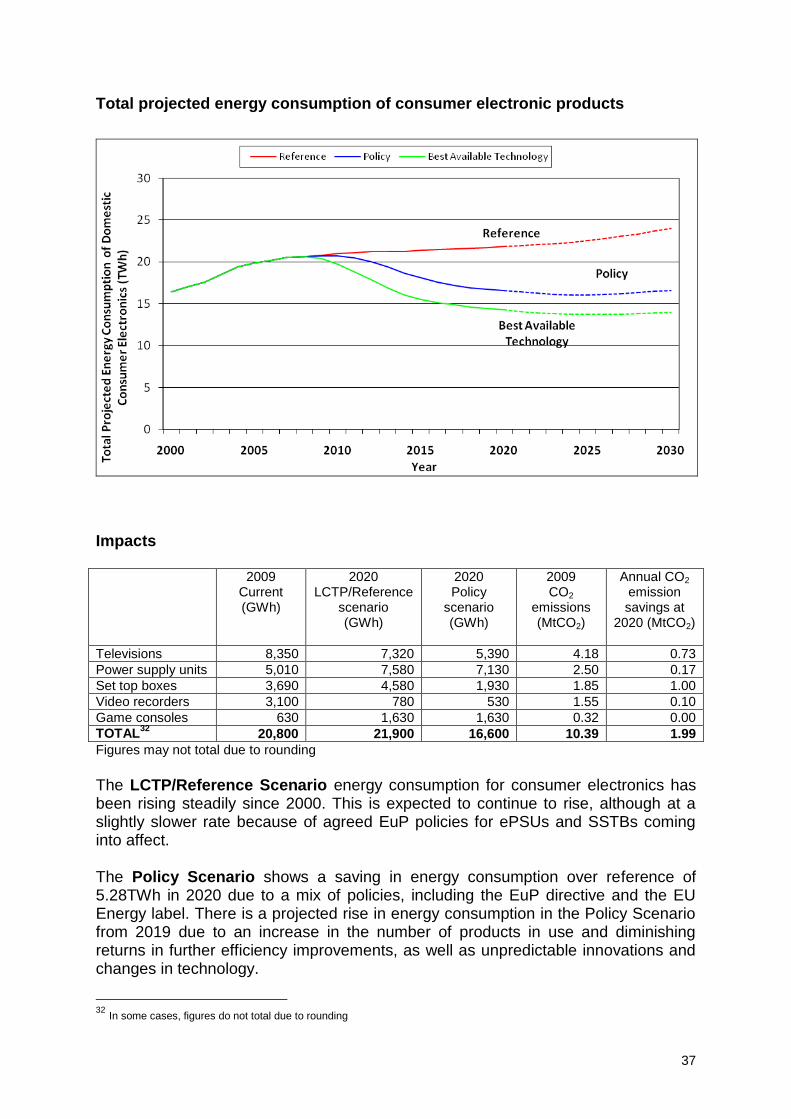
37
Total projected energy consumption of consumer electronic products
Impacts
2009 Current (GWh)
2020 LCTP/Reference
scenario (GWh)
2020 Policy
scenario (GWh)
2009 CO2
emissions (MtCO2)
Annual CO2 emission savings at
2020 (MtCO2)
Televisions 8,350 7,320 5,390 4.18 0.73
Power supply units 5,010 7,580 7,130 2.50 0.17
Set top boxes 3,690 4,580 1,930 1.85 1.00
Video recorders 3,100 780 530 1.55 0.10
Game consoles 630 1,630 1,630 0.32 0.00
TOTAL32
20,800 21,900 16,600 10.39 1.99
Figures may not total due to rounding
The LCTP/Reference Scenario energy consumption for consumer electronics has been rising steadily since 2000. This is expected to continue to rise, although at a slightly slower rate because of agreed EuP policies for ePSUs and SSTBs coming into affect. The Policy Scenario shows a saving in energy consumption over reference of 5.28TWh in 2020 due to a mix of policies, including the EuP directive and the EU Energy label. There is a projected rise in energy consumption in the Policy Scenario from 2019 due to an increase in the number of products in use and diminishing returns in further efficiency improvements, as well as unpredictable innovations and changes in technology.
32
In some cases, figures do not total due to rounding

38
The Best Available Technology (BAT) Scenario shows savings in energy consumption over reference of 0.39TWh in 2009, rising to 7.60TWh by 2020. It assumes that the current best practice product is adopted in 2009 and future best practice products are adopted in subsequent years. Policy Descriptions LCTP/Reference Scenario Policy Scenario
Energy Using Products Directive (EuP)
Standby Consumption Agreed 2008. This measure will reduce the off mode consumption of a number of CE products to 1.0W by 2010 and to below 0.5W by 2013 (based upon assumptions regarding how the requirements will be interpreted).
External Power Supply Units (ePSUs)
Agreed 2009. Two tiers in 2010 and 2011 set mandatory improvements in external power supply power efficiency will impact on-mode efficiency and standby power when the ePSU is plugged in but not actively charging (no-load power).
Additional third revision in 2015 is assumed to increase minimum efficiency to achieve current BAT efficiency. Slight improvements in standby (no-load power).
Simple set top boxes Agreed 2009. Reductions in on-mode power consumption and standby in 2010 for basic SSTBs. Auto power down requirements put STB in standby after 3 hours of no use. Further improvements required in 2012 which also cover advanced SSTBs with recording function.
Additional third revision in 2015 is assumed to set more stringent requirements for recording SSTBs and implementation of standardised interfaces to put SSTB into standby immediately after viewing has finished.
Complex set top boxes 2012, new voluntary agreement or mandatory policy for CSTBs is assumed to reduce on-power and standby power. Implementation of standardised interfaces in 2015 to put CSTB into standby immediately after viewing has finished. Revision in 2018 reduces on-mode power.
Televisions Agreed 2009. Power efficiency requirements in 2010 and 2012 based on screen size to reduce on-power. Auto power down requirements in 2011 put TV in standby after 4 hours of no use.
Assumed revision in 2015 requires TVs to detect when no one is viewing and disable the screen.
Network standby Initial studies for a potential measure are currently underway, but it is not yet clear how this would be implemented. It is assumed that this addresses current exceptions from the standby measure, ensuring 1W/0.5W is achieved by the growing number of CE products with network connections in around 2011 (by switching off network connections when not required). Future modelling will refine these assumptions and could set power limits for networked standby mode as scope becomes clearer
EU Energy Label for Energy label assumed to come into effect

39
LCTP/Reference Scenario Policy Scenario
televisions in 2010 with additional, higher efficiency classes being displayed as standard in 2012, 2015 and 2018. It is assumed that 60% of TVs sold achieve the highest displayed efficiency class in each revision year.
Energy Saving Trust, Energy Savings Recommended
Scheme33
and Retailer
Engagement
Agreed 2004. ESTR specification at 230W has low uptake in market to date. No effect on the market because specification maximum power requirement includes TVs up to 65”. Mechanism has not accelerated integration of digital tuners above normal market forces.
Lowered specification. Revised label and coordinated engagement with retailers (incl. benchmarking and guidance) raises sets specification equivalent to EU label B class. Some improvement with retailer own brand products. Short term effect in 2009/10 superseded by EU label.
EU Code of Conduct (CoC) for Digital TV services
Agreed 2003 and revised as required. Sets maximum power consumption for CSTB on-mode and standby based on product functions. Currently 100% UK market penetration due to both major satellite and cable companies signing up.
2010, CoC is assumed to set long term aspirations to reduce on-power and standby power. Used as basis for EuP ecodesign requirements.
Carbon Emissions Reduction Target (CERT)
Effective 2008-2011. Manufacturer subsidy for sales of TVs under 22” with integrated digital tuner to reduce sales of standalone SSTBs. Almost all sales expected to have occurred without policy intervention.
Supplier Obligation No impact in Reference Scenario since the Supplier Obligation is still under development and could be completely revised from current CERT-like implementation. It is therefore not considered to be an agreed policy.
2011-2020. Assume TVs achieving A class efficiency based on EU energy label and with a smaller power consumption than the TV being replaced, are awarded a subsidy. This has a relatively short term, temporary impact reducing on-mode power.
Standardisation for high-definition multimedia interface consumer electronics control (HDMI CEC)
Standardisation of interfaces ensures all CE products can communicate with each other, placing devices directly into standby when unused and preventing incompatible manufacturer specifications. Requirement to enable this by default in all products from 2015.
Communication standard for cable modems (DOCSIS low power mode standards)
Introduction of low-power mode in DOCSIS mode standards reduces energy consumption of cable router and CSTBs. New products compliant with standard enter market in 2013.
Some additional policies are expected to contribute to the delivery of energy savings in the sector in the reference and policy scenarios. However these have not been modelled separately as they support, and/or may be subsumed by the policies above.
33
There have been changes to ESTR specifications since preparation of this consultation document. However these changes are not expected to have a significant impact on the modelling outputs.
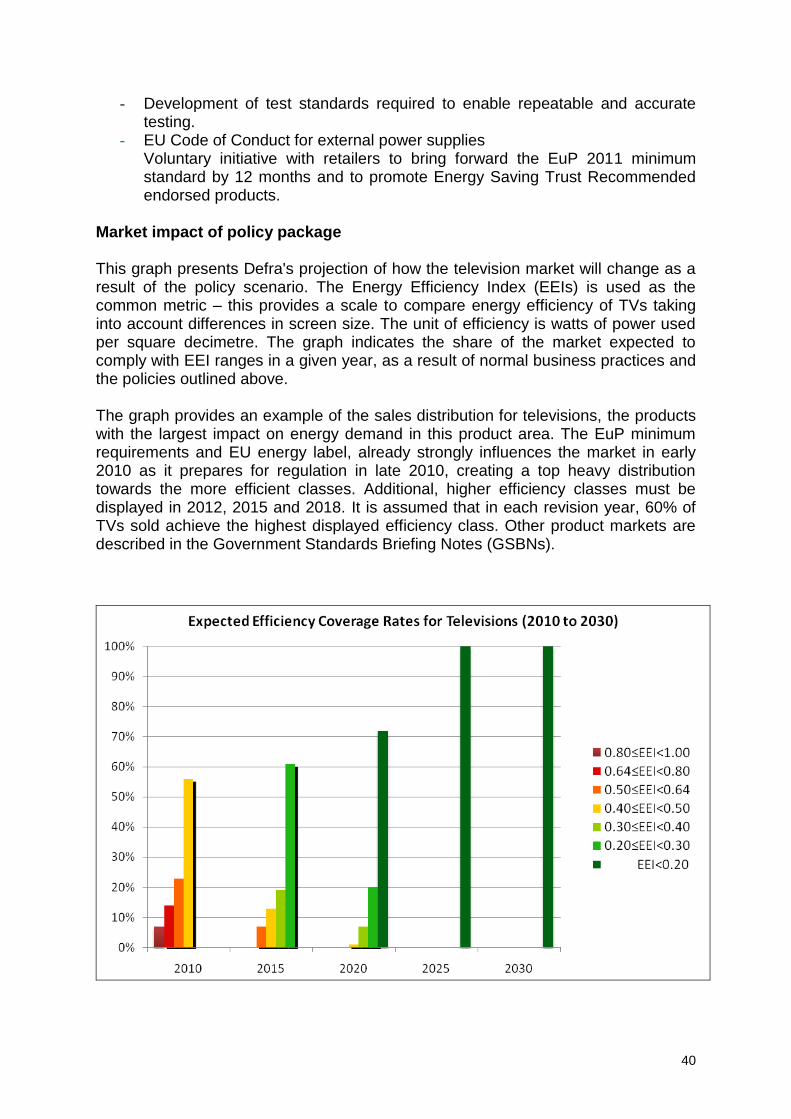
40
- Development of test standards required to enable repeatable and accurate testing.
- EU Code of Conduct for external power supplies Voluntary initiative with retailers to bring forward the EuP 2011 minimum standard by 12 months and to promote Energy Saving Trust Recommended endorsed products.
Market impact of policy package This graph presents Defra's projection of how the television market will change as a result of the policy scenario. The Energy Efficiency Index (EEIs) is used as the common metric – this provides a scale to compare energy efficiency of TVs taking into account differences in screen size. The unit of efficiency is watts of power used per square decimetre. The graph indicates the share of the market expected to comply with EEI ranges in a given year, as a result of normal business practices and the policies outlined above. The graph provides an example of the sales distribution for televisions, the products with the largest impact on energy demand in this product area. The EuP minimum requirements and EU energy label, already strongly influences the market in early 2010 as it prepares for regulation in late 2010, creating a top heavy distribution towards the more efficient classes. Additional, higher efficiency classes must be displayed in 2012, 2015 and 2018. It is assumed that in each revision year, 60% of TVs sold achieve the highest displayed efficiency class. Other product markets are described in the Government Standards Briefing Notes (GSBNs).

41
Impacts by Product
Average annual energy savings (£m)
Average annual product & policy cost increases
(£m)
Net Benefit (£m)
Cost Effectiveness
(£/ktCO2)
Televisions 136 49 1,311 -67 Power supply units 29 3 392 -105 Set top boxes 216 9 3,137 -111 Video recorders 21 1 314 -126 Game consoles - - - N/A TOTAL 402 62 5,154 -97 Attribution of savings to policies
Policy % attributed to energy savings
Rationale for attribution of savings
Defr
a
EuP Directive 72%
The effects of EuP are modelled for the whole period from 2009 – 2030, with product specific revisions in 2012, 2013, 2015 and 2018. Based on expert assumptions, 100% of energy savings from PSUs, STBs and VRs were attributed to EuP. However only 10% of energy savings for TVs was attributed to EuP. This resulted in a weighted split of 72%.
Energy Labelling 27%
The effects of Energy Labelling are modelled for the whole period from 2010 – 2030 with revisions in 2012, 2015 and 2018. Based on expert assumptions, 88% of energy savings for TVs was attributed to Energy Labelling while no energy savings were attributed to PSUs, STBs and VRs. This resulted in a weighted split of 27%.
No
n-D
efr
a
CERT/SO 1%
The effects of the CERT/SO scheme are modelled to affect only TVs for the whole period from 2011 – 2030. Based on expert assumptions, only 2% of TV energy savings are attributed to CERT/SO scheme. This resulted in a weighted split of 1%.
The table above illustrates Defra‟s initial analysis of the percentage of energy savings attributed to policies, along with the rationale for assigning the attributions. These attributions are expected to be further refined as Government departments begin to work on their Carbon Budgets in more detail.
Policy Impacts Split (in accordance with the LCTP) The following table splits out policy impacts in three different ways: by the carbon budget area in which the savings are projected to occur, by Defra product policies and other policies
(Defra and Non-Defra) and by attribution of savings to carbon budget packages.

42
Annual CO2 emissions in 2009 (MtCO2)
Annual CO2 emission savings at
2020 (MtCO2)
Traded Non-
Traded Traded
Non-Traded
Domestic Savings
Domestic Energy Efficiency Package (DEE)
10.39 0.00 2.27 -0.28
Policy split
Defra 10.29 0.00 2.25 -0.28
Non-Defra 0.10 0.00 0.02 0.00
Total 10.39 0.00 2.27 -0.28
Attribution of impacts within packages
Product Policy Savings (unconstrained)
10.29 0.00 2.25 -0.28
Domestic Energy Efficiency Package (DEE)
0.10 0.00 0.02 0.00
Total 10.39 0.00 2.27 -0.28
Key Government Standard Briefing Notes (GSBNs)
Televisions / Key Inputs; Reference Scenario; Policy Scenario; BAT Scenario
Video Recorders / Key Inputs; Reference Scenario; Policy Scenario; BAT Scenario
Game Consoles / Key Inputs; Reference Scenario; Policy Scenario; BAT Scenario
ePSUs / Key Inputs; Reference Scenario; Policy Scenario; BAT Scenario
Set-Top Boxes / Key Inputs; Reference Scenario; Policy Scenario; BAT Scenario
Consumer Electronics / Key Outputs

43
Annex 3: Domestic Appliances
1. Summary
It is expected that overall energy consumption due to domestic appliances will reduce by 9.2% (2.6TWh) between now and 2020 without further policy intervention. Through implementation of cost beneficial policies, energy consumption in 2020 can be reduced by 7.3% (1.9TWh). Of this, 44% of savings (0.84TWh) come from the domestic refrigerating appliances sector, with the remaining savings coming from the domestic laundry appliances sector, 40% (0.76TWh), and the domestic dishwashers sector, 16% (0.3TWh). The key policies projected to have an impact on this area are the EuP Directive34, and, to a lesser extent, the Carbon Emissions Reduction Target (CERT) and Supplier Obligations (SO). In addition, possible developments in the EU Energy Label, EU Ecolabel, and Energy Saving Trust Recommended (ESTR) scheme may also have an impact (although these have not been modelled separately).
In summary, it is projected that:
Market transformation in this area can be delivered with some additional innovation.
This will require future revisions of established government policies as well as some new policies not yet established.
The policy package outlined in this document will be in line with EWP-2007 and LCTP aims.
2. Scope
This annex addresses the following Domestic Appliances products:
Domestic Cold Appliances which include: refrigerators (fridges), fridge-freezers, upright freezers, and chest freezers.
Domestic Laundry which includes: washing machines, tumble driers, and washer-driers
Domestic Dishwashers which includes principally both slimline and standard sized dishwashers.
Future government standards for the Domestic Appliances sector will include domestic cooking appliances. This is expected to comprise ovens, hobs, microwaves and kettles. Summary information concerning these appliances is currently provided in the Domestic Cooking Appliances annex.
34
DIRECTIVE 2005/32/EC OF THE EUROPEAN PARLIAMENT AND OF THE COUNCIL of 6 July 2005 establishing a framework for the setting of ecodesign requirements for energy-using products and amending Council Directive 92/42/EEC and Directives 96/57/EC and 2000/55/EC of the European Parliament and of the Council, Official Journal of the European Union L 191/29 and its implementing directives.

44
3. Key Trends & Assumptions
Without intervention, manufacturers have little incentive to improve the energy efficiency of the products they develop and market. Introducing, initially voluntary (in some sectors) and then mandatory, standards have had a significant effect on improving the energy efficiency of domestic appliances over time. Labelling has encouraged and continues to encourage appliance markets to achieve energy efficiency standards above the minimum standards (where present). Energy efficiency has become an additional factor in competition and market differentiation with top brands leading the way. Domestic appliances are characterised by relatively long lifespans (generally over 10 years). They also tend to be distress purchases (only replaced when they break down). Although these factors result in a lower amount of waste than for areas with high rates of product replacement, they also create fewer opportunities for inefficient products to be taken out of use. Domestic Cold At present, most in-use energy in this sector is consumed by fridge-freezers, both overall and as an average per unit. This is due to the higher number of sales of these appliances proportionally, combined with the fact that they include a freezer compartment (unlike fridges) and have, on average, higher overall volumes than other domestic cold appliances. Fridge-freezers represent the largest proportion of domestic cold stock (appliances in use in the UK in a given year) and will continue to have a dominant share going forward. A shift towards larger appliances, along with the introduction of US style side-by-side appliances and the introduction of correction factors35 erode energy efficiency savings. Moreover, large appliances can be rated A or above despite consuming twice as much energy or more than an average-sized A rated appliance. Each of the built-in, frost-free, and climate class correction factors results in appliances being rated compared to equivalent appliances which are 20% larger and thus appearing (in terms of classification) to be low-energy using products when the reality may be otherwise. These factors can be used cumulatively within one appliance. This compromises energy savings as well as distorting the information provided to consumers. Domestic Laundry Since 1995, along with an increase in household numbers, ownership levels of domestic laundry appliances have increased by more than half. Most households (95%) own some sort of washing facility (washing-machine or washer drier). Almost 80% of UK households own washing machines, 45% own tumble driers and 15% of households own washer driers. Accordingly, manufacturers' research and
35
Correction factors are currently applied to cold appliances with certain features (built-in, frost-free, climate class, and chill compartments). Appliances with these features are allocated a proportion of their total energy use, which is not counted in determining the energy label classification into which they fall. Ostensibly, this is to "correct" for the benefit of the feature. Defra evidence suggests that these correction factors distort the information provided through the energy label and are either too high or should not exist at all.

45
development efforts tend to focus less on washer driers than other domestic laundry appliances. Of the domestic laundry appliances, washing machines use the most energy overall in the UK, with 4,368 GWh36 representing approximately 40% of energy consumption for laundry, due to their high penetration in households. Tumble driers use most energy on average per unit (with new appliances having a market average energy use of 3kWh per use, compared to washing machines using 0.8kWh per use), and use overall 4,309 GWh representing approximately 39% of laundry energy consumption. Washer dryers use the remaining 21% of energy consumed in the sector accounting for 2,348 GWh. Sales are moving towards larger capacities for washing machines and tumble driers. Due to their natural limitations in terms of space, washer driers are not tending to increase significantly in size and smaller capacity ones can still be found on the market. There is a converse usage trend towards smaller loads across all appliances. Other trends in this area include higher spin speeds for washing machines and lower wash temperatures. Tumble driers include higher proportions of condenser driers and an increase in the proportion of those with sensors. Dishwashers Dishwashers are divided into two main categories based on size: (1) full size or standard (approximately 60 cm wide and generally considered to be built for 12 place settings37 – although they can take from 10 place settings upwards). These make up approximately 80% of the UK market; and (2) slimline (approximately 45 cm wide and generally considered to be built for 9 place settings – although they can take between 7 and 10 place settings). These make up approximately 20% of the UK market. A third category, table-top dishwashers, also exists (usually a small box on work surface or draining board, sometimes a small built-in appliance, taking 4 to 6 place settings). There are, however, few table-top dishwashers on the UK market. Sales of dishwashers have almost doubled during the 10 years since 1997. Percentage ownership rose by 13% to its current 28.5% over the same period in tandem with an increase in household numbers. The market is likely to be reaching saturation, as UK ownership is restricted by the space in kitchens for additional appliances. Modelling inputs
Stock (‘000) Sales (‘000) Average life expectancy
(years)
2009 2020 2009 2020 2009 2020
Cold 40,000 44,500 2,880 3,200 15.5 15.5
Laundry 36,500 41,300 2,990 3,400 13.0 13.0
Dishwashers 9,420 11,800 733 971 13.0 13.0
TOTAL 86,000 97,600 6,600 7,570 13.5* 13.5*
36
In 2009 37
Place settings mean a defined (for the purpose of test standards) set of crockery, glass and cutlery for use by one person.
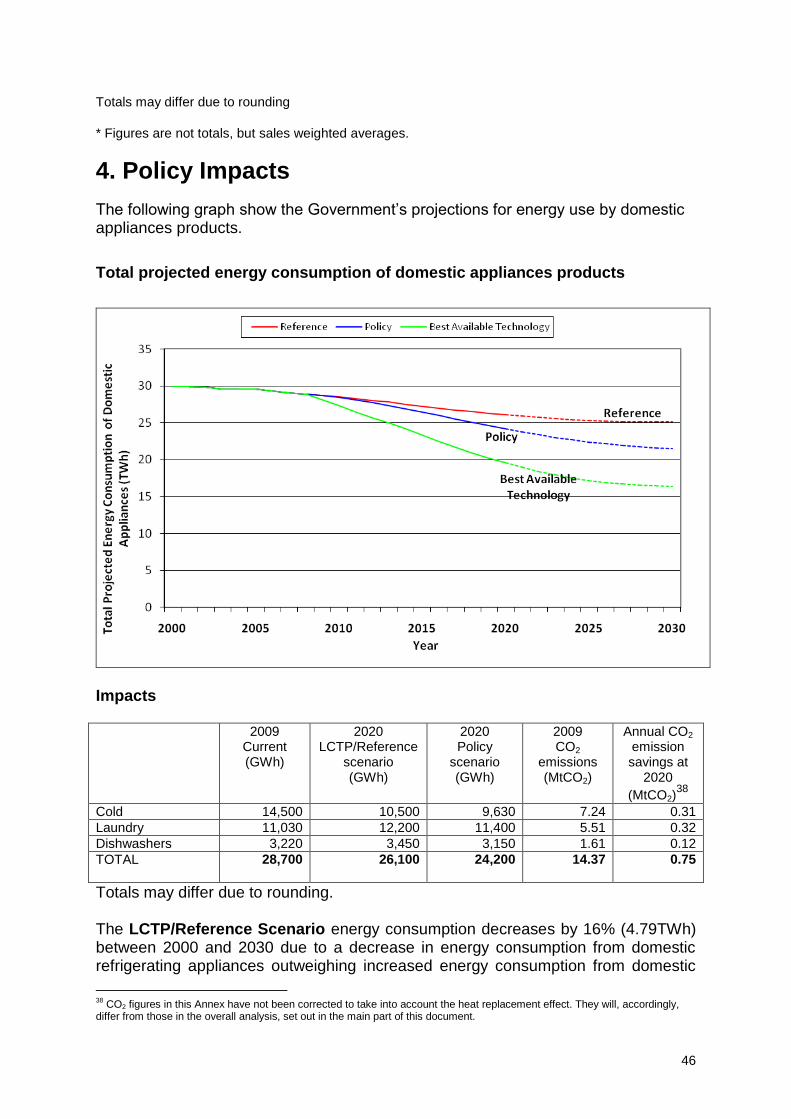
46
Totals may differ due to rounding
* Figures are not totals, but sales weighted averages.
4. Policy Impacts
The following graph show the Government‟s projections for energy use by domestic appliances products.
Total projected energy consumption of domestic appliances products
Impacts
2009 Current (GWh)
2020 LCTP/Reference
scenario (GWh)
2020 Policy
scenario (GWh)
2009 CO2
emissions (MtCO2)
Annual CO2 emission savings at
2020
(MtCO2)38
Cold 14,500 10,500 9,630 7.24 0.31
Laundry 11,030 12,200 11,400 5.51 0.32
Dishwashers 3,220 3,450 3,150 1.61 0.12
TOTAL 28,700
26,100
24,200 14.37 0.75
Totals may differ due to rounding. The LCTP/Reference Scenario energy consumption decreases by 16% (4.79TWh) between 2000 and 2030 due to a decrease in energy consumption from domestic refrigerating appliances outweighing increased energy consumption from domestic
38
CO2 figures in this Annex have not been corrected to take into account the heat replacement effect. They will, accordingly, differ from those in the overall analysis, set out in the main part of this document.

47
laundry and dishwashing appliances. This results from the stronger policies in place and the higher energy saving potential of domestic refrigerating appliances. The Policy Scenario shows a negligible saving in energy consumption over reference in 2009, rising to 1.9TWh by 2020. There is a steady decrease in energy consumption in the policy scenario from 2010 due to a mix of product policies including the EuP Regulations. The Best Available Technology (BAT) Scenario shows savings in energy consumption over reference of 0.64TWh in 2009, rising to 6.5TWh by 2020. It assumes that the currently best practice product is adopted in 2009 and future best practice products are adopted in subsequent years. Policy Descriptions Policies in the reference and policy scenarios for domestic appliances modelling are set out below. The greatest impacts result from the Energy Using Product Directive. LCTP/Reference Scenario Policy Scenario
Energy Using Product Directive (EuP)
Standby Consumption
Agreed in 2008, this measure will reduce the off mode consumption of a number of domestic appliances products to 1.0W by 2010 and to below 0.5W by 2014 (based upon assumptions regarding how the requirements will be interpreted). There may be some exemptions for appliances such as washing machines with safety features – the standby consumption of washing machines and dishwashers will however be limited as part of the overall energy consumption under the EuP Regulations. It is assumed that the same will occur for other appliances.
Refrigerating appliances (cold)
Agreed in 2009, this measure comes into effect in 2010.
Washing Machines. Agreed in 2010, this measure will enter into force in 2011.
Dishwashers Agreed in 2010 and enter into force by 2011.
Tumble driers The Preparatory Study for this product is on the EC EuP Agenda (http://www.ecodryers.org/). It is anticipated that the resulting policy will come into effect in the next 2.5 years.
Washer driers It is anticipated that a washer driers measure will be adopted alongside the tumble driers measure because it comprises a combination of tumble driers and washing machine (already adopted) features. It is, accordingly, anticipated that the resulting policy will come into effect in the next 2.5 years.
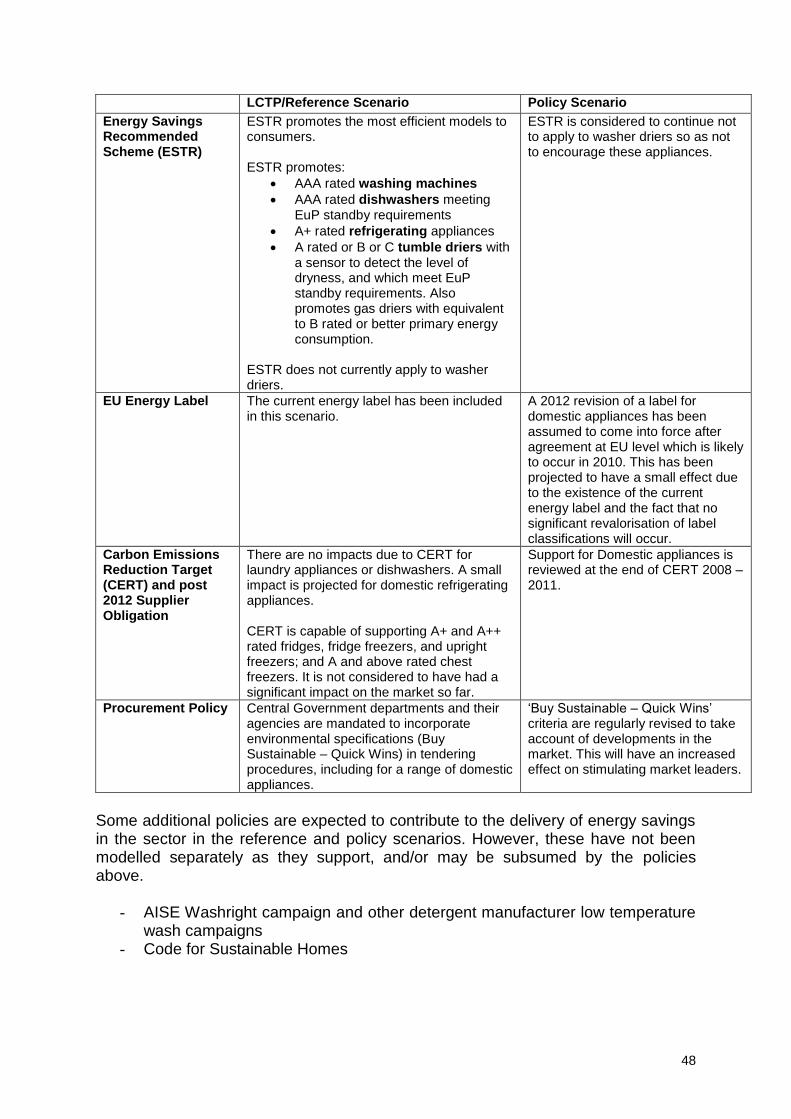
48
LCTP/Reference Scenario Policy Scenario
Energy Savings Recommended Scheme (ESTR)
ESTR promotes the most efficient models to consumers. ESTR promotes:
AAA rated washing machines
AAA rated dishwashers meeting EuP standby requirements
A+ rated refrigerating appliances
A rated or B or C tumble driers with a sensor to detect the level of dryness, and which meet EuP standby requirements. Also promotes gas driers with equivalent to B rated or better primary energy consumption.
ESTR does not currently apply to washer driers.
ESTR is considered to continue not to apply to washer driers so as not to encourage these appliances.
EU Energy Label The current energy label has been included in this scenario.
A 2012 revision of a label for domestic appliances has been assumed to come into force after agreement at EU level which is likely to occur in 2010. This has been projected to have a small effect due to the existence of the current energy label and the fact that no significant revalorisation of label classifications will occur.
Carbon Emissions Reduction Target (CERT) and post 2012 Supplier Obligation
There are no impacts due to CERT for laundry appliances or dishwashers. A small impact is projected for domestic refrigerating appliances. CERT is capable of supporting A+ and A++ rated fridges, fridge freezers, and upright freezers; and A and above rated chest freezers. It is not considered to have had a significant impact on the market so far.
Support for Domestic appliances is reviewed at the end of CERT 2008 – 2011.
Procurement Policy Central Government departments and their agencies are mandated to incorporate environmental specifications (Buy Sustainable – Quick Wins) in tendering procedures, including for a range of domestic appliances.
„Buy Sustainable – Quick Wins‟ criteria are regularly revised to take account of developments in the market. This will have an increased effect on stimulating market leaders.
Some additional policies are expected to contribute to the delivery of energy savings in the sector in the reference and policy scenarios. However, these have not been modelled separately as they support, and/or may be subsumed by the policies above.
- AISE Washright campaign and other detergent manufacturer low temperature wash campaigns
- Code for Sustainable Homes
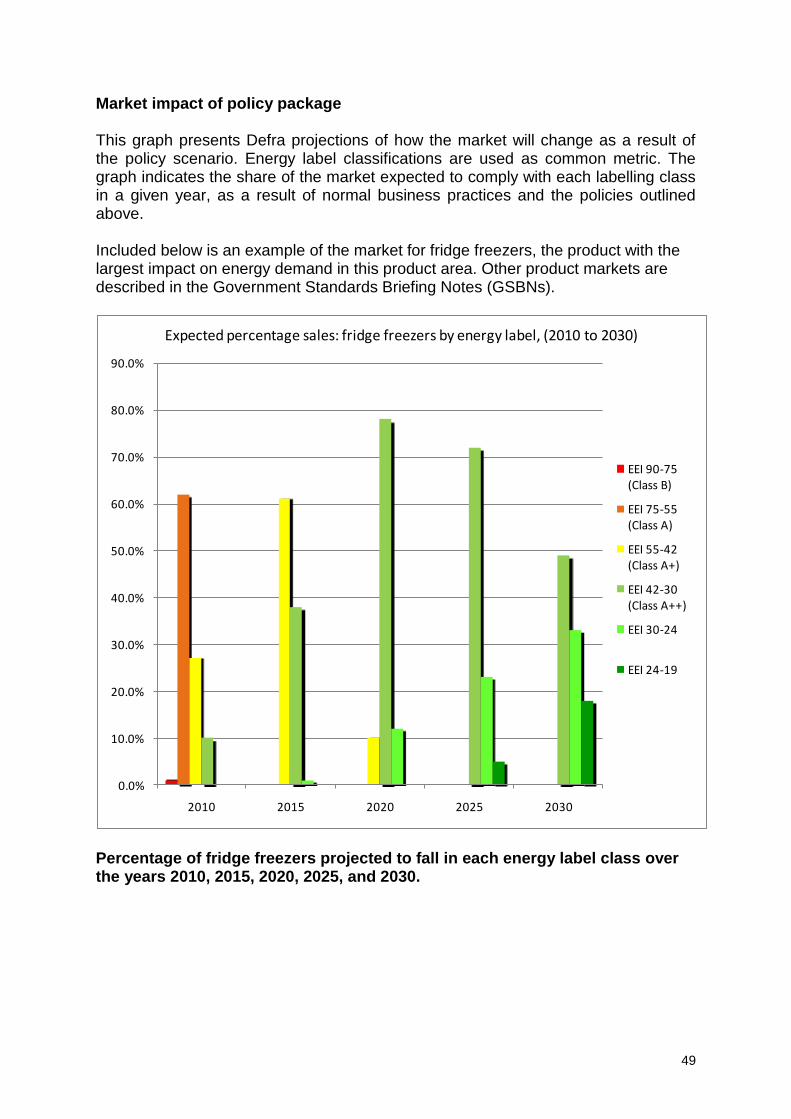
49
Market impact of policy package This graph presents Defra projections of how the market will change as a result of the policy scenario. Energy label classifications are used as common metric. The graph indicates the share of the market expected to comply with each labelling class in a given year, as a result of normal business practices and the policies outlined above. Included below is an example of the market for fridge freezers, the product with the largest impact on energy demand in this product area. Other product markets are described in the Government Standards Briefing Notes (GSBNs).
0.0%
10.0%
20.0%
30.0%
40.0%
50.0%
60.0%
70.0%
80.0%
90.0%
2010 2015 2020 2025 2030
Expected percentage sales: fridge freezers by energy label, (2010 to 2030)
EEI 90-75 (Class B)
EEI 75-55 (Class A)
EEI 55-42 (Class A+)
EEI 42-30 (Class A++)
EEI 30-24
EEI 24-19
Percentage of fridge freezers projected to fall in each energy label class over the years 2010, 2015, 2020, 2025, and 2030.

50
Impacts by Product Average annual
energy savings (£m) Average annual
product & policy cost increases (£m)
Net Benefit (£m) Cost Effectiveness (traded) (£/tCO2)
Cold 80 21 899 -76
Laundry 56 26 453 -58
Dishwashers 25 4 328 -101
TOTAL 161 51 1681 -74
Attribution of savings to policies The table below illustrates Defra‟s initial analysis of the percentage of energy savings attributed to policies, along with the rationale for assigning the attributions. These attributions are expected to be further refined as Government departments begin to work on their Carbon Budgets in more detail.
Policy
% attributed to energy savings
Rationale for % attribution of savings
Defr
a
EuP Directive 49%
The effects of EuP are modelled for the whole period from 2009 – 2030, with product specific revisions in 2010, 2012 and 2014. Based on expert assumptions, 83% of energy savings from domestic wet appliances (laundry & dishwashers) were attributed to EuP while 0% of energy savings for domestic cold appliances was attributed to EuP measures. This resulted in a weighted split of 49%.
Energy Labelling
28%
The effects of Energy Labelling are modelled for the whole period from 2009 – 2030 with product specific revisions in 2011 and 2014. Based on expert assumptions, 12% of energy savings for domestic wet appliances was attributed to Energy Labelling while 51% of energy savings for domestic cold appliances were attributed to Energy Labelling. This resulted in a weighted split of 28%.
Non
-Defr
a
CERT/SO 23%
The effects of the CERT/SO scheme are modelled for the whole period from 2009 – 2030. Based on expert assumptions, 5% of domestic wet appliance energy savings are attributed to CERT/SO scheme while 49% of domestic cold appliance energy savings are attributed to the CERT/SO scheme. This resulted in a weighted split of 23%.

51
Policy Impacts Split (in accordance with the LCTP) The following table splits out policy impacts in three different ways: by the carbon budget area in which the savings are projected to occur, by Defra product policies and other policies (Defra and Non-Defra) and by attribution of savings to carbon budget packages.
Annual CO2 emissions in 2009 (MtCO2)
Annual CO2 emission savings at 2020 (MtCO2)
Traded Non-
Traded Traded
Non-Traded
Domestic Savings
Domestic Energy Efficiency Package (DEE)
14.37 0.00 0.82 -0.06
Policy split
Defra 11.06 0.00 0.63 -0.05
Non-Defra 3.30 0.00 0.19 -0.01
Total 14.37 0.00 0.82 -0.06
Attribution of impacts within packages
Product Policy Savings (unconstrained)
11.06 0.00 0.63 -0.05
Domestic Energy Efficiency Package (DEE)
3.30 0.00 0.19 -0.01
Total 14.37 0.00 0.82 -0.06
Key Government Standard Briefing Notes (GSBNs)
Chest freezers, upright freezers, fridges and fridge-freezers / Key Inputs; Reference scenario; Policy scenario; BAT scenario
Combined Laundry / Key Inputs; Reference scenario; Policy scenario; BAT scenario
Dishwashers / Key Inputs; Reference scenario; Policy scenario; BAT scenario
Domestic Appliances/ Key Outputs

52
Annex 4: Domestic Central Heating Systems
1. Summary
It is expected that energy consumption due to domestic central heating systems will reduce by 6% (23.03 TWh) between now and 2020, without further policy intervention. This reduction occurs due to a projected decline in average heating energy demand, and despite increases in: household numbers (and therefore heating and dedicated water heater installations). Through implementation of cost beneficial policies, energy consumption in 2020 can be further reduced by 8.5% (28.28 TWh). The key policies projected to have an impact on this area are the EuP Directive measure on heating systems, Building Regulations (requirements for new boilers to be SEDBUK A-rated condensing boilers, and for lower carbon targets for new build), Carbon Emissions Reduction Target (CERT), its post-2012 successor and the Code for Sustainable Homes (CSH). In addition, the Heat and Energy Savings Strategy currently being developed will have an impact. In summary, it is projected that
Market transformation in this area can be delivered via additional innovation
This will require future revisions of established government policies as well as some new policies not yet established.
The policy package outlined in this document will contribute below the average required to meet EWP-2007 and LCTP aims.
2. Scope
This annex addresses domestic hydronic39 (wet) heating systems composed of the following products:
Gas central heating boilers
Oil central heating boilers
Biomass central heating boilers (but not biomass stoves and fires at this time)
Electric heat pumps (air source and ground source)
Dedicated electric water heating (not including solar thermal products at this time)
Gas community heating and micro CHP40
Time, temperature and zone controls
All other systems, such as direct heating and central heating systems using air to transport heat, are excluded.
39
Hydronic Heating systems transport heated water around a dwelling, either for space heating or for hot water provision 40
Combined Heat and Power

53
This annex addresses both heating and hot water demand provided for by central heating systems. In addition, it also addresses dedicated water heaters, such as electric taps and showers, and electric storage water heaters.
3. Key Trends & Assumptions
Assumptions from 2009 onwards for all heating systems are as follows:
The number of homes increases from around 26m in 2009 to around 32m by 2030. From 2010, new homes could utilise a variety of technologies to meet new Building Regulation requirements.
Building fabric was modelled on a combination of five house types (Flats, Mid Terrace, End Terrace/Semi-detached, Detached and Bungalows), each split into 8 age classes, from pre-1919 to post 2005, using typical design-based (not actual) values for building fabric thermal resistance (U-values) when built, upgraded to typical current condition (e.g. including known uptake of retrofit loft insulation, cavity wall insulation, etc). Minimum or typical infiltration rates from Building Regulation requirements were assumed. For future dwelling fabric conditions two reference building fabric, or heating demand scenarios were developed:
o Reference One: factors in the impact of future building fabric, or energy demand-related policies. These include the building fabric impacts of the SO, of future Building Regulations, and CSH requirements.
o Reference Two: factors in the impact of current Government programmes including the anticipated impacts of CERT up to 2011 and Building Regulations up to 2010. Policy measures affecting the building fabric are not assumed to change beyond 2011 in this scenario.
A typical internal temperature of 20○C is assumed, throughout the day, in line with the assumptions in the EC-proposed Ecoboiler41 model for calculating heating and hot water energy consumption. This is an evolution from previous modelling (e.g. using BREDEM) which assumed a morning and evening heating pattern. The same internal temperature has been assumed for all years.
For water heating, Ecoboiler assumes a tapping schedule for different house sizes. Hot water demand is assumed to be stable over time.
Energy savings are based on changes in fuel (and technology) employed and/or heating system efficiency - which are calculated using Ecoboiler modelling - rather than on changes in boiler efficiency alone.
41
www.ecoboiler.org
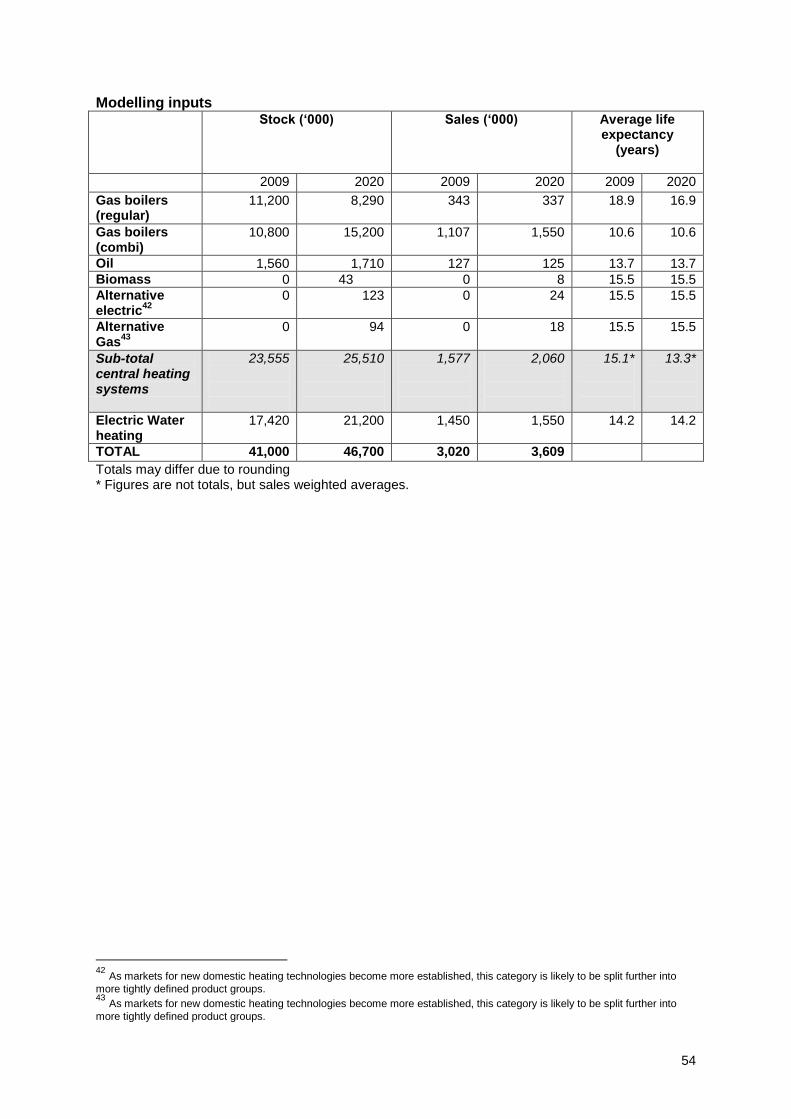
54
Modelling inputs Stock (‘000) Sales (‘000) Average life
expectancy (years)
2009 2020 2009 2020 2009 2020
Gas boilers (regular)
11,200 8,290 343 337 18.9 16.9
Gas boilers (combi)
10,800 15,200 1,107 1,550 10.6 10.6
Oil 1,560 1,710 127 125 13.7 13.7
Biomass 0 43 0 8 15.5 15.5
Alternative electric
42
0 123 0 24 15.5 15.5
Alternative Gas
43
0 94 0 18 15.5 15.5
Sub-total central heating systems
23,555
25,510
1,577
2,060
15.1*
13.3*
Electric Water heating
17,420 21,200 1,450 1,550 14.2 14.2
TOTAL 41,000 46,700 3,020 3,609
Totals may differ due to rounding * Figures are not totals, but sales weighted averages.
42
As markets for new domestic heating technologies become more established, this category is likely to be split further into
more tightly defined product groups. 43
As markets for new domestic heating technologies become more established, this category is likely to be split further into
more tightly defined product groups.

55
Projected growth in heat pump, CHP and biomass boilers installations
0
10,000
20,000
30,000
40,000
50,000
60,000
2000 2005 2010 2015 2020 2025 2030
Re
f Sto
ck (
tho
usa
nd
s)
Year
Elec Alt-Biomass Alt-Elec Alt-Gas Gas-Combi Gas-Reg Oil
0
10000
20000
30000
40000
50000
60000
2000 2005 2010 2015 2020 2025 2030
Po
licy
Sto
ck (
tho
usa
nd
s)
Year
Elec Alt-Biomass Alt-Elec Alt-Gas Gas-Combi Gas-Reg Oil
0
10000
20000
30000
40000
50000
60000
2000 2005 2010 2015 2020 2025 2030
BA
T St
ock
(th
ou
san
ds)
Year
Elec Alt-Biomass Alt-Elec Alt-Gas Gas-Combi Gas-Reg Oil

56
4. Policy Impacts
The following graph(s) show the Government‟s projections for energy use by the domestic central heating systems.
Total projected energy consumption of domestic central heating systems
Reference
Policy
Best Available Technology
0
50
100
150
200
250
300
350
400
2000 2005 2010 2015 2020 2025 2030Tota
l Pro
ject
ed
En
erg
y C
on
sum
pti
on
of
Do
me
stic
He
atin
g (T
Wh
)
Year
Reference Policy Best Available Technology
Impacts
2009 Current (GWh)
2020 LCTP/Reference
scenario (GWh)
2020 Policy
scenario (GWh)
2009 CO2
emissions (MtCO2)
Annual CO2 emission savings at
202044
(MtCO2)
Gas boilers (regular)
166,000 106,000 97,900 30.61 1.42
Gas boilers (combi)
145,000 181,000 160,400 26.75 3.78
Oil 30,100 27,500 24,100 7.98 0.90
Biomass 0 482 1,850 0.00 0.00
Alternative electric
0 602 1,920 0.00 -0.57
Alternative Gas
0 670 2,410 0.00 -0.32
Electric Water heating
14,600 17,600 16,600
7.30 0.43
Total 356,000 333,000 305,000 72.64 5.65
Totals may differ due to rounding
44
The reference against which product policy savings are measured is „reference scenario two‟, which includes improvements in building fabric due to future building fabric-related policies
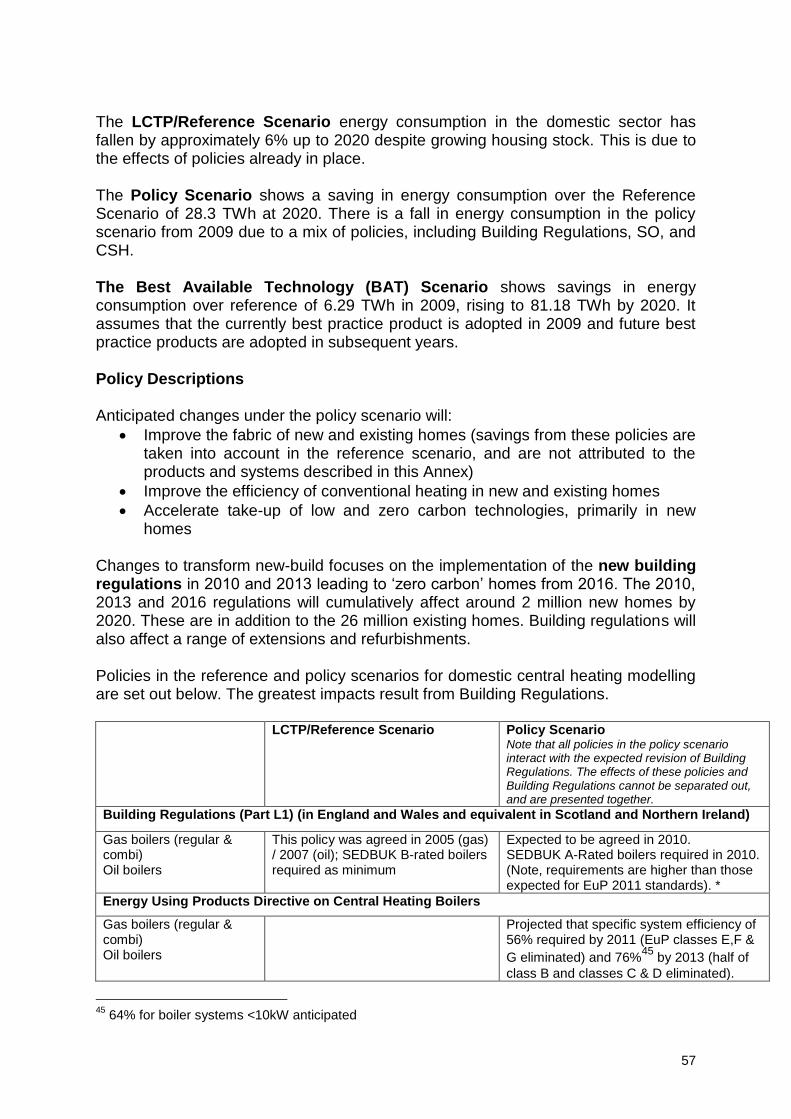
57
The LCTP/Reference Scenario energy consumption in the domestic sector has fallen by approximately 6% up to 2020 despite growing housing stock. This is due to the effects of policies already in place. The Policy Scenario shows a saving in energy consumption over the Reference Scenario of 28.3 TWh at 2020. There is a fall in energy consumption in the policy scenario from 2009 due to a mix of policies, including Building Regulations, SO, and CSH. The Best Available Technology (BAT) Scenario shows savings in energy consumption over reference of 6.29 TWh in 2009, rising to 81.18 TWh by 2020. It assumes that the currently best practice product is adopted in 2009 and future best practice products are adopted in subsequent years. Policy Descriptions Anticipated changes under the policy scenario will:
Improve the fabric of new and existing homes (savings from these policies are taken into account in the reference scenario, and are not attributed to the products and systems described in this Annex)
Improve the efficiency of conventional heating in new and existing homes
Accelerate take-up of low and zero carbon technologies, primarily in new homes
Changes to transform new-build focuses on the implementation of the new building regulations in 2010 and 2013 leading to „zero carbon‟ homes from 2016. The 2010, 2013 and 2016 regulations will cumulatively affect around 2 million new homes by 2020. These are in addition to the 26 million existing homes. Building regulations will also affect a range of extensions and refurbishments. Policies in the reference and policy scenarios for domestic central heating modelling are set out below. The greatest impacts result from Building Regulations. LCTP/Reference Scenario Policy Scenario
Note that all policies in the policy scenario interact with the expected revision of Building Regulations. The effects of these policies and Building Regulations cannot be separated out, and are presented together.
Building Regulations (Part L1) (in England and Wales and equivalent in Scotland and Northern Ireland)
Gas boilers (regular & combi) Oil boilers
This policy was agreed in 2005 (gas) / 2007 (oil); SEDBUK B-rated boilers required as minimum
Expected to be agreed in 2010. SEDBUK A-Rated boilers required in 2010. (Note, requirements are higher than those expected for EuP 2011 standards). *
Energy Using Products Directive on Central Heating Boilers
Gas boilers (regular & combi) Oil boilers
Projected that specific system efficiency of 56% required by 2011 (EuP classes E,F &
G eliminated) and 76%45
by 2013 (half of
class B and classes C & D eliminated).
45
64% for boiler systems <10kW anticipated

58
LCTP/Reference Scenario Policy Scenario Note that all policies in the policy scenario interact with the expected revision of Building Regulations. The effects of these policies and Building Regulations cannot be separated out, and are presented together.
Labelling Directive on Central Heating Boilers
Gas boilers (regular & combi) Oil boilers Biomass Alternative electric Alternative gas
Projected to contribute to a switching of technologies away from conventional boilers toward alternative technologies
Carbon Emissions Reduction Target (CERT) and Post-2012 Supplier Obligation
Gas boilers (regular & combi) Oil boilers
From 2009: support for early replacement of SEDBUK G rated boilers with A rated models
From 2012: Projected support for early replacement of e.g. SEDBUK D-G rated boilers with A-rated models.
Biomass Alternative electric Alternative gas
Direct support for innovative technologies
Heat and Energy Saving Strategy
Gas boilers (regular & combi) Oil boilers Heating Controls Biomass Alternative electric Alternative gas
Expected policies to emerge include: "whole house" advice on energy-saving and renewable measures for all homes; new financial support mechanisms; support for district heating; and requirements for energy saving measures with certain building work. Policies are expected to take a coordinated, geographical (e.g. street by street) approach.
Code for Sustainable Homes
Biomass Alternative electric Alternative gas
Code level 3 minimum for publicly-funded new-builds.
Code level 4 assumed as minimum for publicly funded new-builds, from 2010. Uptake accelerated by tighter carbon emission limits
Energy Using Products Directive on Water Heaters
Water heating products Assumes that F and G class products will be eliminated in 2011, and by 2013 D & E are also eliminated, with tighter requirements for larger water heaters.
* Note that this description does not factor in that DCLG is considering updates on the building regulations part l requirements for boilers. These have not yet been included in the impact modelling as there is insufficient information about these future requirements. Some additional policies are expected to contribute to the delivery of energy savings in the sector. However, these have not been modelled. These include:
- Minimum standards for air source and ground source heat pumps and for biomass boilers; and
- Targets for biomass heating - Proposed Feed-In Tariff for a range of electricity-producing alternative
technologies (e.g. micro CHP)

59
Solid Fuel stoves, cookers and boilers are currently under separate discussion under EuP. There are no policy proposals available at this time46. Market impact of policy package This graph presents Defra projections of how the market will change as a result of the policy scenario. EuP-based system efficiency is used as common metric. However, the graph indicates that the market shares of gas regular, gas combi and oil boilers fall (whose system efficiencies peak at 65%), while those of alt. electric (160%), alt. gas (110%) and alt. biomass (70%) rise.
Impacts by Product Average
annual energy savings (£m)
Average annual product & policy cost increases
Net Benefit (£m)
Cost Effectiveness (* = traded)
(£/tCO2)
Gas boilers (regular) Gas Regular Boiler 252 47 3,110 -62 Gas Combi Boiler 608 227 5,770 -39 Oil Boiler 169 18 2,300 -81 Alternative Electric -154 3 -2930 -160* Alternative Gas -70 46 -1750 -161 Alternative Biomass -234 38 -3600 0 Electric Water Heaters 84 84 1.0 -25*
TOTAL 655 463 2900 -- Attribution of savings to policies The table below illustrates Defra‟s initial analysis of the percentage of energy savings attributed to policies, along with the rationale for assigning the attributions.
46
www.ecosolidfuel.org
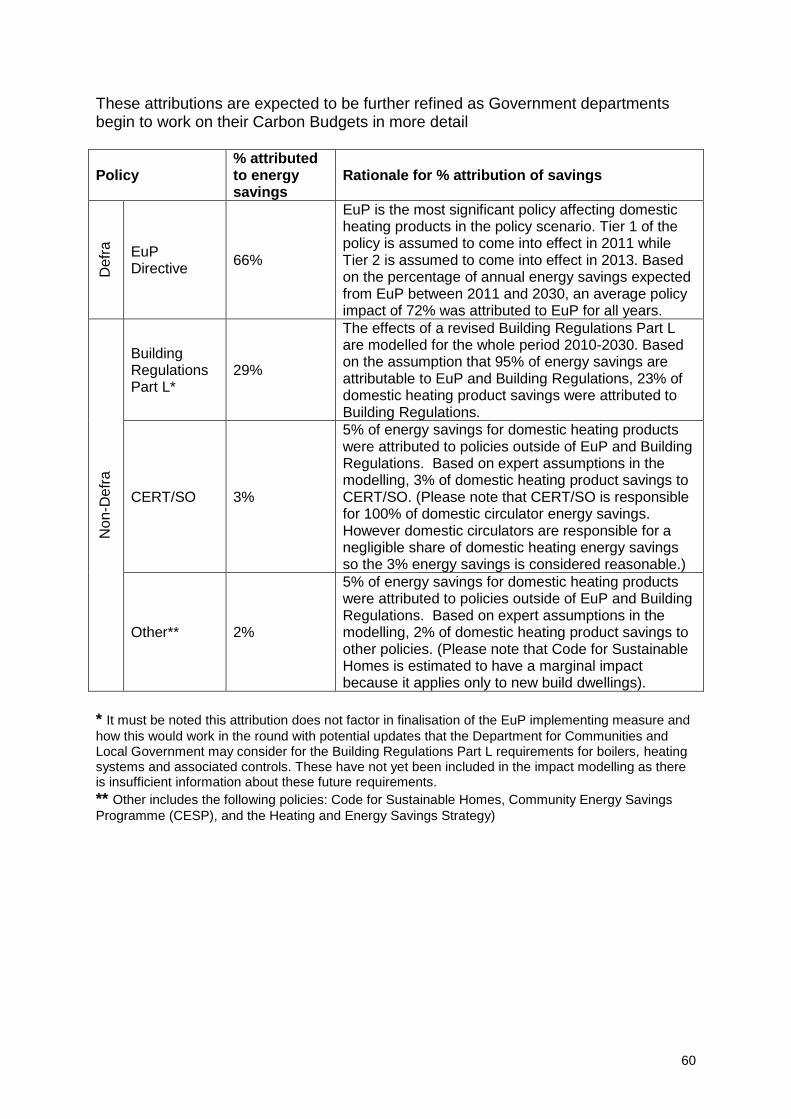
60
These attributions are expected to be further refined as Government departments begin to work on their Carbon Budgets in more detail
Policy % attributed to energy savings
Rationale for % attribution of savings
De
fra
EuP Directive
66%
EuP is the most significant policy affecting domestic heating products in the policy scenario. Tier 1 of the policy is assumed to come into effect in 2011 while Tier 2 is assumed to come into effect in 2013. Based on the percentage of annual energy savings expected from EuP between 2011 and 2030, an average policy impact of 72% was attributed to EuP for all years.
No
n-D
efr
a
Building Regulations Part L*
29%
The effects of a revised Building Regulations Part L are modelled for the whole period 2010-2030. Based on the assumption that 95% of energy savings are attributable to EuP and Building Regulations, 23% of domestic heating product savings were attributed to Building Regulations.
CERT/SO 3%
5% of energy savings for domestic heating products were attributed to policies outside of EuP and Building Regulations. Based on expert assumptions in the modelling, 3% of domestic heating product savings to CERT/SO. (Please note that CERT/SO is responsible for 100% of domestic circulator energy savings. However domestic circulators are responsible for a negligible share of domestic heating energy savings so the 3% energy savings is considered reasonable.)
Other** 2%
5% of energy savings for domestic heating products were attributed to policies outside of EuP and Building Regulations. Based on expert assumptions in the modelling, 2% of domestic heating product savings to other policies. (Please note that Code for Sustainable Homes is estimated to have a marginal impact because it applies only to new build dwellings).
* It must be noted this attribution does not factor in finalisation of the EuP implementing measure and
how this would work in the round with potential updates that the Department for Communities and Local Government may consider for the Building Regulations Part L requirements for boilers, heating systems and associated controls. These have not yet been included in the impact modelling as there is insufficient information about these future requirements. ** Other includes the following policies: Code for Sustainable Homes, Community Energy Savings
Programme (CESP), and the Heating and Energy Savings Strategy)
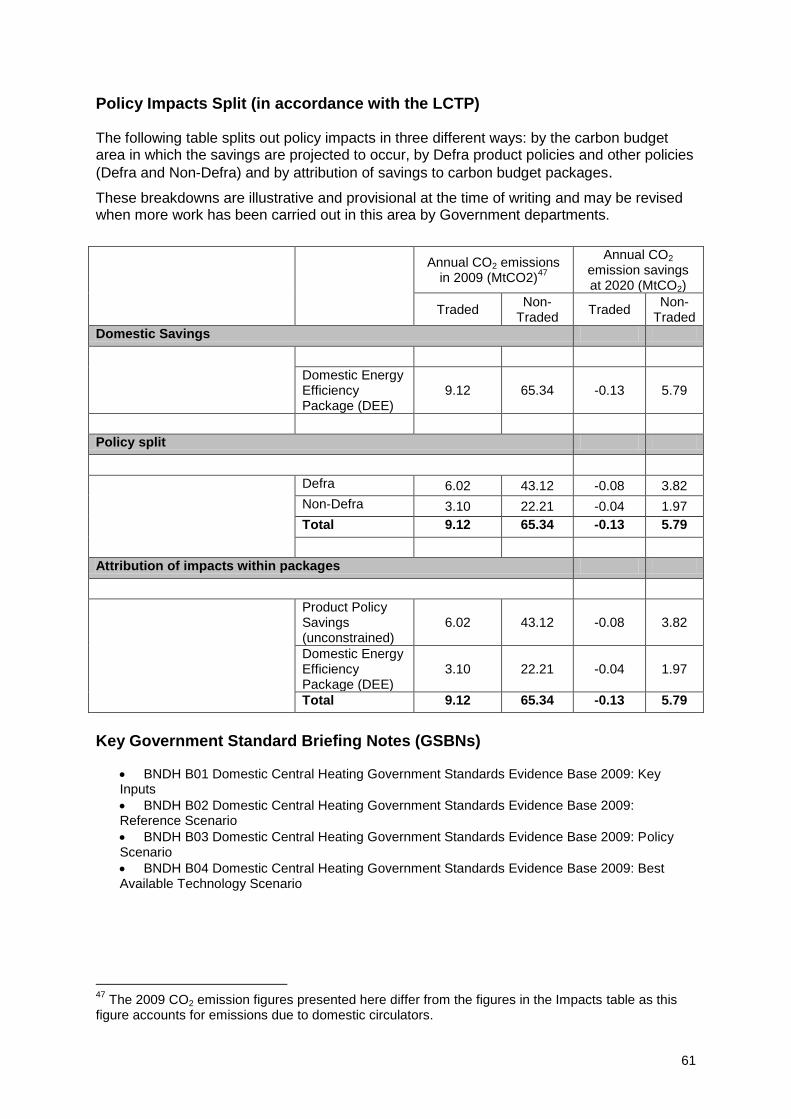
61
Policy Impacts Split (in accordance with the LCTP) The following table splits out policy impacts in three different ways: by the carbon budget area in which the savings are projected to occur, by Defra product policies and other policies
(Defra and Non-Defra) and by attribution of savings to carbon budget packages.
These breakdowns are illustrative and provisional at the time of writing and may be revised when more work has been carried out in this area by Government departments.
Annual CO2 emissions in 2009 (MtCO2)
47
Annual CO2 emission savings at 2020 (MtCO2)
Traded Non-
Traded Traded
Non-Traded
Domestic Savings
Domestic Energy Efficiency Package (DEE)
9.12 65.34 -0.13 5.79
Policy split
Defra 6.02 43.12 -0.08 3.82
Non-Defra 3.10 22.21 -0.04 1.97
Total 9.12 65.34 -0.13 5.79
Attribution of impacts within packages
Product Policy Savings (unconstrained)
6.02 43.12 -0.08 3.82
Domestic Energy Efficiency Package (DEE)
3.10 22.21 -0.04 1.97
Total 9.12 65.34 -0.13 5.79
Key Government Standard Briefing Notes (GSBNs)
BNDH B01 Domestic Central Heating Government Standards Evidence Base 2009: Key Inputs
BNDH B02 Domestic Central Heating Government Standards Evidence Base 2009: Reference Scenario
BNDH B03 Domestic Central Heating Government Standards Evidence Base 2009: Policy Scenario
BNDH B04 Domestic Central Heating Government Standards Evidence Base 2009: Best Available Technology Scenario
47
The 2009 CO2 emission figures presented here differ from the figures in the Impacts table as this figure accounts for emissions due to domestic circulators.
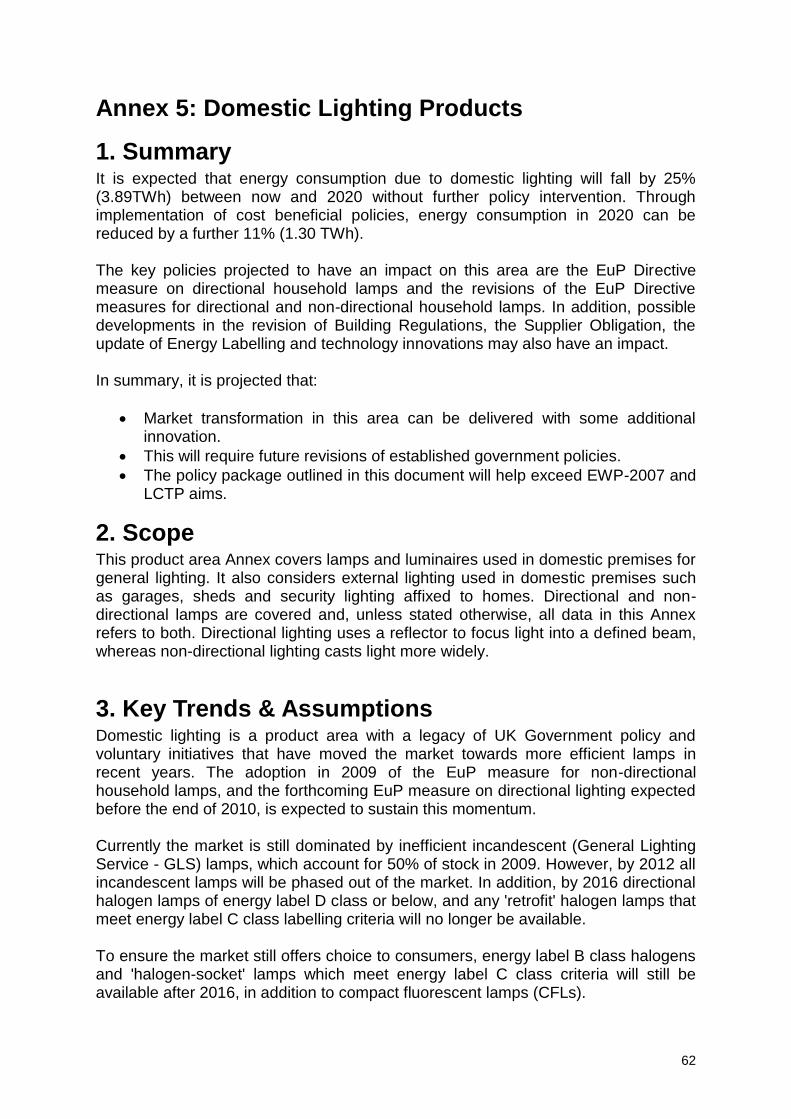
62
Annex 5: Domestic Lighting Products
1. Summary It is expected that energy consumption due to domestic lighting will fall by 25% (3.89TWh) between now and 2020 without further policy intervention. Through implementation of cost beneficial policies, energy consumption in 2020 can be reduced by a further 11% (1.30 TWh). The key policies projected to have an impact on this area are the EuP Directive measure on directional household lamps and the revisions of the EuP Directive measures for directional and non-directional household lamps. In addition, possible developments in the revision of Building Regulations, the Supplier Obligation, the update of Energy Labelling and technology innovations may also have an impact. In summary, it is projected that:
Market transformation in this area can be delivered with some additional innovation.
This will require future revisions of established government policies.
The policy package outlined in this document will help exceed EWP-2007 and LCTP aims.
2. Scope This product area Annex covers lamps and luminaires used in domestic premises for general lighting. It also considers external lighting used in domestic premises such as garages, sheds and security lighting affixed to homes. Directional and non-directional lamps are covered and, unless stated otherwise, all data in this Annex refers to both. Directional lighting uses a reflector to focus light into a defined beam, whereas non-directional lighting casts light more widely.
3. Key Trends & Assumptions Domestic lighting is a product area with a legacy of UK Government policy and voluntary initiatives that have moved the market towards more efficient lamps in recent years. The adoption in 2009 of the EuP measure for non-directional household lamps, and the forthcoming EuP measure on directional lighting expected before the end of 2010, is expected to sustain this momentum. Currently the market is still dominated by inefficient incandescent (General Lighting Service - GLS) lamps, which account for 50% of stock in 2009. However, by 2012 all incandescent lamps will be phased out of the market. In addition, by 2016 directional halogen lamps of energy label D class or below, and any 'retrofit' halogen lamps that meet energy label C class labelling criteria will no longer be available. To ensure the market still offers choice to consumers, energy label B class halogens and 'halogen-socket' lamps which meet energy label C class criteria will still be available after 2016, in addition to compact fluorescent lamps (CFLs).
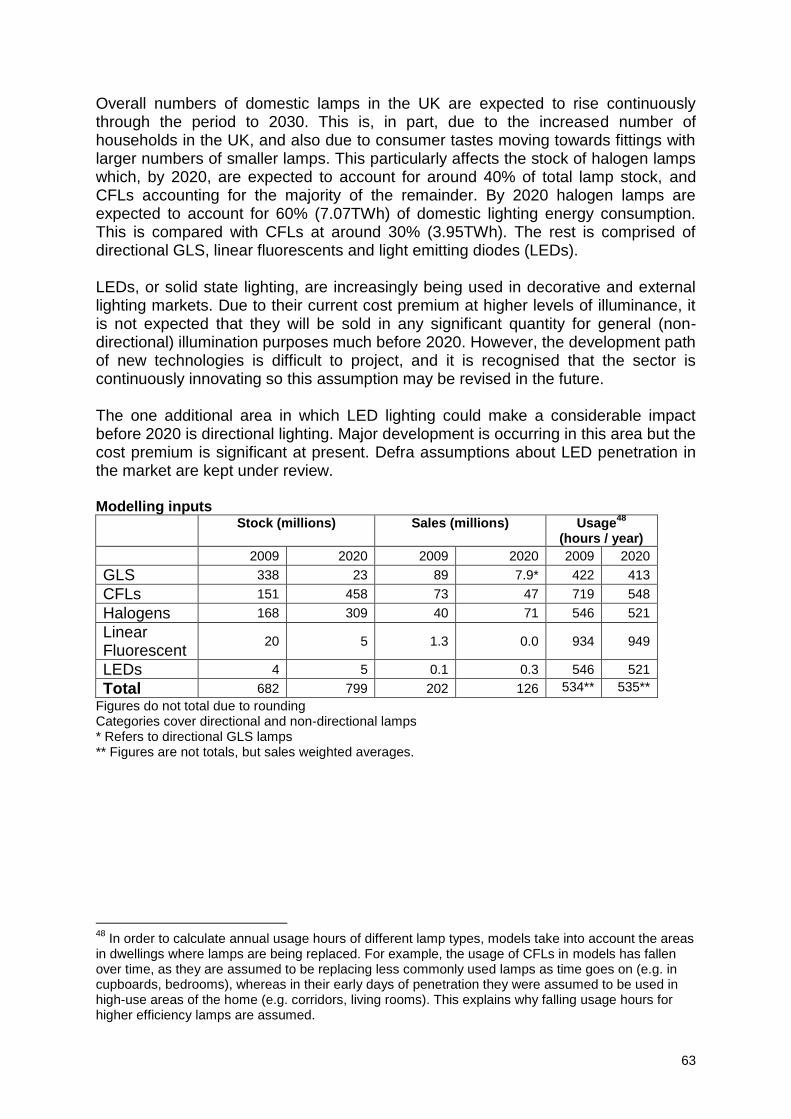
63
Overall numbers of domestic lamps in the UK are expected to rise continuously through the period to 2030. This is, in part, due to the increased number of households in the UK, and also due to consumer tastes moving towards fittings with larger numbers of smaller lamps. This particularly affects the stock of halogen lamps which, by 2020, are expected to account for around 40% of total lamp stock, and CFLs accounting for the majority of the remainder. By 2020 halogen lamps are expected to account for 60% (7.07TWh) of domestic lighting energy consumption. This is compared with CFLs at around 30% (3.95TWh). The rest is comprised of directional GLS, linear fluorescents and light emitting diodes (LEDs). LEDs, or solid state lighting, are increasingly being used in decorative and external lighting markets. Due to their current cost premium at higher levels of illuminance, it is not expected that they will be sold in any significant quantity for general (non-directional) illumination purposes much before 2020. However, the development path of new technologies is difficult to project, and it is recognised that the sector is continuously innovating so this assumption may be revised in the future. The one additional area in which LED lighting could make a considerable impact before 2020 is directional lighting. Major development is occurring in this area but the cost premium is significant at present. Defra assumptions about LED penetration in the market are kept under review. Modelling inputs
Stock (millions) Sales (millions) Usage48
(hours / year)
2009 2020 2009 2020 2009 2020
GLS 338 23 89 7.9* 422 413
CFLs 151 458 73 47 719 548
Halogens 168 309 40 71 546 521
Linear Fluorescent
20 5 1.3 0.0 934 949
LEDs 4 5 0.1 0.3 546 521
Total 682 799 202 126 534** 535**
Figures do not total due to rounding Categories cover directional and non-directional lamps * Refers to directional GLS lamps ** Figures are not totals, but sales weighted averages.
48
In order to calculate annual usage hours of different lamp types, models take into account the areas in dwellings where lamps are being replaced. For example, the usage of CFLs in models has fallen over time, as they are assumed to be replacing less commonly used lamps as time goes on (e.g. in cupboards, bedrooms), whereas in their early days of penetration they were assumed to be used in high-use areas of the home (e.g. corridors, living rooms). This explains why falling usage hours for higher efficiency lamps are assumed.

64
4. Policy Impacts The following graph shows the Government‟s projections for energy use by domestic lighting.
Total projected energy consumption of domestic lighting
Impacts
2009 Current (GWh)
2020 LCTP/Reference
Scenario (GWh)
2020 Policy
Scenario (GWh)
2009 CO2
emissions (MtCO2)
Annual CO2 emission savings at
2020 (MtCO2)
Domestic Lighting
15,800 11,900 10,600 7.9
0.49
The LCTP/Reference Scenario energy consumption in the domestic sector remained relatively constant until 2008, when the effects of various agreed policies affecting the sector came into effect, most particularly the Energy Using Product Directive on non-directional household lamps (from late 2009), shifting the market away from GLS lamps to more efficient alternatives. A slight rise in consumption is seen after 2016. This is driven both by a higher stock of lamps due to increasing numbers of households and the fact that existing policies, while remaining effective, no longer add further savings that will counteract the growth in demand for lighting. The Policy Scenario shows a saving in energy consumption over reference of 1.30 TWh by 2020. There is a continuous fall in energy consumption in the Policy Scenario from now onwards due to a mix of policies including the initial and revised EuP measures on Directional Household lamps and future revisions of the measure

65
on Non-Directional Household lamps. This fall is particularly marked from 2020, when the revisions of the EuP measures on both Directional and Non-Directional lighting are assumed to take effect. The Best Available Technology (BAT) Scenario shows savings in energy consumption over reference of 1.48TWh in 2009, rising to 6.45 TWh by 2020. It assumes that the currently best-practice product is adopted in 2009 and future best-practice products are adopted in subsequent years. It is assumed that GLS lamps are replaced with CFLs, with LEDs phased in slowly. Halogen reflector lamps are replaced by infrared halogens; energy label B and C class rated halogens are replaced by LEDs. Overall, in this scenario LEDs are projected to increase from their current level of about 1% of stock (installed lamps) to nearly 50% by 2020, remaining largely stable thereafter. Policy Descriptions LCTP/Reference Scenario Policy Scenario
Energy Using Product Directive (EuP)
Non-Directional Household lamps
Agreed in 2009. This measure phases out GLS and Halogen energy label D-class lamps completely by 2012, with retrofit halogen energy label C classes phased out by 2016. The result will be that only CFLs, LEDs, halogen retro-fit energy label B class and Halogen Socket energy label C class lamps will remain on the market by 2016.
A revision of the measure is expected to require all non-directional lamps to be energy label A class efficiency by 2020. This assumes that some LED lamp equivalents will be developed in the next decade.
Directional Household Lamps & Luminaires
Expected to be agreed in 2010 and enter into force by 2011. This measure is expected to affect domestic reflector lamps, mains halogens (GU10), low voltage halogens (MR16/MR11) and halogen PAR lamps. The result should be that largely only IR directional lamps will remain on the market by 2014. A revision of the measure is expected to require all directional lamps to be energy label A class efficiency by 2020. This assumes that some LED lamp equivalents will be developed in the next decade.
Other Policies
Carbon Emissions Reduction Target (CERT) and Voluntary Retailer Commitment
Through the Voluntary Commitment retailers committed to phase out GLS lamps by 2011. This will see 186million GLS lamps removed from market by 2011. It is assumed that 56 million are replaced by tungsten halogen lamps, and 130 million by CFLs. Based on current evidence, the Defra model assumes that the CFLs are provided under the CERT
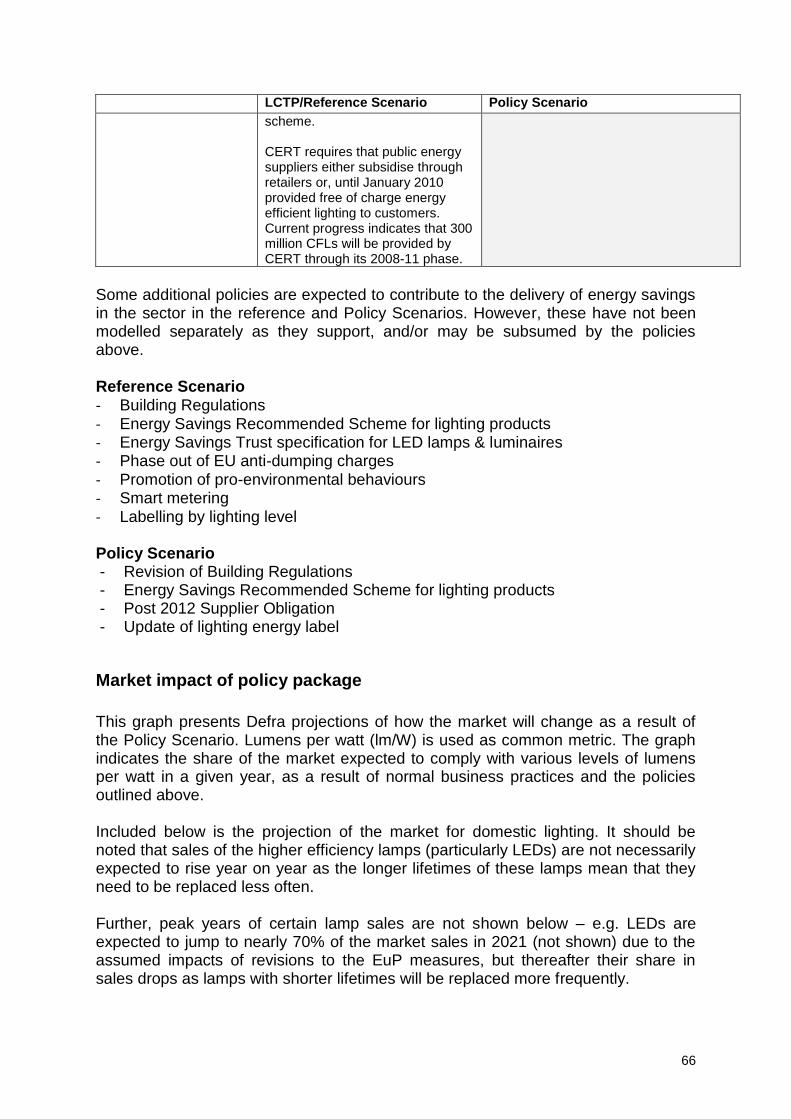
66
LCTP/Reference Scenario Policy Scenario
scheme. CERT requires that public energy suppliers either subsidise through retailers or, until January 2010 provided free of charge energy efficient lighting to customers. Current progress indicates that 300 million CFLs will be provided by CERT through its 2008-11 phase.
Some additional policies are expected to contribute to the delivery of energy savings in the sector in the reference and Policy Scenarios. However, these have not been modelled separately as they support, and/or may be subsumed by the policies above. Reference Scenario - Building Regulations - Energy Savings Recommended Scheme for lighting products - Energy Savings Trust specification for LED lamps & luminaires - Phase out of EU anti-dumping charges - Promotion of pro-environmental behaviours - Smart metering - Labelling by lighting level Policy Scenario - Revision of Building Regulations - Energy Savings Recommended Scheme for lighting products - Post 2012 Supplier Obligation - Update of lighting energy label
Market impact of policy package
This graph presents Defra projections of how the market will change as a result of the Policy Scenario. Lumens per watt (lm/W) is used as common metric. The graph indicates the share of the market expected to comply with various levels of lumens per watt in a given year, as a result of normal business practices and the policies outlined above. Included below is the projection of the market for domestic lighting. It should be noted that sales of the higher efficiency lamps (particularly LEDs) are not necessarily expected to rise year on year as the longer lifetimes of these lamps mean that they need to be replaced less often. Further, peak years of certain lamp sales are not shown below – e.g. LEDs are expected to jump to nearly 70% of the market sales in 2021 (not shown) due to the assumed impacts of revisions to the EuP measures, but thereafter their share in sales drops as lamps with shorter lifetimes will be replaced more frequently.

67
Equivalent lamp technologies ≤14 lm/W: GLS lamps or Halogen energy label D class lamps 14 < lm/W ≤17: Halogen energy label C class lamps 17 < lm/W ≤45: Halogen energy label B class lamps 45 < lm/W ≤60: CFLs and some early developed solid state lighting 60 < lm/W ≤100: Linear fluorescent >100 lm/W: Later developed solid state lighting
Impacts by Product Average
annual energy
savings (£m)
Average annual product & policy cost
increases (£m)
Net Benefit (£m)
Cost Effectiveness (traded) (£/tCO2)
Domestic Lighting 272 26 3,736 -98.0
Attribution of savings to policies
The table below illustrates Defra‟s initial analysis of the percentage of energy savings attributed to policies, along with the rationale for assigning the attributions. These attributions are expected to be further refined as Government departments begin to work on their Carbon Budgets in more detail.
E x p e c t e d E f f i c i e n c y C o v e r a g e R a t e s f o r D o m e s t i c L i g h t i n g ( 2 0 1 0 t o 2 0 3 0 )
0 . 0 0 %
1 0 . 0 0 %
2 0 . 0 0 %
3 0 . 0 0 %
4 0 . 0 0 %
5 0 . 0 0 %
6 0 . 0 0 %
7 0 . 0 0 %
8 0 . 0 0 %
9 0 . 0 0 %
1 0 0 . 0 0 %
2 0 1 0 2 0 1 5 2 0 2 0 2 0 2 5 2 0 3 0
E f f ( l m / w )
Š 1 4 1 4
< E f f ( l m / w ) Š 1 7
1 7 < E f f ( l m / w )
Š 4 5 4 5
< E f f ( l m / w ) Š 6 0
6 0 < E f f ( l m / w )
Š 1 0 0 E f f
( l m / w ) > 1 0 0
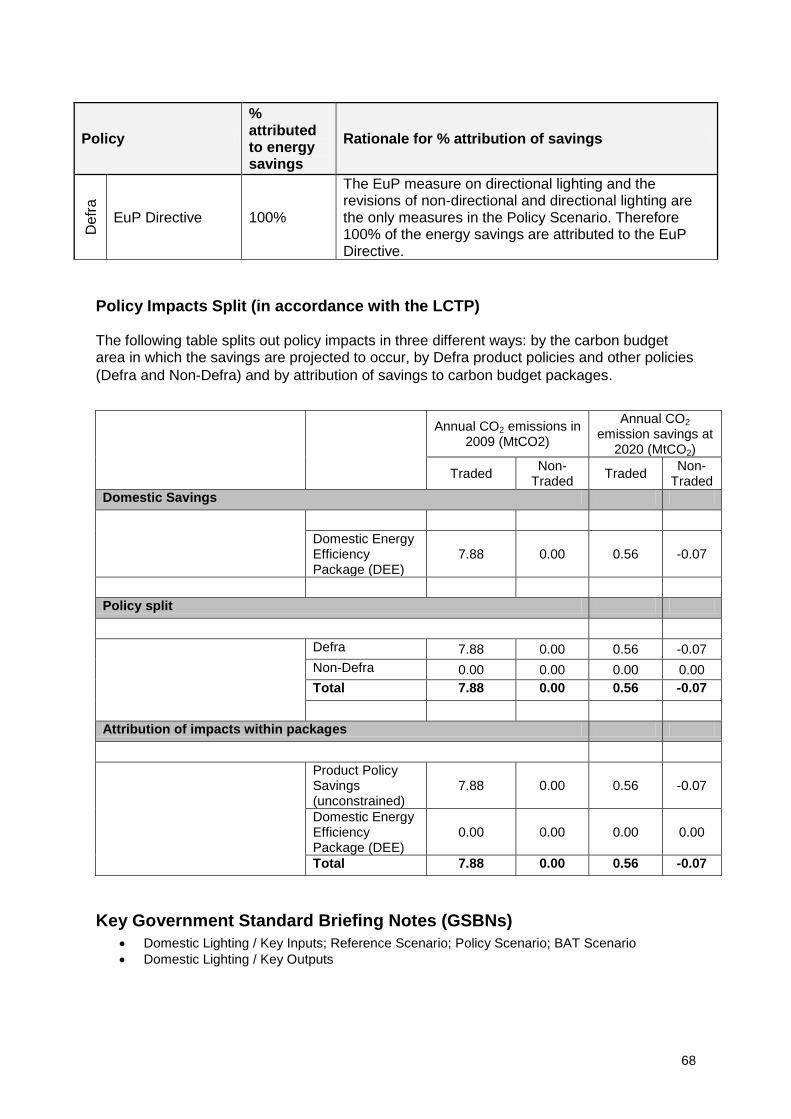
68
Policy Impacts Split (in accordance with the LCTP) The following table splits out policy impacts in three different ways: by the carbon budget area in which the savings are projected to occur, by Defra product policies and other policies
(Defra and Non-Defra) and by attribution of savings to carbon budget packages.
Annual CO2 emissions in 2009 (MtCO2)
Annual CO2 emission savings at
2020 (MtCO2)
Traded Non-
Traded Traded
Non-Traded
Domestic Savings
Domestic Energy Efficiency Package (DEE)
7.88 0.00 0.56 -0.07
Policy split
Defra 7.88 0.00 0.56 -0.07
Non-Defra 0.00 0.00 0.00 0.00
Total 7.88 0.00 0.56 -0.07
Attribution of impacts within packages
Product Policy Savings (unconstrained)
7.88 0.00 0.56 -0.07
Domestic Energy Efficiency Package (DEE)
0.00 0.00 0.00 0.00
Total 7.88 0.00 0.56 -0.07
Key Government Standard Briefing Notes (GSBNs)
Domestic Lighting / Key Inputs; Reference Scenario; Policy Scenario; BAT Scenario
Domestic Lighting / Key Outputs
Policy
% attributed to energy savings
Rationale for % attribution of savings
De
fra
EuP Directive 100%
The EuP measure on directional lighting and the revisions of non-directional and directional lighting are the only measures in the Policy Scenario. Therefore 100% of the energy savings are attributed to the EuP Directive.

69
Annex 6: Air Conditioning Products
1. Summary
It is expected that energy consumption due to domestic and non-domestic air conditioning will increase by 38% (4.47TWh) between now and 2020 without further policy intervention. Through implementation of cost beneficial policies, energy consumption in 2020 can be reduced by 15% (2.49 TWh). The key policies projected to have an impact on this area are the EU Energy using Products (EuP) and Labelling Directives; Enhanced Capital Allowances (ECAs); Building Regulations; and the Carbon Reduction Commitment (CRC). In summary, it is projected that:
Market transformation in this area can be delivered with additional innovation.
This will require future revisions of established government policies as well as the introduction of some new policies.
The policy package outlined in this document will help exceed EWP-2007 and LCTP aims.
2. Scope
This annex addresses the following air conditioning products:
Chillers (air-cooled, water-cooled and absorption)
Air handling units (AHUs)
Close control units
Ducted split units
Fan coil units (FCUs)
Indoor units
Mini split units
Moveable (portable) units
Rooftop units
Window and through-the-wall units
3. Key Trends & Assumptions
The key trend in this market is an increase in cooling demand. The energy consumption related to air conditioning is being tempered by a shift to more efficient products, as a result of a more globalised market. The great majority (over 95%) of cooling occurs in the non-domestic sector. Market penetration in the domestic sector is less than 1% (and is expected to remain relatively low, despite a rapid increase in the number of units sold), and is concentrated in sales of moveable units.

70
Air-cooled chillers These chillers currently account for around 22% of energy consumption from all air conditioning products modelled (or 32% of all central plant systems). Market share is projected to experience a modest decline through to 2020. Thereafter, sales are likely to rise at a rate approaching the sector average. Water-cooled chillers These chillers currently account for around 12% of energy consumption from all air conditioning products modelled (or 17% of all central plant systems). Market share is projected to remain stable to around 2020. Thereafter, sales are likely to rise at a considerable rate. This rise is due in part to: increasing awareness of their superior efficiencies; and the introduction of tighter efficiency limits on competing technologies. Absorption chillers These chillers currently account for less than 6% of energy consumption from all air conditioning products modelled (or 9% of all central plant systems). Market share is projected to remain stable to 2020. Thereafter, sales are likely to rise (particularly as the market for trigeneration - i.e.CHP plus absorption cooling - develops). Air handling units AHUs currently account for around 25% of energy consumption from all air conditioning products modelled (or 37% of all central plant systems). Both market share and sales are, however, projected to decline to 2020 as mini-split, fan coil and rooftop units become more popular. This increasing popularity characterises a general move towards decentralised air conditioning installations, increasingly confining AHUs to the replacement market. Close control units These units currently account for around 12% of energy consumption from all air conditioning products modelled. The market share is, however, projected to decline while sales grow at a rate below the sector average, largely to meet modest growth in demand for cooling in data centres. Ducted split, indoor, moveable, rooftop and window or through-the wall units These products occupy small, niche positions (each consuming less than 1% of total AC energy, except for rooftop units which consume 3%) within the commercial cooling market. Window units are projected to become obsolete; rooftops sales to increase; and moveables, indoor and ducted unit sales to remain stable until at least 2020. Growth in moveables in the domestic sector is offset by declining sales in the non-domestic sector. Fan coil units FCUs currently account for around 3% of energy consumption from all air conditioning products modelled (or 4% of all central plant systems). This share is projected to increase, as in addition to being well-suited to decentralised ventilation systems, these units have become more efficient, cleaner, and easier to maintain. Mini split units Mini splits currently account for around 17% of energy consumption from all air
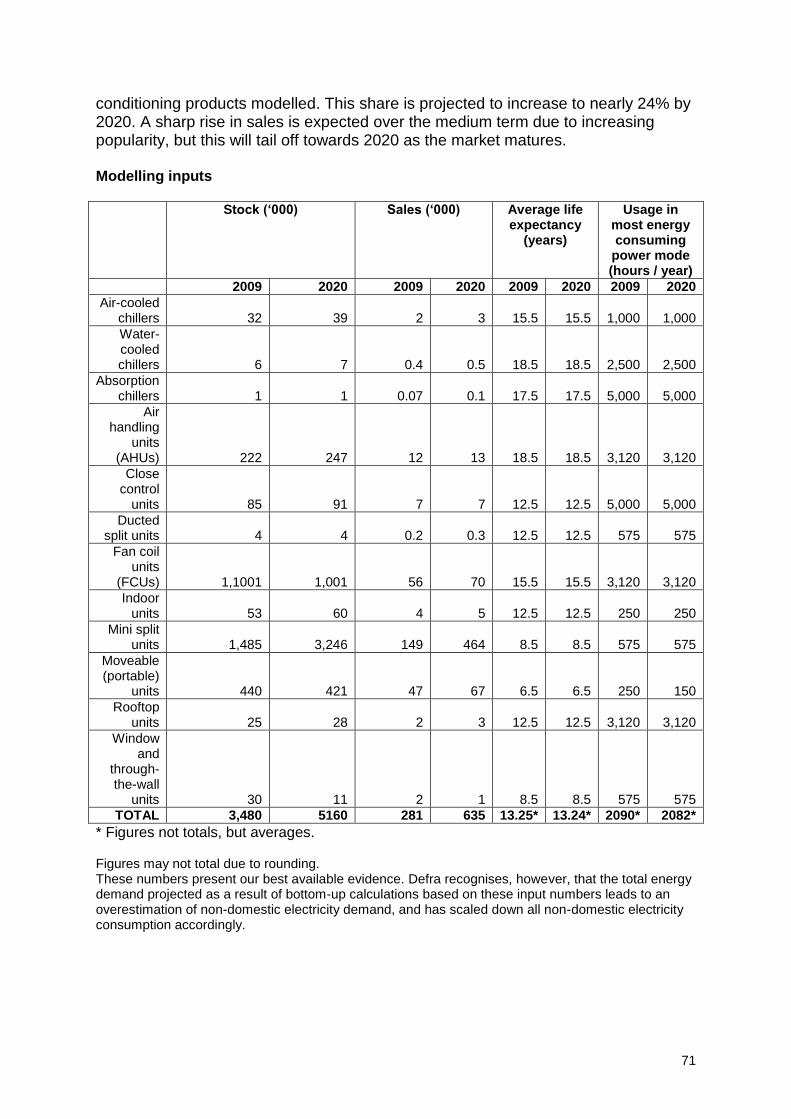
71
conditioning products modelled. This share is projected to increase to nearly 24% by 2020. A sharp rise in sales is expected over the medium term due to increasing popularity, but this will tail off towards 2020 as the market matures. Modelling inputs Stock (‘000) Sales (‘000) Average life
expectancy (years)
Usage in most energy consuming
power mode (hours / year)
2009 2020 2009 2020 2009 2020 2009 2020
Air-cooled chillers 32 39 2 3 15.5 15.5 1,000 1,000 Water-cooled chillers 6 7 0.4 0.5 18.5 18.5 2,500 2,500
Absorption chillers 1 1 0.07 0.1 17.5 17.5 5,000 5,000
Air handling
units (AHUs) 222 247 12 13 18.5 18.5 3,120 3,120
Close control
units 85 91 7 7 12.5 12.5 5,000 5,000 Ducted
split units 4 4 0.2 0.3 12.5 12.5 575 575 Fan coil
units (FCUs) 1,1001 1,001 56 70 15.5 15.5 3,120 3,120 Indoor
units 53 60 4 5 12.5 12.5 250 250 Mini split
units 1,485 3,246 149 464 8.5 8.5 575 575 Moveable (portable)
units 440 421 47 67 6.5 6.5 250 150 Rooftop
units 25 28 2 3 12.5 12.5 3,120 3,120 Window
and through-the-wall
units 30 11 2 1 8.5 8.5 575 575
TOTAL 3,480 5160 281 635 13.25* 13.24* 2090* 2082*
* Figures not totals, but averages. Figures may not total due to rounding. These numbers present our best available evidence. Defra recognises, however, that the total energy demand projected as a result of bottom-up calculations based on these input numbers leads to an overestimation of non-domestic electricity demand, and has scaled down all non-domestic electricity consumption accordingly.
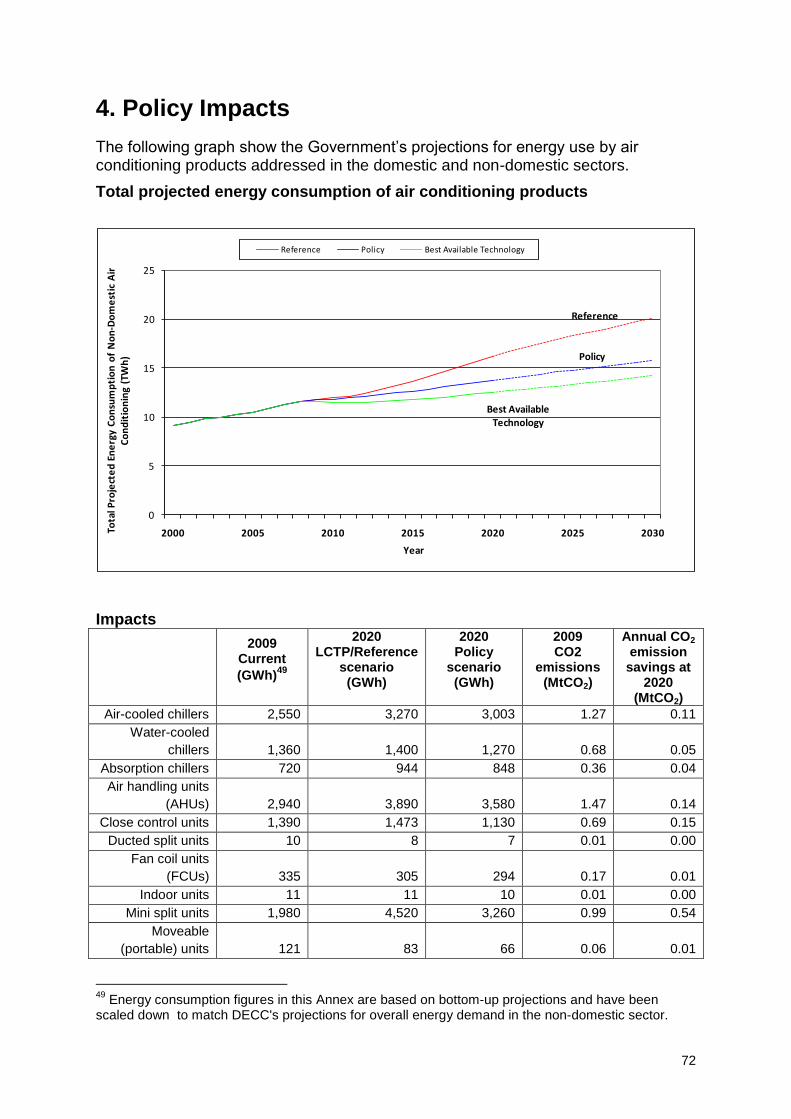
72
4. Policy Impacts
The following graph show the Government‟s projections for energy use by air conditioning products addressed in the domestic and non-domestic sectors.
Total projected energy consumption of air conditioning products
Reference
Policy
Best Available Technology
0
5
10
15
20
25
2000 2005 2010 2015 2020 2025 2030Tota
l Pro
ject
ed
En
erg
y C
on
sum
pti
on
of
No
n-D
om
est
ic A
ir
Co
nd
itio
nin
g (T
Wh
)
Year
Reference Policy Best Available Technology
Impacts
2009 Current
(GWh)49
2020 LCTP/Reference
scenario (GWh)
2020 Policy
scenario (GWh)
2009 CO2
emissions (MtCO2)
Annual CO2 emission
savings at 2020
(MtCO2)
Air-cooled chillers 2,550 3,270 3,003 1.27 0.11
Water-cooled
chillers 1,360 1,400 1,270 0.68 0.05
Absorption chillers 720 944 848 0.36 0.04
Air handling units
(AHUs) 2,940 3,890 3,580 1.47 0.14
Close control units 1,390 1,473 1,130 0.69 0.15
Ducted split units 10 8 7 0.01 0.00
Fan coil units
(FCUs) 335 305 294 0.17 0.01
Indoor units 11 11 10 0.01 0.00
Mini split units 1,980 4,520 3,260 0.99 0.54
Moveable
(portable) units 121 83 66 0.06 0.01
49
Energy consumption figures in this Annex are based on bottom-up projections and have been scaled down to match DECC's projections for overall energy demand in the non-domestic sector.
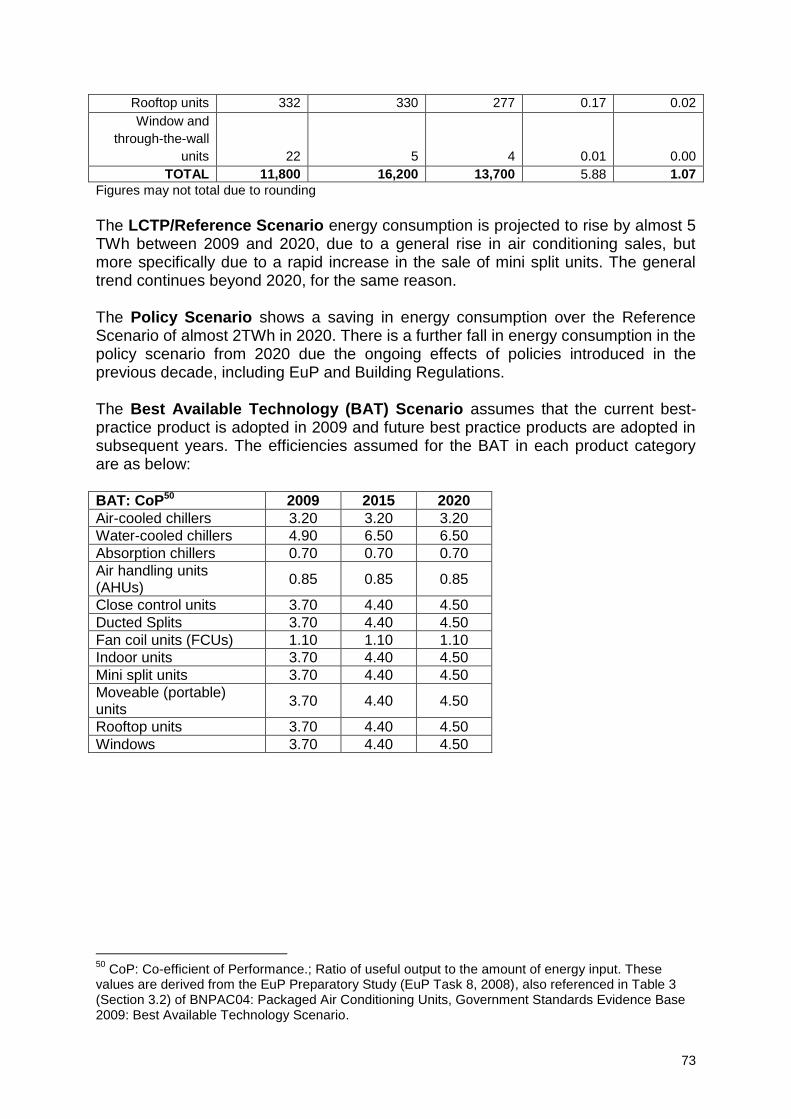
73
Rooftop units 332 330 277 0.17 0.02
Window and
through-the-wall
units 22 5 4 0.01 0.00
TOTAL 11,800 16,200 13,700 5.88 1.07
Figures may not total due to rounding
The LCTP/Reference Scenario energy consumption is projected to rise by almost 5 TWh between 2009 and 2020, due to a general rise in air conditioning sales, but more specifically due to a rapid increase in the sale of mini split units. The general trend continues beyond 2020, for the same reason. The Policy Scenario shows a saving in energy consumption over the Reference Scenario of almost 2TWh in 2020. There is a further fall in energy consumption in the policy scenario from 2020 due the ongoing effects of policies introduced in the previous decade, including EuP and Building Regulations. The Best Available Technology (BAT) Scenario assumes that the current best-practice product is adopted in 2009 and future best practice products are adopted in subsequent years. The efficiencies assumed for the BAT in each product category are as below: BAT: CoP50 2009 2015 2020
Air-cooled chillers 3.20 3.20 3.20
Water-cooled chillers 4.90 6.50 6.50
Absorption chillers 0.70 0.70 0.70
Air handling units (AHUs)
0.85 0.85 0.85
Close control units 3.70 4.40 4.50
Ducted Splits 3.70 4.40 4.50
Fan coil units (FCUs) 1.10 1.10 1.10
Indoor units 3.70 4.40 4.50
Mini split units 3.70 4.40 4.50
Moveable (portable) units
3.70 4.40 4.50
Rooftop units 3.70 4.40 4.50
Windows 3.70 4.40 4.50
50
CoP: Co-efficient of Performance.; Ratio of useful output to the amount of energy input. These values are derived from the EuP Preparatory Study (EuP Task 8, 2008), also referenced in Table 3 (Section 3.2) of BNPAC04: Packaged Air Conditioning Units, Government Standards Evidence Base 2009: Best Available Technology Scenario.

74
Policy Descriptions
LCTP/Reference Scenario Policy Scenario
Energy Using Products Directive
Indoor
Assumed that from 2010, all products*
will be affected by EuP MEPs51
CoP of
2.9 (including those >12kW). From 2013 CoP 3.1, from 2020 CoP 3.2, from 2025 CoP 3.4. *Exceptions:
close controls, of which 94% are driven by EuP (the rest exceeding it)
mini splits, of which 96% are driven by EuP (the rest exceeding it)
Window/wall
Moveables
Rooftops
Ducted split
Close control
Mini splits
Enhanced Capital Allowances
Indoor
Assumed very few claims under current ECA scheme as net benefits too small.
ECAs like all tax reliefs, are kept under review..
Window/wall
Moveables
Rooftops
Ducted split
Close control From 2009, 6.5% (10% of the 65% of units that are >12kW) takeup the current threshold of ECA (3.0)
Mini split From 2009, 3.9% (10% of the 39% of units that are >12kW) takeup the current threshold of ECA
Air- and water-cooled chillers: <100kW; 100-500kW; and 500-750kW
2009-2030: 1%, 10% and 30% of <100kW, 100-500kW and 500-750kW respectively takeup the current threshold of ECA
Building Regulations; Part L 2 (in England and Wales and equivalent in Scotland and Northern Ireland)
Absorption chillers
From 2010 onwards, minimum CoP assumed 0.70
All other products No impact (minimum standards exist but market norms or other policies (ECA) are more advanced and are driving the market).
2010 Building Regulations assumed to have minimal effect, as these too are superseded by market norms. It is assumed that this market feature persists upon further revisions of these Regulations. Improved building fabric requirements are expected to mitigate rising demand for AC.
51
Minimum Energy Performance Standard
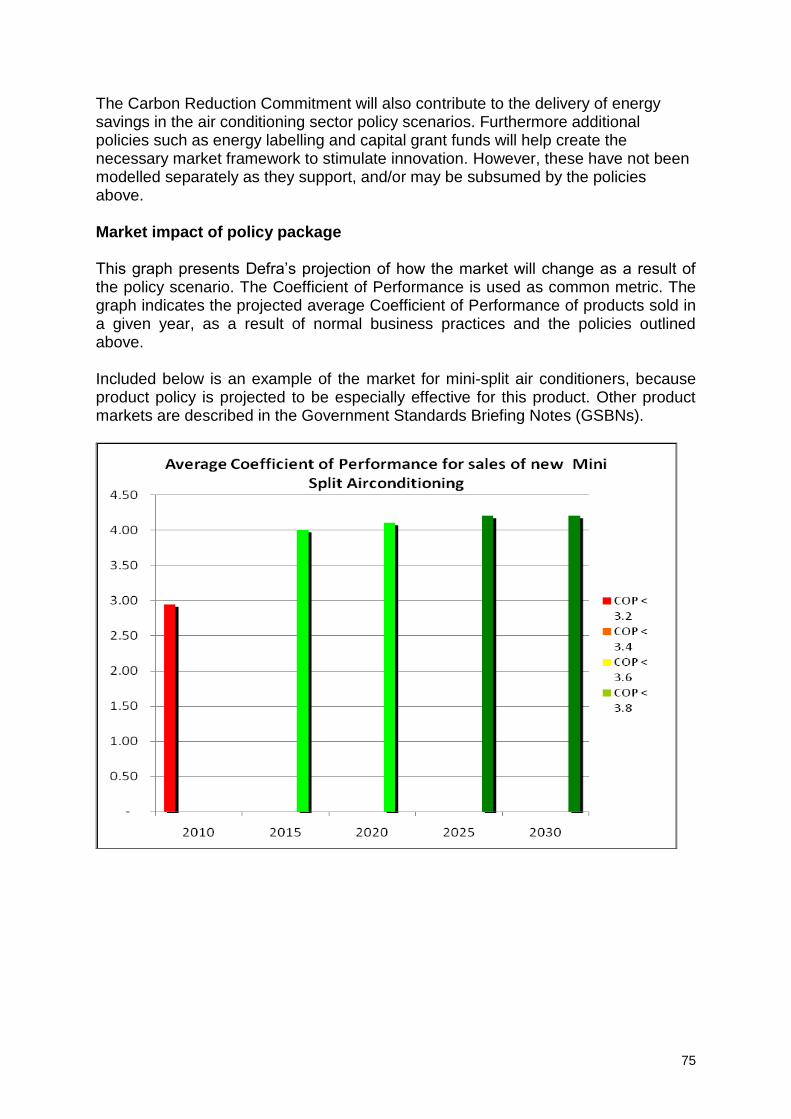
75
The Carbon Reduction Commitment will also contribute to the delivery of energy savings in the air conditioning sector policy scenarios. Furthermore additional policies such as energy labelling and capital grant funds will help create the necessary market framework to stimulate innovation. However, these have not been modelled separately as they support, and/or may be subsumed by the policies above. Market impact of policy package This graph presents Defra‟s projection of how the market will change as a result of the policy scenario. The Coefficient of Performance is used as common metric. The graph indicates the projected average Coefficient of Performance of products sold in a given year, as a result of normal business practices and the policies outlined above. Included below is an example of the market for mini-split air conditioners, because product policy is projected to be especially effective for this product. Other product markets are described in the Government Standards Briefing Notes (GSBNs).
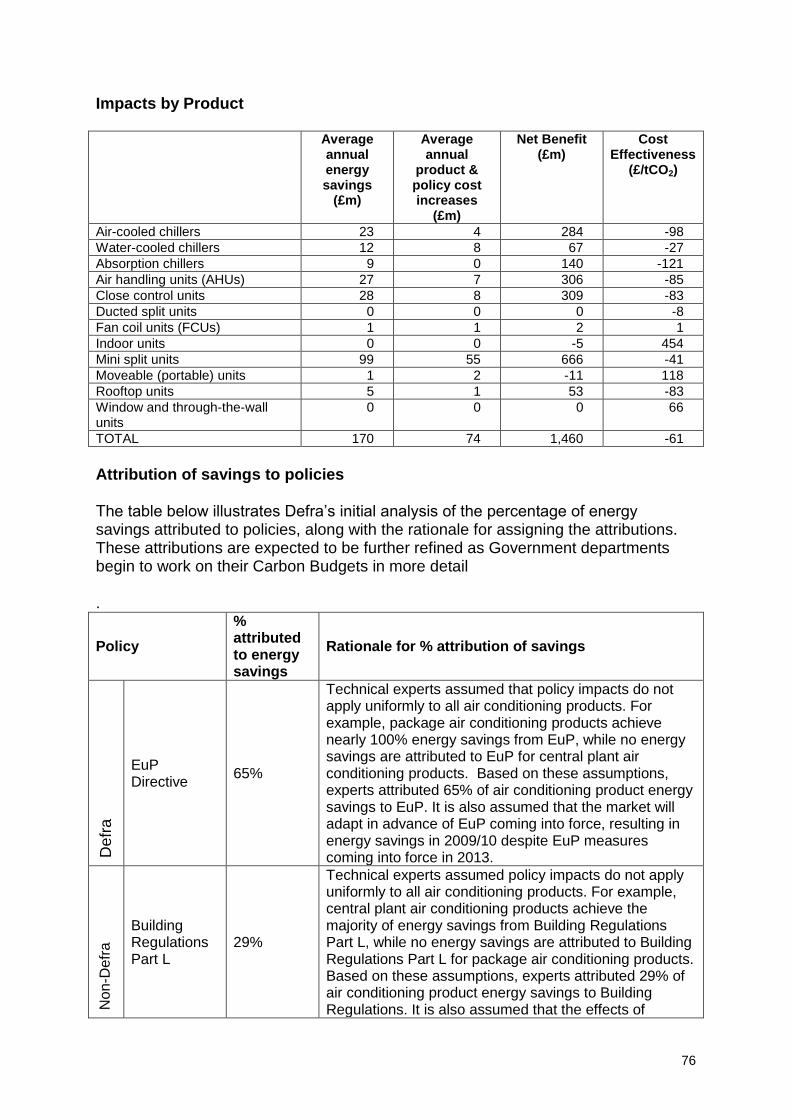
76
Impacts by Product
Average annual energy savings
(£m)
Average annual
product & policy cost increases
(£m)
Net Benefit (£m)
Cost Effectiveness
(£/tCO2)
Air-cooled chillers 23 4 284 -98
Water-cooled chillers 12 8 67 -27
Absorption chillers 9 0 140 -121
Air handling units (AHUs) 27 7 306 -85
Close control units 28 8 309 -83
Ducted split units 0 0 0 -8
Fan coil units (FCUs) 1 1 2 1
Indoor units 0 0 -5 454
Mini split units 99 55 666 -41
Moveable (portable) units 1 2 -11 118
Rooftop units 5 1 53 -83
Window and through-the-wall units
0 0 0 66
TOTAL 170 74 1,460 -61
Attribution of savings to policies The table below illustrates Defra‟s initial analysis of the percentage of energy savings attributed to policies, along with the rationale for assigning the attributions. These attributions are expected to be further refined as Government departments begin to work on their Carbon Budgets in more detail .
Policy
% attributed to energy savings
Rationale for % attribution of savings
Defr
a
EuP Directive
65%
Technical experts assumed that policy impacts do not apply uniformly to all air conditioning products. For example, package air conditioning products achieve nearly 100% energy savings from EuP, while no energy savings are attributed to EuP for central plant air conditioning products. Based on these assumptions, experts attributed 65% of air conditioning product energy savings to EuP. It is also assumed that the market will adapt in advance of EuP coming into force, resulting in energy savings in 2009/10 despite EuP measures coming into force in 2013.
No
n-D
efr
a
Building Regulations Part L
29%
Technical experts assumed policy impacts do not apply uniformly to all air conditioning products. For example, central plant air conditioning products achieve the majority of energy savings from Building Regulations Part L, while no energy savings are attributed to Building Regulations Part L for package air conditioning products. Based on these assumptions, experts attributed 29% of air conditioning product energy savings to Building Regulations. It is also assumed that the effects of

77
Building Regulations will be revised upwards from 2010.
ECA 6%
ECAs are assumed to impact only the top 15-25% most efficient products on the market. Experts assumed ECAs to have minimal impact on smaller, cheaper air conditioning products such as package air conditioning units. ECAs significantly impact air cooled and water cooled chillers only, thus accounting for 6% of air conditioning product savings. It is also assumed that ECA criteria will be revised periodically to reflect technology development and qualifying products.
Policy Impacts Split (in accordance with the LCTP) The following table splits out policy impacts in three different ways: by the carbon budget area in which the savings are projected to occur, by Defra product policies and other policies
(Defra and Non-Defra) and by attribution of savings to carbon budget packages.
Annual CO2 emissions in 2009 (MtCO2)
Annual CO2 emission savings at 2020 (MtCO2)
Traded Non-
Traded Traded
Non-Traded
GS savings within sectors of the economy
Non-Energy Intensive Business Package (NEIB) (CRC)
1.24 0.00 0.22 0.00
Energy Intensive Business Package (EIB) (CCA)
0.06 0.00 0.01 0.00
Unconstrained (Other)
4.59 0.00 0.83 0.00
Total 5.88 0.00 1.07 0.00
Policy split
Defra 3.82 0.00 0.70 0.00
Non-Defra 2.06 0.00 0.37 0.00
Total 5.88 0.00 1.07 0.00
Attribution of impacts within packages
Product Policy Savings (unconstrained)
3.82 0.00 0.70 0.00
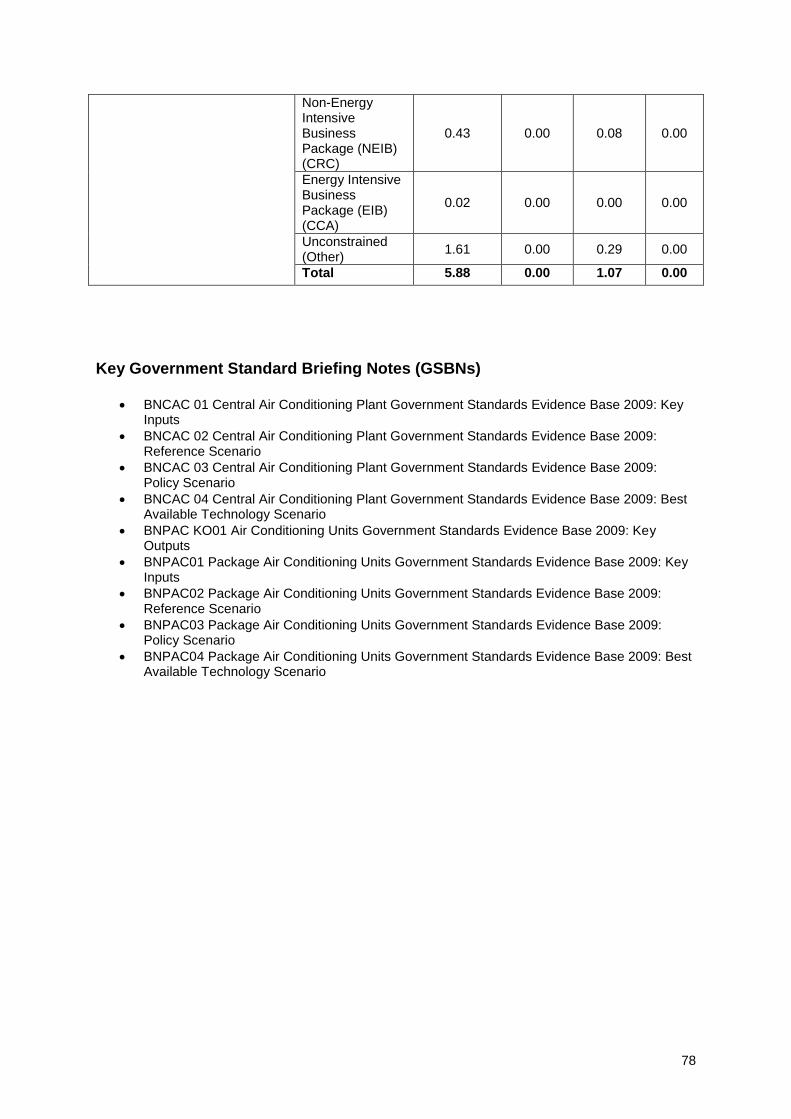
78
Non-Energy Intensive Business Package (NEIB) (CRC)
0.43 0.00 0.08 0.00
Energy Intensive Business Package (EIB) (CCA)
0.02 0.00 0.00 0.00
Unconstrained (Other)
1.61 0.00 0.29 0.00
Total 5.88 0.00 1.07 0.00
Key Government Standard Briefing Notes (GSBNs)
BNCAC 01 Central Air Conditioning Plant Government Standards Evidence Base 2009: Key Inputs
BNCAC 02 Central Air Conditioning Plant Government Standards Evidence Base 2009: Reference Scenario
BNCAC 03 Central Air Conditioning Plant Government Standards Evidence Base 2009: Policy Scenario
BNCAC 04 Central Air Conditioning Plant Government Standards Evidence Base 2009: Best Available Technology Scenario
BNPAC KO01 Air Conditioning Units Government Standards Evidence Base 2009: Key Outputs
BNPAC01 Package Air Conditioning Units Government Standards Evidence Base 2009: Key Inputs
BNPAC02 Package Air Conditioning Units Government Standards Evidence Base 2009: Reference Scenario
BNPAC03 Package Air Conditioning Units Government Standards Evidence Base 2009: Policy Scenario
BNPAC04 Package Air Conditioning Units Government Standards Evidence Base 2009: Best Available Technology Scenario
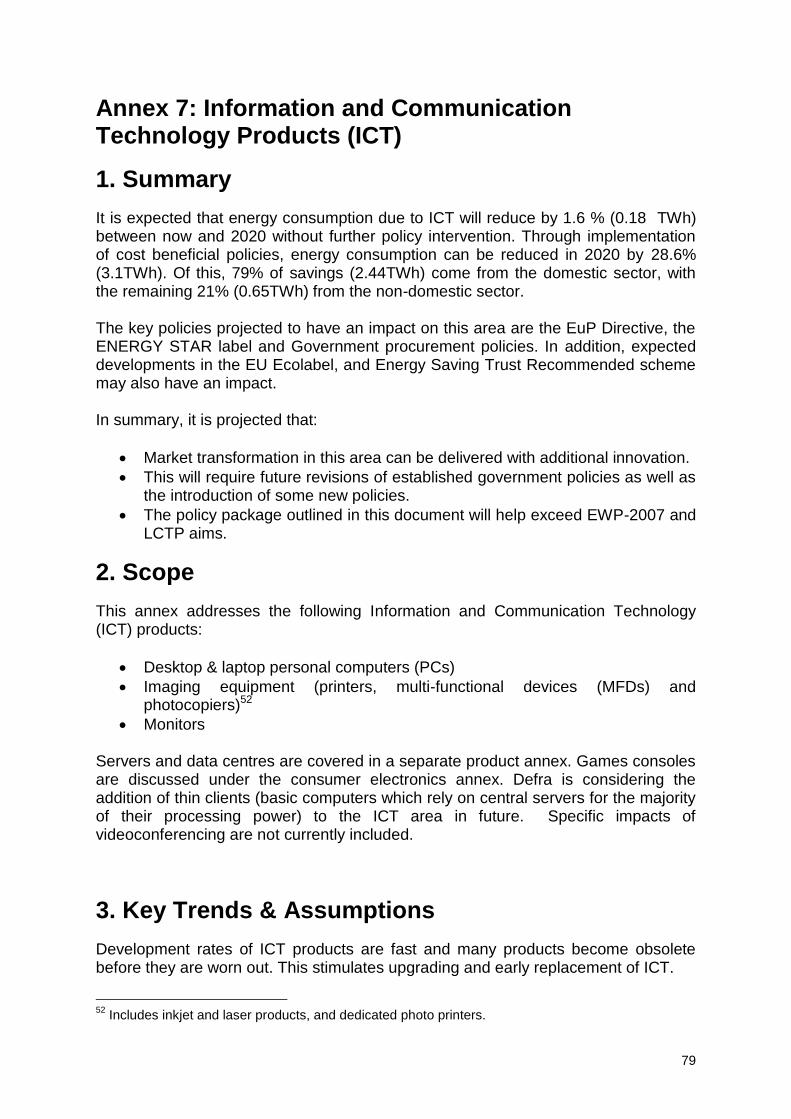
79
Annex 7: Information and Communication Technology Products (ICT)
1. Summary
It is expected that energy consumption due to ICT will reduce by 1.6 % (0.18 TWh) between now and 2020 without further policy intervention. Through implementation of cost beneficial policies, energy consumption can be reduced in 2020 by 28.6% (3.1TWh). Of this, 79% of savings (2.44TWh) come from the domestic sector, with the remaining 21% (0.65TWh) from the non-domestic sector. The key policies projected to have an impact on this area are the EuP Directive, the ENERGY STAR label and Government procurement policies. In addition, expected developments in the EU Ecolabel, and Energy Saving Trust Recommended scheme may also have an impact. In summary, it is projected that:
Market transformation in this area can be delivered with additional innovation.
This will require future revisions of established government policies as well as the introduction of some new policies.
The policy package outlined in this document will help exceed EWP-2007 and LCTP aims.
2. Scope
This annex addresses the following Information and Communication Technology (ICT) products:
Desktop & laptop personal computers (PCs)
Imaging equipment (printers, multi-functional devices (MFDs) and photocopiers)52
Monitors
Servers and data centres are covered in a separate product annex. Games consoles are discussed under the consumer electronics annex. Defra is considering the addition of thin clients (basic computers which rely on central servers for the majority of their processing power) to the ICT area in future. Specific impacts of videoconferencing are not currently included.
3. Key Trends & Assumptions
Development rates of ICT products are fast and many products become obsolete before they are worn out. This stimulates upgrading and early replacement of ICT.
52
Includes inkjet and laser products, and dedicated photo printers.

80
Desktop & Laptop PCs At present, most in-use energy in ICT is consumed by desktop PCs (5.29TWh). Desktop and laptop PCs represent the largest proportion of ICT stock and will continue to have a dominant share going forward, although there will be a transition away from desktop PCs towards laptop PCs. Domestic laptop PC stock is expected to almost triple by 2020 to become the dominant type of domestic PC. This results in a corresponding decrease in energy consumption of desktop PCs and strongly influences the slight decrease in energy consumption of ICT overall. Imaging Equipment Sales are moving away from dedicated printers, copiers and faxes towards multi-functional devices (MFDs). There is also a trend toward colour printing. The high energy consumption of imaging equipment, particularly that of laser (thermal53) printers and MFDs means that imaging devices are expected to continue to dominate non-domestic ICT energy consumption through to 2020. No significant changes are expected in the energy consumption of domestic imaging products. Monitors Cathode Ray Tube (CRT) monitors have given way to Liquid Crystal Display (LCD) monitors. It is expected that monitors will follow similar technology trends to televisions, though the transition to new technologies for monitors is likely to lag behind TVs. The number of monitors is very dependent on the number of PCs. Allowance is made in the energy calculation for increasing screen sizes, efficiency improvements and increasing stringency of ENERGY STAR. It is assumed that monitors will be LCD or equivalent, compliant with increasing efficiency requirements. Transition to Organic Light Emitting Diode displays (OLEDs) has not yet been accounted for as it is not clear at what point these will take up a significant proportion of the monitor market. Product convergence across product groupings There are trends toward convergence of product functionalities, whereby a game console for example may have functions that would traditionally be found in a personal computer or DVD player. Conversely, there are also trends to expand the number of product types into niches such as netbooks and tablets and create new use patterns. The energy impacts of increased product convergence/expansion into the future cannot be accounted for with any degree of certainty, as there are so many directions this may take (positive or negative energy impacts).54
53
Thermal (TEC) printers are generally laser-based, non thermal (OM) printers are generally inkjet based. For full definitions,
please see the printer pages of www.energystar.org 54
Defra is currently undertaking a study to understand how products are used, and can adapt models to
convergence/expansion trends as these become clearer.

81
Modelling inputs in Non-Domestic Sector and Domestic Sector
Stock (‘000) Sales (‘000) Average life expectancy
(years)55
Usage in most energy consuming power
mode56 57(hours / year)
2009 2020 2009 2020 2009 2020 2009 2020
Non-Domestic Sector58
Desktop PC 13,054 9,484 3,183 2,543 4.0 4.0 1,960 1,827
Laptop PC 12,173 21,426 5,678 8,722 2.5 2.5 1,786 1,631
Monitors 19,278 23,679 5,254 6,033 4.0 4.0 1,920 1,920
Imaging Equipment (Non-Thermal)
8,463 10,977 2,116 2,434 4.5 4.5 592 582
Imaging Equipment (Thermal)
5,844 8,544 1,067 1,329 6.5 6.5 50
59
(weeks a year, all modes)
50 (weeks a year,
all modes)
Total Non-Domestic
58,812 74,110 17,298 21,061 4.0* 3.9* 1,687* 1,588*
Domestic Sector
Desktop PC 12,973 7,994 2,242 1,471 4.5 4.5 3,085 4,528
Laptop PC 13,016 34,060 5,443 10,115 3.5 3.5 2,029 3,059
Monitors 16,952 26,334 3,828 5,643 5.0 5.0 2,361 2,806
Imaging Equipment (Non-Thermal)
21,034 31,934 4,938 7,267 4.5 4.5 274 285
Imaging Equipment (Thermal)
1,355 2,219 292 395 5.5 5.9 11.3
(weeks a year, all modes)
11.3 (weeks a year,
all modes)
Total Domestic
65,330 102,54
1 16,744 24,891 4.4* 4.3* 1,754* 2,227*
Total ICT 124,142
176,651
34,042 45,952 4.2* 4.1* 1,828* 2,086*
* Figures not totals, but sales weighted averages. Totals may differ due to rounding.
4. Policy Impacts
The following two graphs show the Government‟s projections for energy use by the ICT products addressed in the domestic and non-domestic sectors.
55
The environmental impacts of longer or shorter lifetimes for ICT equipment in non domestic environments is a complex
consideration. The case for early refreshment will depend upon the balance of impacts in the different life cycle stages for the products being bought and replaced. Due to this variability, the analysis does not currently take this factor into account as a distinct consideration. 56
Most energy consuming modes: (on) idle for PCs, on for monitors, on-ready for non thermal imaging. 57
Further detail on usage data, across all modes and products, can be found in Key Input Government Standards Briefing Notes (GSBNs) 58
These numbers present our best available evidence. Defra recognises, however, that the total energy demand projected as a result of bottom-up calculations based on these input numbers leads to an overestimation of non-domestic electricity demand, and has scaled down all non-domestic electricity consumption accordingly. 59
ENERGY STAR ® assumes weekly usage cycles for printers taking into account the various modes of operation. Printers
assumed to run 50 of these cycles per year.

82
Total projected energy consumption of ICT products
Domestic
Non-Domestic
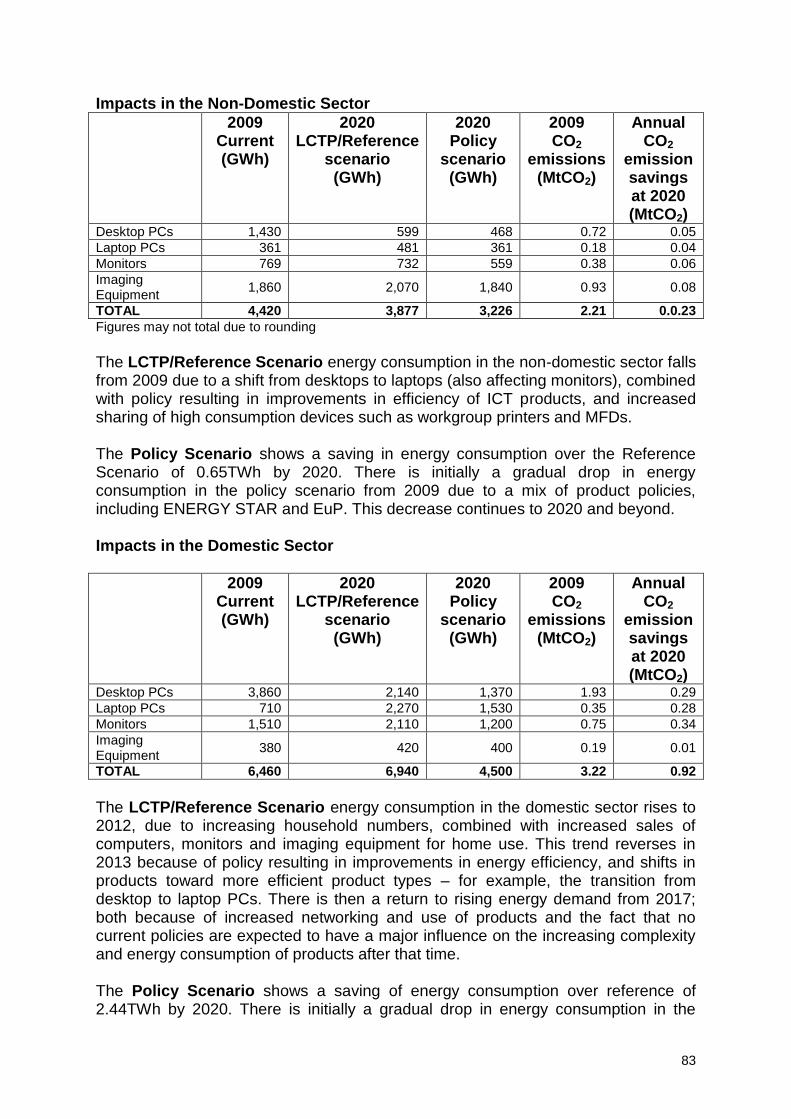
83
Impacts in the Non-Domestic Sector
2009 Current (GWh)
2020 LCTP/Reference
scenario (GWh)
2020 Policy
scenario (GWh)
2009 CO2
emissions (MtCO2)
Annual CO2
emission savings at 2020 (MtCO2)
Desktop PCs 1,430 599 468 0.72 0.05
Laptop PCs 361 481 361 0.18 0.04
Monitors 769 732 559 0.38 0.06
Imaging Equipment
1,860 2,070 1,840 0.93 0.08
TOTAL 4,420 3,877 3,226 2.21 0.0.23
Figures may not total due to rounding
The LCTP/Reference Scenario energy consumption in the non-domestic sector falls from 2009 due to a shift from desktops to laptops (also affecting monitors), combined with policy resulting in improvements in efficiency of ICT products, and increased sharing of high consumption devices such as workgroup printers and MFDs. The Policy Scenario shows a saving in energy consumption over the Reference Scenario of 0.65TWh by 2020. There is initially a gradual drop in energy consumption in the policy scenario from 2009 due to a mix of product policies, including ENERGY STAR and EuP. This decrease continues to 2020 and beyond. Impacts in the Domestic Sector
2009 Current (GWh)
2020 LCTP/Reference
scenario (GWh)
2020 Policy
scenario (GWh)
2009 CO2
emissions (MtCO2)
Annual CO2
emission savings at 2020 (MtCO2)
Desktop PCs 3,860 2,140 1,370 1.93 0.29
Laptop PCs 710 2,270 1,530 0.35 0.28
Monitors 1,510 2,110 1,200 0.75 0.34
Imaging Equipment
380 420 400 0.19 0.01
TOTAL 6,460 6,940 4,500 3.22 0.92
The LCTP/Reference Scenario energy consumption in the domestic sector rises to 2012, due to increasing household numbers, combined with increased sales of computers, monitors and imaging equipment for home use. This trend reverses in 2013 because of policy resulting in improvements in energy efficiency, and shifts in products toward more efficient product types – for example, the transition from desktop to laptop PCs. There is then a return to rising energy demand from 2017; both because of increased networking and use of products and the fact that no current policies are expected to have a major influence on the increasing complexity and energy consumption of products after that time. The Policy Scenario shows a saving of energy consumption over reference of 2.44TWh by 2020. There is initially a gradual drop in energy consumption in the

84
policy scenario from 2009 due to a mix of product policies including ENERGY STAR and EuP. This decrease continues to 2020 and beyond, although policies become less certain. The Best Available Technology (BAT) Scenario in the domestic and non-domestic sectors shows savings in energy consumption over reference of 2.73TWh in 2009, rising to 6.99TWh by 2020. It assumes that current best-practice products60 are adopted in 2010, and that by 2030 all products purchased meet the then current best-product-in-class levels. Policy Descriptions Policies in the reference and policy scenarios for both the non-domestic and domestic ICT modelling are the same, with the exception of Government Procurement which does not affect the domestic sector and the Energy Savings Recommended (ESTR) label which is focused mainly on the domestic sector. Further information is available in the Monitor and Computer GSBNs. LCTP/Reference Scenario Policy Scenario
Energy Using Product Directive (EuP)
Standby Consumption
Agreed in 2008. This measure will reduce "off mode" (plugged-in) consumption of a number of ICT products to 1.0W by 2010 and to below 0.5W by 2013 (based upon assumptions regarding how the requirements will be interpreted).
External Power Supply Units (ePSU)
Agreed in 2009. Two tiers in 2010 and 2012 set mandatory improvements in external power supply power efficiency will impact on-mode efficiency and no-load power. Improvements in external power supply energy efficiency will impact some laptops and non-thermal imaging products. Improved efficiency power supplies will result in reduced energy consumption across all modes of operation (accounted for in general laptop and non-thermal imaging power consumption trend).
Additional third revision in 2015 increases minimum efficiency to achieve then current BAT efficiency. Slight improvements in standby power (when the ePSU is plugged in but not actively charging, often termed no-load power). Again, improvements in external power supply energy efficiency will impact some laptops and non-thermal imaging products. Improved efficiency power supplies will result in reduced energy consumption across all modes of operation (accounted for in general laptop and non-thermal imaging power consumption trend).
Computers and Monitors
Expected to be agreed in 2010 and enter into force by 2012. EuP mandatory requirements are based on previous ENERGY STAR specifications, as new specifications are introduced. Monitor requirements take a similar form to requirements developed for TVs (but slightly more stringent).
Imaging Equipment
As computers, although voluntary agreement mechanisms are envisaged.
60
Where a best practice product is one sitting in the top 10% of ICT products, when ranked by energy efficiency.

85
LCTP/Reference Scenario Policy Scenario
ENERGY STAR
Imaging Equipment
Agreed in 2008. Tier II of the revised ENERGY STAR specification agreed in July 2009.
Further revised specifications anticipated every four years at a similar level of ambition to that aspired to historically (usually to equal the top performing 25% of the market) Revisions are anticipated in 2013, 2017 and 2021. Specifications will vary widely between product types and speeds.
Displays (Monitors)
Agreed in 2009. Revised ENERGY STAR specification due to come into force October 2009.
Further revised specifications anticipated every four years at a similar level of ambition to that aspired to historically (usually to equal the top performing 25% of the market) Assumed improvement on previous specification of revisions:
Mode On Sleep off
2013 10% 0% 50%
2017 10% 0% 0%
2021 5% 0% 0%
Computers Agreed in 2008. Revised ENERGY STAR specification agreed in July 2009.
Further revised specifications anticipated every four years at a similar level of ambition to that aspired to historically (usually to qualify the top performing around 25% of the market) Assumed improvement on previous specification of revisions for desktop PCs:
Assumed improvement on previous specification of revisions for laptop PCs:
On Sleep off
2013 10% 5% 70%
2017 5% 5% 0%
2021 5% 5% 0%
On Sleep off
2013 5% 5% 49%
2017 5% 5% 0%
2021 5% 5% 0%
Government Procurement & Green IT Strategy (Non-Domestic sector only)
2007 revised ENERGY STAR agreement requires government procurement to ENERGY STAR efficiency levels or equivalent (without prejudice to Community and national law and economic criteria) – strengthening the influence of ENERGY STAR 2007 and 2009 specifications. 2009 Quick Win specifications. Specifications currently agreed for computers, monitors and imaging equipment with reference to the most up to date ENERGY STAR specification.
Procurement in line with future ENERGY STAR specifications as minimum (unless uneconomical61). Product energy consumption to be highlighted as a key part of the most economically advantageous calculations made during the Award stage of contracts. Annual update of Government sustainable procurement specifications is expected. 20% additional market compliance to ENERGY STAR assumed as a result.
61
In order for ENERGY STAR to apply, certain economic criteria must be satisfied at the time of purchase (simply stated - the purchase price must be proportional and the equipment must be fit for the purpose for which it is intended).
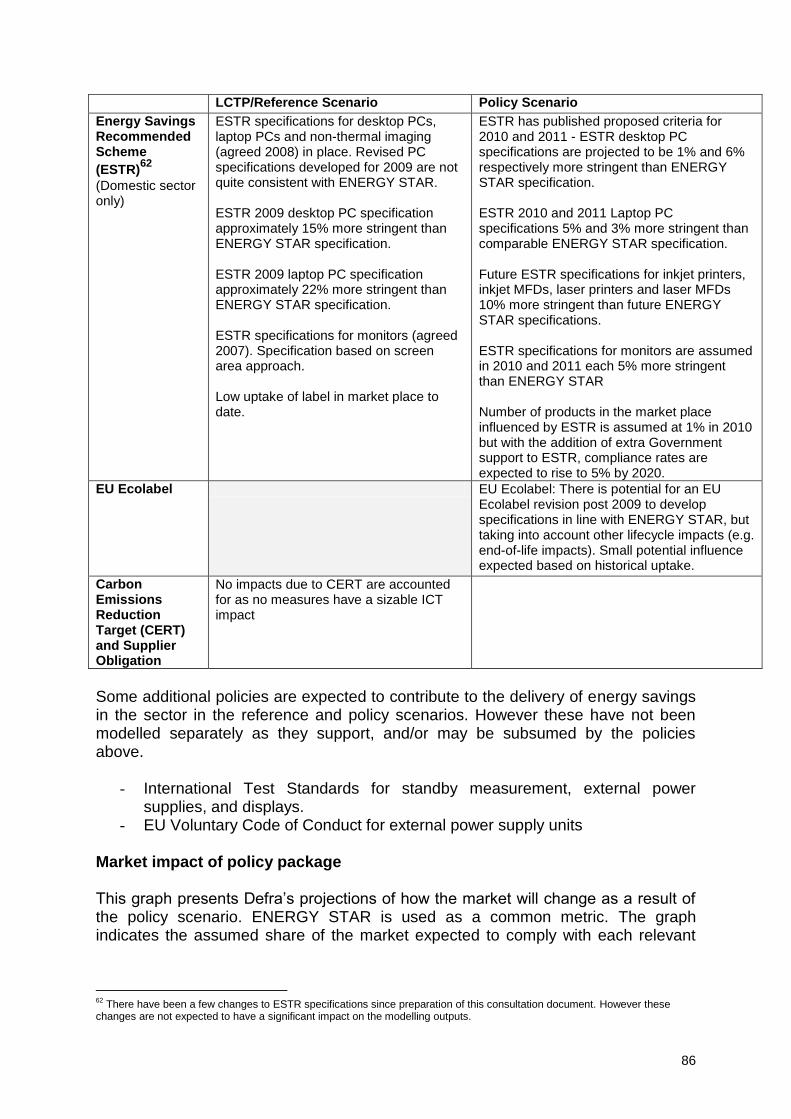
86
LCTP/Reference Scenario Policy Scenario
Energy Savings Recommended Scheme
(ESTR)62
(Domestic sector only)
ESTR specifications for desktop PCs, laptop PCs and non-thermal imaging (agreed 2008) in place. Revised PC specifications developed for 2009 are not quite consistent with ENERGY STAR. ESTR 2009 desktop PC specification approximately 15% more stringent than ENERGY STAR specification. ESTR 2009 laptop PC specification approximately 22% more stringent than ENERGY STAR specification. ESTR specifications for monitors (agreed 2007). Specification based on screen area approach. Low uptake of label in market place to date.
ESTR has published proposed criteria for 2010 and 2011 - ESTR desktop PC specifications are projected to be 1% and 6% respectively more stringent than ENERGY STAR specification. ESTR 2010 and 2011 Laptop PC specifications 5% and 3% more stringent than comparable ENERGY STAR specification. Future ESTR specifications for inkjet printers, inkjet MFDs, laser printers and laser MFDs 10% more stringent than future ENERGY STAR specifications. ESTR specifications for monitors are assumed in 2010 and 2011 each 5% more stringent than ENERGY STAR Number of products in the market place influenced by ESTR is assumed at 1% in 2010 but with the addition of extra Government support to ESTR, compliance rates are expected to rise to 5% by 2020.
EU Ecolabel EU Ecolabel: There is potential for an EU Ecolabel revision post 2009 to develop specifications in line with ENERGY STAR, but taking into account other lifecycle impacts (e.g. end-of-life impacts). Small potential influence expected based on historical uptake.
Carbon Emissions Reduction Target (CERT) and Supplier Obligation
No impacts due to CERT are accounted for as no measures have a sizable ICT impact
Some additional policies are expected to contribute to the delivery of energy savings in the sector in the reference and policy scenarios. However these have not been modelled separately as they support, and/or may be subsumed by the policies above.
- International Test Standards for standby measurement, external power supplies, and displays.
- EU Voluntary Code of Conduct for external power supply units Market impact of policy package This graph presents Defra‟s projections of how the market will change as a result of the policy scenario. ENERGY STAR is used as a common metric. The graph indicates the assumed share of the market expected to comply with each relevant
62
There have been a few changes to ESTR specifications since preparation of this consultation document. However these changes are not expected to have a significant impact on the modelling outputs.
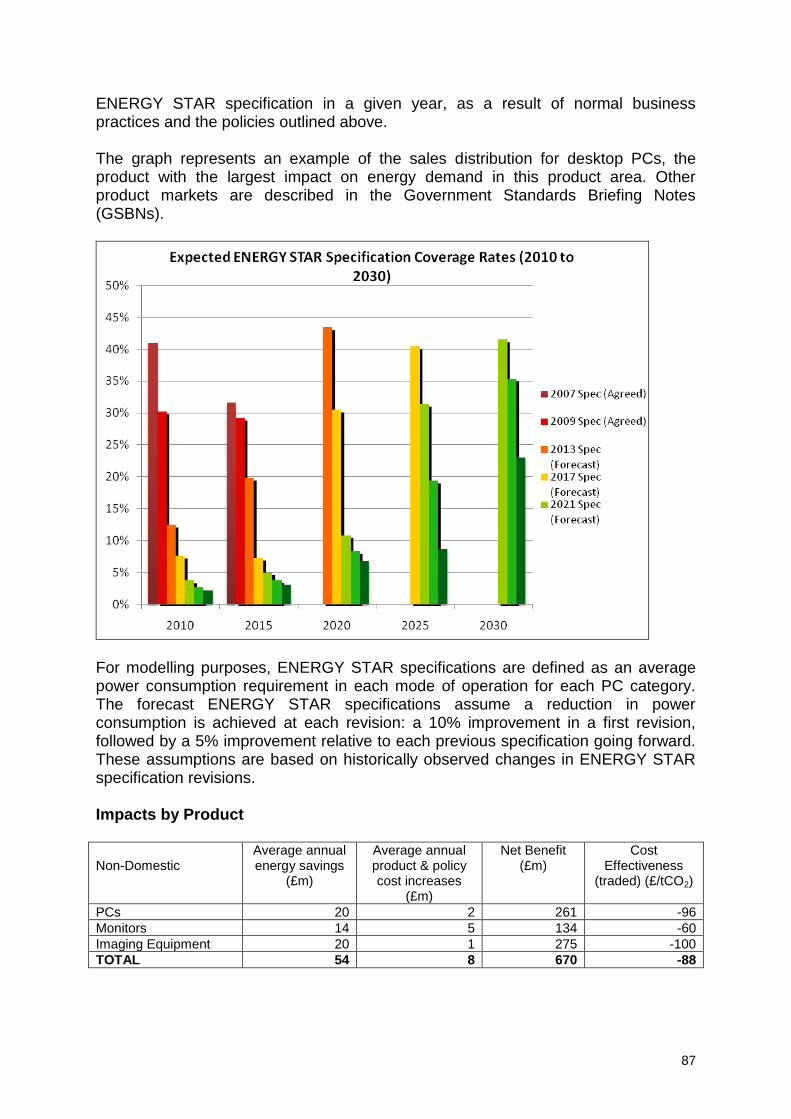
87
ENERGY STAR specification in a given year, as a result of normal business practices and the policies outlined above. The graph represents an example of the sales distribution for desktop PCs, the product with the largest impact on energy demand in this product area. Other product markets are described in the Government Standards Briefing Notes (GSBNs).
For modelling purposes, ENERGY STAR specifications are defined as an average power consumption requirement in each mode of operation for each PC category. The forecast ENERGY STAR specifications assume a reduction in power consumption is achieved at each revision: a 10% improvement in a first revision, followed by a 5% improvement relative to each previous specification going forward. These assumptions are based on historically observed changes in ENERGY STAR specification revisions. Impacts by Product Non-Domestic
Average annual energy savings
(£m)
Average annual product & policy cost increases
(£m)
Net Benefit (£m)
Cost Effectiveness
(traded) (£/tCO2)
PCs 20 2 261 -96
Monitors 14 5 134 -60
Imaging Equipment 20 1 275 -100
TOTAL 54 8 670 -88
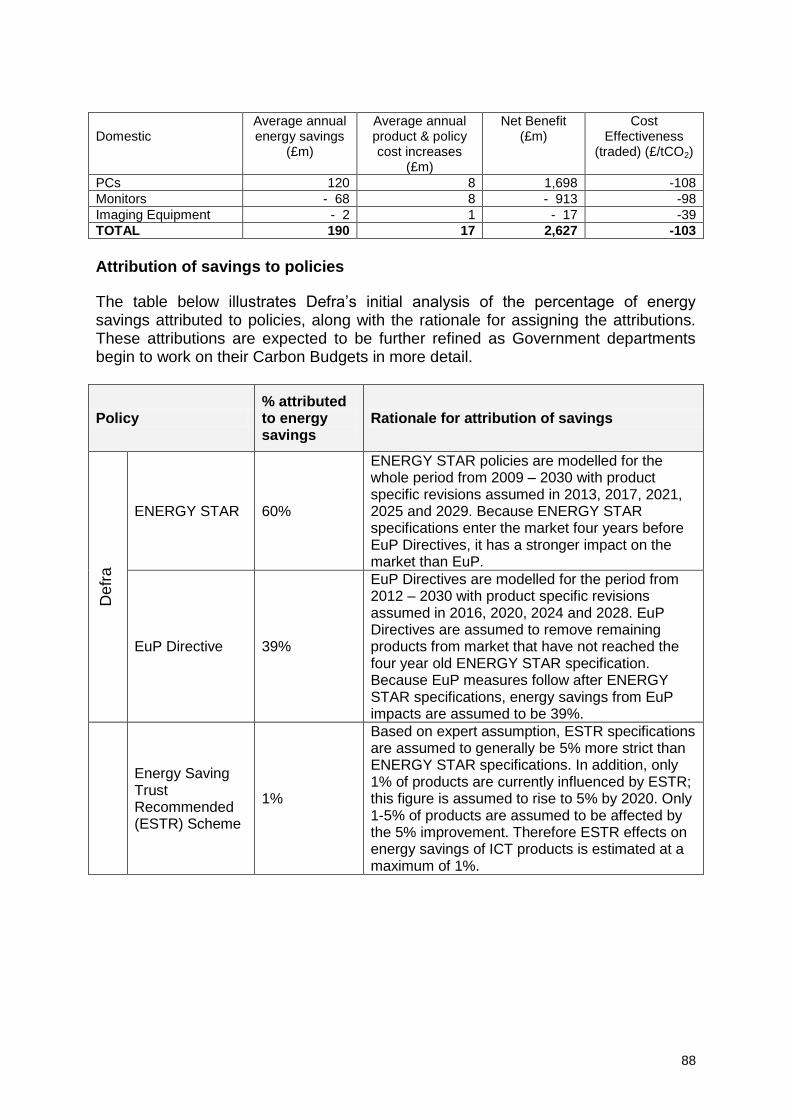
88
Domestic
Average annual energy savings
(£m)
Average annual product & policy cost increases
(£m)
Net Benefit (£m)
Cost Effectiveness
(traded) (£/tCO2)
PCs 120 8 1,698 -108
Monitors - 68 8 - 913 -98
Imaging Equipment - 2 1 - 17 -39
TOTAL 190 17 2,627 -103 Attribution of savings to policies
The table below illustrates Defra‟s initial analysis of the percentage of energy savings attributed to policies, along with the rationale for assigning the attributions. These attributions are expected to be further refined as Government departments begin to work on their Carbon Budgets in more detail.
Policy % attributed to energy savings
Rationale for attribution of savings
Defr
a
ENERGY STAR 60%
ENERGY STAR policies are modelled for the whole period from 2009 – 2030 with product specific revisions assumed in 2013, 2017, 2021, 2025 and 2029. Because ENERGY STAR specifications enter the market four years before EuP Directives, it has a stronger impact on the market than EuP.
EuP Directive 39%
EuP Directives are modelled for the period from 2012 – 2030 with product specific revisions assumed in 2016, 2020, 2024 and 2028. EuP Directives are assumed to remove remaining products from market that have not reached the four year old ENERGY STAR specification. Because EuP measures follow after ENERGY STAR specifications, energy savings from EuP impacts are assumed to be 39%.
Energy Saving Trust Recommended (ESTR) Scheme
1%
Based on expert assumption, ESTR specifications are assumed to generally be 5% more strict than ENERGY STAR specifications. In addition, only 1% of products are currently influenced by ESTR; this figure is assumed to rise to 5% by 2020. Only 1-5% of products are assumed to be affected by the 5% improvement. Therefore ESTR effects on energy savings of ICT products is estimated at a maximum of 1%.
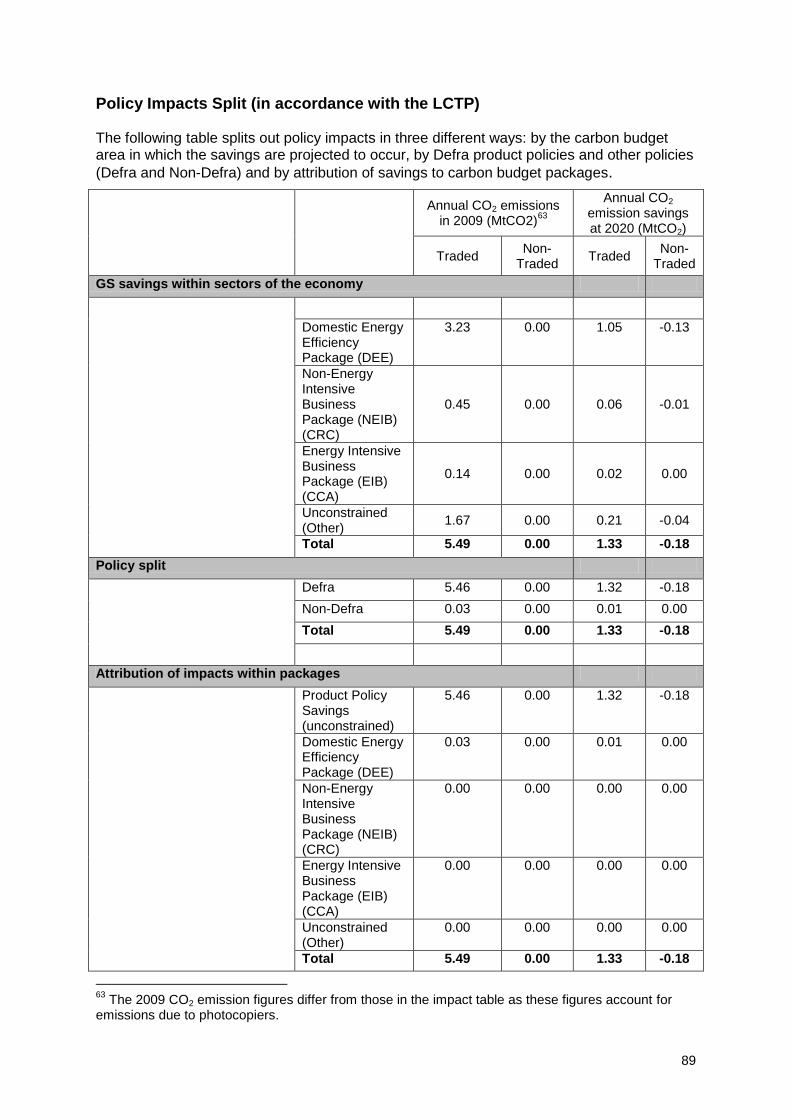
89
Policy Impacts Split (in accordance with the LCTP) The following table splits out policy impacts in three different ways: by the carbon budget area in which the savings are projected to occur, by Defra product policies and other policies
(Defra and Non-Defra) and by attribution of savings to carbon budget packages.
Annual CO2 emissions in 2009 (MtCO2)
63
Annual CO2 emission savings at 2020 (MtCO2)
Traded Non-
Traded Traded
Non-Traded
GS savings within sectors of the economy
Domestic Energy Efficiency Package (DEE)
3.23 0.00 1.05 -0.13
Non-Energy Intensive Business Package (NEIB) (CRC)
0.45 0.00 0.06 -0.01
Energy Intensive Business Package (EIB) (CCA)
0.14 0.00 0.02 0.00
Unconstrained (Other)
1.67 0.00 0.21 -0.04
Total 5.49 0.00 1.33 -0.18
Policy split
Defra 5.46 0.00 1.32 -0.18
Non-Defra 0.03 0.00 0.01 0.00
Total 5.49 0.00 1.33 -0.18
Attribution of impacts within packages
Product Policy Savings (unconstrained)
5.46 0.00 1.32 -0.18
Domestic Energy Efficiency Package (DEE)
0.03 0.00 0.01 0.00
Non-Energy Intensive Business Package (NEIB) (CRC)
0.00 0.00 0.00 0.00
Energy Intensive Business Package (EIB) (CCA)
0.00 0.00 0.00 0.00
Unconstrained (Other)
0.00 0.00 0.00 0.00
Total 5.49 0.00 1.33 -0.18
63
The 2009 CO2 emission figures differ from those in the impact table as these figures account for emissions due to photocopiers.

90
Key Government Standard Briefing Notes (GSBNs) Imaging Equipment / Key Inputs; Reference scenario; Policy scenario; BAT scenario
Computers / Key Inputs; Reference scenario; Policy scenario; BAT scenario
Monitors / Key Inputs; Reference scenario; Policy scenario; BAT scenario
Information & Communication Technology / Key Outputs
91
Annex 8: Motors & Circulators
1. Summary It is expected that energy consumption due to motors will increase by 1.0% (0.83TWh) between now and 2020 without further policy intervention. Through implementation of cost beneficial policies, energy consumption in 2020 will decrease by 0.5% (0.4TWh). All savings are within the non-domestic sector64. For circulators, it is expected that energy consumption will reduce by 38% (1.83 TWh) between now and 2020 without further policy intervention. Through implementation of cost beneficial policies, energy consumption in 2020 can be reduced by 1% (0.03 TWh). Of this, 78% of savings (0.02 TWh) come from the domestic sector, with the remaining 22% (0.06 TWh) from the non-domestic sector.65 The key policies projected to have an impact on the motors area are the Energy-using Products (EuP) Directive (motors and circulators), Enhanced Capital Allowances (ECA) (motors), Quick Wins (motors), Carbon Emissions Reduction Target (CERT) (circulators) and Building Regulations66 (motors & circulators). In addition, possible developments in the Carbon Reduction Commitment (CRC), Energy Saving Trust Recommended scheme (ESTR) and ECA may also have an impact on circulators. In summary, it is projected that:
Market transformation in this area can be delivered via minor technical modifications of products.
This will require future revisions of established government policies.
The policy package outlined in this document will contribute below the average required to meet EWP-2007 and LCTP aims.
2. Scope This annex addresses the following products:
AC induction motors (1-400 kW) and their controls
Permanent magnet motors
Other motors
Domestic circulators (small standalone & boiler-integrated)
Non-domestic circulators (large standalone)
64
The motor figures presented in this Annex differ from the presentation of figures in the cross-cutting summary due to (a) figures here relate to non-domestic motor driven systems as a whole and therefore do not account for overlaps in consumption and savings with other product areas (e.g. commercial refrigeration and air-conditioning) and (b) the non-domestic motors figures in the cross-cutting summary include non-domestic circulators. 65
The circulators figures presented in this Annex differ from the presentation of figures in the cross-cutting summary due to (a) domestic circulators are included in the domestic heating figures in the cross-cutting summary and (b) the non-domestic circulators figures have been included with non-domestic motors in the cross-cutting summary. 66
Part L (in England and Wales and equivalent in Scotland and Northern Ireland)
92
There is an additional annex providing an overview of motor-driven systems which addresses pumps and fans.
3. Key Trends & Assumptions Electric Motors Electric motors are the core of motor-driven systems within industrial and commercial installations. Their applications are diverse and include: fans, pumps, air compressors, refrigeration and air-conditioning compressors, lifts, conveyors and machine tools. The energy used in the motors in these applications is covered in this Annex. However, in terms of savings, only performance standards of the motors themselves are considered here – there are further savings available through performance standards on motor-driven systems e.g. fans and pumps which are not considered here. The majority of motors are in the size range 1-400kW; these account for around 89% of all energy used in motors. Motors outside of this range (representing around 11% of motor energy consumption) are beyond the scope of this Annex. Relatively small gains in motor efficiency can result in large savings due to the widespread use of motors. There are further significant gains to be made through the use of variable speed controls. AC induction motors (1-400 kW) AC induction motors currently dominate the sector, representing 92% of motor stock67. Motor efficiencies68 in this group are approaching their theoretical limits at the top end of the market (IE3). AC induction motors are designed for fixed speed operation, but system efficiencies can be improved by applying these motors with variable speed drives (VSDs) which can result in energy savings of 20% to over 50% in suitable variable speed applications (e.g. fans and pumps). It is expected that the move towards the use of VSDs in appropriate applications will be maintained into the future but that the stock of AC induction motors will start to decline as alternative motor technologies (e.g. permanent magnet motors) start to take market share. Permanent magnet motors Permanent magnet motors are produced in a similar size range to AC induction motors, but are much more efficient due to their design and offer comparable or improved performance relative to AC induction motors. These motors currently represent less than 1% of the stock. Other motors This group of motors represents around 8% of motor stock, and includes various types of DC motors and other AC motors such as synchronous AC motors. This group of motors is generally used in applications where energy efficiency is a lesser
67
This refers to the stock of motors in the 1-400 kW size range, as throughout the Annex 68
Motor efficiency is defined using the IEC 60034-30:2008 standard energy classes, which range from IE1 (low efficiency) to IE4 (high efficiency).

93
priority. Therefore, no significant savings are expected in this area and stock numbers are not expected to change significantly, into the future. Circulators Circulators are a specific motor-driven pump application, typically used in central heating systems. The motors used in circulators are of a different design to those used in other motor-driven systems and are therefore not covered by motor specific policies. Energy use in circulators is highly dependent on usage patterns, hence savings are available through reducing the load on the circulators (e.g. by improved building insulation resulting in a lower demand on the heating system) in addition to efficiency improvements within the product itself. Domestic circulators All boilers require at least one circulator and so domestic circulator stock levels are intrinsically linked to the boiler stock, which is expected to rise in line with increasing household numbers. Historically in the UK, standalone circulators have been used in domestic applications (currently 55% of the domestic stock); however, there is a growing trend towards boiler-integrated circulators, which are expected to account for 48% of stock by 2020. Boiler-integrated circulators are less efficient than their standalone counterparts, which is a further reason for increased energy consumption in this area. Non-domestic circulators Large standalone circulators are used in non-domestic heating systems. Stock levels are linked to the number of commercial and industrial premises and are expected to increase at 1.4% per annum to 2020, reflecting an increase in the non-domestic building stock. However, due to a shift towards more efficient technologies energy use is expected to fall further into the future. Although stock levels are lower than domestic circulators (large standalone circulators representing 8% of total stock), non-domestic circulators are larger and hence are more energy intensive (accounting for a third of the total energy consumption of circulators). Modelling inputs69 Motors
Stock (‘000) Sales (‘000) Average life expectancy
(years)
Usage (hours / year)
2009 2020 2009 2020 2009 2020 2009 2020
AC induction motors
10,600 11,300 880 930 12.5 12.5 2,120 2,120
Permanent magnet
2 156 2 32 12.5 12.5 2,120 2,120
69
These numbers present our best available evidence. Defra recognises, however, that the total energy demand
projected as a result of bottom-up calculations based on these input numbers leads to an overestimation of non-domestic electricity demand, and has scaled down all non-domestic electricity consumption accordingly.
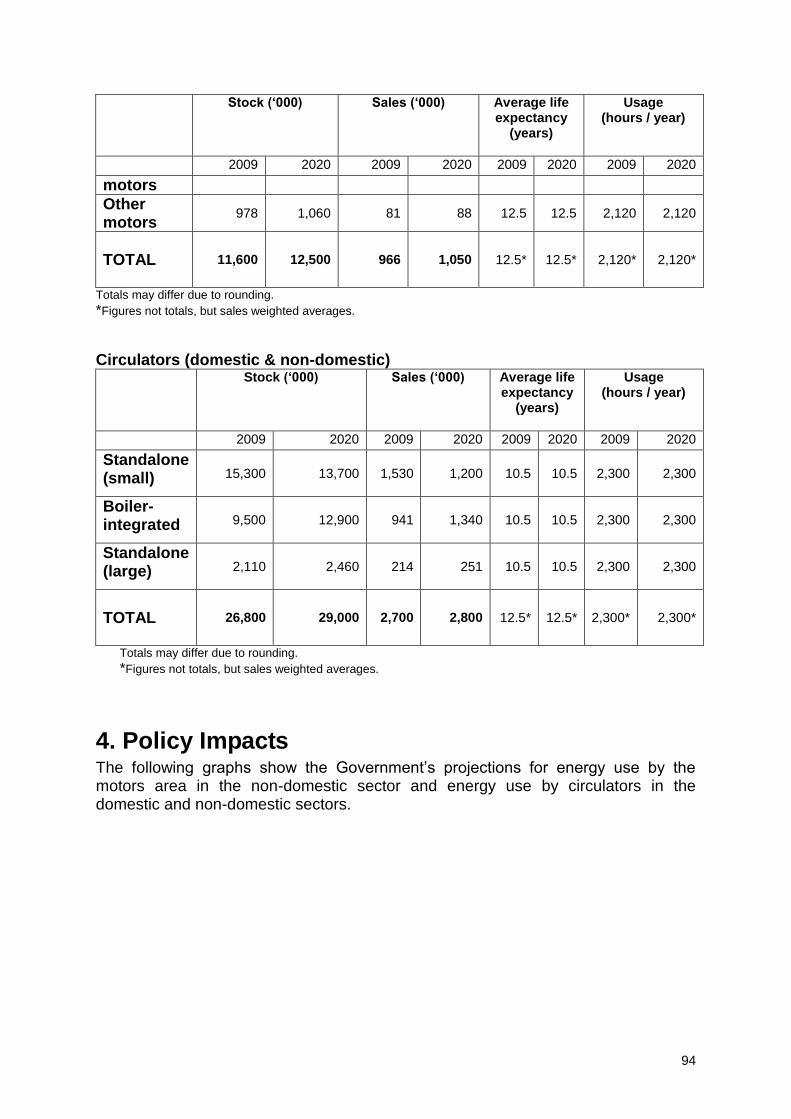
94
Stock (‘000) Sales (‘000) Average life expectancy
(years)
Usage (hours / year)
2009 2020 2009 2020 2009 2020 2009 2020
motors
Other motors
978 1,060 81 88 12.5 12.5 2,120 2,120
TOTAL
11,600 12,500 966 1,050 12.5* 12.5* 2,120* 2,120*
Totals may differ due to rounding.
*Figures not totals, but sales weighted averages.
Circulators (domestic & non-domestic)
Stock (‘000) Sales (‘000) Average life expectancy
(years)
Usage (hours / year)
2009 2020 2009 2020 2009 2020 2009 2020
Standalone (small)
15,300
13,700 1,530 1,200 10.5 10.5 2,300 2,300
Boiler-integrated 9,500 12,900
941
1,340 10.5 10.5 2,300 2,300
Standalone (large) 2,110 2,460
214
251
10.5 10.5 2,300 2,300
TOTAL
26,800 29,000 2,700 2,800 12.5* 12.5* 2,300* 2,300*
Totals may differ due to rounding.
*Figures not totals, but sales weighted averages.
4. Policy Impacts
The following graphs show the Government‟s projections for energy use by the motors area in the non-domestic sector and energy use by circulators in the domestic and non-domestic sectors.
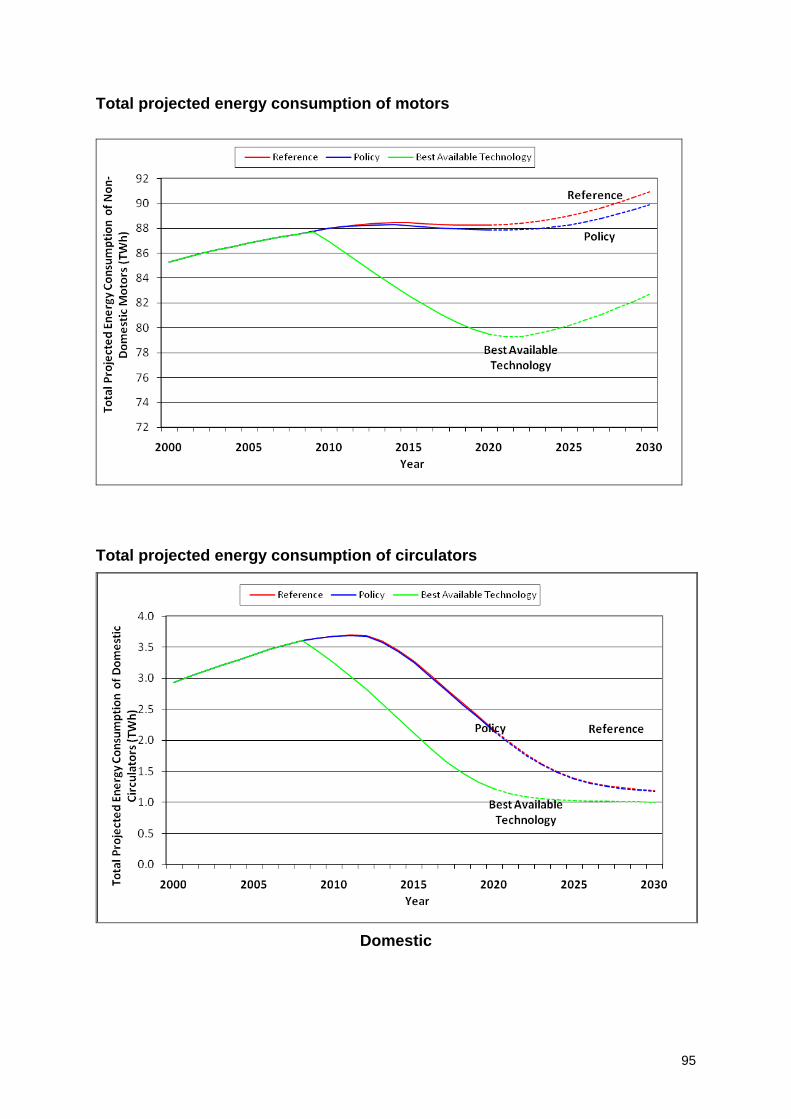
95
Total projected energy consumption of motors
Total projected energy consumption of circulators
Domestic

96
Non-Domestic
Impacts – Motors 2009
Current (GWh)
2020 LCTP/Reference
Scenario (GWh)
2020 Policy
Scenario (GWh)
2009 CO2
emissions (MtCO2)
Annual CO2 emission savings at
2020 (MtCO2)
Motors 86,700 87,490 87,100 43.33 0.17
Domestic Circulators 3,650 2,160 2,140
1.83 0.01
Non Domestic Circulators
1,120 780 774 0.56 0.00
Total 91,400 90,400 90,000 45.72 0.18
* The minimal savings attributed to motors and circulators is due to moving the effects of EuP from the Policy Scenario to the Reference Scenario to account for the final Commission Regulation (EC) No 641/2009 being published on 22
nd July 2009. The impacts of the measure have been re-assessed
since the document was published in December 2009, and the figures published here are deemed to be a more accurate reflection of savings under the current Policy Scenario.
The LCTP/Reference Scenario energy consumption in the non-domestic sector has risen due to an overall increase in motor and circulator stock levels, driven by an increase in building stock. For non-domestic circulators this trend reverses in 2013 because of a general trend towards the adoption of more efficient technologies. Energy consumption also rises in the domestic sector due to increased stock (linked to the rise in household numbers and notably a shift to boiler-integrated circulators which are more energy intensive). This trend reverses in 2012 because of a general shift towards more efficient technology (permanent magnet motors). The Policy Scenario shows a saving in energy consumption over the Reference Scenario of 0.40 TWh by 2020. There is rise in energy consumption in the Policy
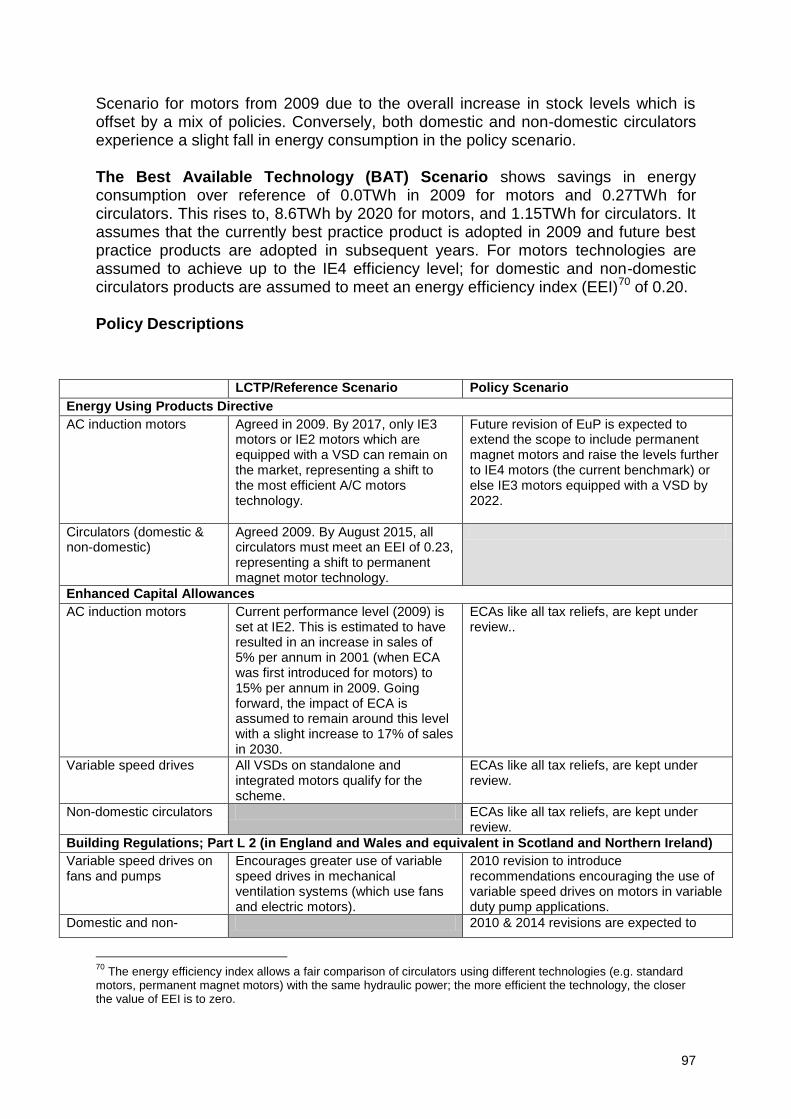
97
Scenario for motors from 2009 due to the overall increase in stock levels which is offset by a mix of policies. Conversely, both domestic and non-domestic circulators experience a slight fall in energy consumption in the policy scenario. The Best Available Technology (BAT) Scenario shows savings in energy consumption over reference of 0.0TWh in 2009 for motors and 0.27TWh for circulators. This rises to, 8.6TWh by 2020 for motors, and 1.15TWh for circulators. It assumes that the currently best practice product is adopted in 2009 and future best practice products are adopted in subsequent years. For motors technologies are assumed to achieve up to the IE4 efficiency level; for domestic and non-domestic circulators products are assumed to meet an energy efficiency index (EEI)70 of 0.20. Policy Descriptions
70
The energy efficiency index allows a fair comparison of circulators using different technologies (e.g. standard motors, permanent magnet motors) with the same hydraulic power; the more efficient the technology, the closer the value of EEI is to zero.
LCTP/Reference Scenario Policy Scenario
Energy Using Products Directive
AC induction motors Agreed in 2009. By 2017, only IE3 motors or IE2 motors which are equipped with a VSD can remain on the market, representing a shift to the most efficient A/C motors technology.
Future revision of EuP is expected to extend the scope to include permanent magnet motors and raise the levels further to IE4 motors (the current benchmark) or else IE3 motors equipped with a VSD by 2022.
Circulators (domestic & non-domestic)
Agreed 2009. By August 2015, all circulators must meet an EEI of 0.23, representing a shift to permanent magnet motor technology.
Enhanced Capital Allowances
AC induction motors Current performance level (2009) is set at IE2. This is estimated to have resulted in an increase in sales of 5% per annum in 2001 (when ECA was first introduced for motors) to 15% per annum in 2009. Going forward, the impact of ECA is assumed to remain around this level with a slight increase to 17% of sales in 2030.
ECAs like all tax reliefs, are kept under review..
Variable speed drives All VSDs on standalone and integrated motors qualify for the scheme.
ECAs like all tax reliefs, are kept under review.
Non-domestic circulators ECAs like all tax reliefs, are kept under review.
Building Regulations; Part L 2 (in England and Wales and equivalent in Scotland and Northern Ireland)
Variable speed drives on fans and pumps
Encourages greater use of variable speed drives in mechanical ventilation systems (which use fans and electric motors).
2010 revision to introduce recommendations encouraging the use of variable speed drives on motors in variable duty pump applications.
Domestic and non- 2010 & 2014 revisions are expected to

98
Some additional policies are expected to contribute to the delivery of energy savings in the sector in the Reference and Policy Scenarios. However, these have not been modelled separately as they support, and/or may be subsumed by the policies above.
- Carbon Reduction Commitment (CRC) for non-domestic circulators - Quick Wins (Government purchasing) - IEC motor labelling standards - Measures influencing usage and behaviours to encourage lower energy use
Market impact of policy package
This graph presents Defra‟s projections of how the market will change as a result of the Policy Scenario. For motors, the IE1 - IE4 efficiency levels according to the standard IEC 60034-30:2008 are used as the common metric, and for circulators the Energy Efficiency Index (EEI) is used. The graphs indicate the share of the market expected to comply with relevant metric in a given year, as a result of normal business practices and the policies outlined above.
domestic circulators increase building insulation requirements, thereby reducing the load on circulators (each revision is estimated to result in a 5% reduction in circulator run hours).
CERT
Domestic circulators CERT 2008-2011: two specific standalone circulator models are supported through CERT, equivalent to an EEI of 0.27. This is estimated to increase sales of these circulators by 25% per annum over this period.
Support for Domestic appliances is reviewed at the end of CERT 2008 – 2011. Assumed: 2011: supports circulators with an EEI of 0.23 2015: uplift qualifying products to EEI of 0.20
Energy Saving Trust Recommended (ESTR) scheme
Domestic circulators ESTR 2011-2020: It is assumed that circulators with an EEI of 0.23 will be endorsed under the ESTR scheme from 2011

99
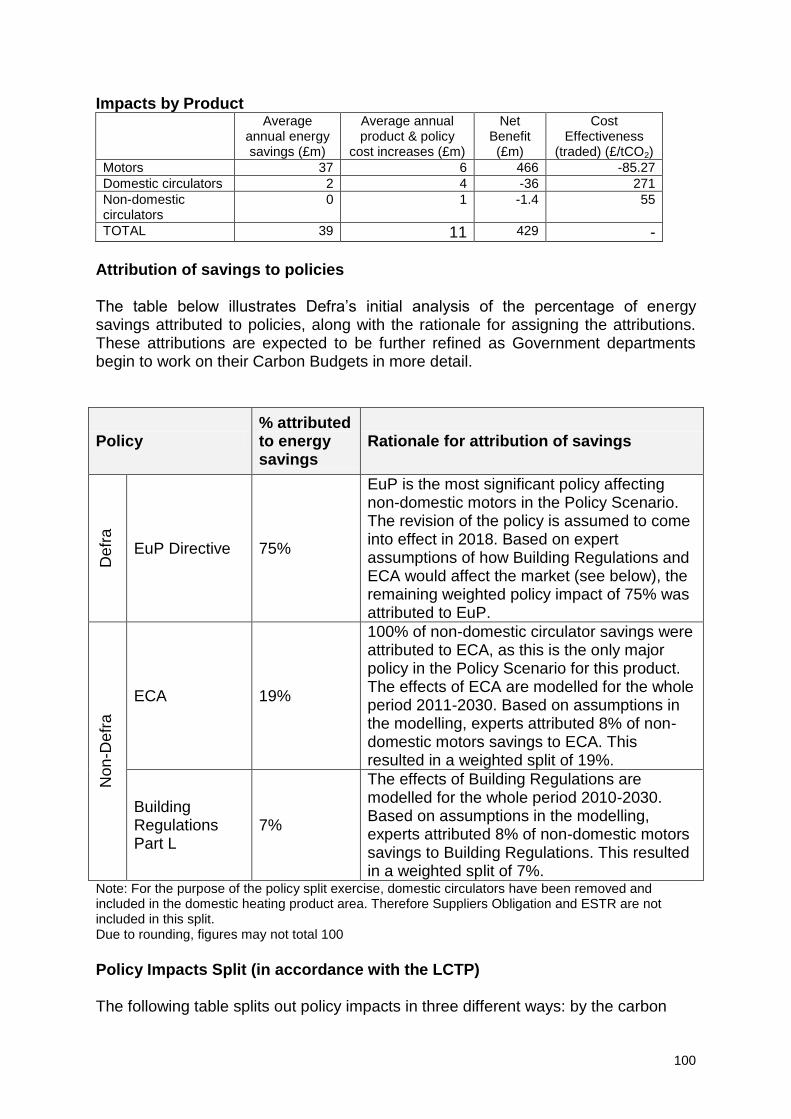
100
Impacts by Product
Average annual energy savings (£m)
Average annual product & policy
cost increases (£m)
Net Benefit (£m)
Cost Effectiveness
(traded) (£/tCO2)
Motors 37 6 466 -85.27 Domestic circulators 2 4 -36 271 Non-domestic circulators
0 1 -1.4 55
TOTAL 39 11 429 -
Attribution of savings to policies The table below illustrates Defra‟s initial analysis of the percentage of energy savings attributed to policies, along with the rationale for assigning the attributions. These attributions are expected to be further refined as Government departments begin to work on their Carbon Budgets in more detail.
Policy % attributed to energy savings
Rationale for attribution of savings
Defr
a
EuP Directive 75%
EuP is the most significant policy affecting non-domestic motors in the Policy Scenario. The revision of the policy is assumed to come into effect in 2018. Based on expert assumptions of how Building Regulations and ECA would affect the market (see below), the remaining weighted policy impact of 75% was attributed to EuP.
Non
-Defr
a
ECA 19%
100% of non-domestic circulator savings were attributed to ECA, as this is the only major policy in the Policy Scenario for this product. The effects of ECA are modelled for the whole period 2011-2030. Based on assumptions in the modelling, experts attributed 8% of non-domestic motors savings to ECA. This resulted in a weighted split of 19%.
Building Regulations Part L
7%
The effects of Building Regulations are modelled for the whole period 2010-2030. Based on assumptions in the modelling, experts attributed 8% of non-domestic motors savings to Building Regulations. This resulted in a weighted split of 7%.
Note: For the purpose of the policy split exercise, domestic circulators have been removed and included in the domestic heating product area. Therefore Suppliers Obligation and ESTR are not included in this split. Due to rounding, figures may not total 100
Policy Impacts Split (in accordance with the LCTP) The following table splits out policy impacts in three different ways: by the carbon
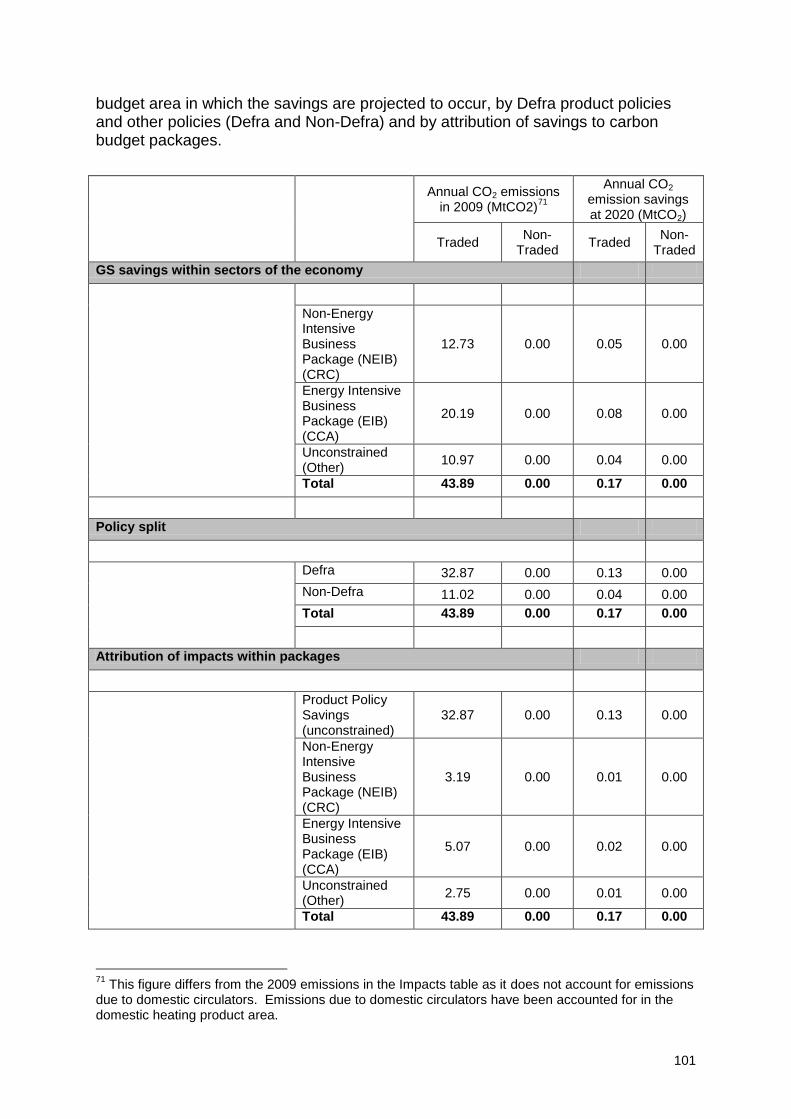
101
budget area in which the savings are projected to occur, by Defra product policies and other policies (Defra and Non-Defra) and by attribution of savings to carbon budget packages.
Annual CO2 emissions in 2009 (MtCO2)
71
Annual CO2 emission savings at 2020 (MtCO2)
Traded Non-
Traded Traded
Non-Traded
GS savings within sectors of the economy
Non-Energy Intensive Business Package (NEIB) (CRC)
12.73 0.00 0.05 0.00
Energy Intensive Business Package (EIB) (CCA)
20.19 0.00 0.08 0.00
Unconstrained (Other)
10.97 0.00 0.04 0.00
Total 43.89 0.00 0.17 0.00
Policy split
Defra 32.87 0.00 0.13 0.00
Non-Defra 11.02 0.00 0.04 0.00
Total 43.89 0.00 0.17 0.00
Attribution of impacts within packages
Product Policy Savings (unconstrained)
32.87 0.00 0.13 0.00
Non-Energy Intensive Business Package (NEIB) (CRC)
3.19 0.00 0.01 0.00
Energy Intensive Business Package (EIB) (CCA)
5.07 0.00 0.02 0.00
Unconstrained (Other)
2.75 0.00 0.01 0.00
Total 43.89 0.00 0.17 0.00
71
This figure differs from the 2009 emissions in the Impacts table as it does not account for emissions due to domestic circulators. Emissions due to domestic circulators have been accounted for in the domestic heating product area.
102
Key Government Standard Briefing Notes (GSBNs)
Motors / Key inputs; Reference Scenario; Policy Scenario; BAT Scenario
Motors / Key Outputs
Circulators / Key inputs; Reference Scenario; Policy Scenario; BAT Scenario
Circulators/ Key Outputs
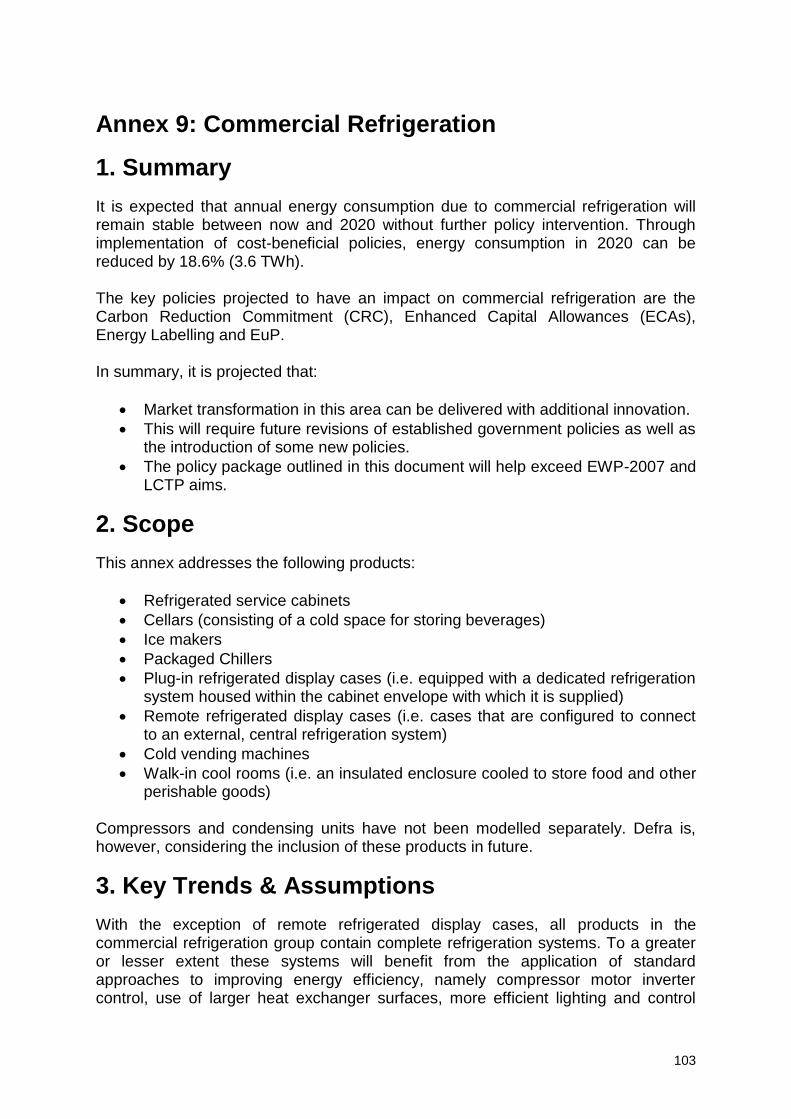
103
Annex 9: Commercial Refrigeration
1. Summary
It is expected that annual energy consumption due to commercial refrigeration will remain stable between now and 2020 without further policy intervention. Through implementation of cost-beneficial policies, energy consumption in 2020 can be reduced by 18.6% (3.6 TWh). The key policies projected to have an impact on commercial refrigeration are the Carbon Reduction Commitment (CRC), Enhanced Capital Allowances (ECAs), Energy Labelling and EuP. In summary, it is projected that:
Market transformation in this area can be delivered with additional innovation.
This will require future revisions of established government policies as well as the introduction of some new policies.
The policy package outlined in this document will help exceed EWP-2007 and LCTP aims.
2. Scope
This annex addresses the following products:
Refrigerated service cabinets
Cellars (consisting of a cold space for storing beverages)
Ice makers
Packaged Chillers
Plug-in refrigerated display cases (i.e. equipped with a dedicated refrigeration system housed within the cabinet envelope with which it is supplied)
Remote refrigerated display cases (i.e. cases that are configured to connect to an external, central refrigeration system)
Cold vending machines
Walk-in cool rooms (i.e. an insulated enclosure cooled to store food and other perishable goods)
Compressors and condensing units have not been modelled separately. Defra is, however, considering the inclusion of these products in future.
3. Key Trends & Assumptions
With the exception of remote refrigerated display cases, all products in the commercial refrigeration group contain complete refrigeration systems. To a greater or lesser extent these systems will benefit from the application of standard approaches to improving energy efficiency, namely compressor motor inverter control, use of larger heat exchanger surfaces, more efficient lighting and control
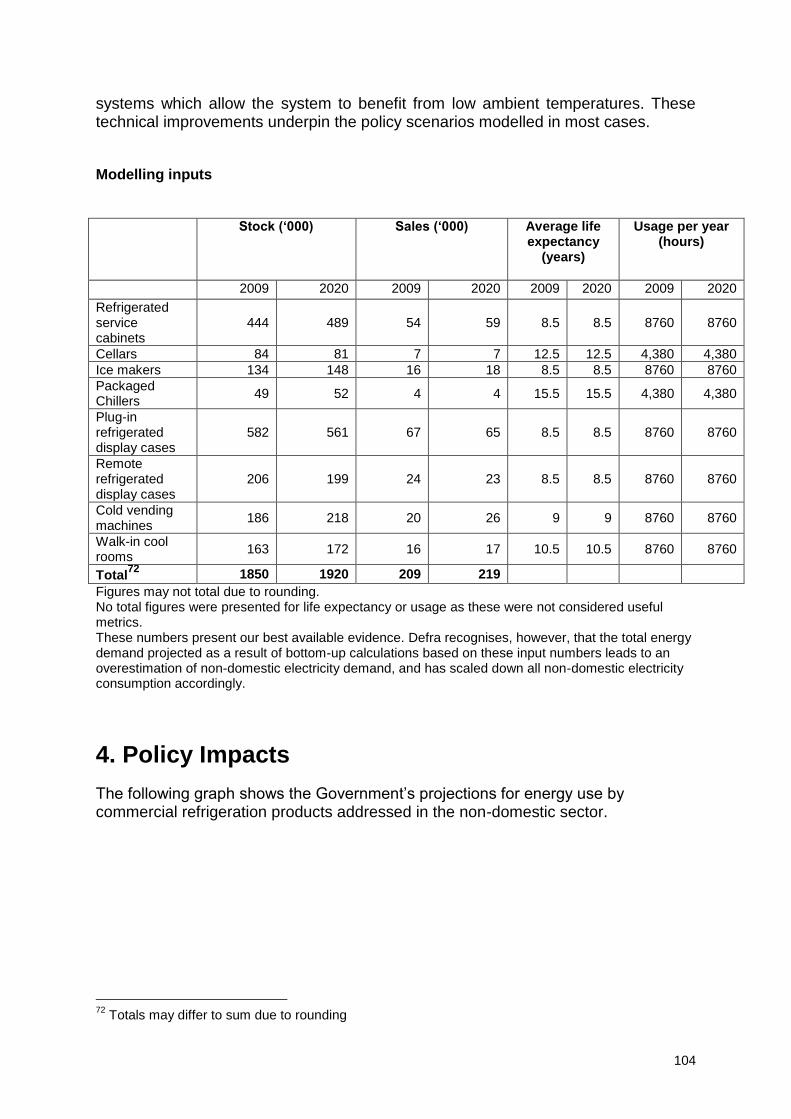
104
systems which allow the system to benefit from low ambient temperatures. These technical improvements underpin the policy scenarios modelled in most cases. Modelling inputs
Stock (‘000) Sales (‘000) Average life expectancy
(years)
Usage per year (hours)
2009 2020 2009 2020 2009 2020 2009 2020
Refrigerated service cabinets
444 489 54 59 8.5 8.5 8760 8760
Cellars 84 81 7 7 12.5 12.5 4,380 4,380
Ice makers 134 148 16 18 8.5 8.5 8760 8760
Packaged Chillers
49 52 4 4 15.5 15.5 4,380 4,380
Plug-in refrigerated display cases
582 561 67 65 8.5 8.5 8760 8760
Remote refrigerated display cases
206 199 24 23 8.5 8.5 8760 8760
Cold vending machines
186 218 20 26 9 9 8760 8760
Walk-in cool rooms
163 172 16 17 10.5 10.5 8760 8760
Total72
1850 1920 209 219
Figures may not total due to rounding. No total figures were presented for life expectancy or usage as these were not considered useful metrics. These numbers present our best available evidence. Defra recognises, however, that the total energy demand projected as a result of bottom-up calculations based on these input numbers leads to an overestimation of non-domestic electricity demand, and has scaled down all non-domestic electricity consumption accordingly.
4. Policy Impacts
The following graph shows the Government‟s projections for energy use by commercial refrigeration products addressed in the non-domestic sector.
72
Totals may differ to sum due to rounding
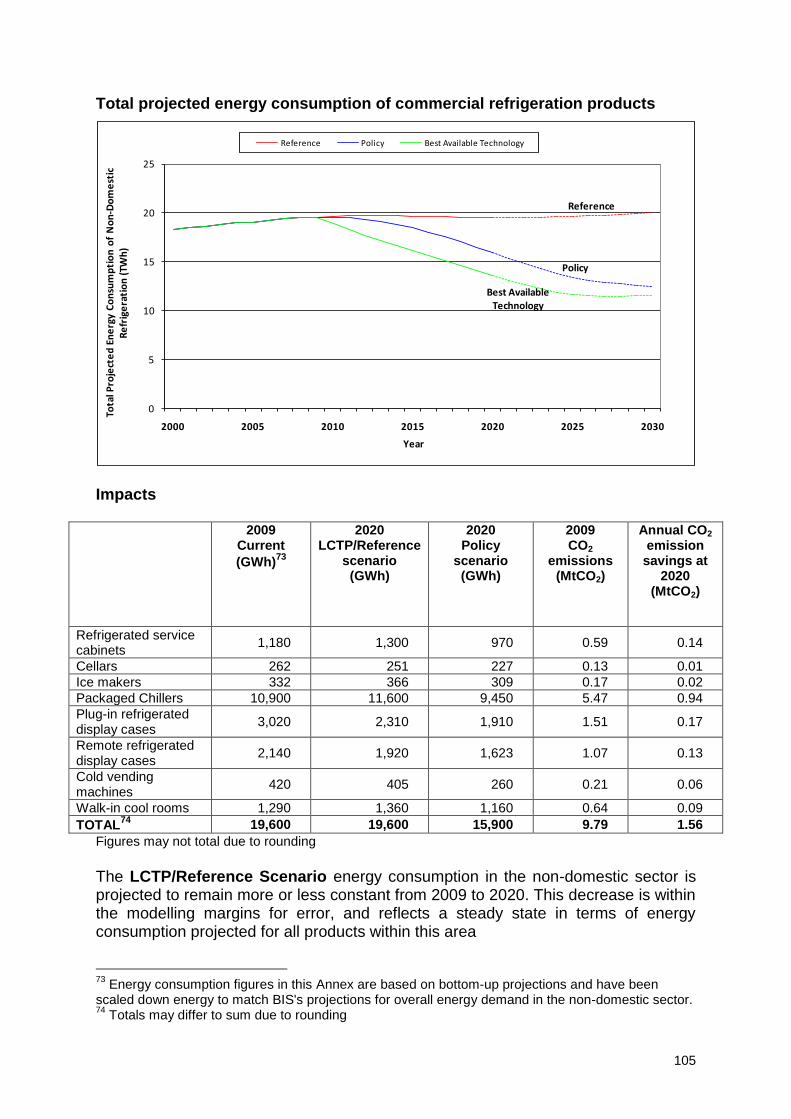
105
Total projected energy consumption of commercial refrigeration products
Reference
Policy
Best Available Technology
0
5
10
15
20
25
2000 2005 2010 2015 2020 2025 2030
Tota
l Pro
ject
ed
En
erg
y C
on
sum
pti
on
of
No
n-D
om
est
ic
Re
frig
era
tio
n (
TWh
)
Year
Reference Policy Best Available Technology
Impacts
2009 Current
(GWh)73
2020 LCTP/Reference
scenario (GWh)
2020 Policy
scenario (GWh)
2009 CO2
emissions (MtCO2)
Annual CO2 emission
savings at 2020
(MtCO2)
Refrigerated service cabinets
1,180 1,300 970 0.59 0.14
Cellars 262 251 227 0.13 0.01
Ice makers 332 366 309 0.17 0.02
Packaged Chillers 10,900 11,600 9,450 5.47 0.94
Plug-in refrigerated display cases
3,020 2,310 1,910 1.51 0.17
Remote refrigerated display cases
2,140 1,920 1,623 1.07 0.13
Cold vending machines
420 405 260 0.21 0.06
Walk-in cool rooms 1,290 1,360 1,160 0.64 0.09
TOTAL74
19,600 19,600 15,900 9.79 1.56
Figures may not total due to rounding
The LCTP/Reference Scenario energy consumption in the non-domestic sector is projected to remain more or less constant from 2009 to 2020. This decrease is within the modelling margins for error, and reflects a steady state in terms of energy consumption projected for all products within this area
73
Energy consumption figures in this Annex are based on bottom-up projections and have been scaled down energy to match BIS's projections for overall energy demand in the non-domestic sector. 74
Totals may differ to sum due to rounding
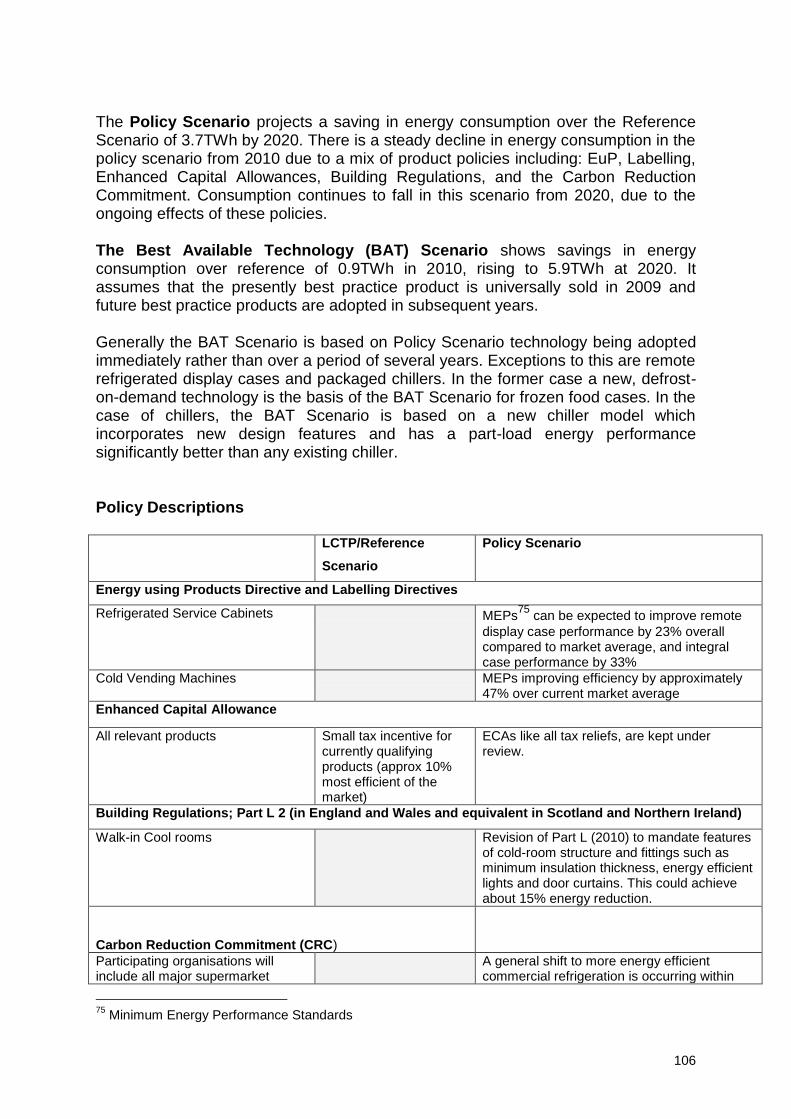
106
The Policy Scenario projects a saving in energy consumption over the Reference Scenario of 3.7TWh by 2020. There is a steady decline in energy consumption in the policy scenario from 2010 due to a mix of product policies including: EuP, Labelling, Enhanced Capital Allowances, Building Regulations, and the Carbon Reduction Commitment. Consumption continues to fall in this scenario from 2020, due to the ongoing effects of these policies. The Best Available Technology (BAT) Scenario shows savings in energy consumption over reference of 0.9TWh in 2010, rising to 5.9TWh at 2020. It assumes that the presently best practice product is universally sold in 2009 and future best practice products are adopted in subsequent years. Generally the BAT Scenario is based on Policy Scenario technology being adopted immediately rather than over a period of several years. Exceptions to this are remote refrigerated display cases and packaged chillers. In the former case a new, defrost-on-demand technology is the basis of the BAT Scenario for frozen food cases. In the case of chillers, the BAT Scenario is based on a new chiller model which incorporates new design features and has a part-load energy performance significantly better than any existing chiller. Policy Descriptions LCTP/Reference
Scenario
Policy Scenario
Energy using Products Directive and Labelling Directives
Refrigerated Service Cabinets MEPs75
can be expected to improve remote
display case performance by 23% overall compared to market average, and integral case performance by 33%
Cold Vending Machines MEPs improving efficiency by approximately 47% over current market average
Enhanced Capital Allowance
All relevant products Small tax incentive for currently qualifying products (approx 10% most efficient of the market)
ECAs like all tax reliefs, are kept under review.
Building Regulations; Part L 2 (in England and Wales and equivalent in Scotland and Northern Ireland)
Walk-in Cool rooms Revision of Part L (2010) to mandate features of cold-room structure and fittings such as minimum insulation thickness, energy efficient lights and door curtains. This could achieve about 15% energy reduction.
Carbon Reduction Commitment (CRC)
Participating organisations will include all major supermarket
A general shift to more energy efficient commercial refrigeration is occurring within
75
Minimum Energy Performance Standards

107
LCTP/Reference
Scenario
Policy Scenario
chains (affecting display cases and cool rooms), large food processing companies (cool-rooms and packaged chillers), and brewery and restaurant chains (cool rooms, cellars, ice makers and refrigerated service cabinets). Public sector participants are likely to include hospital trusts, Local Authorities etc. Consequently all commercial refrigeration product areas could be affected.
the market currently, primarily driven by higher electricity prices and market innovation. Impact of the CRC is therefore thought to be limited in this product area
Market impact of policy package This graph presents Defra‟s projection of how the market will change as a result of the Policy Scenario. The coefficient of performance is used as a common metric. The graph indicates the projected average coefficient of performance of products sold on the market in a given year, as a result of normal business practices and the policies outlined above. Included below is an example of the market for packaged (or process) chillers, the product with the largest impact on energy demand in this product area. The “standard” chiller is assumed to have an Energy Efficiency Ratio (EER) of 3.0 under real operating conditions, and the “efficient” chiller an EER of 5.9 under these conditions. Other product markets are described in the Government Standards Briefing Notes (GSBNs).
Process chillers - expected market penetration
of efficient units
0.00%
20.00%
40.00%
60.00%
80.00%
100.00%
120.00%
2010 2012 2014 2016 2020
Standard
Efficient

108
Impacts by Product
Average annual energy savings (£m)
Average annual product & policy cost increases
(£m)
Net Benefit (£m)
Cost Effectiveness
(£/tCO2)
Refrigerated service cabinets 24 15 134 -31
Cellars 2 1 14 -51
Ice makers 4 1 54 -94
Packaged Chillers 221 1 3,341 -120
Plug-in refrigerated display cases 30 8 335 -86
Remote refrigerated display cases 22 6 250 -84
Cold vending machines 10 1 148 -117
Walk-in cool rooms 16 10 88 -26
TOTAL76
329 43 4,364 -103
Attribution of savings to policies The table below illustrates Defra‟s initial analysis of the percentage of energy savings attributed to policies, along with the rationale for assigning the attributions. These attributions are expected to be further refined as Government departments begin to work on their Carbon Budgets in more detail.
Policy % attributed to energy savings
Rationale for attribution of savings
De
fra
EuP Directive 77%
EuP is the most significant policy affecting commercial refrigeration products in the Policy Scenario. EuP is assumed to come into effect between 2011 and 2012 for applicable commercial refrigeration products. Based on expert assumptions of how ECA and Building Regulations would affect the market (see below), the remaining weighted policy impact of 77% was attributed to EuP.
Non
-Defr
a
ECA 17%
Expert assumptions attributed energy savings to ECA based on expected savings from current and future revisions. The effects of ECA are modelled as constant for the whole period 2011-2030 as it is assumed that the ECA scheme will be revised upwards in the future to ensure that allowances apply to only the top 15-25% of the market. ECA impacts are assumed to be less for products with low capital costs.
76
Totals may differ from sum due to rounding
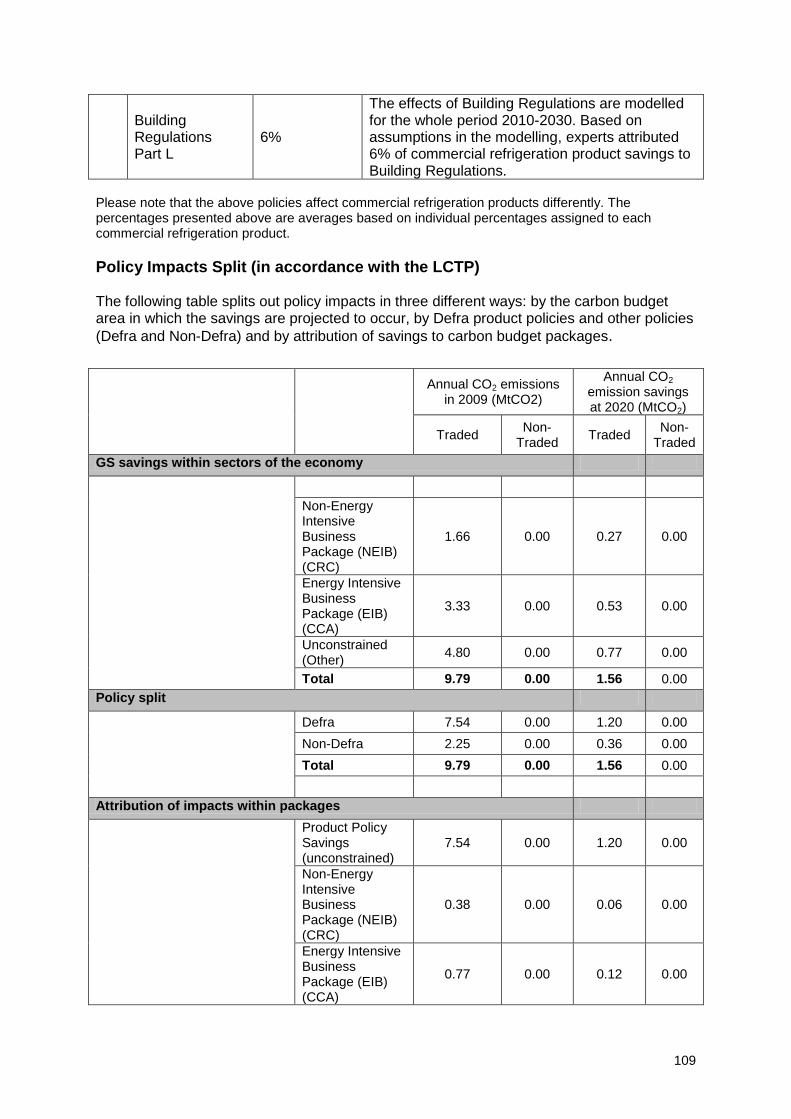
109
Building Regulations Part L
6%
The effects of Building Regulations are modelled for the whole period 2010-2030. Based on assumptions in the modelling, experts attributed 6% of commercial refrigeration product savings to Building Regulations.
Please note that the above policies affect commercial refrigeration products differently. The percentages presented above are averages based on individual percentages assigned to each commercial refrigeration product.
Policy Impacts Split (in accordance with the LCTP) The following table splits out policy impacts in three different ways: by the carbon budget area in which the savings are projected to occur, by Defra product policies and other policies
(Defra and Non-Defra) and by attribution of savings to carbon budget packages.
Annual CO2 emissions in 2009 (MtCO2)
Annual CO2 emission savings at 2020 (MtCO2)
Traded Non-
Traded Traded
Non-Traded
GS savings within sectors of the economy
Non-Energy Intensive Business Package (NEIB) (CRC)
1.66 0.00 0.27 0.00
Energy Intensive Business Package (EIB) (CCA)
3.33 0.00 0.53 0.00
Unconstrained (Other)
4.80 0.00 0.77 0.00
Total 9.79 0.00 1.56 0.00
Policy split
Defra 7.54 0.00 1.20 0.00
Non-Defra 2.25 0.00 0.36 0.00
Total 9.79 0.00 1.56 0.00
Attribution of impacts within packages
Product Policy Savings (unconstrained)
7.54 0.00 1.20 0.00
Non-Energy Intensive Business Package (NEIB) (CRC)
0.38 0.00 0.06 0.00
Energy Intensive Business Package (EIB) (CCA)
0.77 0.00 0.12 0.00

110
Unconstrained (Other)
1.10 0.00 0.18 0.00
Total 9.79 0.00 1.56 0.00
Key Government Standard Briefing Notes (GSBNs)
BNCR C01 Cellar cooling Government Standards Evidence Base 2009: Key Inputs
BNCR C02 Cellar cooling Government Standards Evidence Base 2009: Reference Scenario
BNCR C03 Cellar cooling Government Standards Evidence Base 2009: Policy Scenario
BNCR C04 Cellar cooling Government Standards Evidence Base 2009: Best Available Technology Scenario
BNCR CR01 Walk-in Cool Rooms Government Standards Evidence Base 2009: Key Inputs
BNCR CR02 Walk-in Cool Rooms Government Standards Evidence Base 2009: Reference Scenario
BNCR CR03 Walk-in Cool Rooms Government Standards Evidence Base 2009: Policy Scenario
BNCR CR04 Walk-in Cool Rooms Government Standards Evidence Base 2009: Best Available Technology Scenario
BNCR CS01 Commercial Service Cabinets Government Standards Evidence Base 2009: Key Inputs
BNCR CS02 Commercial Service Cabinets Government Standards Evidence Base 2009: Reference Scenario
BNCR CS03 Commercial Service Cabinets Government Standards Evidence Base 2009: Policy Scenario
BNCR CS04 Commercial Service Cabinets Government Standards Evidence Base 2009: Best Available Technology Scenario
BNCR IM01 Ice Machines Government Standards Evidence Base 2009: Key Inputs
BNCR IM02 Ice Machines Government Standards Evidence Base 2009: Reference Scenario
BNCR IM03 Ice Machines Government Standards Evidence Base 2009: Policy Scenario
BNCR IM04 Ice Machines Government Standards Evidence Base 2009: Best Available Technology Scenario
BNCR KO01 Non-Domestic Refrigeration Government Standards Evidence Base 2009: Key Outputs
BNCR PC01 Package Chillers Government Standards Evidence Base 2009: Key Inputs
BNCR PC02 Package Chillers Government Standards Evidence Base 2009: Reference Scenario
BNCR PC03 Package Chillers Government Standards Evidence Base 2009: Policy Scenario
BNCR PC04 Package Chillers Government Standards Evidence Base 2009: Best Available Technology Scenario
BNCR RDC01 Refrigerated Display Cases Government Standards Evidence Base 2009: Key Inputs
BNCR RDC02 Refrigerated Display Cases Government Standards Evidence Base 2009: Reference Scenario
BNCR RDC03 Refrigerated Display Cases Government Standards Evidence Base 2009: Policy Scenario
BNCR RDC04 Refrigerated Display Cases Government Standards Evidence Base 2009: Best Available Technology Scenario
BNCR VM01 Vending Machines Government Standards Evidence Base 2009: Key Inputs
BNCR VM02 Vending Machines Government Standards Evidence Base 2009: Reference Scenario
BNCR VM03 Vending Machines Government Standards Evidence Base 2009: Policy Scenario
BNCR VM04 Vending Machines Government Standards Evidence Base 2009: Best Available Technology Scenario
111
Annex 10: Non-domestic Lighting Products
1. Summary It is expected that energy consumption due to non-domestic lighting will fall by around 17% (7.14TWh) between now and 2020 without further policy intervention. Through implementation of cost beneficial policies, energy consumption in 2020 can be reduced by a further 13.0% (4.45TWh). Of this, 99% of savings (4.40TWh) come from the commercial sector, with the remaining 1% (0.06TWh) from street and traffic lighting. The key policies projected to have an impact on this area are potential revisions of the EuP Directive on Tertiary Lighting, EuP Directive on directional lamps, the revision of Building Regulations (Part L1), the Enhanced Capital Allowance (ECA) Scheme and Green Public Procurement Criteria. Other possible developments in the Carbon Reduction Commitment, the Energy Services Directive, the European Lamp Companies Federation (ELC) and CELMA77 Total Lighting Solution and the Forward Commitment Procurement Model may also have an impact but have not been modelled separately. In summary, it is projected that:
Market transformation in this area can be delivered with some additional innovation.
This will require future revisions of established government policies as well as some new policies not yet established.
The policy package outlined in this document will help exceed EWP-2007 and LCTP aims.
2. Scope This product area annex covers lamps (i.e. bulbs), ballasts and luminaires (i.e. fittings) used in the commercial sector and for street and traffic lighting.
Commercial lighting covers all internal and external, fixed to building lighting for all commercial (i.e. non domestic) premises including offices, retail units, hotels, public services buildings, industrial units and warehouses.
Street & traffic lighting includes public street lighting, signage and traffic signals
The data exclude private external lighting (e.g. private car parks). Directional and non-directional lamps are covered and, unless stated otherwise, all data in this Annex refers to both. Directional lighting uses a reflector to focus light into a defined beam, whereas non-directional lighting casts light more widely.
77
CELMA is a federation representing 20 National Manufacturers Associations for Luminaires and Electrotechnical Components for Luminaires.
112
3. Key Trends & Assumptions Non-domestic lighting covers a vast number of lamps, luminaires and ballast types in a constantly evolving and innovative market. Traditionally dealt with through energy efficiency policies specific to how and where lamps are used, the recent EuP Directive on Tertiary Lighting78,79 has taken a broad approach to setting minimum efficiency standards across the sector.
Commercial Lighting
Fluorescent lighting is used for general lighting in a wide range of commercial buildings. These lamps have been targeted by the recent EuP measure on Tertiary Lighting. This measure reinforces the pattern of sales moving away from inefficient T12 (38mm) and T8 (26mm) towards the more efficient options such as T5 (16mm) lamps. Compact fluorescent lamps with integrated ballasts (CFLi) and without ballasts (CFL) are replacing tungsten filament lamps. Ambient lighting is still provided in significant numbers by GLS lamps, to provide a 'homely' feel to public buildings, such as restaurants and pubs, although CFLs are making very significant inroads into these markets, with higher efficiency halogen lamps and some LED lamps also used for this purpose. The sector makes use of high-intensity discharge (HID) lamps for lighting industrial areas, warehouses and retail sheds. The EuP measure on Tertiary Lighting will remove high-pressure mercury lamps from the market in 2015 and these are likely to be replaced primarily by metal halide lamps. Stocks of other HID lamps are expected to remain relatively static, though the minimum efficiency levels for these lamps will be affected by the EuP measure. The final main use for lamps in the commercial sector is for accent lighting in retail premises, offices, museums and galleries. There is a growing market for compact metal halides and LEDs to replace the tungsten halogen lamps currently used for this purpose. LEDs are expected to improve in efficacy rapidly over the next decade, resulting in higher light outputs and the potential to make inroads into new markets across commercial, domestic and street lighting. Defra assumptions about LED penetration in the market are kept under review.
Street & Traffic Lighting
On major roads, the majority of new installations utilise relatively inefficient high-pressure sodium (HPS) lamps. There are higher efficacy models available on the
78
COMMISSION REGULATION (EC) No 245/2009 of 18 March 2009 implementing Directive 2005/32/EC of the European Parliament and of the Council with regard to Ecodesign requirements for fluorescent lamps without integrated ballast, for high intensity discharge lamps, and for ballasts and luminaires able to operate such lamps, and repealing Directive 2000/55/EC of the European Parliament and of the Council 79
Since entering into the Official Journal of the European Union, Commission Regulation (EC) No 245/2009 of 18 March 2009 has undergone further consultation and a number of anomalies within the Regulation have been identified, which effectively mean that it will not achieve the aims originally expected and stated above. At the time of writing, a revised version of the Regulation is due to be voted upon in time for the timetabled Stage 1 requirements in early 2010.

113
market now (125 lumens/watt or higher) which give off a whiter light and are becoming increasingly popular. White light is also popular in urban and residential installations, resulting in increased installations of metal halide lamps as well as the „plus‟ HPS lamps between now and 2020. Metal halide lamps have become more efficient, resulting in higher light output, and stock is due to increase from 6% to 19% as a share of all street lighting. At present LEDs are not modelled in street lighting. However, the development path of new technologies is difficult to predict, and it is recognised that the sector is continuously innovating, so this assumption may be revised in the future. Traffic signals are being switched from using GLS lamps to LED lamps. LEDs represent the best available technology in energy efficiency terms for traffic signals. Modelling inputs80,81
Stock (millions) Sales (millions) Usage (hours/year)
2009 2020 2009 2009 2009-2020
Commercial Lighting
297.3 328.1 122.8 86.8
Ambient – 3607 Display – 4990
Industrial – 4000 Office - 3579
Street Lighting 7.9 8.7 1.6 1.8 4,085
Traffic Lighting 1.2 1.6 0.9 0.2 2,920
Total 306.5 338.3 125.4 88.8 Figures do not total due to rounding. An average usage figure for Non domestic lighting has not been included. It is not considered a useful metric given the variety of lamp types and applications that were considered in this product area.
4. Policy Impacts The following graph shows the Government‟s projections for energy use by the commercial lighting sector, and street and traffic lighting.
80
These numbers present our best available evidence. Defra recognises, however, that the total energy demand
projected as a result of bottom-up calculations based on these input numbers leads to an overestimation of non-domestic electricity demand, and has scaled down all non-domestic electricity consumption accordingly. 81
Following public consultation on this document (December 2009-March 2010), parties provided Defra with
evidence which led to a review of Commercial Lighting usage assumptions, stock levels and the way in which controls are modelled. Subsequently the Commercial lighting models were updated in April 2010, and the revised results are presented in this updated Annex. Please see the Commercial Lighting GSBN series for further details on the changes made.
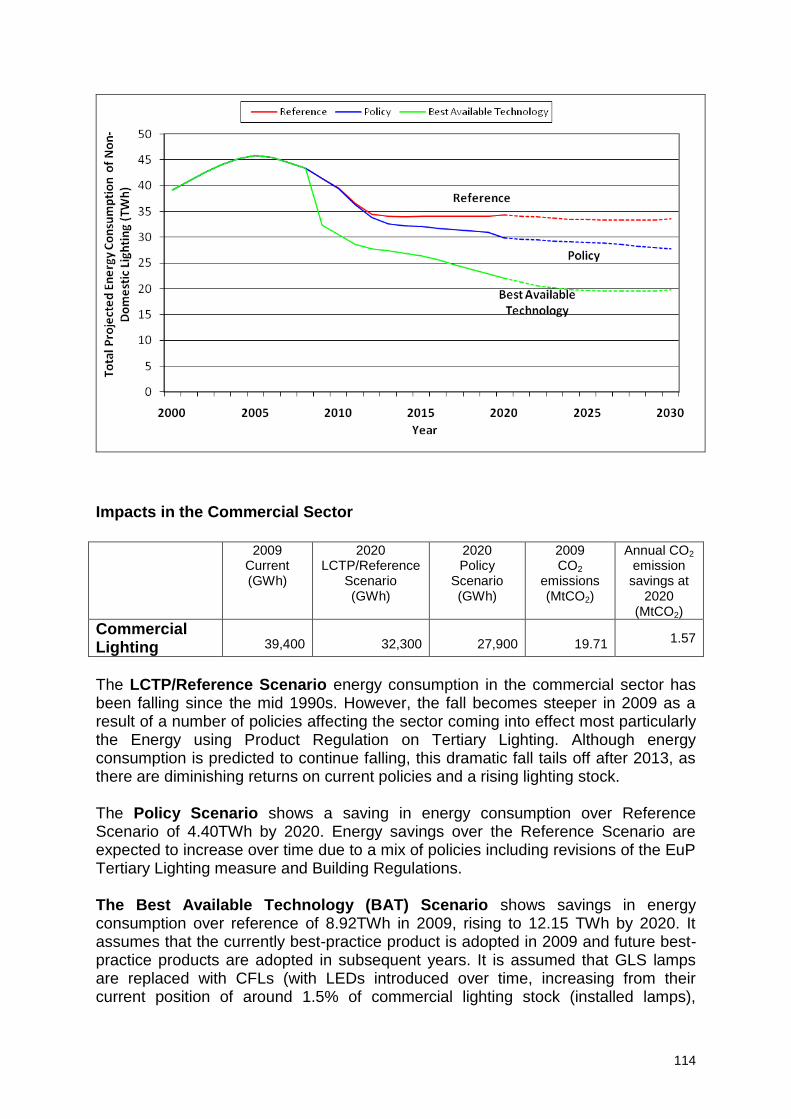
114
Impacts in the Commercial Sector
2009 Current (GWh)
2020 LCTP/Reference
Scenario (GWh)
2020 Policy
Scenario (GWh)
2009 CO2
emissions (MtCO2)
Annual CO2 emission savings at
2020 (MtCO2)
Commercial Lighting 39,400 32,300 27,900 19.71 1.57
The LCTP/Reference Scenario energy consumption in the commercial sector has been falling since the mid 1990s. However, the fall becomes steeper in 2009 as a result of a number of policies affecting the sector coming into effect most particularly the Energy using Product Regulation on Tertiary Lighting. Although energy consumption is predicted to continue falling, this dramatic fall tails off after 2013, as there are diminishing returns on current policies and a rising lighting stock. The Policy Scenario shows a saving in energy consumption over Reference Scenario of 4.40TWh by 2020. Energy savings over the Reference Scenario are expected to increase over time due to a mix of policies including revisions of the EuP Tertiary Lighting measure and Building Regulations. The Best Available Technology (BAT) Scenario shows savings in energy consumption over reference of 8.92TWh in 2009, rising to 12.15 TWh by 2020. It assumes that the currently best-practice product is adopted in 2009 and future best-practice products are adopted in subsequent years. It is assumed that GLS lamps are replaced with CFLs (with LEDs introduced over time, increasing from their current position of around 1.5% of commercial lighting stock (installed lamps),
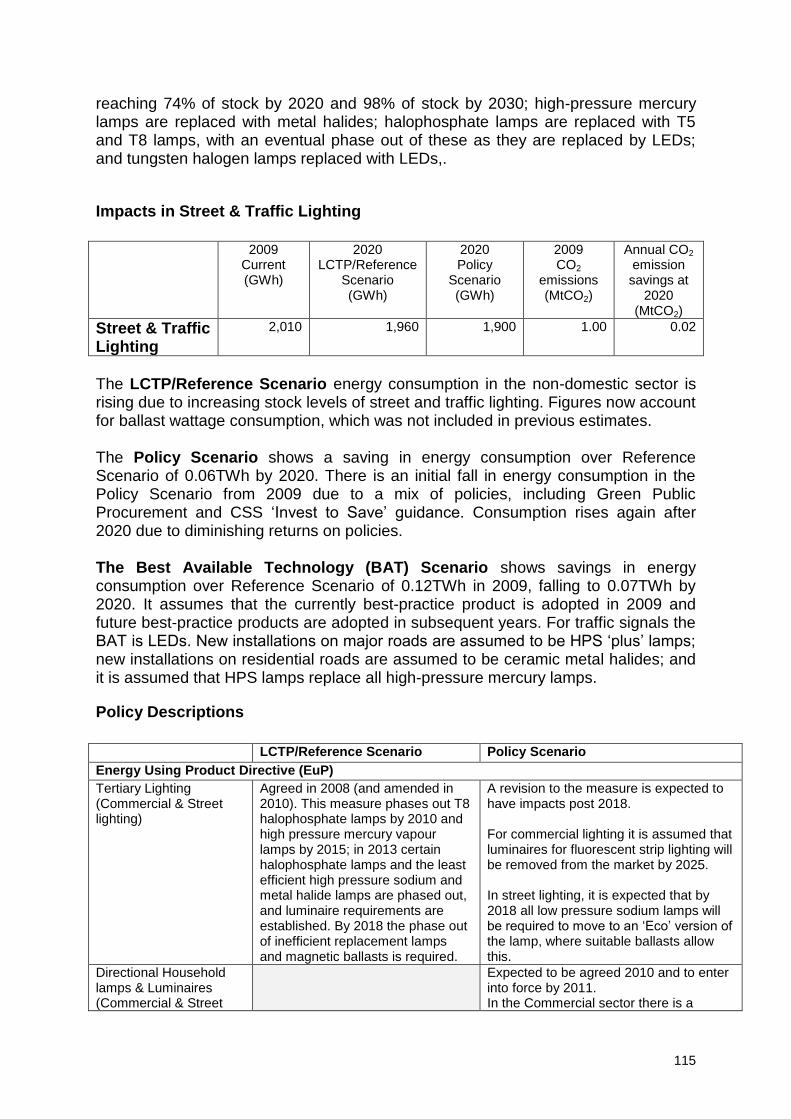
115
reaching 74% of stock by 2020 and 98% of stock by 2030; high-pressure mercury lamps are replaced with metal halides; halophosphate lamps are replaced with T5 and T8 lamps, with an eventual phase out of these as they are replaced by LEDs; and tungsten halogen lamps replaced with LEDs,.
Impacts in Street & Traffic Lighting
2009 Current (GWh)
2020 LCTP/Reference
Scenario (GWh)
2020 Policy
Scenario (GWh)
2009 CO2
emissions (MtCO2)
Annual CO2
emission savings at
2020 (MtCO2)
Street & Traffic Lighting
2,010 1,960 1,900 1.00 0.02
The LCTP/Reference Scenario energy consumption in the non-domestic sector is rising due to increasing stock levels of street and traffic lighting. Figures now account for ballast wattage consumption, which was not included in previous estimates. The Policy Scenario shows a saving in energy consumption over Reference Scenario of 0.06TWh by 2020. There is an initial fall in energy consumption in the Policy Scenario from 2009 due to a mix of policies, including Green Public Procurement and CSS „Invest to Save‟ guidance. Consumption rises again after 2020 due to diminishing returns on policies. The Best Available Technology (BAT) Scenario shows savings in energy consumption over Reference Scenario of 0.12TWh in 2009, falling to 0.07TWh by 2020. It assumes that the currently best-practice product is adopted in 2009 and future best-practice products are adopted in subsequent years. For traffic signals the BAT is LEDs. New installations on major roads are assumed to be HPS „plus‟ lamps; new installations on residential roads are assumed to be ceramic metal halides; and it is assumed that HPS lamps replace all high-pressure mercury lamps.
Policy Descriptions
LCTP/Reference Scenario Policy Scenario
Energy Using Product Directive (EuP)
Tertiary Lighting (Commercial & Street lighting)
Agreed in 2008 (and amended in 2010). This measure phases out T8 halophosphate lamps by 2010 and high pressure mercury vapour lamps by 2015; in 2013 certain halophosphate lamps and the least efficient high pressure sodium and metal halide lamps are phased out, and luminaire requirements are established. By 2018 the phase out of inefficient replacement lamps and magnetic ballasts is required.
A revision to the measure is expected to have impacts post 2018. For commercial lighting it is assumed that luminaires for fluorescent strip lighting will be removed from the market by 2025. In street lighting, it is expected that by 2018 all low pressure sodium lamps will be required to move to an „Eco‟ version of the lamp, where suitable ballasts allow this.
Directional Household lamps & Luminaires (Commercial & Street
Expected to be agreed 2010 and to enter into force by 2011. In the Commercial sector there is a

116
LCTP/Reference Scenario Policy Scenario
lighting) potential impact on tungsten halogen lamps and the possibility of removing of R7 & G9 luminaires. In traffic lighting, it is expected that mains halogen reflector lamps used for traffic signals are replaced with IR coated reflector halogens. A revision of the measure is expected to require all directional lamps to be „A‟ class efficiency by 2020. This assumes that suitable LED lamps will be developed in the next decade.
Other Policies
ECA Scheme (Commercial lighting only)
The ECA scheme currently covers lighting controls, high efficiency lighting units and white LED units. Expected impacts are based on the scheme‟s 5 year projections.
ECAs like all tax reliefs, are kept under review.
Building Regulations; Part L 2 (in England and Wales and equivalent in Scotland and Northern Ireland) (Commercial lighting only)
2006 Building Regulations for commercial premises specify that the minimum average initial efficacy is: General lighting in office areas – 45
luminaire lumens/W82
General lighting in spaces other than office areas – 50 lamp
lumens/W83
Display lighting – 15 lamp lumens/W
Revisions to Building Regulations are expected in 2010. It is expected that minimum average initial efficacy will be set as follows: General lighting in office areas – 55 luminaire lumens/W General lighting in spaces other than office areas – 55 lamp lumens/W Display lighting – 22 lamp lumens/W (Based on non-domestic building services compliance guide: 2010 edition)
Voluntary Initiative (Commercial lighting only)
Through the Voluntary Commitment retailers committed to phase out GLS lamps by 2011. This will have a very small impact on commercial premises that buy their lamps in wholesale outlets (e.g. SMEs)
Highways Agency Sustainable Development Policy (Street lighting only)
The HA are responsible for 5% of street lighting; following a cost-benefit analysis it is expected that around 20% of HPS and LPS (high/low pressure sodium) will be removed from stock in coming years; some HPS lamps will be replaced with more efficient versions, and that dimming lights will be encouraged.
CSS 'Invest to Save' Guidance (Street lighting only)
This guidance discusses the removal of street lighting and investment in dimming technologies by Local Authorities. Modest savings have been ascribed.
82
Luminaire lumens/watt is the luminous efficacy (light output for electrical power input), taking into account the luminaire; the measure includes efficiency reduction factors such as the luminaire light output ratio (the proportion of lamp lumen output providing useful light) and maintenance factor (average cleanliness) 83
Lamp lumens/watt is the luminous efficacy (light output for the electrical power input) for a lamp considered in isolation

117
LCTP/Reference Scenario Policy Scenario
Green Public Procurement Criteria (Street lighting only)
This voluntary initiative is under discussion, and expected to be agreed late in 2009. It is assumed that around 30% of Local Authorities will invest in improved HPS and Metal Halide lamps, and will phase out a proportion of their high pressure mercury lamps ahead of the EuP Tertiary Lighting Directive.
Voluntary Procurement Scheme (Street lighting only)
In order to pre-empt the effect of the revision of the EuP measure on LPS lamps a voluntary procurement scheme could bring about a move of approximately 50% of suitable LPS lamps towards „Eco‟ replacements from 2012.
There are some additional policies which will contribute to the delivery of energy savings in the sector in the reference and Policy Scenarios. However these have not been modelled separately as they support, and/or may be subsumed by the policies above. Reference Scenario - Phase out of EU anti-dumping charges (October 2008) - Sustainable Public Procurement Action Plan/Quick Wins - Highways Agency specification for the design of street lighting - LIGHTCOR2E calculator - Lighting design specifications Policy Scenario - Carbon Reduction Commitment - ELC/CELMA Total Lighting Solution - Forward Commitment Procurement Model - Update of lighting energy label - Energy Services Directive to trial a central management system to control
inventory and power factors for street lighting
Market impact of policy package
This graph presents Defra‟s projections of how the market will change as a result of the Policy Scenario. Lumens per watt (lm/W) is used as a common metric. The graphs indicate the share of the market (i.e. lamp sales) expected to comply with various levels of lumens per watt in a given year, as a result of normal business practices and the policies outlined above. Included below is the projection of the market for commercial lighting and street & traffic lighting. It should be noted that sales of the higher efficiency lamps (particularly LEDs) are not necessarily expected to rise year on year as the longer lifetimes of these lamps mean that they need to be replaced less often.
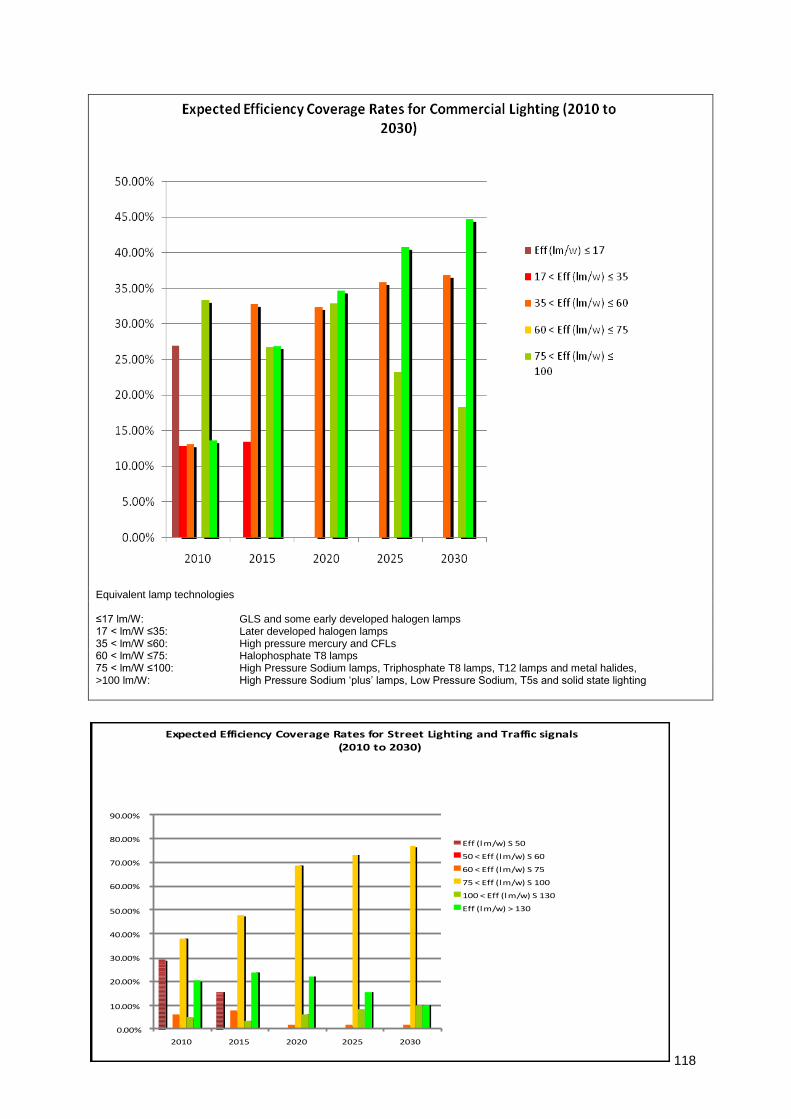
118
Equivalent lamp technologies ≤17 lm/W: GLS and some early developed halogen lamps 17 < lm/W ≤35: Later developed halogen lamps 35 < lm/W ≤60: High pressure mercury and CFLs 60 < lm/W ≤75: Halophosphate T8 lamps 75 < lm/W ≤100: High Pressure Sodium lamps, Triphosphate T8 lamps, T12 lamps and metal halides, >100 lm/W: High Pressure Sodium „plus‟ lamps, Low Pressure Sodium, T5s and solid state lighting
Expected Efficiency Coverage Rates for Street Lighting and Traffic signals
(2010 to 2030)
0.00%
10.00%
20.00%
30.00%
40.00%
50.00%
60.00%
70.00%
80.00%
90.00%
2010 2015 2020 2025 2030
Eff (lm/w) S 50
50 < Eff (lm/w) S 60
60 < Eff (lm/w) S 75
75 < Eff (lm/w) S 100
100 < Eff (lm/w) S 130
Eff (lm/w) > 130
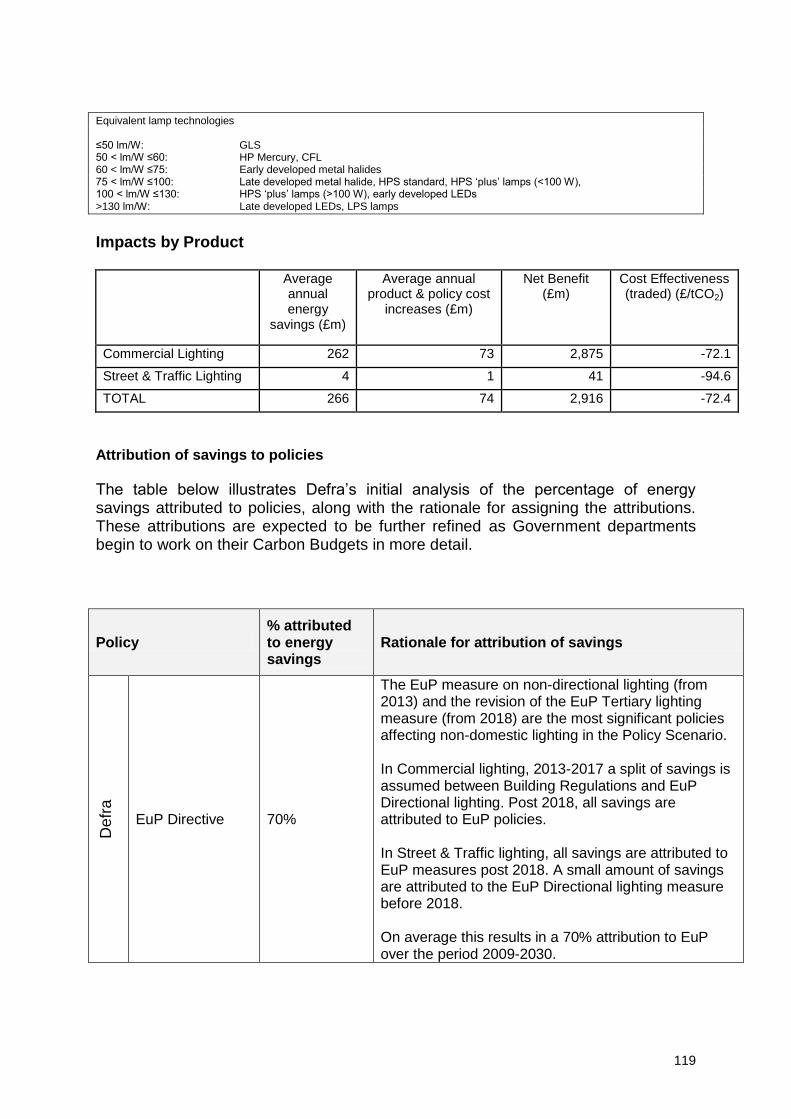
119
Equivalent lamp technologies ≤50 lm/W: GLS 50 < lm/W ≤60: HP Mercury, CFL 60 < lm/W ≤75: Early developed metal halides 75 < lm/W ≤100: Late developed metal halide, HPS standard, HPS „plus‟ lamps (<100 W), 100 < lm/W ≤130: HPS „plus‟ lamps (>100 W), early developed LEDs >130 lm/W: Late developed LEDs, LPS lamps
Impacts by Product Average
annual energy
savings (£m)
Average annual product & policy cost
increases (£m)
Net Benefit (£m)
Cost Effectiveness (traded) (£/tCO2)
Commercial Lighting 262 73 2,875 -72.1
Street & Traffic Lighting 4 1 41 -94.6
TOTAL 266 74 2,916 -72.4
Attribution of savings to policies
The table below illustrates Defra‟s initial analysis of the percentage of energy savings attributed to policies, along with the rationale for assigning the attributions. These attributions are expected to be further refined as Government departments begin to work on their Carbon Budgets in more detail.
Policy % attributed to energy savings
Rationale for attribution of savings
Defr
a
EuP Directive 70%
The EuP measure on non-directional lighting (from 2013) and the revision of the EuP Tertiary lighting measure (from 2018) are the most significant policies affecting non-domestic lighting in the Policy Scenario. In Commercial lighting, 2013-2017 a split of savings is assumed between Building Regulations and EuP Directional lighting. Post 2018, all savings are attributed to EuP policies. In Street & Traffic lighting, all savings are attributed to EuP measures post 2018. A small amount of savings are attributed to the EuP Directional lighting measure before 2018. On average this results in a 70% attribution to EuP over the period 2009-2030.

120
Non
-Defr
a
Building Regulations Part L
20% Based on assumptions in the modelling, experts attributed 20% of commercial lighting savings to Building Regulations.
ECA 10% Based on assumptions in the modelling, experts attributed 10% of commercial lighting savings to ECA.
A small impact was ascribed to voluntary procurement measures in the Street & Traffic lighting area. However, due to the relatively small contribution of savings to non-domestic lighting as a whole, this attribution was negligible when weighted, and so is not included in this analysis. Policy Impacts Split (in accordance with the LCTP) The following table splits out policy impacts in three different ways: by the carbon budget area in which the savings are projected to occur, by Defra product policies and other policies
(Defra and Non-Defra) and by attribution of savings to carbon budget packages.
Annual CO2 emissions in 2009 (MtCO2)
Annual CO2 emission savings at 2020 (MtCO2)
Traded Non-
Traded Traded
Non-Traded
GS savings within sectors of the economy
Non-Energy Intensive Business Package (NEIB) (CRC)
4.14 0.00 0.38 -0.06
Energy Intensive Business Package (EIB) (CCA)
0.83 0.00 0.08 -0.01
Unconstrained (Other)
15.75 0.00 1.46 -0.24
Total 20.72 0.00 1.91 -0.32
Policy split
Defra 14.50 0.00 1.34 -0.22
Non-Defra 6.22 0.00 0.57 -0.10
Total 20.72 0.00 1.91 -0.32
Attribution of impacts within packages
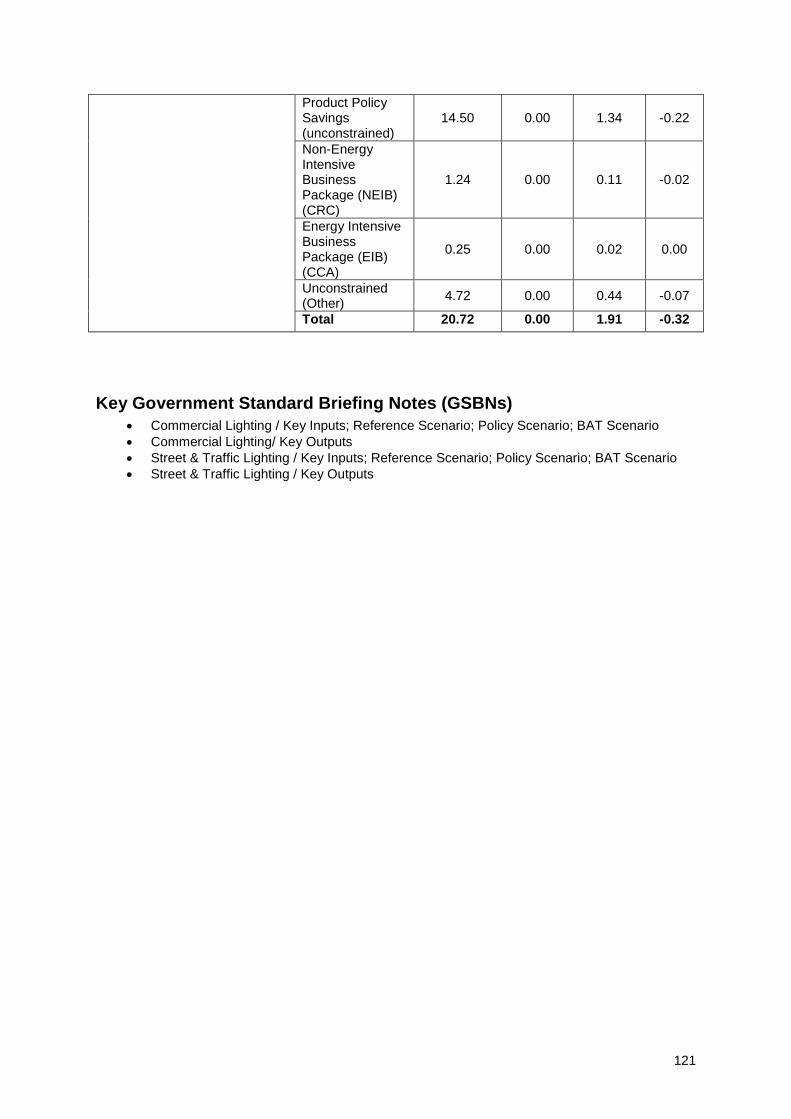
121
Product Policy Savings (unconstrained)
14.50 0.00 1.34 -0.22
Non-Energy Intensive Business Package (NEIB) (CRC)
1.24 0.00 0.11 -0.02
Energy Intensive Business Package (EIB) (CCA)
0.25 0.00 0.02 0.00
Unconstrained (Other)
4.72 0.00 0.44 -0.07
Total 20.72 0.00 1.91 -0.32
Key Government Standard Briefing Notes (GSBNs)
Commercial Lighting / Key Inputs; Reference Scenario; Policy Scenario; BAT Scenario
Commercial Lighting/ Key Outputs
Street & Traffic Lighting / Key Inputs; Reference Scenario; Policy Scenario; BAT Scenario
Street & Traffic Lighting / Key Outputs
122
Annex 11: Servers and Data Centres
1. Summary
It is expected that energy consumption due to data centres (DC) will increase by approximately 170%84 (in the region of 17TWh) between now and 2020 without further policy intervention. Through implementation of cost beneficial policies, it is anticipated that energy consumption in 2020 could be reduced by approximately 40% (in the region of 10TWh). This would give a net increase of 7TWh over 2009 levels85. The key policies which may in future have an impact on this area are the ENERGY STAR label, and the EU Code of Conduct for Data Centres. Defra anticipates completing its analysis of this area in time for the next consultation. In summary, it is projected that:
Market transformation in this area can be delivered via minor technical modifications of products and/or infrastructure.
This will require future revisions of established government policies.
2. Scope
This annex addresses the following areas of ICT infrastructure:
Servers
Data centres ICT products such as computers are covered under a separate product annex. Defra is considering the future addition of networking equipment such as internet routers. Aspects of storage and network energy consumption are considered to a limited extent in this preliminary analysis86. Software is not explicitly included, but is implicit in policy measures.
3. Key Trends & Assumptions Energy consumption of data centres is growing, partly due to increases in installed server capacity, but also due to increasing demands of additional ICT and cooling equipment in the data centre87.
84
Whilst current growth follows an exponential trend, the rate of increase is reduced into the future to constrain future
projections within realistic boundaries. 85
It is acknowledged that ICT implementations can also improve energy efficiency / reduce carbon emissions in other areas
(for example via video conferencing or data sharing), but such considerations are out of scope of this current Defra analysis. 86
Whilst CPU utilization is not the only metric for server work done, it provides a basic means of estimating overall server
energy consumption. It is also recognized that the compute load is not the only productive load in the data centre and that storage and networks account for a component of work done and energy consumed in a data centre. These also have potential for energy saving. It has not been possible to address these aspects in any depth in this preliminary analysis. 87
Cloud computing (which shifts local computer processing and storage to large internet based services) may also have an
impact upon server numbers, although it there is insufficient certainty on this trend to enable it to currently be taken into account.
123
Servers Servers contribute an estimated 38% of the total data centre energy consumption. Server energy consumption is expected to continue increasing as the number of servers in use increases88. This is likely to be due to increasing demand for internet services including personal and corporate storage, entertainment services and further use of ICT to increase business productivity. A high level of virtualisation (of multiple servers onto one physical server) is already included in the current reference projection. This is expected to increase in future years, but further virtualisation is likely to have little overall impact. In effectively lowering the cost of owning and running an application, it is likely to create an increase in demand, rather than substantial energy saving. Data centres The data centre adds an additional 62% onto the energy consumed by the server. The additional energy consumption arises in part from the additional ICT equipment in the data centre such as data storage and networking equipment. Whilst it is recognised that data storage stock is growing89, the main cause of additional consumption is the power and cooling equipment needed to ensure the ICT equipment functions reliably.
4. Potential policy Impacts
Defra does not currently have sufficiently accurate data in this area. Defra's current understanding of this area, based on available data and expert opinion is set out in this section. Potential impacts The reference scenario projects that energy consumption will rise up to almost 27TWh for data centres including servers in 2020, due to increased demand for server services. Considerable increases are expected in the future, but energy consumption will flatten out in 2025 because of uncertainties in demand projections. The introduction or modification of policies in the policy scenario may result in significant savings in energy consumption over the reference in the region of 40% (around 10TWh) by 2020. A continued rise in energy consumption in the policy scenario is anticipated, particularly from 2014 due to the difficulty regulating this area and the immaturity of voluntary initiatives. The Best Available Technology (BAT) scenario anticipated possible savings in energy consumption over reference in the region of 0.2TWh in 2009. These could rise to approximately 20TWh by 2020. This scenario assumes that the current best
88
The environmental impacts of longer or shorter lifetimes for ICT equipment in non domestic environments is a complex
consideration. The case for early refreshment will depend upon the balance of impacts in the different life cycle stages for the products being bought and replaced. Due to this variability, the analysis does not currently take this factor into account as a distinct consideration. 89 Storage is modelled in line with US report to congress on data centres.
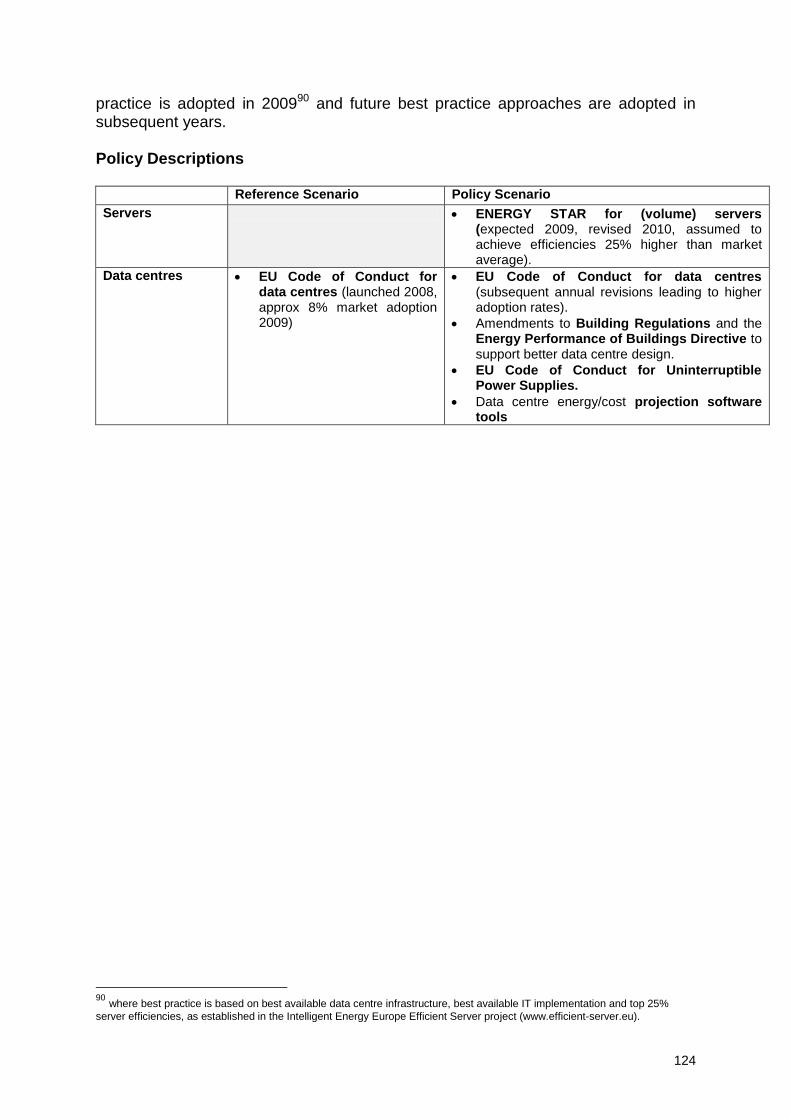
124
practice is adopted in 200990 and future best practice approaches are adopted in subsequent years. Policy Descriptions Reference Scenario Policy Scenario
Servers ENERGY STAR for (volume) servers (expected 2009, revised 2010, assumed to achieve efficiencies 25% higher than market average).
Data centres EU Code of Conduct for data centres (launched 2008, approx 8% market adoption 2009)
EU Code of Conduct for data centres (subsequent annual revisions leading to higher adoption rates).
Amendments to Building Regulations and the Energy Performance of Buildings Directive to support better data centre design.
EU Code of Conduct for Uninterruptible Power Supplies.
Data centre energy/cost projection software tools
90
where best practice is based on best available data centre infrastructure, best available IT implementation and top 25%
server efficiencies, as established in the Intelligent Energy Europe Efficient Server project (www.efficient-server.eu).

125
Annex 12: Domestic cooking appliances
1. Summary
It is expected that energy consumption due to Domestic Cooking Appliances will remain more or less constant between now and 2020 without further policy intervention. Through implementation of cost beneficial policies, it is anticipated that energy consumption in 2020 could be reduced by approximately 10% (in the region of 2TWh). Of this, approximately 43% of savings come from ovens, 42% from hobs, 14% from kettles and 1% from microwaves. The key policies which may, in future have an impact on this area are EU Energy Using Product Policy (EU EuP), EU Energy Labelling (EL), the Carbon Emissions Reduction Target (CERT), and Energy Saving Recommended (ESR). MTP anticipates collecting further evidence in this area before the next consultation. In summary, it is projected that:
Market transformation in this area can be delivered via minor technical modifications of products.
This will require future revisions of established government policies.
2. Scope
This annexe addresses the following Domestic Cooking Appliances products:
Ovens (Electric and Gas)
Hobs (Gas and Electric)
Microwaves
Electric Kettles
3. Key Trends & Assumptions
Ovens (Electric and Gas) - Energy consumption is estimated at 3.8 TWh/year from electric and 2.7TWh/year from gas) in 2009. All UK households are assumed to have access to an oven (64% electric, 36% gas). There is an EU Energy Label for electric ovens but not for gas ovens. The UK electric oven market is divided mainly between the A (35%) and B (54%) labelling classifications in 2007. Consumers increasingly prefer to buy electric rather than gas ovens because they are believed to cook more evenly. Accordingly, numbers of gas ovens are projected to decline (to around 30% by 2020) and those of electric ovens to increase proportionally (to around 70% by 2020). Hobs (Gas and Electric) - Energy consumption is estimated at 4.8TWh/year from gas and 3.2 TWh/year from electric) in 2009. All UK households are assumed to have access to a hob (55% gas, 45% electric). Consumers generally prefer to use gas hobs because they are believed to give more flexible control of temperatures. Technological developments which are resulting in more user-friendly electric hobs are not expected to offset this trend. Moreover, trends towards easier to clean glass

126
surfaces and a greater variety of burner sizes may also encourage more users to switch to gas. Accordingly, numbers of electric hobs are projected to decline (to approximately 40% by 2020) and those of gas hobs to increase proportionally (to around 60% in 2020). Microwave Ovens - Energy consumption is estimated as 2.4TWh/year in 2009. The stock of microwaves is likely to remain constant at 85% ownership. Two thirds of microwaves are microwave-only. A significant proportion of energy consumption of microwaves is due to standby, since most have clocks and consumers have a preference for models with electronic controls. This is likely to fall as older electronic models are replaced with those that meet the EuP standby consumption thresholds. Electric Kettles - Energy consumption is estimated at 4.3TWh/year in 2009. Most UK households (96%) own a kettle. This is likely to remain reasonably steady to 2020. Over 5 million kettles are sold each year with an estimated lifespan of about 5 years. Over the last few years a number of different types of kettle have entered the UK market which either increase (e.g. those with keep warm facilities) or decrease energy consumption (e.g. those restricting the amount of water boiled). Overall kettle energy consumption is expected to rise as the number of households increases. The stock is likely to include more „energy saving‟ and water saving kettles but the current proportion of those is low.
4. Potential Policy Impacts
MTP does not currently have sufficiently accurate data in this area. MTP's current understanding of this area, based on available data and expert opinion is set out in this section. Potential Impacts It is expected that, in absence of policy (reference), energy consumption will gradually increase due to increases in household numbers. Electric ovens are the only appliance showing a reduction in total energy use, but this starts to increase from around 2022 due to increased number of households and a shift in ownership to electric rather than gas. If policies were implemented, they may result in small savings in energy consumption over reference by 2020. A gradual decline in energy consumption is anticipated from around 2012 due to a mix of policies, such as EU EuP, EL, CERT and ESR. If all new purchases were of the most efficient products available, savings over reference in the region of 0.6TWh in 2009 are anticipated. These could rise to approximately 5TWh by 2020. Policy Descriptions Reference Scenario Policy Scenario
Gas and Electric Ovens Gas and Electric Hobs Microwave ovens
EuP Standby (with a few exceptions, this does not generally apply to hobs)
EU Energy Label (currently for
EuP MEP (preparatory study anticipated in approximately 2 years)
EU Energy Label for all ovens
Energy Saving Recommended

127
electric ovens only) CERT – has not supported any of the domestic cooking appliances to date but could in future
Kettles EuP Standby
Energy Saving Recommended endorses kettles consuming 20% less than average energy
CERT – Eco kettles have been supplied under CERT
128
Annex 13: Motor-driven systems
1. Summary
It is expected that energy consumption due to motor-driven systems will increase by approximately 3% (in the region of 2TWh) between now and 2020 without further policy intervention. Through implementation of cost beneficial policies, it is anticipated that energy consumption in 2020 could be reduced by approximately 11% (in the region of 10TWh). All savings are expected within the non-domestic sector. The key policies which may, in future have an impact on this area are the Energy-using Products (EuP) Directive, Enhanced Capital Allowances (ECA), Quick Wins, and Building Regulations Part L. In addition, possible developments in the Carbon Reduction Commitment (CRC) may also have an impact. Defra anticipates collecting further evidence in this area and completing its analysis of this area in time for the next consultation. In summary, it is projected that:
Market transformation in this area can be delivered via minor technical modifications of products.
This will require future revisions of established government policies as well as the introduction of some new policies.
2. Scope
This annex addresses pumps and fans in the size range 0.75kW to 400kW, representing the majority of products and systems in this area. These can be broken down as follows:
Products: Systems driven by electric motors, including:
Pumps (centrifugal, in clean water applications)
Fans (including centrifugal, axial, box, roof and cross flow designs)
Pumping systems (in industrial and commercial applications)
Fan systems (in industrial and commercial applications)
Defra is also considering collecting further evidence on:
Pumping systems (in industrial and commercial applications)
Air compressors (in industrial and commercial applications)
3. Key Trends & Assumptions
Fans and pumps are used across industry and commerce in a variety of applications, including ventilation, heating and cooling systems in buildings and industrial processes. Relatively small gains in fan and pump efficiency can result in large savings due to the widespread use of these products. There are further significant gains, in the
129
region of 20% to 30%, to be made through the proper dimensioning, application and control (for example, via variable speed drives) of the systems in which fans and pumps are applied. Pumping applications - Pumping systems account for approximately 32% of all energy consumed by electric motors. At least 60% of this is associated with pumping clean water. Building applications account for 41% of pumping systems energy, followed by water and sewage utilities (14%), chemicals and downstream industries (9%), and the remainder spilt between a number of sectors. Overall, pumps have a wide spread of efficiencies from under 50% to over 80% depending on size, type and application. A given pump-type for a given application generally has an available efficiency range of around 10%, with scope to increase average efficiency by 4% to 5%. Anecdotal evidence suggests that further efficiencies may be achieved through improved pump-type selection. Fans in ventilation - Fan systems account for around 22% of all energy consumed by motors and use a range of fan types (e.g. axial, centrifugal, box, roof and cross-flow). Similar principles apply to these fans as to pumps: they have similar overall efficiency ranges with scope to increase average efficiency for a given application by 4% to 12%.
4. Potential Policy Impacts
Defra does not currently have sufficiently accurate data in this area, but is working to improve its knowledge base. Defra's current understanding of this area, based on available data and expert opinion is set out in this section. Potential Impacts It is expected that, in the absence of policy, energy consumption will rise slowly up to 2020 due to small increases in stock. This trend is anticipated to reverse around 2020 because of reductions in growth. Implementation of policies may result in significant savings in energy consumption, in the region of 5TWh by 2020. A fall in energy consumption is anticipated from around 2011 due to a mix of policies, such as the EU Energy using Products Directive and UK Building Regulations Part L 2 (in England and Wales and equivalent in Scotland and Northern Ireland). If all new purchases were of the most efficient products available from 2009 onwards, there may be savings in energy consumption in the region of 1TWh in 2009. These could rise to approximately 14TWh by 2020. Policy Descriptions Current Policy Future Policy
Fans (products)
Enhanced Capital Allowances scheme indirectly stimulates the top end of the market where manufacturers of products including fans (heat exchangers, heat pumps, refrigerating equipment) specify
EuP Directive for ventilation fans (regulation anticipated to come into force in 2011)
ECAs like all tax reliefs, are kept under review. Quick Wins aligned with the products included in the Energy Technology Product (ETPL) under the ECA scheme
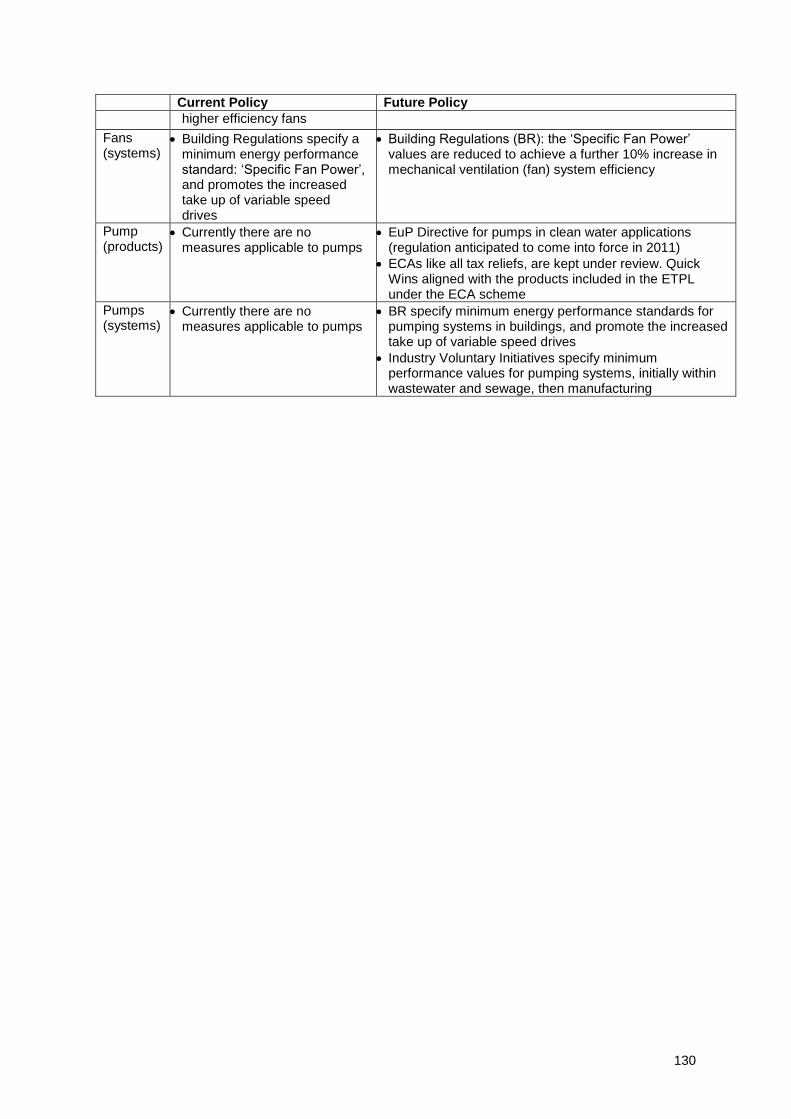
130
Current Policy Future Policy
higher efficiency fans
Fans (systems)
Building Regulations specify a minimum energy performance standard: „Specific Fan Power‟, and promotes the increased take up of variable speed drives
Building Regulations (BR): the „Specific Fan Power‟ values are reduced to achieve a further 10% increase in mechanical ventilation (fan) system efficiency
Pump (products)
Currently there are no measures applicable to pumps
EuP Directive for pumps in clean water applications (regulation anticipated to come into force in 2011)
ECAs like all tax reliefs, are kept under review. Quick Wins aligned with the products included in the ETPL under the ECA scheme
Pumps (systems)
Currently there are no measures applicable to pumps
BR specify minimum energy performance standards for pumping systems in buildings, and promote the increased take up of variable speed drives
Industry Voluntary Initiatives specify minimum performance values for pumping systems, initially within wastewater and sewage, then manufacturing
131
Annex 14: Non-Domestic Heating
1. Summary
The energy consumption due to non-domestic heating was around 195 TWh in 2005, and is expected to reduce moderately by 2020 without further policy intervention. Through implementation of cost beneficial policies, it is anticipated that energy consumption in 2020 could be reduced. The key policies which may in future have an impact on this area are: Building Regulations and the Energy Performance of Buildings Directive (EPBD); Energy-using Products (EuP) and Labelling Directives; the Carbon Reduction Commitment (CRC); and Local Authority planning policy (such as the „Merton Rule‟). In addition, possible developments in the Energy End-use Efficiency and Energy Services Directive (ESD) may also have an impact. Defra anticipates completing its analysis of this area in time for the next consultation. Policies may also be developed or existing measures adjusted which would require commercial heating systems to respond to remote signals to adjust power consumption to provide instantaneous automated demand response. For example, by either reacting to frequency changes or via smart meters responding to dynamic time of use tariffs, thus enabling such products to be included in more active energy demand side management to assist in power system balancing in the future. In summary, it is projected that:
Market transformation in this area may require substantial innovation.
This will require future revisions of established government policies as well as some new policies not yet established.
2. Scope
This annex addresses the following non-domestic heating products:
Oil and gas boilers (includes modular and unitary boilers)
Oil and gas-fired warm air and radiant heaters
Heat pumps (ground, water and air source, connected to water or air distribution)
3. Key Trends & Assumptions
Trends affecting all products:
Heating demand in buildings (new and existing) is diminishing, due to improving the building fabric (walls, roofs, windows, etc).
Product efficiency is improving, principally due to improvements in standards for space heating and water control systems.
High carbon emitting products are being displaced by those using lower-carbon fuels.
Assumptions and drivers affecting all products:

132
Ongoing effects of current and planned policies: o Future Building Regulations set targets for Required Minimum Boiler Seasonal
Efficiency: up to 87% for new buildings and up to 82% for existing buildings91. o EPBD as reflected in current Buildings Regulations requires building energy
performance improvements when renovating buildings over 1000 m2 floor area, and boiler system inspections. Energy Performance Certificates are also required for buildings constructed, rented or sold and public buildings larger than 1,000 m².
o ECA promotes high efficiency products through the use of tax rebates on the energy-efficient equipment purchased.
o Planning policy (requiring more low/zero CO2 energy in new building developments).
Increasing, and/or increasingly erratic energy prices.
Increasing product diversity, competition and technical innovation.
Diminishing potential for further improvements in efficiency for fossil fuel boilers.
4. Potential Policy Impacts
Defra does not currently have sufficiently accurate data in this area. Defra's current understanding of this area, based on available data and expert opinion is set out in this section. Potential Impacts It is expected that, in the absence of policies to improve energy efficiency of non domestic heating products, energy consumption will continue to fall moderately due to increased energy efficiency and improved building fabric. This trend continues from around 2020 for the same reasons. Implementation of policies may result in large savings in energy consumption over the reference scenario by 2020. A fall in energy consumption is anticipated from around 2020 due to a mix of policies, including Building Regulations, Carbon Reduction Commitment (CRC), and planning laws. Policy Descriptions Policy Existing Policy Effects Future Policy Effects
Building Regulations and Energy Performance of Buildings Directive
Has established minimum efficiency requirements for boilers (SEDBUK level A or B). Minimum fabric and whole-building energy consumption requirements are in place.
Expected higher minimum requirements for boiler efficiency (SEDBUK level A); higher fabric and whole-building energy consumption requirements; and the introduction of low or zero carbon heating technologies.
EuP and Labelling Directives
Expected to improve heating system efficiencies (including controls) via MEPs and energy labels. Currently expected minimum requirements are 76% (smaller boilers) and 96% (large boilers) specific efficiency (as defined in the EuP measure under discussion).
Enhanced Capital . ECAs like all tax reliefs, are kept under
91
Proposed non-domestic building services compliance guide: 2010 edition; latest draft for consultation (March 2009). Targets based on gross calorific value.

133
Policy Existing Policy Effects Future Policy Effects
Allowances ECAs promote the purchase of more energy efficient products by offering a tax relief to businesses who purchase energy saving equipment.
review.
Carbon Reduction Commitment
Expected to encourage large public and private sector organisations to invest in cost effective, efficient, lower carbon heating systems, as part of their efforts to reduce CO2 emissions.
Planning policy (e.g. PPS 22, PPS 1)
Some Local Authorities require a percentage (e.g.10-20%) of on-site or near-site renewable or low carbon energy generation (inevitably including heat generation) for use in new non-domestic building developments.
Expect that more Local Authorities adopt these policies.
Energy End use Efficiency and Energy Services Directive
Expected to improve energy metering and billing, and promote efficient, best-practice Government procurement of heating systems for the public estate.

134
Annex 15: Other product areas (Overview) Defra continuously seeks to expand the range of products included in its evidence base in order to enable Government to develop informed and effective product policy. This Annex briefly highlights a number of products which Defra has begun to, or plans to, add to its evidence base. These are products which are likely to be the subject of future energy using product policy. It is therefore essential that a comprehensive evidence base be developed for these products92. Additions to consumer electronics and information and communication technology A number of products are at various stages of investigation within the consumer electronics and ICT evidence base. Defra seeks to gather evidence on these products to refine current models and to ensure that the evidence base is as complete as possible. They include the following products:
Television monitors
Television monitors are televisions (TVs) without a tuner. They are used with a digital set top box or similar device to receive television signals. These products are currently included under the EuP Implementing Measure on televisions93, and to some extent within the domestic TV and non-domestic monitor evidence base. Defra intends to gather further evidence on TV monitors in order that they may form a separate category for future product-specific analysis.
Electronic photo frames
Sales of electronic photo frames are increasing and these products are likely to be left on for long periods of time. Accordingly, there is recognised potential for energy savings in this product category. Moreover, photo frames will qualify under the 2009 revision of the ENERGY STAR display specification, and may also be included in the proposed EU Energy using Products (EuP) Implementing Measure on computer monitors and displays (expected to come into force in 2012).
Thin clients
Thin clients are basic computers which rely on central servers for the majority of their processing power. They are replacing desktops and laptops in some non-domestic applications. The 2009 ENERGY STAR computer specification will be extended to address thin clients. EuP measures concerning computers may also address these products.
92
The scope of this Annex is largely, though not exclusively, based upon the European Commission‟s Energy Using Products Directive Working Plan (October, 2008). 93
The Implementing Measure on Eco-design & Labelling was agreed in Regulatory Committee on 31st March 2009. It is currently undergoing European Parliament scrutiny.
135
Audio and video projection equipment
Some audio and video projection equipment may fall under the current EuP preparatory study on sound and imaging. As yet, detailed savings estimates for these products are not available. The preparatory study will provide further information on potential energy savings of these products and the likelihood of them forming the basis of an EuP measure. This will enable Defra to assess the need for these products to be included in its evidence base.
Network, data processing and data storage equipment
These products fall into a high-growth area of non-domestic Information and Communication Technology. They are energy intensive and are often used continuously. Example products include servers, network communication equipment, uninterruptible power supplies and enterprise storage devices (large scale storage devices for businesses). Enterprise storage devices provide a means of centrally storing data instead of it being stored on individual servers. It is expected that they may become more prevalent in the future. Initial estimates suggest significant potential energy savings.
Networked products
Many products across a range of sectors have networked standby modes which, while possibly not addressed in currently approved EuP measures, may be addressed in future. These products will mainly, though not exclusively, fall under the consumer electronics and information and communication technology categories.
Beverage machines
This sector comprises primarily of domestic beverage machines, such as coffee makers (with non-domestic beverage machines being included in Commercial Catering and Cooking). Although a relatively small source of domestic energy consumption, there are indications that these products will fall under the remit of Energy using Product policy in the future and that implementation of suitable standards could result in a degree of energy savings. As yet savings estimates for these products are not available.
Commercial Catering & Cooking Equipment
There is potential to improve energy efficiency of products used in the non-domestic catering and cooking sector. Products falling within this sector include gas and electric powered ovens, hobs, grills and fryers, as well as microwaves and hot and cold beverage machines. The European Commission has begun an EuP preparatory study on these products. Implementation of suitable standards could result in a degree of energy savings. As yet savings estimates for these products are not available.
136
Electric & fossil fuelled heating equipment
Extending coverage of heating products will allow Defra to provide more accurate data on an area that accounts for a significant proportion of energy consumption across both the domestic and non-domestic sectors. Example products in this category include electric storage heating radiators, electric heaters for space, soil heating, gas and oil fired dry space heating systems and heat pumps. These products are energy intensive and are often operated for long periods of time. The European Commission has made an initial estimate that average energy savings of more than 20% could be possible with effective standards in place.
Industrial and laboratory furnaces and ovens
Furnaces and ovens used in the industrial sector are energy intensive and used continuously throughout working hours. They include integrated fans, which also account for energy consumption. Example products in this sector include infra-red radiation ovens, resistance-heated and electrical induction furnaces and ovens, and furnace burners. Third-country specifications (e.g. Energy labelling and MEPs) indicate potential for improvement in this product category. The European Commission has made an initial estimate that average energy savings of over 20% could be made with effective standards in place.
Machine Tools
Machine tools are electricity powered pieces of equipment primarily found in the industrial sector. They are, typically, used to work on metals and hard materials. Example products include horizontal and vertical lathes, forming tools (e.g. for drilling, folding, grinding, cutting), separation tools and machine tools used in physical-chemical processes. These products are energy-intensive, and are often used around the clock in manufacturing. Through improving power factors (reducing power loss due to motors), increasing efficiency of machines in „idle‟ mode and by introducing efficient variable speed drives, there is substantial potential for energy savings.
Transformers
Transformers modify the input and output voltage of electricity. Example products in this category include distribution transformers, power transformers and small transformers. Transformers have substantial energy losses and are often used for prolonged periods of time. Third country specifications (e.g. Energy labelling, ENERGY STAR and MEPs) indicate potential for improvement in this product category. The European Commission has made an initial estimate that energy savings of up to 30% could be made with effective standards in place. Vacuum Cleaners Vacuum cleaners are electrically operated appliances which removes soiled material from surfaces, by an airflow created by a vacuum within the unit. Example products include upright cleaners, canister or cylinder cleaners, stick cleaners or handheld cleaners. The Eco-Design preparatory study indicated that measures such as a capped maximum power consumption (potentially time based) and energy labelling could result in improvements in this product category. Tiered minimum performance standards may be another option considered. The Eco-Design study‟s impact analysis indicated that electricity savings of up to 28% are achievable.
137
APPENDIX I – ANALYSIS OF POLICY SCENARIOS
Summary
A. The role of Product Policy Appliances that use energy, such as white goods, lighting, televisions and electric motors contribute significantly to the UK‟s CO2 emissions: around half of the UK‟s greenhouse gas emissions result from the use of energy-using products, in our homes, offices and in industry. By removing the worst products from the market and promoting the sales of the best products, emissions and energy bills are reduced significantly. Government does this through various means and, taken together, these “product policies” are examined in this document. This document provides a high-level overview of product policy in the UK and is supported by nine annexes describing specific energy-using product groups. The impacts of product policy are assessed against:
the 2007 Energy White Paper (EWP) target of 3.7 to 11 MtCO2 per year by 2020; and
the 2009 UK Low Carbon Transition Plan (LCTP)'s aim of doubling the emissions savings expected by the measures agreed so far by 2020, currently estimated to equate to 15 MtCO2 per year by 2020 (or twice estimated banked savings of 71/3 MtCO2).
Product policy helps Government to deliver CO2 emission reductions, at no overall cost to society, combining substantial emission reductions with the generation of billions of pounds of benefits to the UK through reduced energy bills. Impact calculations project net benefits to UK society of £26 billion (£41 billion in benefits, against a cost of £15 billion compared to the LCTP/Reference scenario) over the period 2009 – 2030. The Climate Change Committee has highlighted the importance of this work in reducing UK carbon emissions.
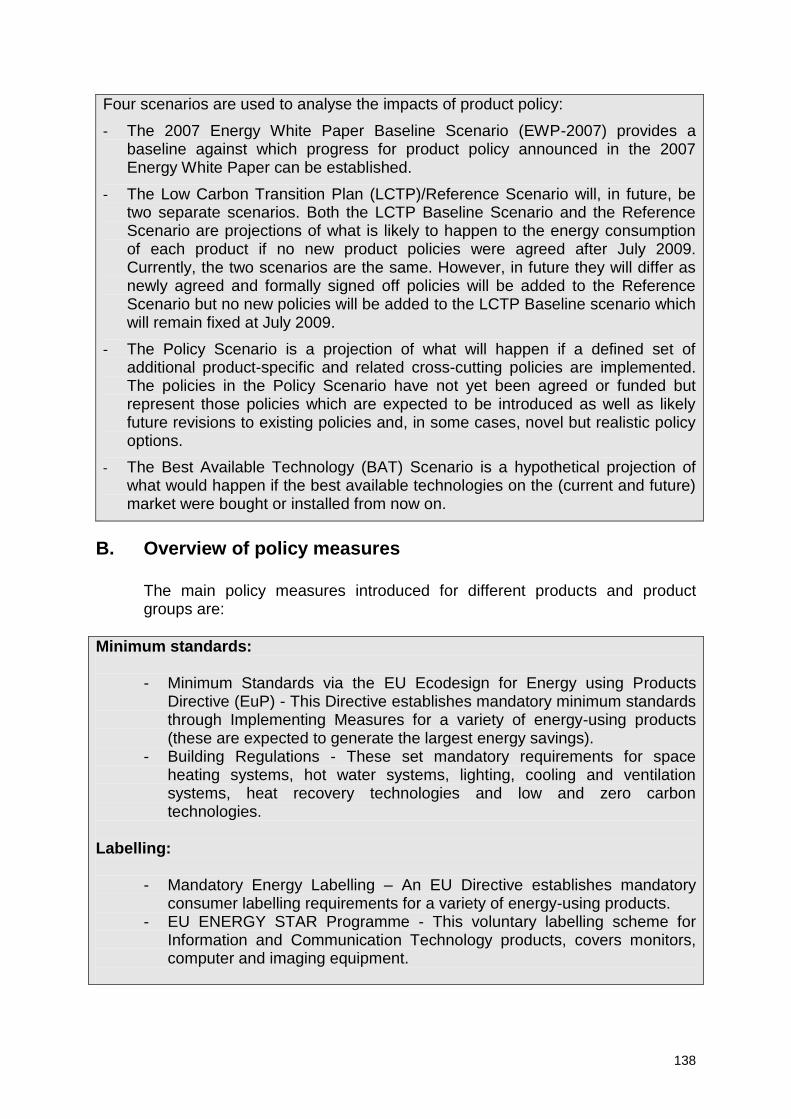
138
Four scenarios are used to analyse the impacts of product policy:
- The 2007 Energy White Paper Baseline Scenario (EWP-2007) provides a baseline against which progress for product policy announced in the 2007 Energy White Paper can be established.
- The Low Carbon Transition Plan (LCTP)/Reference Scenario will, in future, be two separate scenarios. Both the LCTP Baseline Scenario and the Reference Scenario are projections of what is likely to happen to the energy consumption of each product if no new product policies were agreed after July 2009. Currently, the two scenarios are the same. However, in future they will differ as newly agreed and formally signed off policies will be added to the Reference Scenario but no new policies will be added to the LCTP Baseline scenario which will remain fixed at July 2009.
- The Policy Scenario is a projection of what will happen if a defined set of additional product-specific and related cross-cutting policies are implemented. The policies in the Policy Scenario have not yet been agreed or funded but represent those policies which are expected to be introduced as well as likely future revisions to existing policies and, in some cases, novel but realistic policy options.
- The Best Available Technology (BAT) Scenario is a hypothetical projection of what would happen if the best available technologies on the (current and future) market were bought or installed from now on.
B. Overview of policy measures
The main policy measures introduced for different products and product groups are:
Minimum standards:
- Minimum Standards via the EU Ecodesign for Energy using Products Directive (EuP) - This Directive establishes mandatory minimum standards through Implementing Measures for a variety of energy-using products (these are expected to generate the largest energy savings).
- Building Regulations - These set mandatory requirements for space heating systems, hot water systems, lighting, cooling and ventilation systems, heat recovery technologies and low and zero carbon technologies.
Labelling:
- Mandatory Energy Labelling – An EU Directive establishes mandatory consumer labelling requirements for a variety of energy-using products.
- EU ENERGY STAR Programme - This voluntary labelling scheme for Information and Communication Technology products, covers monitors, computer and imaging equipment.

139
- Energy Saving Trust Recommended (ESTR) Labelling Scheme - This is a voluntary labelling scheme, which sets minimum performance criteria for a number of energy-using products in the domestic sector.
Obligation on Energy Suppliers:
- Carbon Emissions Reduction Target (CERT) - This is a statutory obligation on energy suppliers to achieve carbon targets by encouraging households to take up energy efficiency and low carbon measures and has included the promotion of energy-efficient products.
Fiscal:
- Enhanced Capital Allowance (ECA) scheme - This scheme provides a fiscal incentive that enables businesses to claim 100% first-year capital allowances on their spending on qualifying energy saving products.
Market based:
- Carbon Reduction Commitment Energy Efficiency Scheme (CRC) - This measure will place a price on carbon emissions, creating an incentive for large non-energy intensive businesses and the public sector to control their CO2 emissions.
For more details of the policies and measures modelled, and considered to have contributed to the expected trends by product, please see the individual product area
annexes. In accordance with the LCTP, savings achieved as a result of government policies have been divided into various packages and attributed in line with the carbon budgets methodology94. This is an evolving process and will be further refined as Government Departments begin to work on their Carbon Budgets. The following table sets out an initial analysis of the attribution of savings by Defra product areas to product policy and the carbon budget packages identified in the LCTP. These breakdowns are illustrative and provisional at the time of writing and may be revised when more work has been carried out in this area.
94
Government has set carbon budgets that are based on the Climate Change Committee‟s (CCC) Interim budgets, consistent with the UK‟s share of the EU‟s target to reduce greenhouse gas emissions to 20% below 1990 levels by 2020. The CCC proposed two sets of carbon budgets for the UK, one to apply now before a global deal on climate change is reached („Interim‟ budgets), and a more challenging set to apply once a global deal on climate change has been agreed („Intended‟ budgets). These are further described in LCTP.

140
Overview of policy splits by Defra product area95 (figures rounded)
Package
Pro
du
ct P
olic
y
Savi
ngs
(Un
con
stra
ined
) (L
ed b
y D
efra
)
Do
me
stic
Ener
gy
Effi
cien
cy
Pac
kage
(N
ot
led
by
Def
ra)
No
n-E
ner
gy
Inte
nsi
ve
Bu
sin
ess
Pac
kage
(N
EIB
)
(CR
C)
(No
t le
d
by
Def
ra)
En
ergy
Inte
nsi
ve
Bu
sin
ess
Pac
kage
(EI
B)
(CC
A)
Un
con
stra
ined
(Oth
er)
(No
t
led
by
Def
ra)
Product Area Total Emissions Savings in 2020 (MtCO2)
Domestic consumer electronics 2.0 2.0 0.0 0.0 0.0 0.0
Domestic appliances 0.8 0.6 0.2 0.0 0.0 0.0
Domestic heating 5.7 3.7 1.9 0.0 0.0 0.0
Domestic lighting 0.5 0.5 0.0 0.0 0.0 0.0
Domestic ICT 0.9 0.9 0.0 0.0 0.0 0.0
Non-Domestic ICT 0.2 0.2 0.0 0.0 0.0 0.0
Non-domestic refrigeration 1.6 1.2 0.0 0.1 0.1 0.2
Non Domestic Motors* 0.0 0.0 0.0 0.0 0.0 0.0
Air conditioning 1.1 0.7 0.0 0.1 0.0 0.3
Non-domestic lighting 1.6 1.1 0.0 0.1 0.0 0.4
Total 14.3 10.9 2.1 0.2 0.2 0.8
C. Key data
Projected Savings from Policy
Scenario by 2020 compared to the 2009 baseline
Projected Savings from Policy Scenario by 2020 compared to the baseline from
2007
Net benefit of product policy (£bn) 2009-2030
Domestica 9.8 14.9 16.1
Non Domesticb 4.5 6.6 9.8
Standby 0.0 2.3 0.0
a Domestic sector includes Consumer Electronics, Domestic Appliances, Domestic Heating, Domestic
Lighting, and the domestic parts of the Air Conditioning, Information & Communication Technology and Circulators. b Non-domestic sector includes Commercial Refrigeration, Non-Domestic Lighting, and the non-
domestic parts of the Air Conditioning, Information & Communication Technology and Motors & Circulators.
D. Policy Gap
Projected policies will deliver substantial savings, exceeding the LCTP aim of doubling the emissions savings expected by the measures agreed so far by 2020, currently estimated at 15MtCO2 per year by 2020 (or twice estimated banked 95
The packages described here are in line with the carbon budgets methodology as set out at Annex A of LCTP Analytical Annex
141
savings of 7⅓MtCO2) and going beyond to reach annual savings of 24MtCO2 by 2020, relative to the EWP-2007 baseline. There is potential for approximately 24MtCO2 of additional annual savings (against the EWP-2007 baseline) achievable by using the best available technologies (BAT). Further savings can be achieved by consumer behaviour-focused policies.
A number of policy options are available to bridge this „gap‟ between the savings achievable between the Policy and BAT scenarios. These focus around building upon, and extending, existing policy mechanisms and supporting technological innovation in energy-using products. Moreover, Government is considering complementary policies focussed around encouraging responsible, energy-saving consumer behaviour, avoiding the potential for a "rebound effect"; as well as investigating the life-cycle effects, balancing the waste and economic effects of earlier or later product replacement with the energy efficiency benefits.
Analysis
Figure A1 presents the total projected CO2 emissions (domestic and non-domestic) under each of the four scenarios. It reflects how CO2 emissions under the different scenarios compare against the Energy White Paper 2007 (EWP) / Low Carbon Transition Plan 2009 LCTP aim of doubling the emissions savings expected by the measures agreed so far by 2020, currently estimated to equate to 15 MtCO2 per year by 2020 (or twice estimated banked savings of 71/3 MtCO2). This aim is depicted by the difference between the EWP-2007 line and the “target” marker on Figure A1. It also reflects how anticipated policies will deliver savings against the LCTP baseline. CO2 emissions are expected to decrease in all scenarios. CO2 emissions are only seen to diverge from 2009 in the different scenarios, as all scenarios are assumed, for the purpose of this Government Standards analysis, to show the same energy consumption and CO2 emissions until this date. It can be seen that prior to 2009, CO2 emissions gradually rose, peaking in 2007. The difference between the LCTP/Reference Scenario and the EWP baseline is due to policies introduced since the Energy White Paper, which includes the minimum energy efficiency standards measures agreed in the EU before July 2009 as well as an agreed revision of CERT and ENERGY STAR. These are expected to have delivered around 10.0MtCO2 representing a banked saving of 68% of the EWP/LCTP target by 2020 (shown by the lower CO2 emissions in the Reference Scenario). These savings are “banked” and will be added to future savings when comparing the impact of product policy against the target. The Policy Scenario is projected to deliver a total of 24 MtCO2 by 2020, relative to the EWP/LCTP baseline96, which is around 1.6 times the EWP/LCTP savings target. The majority of these savings are expected to result from post-July 2009 EuP measures (including the next stage of revisions to these measures).
96
This comparison to the EWP / LCTP target is an approximation, based on a simplified calculation.

142
This comparison, however, does not account for differences between the scope of the Policy Scenario and the EWP-2007 target: the EWP-2007 target was based on the impacts of product policies only. The Policy Scenario includes, in addition, wider policies such as Building Regulations that affect the performance of products. A correction for these differences has been made as part of the carbon budgets analysis. This indicates that the impacts of the same sub-set of policies as included when setting the EWP-2007 target is projected to achieve approximately over one and a third more than the EWP/LCTP target by 2020.
Figure A1 Projected CO2 emissions of all scenarios
Under the BAT Scenario, further savings of 24 MtCO2 by 2020 are projected to be possible, relative to the Policy Scenario. The BAT Scenario assumes the best available technologies are sold across all product groups. There are currently, however, no specific policies in place to access these additional savings. Moreover, the BAT scenario reflects the best available technology at a given time without taking into account the ease of availability of that technology. By 2030, the difference between the Policy and BAT Scenarios has reduced slightly to 21 MtCO2. Nonetheless, this still represents a substantial savings potential. The figures below illustrate the corresponding energy consumption in the different scenarios, separated by fuel type. Figure A2 represents electricity consumption Figure A3 other fuels (including gas, oil and biomass)

143
Figure A2 Electricity consumption in the Reference, Policy and BAT scenarios97, 98
Figure A3 Other fuels (gas, oil and biomass) energy consumption in the Reference, Policy and BAT scenarios99, 100
97
This graph represents end use energy consumption and does not include HRE. 98
The y axis of this graph does not go through the origin/zero. 99
This graph represents end use energy consumption and does not include HRE. 100
The y axis of this graph does not go through the origin/zero.

144
5.2 Consumption by Product Groups
Figure A4 breaks down CO2 emissions under the LCTP/Reference Scenario by product area, covering both domestic and non-domestic sectors. The breakdown by product group can be found in Table A1. Figure A5 and Figure A6 present the same breakdown by energy for electricity and other fuels, respectively. Table A2 and Table A3 present this projected energy consumption data. The domestic sector dominates, accounting for around 67% of CO2 emissions in 2020. Domestic heating represents around a half of total CO2 emissions due to high levels of ownership, with practically all households having some form of heating system, and relatively high unit power consumption. Lighting consumption (domestic and non-domestic) is relatively low due to the inclusion of the EuP measures on lighting in the Reference Scenario.
Figure A4 Projected CO2 emissions by product group, Reference Scenario
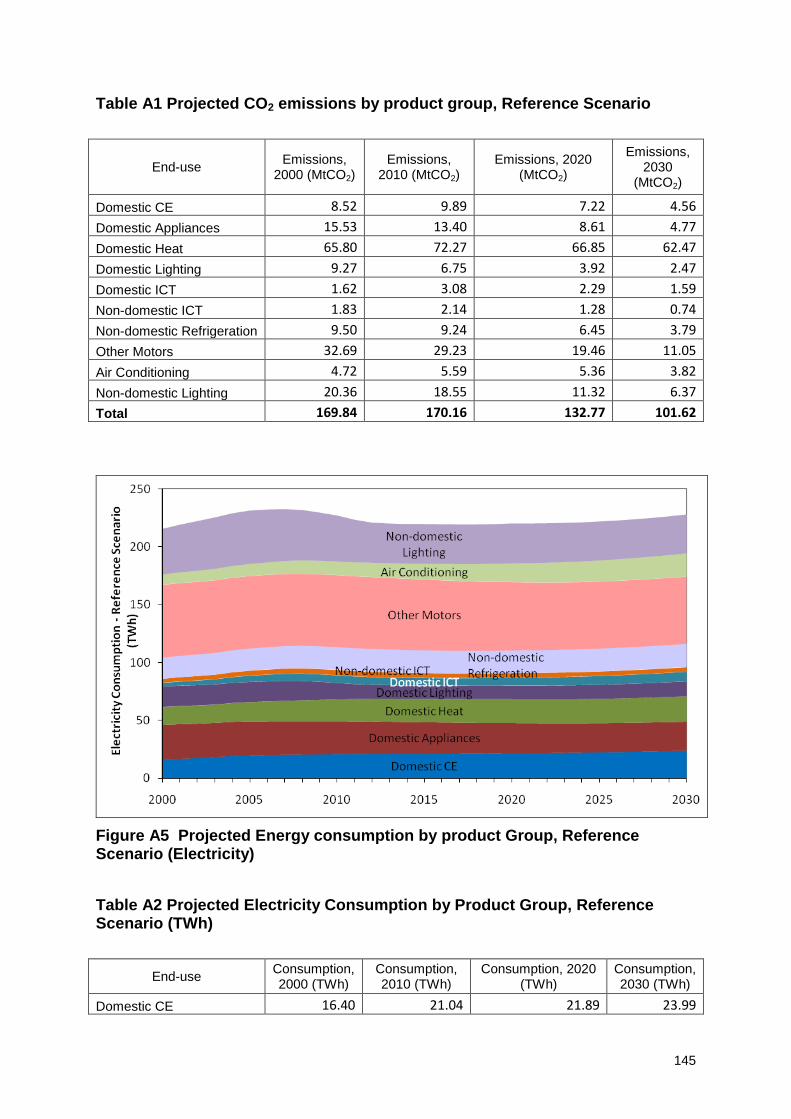
145
Table A1 Projected CO2 emissions by product group, Reference Scenario
End-use Emissions,
2000 (MtCO2) Emissions,
2010 (MtCO2) Emissions, 2020
(MtCO2)
Emissions, 2030
(MtCO2)
Domestic CE 8.52 9.89 7.22 4.56
Domestic Appliances 15.53 13.40 8.61 4.77
Domestic Heat 65.80 72.27 66.85 62.47
Domestic Lighting 9.27 6.75 3.92 2.47
Domestic ICT 1.62 3.08 2.29 1.59
Non-domestic ICT 1.83 2.14 1.28 0.74
Non-domestic Refrigeration 9.50 9.24 6.45 3.79
Other Motors 32.69 29.23 19.46 11.05
Air Conditioning 4.72 5.59 5.36 3.82
Non-domestic Lighting 20.36 18.55 11.32 6.37
Total 169.84 170.16 132.77 101.62
Figure A5 Projected Energy consumption by product Group, Reference Scenario (Electricity)
Table A2 Projected Electricity Consumption by Product Group, Reference Scenario (TWh)
End-use Consumption, 2000 (TWh)
Consumption, 2010 (TWh)
Consumption, 2020 (TWh)
Consumption, 2030 (TWh)
Domestic CE 16.40 21.04 21.89 23.99

146
Domestic Appliances 29.90 28.52 26.09 25.11
Domestic Heat 15.17 18.66 20.35 21.81
Domestic Lighting 17.85 14.37 11.88 12.98
Domestic ICT 3.12 6.56 6.93 8.36
Non-domestic ICT 3.51 4.55 3.88 3.88
Non-domestic Refrigeration 18.29 19.67 19.55 19.97
Other Motors 62.93 62.20 58.98 58.14
Air Conditioning 9.08 11.90 16.23 20.09
Non-domestic Lighting 39.19 39.47 34.30 33.54
Total 215.44 226.94 220.08 227.87
Figure A6 Projected Energy consumption by Product Group, Reference Scenario (Other fuels)
Table A3 Projected Energy consumption by Product Group, Reference Scenario (Other fuels)
End-use Consumption, 2000 (TWh)
Consumption, 2010 (TWh)
Consumption, 2020 (TWh)
Consumption, 2030 (TWh)
Gas 278.57 302.92 287.25 279.41
Oil 25.16 29.28 27.49 26.10
Biomass 0.00 0.00 0.48 1.73
Total 303.73 332.20 315.22 307.24

147
Table A4 shows the energy consumption by product area for the Reference Scenario in 2009 and 2020.
Table A4 Energy consumption per product area (TWh/year)
LCTP/Reference
2009101
LCTP/Reference 2020
Domestic consumer electronics 21 22
Domestic appliances 29 26
Domestic heating 360 336
Domestic lighting 16 12
Domestic ICT 6 7
Non-Domestic ICT 5 4
Non-domestic refrigeration 20 20
Non-Domestic Motors 62 59
Air conditioning 12 16
Non-domestic lighting 41 34
Total 571 535
In the LCTP/Reference Scenarios, CO2 emissions in many product areas are expected to remain more or less constant. The most notable exception is domestic heating where CO2 emissions fall due to a shift towards lower carbon technologies and improvements in building fabric, which are expected to result in lower heating demand. Emissions from domestic and non-domestic lighting, cold appliances and motors also decrease, principally due to agreed EuP measures. Figure A7 and Figure A8 shows the projected electricity and other fuel consumptions in the Policy scenario. This data is broken down in Table A5 and Table A6.
101 Non-domestic energy consumption figures in this document have been scaled down to match DECC's projections for overall energy demand in the non-domestic sector (www.decc.gov.uk/en/content/cms/statistics/statistics.aspx).
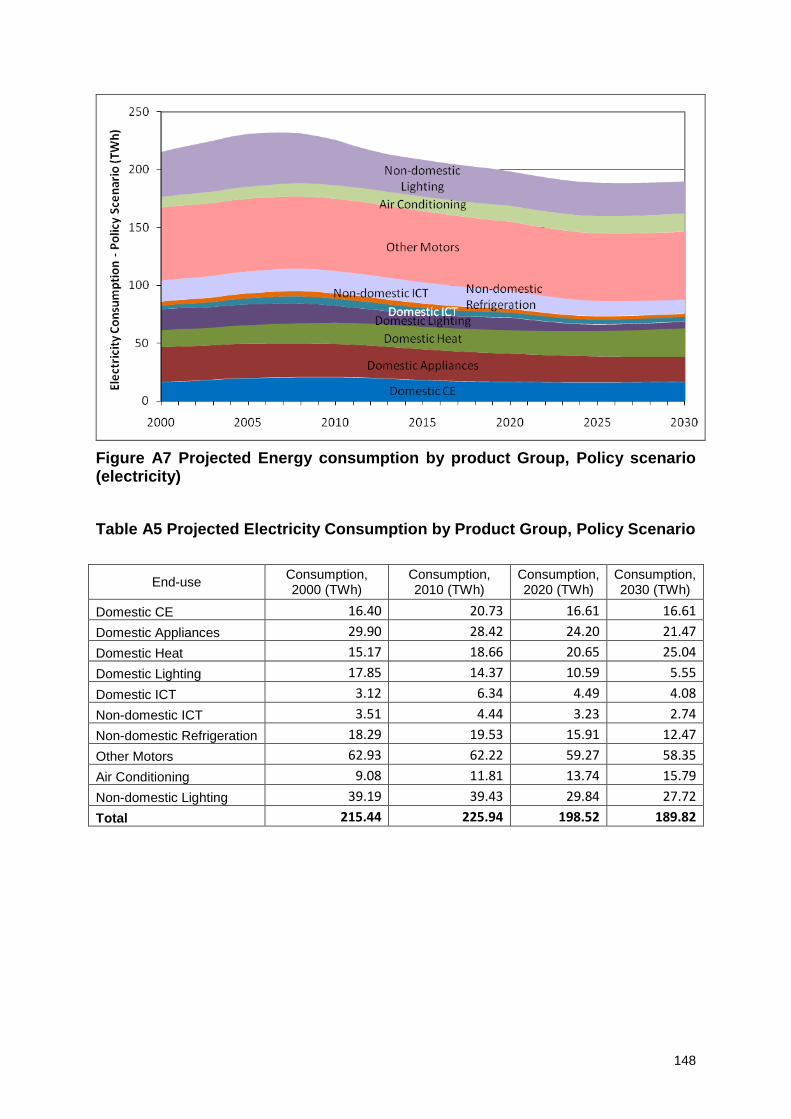
148
Figure A7 Projected Energy consumption by product Group, Policy scenario (electricity)
Table A5 Projected Electricity Consumption by Product Group, Policy Scenario
End-use Consumption, 2000 (TWh)
Consumption, 2010 (TWh)
Consumption, 2020 (TWh)
Consumption, 2030 (TWh)
Domestic CE 16.40 20.73 16.61 16.61
Domestic Appliances 29.90 28.42 24.20 21.47
Domestic Heat 15.17 18.66 20.65 25.04
Domestic Lighting 17.85 14.37 10.59 5.55
Domestic ICT 3.12 6.34 4.49 4.08
Non-domestic ICT 3.51 4.44 3.23 2.74
Non-domestic Refrigeration 18.29 19.53 15.91 12.47
Other Motors 62.93 62.22 59.27 58.35
Air Conditioning 9.08 11.81 13.74 15.79
Non-domestic Lighting 39.19 39.43 29.84 27.72
Total 215.44 225.94 198.52 189.82

149
Figure A8 Projected Energy consumption by product Group, Policy scenario (other fuels)
Table A6 Projected Energy Consumption by Fuel type, Policy Scenario (TWh)
End-use Consumption, 2000 (TWh)
Consumption, 2010 (TWh)
Consumption, 2020 (TWh)
Consumption, 2030 (TWh)
Gas 278.57 302.17 260.70 231.31
Oil 25.16 29.18 24.08 19.17
Biomass 0.00 0.00 1.85 6.64
Extra Heating (HRE) (Gas) 0.00 0.22 4.67 8.81
Total 303.73 331.57 291.29 265.92
Figure A9 shows the projected CO2 emissions by product group in the Policy scenario. This data is broken down in Table A7.
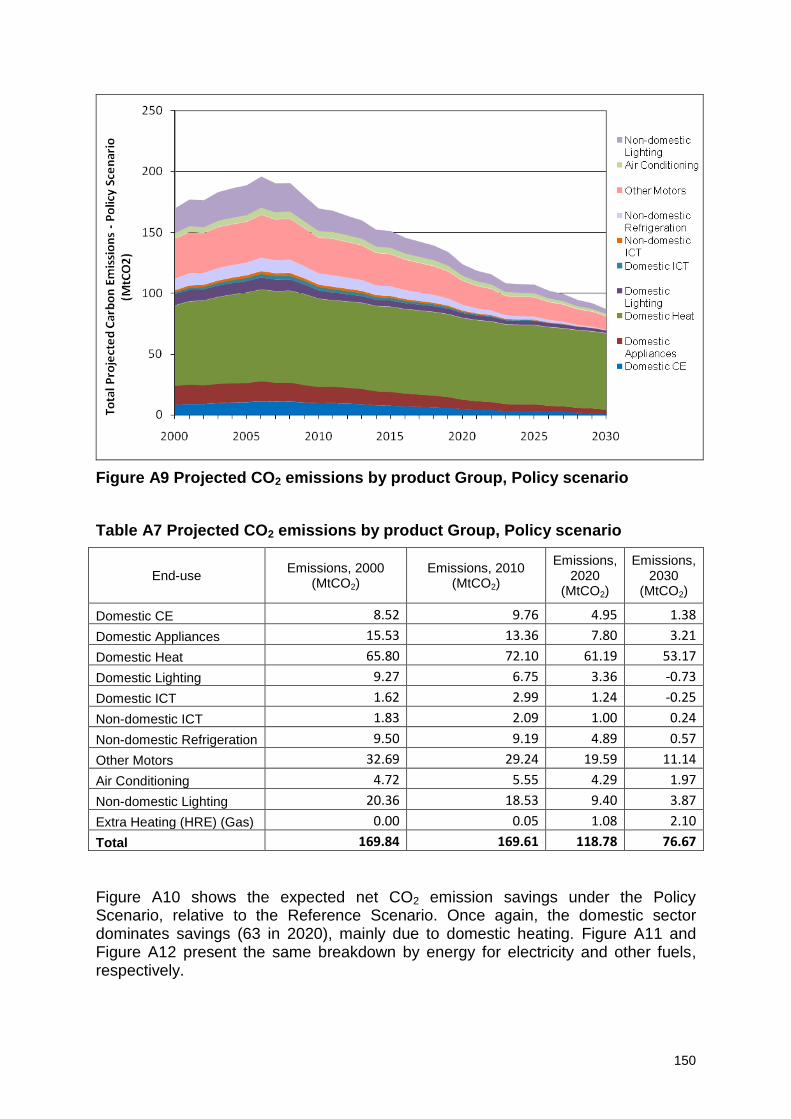
150
Figure A9 Projected CO2 emissions by product Group, Policy scenario
Table A7 Projected CO2 emissions by product Group, Policy scenario
End-use Emissions, 2000
(MtCO2) Emissions, 2010
(MtCO2)
Emissions, 2020
(MtCO2)
Emissions, 2030
(MtCO2)
Domestic CE 8.52 9.76 4.95 1.38
Domestic Appliances 15.53 13.36 7.80 3.21
Domestic Heat 65.80 72.10 61.19 53.17
Domestic Lighting 9.27 6.75 3.36 -0.73
Domestic ICT 1.62 2.99 1.24 -0.25
Non-domestic ICT 1.83 2.09 1.00 0.24
Non-domestic Refrigeration 9.50 9.19 4.89 0.57
Other Motors 32.69 29.24 19.59 11.14
Air Conditioning 4.72 5.55 4.29 1.97
Non-domestic Lighting 20.36 18.53 9.40 3.87
Extra Heating (HRE) (Gas) 0.00 0.05 1.08 2.10
Total 169.84 169.61 118.78 76.67
Figure A10 shows the expected net CO2 emission savings under the Policy Scenario, relative to the Reference Scenario. Once again, the domestic sector dominates savings (63 in 2020), mainly due to domestic heating. Figure A11 and Figure A12 present the same breakdown by energy for electricity and other fuels, respectively.

151
By 2020, annual savings are projected to be around 14 MtCO2, rising to 25MtCO2 in 2030, representing a 11% and 25% reduction over the LCTP/Reference Scenario, respectively. This is a significant improvement, however, still just over half of the 20% reduction required, assuming an equal distribution of the EU 20/20/20 targets across all sectors.
Figure A10 Projected CO2 emission savings by product group, Policy Scenario
Table A8 Projected CO2 emission savings by product group, Policy Scenario
End-use Emissions Savings,
2010 (MtCO2) Emissions Savings, 2020
(MtCO2)
Emissions Savings, 2030
(MtCO2)
Domestic CE 0.11 1.99 2.78
Domestic Appliances 0.04 0.75 1.41
Domestic Heat 0.16 5.65 9.29
Domestic Lighting 0.00 0.49 2.81
Domestic ICT 0.08 0.92 1.61
Non-domestic ICT 0.04 0.23 0.41
Non-domestic Refrigeration 0.06 1.56 3.23
Other Motors 0.00 0.00 0.00
Air Conditioning 0.04 1.07 1.85
Non-domestic Lighting 0.01 1.60 2.08
Total 0.56 14.27 25.48
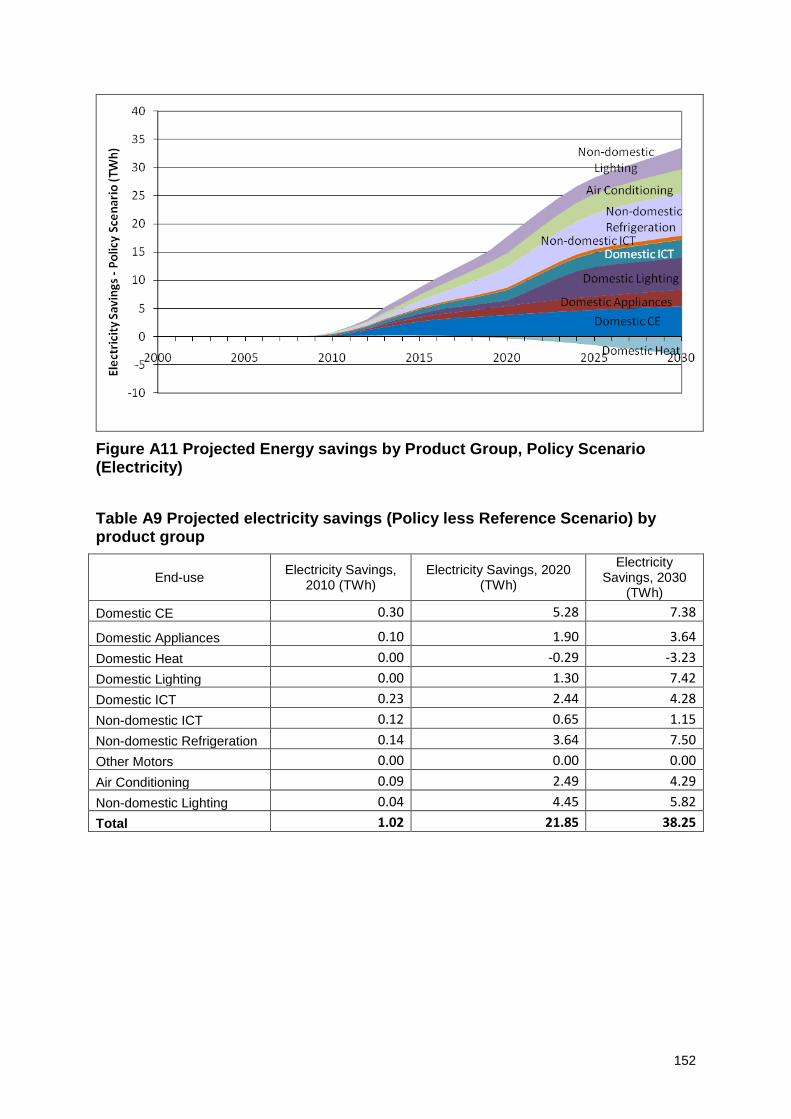
152
Figure A11 Projected Energy savings by Product Group, Policy Scenario (Electricity)
Table A9 Projected electricity savings (Policy less Reference Scenario) by product group
End-use Electricity Savings,
2010 (TWh) Electricity Savings, 2020
(TWh)
Electricity Savings, 2030
(TWh)
Domestic CE 0.30 5.28 7.38
Domestic Appliances 0.10 1.90 3.64
Domestic Heat 0.00 -0.29 -3.23
Domestic Lighting 0.00 1.30 7.42
Domestic ICT 0.23 2.44 4.28
Non-domestic ICT 0.12 0.65 1.15
Non-domestic Refrigeration 0.14 3.64 7.50
Other Motors 0.00 0.00 0.00
Air Conditioning 0.09 2.49 4.29
Non-domestic Lighting 0.04 4.45 5.82
Total 1.02 21.85 38.25
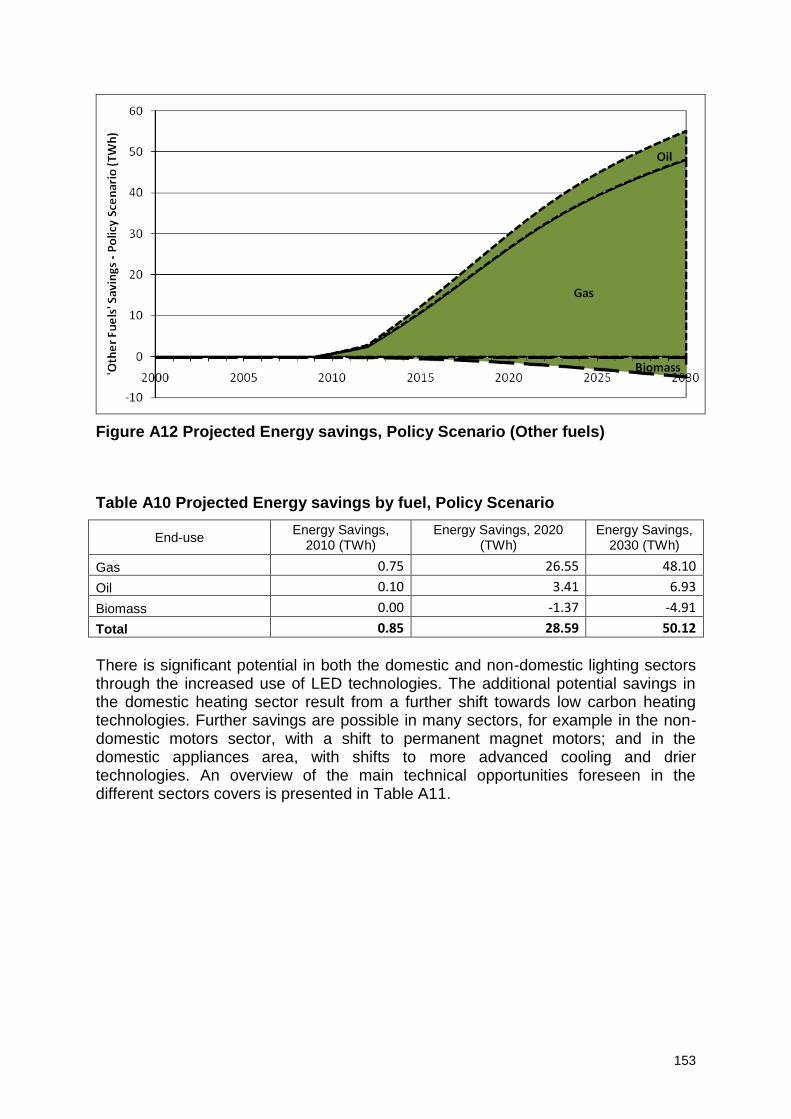
153
Figure A12 Projected Energy savings, Policy Scenario (Other fuels)
Table A10 Projected Energy savings by fuel, Policy Scenario
End-use Energy Savings,
2010 (TWh) Energy Savings, 2020
(TWh) Energy Savings,
2030 (TWh)
Gas 0.75 26.55 48.10
Oil 0.10 3.41 6.93
Biomass 0.00 -1.37 -4.91
Total 0.85 28.59 50.12
There is significant potential in both the domestic and non-domestic lighting sectors through the increased use of LED technologies. The additional potential savings in the domestic heating sector result from a further shift towards low carbon heating technologies. Further savings are possible in many sectors, for example in the non-domestic motors sector, with a shift to permanent magnet motors; and in the domestic appliances area, with shifts to more advanced cooling and drier technologies. An overview of the main technical opportunities foreseen in the different sectors covers is presented in Table A11.
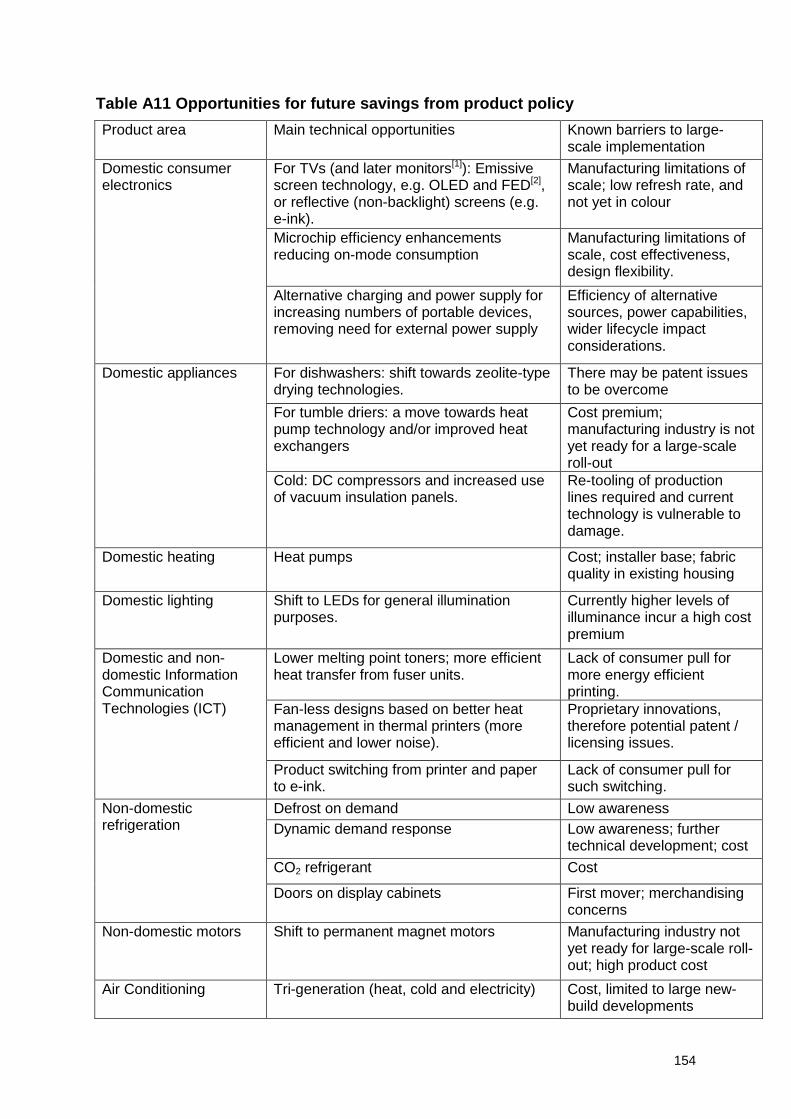
154
Table A11 Opportunities for future savings from product policy
Product area Main technical opportunities Known barriers to large-scale implementation
Domestic consumer electronics
For TVs (and later monitors[1]): Emissive screen technology, e.g. OLED and FED[2], or reflective (non-backlight) screens (e.g. e-ink).
Manufacturing limitations of scale; low refresh rate, and not yet in colour
Microchip efficiency enhancements reducing on-mode consumption
Manufacturing limitations of scale, cost effectiveness, design flexibility.
Alternative charging and power supply for increasing numbers of portable devices, removing need for external power supply
Efficiency of alternative sources, power capabilities, wider lifecycle impact considerations.
Domestic appliances For dishwashers: shift towards zeolite-type drying technologies.
There may be patent issues to be overcome
For tumble driers: a move towards heat pump technology and/or improved heat exchangers
Cost premium; manufacturing industry is not yet ready for a large-scale roll-out
Cold: DC compressors and increased use of vacuum insulation panels.
Re-tooling of production lines required and current technology is vulnerable to damage.
Domestic heating Heat pumps Cost; installer base; fabric quality in existing housing
Domestic lighting Shift to LEDs for general illumination purposes.
Currently higher levels of illuminance incur a high cost premium
Domestic and non-domestic Information Communication Technologies (ICT)
Lower melting point toners; more efficient heat transfer from fuser units.
Lack of consumer pull for more energy efficient printing.
Fan-less designs based on better heat management in thermal printers (more efficient and lower noise).
Proprietary innovations, therefore potential patent / licensing issues.
Product switching from printer and paper to e-ink.
Lack of consumer pull for such switching.
Non-domestic refrigeration
Defrost on demand Low awareness
Dynamic demand response Low awareness; further technical development; cost
CO2 refrigerant Cost
Doors on display cabinets First mover; merchandising concerns
Non-domestic motors Shift to permanent magnet motors Manufacturing industry not yet ready for large-scale roll-out; high product cost
Air Conditioning Tri-generation (heat, cold and electricity) Cost, limited to large new-build developments
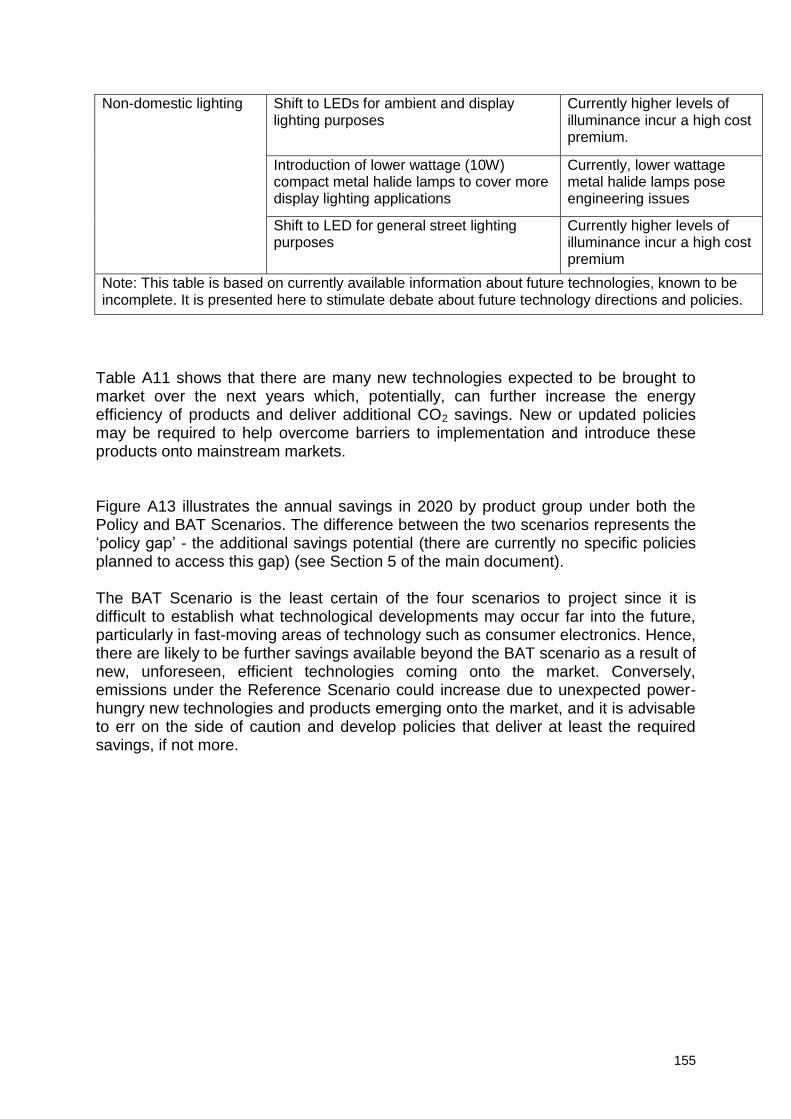
155
Non-domestic lighting Shift to LEDs for ambient and display lighting purposes
Currently higher levels of illuminance incur a high cost premium.
Introduction of lower wattage (10W) compact metal halide lamps to cover more display lighting applications
Currently, lower wattage metal halide lamps pose engineering issues
Shift to LED for general street lighting purposes
Currently higher levels of illuminance incur a high cost premium
Note: This table is based on currently available information about future technologies, known to be incomplete. It is presented here to stimulate debate about future technology directions and policies.
Table A11 shows that there are many new technologies expected to be brought to market over the next years which, potentially, can further increase the energy efficiency of products and deliver additional CO2 savings. New or updated policies may be required to help overcome barriers to implementation and introduce these products onto mainstream markets. Figure A13 illustrates the annual savings in 2020 by product group under both the Policy and BAT Scenarios. The difference between the two scenarios represents the „policy gap‟ - the additional savings potential (there are currently no specific policies planned to access this gap) (see Section 5 of the main document). The BAT Scenario is the least certain of the four scenarios to project since it is difficult to establish what technological developments may occur far into the future, particularly in fast-moving areas of technology such as consumer electronics. Hence, there are likely to be further savings available beyond the BAT scenario as a result of new, unforeseen, efficient technologies coming onto the market. Conversely, emissions under the Reference Scenario could increase due to unexpected power-hungry new technologies and products emerging onto the market, and it is advisable to err on the side of caution and develop policies that deliver at least the required savings, if not more.

156
Figure A13 Annual CO2 emission reductions in 2020 by product group under Policy and BAT Scenarios
5.3 Costs and benefits of product policy
An estimate of the costs and benefits over the period 2009-2030 of the policy packages included in the Policy Scenario have been made for each product group (Table A12). Benefits include the financial savings resulting from reduced electricity consumption of more efficient appliances plus consequent benefits of reductions in CO2 emissions across UK and improvements in air quality as a result of less electricity being generated at power stations. Costs include the cost to Government, industry and consumers of the proposed policy packages. In the majority of cases, it is assumed that the manufacturers (often outside the UK and in some cases outside the EU) will pass the bulk of any cost increase onto consumers.
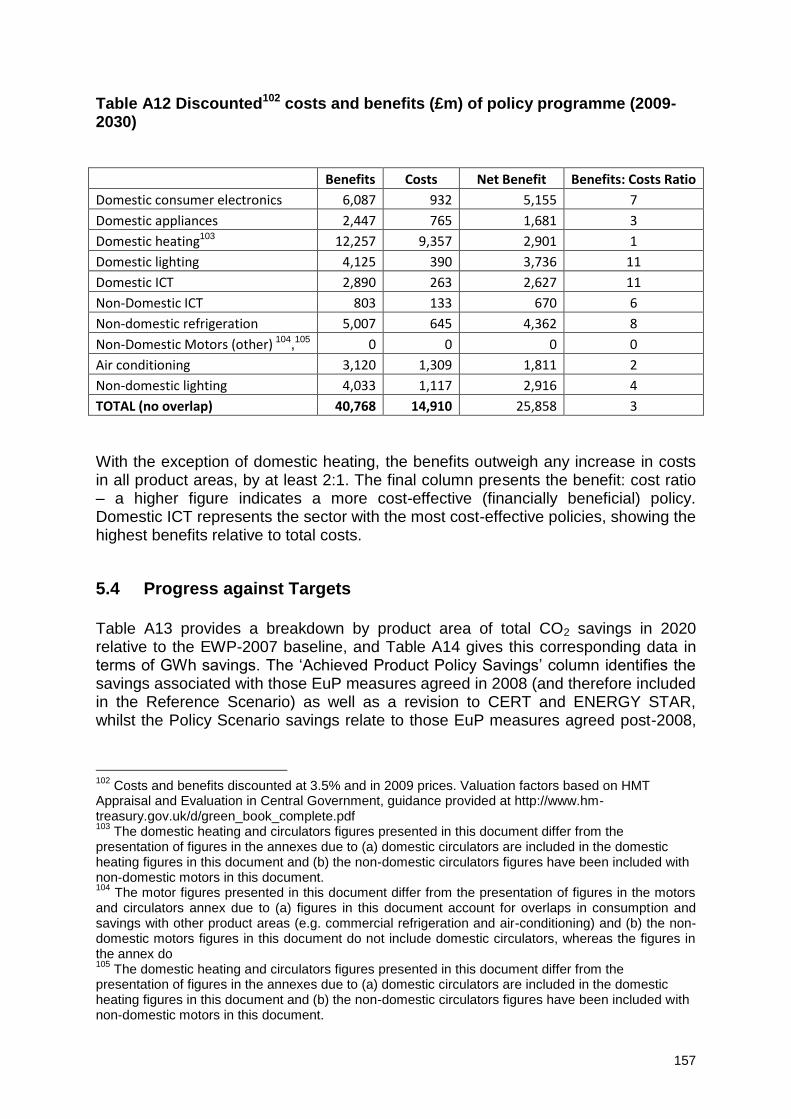
157
Table A12 Discounted102 costs and benefits (£m) of policy programme (2009-2030)
Benefits Costs Net Benefit Benefits: Costs Ratio
Domestic consumer electronics 6,087 932 5,155 7
Domestic appliances 2,447 765 1,681 3
Domestic heating103 12,257 9,357 2,901 1
Domestic lighting 4,125 390 3,736 11
Domestic ICT 2,890 263 2,627 11
Non-Domestic ICT 803 133 670 6
Non-domestic refrigeration 5,007 645 4,362 8
Non-Domestic Motors (other) 104,105 0 0 0 0
Air conditioning 3,120 1,309 1,811 2
Non-domestic lighting 4,033 1,117 2,916 4
TOTAL (no overlap) 40,768 14,910 25,858 3
With the exception of domestic heating, the benefits outweigh any increase in costs in all product areas, by at least 2:1. The final column presents the benefit: cost ratio – a higher figure indicates a more cost-effective (financially beneficial) policy. Domestic ICT represents the sector with the most cost-effective policies, showing the highest benefits relative to total costs.
5.4 Progress against Targets
Table A13 provides a breakdown by product area of total CO2 savings in 2020 relative to the EWP-2007 baseline, and Table A14 gives this corresponding data in terms of GWh savings. The „Achieved Product Policy Savings‟ column identifies the savings associated with those EuP measures agreed in 2008 (and therefore included in the Reference Scenario) as well as a revision to CERT and ENERGY STAR, whilst the Policy Scenario savings relate to those EuP measures agreed post-2008,
102
Costs and benefits discounted at 3.5% and in 2009 prices. Valuation factors based on HMT Appraisal and Evaluation in Central Government, guidance provided at http://www.hm-treasury.gov.uk/d/green_book_complete.pdf 103
The domestic heating and circulators figures presented in this document differ from the presentation of figures in the annexes due to (a) domestic circulators are included in the domestic heating figures in this document and (b) the non-domestic circulators figures have been included with non-domestic motors in this document. 104
The motor figures presented in this document differ from the presentation of figures in the motors and circulators annex due to (a) figures in this document account for overlaps in consumption and savings with other product areas (e.g. commercial refrigeration and air-conditioning) and (b) the non-domestic motors figures in this document do not include domestic circulators, whereas the figures in the annex do 105
The domestic heating and circulators figures presented in this document differ from the presentation of figures in the annexes due to (a) domestic circulators are included in the domestic heating figures in this document and (b) the non-domestic circulators figures have been included with non-domestic motors in this document.
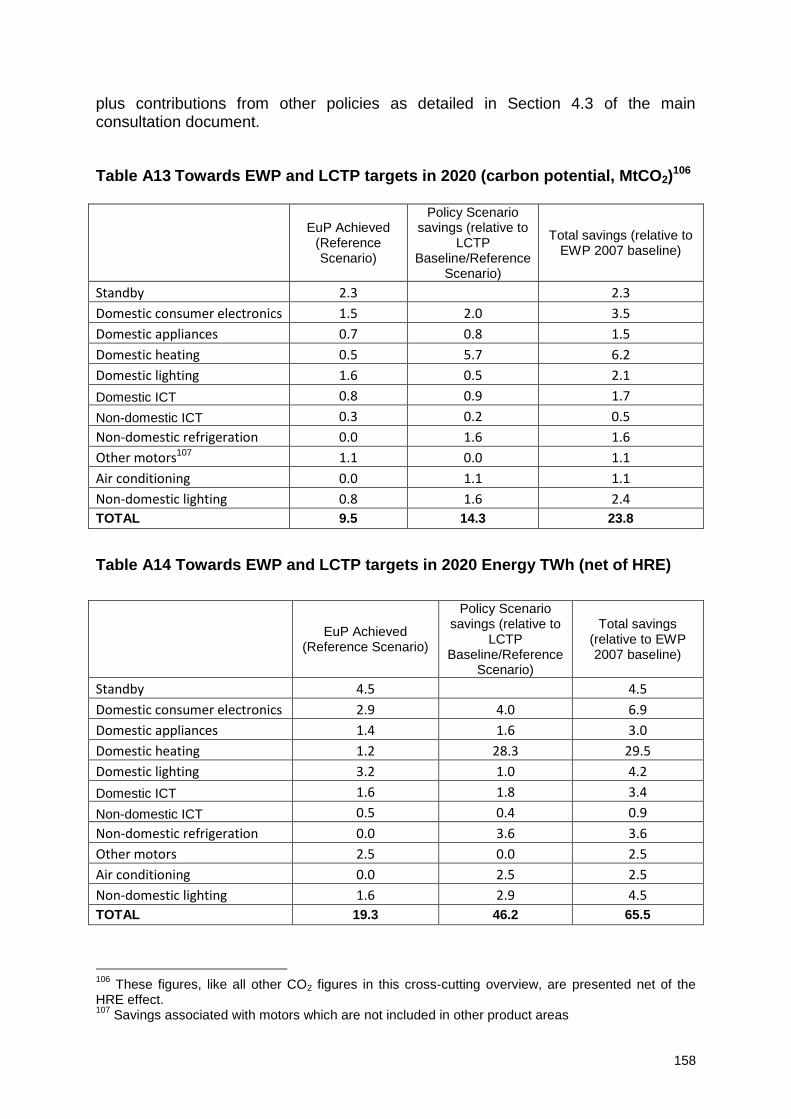
158
plus contributions from other policies as detailed in Section 4.3 of the main consultation document.
Table A13 Towards EWP and LCTP targets in 2020 (carbon potential, MtCO2)106
EuP Achieved
(Reference Scenario)
Policy Scenario savings (relative to
LCTP Baseline/Reference
Scenario)
Total savings (relative to EWP 2007 baseline)
Standby 2.3 2.3
Domestic consumer electronics 1.5 2.0 3.5
Domestic appliances 0.7 0.8 1.5
Domestic heating 0.5 5.7 6.2
Domestic lighting 1.6 0.5 2.1
Domestic ICT 0.8 0.9 1.7
Non-domestic ICT 0.3 0.2 0.5
Non-domestic refrigeration 0.0 1.6 1.6
Other motors107 1.1 0.0 1.1
Air conditioning 0.0 1.1 1.1
Non-domestic lighting 0.8 1.6 2.4
TOTAL 9.5 14.3 23.8
Table A14 Towards EWP and LCTP targets in 2020 Energy TWh (net of HRE)
EuP Achieved
(Reference Scenario)
Policy Scenario savings (relative to
LCTP Baseline/Reference
Scenario)
Total savings (relative to EWP 2007 baseline)
Standby 4.5 4.5
Domestic consumer electronics 2.9 4.0 6.9
Domestic appliances 1.4 1.6 3.0
Domestic heating 1.2 28.3 29.5
Domestic lighting 3.2 1.0 4.2
Domestic ICT 1.6 1.8 3.4
Non-domestic ICT 0.5 0.4 0.9
Non-domestic refrigeration 0.0 3.6 3.6
Other motors 2.5 0.0 2.5
Air conditioning 0.0 2.5 2.5
Non-domestic lighting 1.6 2.9 4.5
TOTAL 19.3 46.2 65.5
106
These figures, like all other CO2 figures in this cross-cutting overview, are presented net of the HRE effect. 107
Savings associated with motors which are not included in other product areas
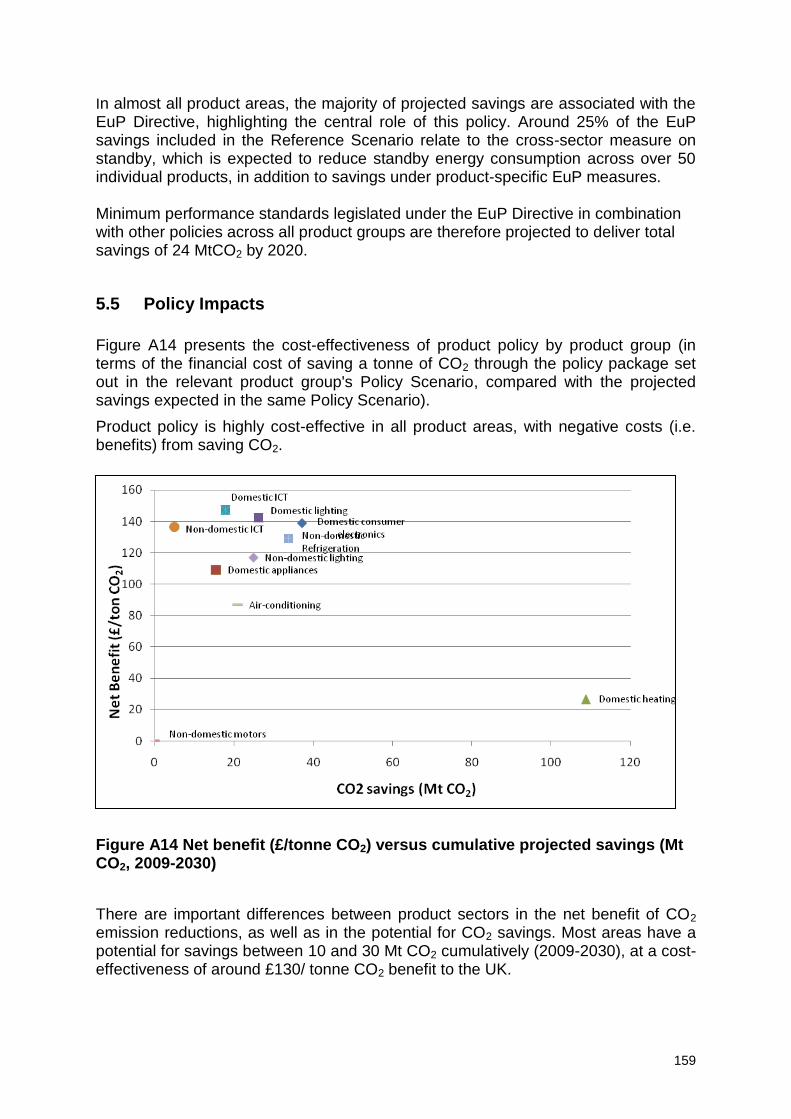
159
In almost all product areas, the majority of projected savings are associated with the EuP Directive, highlighting the central role of this policy. Around 25% of the EuP savings included in the Reference Scenario relate to the cross-sector measure on standby, which is expected to reduce standby energy consumption across over 50 individual products, in addition to savings under product-specific EuP measures. Minimum performance standards legislated under the EuP Directive in combination with other policies across all product groups are therefore projected to deliver total savings of 24 MtCO2 by 2020.
5.5 Policy Impacts
Figure A14 presents the cost-effectiveness of product policy by product group (in terms of the financial cost of saving a tonne of CO2 through the policy package set out in the relevant product group's Policy Scenario, compared with the projected savings expected in the same Policy Scenario).
Product policy is highly cost-effective in all product areas, with negative costs (i.e. benefits) from saving CO2.
Figure A14 Net benefit (£/tonne CO2) versus cumulative projected savings (Mt CO2, 2009-2030)
There are important differences between product sectors in the net benefit of CO2 emission reductions, as well as in the potential for CO2 savings. Most areas have a potential for savings between 10 and 30 Mt CO2 cumulatively (2009-2030), at a cost-effectiveness of around £130/ tonne CO2 benefit to the UK.
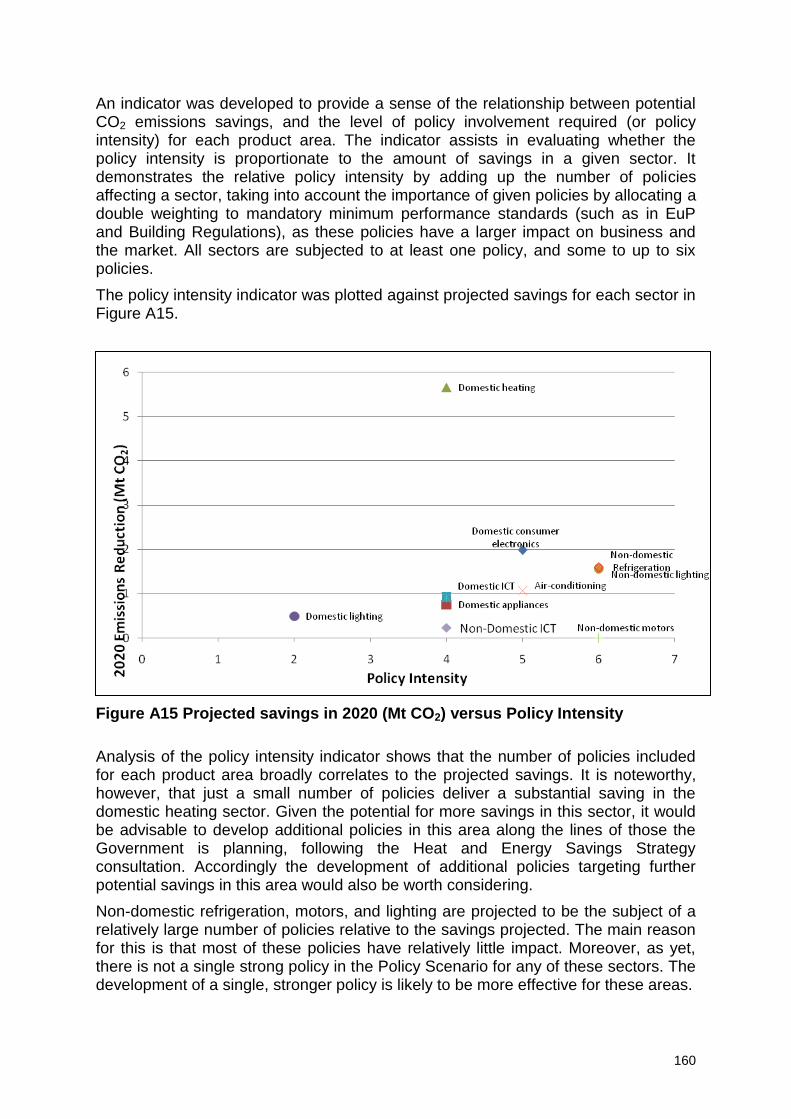
160
An indicator was developed to provide a sense of the relationship between potential CO2 emissions savings, and the level of policy involvement required (or policy intensity) for each product area. The indicator assists in evaluating whether the policy intensity is proportionate to the amount of savings in a given sector. It demonstrates the relative policy intensity by adding up the number of policies affecting a sector, taking into account the importance of given policies by allocating a double weighting to mandatory minimum performance standards (such as in EuP and Building Regulations), as these policies have a larger impact on business and the market. All sectors are subjected to at least one policy, and some to up to six policies.
The policy intensity indicator was plotted against projected savings for each sector in Figure A15.
Figure A15 Projected savings in 2020 (Mt CO2) versus Policy Intensity
Analysis of the policy intensity indicator shows that the number of policies included for each product area broadly correlates to the projected savings. It is noteworthy, however, that just a small number of policies deliver a substantial saving in the domestic heating sector. Given the potential for more savings in this sector, it would be advisable to develop additional policies in this area along the lines of those the Government is planning, following the Heat and Energy Savings Strategy consultation. Accordingly the development of additional policies targeting further potential savings in this area would also be worth considering.
Non-domestic refrigeration, motors, and lighting are projected to be the subject of a relatively large number of policies relative to the savings projected. The main reason for this is that most of these policies have relatively little impact. Moreover, as yet, there is not a single strong policy in the Policy Scenario for any of these sectors. The development of a single, stronger policy is likely to be more effective for these areas.