Embed Size (px)
Citation preview
1 of 58
chapter:
10
>>
Krugman/Wells
©2009 Worth Publishers
Savings, InvestmentSpending, and theFinancial System
2 of 58
WHAT YOU WILL LEARN IN THIS CHAPTER
The relationship between savings and investmentspending
Aspects of the loanable funds market, whichshows how savers are matched with borrowers
The purpose of the five principal types of assets:stocks, bonds, loans, real estate and bankdeposits
How financial intermediaries help investorsachieve diversification
Some competing views of what determines stockprices and why stock market fluctuations can be asource of macroeconomic instability
3 of 58
Matching Up Savings and Investment Spending
According to the savings–investment spendingidentity, savings and investment spending arealways equal for the economy as a whole.
The budget surplus is the difference between taxrevenue and government spending when taxrevenue exceeds government spending.
The budget deficit is the difference between taxrevenue and government spending whengovernment spending exceeds tax revenue.
4 of 58
Matching Up Savings and Investment Spending
The budget balance is the difference between taxrevenue and government spending.
National savings, the sum of private savings plusthe budget balance, is the total amount of savingsgenerated within the economy.
Capital inflow is the net inflow of funds into acountry.
5 of 58
The Savings–Investment Spending Identity
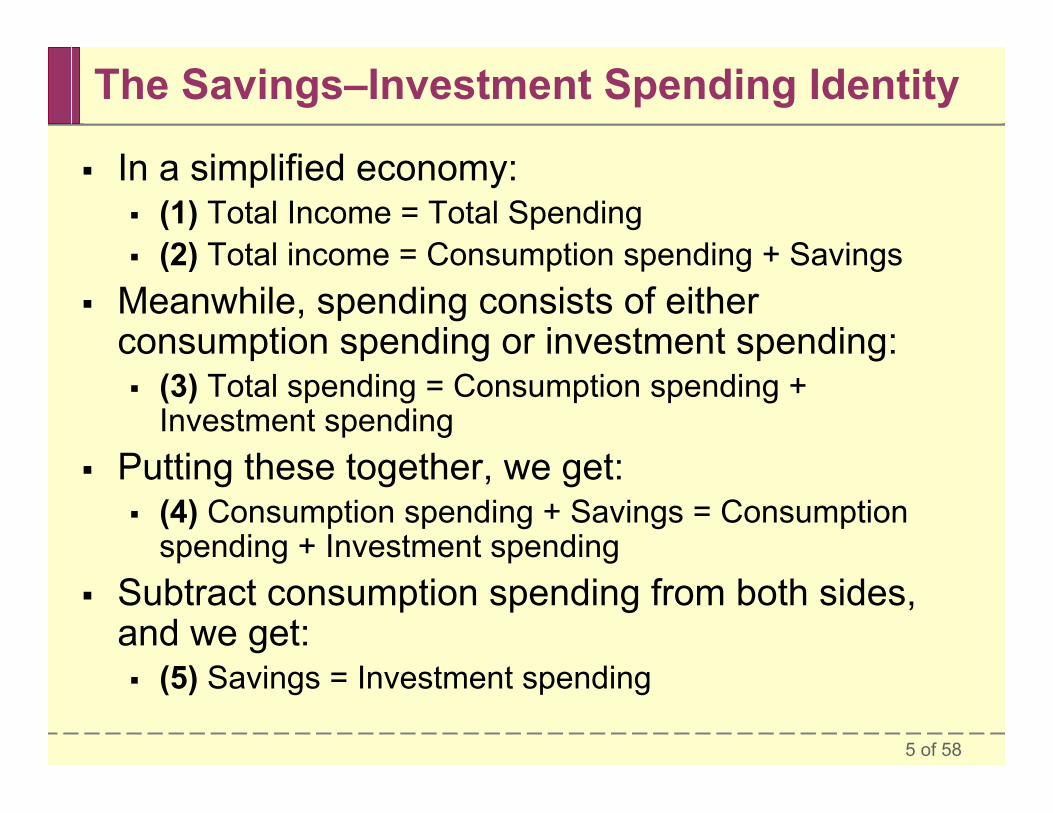
In a simplified economy: (1) Total Income = Total Spending (2) Total income = Consumption spending + Savings
Meanwhile, spending consists of eitherconsumption spending or investment spending: (3) Total spending = Consumption spending +
Investment spending Putting these together, we get:
(4) Consumption spending + Savings = Consumptionspending + Investment spending
Subtract consumption spending from both sides,and we get: (5) Savings = Investment spending
6 of 58
The Savings–Investment Spending Identity
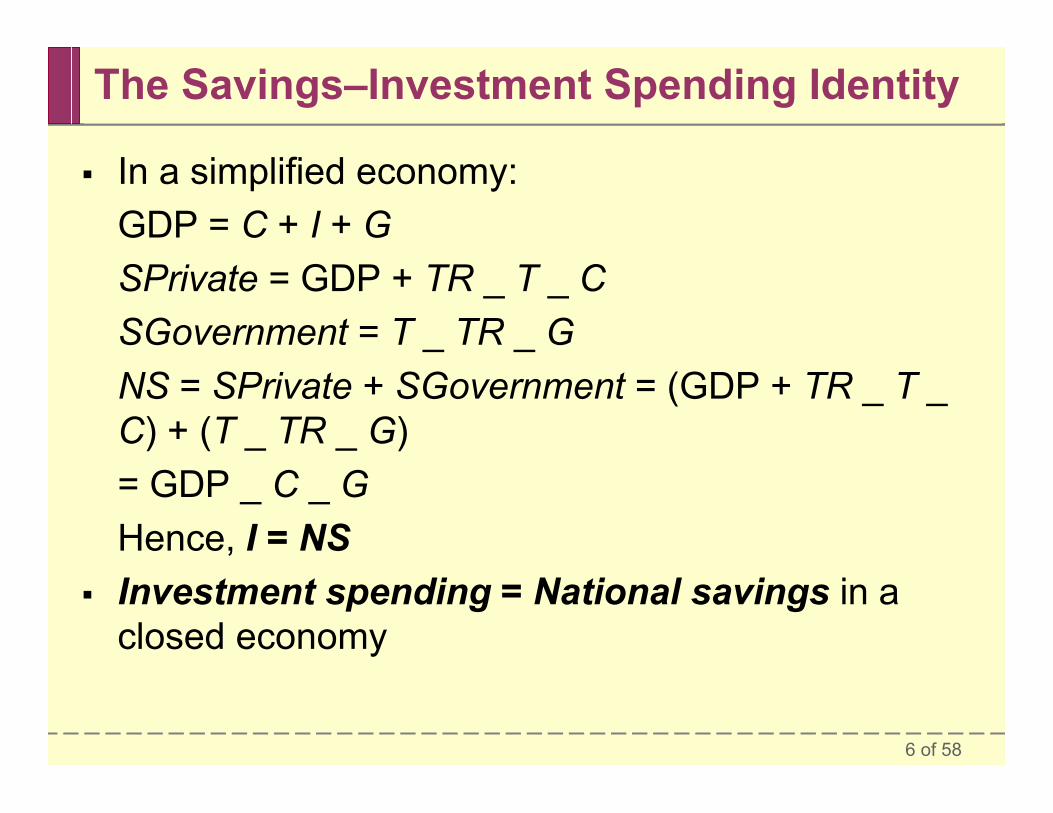
In a simplified economy:GDP = C + I + GSPrivate = GDP + TR _ T _ CSGovernment = T _ TR _ GNS = SPrivate + SGovernment = (GDP + TR _ T _C) + (T _ TR _ G)= GDP _ C _ GHence, I = NS
Investment spending = National savings in aclosed economy
7 of 58
PITFALLS
Investment versus investment spending When macroeconomists use the term investment spending,
they almost always mean “spending on new physical capital.”This can be confusing, because in ordinary life we often saythat someone who buys stocks or purchases an existingbuilding is “investing.”
The important point to keep in mind is that only spendingthat adds to the economy’s stock of physical capital is“investment spending.” In contrast, the act of purchasing anasset such as a share of stock, a bond, or existing realestate is “making an investment.”
8 of 58
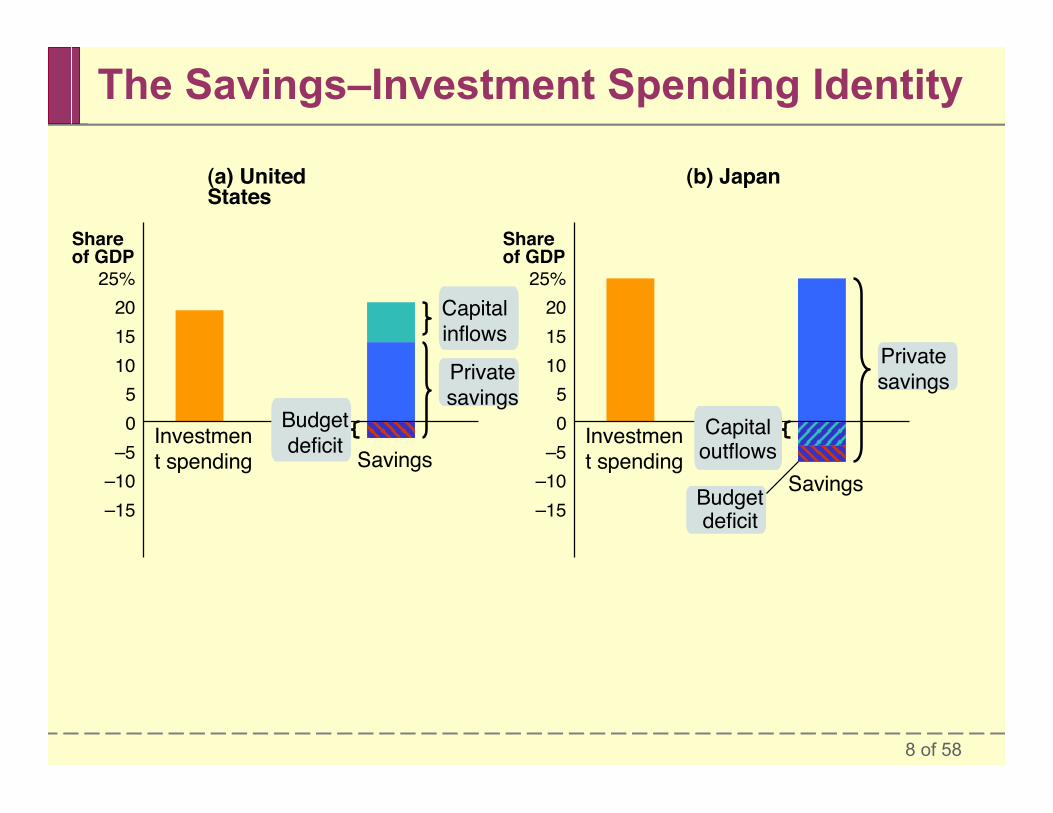
Budgetdeficit
The Savings–Investment Spending Identity
Shareof GDP
25%201510
50
–5–10–15
Investment spending Savings
CapitalinflowsPrivatesavings
Shareof GDP
25%201510
50
–5–10–15
Investment spending
Savings
Privatesavings
Budgetdeficit
Capitaloutflows
(a) UnitedStates
(b) Japan
9 of 58
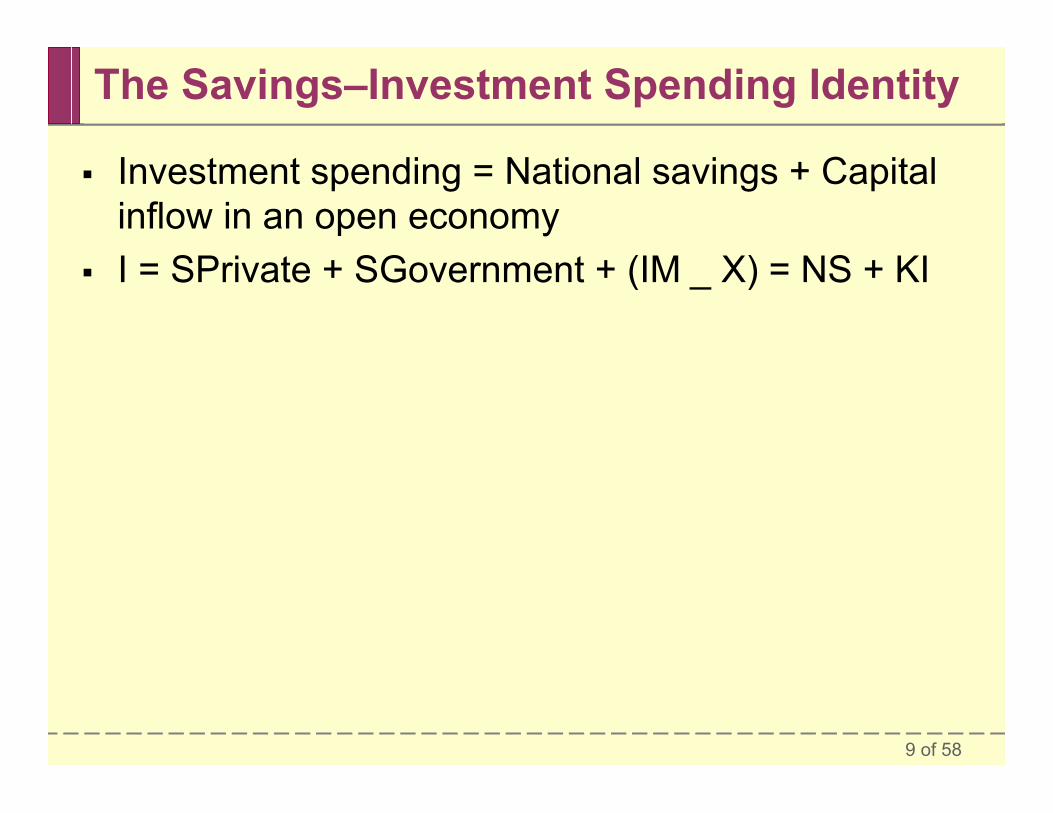
The Savings–Investment Spending Identity
Investment spending = National savings + Capitalinflow in an open economy
I = SPrivate + SGovernment + (IM _ X) = NS + KI
10 of 58
PITFALLS
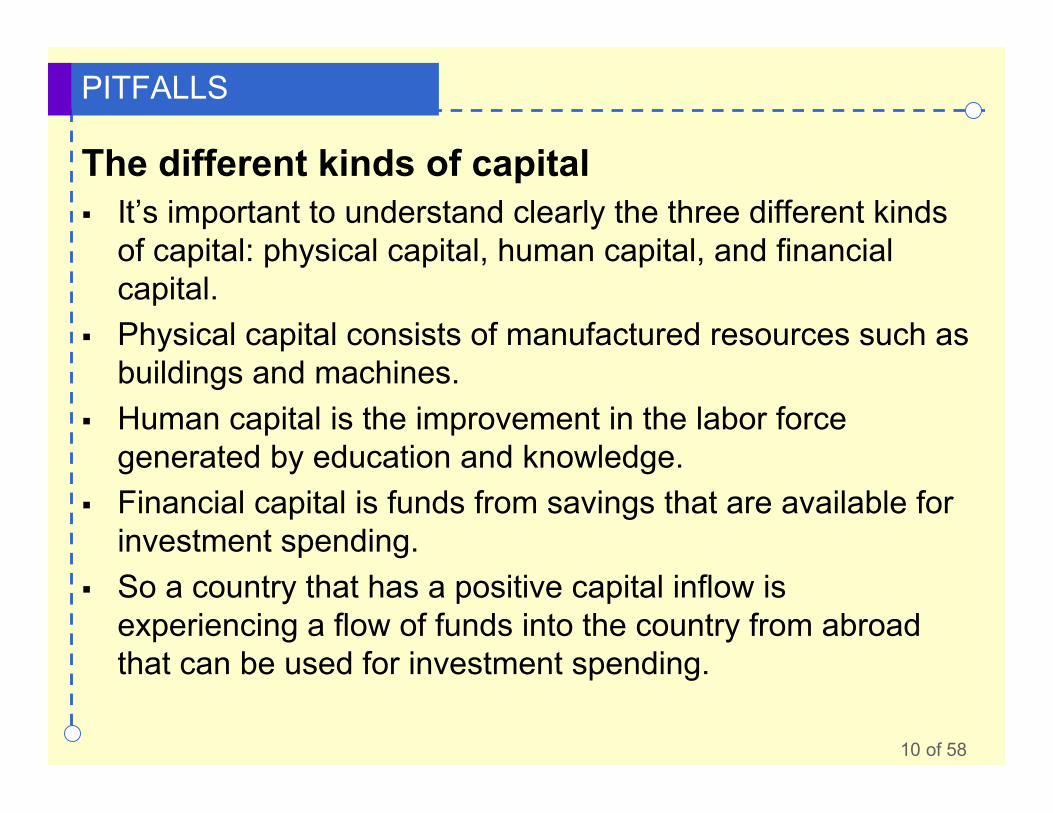
The different kinds of capital It’s important to understand clearly the three different kinds
of capital: physical capital, human capital, and financialcapital.
Physical capital consists of manufactured resources such asbuildings and machines.
Human capital is the improvement in the labor forcegenerated by education and knowledge.
Financial capital is funds from savings that are available forinvestment spending.
So a country that has a positive capital inflow isexperiencing a flow of funds into the country from abroadthat can be used for investment spending.
11 of 58
FOR INQUIRING MINDS
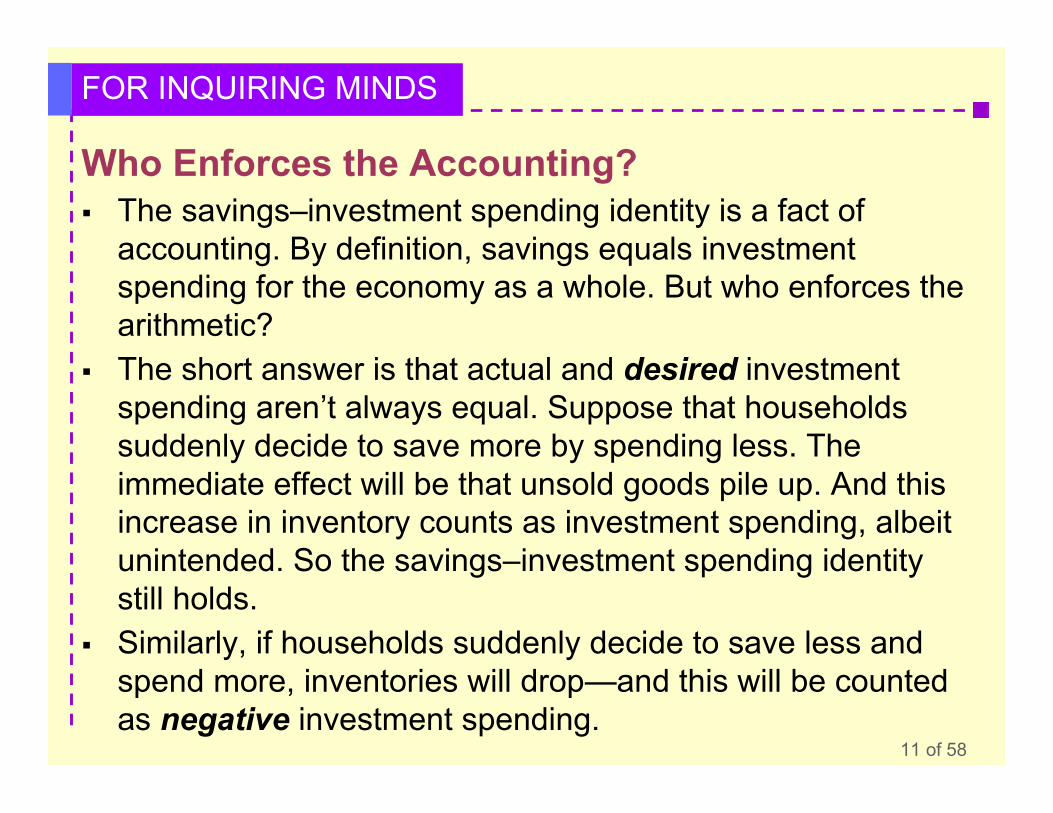
Who Enforces the Accounting? The savings–investment spending identity is a fact of
accounting. By definition, savings equals investmentspending for the economy as a whole. But who enforces thearithmetic?
The short answer is that actual and desired investmentspending aren’t always equal. Suppose that householdssuddenly decide to save more by spending less. Theimmediate effect will be that unsold goods pile up. And thisincrease in inventory counts as investment spending, albeitunintended. So the savings–investment spending identitystill holds.
Similarly, if households suddenly decide to save less andspend more, inventories will drop—and this will be countedas negative investment spending.
12 of 58
The Market for Loanable Funds
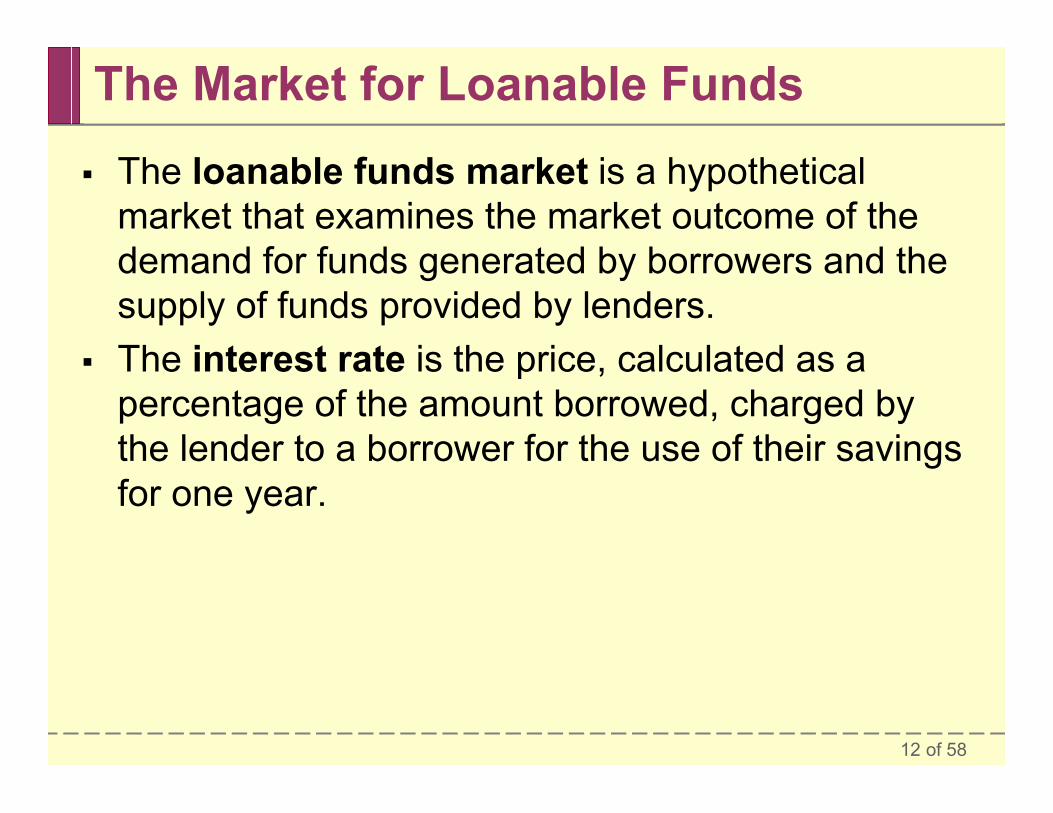
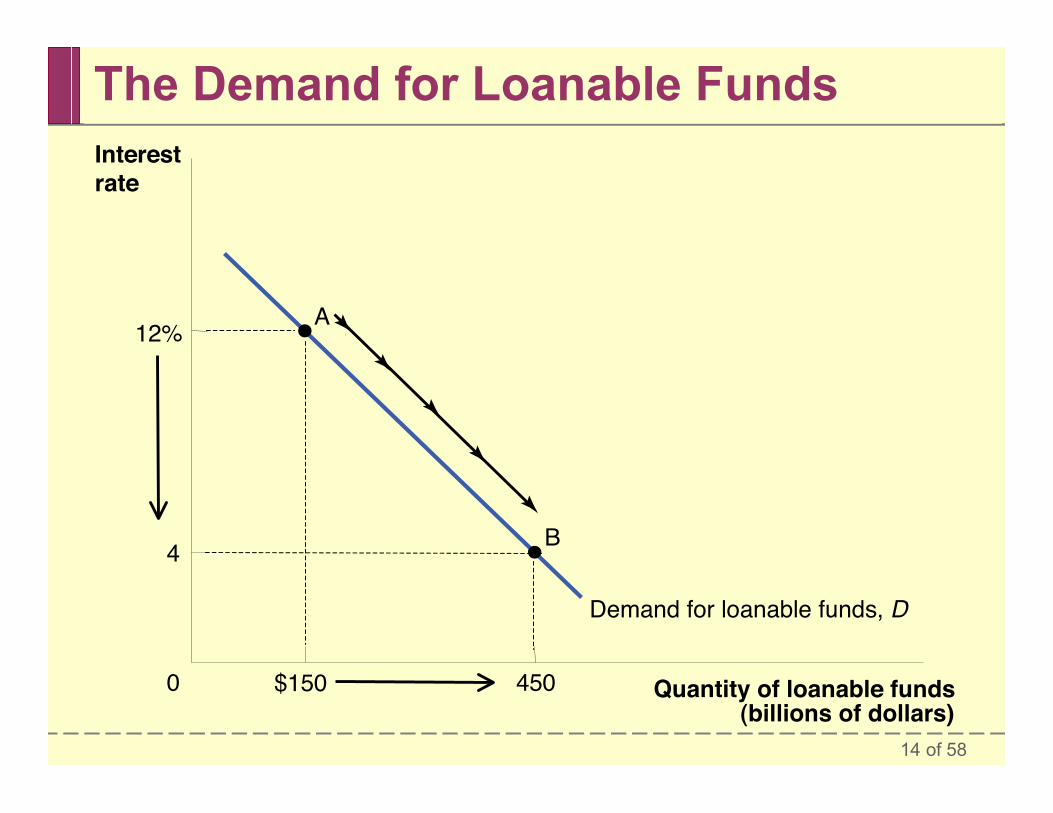
The loanable funds market is a hypotheticalmarket that examines the market outcome of thedemand for funds generated by borrowers and thesupply of funds provided by lenders.
The interest rate is the price, calculated as apercentage of the amount borrowed, charged bythe lender to a borrower for the use of their savingsfor one year.
13 of 58
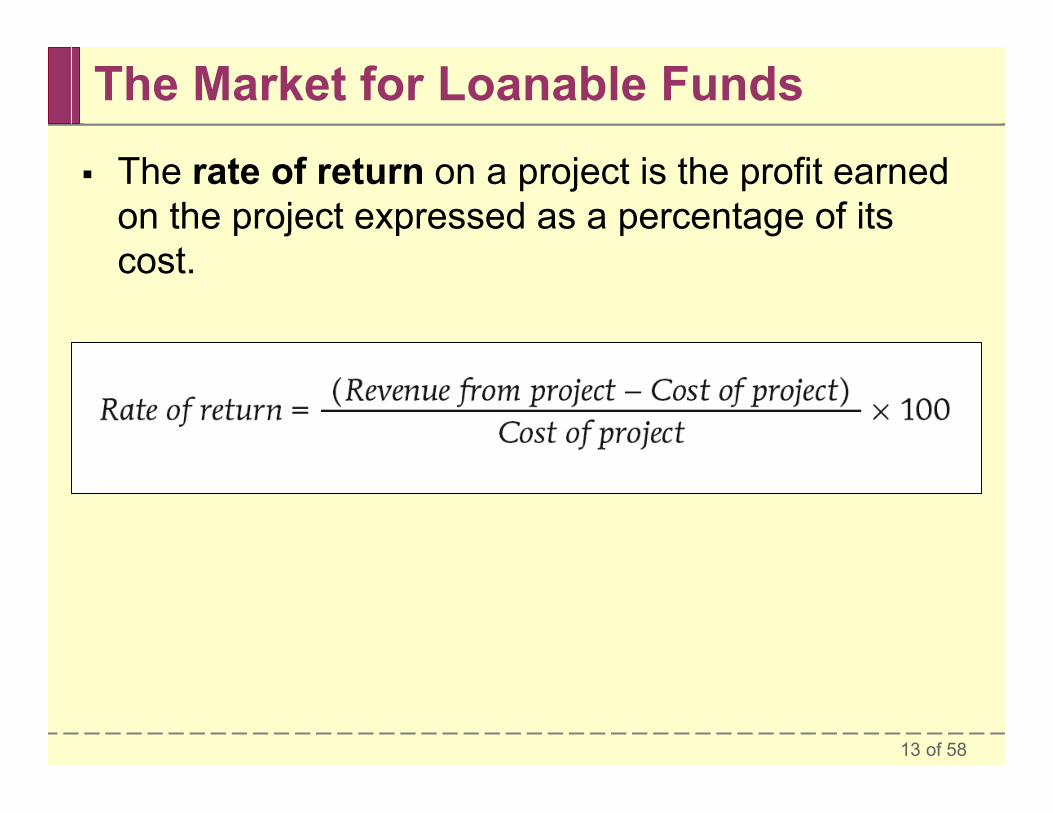
The Market for Loanable Funds
The rate of return on a project is the profit earnedon the project expressed as a percentage of itscost.
14 of 58
$1500
12% A
Interestrate
Demand for loanable funds, D
Quantity of loanable funds(billions of dollars)
B
450
4
TThe Demand for Loanable Funds
15 of 58
$1500
4 X
Quantity of loanable funds(billions of dollars)
Interestrate
Supply of loanable funds, S
450
12% Y
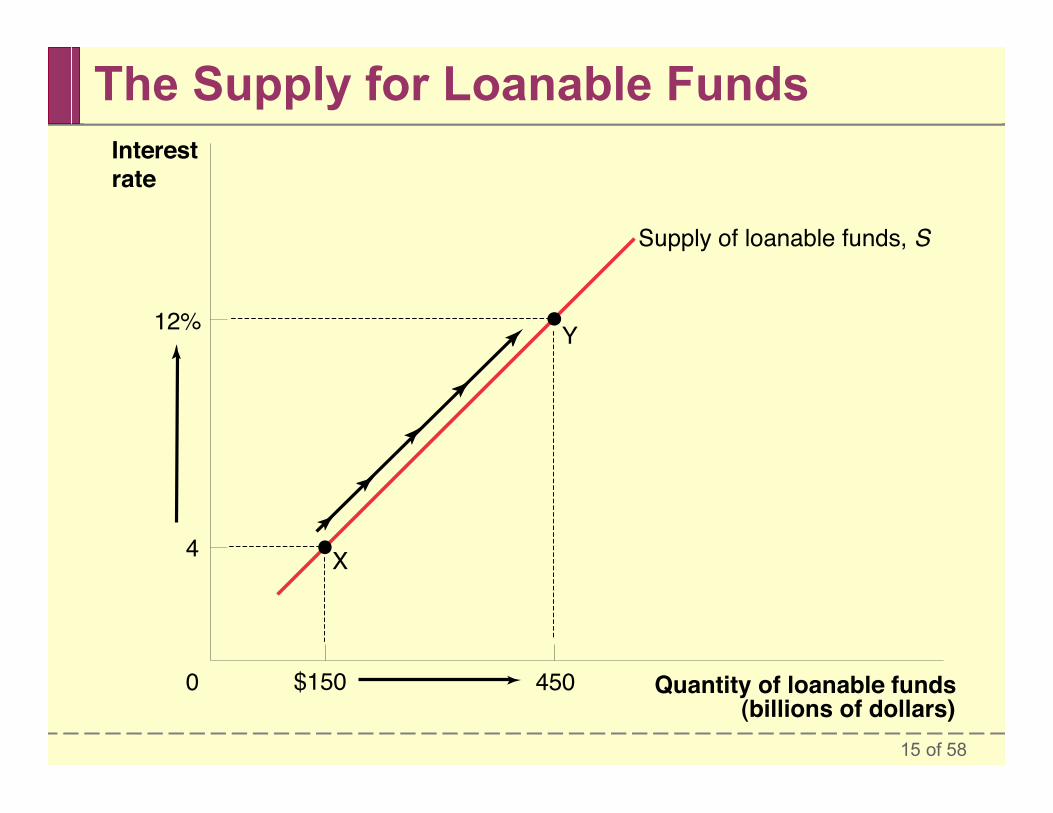
The Supply for Loanable Funds
16 of 58
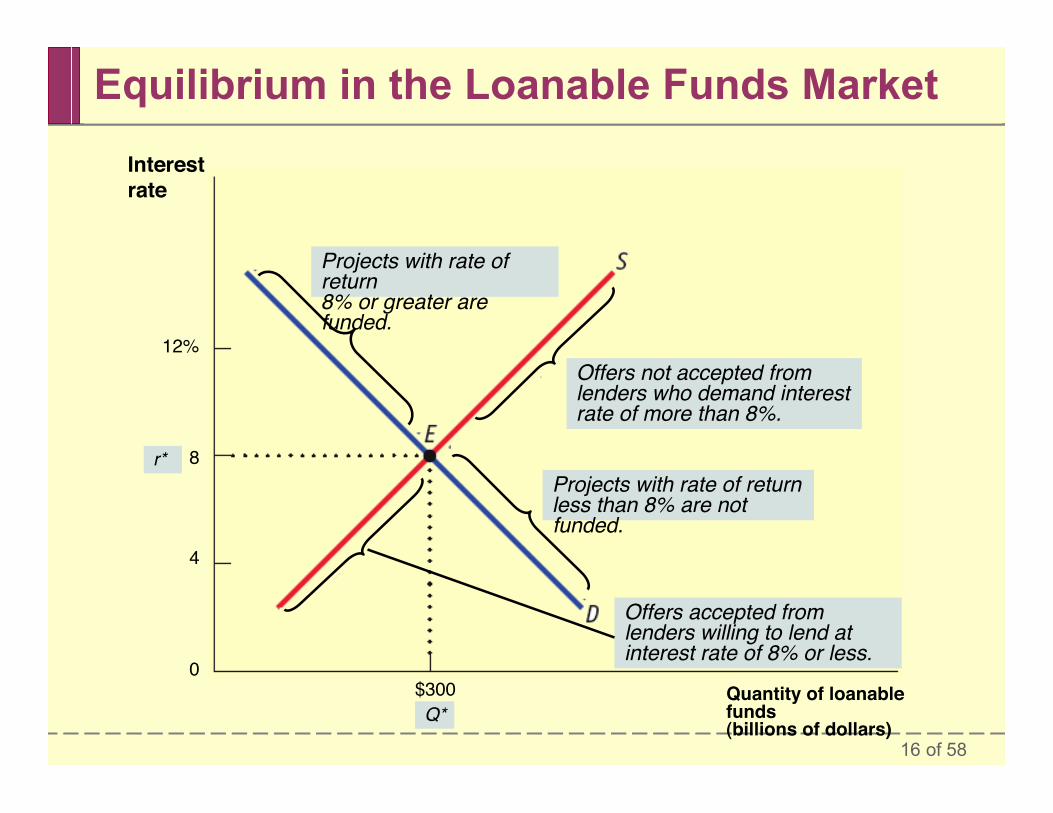
Equilibrium in the Loanable Funds MarketInterestrate
12%
8
4
0$300 Quantity of loanable
funds(billions of dollars)
Offers not accepted fromlenders who demand interestrate of more than 8%.
Projects with rate of returnless than 8% are notfunded.
Projects with rate ofreturn8% or greater arefunded.
Offers accepted fromlenders willing to lend atinterest rate of 8% or less.
r*
Q*
17 of 58
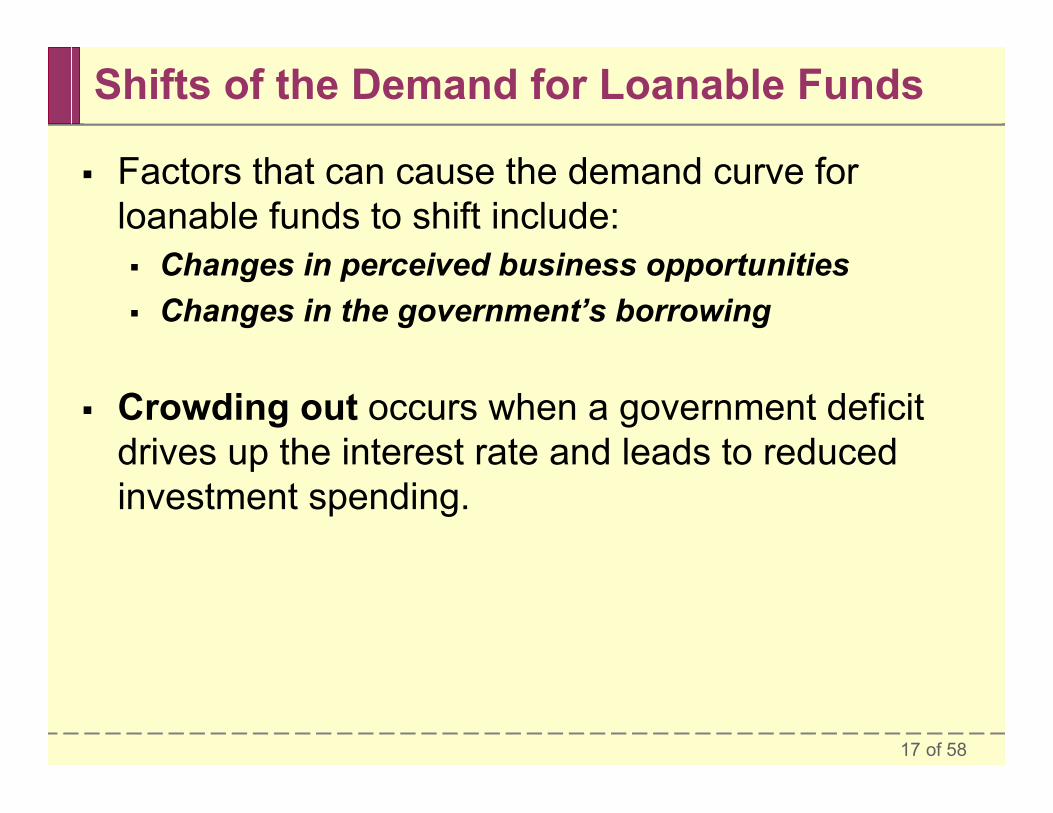
Shifts of the Demand for Loanable Funds
Factors that can cause the demand curve forloanable funds to shift include: Changes in perceived business opportunities Changes in the government’s borrowing
Crowding out occurs when a government deficitdrives up the interest rate and leads to reducedinvestment spending.
18 of 58
S
D 1
r1
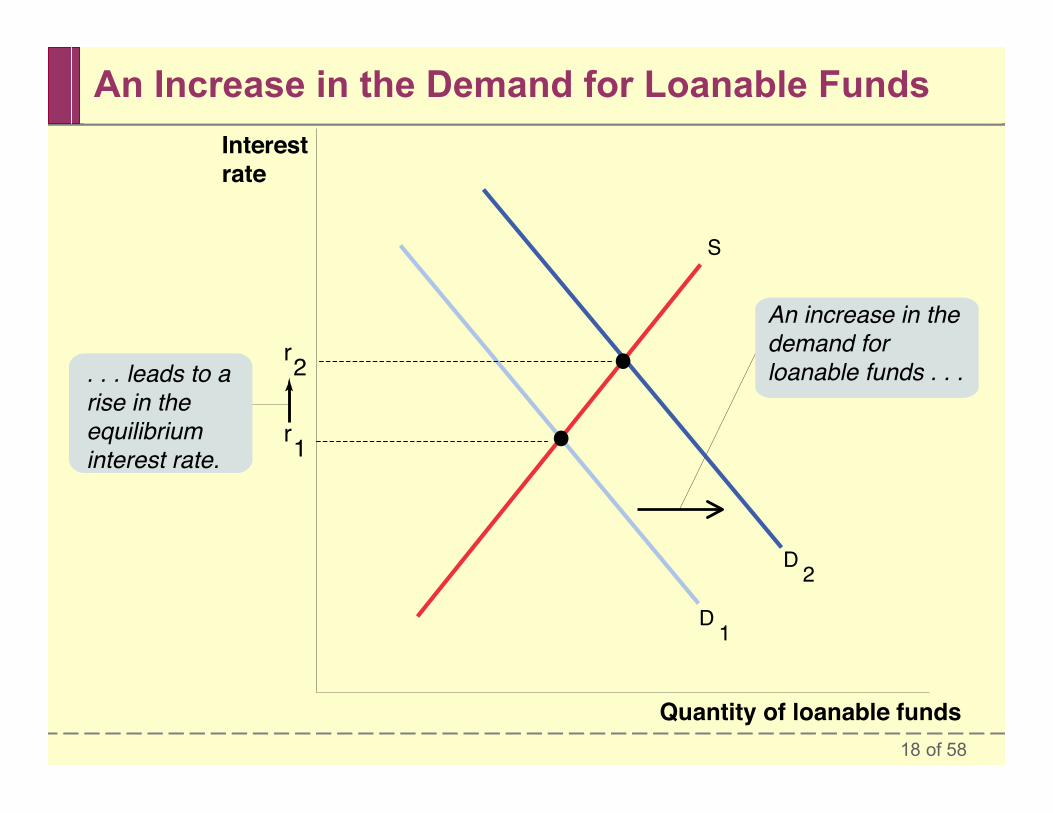
r2. . . leads to arise in theequilibriuminterest rate.
Interestrate
Quantity of loanable funds
An increase in thedemand forloanable funds . . .
D 2
An Increase in the Demand for Loanable Funds
19 of 58
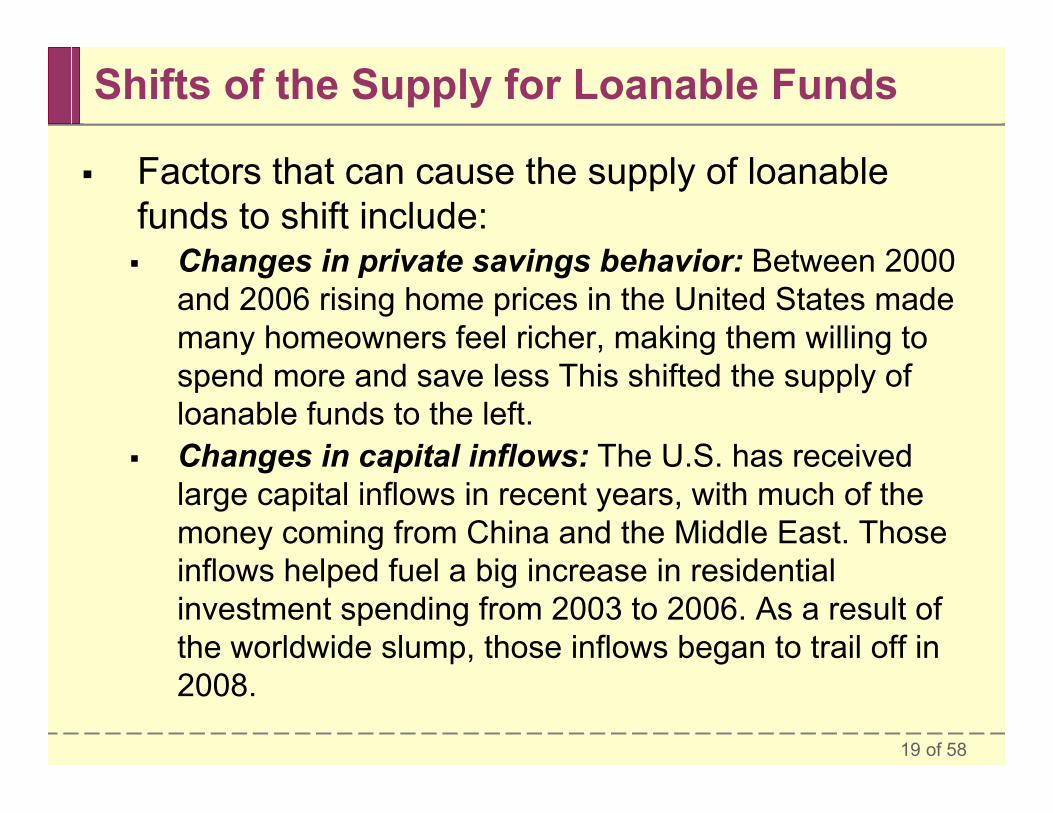
Shifts of the Supply for Loanable Funds
Factors that can cause the supply of loanablefunds to shift include: Changes in private savings behavior: Between 2000
and 2006 rising home prices in the United States mademany homeowners feel richer, making them willing tospend more and save less This shifted the supply ofloanable funds to the left.
Changes in capital inflows: The U.S. has receivedlarge capital inflows in recent years, with much of themoney coming from China and the Middle East. Thoseinflows helped fuel a big increase in residentialinvestment spending from 2003 to 2006. As a result ofthe worldwide slump, those inflows began to trail off in2008.
20 of 58
D
S1
r1
Interestrate
Quantity of loanable funds
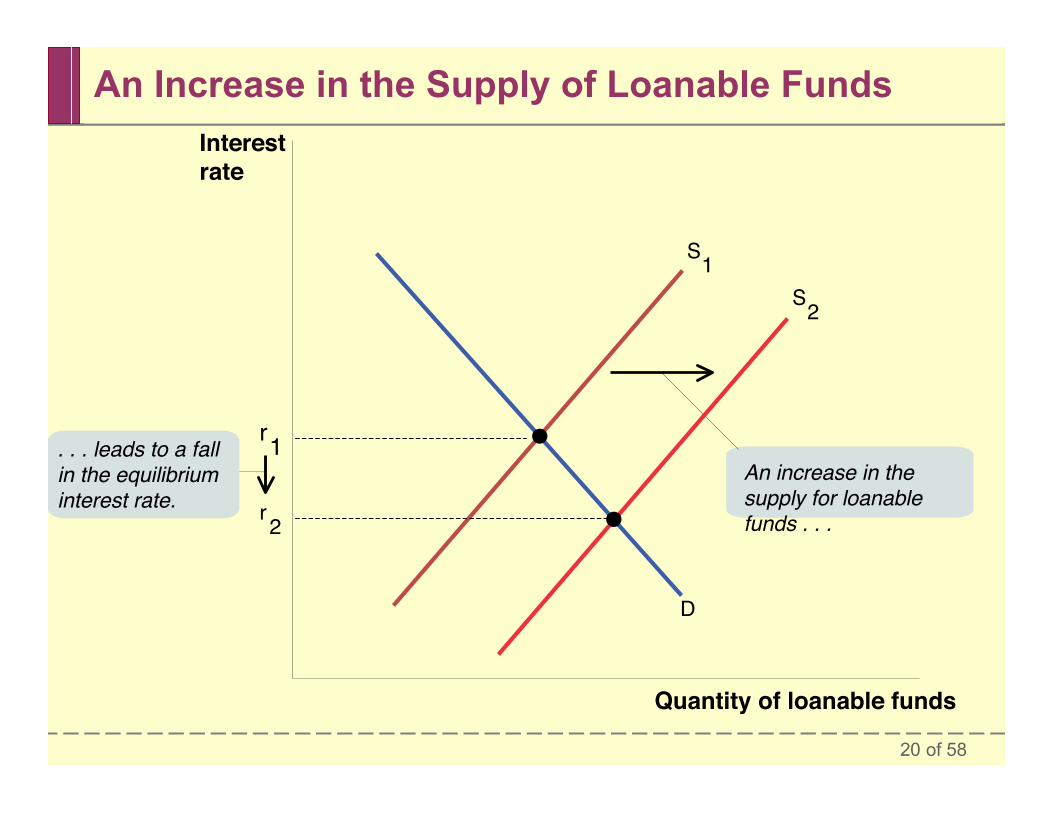
An increase in thesupply for loanablefunds . . .
S2
r2
. . . leads to a fallin the equilibriuminterest rate.
An Increase in the Supply of Loanable Funds
21 of 58
Inflation and Interest Rates
Anything that shifts either the supply of loanablefunds curve or the demand for loanable funds curvechanges the interest rate.
Historically, major changes in interest rates havebeen driven by many factors, including: changes in government policy. technological innovations that created new investment
opportunities.
22 of 58
Inflation and Interest Rates
However, arguably the most important factoraffecting interest rates over time is changingexpectations about future inflation.
This shifts both the supply and the demand forloanable funds.
This is the reason, for example, that interest ratestoday are much lower than they were in the late1970s and early 1980s.
23 of 58
Inflation and Interest Rates
Real interest rate =nominal interest rate - inflation rate
In the real world neither borrowers nor lendersknow what the future inflation rate will be when theymake a deal. Actual loan contracts, therefore,specify a nominal interest rate rather than a realinterest rate.
24 of 58
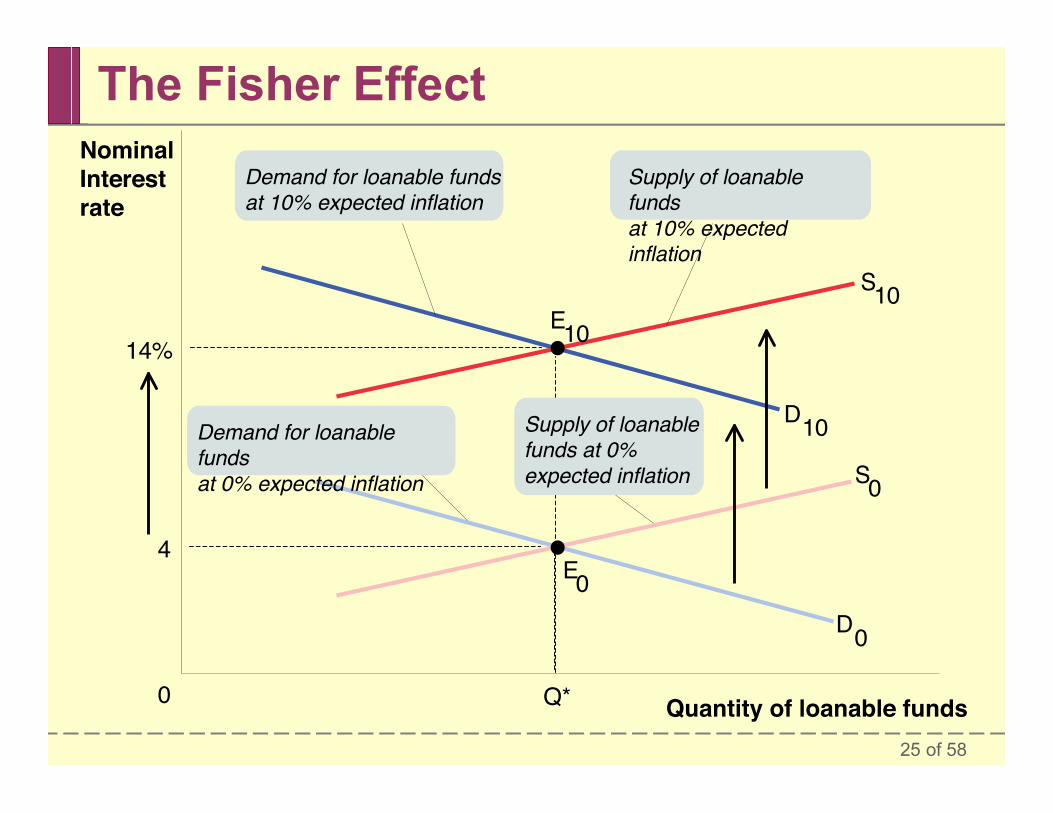
The Fisher Effect
According to the Fisher effect, an increase inexpected future inflation drives up the nominalinterest rate, leaving the expected real interest rateunchanged.
25 of 58
E0
S0
D0
4
0 Q*
NominalInterestrate
Quantity of loanable funds
Demand for loanablefundsat 0% expected inflation
Demand for loanable fundsat 10% expected inflation
Supply of loanablefundsat 10% expectedinflation
E10
S10
D10
14%
Supply of loanablefunds at 0%expected inflation
The Fisher Effect
26 of 58
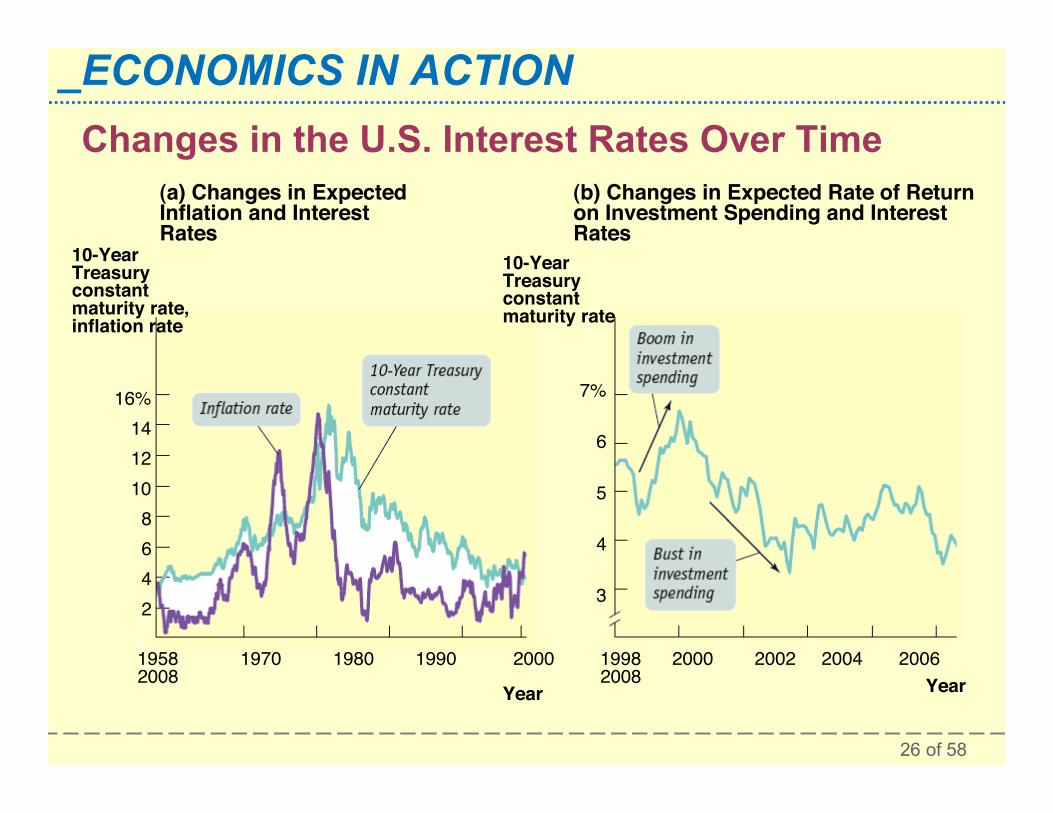
_ECONOMICS IN ACTIONChanges in the U.S. Interest Rates Over Time
10-YearTreasuryconstantmaturity rate,inflation rate
Year
16%141210
8642
1958 1970 1980 1990 20002008
10-YearTreasuryconstantmaturity rate
7%
6
5
4
3
Year1998 2000 2002 2004 20062008
(a) Changes in ExpectedInflation and InterestRates
(b) Changes in Expected Rate of Returnon Investment Spending and InterestRates

27 of 58
The Financial System
A household’s wealth is the value of itsaccumulated savings.
A financial asset is a paper claim that entitles thebuyer to future income from the seller.
A physical asset is a claim on a tangible objectthat gives the owner the right to dispose of theobject as he or she wishes.
28 of 58
The Financial System
A liability is a requirement to pay income in thefuture.
Transaction costs are the expenses of negotiatingand executing a deal.
Financial risk is uncertainty about future outcomesthat involve financial losses and gains.
29 of 58
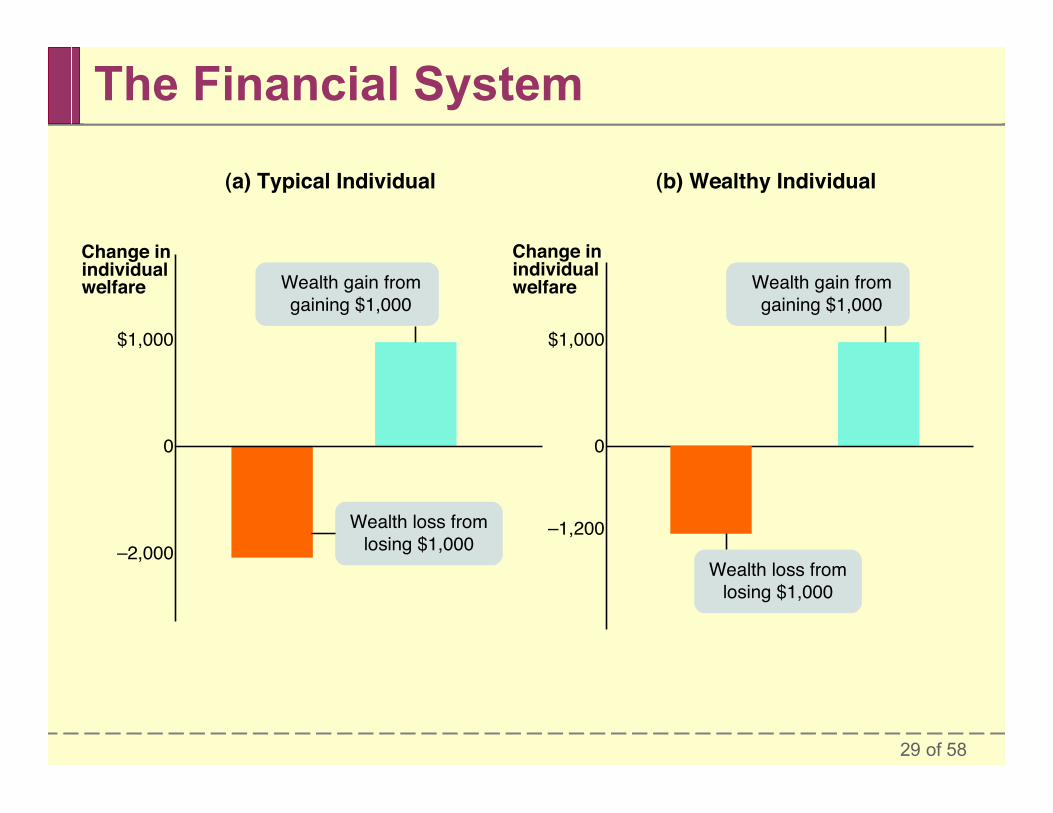
The Financial System
Change inindividualwelfare
$1,000
0
–2,000
$1,000
0
–1,200
Change inindividualwelfare
(a) Typical Individual (b) Wealthy Individual
Wealth loss fromlosing $1,000
Wealth gain fromgaining $1,000
Wealth gain fromgaining $1,000
Wealth loss fromlosing $1,000
30 of 58
Three Tasks of a Financial System
Reducing transaction costs _ the cost of making adeal.
Reducing financial risk _ uncertainty about futureoutcomes that involves financial gains and losses.
Providing liquid assets _ assets that can be quicklyconverted into cash (in contrast to illiquid assets,which can’t).
31 of 58
Three Tasks of a Financial System
An individual can engage in diversification byinvesting in several different things so that thepossible losses are independent events.
An asset is liquid if it can be quickly converted intocash.
An asset is illiquid if it cannot be quickly convertedinto cash.
32 of 58
Types of Financial Assets
There are four main types of financial assets: loans bonds stocks bank deposits
In addition, financial innovation has allowed thecreation of a wide range of loan-backedsecurities.
33 of 58
Types of Financial Assets
A loan is a lending agreement between a particularlender and a particular borrower.
A default occurs when a borrower fails to makepayments as specified by the loan or bond contract.
A loan-backed security is an asset created bypooling individual loans and selling shares in thatpool.
34 of 58
Financial Intermediaries
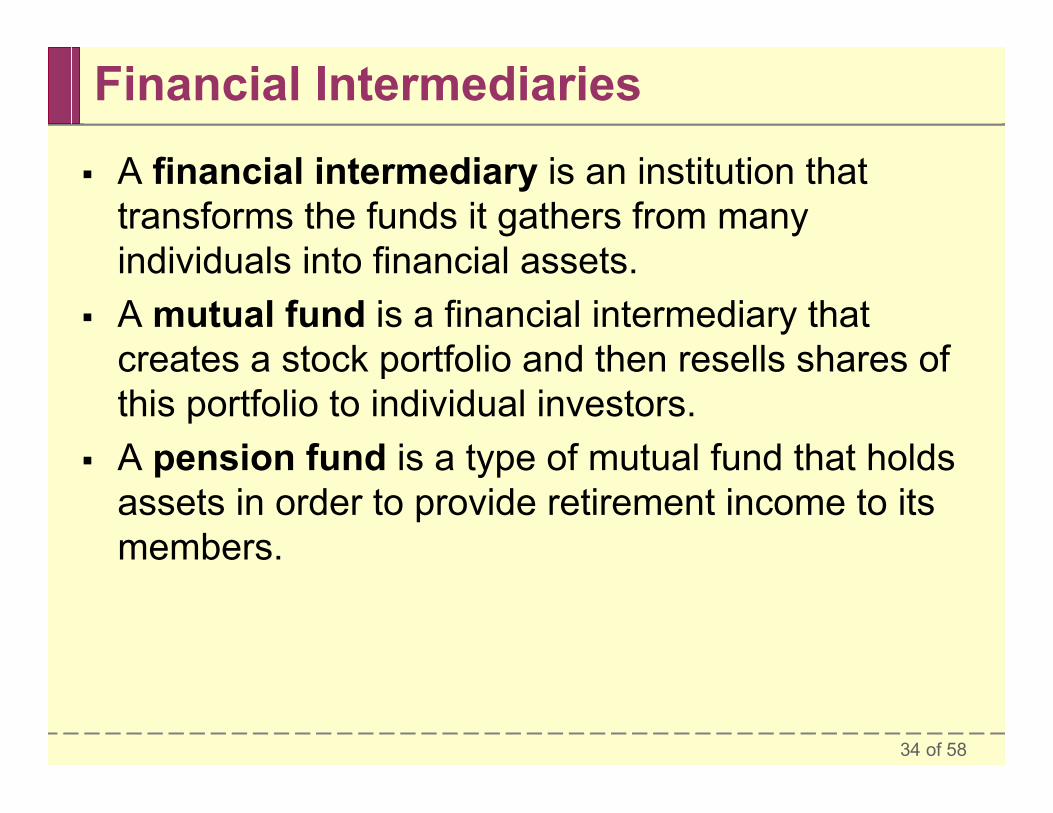
A financial intermediary is an institution thattransforms the funds it gathers from manyindividuals into financial assets.
A mutual fund is a financial intermediary thatcreates a stock portfolio and then resells shares ofthis portfolio to individual investors.
A pension fund is a type of mutual fund that holdsassets in order to provide retirement income to itsmembers.
35 of 58
Financial Intermediaries
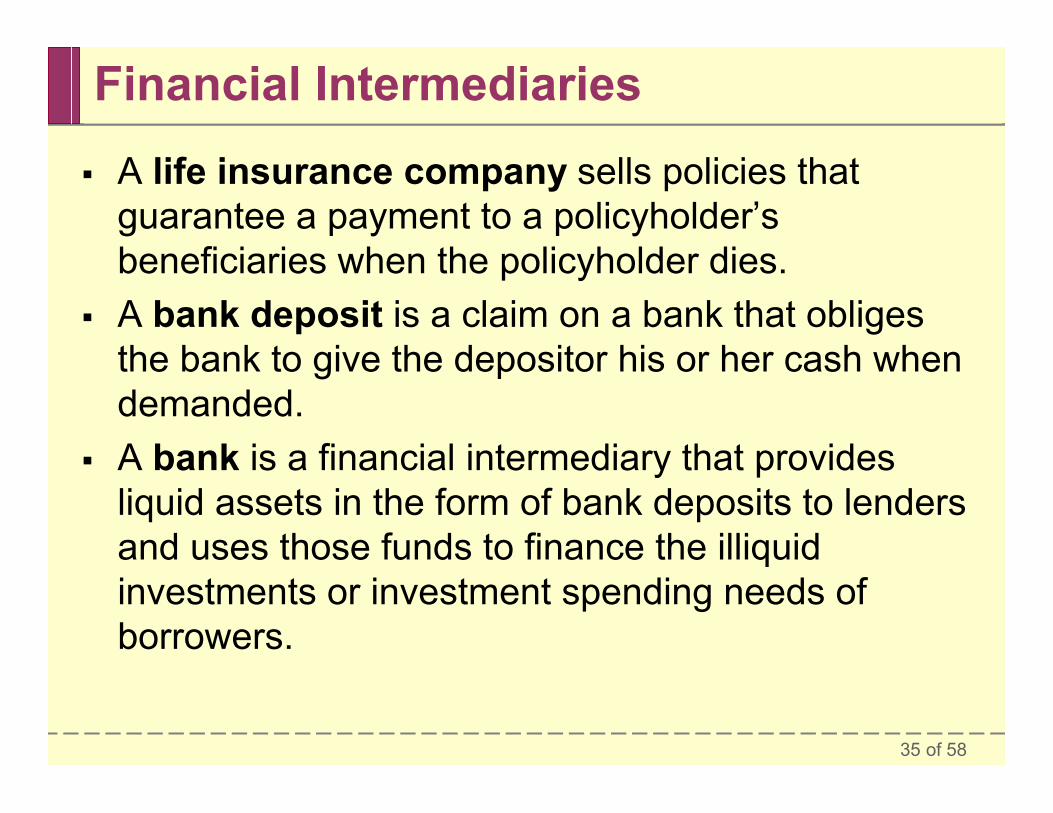
A life insurance company sells policies thatguarantee a payment to a policyholder’sbeneficiaries when the policyholder dies.
A bank deposit is a claim on a bank that obligesthe bank to give the depositor his or her cash whendemanded.
A bank is a financial intermediary that providesliquid assets in the form of bank deposits to lendersand uses those funds to finance the illiquidinvestments or investment spending needs ofborrowers.
36 of 58
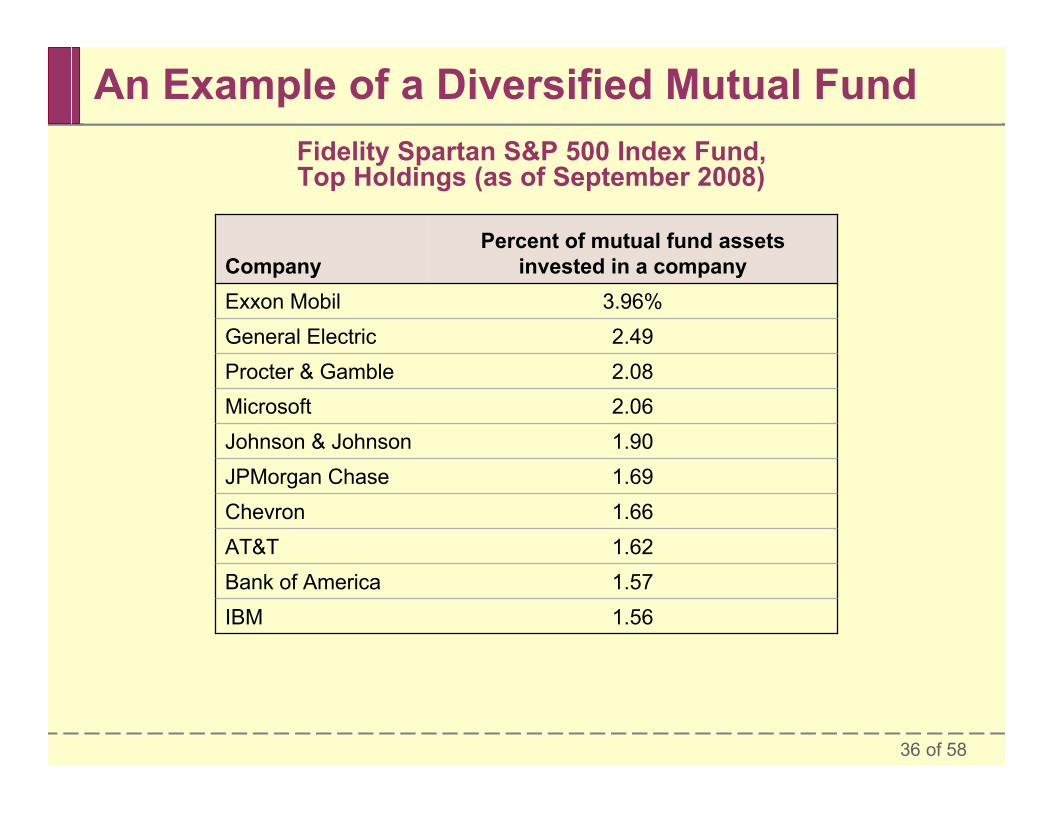
Fidelity Spartan S&P 500 Index Fund,Top Holdings (as of September 2008)
An Example of a Diversified Mutual Fund
1.56IBM1.57Bank of America1.62AT&T1.66Chevron1.69JPMorgan Chase1.90Johnson & Johnson2.06Microsoft2.08Procter & Gamble2.49General Electric
3.96%Exxon Mobil
Percent of mutual fund assetsinvested in a companyCompany
37 of 58
_ECONOMICS IN ACTIONBanks and the South Korean Miracle In the early 1960s, South Korea’s interest rates on deposits
were very low at a time when the country was experiencinghigh inflation. So savers didn’t want to save by puttingmoney in a bank, fearing that much of their purchasingpower would be eroded by rising prices. Instead, theyengaged in current consumption by spending their moneyon goods and services or on physical assets such as realestate and gold.
In 1965 the South Korean government reformed thecountry’s banks and increased interest rates. Over the nextfive years the value of bank deposits increased 600% andthe national savings rate more than doubled. Therejuvenated banking system made it possible for SouthKorean businesses to launch a great investment boom, akey element in the country’s growth surge.
38 of 58
Financial Fluctuations
Financial market fluctuations can be a source ofmacroeconomic instability.
Stock prices are determined by supply and demandas well as the desirability of competing assets, likebonds: when the interest rate rises, stock prices generally fall
and vice versa.
39 of 58
Financial Fluctuations
The value of a financial asset today depends oninvestors’ beliefs about the future value or price ofthe asset.
If investors believe that it will be worth more in thefuture, they will demand more of the asset today atany given price.
Consequently, today’s equilibrium price of the assetwill rise.
40 of 58
Financial Fluctuations
If investors believe the asset will be worth less inthe future, they will demand less today at any givenprice.
Consequently, today’s equilibrium price of the assetwill fall.
Today’s stock prices will change according tochanges in investors’ expectations about futurestock prices.
41 of 58
FOR INQUIRING MINDS
How Now, Dow Jones? Financial news reports often lead with the day’s stock
market action, as measured by changes in the Dow JonesIndustrial Average, the S&P 500, and the NASDAQ. Allthree are stock market indices. Like the consumer priceindex, they are numbers constructed as a summary ofaverage prices.
The Dow, created by the financial analysis company DowJones, is an index of the prices of stock in 30 leadingcompanies, The S&P 500 is an index of 500 companies,created by Standard and Poor’s. The NASDAQ is compiledby the National Association of Securities Dealers.
The movement in an index gives investors a quick, snapshotview of how stocks from certain sectors of the economy aredoing.
42 of 58
Financial Fluctuations
Financial market fluctuations can be a source ofmacroeconomic instability.
There are two principal competing views about howasset price expectations are determined.
One view, which comes from traditional economicanalysis, emphasizes the rational reasons whyexpectations should change.
The other, widely held by market participants andalso supported by some economists, emphasizesthe irrationality of market participants.
43 of 58
Financial Fluctuations
One view of how expectations are formed is theefficient markets hypothesis, which holds that theprices of financial assets embody all publiclyavailable information.
It implies that fluctuations are inherentlyunpredictable—they follow a random walk.
44 of 58
Irrational Markets?
Many market participants and economists believethat, based on actual evidence, financial marketsare not as rational as the efficient marketshypothesis claims.
Such evidence includes the fact that stock pricefluctuations are too great to be driven byfundamentals alone.

45 of 58
Asset Prices and Macroeconomics
How do macroeconomists and policy makers dealwith the fact that asset prices fluctuate a lot andthat these fluctuations can have importanteconomic effects?
Should policy makers try to pop asset bubblesbefore they get too big?
This debate covered in chapter 17.
46 of 58
FOR INQUIRING MINDS
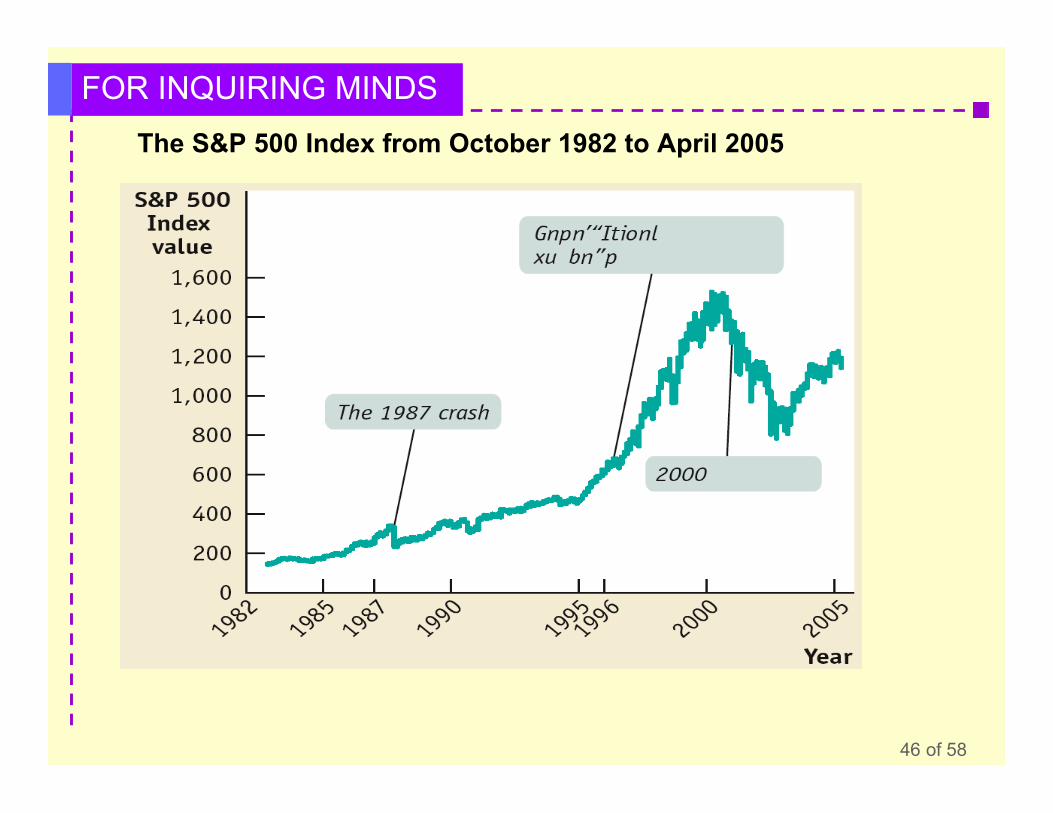
The S&P 500 Index from October 1982 to April 2005
47 of 58
_ECONOMICS IN ACTIONThe Great American Housing Bubble Between 2000 and 2006, there was a huge increase in the
price of houses in America. A number of economists arguedthat this price increase was excessive—that it was a“bubble”.
Yet there were also a number of economists who arguedthat the rise in housing prices was completely justified.
They pointed, in particular, to the fact that interest rateswere unusually low in the years of rapid price increases.
They argued that low interest rates combined with otherfactors, such as growing population, explained the surge inprices.
48 of 58
_ECONOMICS IN ACTIONThe Great American Housing Bubble Alan Greenspan, the chairman of the Federal Reserve,
conceded in 2005 that there might be some “froth” in themarkets but denied that there was any national bubble.
Unfortunately, it turned out that the skeptics were right.Greenspan himself would later concede that there had, infact, been a huge national bubble.
In 2006, as home prices began to level off, it becameapparent that many buyers had held unrealistic expectationsabout future prices.
Home prices began falling, and the demand for housing felldrastically.
49 of 58
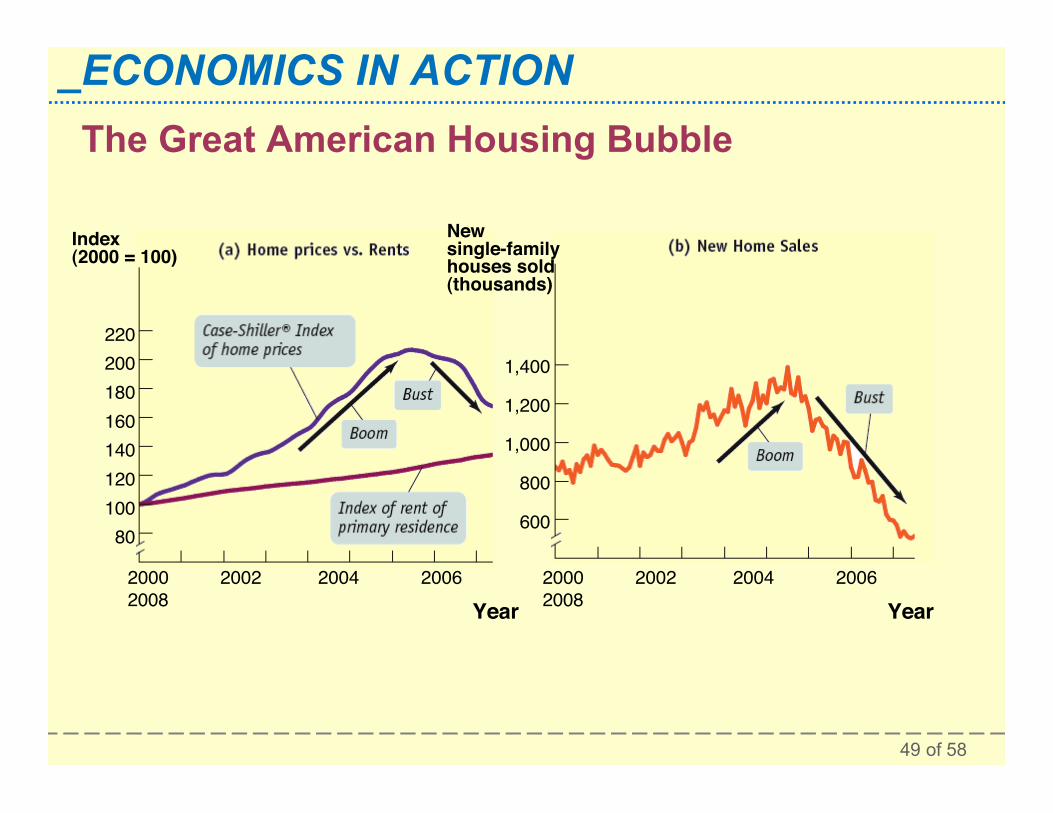
_ECONOMICS IN ACTIONThe Great American Housing Bubble
Index(2000 = 100)
22020018016014012010080
2000 2002 2004 20062008 Year
2000 2002 2004 20062008 Year
Newsingle-familyhouses sold(thousands)
1,400
1,200
1,000
800
600
50 of 58
SUMMARY
1. Investment in physical capital is necessary for long-runeconomic growth. So in order for an economy to grow, itmust channel savings into investment spending.
2. According to the savings–investment spending identity,savings and investment spending are always equal for theeconomy as a whole. The government is a source ofsavings when it runs a positive budget balance or budgetsurplus; it is a source of dissavings when it runs anegative budget balance or budget deficit. In a closedeconomy, savings is equal to national savings, the sum ofprivate savings plus the budget balance. In an openeconomy, savings is equal to national savings plus capitalinflow of foreign savings. When a capital outflow, ornegative capital inflow, occurs, some portion of nationalsavings is funding investment spending in other countries.
51 of 58
SUMMARY
3. The hypothetical loanable funds market shows how loansfrom savers are allocated among borrowers withinvestment spending projects. In equilibrium, only thoseprojects with a rate of return greater than or equal to theequilibrium interest rate will be funded. By showing howgains from trade between lenders and borrowers aremaximized, the loanable funds market shows why a wellfunctioning financial system leads to greater long-runeconomic growth. Government budget deficits can raisethe interest rate and can lead to crowding out ofinvestment spending. Changes in perceived businessopportunities and in government borrowing shift thedemand curve for loanable funds; changes in privatesavings and capital inflows shift the supply curve.
52 of 58
SUMMARY
4. Because neither borrowers nor lenders can know the futureinflation rate, loans specify a nominal interest rate ratherthan a real interest rate. For a given expected future inflationrate, shifts of the demand and supply curves of loanablefunds result in changes in the underlying real interest rate,leading to changes in the nominal interest rate. According tothe Fisher effect, an increase in expected future inflationraises the nominal interest rate one-to-one so that theexpected real interest rate remains unchanged.
53 of 58
SUMMARY
5. Households invest their current savings or wealth bypurchasing assets. Assets come in the form of either afinancial asset or a physical asset. A financial asset isalso a liability from the point of view of its seller. There arefour main types of financial assets: loans, bonds, stocks,and bank deposits. Each of them serves a differentpurpose in addressing the three fundamental tasks of afinancial system: reducing transaction costs—the cost ofmaking a deal; reducing financial risk—uncertainty aboutfuture outcomes that involves financial gains and losses;and providing liquid assets— assets that can be quicklyconverted into cash without much loss of value (in contrastto illiquid assets, which are not easily converted).
54 of 58
SUMMARY
6. Although many small and moderate-size borrowers usebank loans to fund investment spending, larger companiestypically issue bonds. Bonds with a higher risk of defaultmust typically pay a higher interest rate. Business ownersreduce their risk by selling stock. Although stocks usuallygenerate a higher return than bonds, investors typically wishto reduce their risk by engaging in diversification, owning awide range of assets whose returns are based on unrelated,or independent, events. Most people are risk-averse. Loan-backed securities, a recent innovation, are assets createdby pooling individual loans and selling shares of that pool toinvestors. Because they are more diversified and moreliquid than individual loans, trading on financial markets likebonds, they are preferred by investors. It can be difficult,however, to assess their quality.
55 of 58
SUMMARY
7. Financial intermediaries—institutions such as mutualfunds, pension funds, life insurance companies, andbanks—are critical components of the financial system.Mutual funds and pension funds allow small investors todiversify, and life insurance companies reduce risk.
8. A bank allows individuals to hold liquid bank deposits thatare then used to finance illiquid loans. Banks can performthis mismatch because on average only a small fraction ofdepositors withdraw their savings at any one time. Banksare a key ingredient of long-run economic growth.
56 of 58
SUMMARY
9. Asset market fluctuations can be a source of short-runmacroeconomic instability. Asset prices are determined bysupply and demand as well as by the desirability ofcompeting assets, like bonds: when the interest rate rises,prices of stocks and physical assets such as real estategenerally fall, and vice versa. Expectations drive the supplyof and demand for assets: expectations of higher futureprices push today’s asset prices higher, and expectations oflower future prices drive them lower. One view of howexpectations are formed is the efficient marketshypothesis, which holds that the prices of assets embodyall publicly available information. It implies that fluctuationsare inherently unpredictable—they follow a random walk.
57 of 58
SUMMARY
10.Many market participants and economists believe that,based on actual evidence, financial markets are not asrational as the efficient markets hypothesis claims. Suchevidence includes the fact that stock price fluctuations aretoo great to be driven by fundamentals alone. Policy makersassume neither that markets always behave rationally northat they can outsmart them.

58 of 58
The End of Chapter 10
coming attraction:Chapter 11:
Income and Expenditure