Embed Size (px)
Citation preview
Geotechnical Data Report
SAWS Mitchell Lake Wetland Project
San Antonio, Texas
Arias Project No. 2017-698
Prepared For: Alan Plummer Associates, Inc.
June 11, 2018
ARIASGEOPROFESSIONALS
13581 Pond Springs Road, Suite 210, Austin, Texas 78729 • Phone: (512) 428-5550 • Fax: (512) 428-5525
June 11,2018Arias Project No. 201 7-698 VIA Email: [email protected]
Mr. Timothy Noack, P.E.Alan Plummer Associates, Inc.1777 NE Loop 410, Suite 500San Antonio, Texas 78217
RE: Geotechnical Data ReportSAWS Mitchell Lake Wetland ProjectSan Antonio, Texas
Dear Mr. Noack,
Arias & Associates, Inc. (Arias) is pleased to submit this Geotechnical Data Report (GDR) for theabove referenced project. Our services were performed according to the signed agreement forsubconsultant services between Alan Plummer Associates, Inc. and Arias & Associates, Inc. datedNovember 17, 2017.
The purpose of this geotechnical study was to obtain subsurface and groundwater information alongthe proposed embankment dam and wetland area. The scope included a field investigation phase,laboratory testing, and preparation of this data report. It should be noted that our scope of serviceswas limited to providing geotechnical data based upon our field and laboratory test results.
We sincerely appreciate the opportunity of working with you on this project and look forward to ourcontinued association throughout final design and construction phases. Please do not hesitate tocontact us about this report, or if we can be of further service.
..b”b %‘~
-rry I ‘~~RE~D.GE ~ JERRYD.sHEpEF~rj”:enior Geotechnical Engineer ~ ••••••
112142 :~‘
Sincerely,ARIAS GEOPROFESSIONALS, INC.TBPE Registration No. F-32
%~o~r~ j~SzySenior Geotechnical Engineer
Adington Austin Corpus Christi Eagle Pass San Antonio
TABLE OF CONTENTS
Page
Arias Geoprofessionals i Arias Job No. 2017-698
INTRODUCTION ................................................................................................................... 1 FIELD EXPLORATION .......................................................................................................... 1 LABORATORY TESTING ...................................................................................................... 3 SITE AND SUBSURFACE CONDITIONS ............................................................................. 4
Area Geology .................................................................................................................... 4 Site Stratigraphic and Engineering Properties .................................................................. 5 Groundwater Occurrence. ................................................................................................. 6
GENERAL COMMENTS ........................................................................................................ 7 Subsurface Variations ....................................................................................................... 7 Standard of Care ............................................................................................................... 7
Appendices
APPENDIX A: FIGURES .............................................................................................................. A
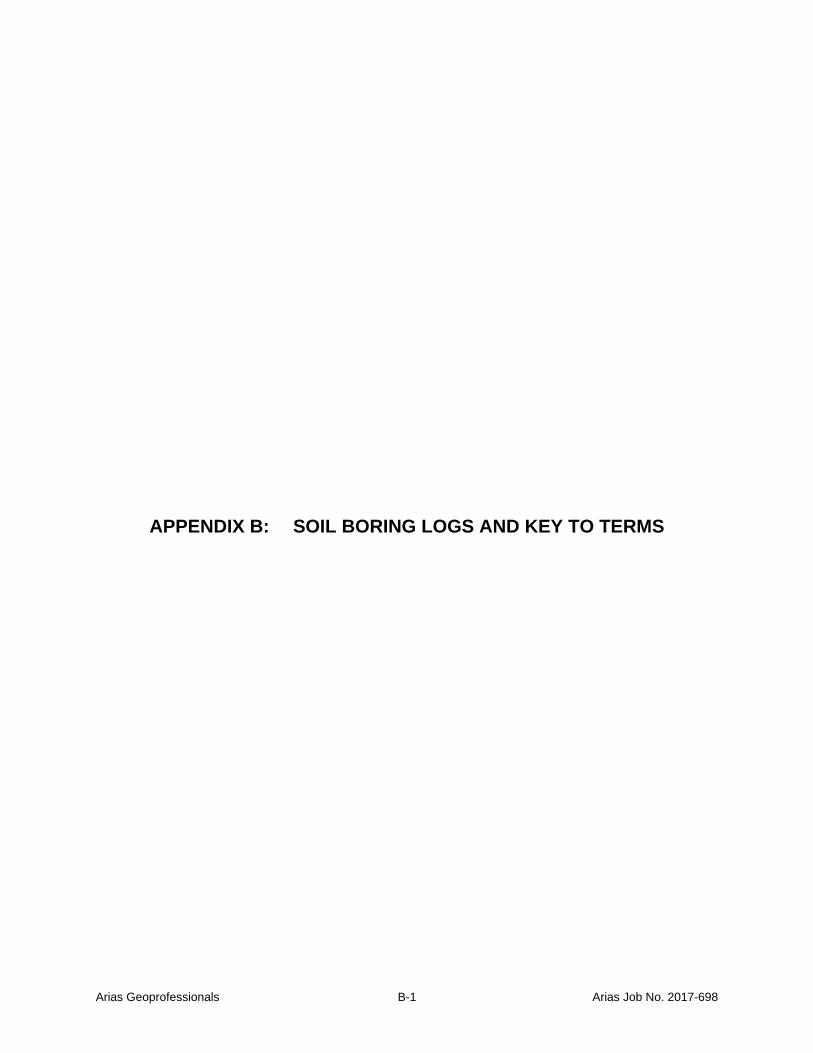
APPENDIX B: SOIL BORING LOGS AND KEY TO TERMS ....................................................... B
APPENDIX C: LABORATORY AND FIELD TEST PROCEDURES ............................................. C
APPENDIX D: SIEVE ANALYSIS TEST RESULTS .................................................................... D
APPENDIX E: ONE-DIMENTIONAL CONSOLIDATION TEST RESULTS .................................. E
APPENDIX F: DIRECT SHEAR TEST RESULTS ........................................................................ F
APPENDIX G: ONE-DIMENTIONAL CONSOLIDATION TEST RESULTS ................................. G
APPENDIX H: CONSOLIDATED UNDRAINED TRIAXIAL TEST RESULTS .............................. H
APPENDIX I: ASFE INFORMATION – GEOTECHNICAL REPORT ............................................ I
APPENDIX J: PROJECT QUALITY ASSURANCE ..................................................................... J
TABLE OF CONTENTS
Page
Arias Geoprofessionals ii Arias Job No. 2017-698
Tables Table 1: Boring Summary Table ................................................................................................... 2 Table 2: Laboratory Test Name, Method and Log Designation .................................................... 3 Table 3: Generalized Subsurface Conditions and Engineering Properties ................................... 5 Table 4: Water -Level Observations in boreholes ......................................................................... 6
Arias Geoprofessionals 1 Arias Job No. 2017-698
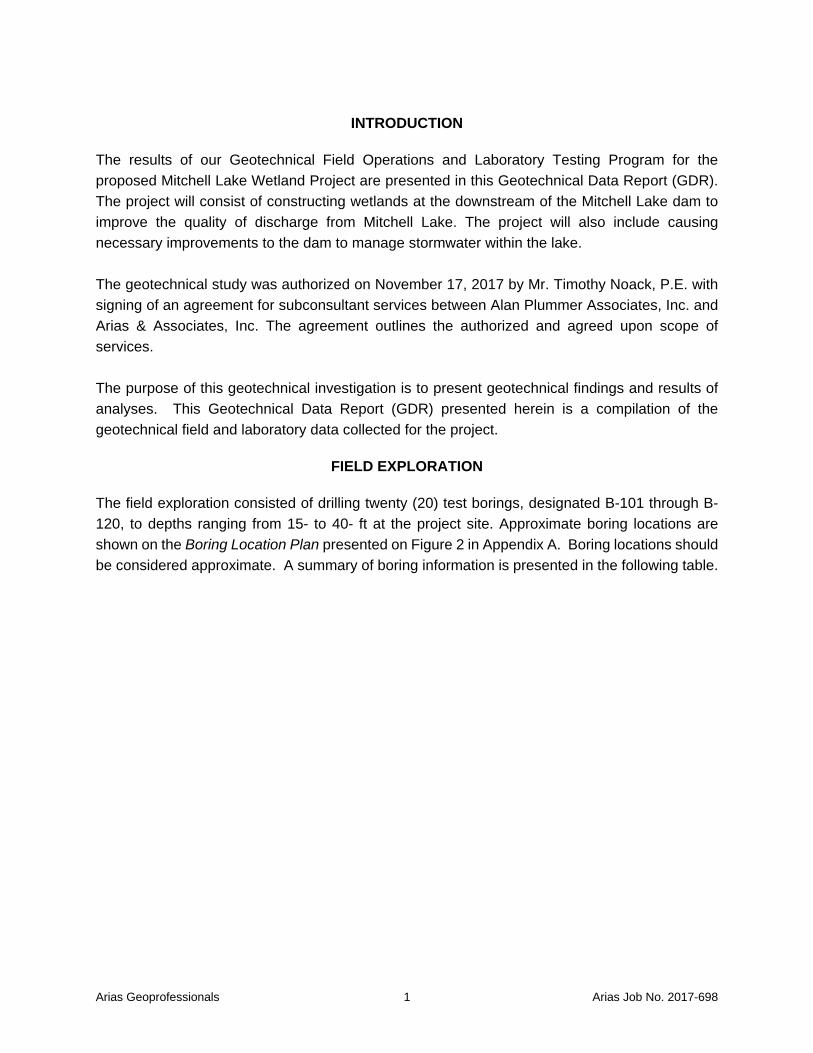
INTRODUCTION
The results of our Geotechnical Field Operations and Laboratory Testing Program for the proposed Mitchell Lake Wetland Project are presented in this Geotechnical Data Report (GDR). The project will consist of constructing wetlands at the downstream of the Mitchell Lake dam to improve the quality of discharge from Mitchell Lake. The project will also include causing necessary improvements to the dam to manage stormwater within the lake. The geotechnical study was authorized on November 17, 2017 by Mr. Timothy Noack, P.E. with signing of an agreement for subconsultant services between Alan Plummer Associates, Inc. and Arias & Associates, Inc. The agreement outlines the authorized and agreed upon scope of services. The purpose of this geotechnical investigation is to present geotechnical findings and results of analyses. This Geotechnical Data Report (GDR) presented herein is a compilation of the geotechnical field and laboratory data collected for the project.
FIELD EXPLORATION
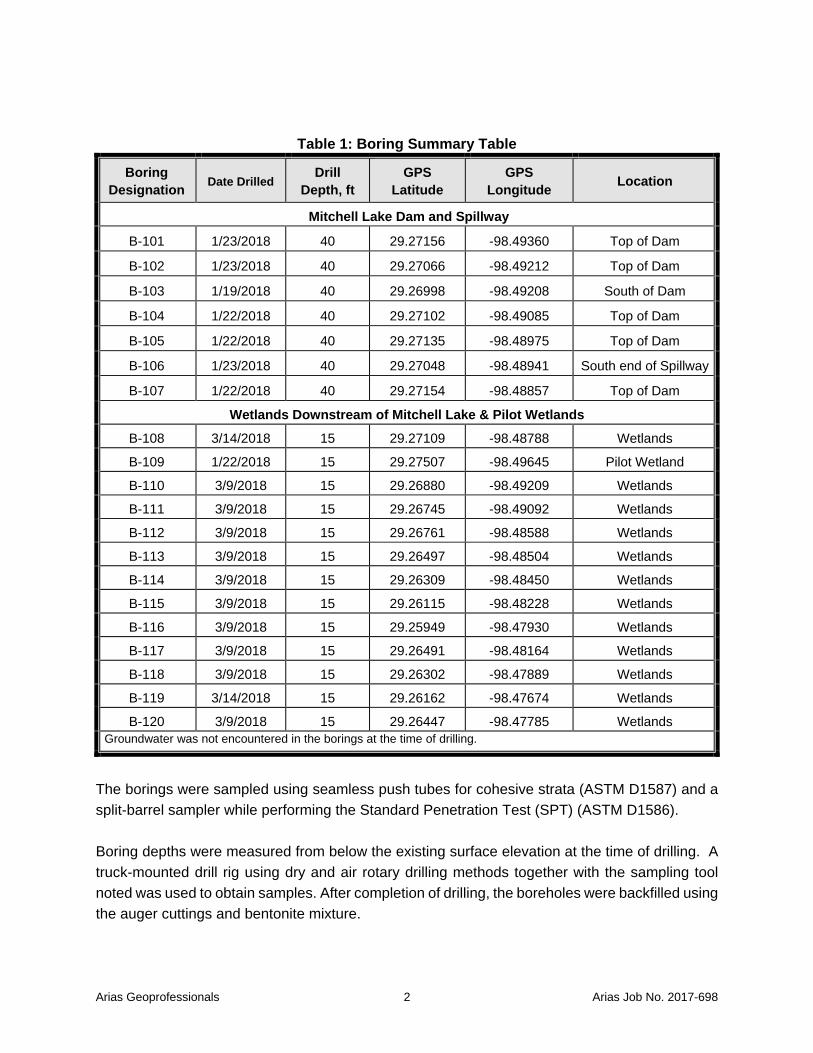
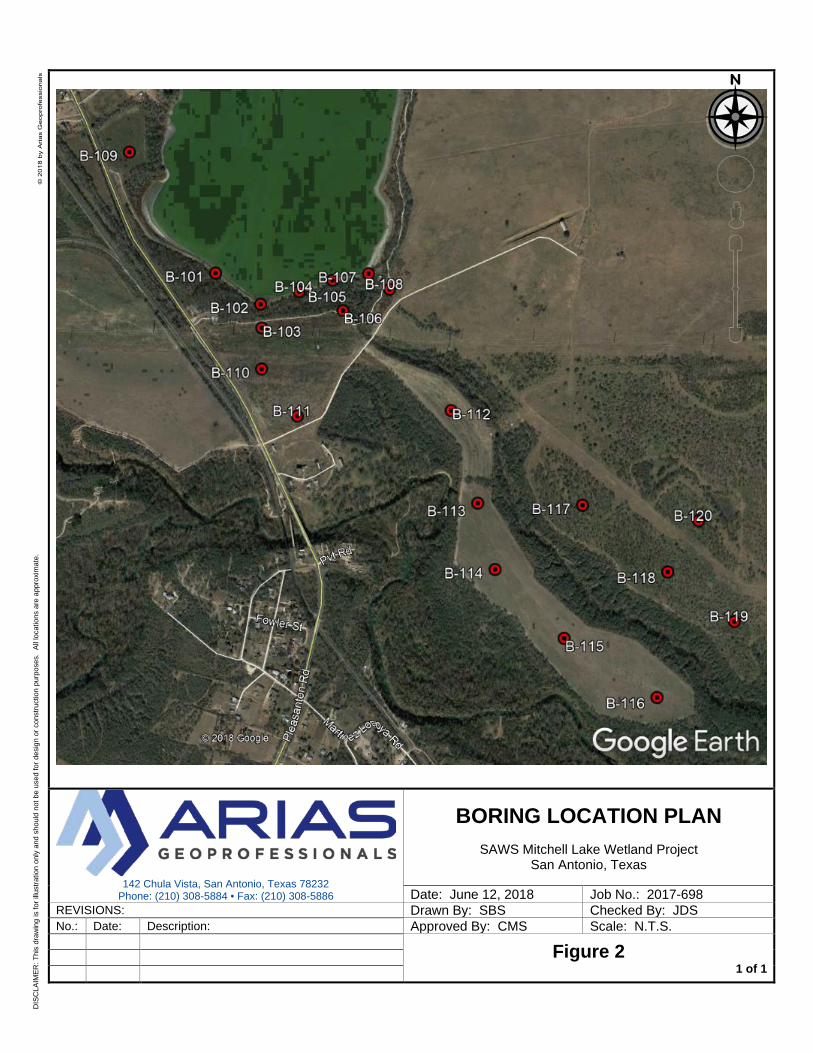
The field exploration consisted of drilling twenty (20) test borings, designated B-101 through B-120, to depths ranging from 15- to 40- ft at the project site. Approximate boring locations are shown on the Boring Location Plan presented on Figure 2 in Appendix A. Boring locations should be considered approximate. A summary of boring information is presented in the following table.
Arias Geoprofessionals 2 Arias Job No. 2017-698
Table 1: Boring Summary Table
Boring Designation Date Drilled
Drill Depth, ft
GPS Latitude
GPS Longitude Location
Mitchell Lake Dam and Spillway
B-101 1/23/2018 40 29.27156 -98.49360 Top of Dam
B-102 1/23/2018 40 29.27066 -98.49212 Top of Dam
B-103 1/19/2018 40 29.26998 -98.49208 South of Dam
B-104 1/22/2018 40 29.27102 -98.49085 Top of Dam
B-105 1/22/2018 40 29.27135 -98.48975 Top of Dam
B-106 1/23/2018 40 29.27048 -98.48941 South end of Spillway
B-107 1/22/2018 40 29.27154 -98.48857 Top of Dam
Wetlands Downstream of Mitchell Lake & Pilot Wetlands B-108 3/14/2018 15 29.27109 -98.48788 Wetlands
B-109 1/22/2018 15 29.27507 -98.49645 Pilot Wetland
B-110 3/9/2018 15 29.26880 -98.49209 Wetlands
B-111 3/9/2018 15 29.26745 -98.49092 Wetlands
B-112 3/9/2018 15 29.26761 -98.48588 Wetlands
B-113 3/9/2018 15 29.26497 -98.48504 Wetlands
B-114 3/9/2018 15 29.26309 -98.48450 Wetlands
B-115 3/9/2018 15 29.26115 -98.48228 Wetlands
B-116 3/9/2018 15 29.25949 -98.47930 Wetlands
B-117 3/9/2018 15 29.26491 -98.48164 Wetlands
B-118 3/9/2018 15 29.26302 -98.47889 Wetlands
B-119 3/14/2018 15 29.26162 -98.47674 Wetlands
B-120 3/9/2018 15 29.26447 -98.47785 Wetlands Groundwater was not encountered in the borings at the time of drilling.
The borings were sampled using seamless push tubes for cohesive strata (ASTM D1587) and a split-barrel sampler while performing the Standard Penetration Test (SPT) (ASTM D1586). Boring depths were measured from below the existing surface elevation at the time of drilling. A truck-mounted drill rig using dry and air rotary drilling methods together with the sampling tool noted was used to obtain samples. After completion of drilling, the boreholes were backfilled using the auger cuttings and bentonite mixture.
Arias Geoprofessionals 3 Arias Job No. 2017-698
Detailed descriptions of subsurface conditions encountered in the borings are presented on the Boring Logs included in Appendix B. Sample type and interval are included on the individual soil boring logs at the respective sample depth. An Arias representative visually logged each recovered sample and selected representative samples for laboratory testing. Site Photographs of the drilling operation are presented in Appendix A, Figure 3. SPT N-values for those intervals where the sampler was advanced for a 12-inch penetration after the initial 6-inch seating are shown on the individual boring logs included in Appendix B. The GPS coordinates (horizontal datum NAD 83) obtained using a hand-held GPS device are shown on the boring logs and should be considered approximate. Drilling and groundwater notes, obtained at the time of boring, are also shown on the boring logs. Soil classifications and borehole logging were conducted during the exploration by one of our field engineering technicians working under the supervision of our Geotechnical Engineer. Final soil classifications, as seen on the boring logs included in Appendix B, were determined in the laboratory based on laboratory and field test results and applicable ASTM procedures. The key to the terms and symbols used on the logs and the field test procedures is also included in Appendix B, following the boring logs.
LABORATORY TESTING
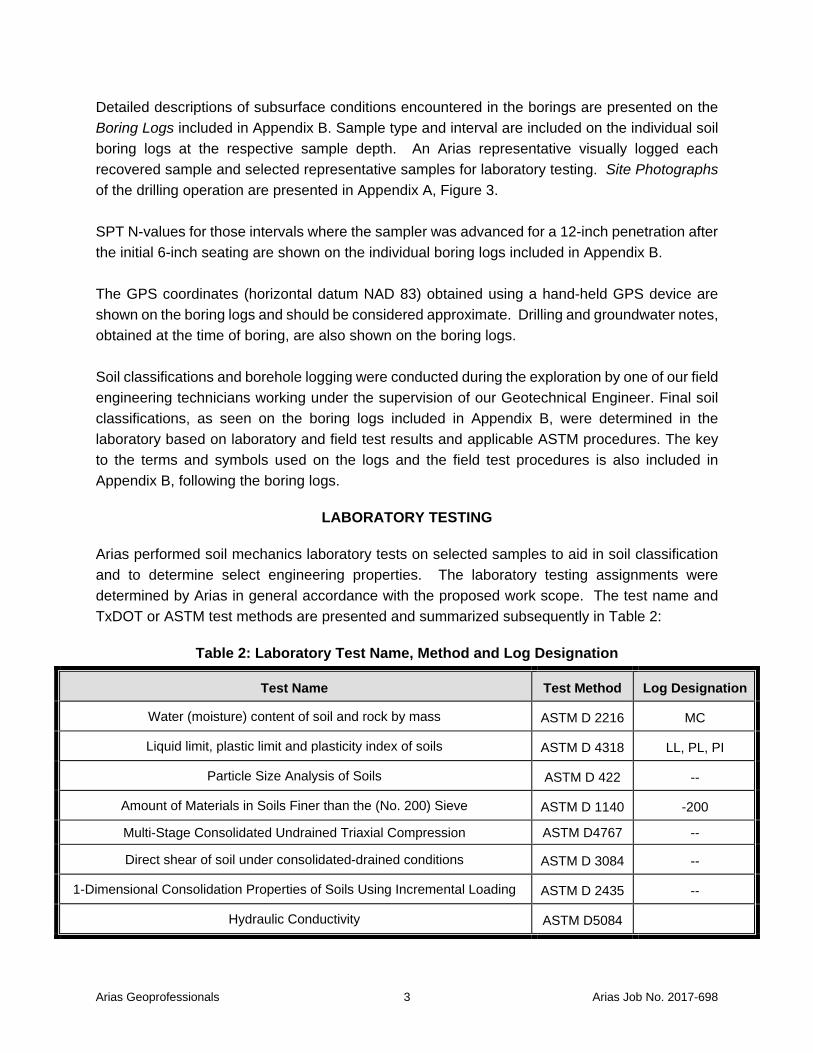
Arias performed soil mechanics laboratory tests on selected samples to aid in soil classification and to determine select engineering properties. The laboratory testing assignments were determined by Arias in general accordance with the proposed work scope. The test name and TxDOT or ASTM test methods are presented and summarized subsequently in Table 2:
Table 2: Laboratory Test Name, Method and Log Designation
Test Name Test Method Log Designation
Water (moisture) content of soil and rock by mass ASTM D 2216 MC
Liquid limit, plastic limit and plasticity index of soils ASTM D 4318 LL, PL, PI
Particle Size Analysis of Soils ASTM D 422 --
Amount of Materials in Soils Finer than the (No. 200) Sieve ASTM D 1140 -200
Multi-Stage Consolidated Undrained Triaxial Compression ASTM D4767 --
Direct shear of soil under consolidated-drained conditions ASTM D 3084 --
1-Dimensional Consolidation Properties of Soils Using Incremental Loading ASTM D 2435 --
Hydraulic Conductivity ASTM D5084
Arias Geoprofessionals 4 Arias Job No. 2017-698
The results of Atterberg Limits (ASTM D4318) and grain size analyses (ASTM D422), are shown on the boring logs at the respective sample depth, and presented in Appendix B. A Graphical presentation of the sieve analyses is presented in Appendix C. The results of the remaining tests are provided in the subsequent report sections and/or respective appendices of this report.
To evaluate one-dimensional (1-D) consolidation properties of the clay soils, incremental loading tests were performed on four (4) sample specimens in general accordance with ASTM D 2435. The results are presented as curves of vertical effective stress vs. axial strain in Appendix D.
To evaluate drained strength parameters, direct shear testing under consolidated drained testing was performed on four (4) recovered samples. The testing was performed on 3 separate specimens for each sample (i.e. multi-sample tests). Laboratory results for the direct shear testing are included in Appendix E.
To evaluate undrained shear strength parameters, multi-stage triaxial compression testing under consolidated-undrained conditions were performed on three (3) recovered samples. For each soil sample, the testing was performed on 3 separate specimens at 3 different confining stresses (i.e. multi-sample tests). The Laboratory results for the triaxial testing are included in Appendix F.
Falling-head hydraulic conductivity testing was performed on two (2) recovered samples in general accordance with ASTM D 2435. The tests were continued until a steady value of hydraulic conductivity was reached for each soil sample. Laboratory results for the hydraulic conductivity testing are included in Appendix G.
The soil laboratory testing for this project was done in accordance with applicable ASTM procedures with the specifications and definitions for these tests listed in Table 2. Remaining soil samples recovered from this exploration will be routinely discarded following submittal of this report.
SITE AND SUBSURFACE CONDITIONS
Geologic, generalized stratigraphic and groundwater conditions at the Project site are discussed in the following sections. The subsurface stratigraphic and groundwater conditions are based on conditions encountered at the boring locations at the time of exploration and to the depths explored.
Area Geology
According to the Geologic Map of Texas, San Antonio, the site is mapped as being underlain by the Fluviatile terrace deposits (Qt). Fluviatile terrace deposits are stream bed deposits typically consisting of clays, sands, silts, and gravels. Such deposits can contain point bars, cutbanks, oxbows, and abandoned channel segments associated with variations in stream bed activity. As a result, soil profiles in terrace deposit areas may vary greatly over relatively short distances. Key
Arias Geoprofessionals 5 Arias Job No. 2017-698
geotechnical engineering concerns for development supported on this formation are the expansive nature of the clays, the consistency or relative density of the deposits, and the absence/presence as well as thickness of potentially water‐bearing gravels. Due to the alluvial nature of these deposits, significant variations can occur over short distances. A Geologic Map is presented on Figure 4 in Appendix A.
Site Stratigraphic and Engineering Properties
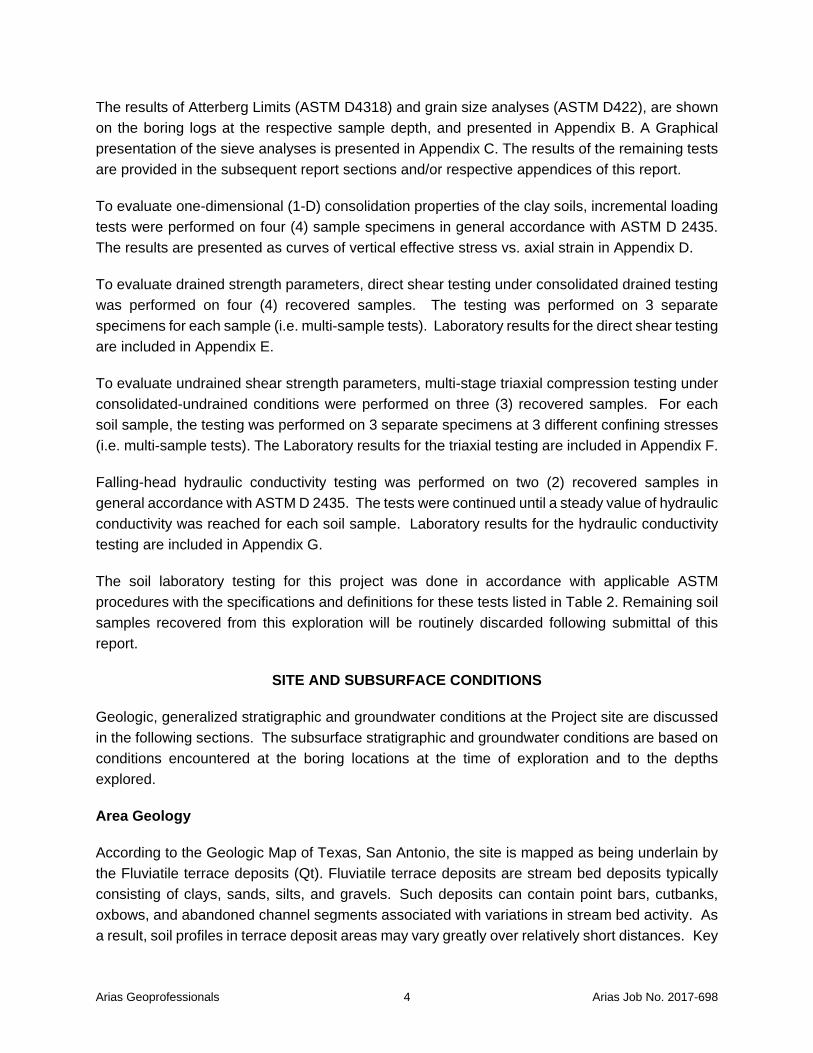
The general stratigraphic conditions at the boring locations are provided in Table 3. The presence and thickness of the various subsurface materials can be expected to vary away from and between the exploration locations. The descriptions conform to the Unified Soils Classification System. Table 3: Generalized Subsurface Conditions and Engineering Properties
Stratum Depth, ft. Material Type PI
range No. 200 range
PP Range,
tsf
N range
FILL
0 – 6
to
6 – 11
Fill: Fat Clay (CH); Lean Clay, Sandy Lean Clay (CL); stiff to hard; dark to light brown, tan, gray; with trace gravel, trace
calcareous deposits, ferrous stains
23 – 54 84 – 97 1.25 – 4.5+ 11 – 48
CLAYEY MATERIAL
0 – 38
to
2 – 40
Fat Clay (CH); Lean Clay, Lean Clay with Sand, Sandy Lean Clay (CL); soft to hard; dark to light gray, dark to light
brown, reddish brown, tan; with ferrous stains, sand seams (Not noted at B-108)
18 – 40 61 – 98 0.25 – 4.5+ 10 – 50/3’’
GRANULAR MATERIAL
0 – 4
to
4 – 15
Clayey Sand, Clayey Sand with Gravel (SC); loose to very dense; tan, brown; with calcareous nodules, ferrous stains
(Noted at B-108 & B-109)
14 – 19 26 – 43 4.5+ 10 – 50/2’’
Where: Depth - Depth from existing ground surface at the time of geotechnical study, feet PI - Plasticity Index, % -200 - Percent passing U.S. Standard No. 200 sieve, % N - Standard Penetration Test, N-value, in blows per foot (bpf) PP - Pocket Penetrometer, tsf UC - Unconfined Compressive Strength, tsf Avg - Average value Typ - Typical value BTD - Boring Termination Depth Soil conditions may vary between the sample boring locations. Transition boundaries or contacts, noted on the boring logs to separate soil types, are approximate. Actual contacts may be gradual and vary at different locations. If conditions encountered during construction indicate more
Arias Geoprofessionals 6 Arias Job No. 2017-698
variation than established as a result of this study, we should be contacted to evaluate the significance of the changed conditions relative to our recommendations.
Groundwater Occurrence.
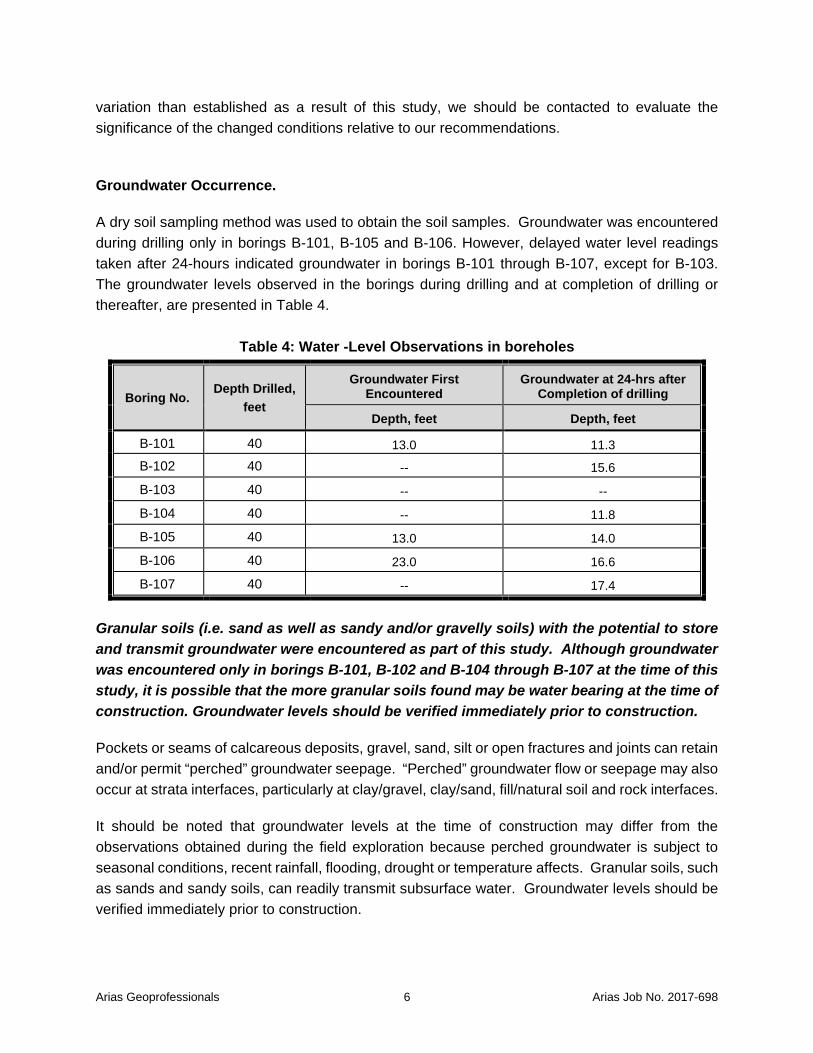
A dry soil sampling method was used to obtain the soil samples. Groundwater was encountered during drilling only in borings B-101, B-105 and B-106. However, delayed water level readings taken after 24-hours indicated groundwater in borings B-101 through B-107, except for B-103. The groundwater levels observed in the borings during drilling and at completion of drilling or thereafter, are presented in Table 4.
Table 4: Water -Level Observations in boreholes
Boring No. Depth Drilled,
feet
Groundwater First Encountered
Groundwater at 24-hrs after Completion of drilling
Depth, feet Depth, feet
B-101 40 13.0
11.3 B-102 40 -- 15.6
B-103 40 -- --
B-104 40 -- 11.8
B-105 40 13.0 14.0
B-106 40 23.0 16.6
B-107 40 -- 17.4
Granular soils (i.e. sand as well as sandy and/or gravelly soils) with the potential to store and transmit groundwater were encountered as part of this study. Although groundwater was encountered only in borings B-101, B-102 and B-104 through B-107 at the time of this study, it is possible that the more granular soils found may be water bearing at the time of construction. Groundwater levels should be verified immediately prior to construction.
Pockets or seams of calcareous deposits, gravel, sand, silt or open fractures and joints can retain and/or permit “perched” groundwater seepage. “Perched” groundwater flow or seepage may also occur at strata interfaces, particularly at clay/gravel, clay/sand, fill/natural soil and rock interfaces.
It should be noted that groundwater levels at the time of construction may differ from the observations obtained during the field exploration because perched groundwater is subject to seasonal conditions, recent rainfall, flooding, drought or temperature affects. Granular soils, such as sands and sandy soils, can readily transmit subsurface water. Groundwater levels should be verified immediately prior to construction.
Arias Geoprofessionals 7 Arias Job No. 2017-698
The installation of temporary piezometers (observation wells) can be performed to obtain more accurate groundwater data. Additionally, pump and recharge tests can be performed using the piezometers to aid in estimating groundwater seepage rates. Subsurface water readings and seepage rates will generally provide an indication of groundwater conditions at that respective location and time. If needed, this information can be used to assist the contractor in developing construction dewatering plans. We should note that installing piezometers and performing groundwater testing was beyond our authorized scope of services for this project. We can provide these services if desired.
Due to the location of the proposed construction within a lake and floodplain area, the presence of groundwater should be anticipated during excavations. Both temporary and permanent groundwater controls will be necessary for proper embankment dam construction and suitable long-term performance. Temporary groundwater controls are typically the responsibility of the contractor and may consist of sumping and pumping and/or deep wells and well points.
GENERAL COMMENTS
This report was prepared as an instrument of service for this project exclusively for the use of Mr. Timothy Noack, P. E, Alan Plummer Associates, Inc. and their design team. If the development plans change relative to layout, size or anticipated loads or if different subsurface conditions are encountered, we should be informed and retained to ascertain the impact of these changes on our recommendations. We cannot be responsible for the potential impact of these changes if we are not informed.
Subsurface Variations
Soil and groundwater conditions may vary between the sample boring locations. Transition boundaries or contacts, noted on the boring logs to separate soil/rock types, are approximate. Actual contacts may be gradual and vary at different locations. The contractor should verify that similar conditions exist throughout the proposed area of excavation. If different subsurface conditions or highly variable subsurface conditions are encountered during construction, we should be contacted to evaluate the significance of the changed conditions relative to our recommendations.
Standard of Care
Subject to the limitations inherent in the agreed scope of services as to the degree of care and amount of time and expenses to be incurred, and subject to any other limitations contained in the agreement for this work, Arias has performed its services consistent with that level of care and skill ordinarily exercised by other professional engineers practicing in the same locale and under similar circumstances at the time the services were performed. Information about this geotechnical report is provided in the ASFE publication included in Appendix H.
Arias Geoprofessionals A-1 Arias Job No. 2017-698
APPENDIX A: FIGURES
142 Chula Vista, San Antonio, Texas 78232 Phone: (210) 308-5884 • Fax: (210) 308-5886
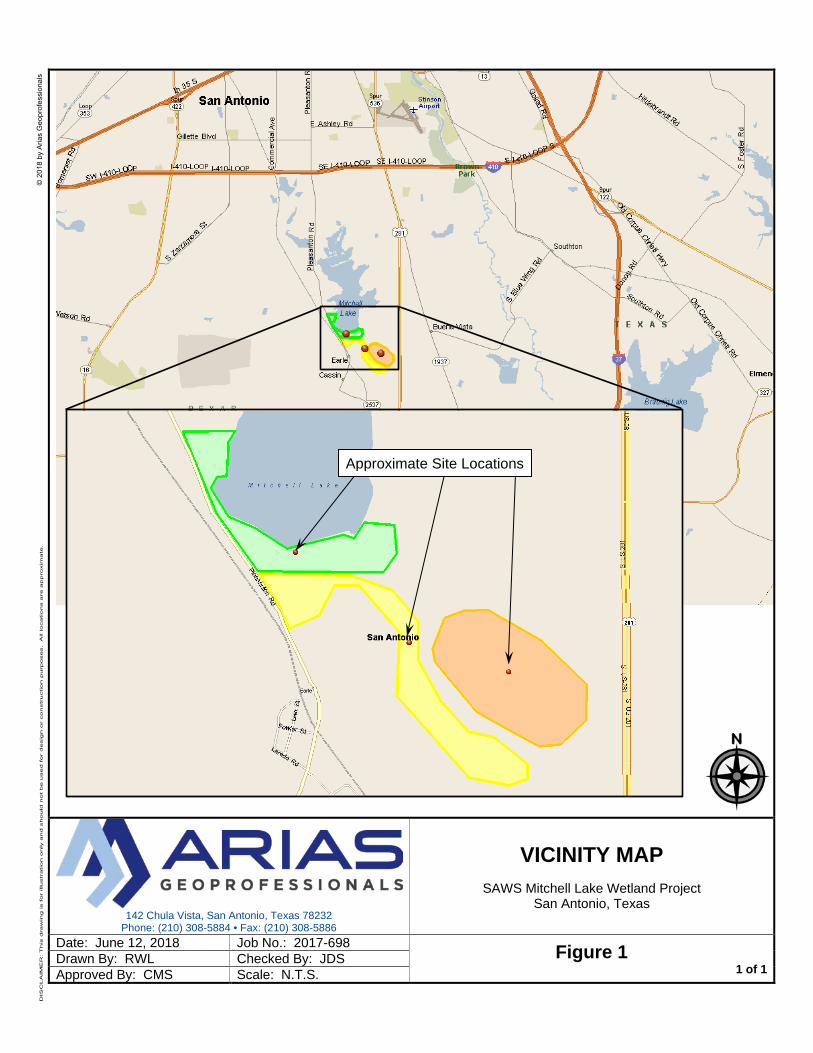
VICINITY MAP
SAWS Mitchell Lake Wetland Project San Antonio, Texas
Date: June 12, 2018 Job No.: 2017-698 Figure 1 1 of 1
Drawn By: RWL Checked By: JDS Approved By: CMS Scale: N.T.S.
Approximate Site Locations
142 Chula Vista, San Antonio, Texas 78232 Phone: (210) 308-5884 • Fax: (210) 308-5886
BORING LOCATION PLAN
SAWS Mitchell Lake Wetland Project San Antonio, Texas
Date: June 12, 2018 Job No.: 2017-698 REVISIONS: Drawn By: SBS Checked By: JDS No.: Date: Description: Approved By: CMS Scale: N.T.S. Figure 2
1 of 1
DIS
CLA
IMER
: Thi
s dr
awin
g is
for i
llust
ratio
n on
ly a
nd s
houl
d no
t be
used
for d
esig
n or
con
stru
ctio
n pu
rpos
es.
All l
ocat
ions
are
app
roxi
mat
e.
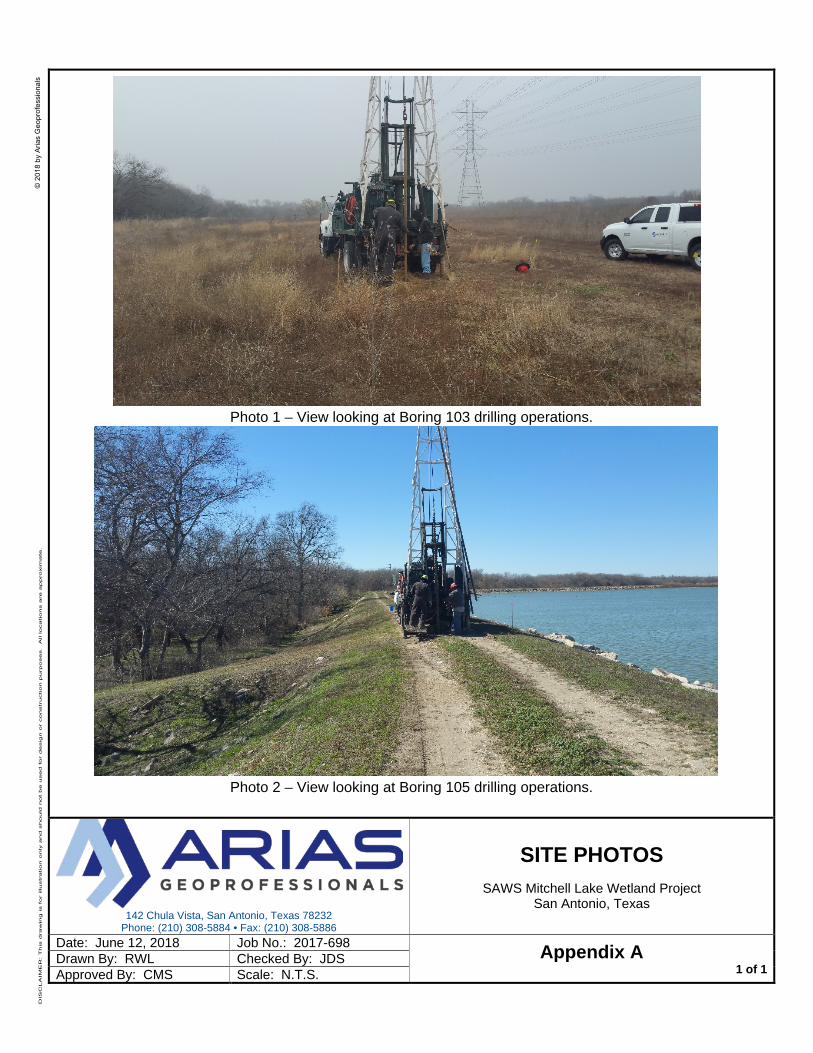
Photo 1 – View looking at Boring 103 drilling operations.
Photo 2 – View looking at Boring 105 drilling operations.
142 Chula Vista, San Antonio, Texas 78232 Phone: (210) 308-5884 • Fax: (210) 308-5886
SITE PHOTOS
SAWS Mitchell Lake Wetland Project San Antonio, Texas
Date: June 12, 2018 Job No.: 2017-698 Appendix A 1 of 1
Drawn By: RWL Checked By: JDS Approved By: CMS Scale: N.T.S.
Arias Geoprofessionals B-1 Arias Job No. 2017-698
APPENDIX B: SOIL BORING LOGS AND KEY TO TERMS
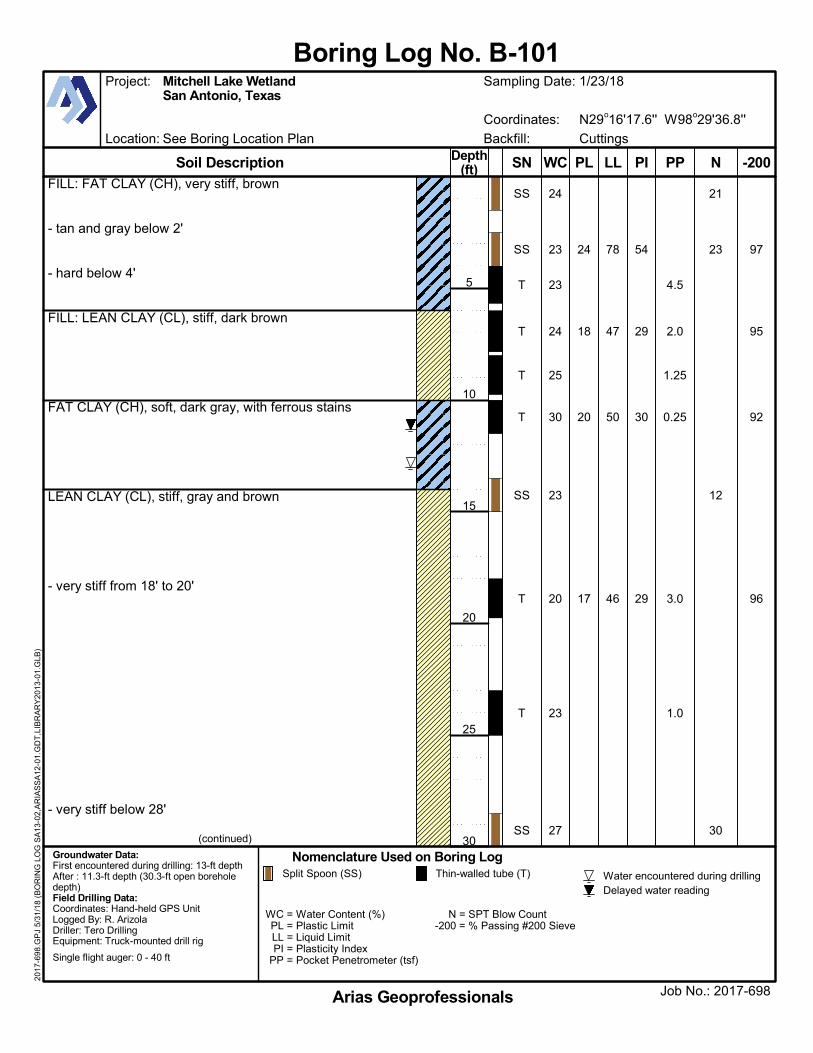
FILL: FAT CLAY (CH), very stiff, brown
- tan and gray below 2'
- hard below 4'
FILL: LEAN CLAY (CL), stiff, dark brown
FAT CLAY (CH), soft, dark gray, with ferrous stains
LEAN CLAY (CL), stiff, gray and brown
- very stiff from 18' to 20'
- very stiff below 28'
97
95
92
96
21
23
12
30
4.5
2.0
1.25
0.25
3.0
1.0
24
18
20
17
78
47
50
46
54
29
30
29
24
23
23
24
25
30
23
20
23
27
SS
SS
T
T
T
T
SS
T
T
SS
Location: See Boring Location Plan
Coordinates: N29o16'17.6'' W98o29'36.8''
WC = Water Content (%)PL = Plastic LimitLL = Liquid LimitPI = Plasticity Index
PP = Pocket Penetrometer (tsf)
N = SPT Blow Count-200 = % Passing #200 Sieve
Soil Description
Nomenclature Used on Boring LogGroundwater Data:First encountered during drilling: 13-ft depthAfter : 11.3-ft depth (30.3-ft open boreholedepth)Field Drilling Data:Coordinates: Hand-held GPS UnitLogged By: R. ArizolaDriller: Tero DrillingEquipment: Truck-mounted drill rig
Single flight auger: 0 - 40 ft
Backfill: Cuttings
Water encountered during drilling
(continued)
Split Spoon (SS) Thin-walled tube (T)
Job No.: 2017-698
Project: Mitchell Lake WetlandSan Antonio, Texas
Delayed water reading
Sampling Date: 1/23/18
Arias Geoprofessionals
Boring Log No. B-10120
17-6
98.G
PJ
5/31
/18
(BO
RIN
G L
OG
SA
13-0
2,A
RIA
SS
A12
-01.
GD
T,L
IBR
AR
Y20
13-0
1.G
LB)
-200NPPPL LL PIWCSNDepth(ft)
5
10
15
20
25
30
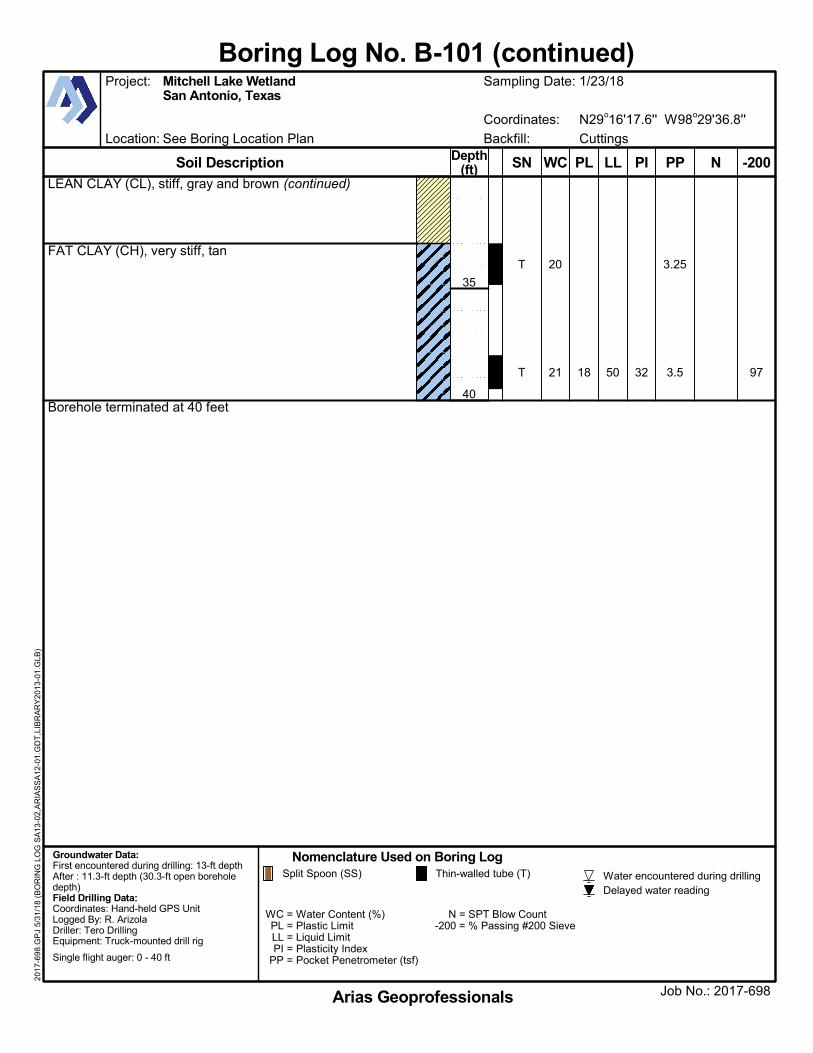
LEAN CLAY (CL), stiff, gray and brown (continued)
FAT CLAY (CH), very stiff, tan
Borehole terminated at 40 feet
97
3.25
3.518 50 32
20
21
T
T
Location: See Boring Location Plan
Coordinates: N29o16'17.6'' W98o29'36.8''
WC = Water Content (%)PL = Plastic LimitLL = Liquid LimitPI = Plasticity Index
PP = Pocket Penetrometer (tsf)
N = SPT Blow Count-200 = % Passing #200 Sieve
Soil Description
Nomenclature Used on Boring LogGroundwater Data:First encountered during drilling: 13-ft depthAfter : 11.3-ft depth (30.3-ft open boreholedepth)Field Drilling Data:Coordinates: Hand-held GPS UnitLogged By: R. ArizolaDriller: Tero DrillingEquipment: Truck-mounted drill rig
Single flight auger: 0 - 40 ft
Backfill: Cuttings
Water encountered during drillingSplit Spoon (SS) Thin-walled tube (T)
Job No.: 2017-698
Project: Mitchell Lake WetlandSan Antonio, Texas
Delayed water reading
Sampling Date: 1/23/18
Arias Geoprofessionals
Boring Log No. B-101 (continued)20
17-6
98.G
PJ
5/31
/18
(BO
RIN
G L
OG
SA
13-0
2,A
RIA
SS
A12
-01.
GD
T,L
IBR
AR
Y20
13-0
1.G
LB)
-200NPPPL LL PIWCSNDepth(ft)
35
40
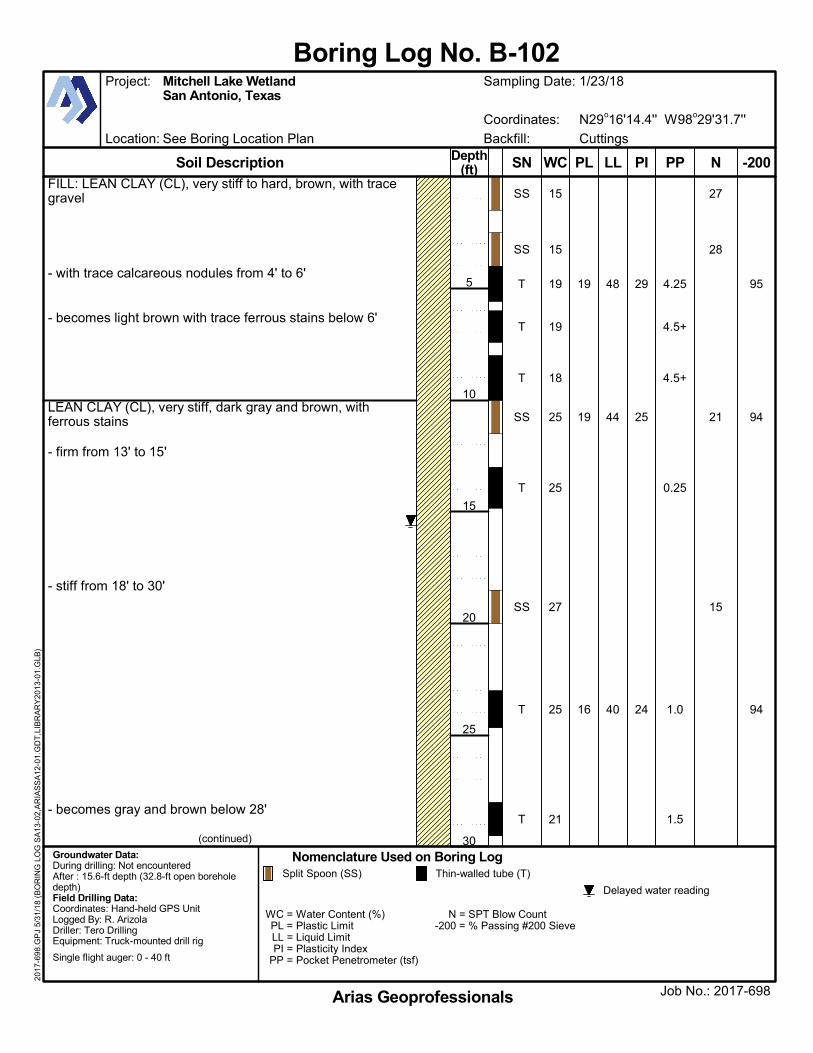
FILL: LEAN CLAY (CL), very stiff to hard, brown, with tracegravel
- with trace calcareous nodules from 4' to 6'
- becomes light brown with trace ferrous stains below 6'
LEAN CLAY (CL), very stiff, dark gray and brown, withferrous stains
- firm from 13' to 15'
- stiff from 18' to 30'
- becomes gray and brown below 28'
95
94
94
27
28
21
15
4.25
4.5+
4.5+
0.25
1.0
1.5
19
19
16
48
44
40
29
25
24
15
15
19
19
18
25
25
27
25
21
SS
SS
T
T
T
SS
T
SS
T
T
Location: See Boring Location Plan
Coordinates: N29o16'14.4'' W98o29'31.7''
WC = Water Content (%)PL = Plastic LimitLL = Liquid LimitPI = Plasticity Index
PP = Pocket Penetrometer (tsf)
N = SPT Blow Count-200 = % Passing #200 Sieve
Soil Description
Nomenclature Used on Boring LogGroundwater Data:During drilling: Not encounteredAfter : 15.6-ft depth (32.8-ft open boreholedepth)Field Drilling Data:Coordinates: Hand-held GPS UnitLogged By: R. ArizolaDriller: Tero DrillingEquipment: Truck-mounted drill rig
Single flight auger: 0 - 40 ft
Backfill: Cuttings
(continued)
Split Spoon (SS) Thin-walled tube (T)
Job No.: 2017-698
Project: Mitchell Lake WetlandSan Antonio, Texas
Delayed water reading
Sampling Date: 1/23/18
Arias Geoprofessionals
Boring Log No. B-10220
17-6
98.G
PJ
5/31
/18
(BO
RIN
G L
OG
SA
13-0
2,A
RIA
SS
A12
-01.
GD
T,L
IBR
AR
Y20
13-0
1.G
LB)
-200NPPPL LL PIWCSNDepth(ft)
5
10
15
20
25
30
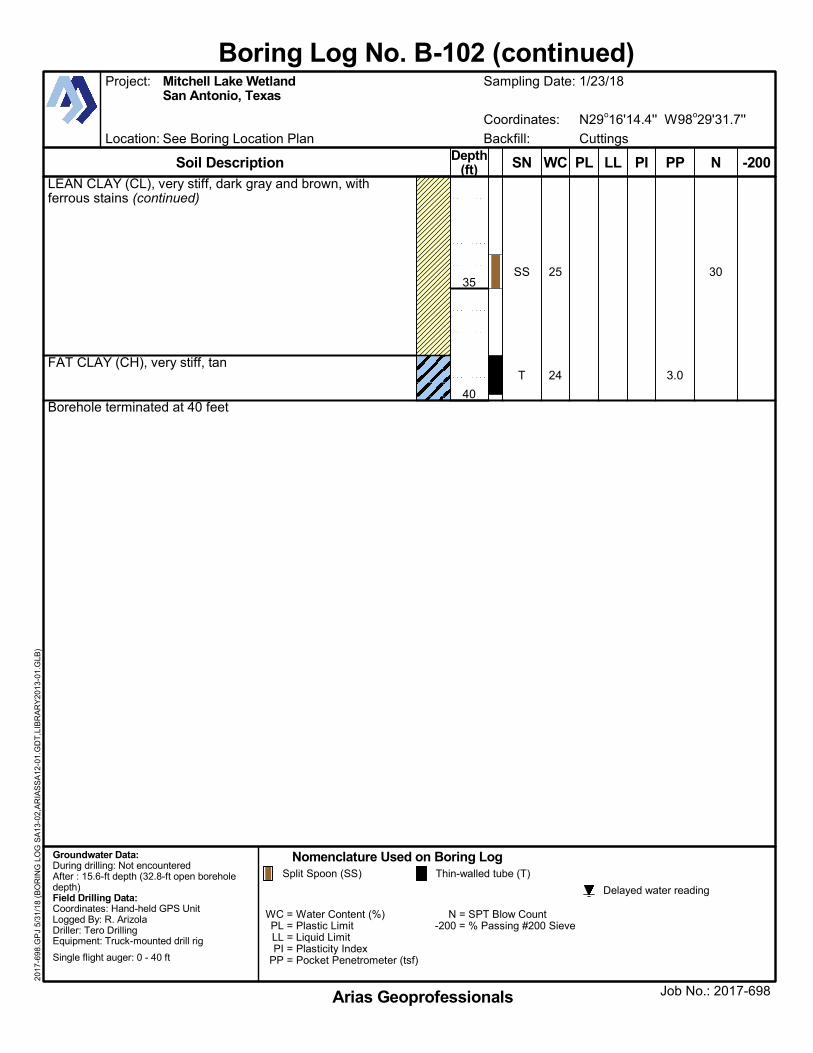
LEAN CLAY (CL), very stiff, dark gray and brown, withferrous stains (continued)
FAT CLAY (CH), very stiff, tan
Borehole terminated at 40 feet
30
3.0
25
24
SS
T
Location: See Boring Location Plan
Coordinates: N29o16'14.4'' W98o29'31.7''
WC = Water Content (%)PL = Plastic LimitLL = Liquid LimitPI = Plasticity Index
PP = Pocket Penetrometer (tsf)
N = SPT Blow Count-200 = % Passing #200 Sieve
Soil Description
Nomenclature Used on Boring LogGroundwater Data:During drilling: Not encounteredAfter : 15.6-ft depth (32.8-ft open boreholedepth)Field Drilling Data:Coordinates: Hand-held GPS UnitLogged By: R. ArizolaDriller: Tero DrillingEquipment: Truck-mounted drill rig
Single flight auger: 0 - 40 ft
Backfill: Cuttings
Split Spoon (SS) Thin-walled tube (T)
Job No.: 2017-698
Project: Mitchell Lake WetlandSan Antonio, Texas
Delayed water reading
Sampling Date: 1/23/18
Arias Geoprofessionals
Boring Log No. B-102 (continued)20
17-6
98.G
PJ
5/31
/18
(BO
RIN
G L
OG
SA
13-0
2,A
RIA
SS
A12
-01.
GD
T,L
IBR
AR
Y20
13-0
1.G
LB)
-200NPPPL LL PIWCSNDepth(ft)
35
40
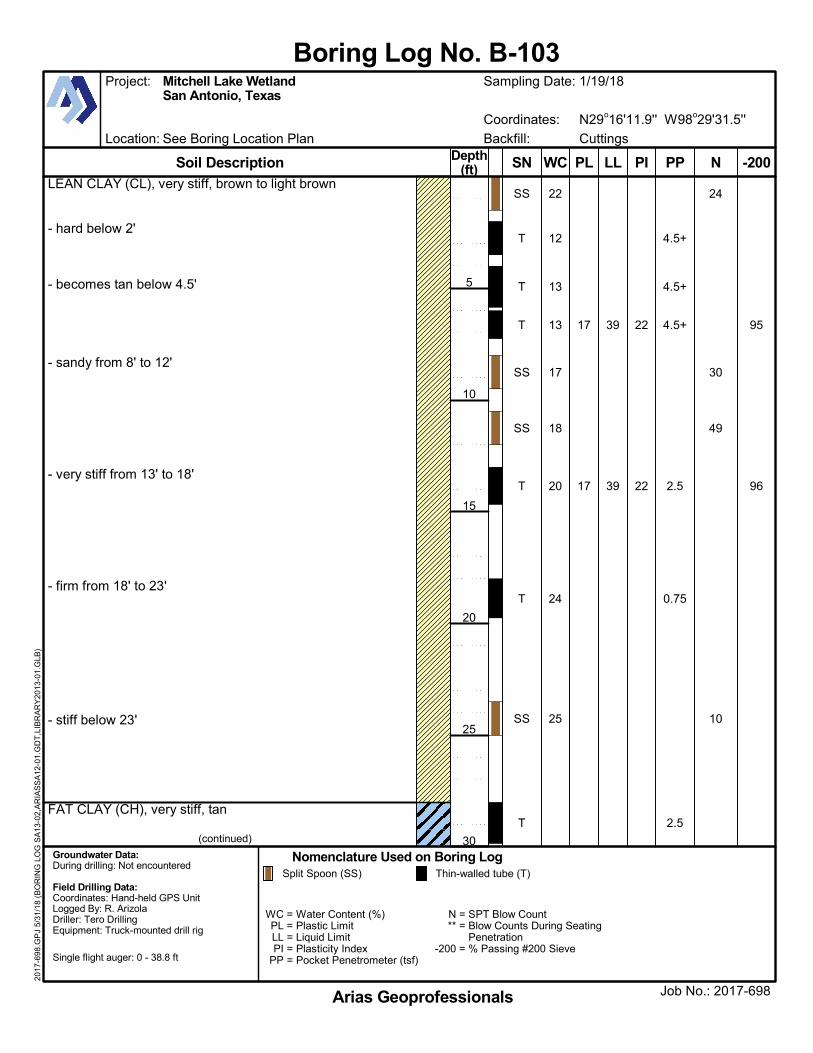
LEAN CLAY (CL), very stiff, brown to light brown
- hard below 2'
- becomes tan below 4.5'
- sandy from 8' to 12'
- very stiff from 13' to 18'
- firm from 18' to 23'
- stiff below 23'
FAT CLAY (CH), very stiff, tan
95
96
24
30
49
10
4.5+
4.5+
4.5+
2.5
0.75
2.5
17
17
39
39
22
22
22
12
13
13
17
18
20
24
25
SS
T
T
T
SS
SS
T
T
SS
T
Location: See Boring Location Plan
Coordinates: N29o16'11.9'' W98o29'31.5''
WC = Water Content (%)PL = Plastic LimitLL = Liquid LimitPI = Plasticity Index
PP = Pocket Penetrometer (tsf)
N = SPT Blow Count** = Blow Counts During Seating
Penetration-200 = % Passing #200 Sieve
Soil Description
Nomenclature Used on Boring LogGroundwater Data:During drilling: Not encountered
Field Drilling Data:Coordinates: Hand-held GPS UnitLogged By: R. ArizolaDriller: Tero DrillingEquipment: Truck-mounted drill rig
Single flight auger: 0 - 38.8 ft
Backfill: Cuttings
(continued)
Split Spoon (SS) Thin-walled tube (T)
Job No.: 2017-698
Project: Mitchell Lake WetlandSan Antonio, Texas
Sampling Date: 1/19/18
Arias Geoprofessionals
Boring Log No. B-10320
17-6
98.G
PJ
5/31
/18
(BO
RIN
G L
OG
SA
13-0
2,A
RIA
SS
A12
-01.
GD
T,L
IBR
AR
Y20
13-0
1.G
LB)
-200NPPPL LL PIWCSNDepth(ft)
5
10
15
20
25
30
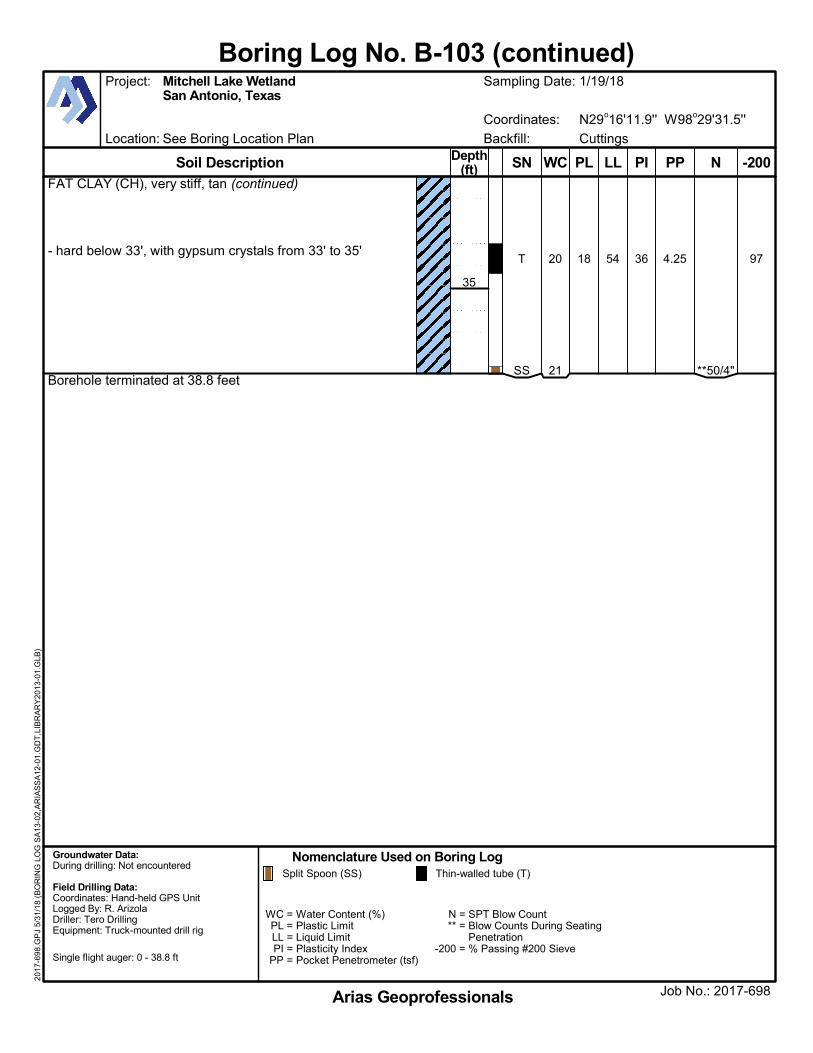
FAT CLAY (CH), very stiff, tan (continued)
- hard below 33', with gypsum crystals from 33' to 35'
Borehole terminated at 38.8 feet
97
**50/4"
4.2518 54 3620
21
T
SS
Location: See Boring Location Plan
Coordinates: N29o16'11.9'' W98o29'31.5''
WC = Water Content (%)PL = Plastic LimitLL = Liquid LimitPI = Plasticity Index
PP = Pocket Penetrometer (tsf)
N = SPT Blow Count** = Blow Counts During Seating
Penetration-200 = % Passing #200 Sieve
Soil Description
Nomenclature Used on Boring LogGroundwater Data:During drilling: Not encountered
Field Drilling Data:Coordinates: Hand-held GPS UnitLogged By: R. ArizolaDriller: Tero DrillingEquipment: Truck-mounted drill rig
Single flight auger: 0 - 38.8 ft
Backfill: Cuttings
Split Spoon (SS) Thin-walled tube (T)
Job No.: 2017-698
Project: Mitchell Lake WetlandSan Antonio, Texas
Sampling Date: 1/19/18
Arias Geoprofessionals
Boring Log No. B-103 (continued)20
17-6
98.G
PJ
5/31
/18
(BO
RIN
G L
OG
SA
13-0
2,A
RIA
SS
A12
-01.
GD
T,L
IBR
AR
Y20
13-0
1.G
LB)
-200NPPPL LL PIWCSNDepth(ft)
35
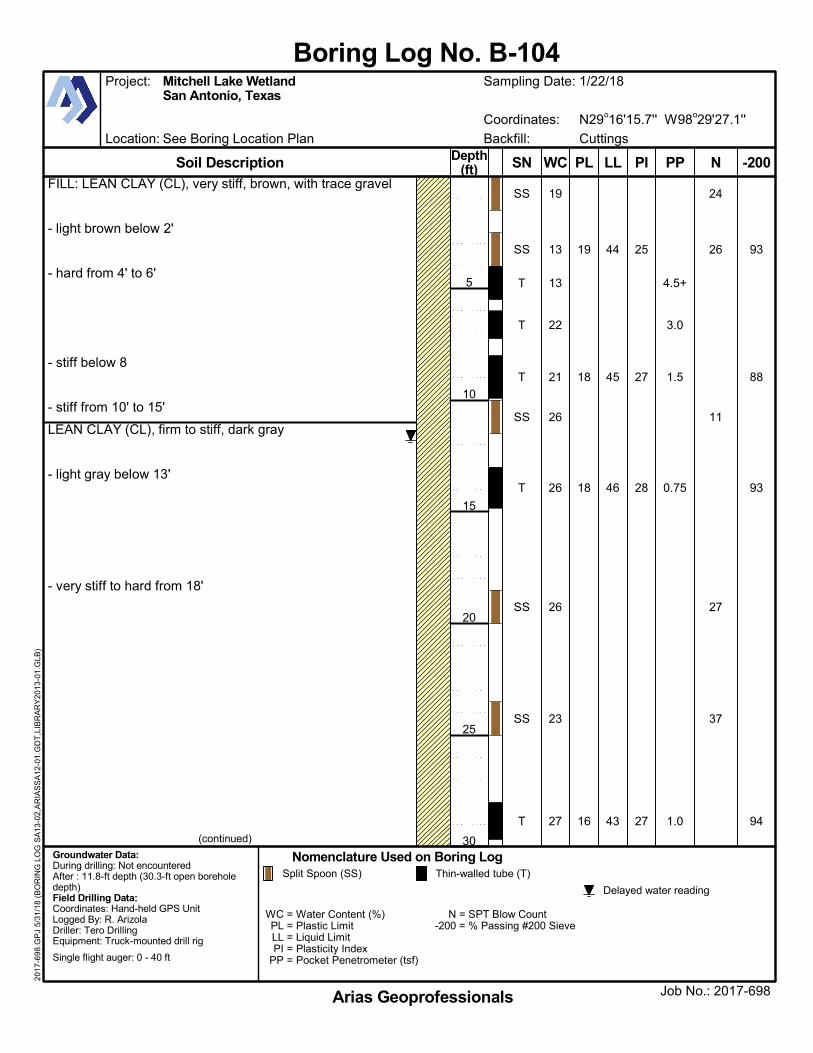
FILL: LEAN CLAY (CL), very stiff, brown, with trace gravel
- light brown below 2'
- hard from 4' to 6'
- stiff below 8
- stiff from 10' to 15'
LEAN CLAY (CL), firm to stiff, dark gray
- light gray below 13'
- very stiff to hard from 18'
93
88
93
94
24
26
11
27
37
4.5+
3.0
1.5
0.75
1.0
19
18
18
16
44
45
46
43
25
27
28
27
19
13
13
22
21
26
26
26
23
27
SS
SS
T
T
T
SS
T
SS
SS
T
Location: See Boring Location Plan
Coordinates: N29o16'15.7'' W98o29'27.1''
WC = Water Content (%)PL = Plastic LimitLL = Liquid LimitPI = Plasticity Index
PP = Pocket Penetrometer (tsf)
N = SPT Blow Count-200 = % Passing #200 Sieve
Soil Description
Nomenclature Used on Boring LogGroundwater Data:During drilling: Not encounteredAfter : 11.8-ft depth (30.3-ft open boreholedepth)Field Drilling Data:Coordinates: Hand-held GPS UnitLogged By: R. ArizolaDriller: Tero DrillingEquipment: Truck-mounted drill rig
Single flight auger: 0 - 40 ft
Backfill: Cuttings
(continued)
Split Spoon (SS) Thin-walled tube (T)
Job No.: 2017-698
Project: Mitchell Lake WetlandSan Antonio, Texas
Delayed water reading
Sampling Date: 1/22/18
Arias Geoprofessionals
Boring Log No. B-10420
17-6
98.G
PJ
5/31
/18
(BO
RIN
G L
OG
SA
13-0
2,A
RIA
SS
A12
-01.
GD
T,L
IBR
AR
Y20
13-0
1.G
LB)
-200NPPPL LL PIWCSNDepth(ft)
5
10
15
20
25
30
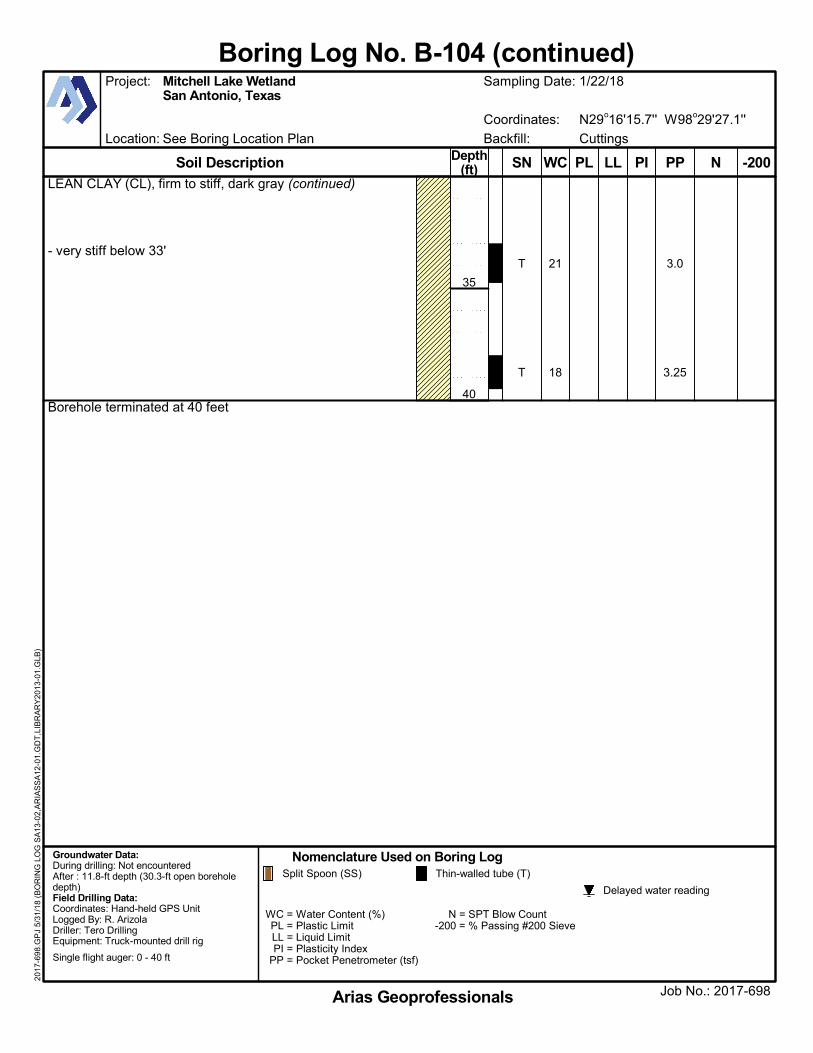
LEAN CLAY (CL), firm to stiff, dark gray (continued)
- very stiff below 33'
Borehole terminated at 40 feet
3.0
3.25
21
18
T
T
Location: See Boring Location Plan
Coordinates: N29o16'15.7'' W98o29'27.1''
WC = Water Content (%)PL = Plastic LimitLL = Liquid LimitPI = Plasticity Index
PP = Pocket Penetrometer (tsf)
N = SPT Blow Count-200 = % Passing #200 Sieve
Soil Description
Nomenclature Used on Boring LogGroundwater Data:During drilling: Not encounteredAfter : 11.8-ft depth (30.3-ft open boreholedepth)Field Drilling Data:Coordinates: Hand-held GPS UnitLogged By: R. ArizolaDriller: Tero DrillingEquipment: Truck-mounted drill rig
Single flight auger: 0 - 40 ft
Backfill: Cuttings
Split Spoon (SS) Thin-walled tube (T)
Job No.: 2017-698
Project: Mitchell Lake WetlandSan Antonio, Texas
Delayed water reading
Sampling Date: 1/22/18
Arias Geoprofessionals
Boring Log No. B-104 (continued)20
17-6
98.G
PJ
5/31
/18
(BO
RIN
G L
OG
SA
13-0
2,A
RIA
SS
A12
-01.
GD
T,L
IBR
AR
Y20
13-0
1.G
LB)
-200NPPPL LL PIWCSNDepth(ft)
35
40
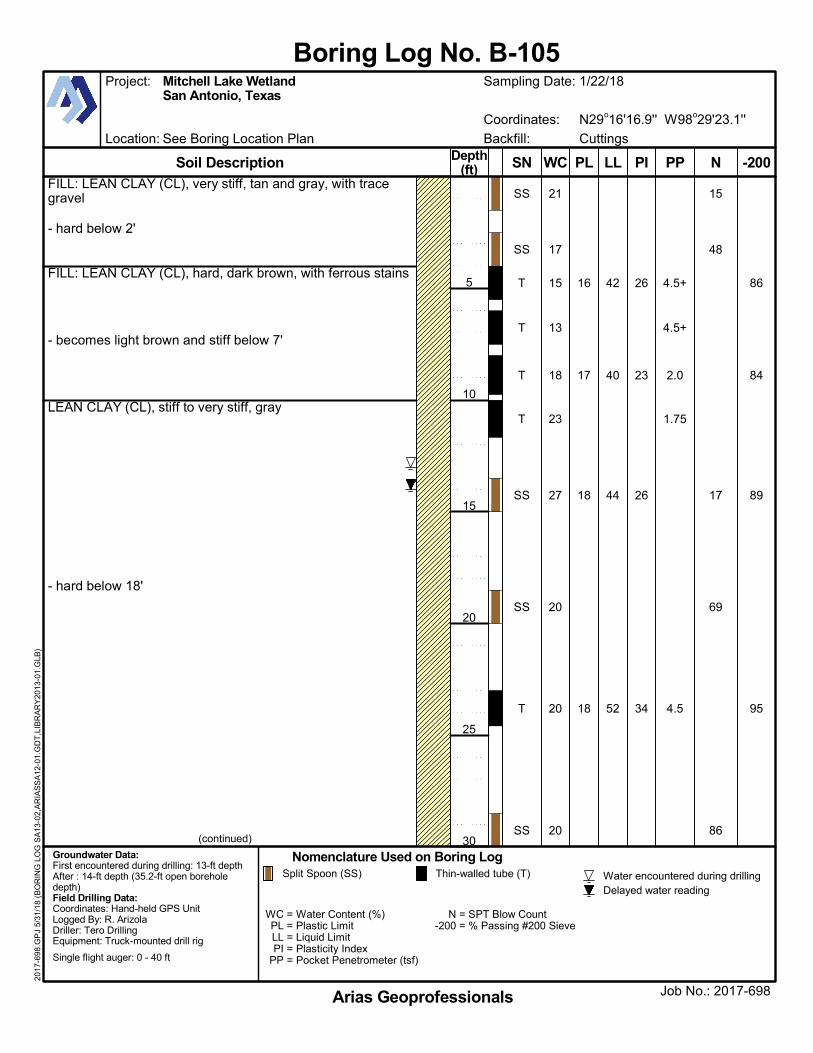
FILL: LEAN CLAY (CL), very stiff, tan and gray, with tracegravel
- hard below 2'
FILL: LEAN CLAY (CL), hard, dark brown, with ferrous stains
- becomes light brown and stiff below 7'
LEAN CLAY (CL), stiff to very stiff, gray
- hard below 18'
86
84
89
95
15
48
17
69
86
4.5+
4.5+
2.0
1.75
4.5
16
17
18
18
42
40
44
52
26
23
26
34
21
17
15
13
18
23
27
20
20
20
SS
SS
T
T
T
T
SS
SS
T
SS
Location: See Boring Location Plan
Coordinates: N29o16'16.9'' W98o29'23.1''
WC = Water Content (%)PL = Plastic LimitLL = Liquid LimitPI = Plasticity Index
PP = Pocket Penetrometer (tsf)
N = SPT Blow Count-200 = % Passing #200 Sieve
Soil Description
Nomenclature Used on Boring LogGroundwater Data:First encountered during drilling: 13-ft depthAfter : 14-ft depth (35.2-ft open boreholedepth)Field Drilling Data:Coordinates: Hand-held GPS UnitLogged By: R. ArizolaDriller: Tero DrillingEquipment: Truck-mounted drill rig
Single flight auger: 0 - 40 ft
Backfill: Cuttings
Water encountered during drilling
(continued)
Split Spoon (SS) Thin-walled tube (T)
Job No.: 2017-698
Project: Mitchell Lake WetlandSan Antonio, Texas
Delayed water reading
Sampling Date: 1/22/18
Arias Geoprofessionals
Boring Log No. B-10520
17-6
98.G
PJ
5/31
/18
(BO
RIN
G L
OG
SA
13-0
2,A
RIA
SS
A12
-01.
GD
T,L
IBR
AR
Y20
13-0
1.G
LB)
-200NPPPL LL PIWCSNDepth(ft)
5
10
15
20
25
30
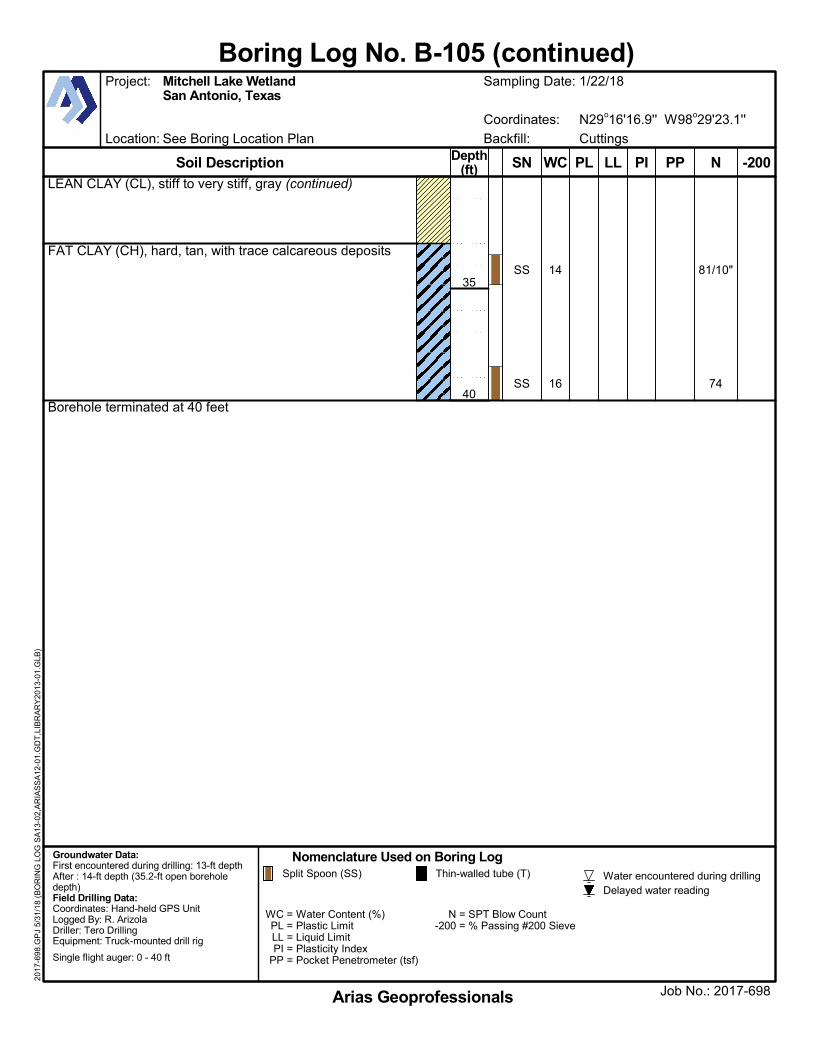
LEAN CLAY (CL), stiff to very stiff, gray (continued)
FAT CLAY (CH), hard, tan, with trace calcareous deposits
Borehole terminated at 40 feet
81/10"
74
14
16
SS
SS
Location: See Boring Location Plan
Coordinates: N29o16'16.9'' W98o29'23.1''
WC = Water Content (%)PL = Plastic LimitLL = Liquid LimitPI = Plasticity Index
PP = Pocket Penetrometer (tsf)
N = SPT Blow Count-200 = % Passing #200 Sieve
Soil Description
Nomenclature Used on Boring LogGroundwater Data:First encountered during drilling: 13-ft depthAfter : 14-ft depth (35.2-ft open boreholedepth)Field Drilling Data:Coordinates: Hand-held GPS UnitLogged By: R. ArizolaDriller: Tero DrillingEquipment: Truck-mounted drill rig
Single flight auger: 0 - 40 ft
Backfill: Cuttings
Water encountered during drillingSplit Spoon (SS) Thin-walled tube (T)
Job No.: 2017-698
Project: Mitchell Lake WetlandSan Antonio, Texas
Delayed water reading
Sampling Date: 1/22/18
Arias Geoprofessionals
Boring Log No. B-105 (continued)20
17-6
98.G
PJ
5/31
/18
(BO
RIN
G L
OG
SA
13-0
2,A
RIA
SS
A12
-01.
GD
T,L
IBR
AR
Y20
13-0
1.G
LB)
-200NPPPL LL PIWCSNDepth(ft)
35
40
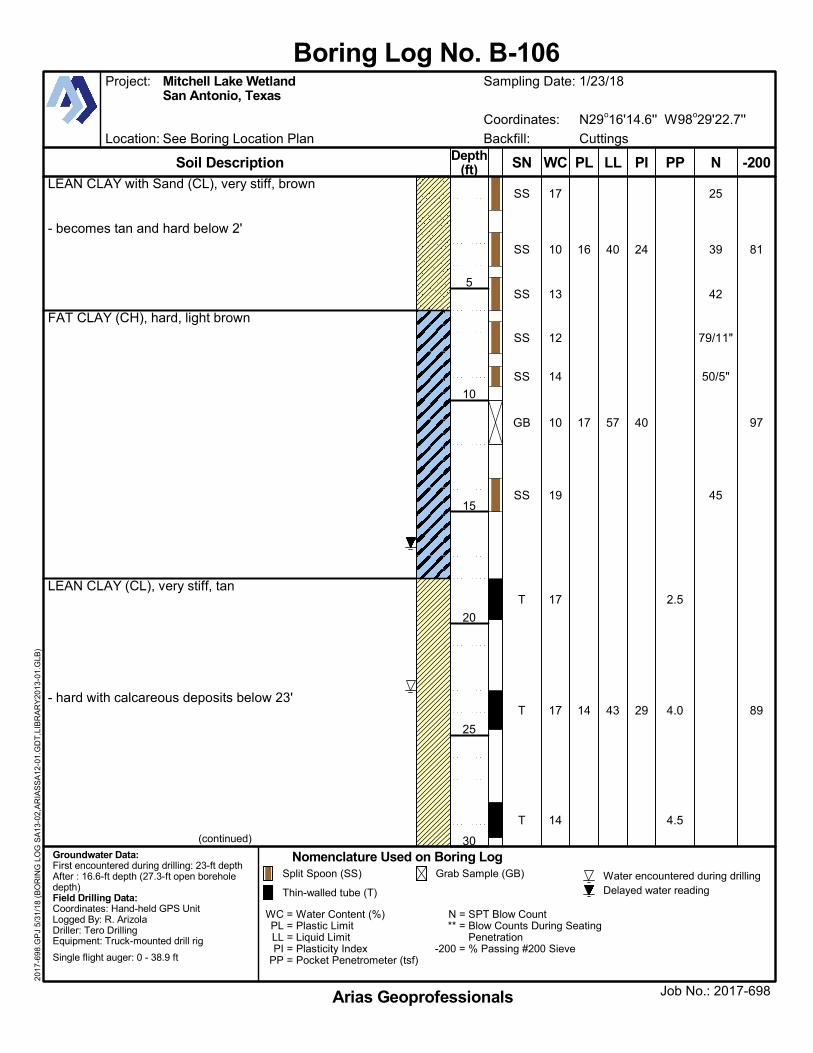
LEAN CLAY with Sand (CL), very stiff, brown
- becomes tan and hard below 2'
FAT CLAY (CH), hard, light brown
LEAN CLAY (CL), very stiff, tan
- hard with calcareous deposits below 23'
81
97
89
25
39
42
79/11"
50/5"
45
2.5
4.0
4.5
16
17
14
40
57
43
24
40
29
17
10
13
12
14
10
19
17
17
14
SS
SS
SS
SS
SS
GB
SS
T
T
T
Location: See Boring Location Plan
Coordinates: N29o16'14.6'' W98o29'22.7''
WC = Water Content (%)PL = Plastic LimitLL = Liquid LimitPI = Plasticity Index
PP = Pocket Penetrometer (tsf)
N = SPT Blow Count** = Blow Counts During Seating
Penetration-200 = % Passing #200 Sieve
Soil Description
Nomenclature Used on Boring LogGroundwater Data:First encountered during drilling: 23-ft depthAfter : 16.6-ft depth (27.3-ft open boreholedepth)Field Drilling Data:Coordinates: Hand-held GPS UnitLogged By: R. ArizolaDriller: Tero DrillingEquipment: Truck-mounted drill rig
Single flight auger: 0 - 38.9 ft
Backfill: Cuttings
Water encountered during drilling
(continued)
Split Spoon (SS) Grab Sample (GB)
Thin-walled tube (T)
Job No.: 2017-698
Project: Mitchell Lake WetlandSan Antonio, Texas
Delayed water reading
Sampling Date: 1/23/18
Arias Geoprofessionals
Boring Log No. B-10620
17-6
98.G
PJ
5/31
/18
(BO
RIN
G L
OG
SA
13-0
2,A
RIA
SS
A12
-01.
GD
T,L
IBR
AR
Y20
13-0
1.G
LB)
-200NPPPL LL PIWCSNDepth(ft)
5
10
15
20
25
30
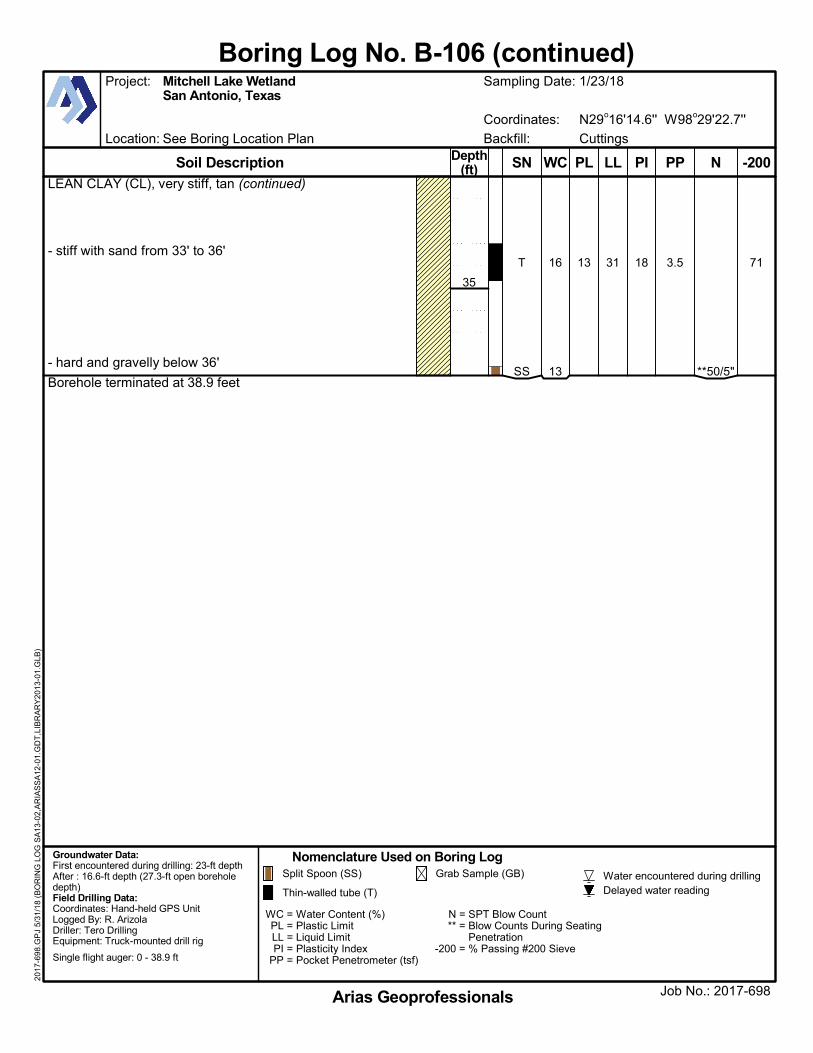
LEAN CLAY (CL), very stiff, tan (continued)
- stiff with sand from 33' to 36'
- hard and gravelly below 36'
Borehole terminated at 38.9 feet
71
**50/5"
3.513 31 1816
13
T
SS
Location: See Boring Location Plan
Coordinates: N29o16'14.6'' W98o29'22.7''
WC = Water Content (%)PL = Plastic LimitLL = Liquid LimitPI = Plasticity Index
PP = Pocket Penetrometer (tsf)
N = SPT Blow Count** = Blow Counts During Seating
Penetration-200 = % Passing #200 Sieve
Soil Description
Nomenclature Used on Boring LogGroundwater Data:First encountered during drilling: 23-ft depthAfter : 16.6-ft depth (27.3-ft open boreholedepth)Field Drilling Data:Coordinates: Hand-held GPS UnitLogged By: R. ArizolaDriller: Tero DrillingEquipment: Truck-mounted drill rig
Single flight auger: 0 - 38.9 ft
Backfill: Cuttings
Water encountered during drillingSplit Spoon (SS) Grab Sample (GB)
Thin-walled tube (T)
Job No.: 2017-698
Project: Mitchell Lake WetlandSan Antonio, Texas
Delayed water reading
Sampling Date: 1/23/18
Arias Geoprofessionals
Boring Log No. B-106 (continued)20
17-6
98.G
PJ
5/31
/18
(BO
RIN
G L
OG
SA
13-0
2,A
RIA
SS
A12
-01.
GD
T,L
IBR
AR
Y20
13-0
1.G
LB)
-200NPPPL LL PIWCSNDepth(ft)
35
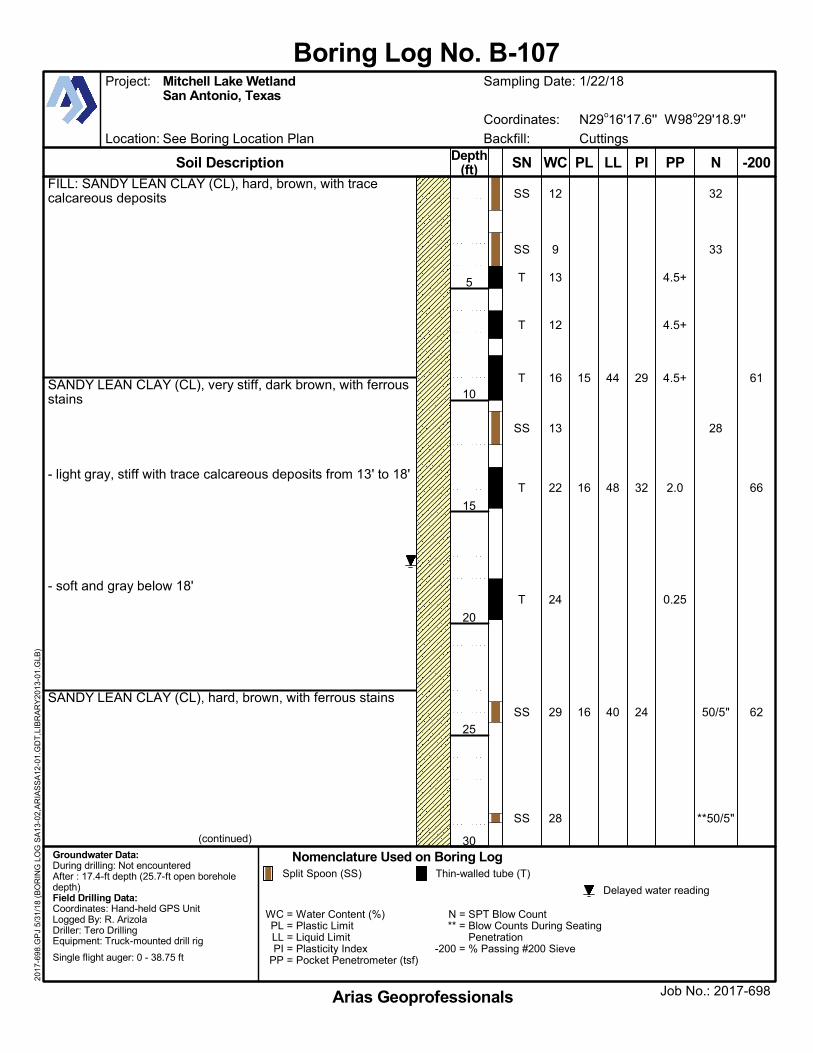
FILL: SANDY LEAN CLAY (CL), hard, brown, with tracecalcareous deposits
SANDY LEAN CLAY (CL), very stiff, dark brown, with ferrousstains
- light gray, stiff with trace calcareous deposits from 13' to 18'
- soft and gray below 18'
SANDY LEAN CLAY (CL), hard, brown, with ferrous stains
61
66
62
32
33
28
50/5"
**50/5"
4.5+
4.5+
4.5+
2.0
0.25
15
16
16
44
48
40
29
32
24
12
9
13
12
16
13
22
24
29
28
SS
SS
T
T
T
SS
T
T
SS
SS
Location: See Boring Location Plan
Coordinates: N29o16'17.6'' W98o29'18.9''
WC = Water Content (%)PL = Plastic LimitLL = Liquid LimitPI = Plasticity Index
PP = Pocket Penetrometer (tsf)
N = SPT Blow Count** = Blow Counts During Seating
Penetration-200 = % Passing #200 Sieve
Soil Description
Nomenclature Used on Boring LogGroundwater Data:During drilling: Not encounteredAfter : 17.4-ft depth (25.7-ft open boreholedepth)Field Drilling Data:Coordinates: Hand-held GPS UnitLogged By: R. ArizolaDriller: Tero DrillingEquipment: Truck-mounted drill rig
Single flight auger: 0 - 38.75 ft
Backfill: Cuttings
(continued)
Split Spoon (SS) Thin-walled tube (T)
Job No.: 2017-698
Project: Mitchell Lake WetlandSan Antonio, Texas
Delayed water reading
Sampling Date: 1/22/18
Arias Geoprofessionals
Boring Log No. B-10720
17-6
98.G
PJ
5/31
/18
(BO
RIN
G L
OG
SA
13-0
2,A
RIA
SS
A12
-01.
GD
T,L
IBR
AR
Y20
13-0
1.G
LB)
-200NPPPL LL PIWCSNDepth(ft)
5
10
15
20
25
30
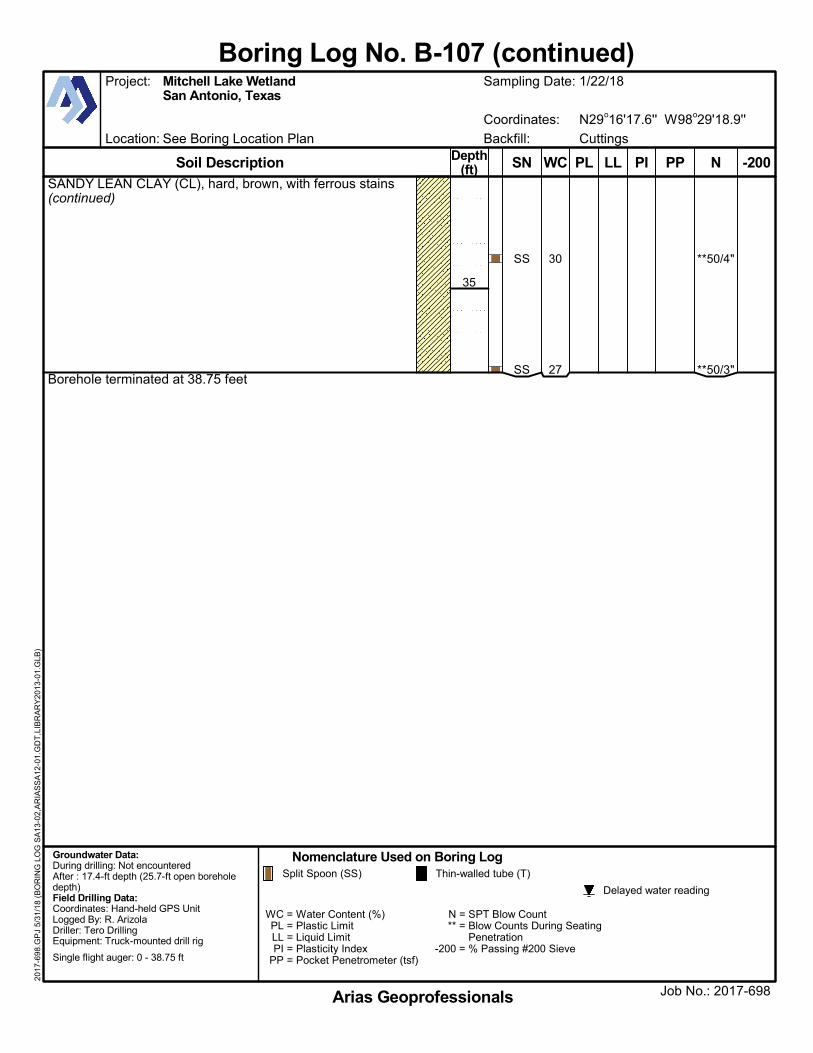
SANDY LEAN CLAY (CL), hard, brown, with ferrous stains(continued)
Borehole terminated at 38.75 feet
**50/4"
**50/3"
30
27
SS
SS
Location: See Boring Location Plan
Coordinates: N29o16'17.6'' W98o29'18.9''
WC = Water Content (%)PL = Plastic LimitLL = Liquid LimitPI = Plasticity Index
PP = Pocket Penetrometer (tsf)
N = SPT Blow Count** = Blow Counts During Seating
Penetration-200 = % Passing #200 Sieve
Soil Description
Nomenclature Used on Boring LogGroundwater Data:During drilling: Not encounteredAfter : 17.4-ft depth (25.7-ft open boreholedepth)Field Drilling Data:Coordinates: Hand-held GPS UnitLogged By: R. ArizolaDriller: Tero DrillingEquipment: Truck-mounted drill rig
Single flight auger: 0 - 38.75 ft
Backfill: Cuttings
Split Spoon (SS) Thin-walled tube (T)
Job No.: 2017-698
Project: Mitchell Lake WetlandSan Antonio, Texas
Delayed water reading
Sampling Date: 1/22/18
Arias Geoprofessionals
Boring Log No. B-107 (continued)20
17-6
98.G
PJ
5/31
/18
(BO
RIN
G L
OG
SA
13-0
2,A
RIA
SS
A12
-01.
GD
T,L
IBR
AR
Y20
13-0
1.G
LB)
-200NPPPL LL PIWCSNDepth(ft)
35
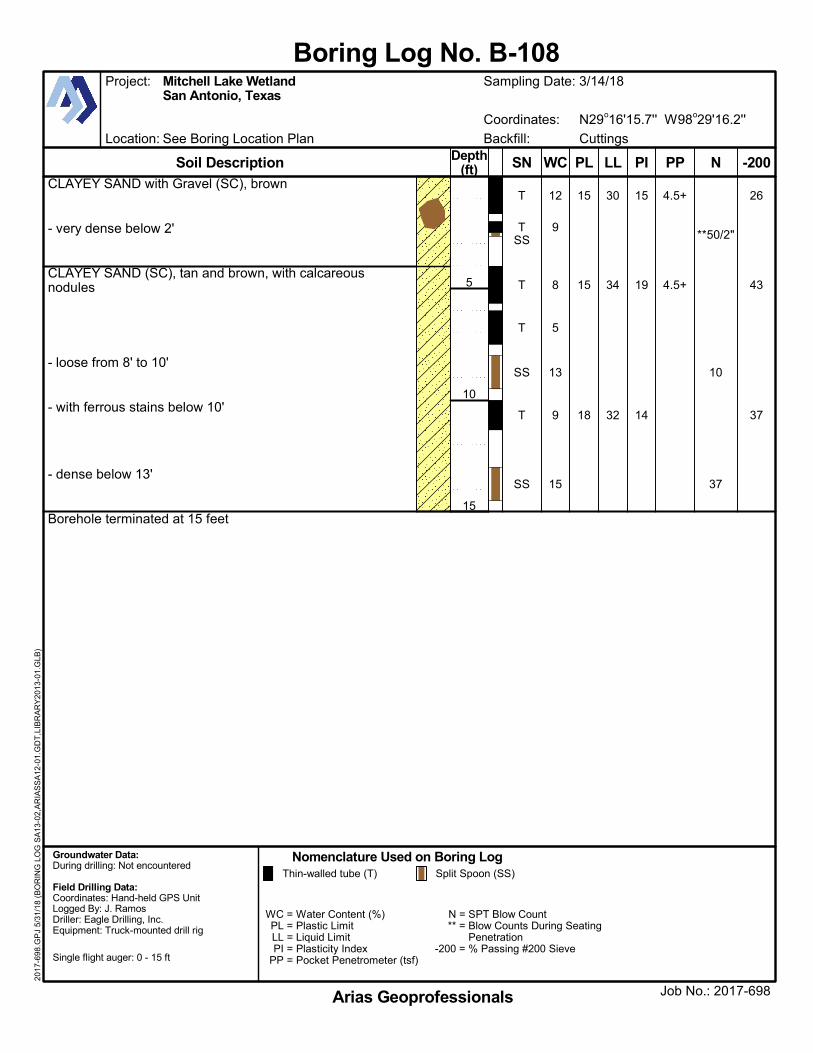
CLAYEY SAND with Gravel (SC), brown
- very dense below 2'
CLAYEY SAND (SC), tan and brown, with calcareousnodules
- loose from 8' to 10'
- with ferrous stains below 10'
- dense below 13'
Borehole terminated at 15 feet
26
43
37
**50/2"
10
37
4.5+
4.5+
15
15
18
30
34
32
15
19
14
12
9
8
5
13
9
15
T
TSS
T
T
SS
T
SS
Location: See Boring Location Plan
Coordinates: N29o16'15.7'' W98o29'16.2''
WC = Water Content (%)PL = Plastic LimitLL = Liquid LimitPI = Plasticity Index
PP = Pocket Penetrometer (tsf)
N = SPT Blow Count** = Blow Counts During Seating
Penetration-200 = % Passing #200 Sieve
Soil Description
Nomenclature Used on Boring LogGroundwater Data:During drilling: Not encountered
Field Drilling Data:Coordinates: Hand-held GPS UnitLogged By: J. RamosDriller: Eagle Drilling, Inc.Equipment: Truck-mounted drill rig
Single flight auger: 0 - 15 ft
Backfill: Cuttings
Thin-walled tube (T) Split Spoon (SS)
Job No.: 2017-698
Project: Mitchell Lake WetlandSan Antonio, Texas
Sampling Date: 3/14/18
Arias Geoprofessionals
Boring Log No. B-10820
17-6
98.G
PJ
5/31
/18
(BO
RIN
G L
OG
SA
13-0
2,A
RIA
SS
A12
-01.
GD
T,L
IBR
AR
Y20
13-0
1.G
LB)
-200NPPPL LL PIWCSNDepth(ft)
5
10
15
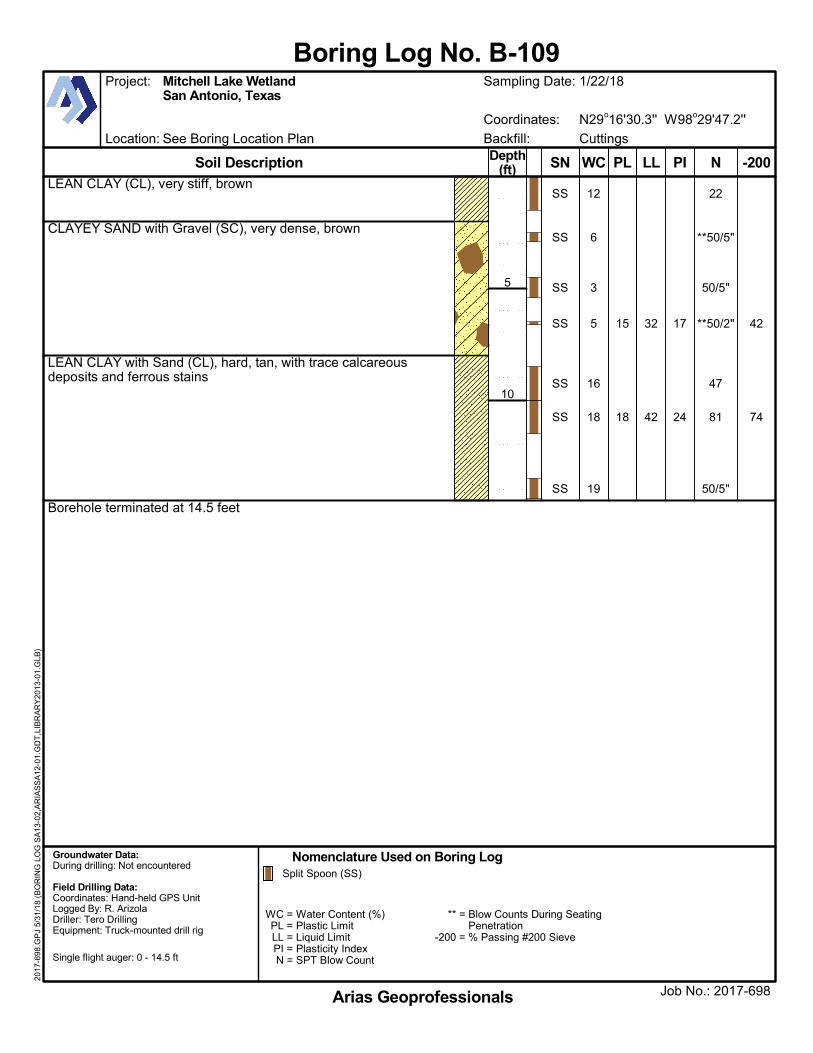
LEAN CLAY (CL), very stiff, brown
CLAYEY SAND with Gravel (SC), very dense, brown
LEAN CLAY with Sand (CL), hard, tan, with trace calcareousdeposits and ferrous stains
Borehole terminated at 14.5 feet
42
74
22
**50/5"
50/5"
**50/2"
47
81
50/5"
15
18
32
42
17
24
12
6
3
5
16
18
19
SS
SS
SS
SS
SS
SS
SS
Location: See Boring Location Plan
Coordinates: N29o16'30.3'' W98o29'47.2''
WC = Water Content (%)PL = Plastic LimitLL = Liquid LimitPI = Plasticity IndexN = SPT Blow Count
** = Blow Counts During SeatingPenetration
-200 = % Passing #200 Sieve
Soil Description
Nomenclature Used on Boring LogGroundwater Data:During drilling: Not encountered
Field Drilling Data:Coordinates: Hand-held GPS UnitLogged By: R. ArizolaDriller: Tero DrillingEquipment: Truck-mounted drill rig
Single flight auger: 0 - 14.5 ft
Backfill: Cuttings
Split Spoon (SS)
Job No.: 2017-698
Project: Mitchell Lake WetlandSan Antonio, Texas
Sampling Date: 1/22/18
Arias Geoprofessionals
Boring Log No. B-10920
17-6
98.G
PJ
5/31
/18
(BO
RIN
G L
OG
SA
13-0
2,A
RIA
SS
A12
-01.
GD
T,L
IBR
AR
Y20
13-0
1.G
LB)
-200NPL LL PIWCSNDepth(ft)
5
10
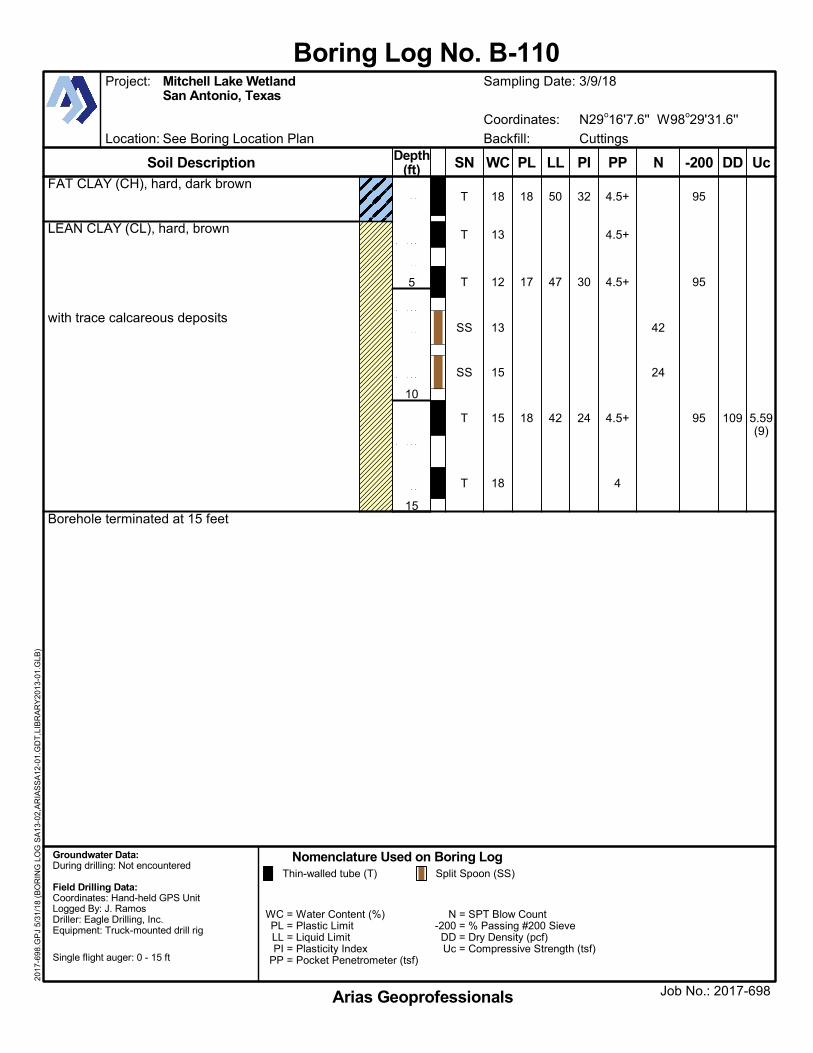
FAT CLAY (CH), hard, dark brown
LEAN CLAY (CL), hard, brown
with trace calcareous deposits
Borehole terminated at 15 feet
5.59(9)
109
95
95
95
42
24
4.5+
4.5+
4.5+
4.5+
4
18
17
18
50
47
42
32
30
24
18
13
12
13
15
15
18
T
T
T
SS
SS
T
T
Location: See Boring Location Plan
Coordinates: N29o16'7.6'' W98o29'31.6''
WC = Water Content (%)PL = Plastic LimitLL = Liquid LimitPI = Plasticity Index
PP = Pocket Penetrometer (tsf)
N = SPT Blow Count-200 = % Passing #200 SieveDD = Dry Density (pcf)Uc = Compressive Strength (tsf)
Soil Description
Nomenclature Used on Boring LogGroundwater Data:During drilling: Not encountered
Field Drilling Data:Coordinates: Hand-held GPS UnitLogged By: J. RamosDriller: Eagle Drilling, Inc.Equipment: Truck-mounted drill rig
Single flight auger: 0 - 15 ft
Backfill: Cuttings
Thin-walled tube (T) Split Spoon (SS)
Job No.: 2017-698
Project: Mitchell Lake WetlandSan Antonio, Texas
Sampling Date: 3/9/18
Arias Geoprofessionals
Boring Log No. B-11020
17-6
98.G
PJ
5/31
/18
(BO
RIN
G L
OG
SA
13-0
2,A
RIA
SS
A12
-01.
GD
T,L
IBR
AR
Y20
13-0
1.G
LB)
UcDD-200NPPPL LL PIWCSNDepth(ft)
5
10
15
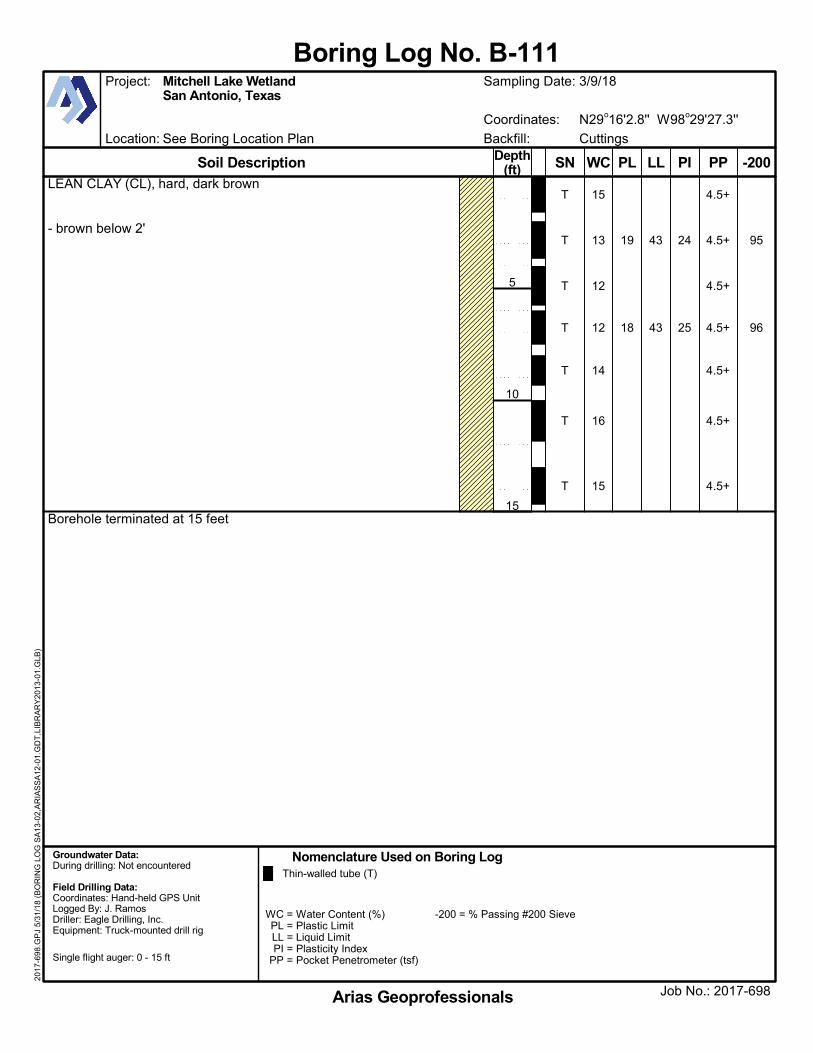
LEAN CLAY (CL), hard, dark brown
- brown below 2'
Borehole terminated at 15 feet
95
96
4.5+
4.5+
4.5+
4.5+
4.5+
4.5+
4.5+
19
18
43
43
24
25
15
13
12
12
14
16
15
T
T
T
T
T
T
T
Location: See Boring Location Plan
Coordinates: N29o16'2.8'' W98o29'27.3''
WC = Water Content (%)PL = Plastic LimitLL = Liquid LimitPI = Plasticity Index
PP = Pocket Penetrometer (tsf)
-200 = % Passing #200 Sieve
Soil Description
Nomenclature Used on Boring LogGroundwater Data:During drilling: Not encountered
Field Drilling Data:Coordinates: Hand-held GPS UnitLogged By: J. RamosDriller: Eagle Drilling, Inc.Equipment: Truck-mounted drill rig
Single flight auger: 0 - 15 ft
Backfill: Cuttings
Thin-walled tube (T)
Job No.: 2017-698
Project: Mitchell Lake WetlandSan Antonio, Texas
Sampling Date: 3/9/18
Arias Geoprofessionals
Boring Log No. B-11120
17-6
98.G
PJ
5/31
/18
(BO
RIN
G L
OG
SA
13-0
2,A
RIA
SS
A12
-01.
GD
T,L
IBR
AR
Y20
13-0
1.G
LB)
-200PPPL LL PIWCSNDepth(ft)
5
10
15
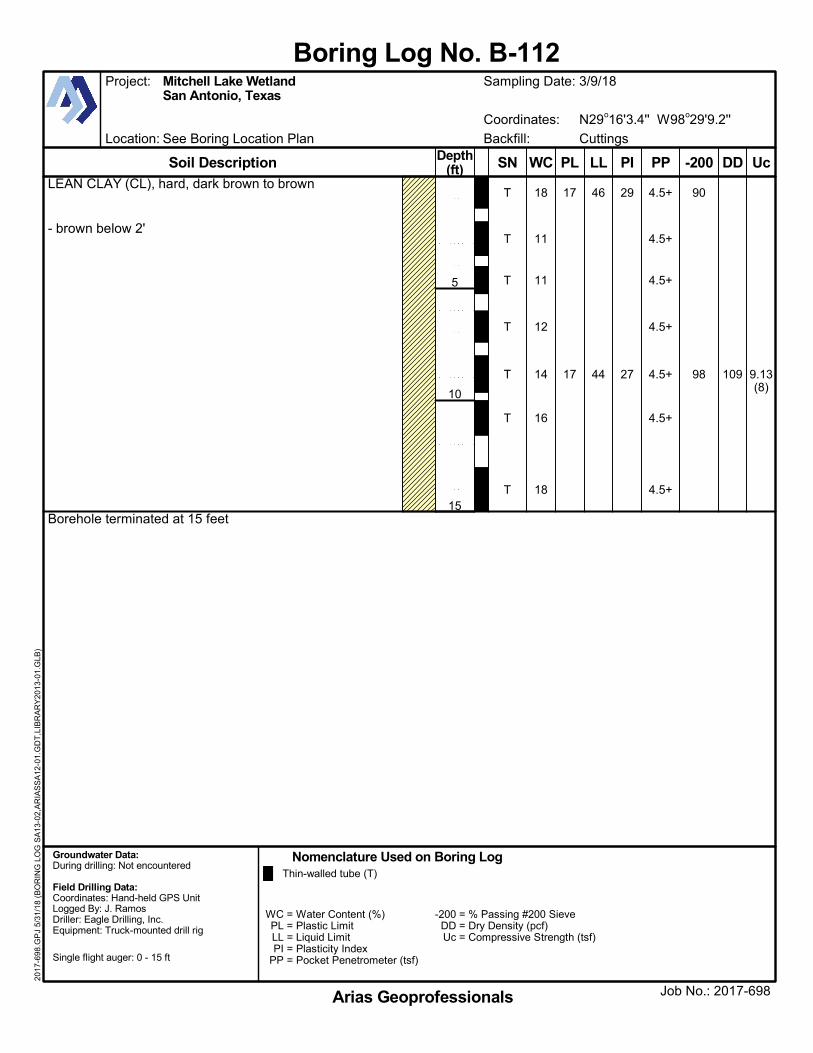
LEAN CLAY (CL), hard, dark brown to brown
- brown below 2'
Borehole terminated at 15 feet
9.13(8)
109
90
98
4.5+
4.5+
4.5+
4.5+
4.5+
4.5+
4.5+
17
17
46
44
29
27
18
11
11
12
14
16
18
T
T
T
T
T
T
T
Location: See Boring Location Plan
Coordinates: N29o16'3.4'' W98o29'9.2''
WC = Water Content (%)PL = Plastic LimitLL = Liquid LimitPI = Plasticity Index
PP = Pocket Penetrometer (tsf)
-200 = % Passing #200 SieveDD = Dry Density (pcf)Uc = Compressive Strength (tsf)
Soil Description
Nomenclature Used on Boring LogGroundwater Data:During drilling: Not encountered
Field Drilling Data:Coordinates: Hand-held GPS UnitLogged By: J. RamosDriller: Eagle Drilling, Inc.Equipment: Truck-mounted drill rig
Single flight auger: 0 - 15 ft
Backfill: Cuttings
Thin-walled tube (T)
Job No.: 2017-698
Project: Mitchell Lake WetlandSan Antonio, Texas
Sampling Date: 3/9/18
Arias Geoprofessionals
Boring Log No. B-11220
17-6
98.G
PJ
5/31
/18
(BO
RIN
G L
OG
SA
13-0
2,A
RIA
SS
A12
-01.
GD
T,L
IBR
AR
Y20
13-0
1.G
LB)
UcDD-200PPPL LL PIWCSNDepth(ft)
5
10
15
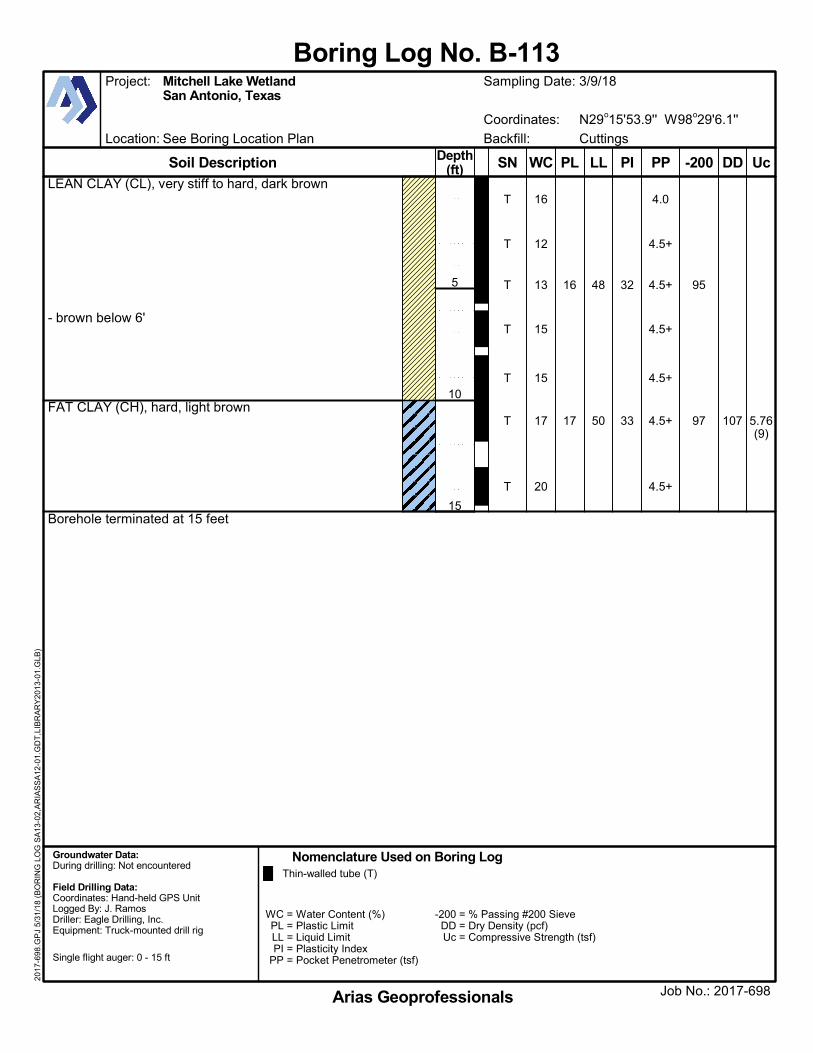
LEAN CLAY (CL), very stiff to hard, dark brown
- brown below 6'
FAT CLAY (CH), hard, light brown
Borehole terminated at 15 feet
5.76(9)
107
95
97
4.0
4.5+
4.5+
4.5+
4.5+
4.5+
4.5+
16
17
48
50
32
33
16
12
13
15
15
17
20
T
T
T
T
T
T
T
Location: See Boring Location Plan
Coordinates: N29o15'53.9'' W98o29'6.1''
WC = Water Content (%)PL = Plastic LimitLL = Liquid LimitPI = Plasticity Index
PP = Pocket Penetrometer (tsf)
-200 = % Passing #200 SieveDD = Dry Density (pcf)Uc = Compressive Strength (tsf)
Soil Description
Nomenclature Used on Boring LogGroundwater Data:During drilling: Not encountered
Field Drilling Data:Coordinates: Hand-held GPS UnitLogged By: J. RamosDriller: Eagle Drilling, Inc.Equipment: Truck-mounted drill rig
Single flight auger: 0 - 15 ft
Backfill: Cuttings
Thin-walled tube (T)
Job No.: 2017-698
Project: Mitchell Lake WetlandSan Antonio, Texas
Sampling Date: 3/9/18
Arias Geoprofessionals
Boring Log No. B-11320
17-6
98.G
PJ
5/31
/18
(BO
RIN
G L
OG
SA
13-0
2,A
RIA
SS
A12
-01.
GD
T,L
IBR
AR
Y20
13-0
1.G
LB)
UcDD-200PPPL LL PIWCSNDepth(ft)
5
10
15
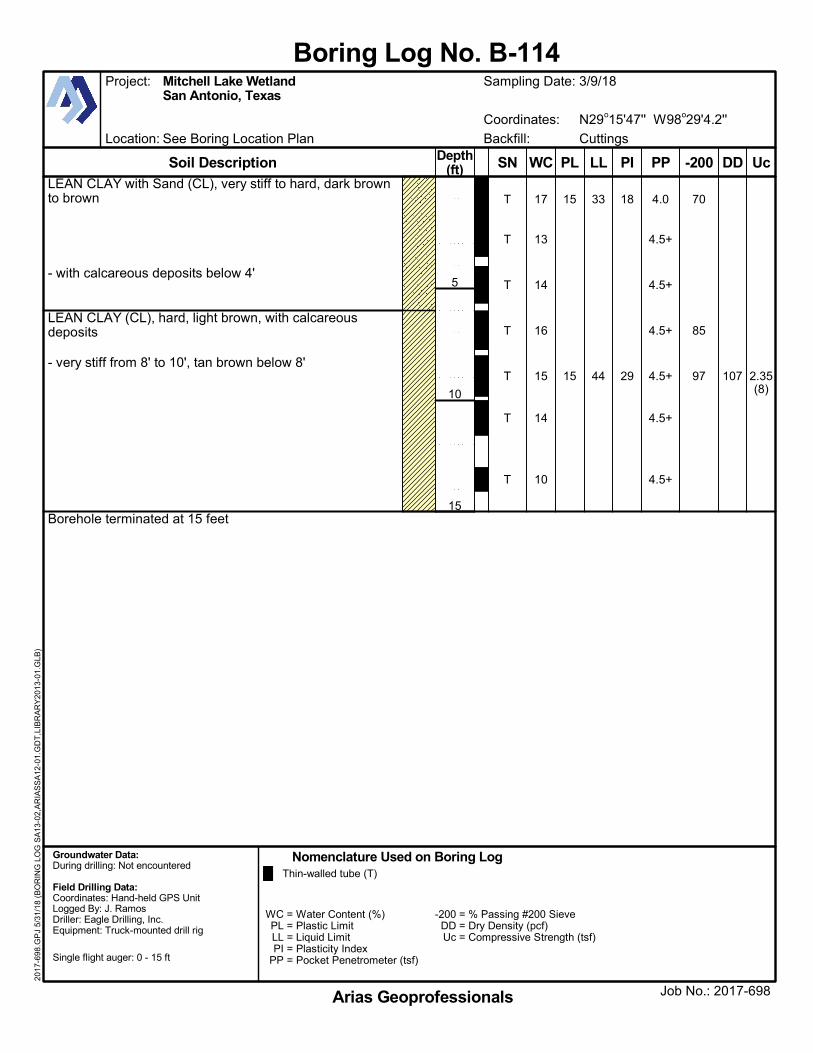
LEAN CLAY with Sand (CL), very stiff to hard, dark brownto brown
- with calcareous deposits below 4'
LEAN CLAY (CL), hard, light brown, with calcareousdeposits
- very stiff from 8' to 10', tan brown below 8'
Borehole terminated at 15 feet
2.35(8)
107
70
85
97
4.0
4.5+
4.5+
4.5+
4.5+
4.5+
4.5+
15
15
33
44
18
29
17
13
14
16
15
14
10
T
T
T
T
T
T
T
Location: See Boring Location Plan
Coordinates: N29o15'47'' W98o29'4.2''
WC = Water Content (%)PL = Plastic LimitLL = Liquid LimitPI = Plasticity Index
PP = Pocket Penetrometer (tsf)
-200 = % Passing #200 SieveDD = Dry Density (pcf)Uc = Compressive Strength (tsf)
Soil Description
Nomenclature Used on Boring LogGroundwater Data:During drilling: Not encountered
Field Drilling Data:Coordinates: Hand-held GPS UnitLogged By: J. RamosDriller: Eagle Drilling, Inc.Equipment: Truck-mounted drill rig
Single flight auger: 0 - 15 ft
Backfill: Cuttings
Thin-walled tube (T)
Job No.: 2017-698
Project: Mitchell Lake WetlandSan Antonio, Texas
Sampling Date: 3/9/18
Arias Geoprofessionals
Boring Log No. B-11420
17-6
98.G
PJ
5/31
/18
(BO
RIN
G L
OG
SA
13-0
2,A
RIA
SS
A12
-01.
GD
T,L
IBR
AR
Y20
13-0
1.G
LB)
UcDD-200PPPL LL PIWCSNDepth(ft)
5
10
15
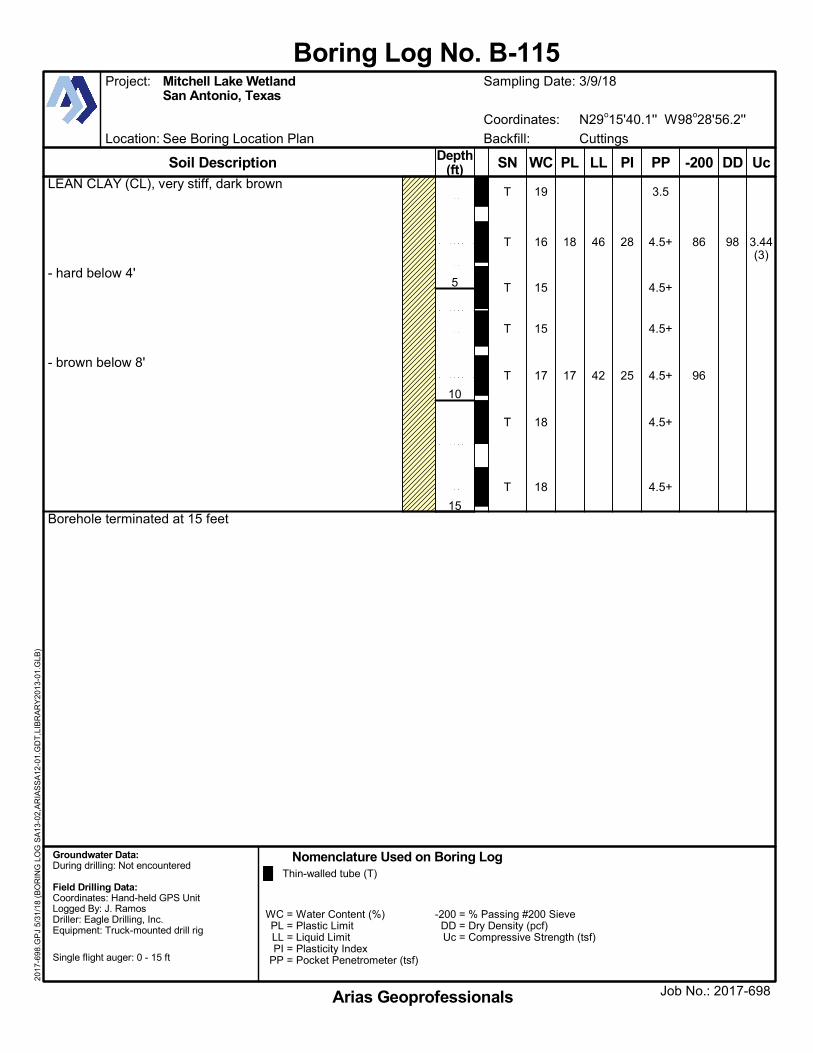
LEAN CLAY (CL), very stiff, dark brown
- hard below 4'
- brown below 8'
Borehole terminated at 15 feet
3.44(3)
9886
96
3.5
4.5+
4.5+
4.5+
4.5+
4.5+
4.5+
18
17
46
42
28
25
19
16
15
15
17
18
18
T
T
T
T
T
T
T
Location: See Boring Location Plan
Coordinates: N29o15'40.1'' W98o28'56.2''
WC = Water Content (%)PL = Plastic LimitLL = Liquid LimitPI = Plasticity Index
PP = Pocket Penetrometer (tsf)
-200 = % Passing #200 SieveDD = Dry Density (pcf)Uc = Compressive Strength (tsf)
Soil Description
Nomenclature Used on Boring LogGroundwater Data:During drilling: Not encountered
Field Drilling Data:Coordinates: Hand-held GPS UnitLogged By: J. RamosDriller: Eagle Drilling, Inc.Equipment: Truck-mounted drill rig
Single flight auger: 0 - 15 ft
Backfill: Cuttings
Thin-walled tube (T)
Job No.: 2017-698
Project: Mitchell Lake WetlandSan Antonio, Texas
Sampling Date: 3/9/18
Arias Geoprofessionals
Boring Log No. B-11520
17-6
98.G
PJ
5/31
/18
(BO
RIN
G L
OG
SA
13-0
2,A
RIA
SS
A12
-01.
GD
T,L
IBR
AR
Y20
13-0
1.G
LB)
UcDD-200PPPL LL PIWCSNDepth(ft)
5
10
15
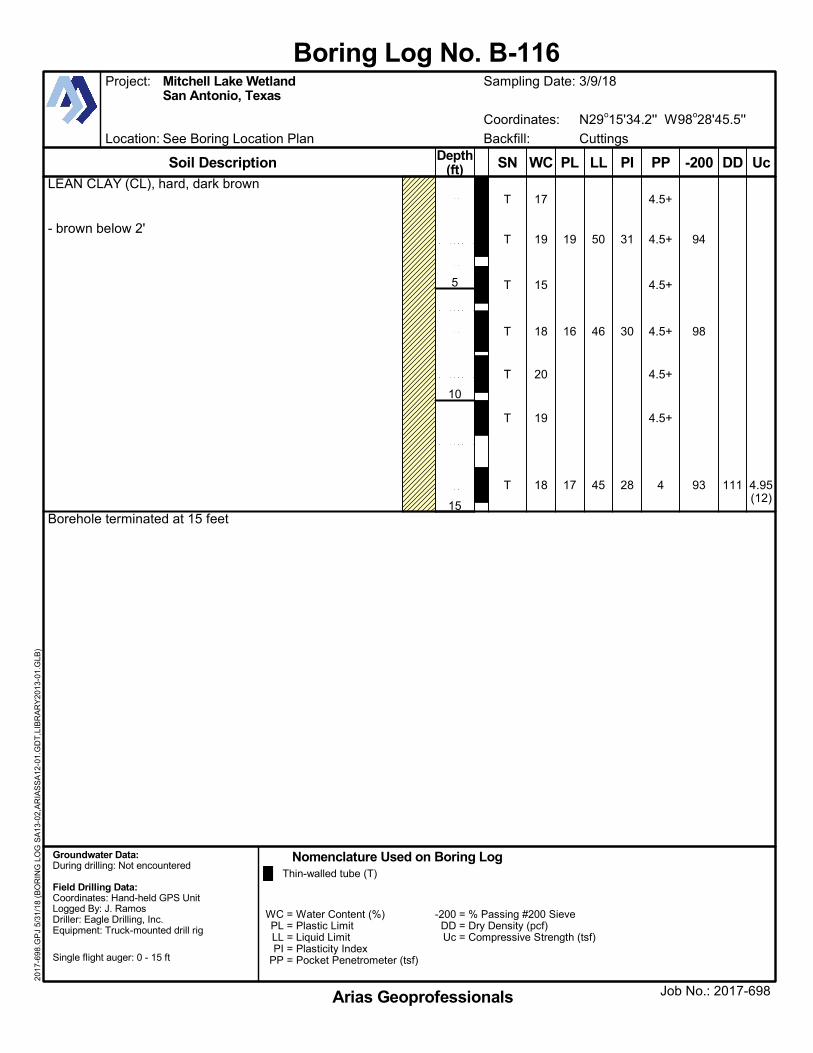
LEAN CLAY (CL), hard, dark brown
- brown below 2'
Borehole terminated at 15 feet
4.95(12)
111
94
98
93
4.5+
4.5+
4.5+
4.5+
4.5+
4.5+
4
19
16
17
50
46
45
31
30
28
17
19
15
18
20
19
18
T
T
T
T
T
T
T
Location: See Boring Location Plan
Coordinates: N29o15'34.2'' W98o28'45.5''
WC = Water Content (%)PL = Plastic LimitLL = Liquid LimitPI = Plasticity Index
PP = Pocket Penetrometer (tsf)
-200 = % Passing #200 SieveDD = Dry Density (pcf)Uc = Compressive Strength (tsf)
Soil Description
Nomenclature Used on Boring LogGroundwater Data:During drilling: Not encountered
Field Drilling Data:Coordinates: Hand-held GPS UnitLogged By: J. RamosDriller: Eagle Drilling, Inc.Equipment: Truck-mounted drill rig
Single flight auger: 0 - 15 ft
Backfill: Cuttings
Thin-walled tube (T)
Job No.: 2017-698
Project: Mitchell Lake WetlandSan Antonio, Texas
Sampling Date: 3/9/18
Arias Geoprofessionals
Boring Log No. B-11620
17-6
98.G
PJ
5/31
/18
(BO
RIN
G L
OG
SA
13-0
2,A
RIA
SS
A12
-01.
GD
T,L
IBR
AR
Y20
13-0
1.G
LB)
UcDD-200PPPL LL PIWCSNDepth(ft)
5
10
15
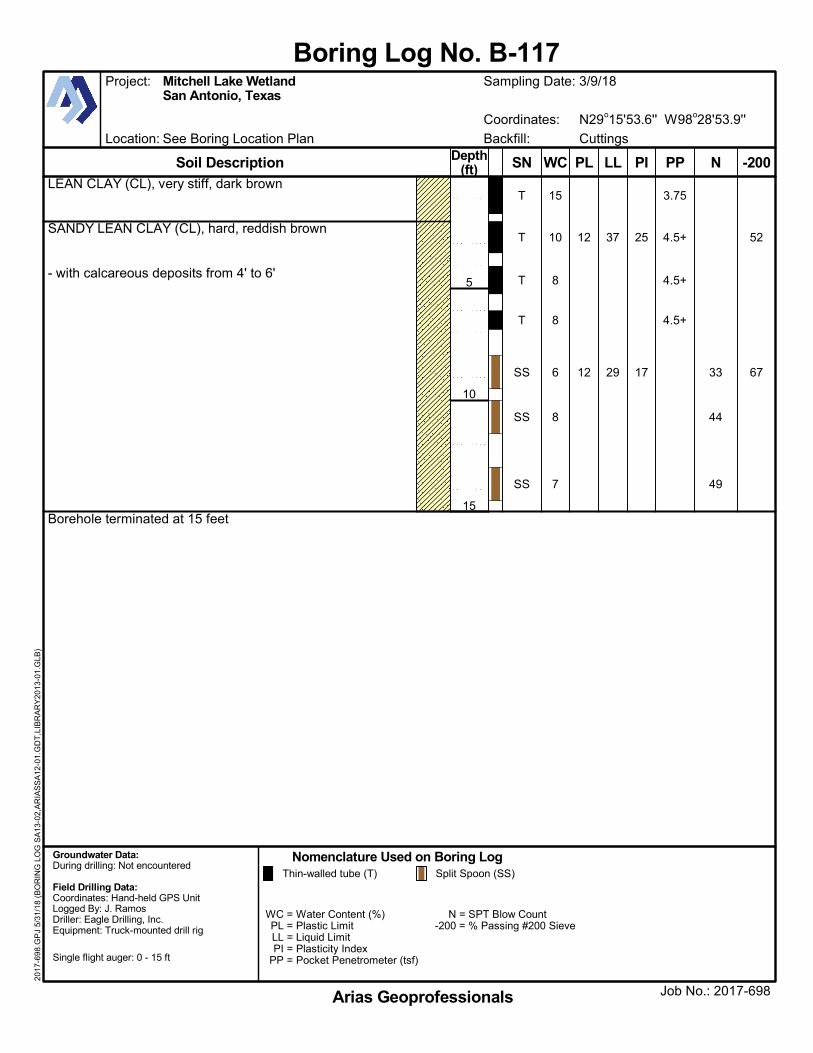
LEAN CLAY (CL), very stiff, dark brown
SANDY LEAN CLAY (CL), hard, reddish brown
- with calcareous deposits from 4' to 6'
Borehole terminated at 15 feet
52
6733
44
49
3.75
4.5+
4.5+
4.5+
12
12
37
29
25
17
15
10
8
8
6
8
7
T
T
T
T
SS
SS
SS
Location: See Boring Location Plan
Coordinates: N29o15'53.6'' W98o28'53.9''
WC = Water Content (%)PL = Plastic LimitLL = Liquid LimitPI = Plasticity Index
PP = Pocket Penetrometer (tsf)
N = SPT Blow Count-200 = % Passing #200 Sieve
Soil Description
Nomenclature Used on Boring LogGroundwater Data:During drilling: Not encountered
Field Drilling Data:Coordinates: Hand-held GPS UnitLogged By: J. RamosDriller: Eagle Drilling, Inc.Equipment: Truck-mounted drill rig
Single flight auger: 0 - 15 ft
Backfill: Cuttings
Thin-walled tube (T) Split Spoon (SS)
Job No.: 2017-698
Project: Mitchell Lake WetlandSan Antonio, Texas
Sampling Date: 3/9/18
Arias Geoprofessionals
Boring Log No. B-11720
17-6
98.G
PJ
5/31
/18
(BO
RIN
G L
OG
SA
13-0
2,A
RIA
SS
A12
-01.
GD
T,L
IBR
AR
Y20
13-0
1.G
LB)
-200NPPPL LL PIWCSNDepth(ft)
5
10
15
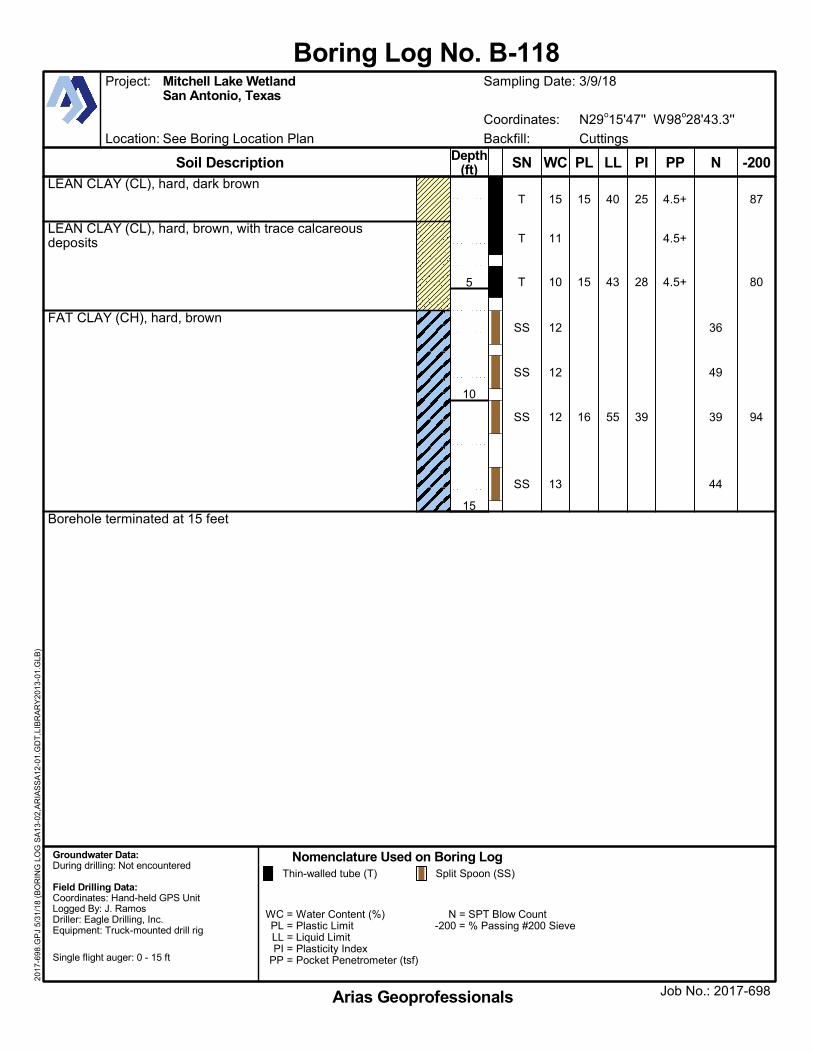
LEAN CLAY (CL), hard, dark brown
LEAN CLAY (CL), hard, brown, with trace calcareousdeposits
FAT CLAY (CH), hard, brown
Borehole terminated at 15 feet
87
80
94
36
49
39
44
4.5+
4.5+
4.5+
15
15
16
40
43
55
25
28
39
15
11
10
12
12
12
13
T
T
T
SS
SS
SS
SS
Location: See Boring Location Plan
Coordinates: N29o15'47'' W98o28'43.3''
WC = Water Content (%)PL = Plastic LimitLL = Liquid LimitPI = Plasticity Index
PP = Pocket Penetrometer (tsf)
N = SPT Blow Count-200 = % Passing #200 Sieve
Soil Description
Nomenclature Used on Boring LogGroundwater Data:During drilling: Not encountered
Field Drilling Data:Coordinates: Hand-held GPS UnitLogged By: J. RamosDriller: Eagle Drilling, Inc.Equipment: Truck-mounted drill rig
Single flight auger: 0 - 15 ft
Backfill: Cuttings
Thin-walled tube (T) Split Spoon (SS)
Job No.: 2017-698
Project: Mitchell Lake WetlandSan Antonio, Texas
Sampling Date: 3/9/18
Arias Geoprofessionals
Boring Log No. B-11820
17-6
98.G
PJ
5/31
/18
(BO
RIN
G L
OG
SA
13-0
2,A
RIA
SS
A12
-01.
GD
T,L
IBR
AR
Y20
13-0
1.G
LB)
-200NPPPL LL PIWCSNDepth(ft)
5
10
15

LEAN CLAY with Sand (CL), hard, dark brown
- brown below 2'
LEAN CLAY (CL), hard, brown
Borehole terminated at 15 feet
12.13(3)
12082
98
4.5+
4.5+
4.5+
4.5+
4.5+
4.5+
4.5+
21
21
47
49
26
28
19
14
12
13
15
15
14
T
T
T
T
T
T
T
Location: See Boring Location Plan
Coordinates: N29o15'41.7'' W98o28'36.3''
WC = Water Content (%)PL = Plastic LimitLL = Liquid LimitPI = Plasticity Index
PP = Pocket Penetrometer (tsf)
-200 = % Passing #200 SieveDD = Dry Density (pcf)Uc = Compressive Strength (tsf)
Soil Description
Nomenclature Used on Boring LogGroundwater Data:During drilling: Not encountered
Field Drilling Data:Coordinates: Hand-held GPS UnitLogged By: J. RamosDriller: Eagle Drilling, Inc.Equipment: Truck-mounted drill rig
Single flight auger: 0 - 15 ft
Backfill: Cuttings
Thin-walled tube (T)
Job No.: 2017-698
Project: Mitchell Lake WetlandSan Antonio, Texas
Sampling Date: 3/14/18
Arias Geoprofessionals
Boring Log No. B-11920
17-6
98.G
PJ
5/31
/18
(BO
RIN
G L
OG
SA
13-0
2,A
RIA
SS
A12
-01.
GD
T,L
IBR
AR
Y20
13-0
1.G
LB)
UcDD-200PPPL LL PIWCSNDepth(ft)
5
10
15
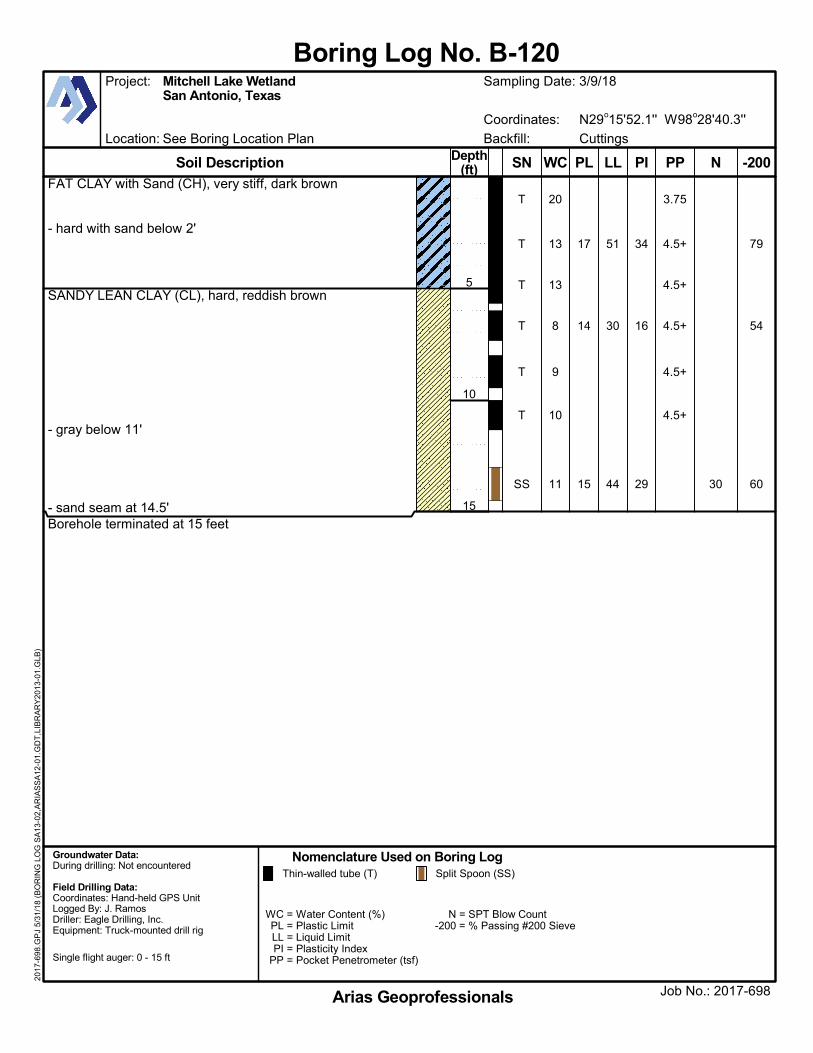
FAT CLAY with Sand (CH), very stiff, dark brown
- hard with sand below 2'
SANDY LEAN CLAY (CL), hard, reddish brown
- gray below 11'
- sand seam at 14.5'Borehole terminated at 15 feet
79
54
6030
3.75
4.5+
4.5+
4.5+
4.5+
4.5+
17
14
15
51
30
44
34
16
29
20
13
13
8
9
10
11
T
T
T
T
T
T
SS
Location: See Boring Location Plan
Coordinates: N29o15'52.1'' W98o28'40.3''
WC = Water Content (%)PL = Plastic LimitLL = Liquid LimitPI = Plasticity Index
PP = Pocket Penetrometer (tsf)
N = SPT Blow Count-200 = % Passing #200 Sieve
Soil Description
Nomenclature Used on Boring LogGroundwater Data:During drilling: Not encountered
Field Drilling Data:Coordinates: Hand-held GPS UnitLogged By: J. RamosDriller: Eagle Drilling, Inc.Equipment: Truck-mounted drill rig
Single flight auger: 0 - 15 ft
Backfill: Cuttings
Thin-walled tube (T) Split Spoon (SS)
Job No.: 2017-698
Project: Mitchell Lake WetlandSan Antonio, Texas
Sampling Date: 3/9/18
Arias Geoprofessionals
Boring Log No. B-12020
17-6
98.G
PJ
5/31
/18
(BO
RIN
G L
OG
SA
13-0
2,A
RIA
SS
A12
-01.
GD
T,L
IBR
AR
Y20
13-0
1.G
LB)
-200NPPPL LL PIWCSNDepth(ft)
5
10
15
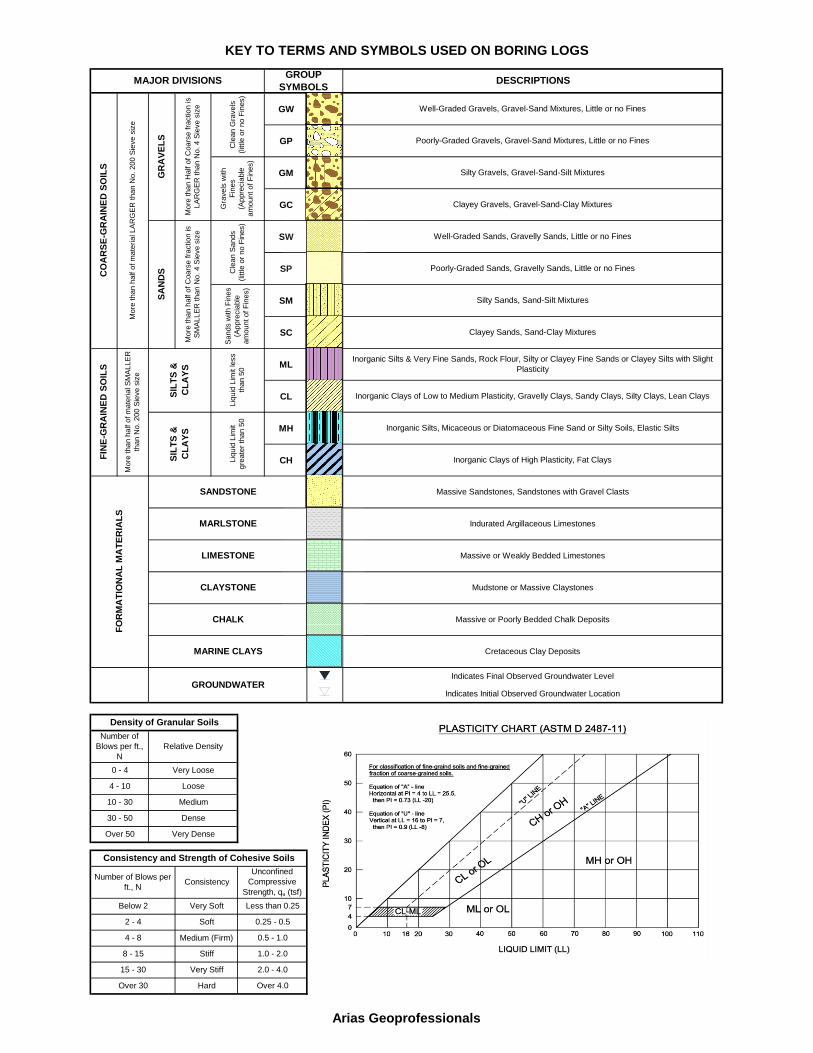
GW
GP
GM
GC
SW
SP
SM
SC
ML
CL
MH
CH
Massive or Weakly Bedded Limestones
More
than h
alf o
f m
ate
rial S
MA
LLE
R
than N
o. 200 S
ieve s
ize
FO
RM
AT
ION
AL
MA
TE
RIA
LS
GROUP
SYMBOLS
KEY TO TERMS AND SYMBOLS USED ON BORING LOGS
CO
AR
SE
-GR
AIN
ED
SO
ILS
GR
AV
EL
SS
AN
DS
More
than H
alf o
f C
oars
e fra
ction is
LA
RG
ER
than N
o. 4 S
ieve s
ize
More
than h
alf o
f m
ate
rial LA
RG
ER
than N
o. 200 S
ieve s
ize
MAJOR DIVISIONS
Silty Gravels, Gravel-Sand-Silt Mixtures
Poorly-Graded Gravels, Gravel-Sand Mixtures, Little or no Fines
Well-Graded Gravels, Gravel-Sand Mixtures, Little or no Fines
DESCRIPTIONS
Clayey Sands, Sand-Clay Mixtures
Silty Sands, Sand-Silt Mixtures
Poorly-Graded Sands, Gravelly Sands, Little or no Fines
Well-Graded Sands, Gravelly Sands, Little or no FinesC
lean G
ravels
(little o
r no F
ines)
Gra
vels
with
Fin
es
(Appre
cia
ble
am
ount of F
ines)
Cle
an S
ands
(little o
r no F
ines)
Sands w
ith F
ines
(Appre
cia
ble
am
ount of F
ines)
Liq
uid
Lim
it less
than 5
0
Liq
uid
Lim
it
gre
ate
r th
an 5
0
LIMESTONE
MARLSTONE
SANDSTONE
Clayey Gravels, Gravel-Sand-Clay Mixtures
Massive Sandstones, Sandstones with Gravel Clasts
Inorganic Clays of High Plasticity, Fat Clays
Inorganic Silts, Micaceous or Diatomaceous Fine Sand or Silty Soils, Elastic Silts
Inorganic Clays of Low to Medium Plasticity, Gravelly Clays, Sandy Clays, Silty Clays, Lean Clays
Inorganic Silts & Very Fine Sands, Rock Flour, Silty or Clayey Fine Sands or Clayey Silts with Slight
Plasticity
Indurated Argillaceous Limestones
Indicates Final Observed Groundwater Level
Indicates Initial Observed Groundwater Location
Cretaceous Clay Deposits
Massive or Poorly Bedded Chalk Deposits
Mudstone or Massive Claystones
FIN
E-G
RA
INE
D S
OIL
S
More
than h
alf o
f C
oars
e fra
ction is
SM
ALLE
R than N
o. 4 S
ieve s
ize
SIL
TS
&
CL
AY
S
SIL
TS
&
CL
AY
S
GROUNDWATER
MARINE CLAYS
CHALK
CLAYSTONE
Very Dense
30 - 50
Over 50
10 - 30
Consistency and Strength of Cohesive Soils
Number of Blows per
ft., N
Unconfined
Compressive
Strength, qᵤ (tsf)
Consistency
Density of Granular Soils
Relative Density
Very Loose
Number of
Blows per ft.,
N
0 - 4
4 - 10 Loose
Medium
Dense
Below 2
2 - 4 Soft
Very Soft
Stiff
Less than 0.25
0.25 - 0.5
0.5 - 1.0
1.0 - 2.0
Medium (Firm)
Very Stiff
Hard
4 - 8
8 - 15
15 - 30
Over 30 Over 4.0
2.0 - 4.0
Arias Geoprofessionals
Group
SymbolGW
(Less than 5% finesC
)
Cu < 4 and/or GP
[Cc < or Cc > 3]D
Gravels with Fines GM
(More than 12% finesC
)
GC
Sands Clean Sands SW
(Less than 5% finesH
) Cu < 6 and/or SP
[Cc < or Cc > 3]D
Sands with Fines SM
(More than 12% finesH
)
SC
Silts and Clays inorganic CL
ML
organic OL
Silts and Clays inorganic CH
MH
organic OH
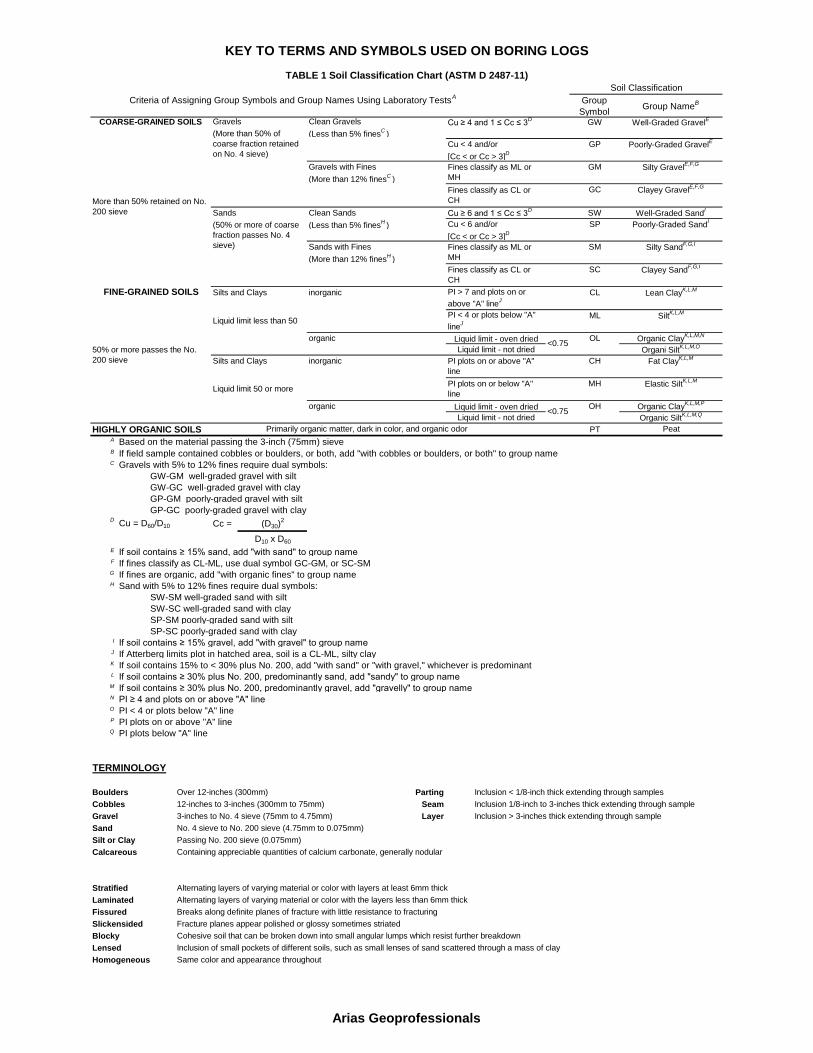
HIGHLY ORGANIC SOILS PTA Based on the material passing the 3-inch (75mm) sieveB If field sample contained cobbles or boulders, or both, add "with cobbles or boulders, or both" to group name
C Gravels with 5% to 12% fines require dual symbols:
GW-GM well-graded gravel with silt
GW-GC well-graded gravel with clay
GP-GM poorly-graded gravel with silt
GP-GC poorly-graded gravel with clayD
Cu = D60/D10 Cc =
E If soil contains ≥ 15% sand, add "with sand" to group nameF If fines classify as CL-ML, use dual symbol GC-GM, or SC-SMG If fines are organic, add "with organic fines" to group nameH Sand with 5% to 12% fines require dual symbols:
SW-SM well-graded sand with silt
SW-SC well-graded sand with clay
SP-SM poorly-graded sand with silt
SP-SC poorly-graded sand with clayI If soil contains ≥ 15% gravel, add "with gravel" to group nameJ If Atterberg limits plot in hatched area, soil is a CL-ML, silty clayK If soil contains 15% to < 30% plus No. 200, add "with sand" or "with gravel," whichever is predominantL If soil contains ≥ 30% plus No. 200, predominantly sand, add "sandy" to group nameM If soil contains ≥ 30% plus No. 200, predominantly gravel, add "gravelly" to group nameN PI ≥ 4 and plots on or above "A" lineO PI < 4 or plots below "A" lineP PI plots on or above "A" lineQ PI plots below "A" line
TERMINOLOGY
Boulders Over 12-inches (300mm) Parting Inclusion < 1/8-inch thick extending through samples
Cobbles 12-inches to 3-inches (300mm to 75mm) Seam Inclusion 1/8-inch to 3-inches thick extending through sample
Gravel 3-inches to No. 4 sieve (75mm to 4.75mm) Layer Inclusion > 3-inches thick extending through sample
Sand No. 4 sieve to No. 200 sieve (4.75mm to 0.075mm)
Silt or Clay Passing No. 200 sieve (0.075mm)
Calcareous Containing appreciable quantities of calcium carbonate, generally nodular
Stratified Alternating layers of varying material or color with layers at least 6mm thick
Laminated Alternating layers of varying material or color with the layers less than 6mm thick
Fissured Breaks along definite planes of fracture with little resistance to fracturing
Slickensided Fracture planes appear polished or glossy sometimes striated
Blocky Cohesive soil that can be broken down into small angular lumps which resist further breakdown
Lensed Inclusion of small pockets of different soils, such as small lenses of sand scattered through a mass of clay
Homogeneous Same color and appearance throughout
(D30)2
D10 x D60
KEY TO TERMS AND SYMBOLS USED ON BORING LOGS
TABLE 1 Soil Classification Chart (ASTM D 2487-11)
Group NameB
Organic ClayK,L,M,N
Organi SiltK,L,M,O
Fat ClayK,L,M
Clayey GravelE,F,G
Well-Graded SandI
Poorly-Graded SandI
Silty SandF,G,I
Clayey SandF,G,I
Well-Graded GravelE
Poorly-Graded GravelE
Silty GravelE,F,G
Soil Classification
Criteria of Assigning Group Symbols and Group Names Using Laboratory TestsA
More than 50% retained on No.
200 sieve
FINE-GRAINED SOILS
COARSE-GRAINED SOILS
Primarily organic matter, dark in color, and organic odor
Liquid limit less than 50
Liquid limit 50 or more
PI > 7 and plots on or
above "A" lineJ
PI < 4 or plots below "A"
lineJ
PI plots on or above "A"
line
PI plots on or below "A"
line
Fines classify as CL or
CH
(50% or more of coarse
fraction passes No. 4
sieve)
50% or more passes the No.
200 sieve
Cu ≥ 4 and 1 ≤ Cc ≤ 3DGravels Clean Gravels
Elastic SiltK,L,M
Organic ClayK,L,M,P
Organic SiltK,L,M,Q
Peat
Lean ClayK,L,M
SiltK,L,M
Fines classify as CL or
CH
Cu ≥ 6 and 1 ≤ Cc ≤ 3D
Fines classify as ML or
MH
(More than 50% of
coarse fraction retained
on No. 4 sieve)
Fines classify as ML or
MH
<0.75
<0.75
Liquid limit - oven dried
Liquid limit - not dried
Liquid limit - oven dried
Liquid limit - not dried
Arias Geoprofessionals
Excellent
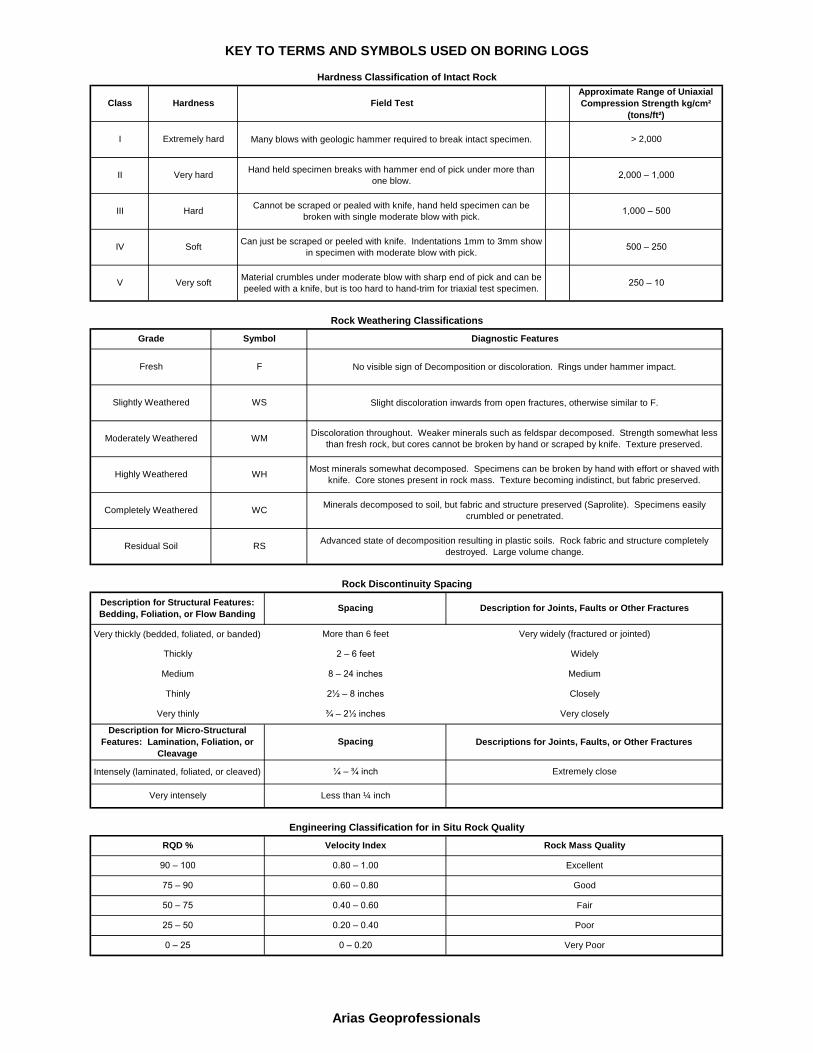
Rock Mass QualityVelocity IndexRQD %
90 – 100
75 – 90
50 – 75
25 – 50
0 – 25
0.80 – 1.00
0.60 – 0.80
0.40 – 0.60
0.20 – 0.40
0 – 0.20
Good
Fair
Very Poor
Poor
Very widely (fractured or jointed)
Widely
Medium
Closely
Very closely
Descriptions for Joints, Faults, or Other Fractures
Extremely close
Diagnostic Features
No visible sign of Decomposition or discoloration. Rings under hammer impact.
Slight discoloration inwards from open fractures, otherwise similar to F.
Discoloration throughout. Weaker minerals such as feldspar decomposed. Strength somewhat less
than fresh rock, but cores cannot be broken by hand or scraped by knife. Texture preserved.
Most minerals somewhat decomposed. Specimens can be broken by hand with effort or shaved with
knife. Core stones present in rock mass. Texture becoming indistinct, but fabric preserved.
Minerals decomposed to soil, but fabric and structure preserved (Saprolite). Specimens easily
crumbled or penetrated.
Advanced state of decomposition resulting in plastic soils. Rock fabric and structure completely
destroyed. Large volume change.
Spacing Description for Joints, Faults or Other Fractures
Thickly
Medium
Thinly
Very thinly
Description for Micro-Structural
Features: Lamination, Foliation, or
Cleavage
Intensely (laminated, foliated, or cleaved)
Very intensely
Spacing
¼ – ¾ inch
2 – 6 feet
Description for Structural Features:
Bedding, Foliation, or Flow Banding
Very thickly (bedded, foliated, or banded)
Symbol
F
WS
WM
WH
WC
RS
More than 6 feet
Engineering Classification for in Situ Rock Quality
Class
I
II
III
IV
V
Extremely hard
Hardness
Very hard
Hard
Soft
Very soft
Less than ¼ inch
¾ – 2½ inches
2½ – 8 inches
8 – 24 inches
Grade
Fresh
Slightly Weathered
Moderately Weathered
Highly Weathered
Completely Weathered
KEY TO TERMS AND SYMBOLS USED ON BORING LOGS
Hardness Classification of Intact Rock
Rock Weathering Classifications
Rock Discontinuity Spacing
Residual Soil
> 2,000
Approximate Range of Uniaxial
Compression Strength kg/cm²
(tons/ft²)
2,000 – 1,000
1,000 – 500
500 – 250
250 – 10
Field Test
Many blows with geologic hammer required to break intact specimen.
Hand held specimen breaks with hammer end of pick under more than
one blow.
Cannot be scraped or pealed with knife, hand held specimen can be
broken with single moderate blow with pick.
Can just be scraped or peeled with knife. Indentations 1mm to 3mm show
in specimen with moderate blow with pick.
Material crumbles under moderate blow with sharp end of pick and can be
peeled with a knife, but is too hard to hand-trim for triaxial test specimen.
Arias Geoprofessionals
Arias Geoprofessionals C-1 Arias Job No. 2017-698
APPENDIX C: LABORATORY AND FIELD TEST PROCEDURES
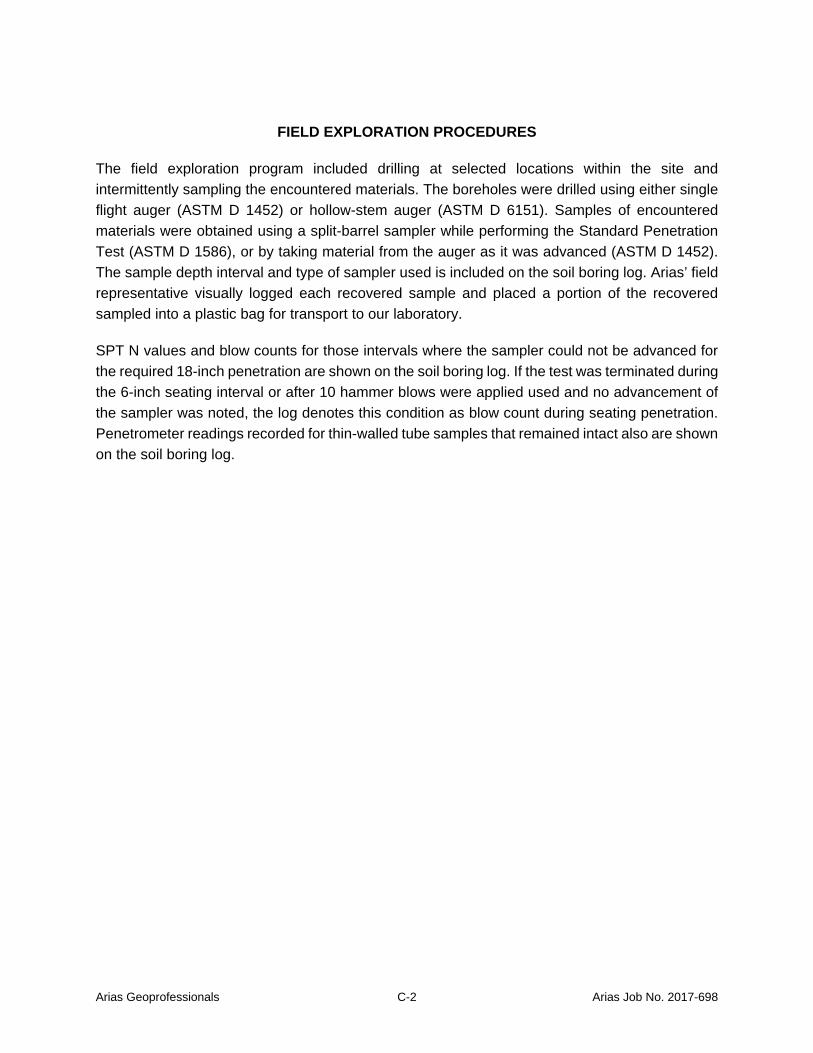
Arias Geoprofessionals C-2 Arias Job No. 2017-698
FIELD EXPLORATION PROCEDURES
The field exploration program included drilling at selected locations within the site and intermittently sampling the encountered materials. The boreholes were drilled using either single flight auger (ASTM D 1452) or hollow-stem auger (ASTM D 6151). Samples of encountered materials were obtained using a split-barrel sampler while performing the Standard Penetration Test (ASTM D 1586), or by taking material from the auger as it was advanced (ASTM D 1452). The sample depth interval and type of sampler used is included on the soil boring log. Arias’ field representative visually logged each recovered sample and placed a portion of the recovered sampled into a plastic bag for transport to our laboratory.
SPT N values and blow counts for those intervals where the sampler could not be advanced for the required 18-inch penetration are shown on the soil boring log. If the test was terminated during the 6-inch seating interval or after 10 hammer blows were applied used and no advancement of the sampler was noted, the log denotes this condition as blow count during seating penetration. Penetrometer readings recorded for thin-walled tube samples that remained intact also are shown on the soil boring log.
Arias & Associates, Inc. D-1 Arias Job No. 2014-703
APPENDIX D: SIEVE ANALYSIS TEST RESULTS

0
5
10
15
20
25
30
35
40
45
50
55
60
65
70
75
80
85
90
95
100
0.0010.010.1110100
Depth
1.5
medium
6 810 14
Classification
503/4 1/23/8
Boring
Boring Depth
GRAIN SIZE DISTRIBUTION
COBBLESGRAVEL SAND
PI Cc
HYDROMETERU.S. SIEVE OPENING IN INCHES U.S. SIEVE NUMBERS
D100 D60
CuLL PL
GRAIN SIZE IN MILLIMETERS
PE
RC
EN
T F
INE
R B
Y W
EIG
HT
coarse
3
%Gravel %Sand %Silt %Clay
100 1403 2
D10
4
fine coarseSILT OR CLAY
4
D30
2.5
6.0
10.0
18.0
101
101
101
101
20016 20 30 4016 60
fine
Elev
101
101
101
101
FAT CLAY (CH)
LEAN CLAY (CL)
FAT CLAY (CH)
LEAN CLAY (CL)
78
47
50
46
24
18
20
17
54
29
30
29
0.3
0.0
0.2
0.3
96.9
95.0
92.4
96.1
Silt and clay fractions were determined using 0.002 mm as the maximum particle size for clay.
2.5
6.0
10.0
18.0
75
4.75
75
75
2.7
5.0
7.4
3.6
Arias Geoprofessionals
Project: Mitchell Lake Wetland
Location: See Boring Location Plan
Job No.: 2017-698
20
17
-69
8.G
PJ
6/1
1/1
8 (
GR
AIN
SIZ
E A
RIA
S,U
S_
LA
B.G
DT
,LIB
RA
RY
20
13
-01
.GL
B)
142 Chula Vista DriveSan Antonio, Texas 78232Phone: (210) 308-5884

0
5
10
15
20
25
30
35
40
45
50
55
60
65
70
75
80
85
90
95
100
0.0010.010.1110100
Depth
1.5
medium
6 810 14
Classification
503/4 1/23/8
Boring
Boring Depth
GRAIN SIZE DISTRIBUTION
COBBLESGRAVEL SAND
PI Cc
HYDROMETERU.S. SIEVE OPENING IN INCHES U.S. SIEVE NUMBERS
D100 D60
CuLL PL
GRAIN SIZE IN MILLIMETERS
PE
RC
EN
T F
INE
R B
Y W
EIG
HT
coarse
3
%Gravel %Sand %Silt %Clay
100 1403 2
D10
4
fine coarseSILT OR CLAY
4
D30
38.0
4.0
10.0
23.0
101
102
102
102
20016 20 30 4016 60
fine
Elev
101
102
102
102
FAT CLAY (CH)
LEAN CLAY (CL)
LEAN CLAY (CL)
LEAN CLAY (CL)
50
48
44
40
18
19
19
16
32
29
25
24
0.0
0.0
0.0
0.0
97.0
94.7
93.8
94.0
Silt and clay fractions were determined using 0.002 mm as the maximum particle size for clay.
38.0
4.0
10.0
23.0
4.75
4.75
4.75
4.75
3.0
5.3
6.2
6.0
Arias Geoprofessionals
Project: Mitchell Lake Wetland
Location: See Boring Location Plan
Job No.: 2017-698
20
17
-69
8.G
PJ
6/1
1/1
8 (
GR
AIN
SIZ
E A
RIA
S,U
S_
LA
B.G
DT
,LIB
RA
RY
20
13
-01
.GL
B)
142 Chula Vista DriveSan Antonio, Texas 78232Phone: (210) 308-5884

0
5
10
15
20
25
30
35
40
45
50
55
60
65
70
75
80
85
90
95
100
0.0010.010.1110100
Depth
1.5
medium
6 810 14
Classification
503/4 1/23/8
Boring
Boring Depth
GRAIN SIZE DISTRIBUTION
COBBLESGRAVEL SAND
PI Cc
HYDROMETERU.S. SIEVE OPENING IN INCHES U.S. SIEVE NUMBERS
D100 D60
CuLL PL
GRAIN SIZE IN MILLIMETERS
PE
RC
EN
T F
INE
R B
Y W
EIG
HT
coarse
3
%Gravel %Sand %Silt %Clay
100 1403 2
D10
4
fine coarseSILT OR CLAY
4
D30
6.0
13.0
33.0
2.5
103
103
103
104
20016 20 30 4016 60
fine
Elev
103
103
103
104
LEAN CLAY (CL)
LEAN CLAY (CL)
FAT CLAY (CH)
LEAN CLAY (CL)
39
39
54
44
17
17
18
19
22
22
36
25
0.0
0.0
0.0
0.0
94.7
95.8
97.3
92.9
Silt and clay fractions were determined using 0.002 mm as the maximum particle size for clay.
6.0
13.0
33.0
2.5
4.75
4.75
4.75
4.75
5.3
4.2
2.7
7.1
Arias Geoprofessionals
Project: Mitchell Lake Wetland
Location: See Boring Location Plan
Job No.: 2017-698
20
17
-69
8.G
PJ
6/1
1/1
8 (
GR
AIN
SIZ
E A
RIA
S,U
S_
LA
B.G
DT
,LIB
RA
RY
20
13
-01
.GL
B)
142 Chula Vista DriveSan Antonio, Texas 78232Phone: (210) 308-5884

0
5
10
15
20
25
30
35
40
45
50
55
60
65
70
75
80
85
90
95
100
0.0010.010.1110100
Depth
1.5
medium
6 810 14
Classification
503/4 1/23/8
Boring
Boring Depth
GRAIN SIZE DISTRIBUTION
COBBLESGRAVEL SAND
PI Cc
HYDROMETERU.S. SIEVE OPENING IN INCHES U.S. SIEVE NUMBERS
D100 D60
CuLL PL
GRAIN SIZE IN MILLIMETERS
PE
RC
EN
T F
INE
R B
Y W
EIG
HT
coarse
3
%Gravel %Sand %Silt %Clay
100 1403 2
D10
4
fine coarseSILT OR CLAY
4
D30
8.0
13.0
28.0
4.0
104
104
104
105
20016 20 30 4016 60
fine
Elev
104
104
104
105
LEAN CLAY (CL)
LEAN CLAY (CL)
LEAN CLAY (CL)
LEAN CLAY (CL)
45
46
43
42
18
18
16
16
27
28
27
26
0.0
0.0
0.0
0.0
88.2
93.2
94.1
86.3
Silt and clay fractions were determined using 0.002 mm as the maximum particle size for clay.
8.0
13.0
28.0
4.0
4.75
4.75
4.75
4.75
11.8
6.8
5.9
13.7
Arias Geoprofessionals
Project: Mitchell Lake Wetland
Location: See Boring Location Plan
Job No.: 2017-698
20
17
-69
8.G
PJ
6/1
1/1
8 (
GR
AIN
SIZ
E A
RIA
S,U
S_
LA
B.G
DT
,LIB
RA
RY
20
13
-01
.GL
B)
142 Chula Vista DriveSan Antonio, Texas 78232Phone: (210) 308-5884

0
5
10
15
20
25
30
35
40
45
50
55
60
65
70
75
80
85
90
95
100
0.0010.010.1110100
Depth
1.5
medium
6 810 14
Classification
503/4 1/23/8
Boring
Boring Depth
GRAIN SIZE DISTRIBUTION
COBBLESGRAVEL SAND
PI Cc
HYDROMETERU.S. SIEVE OPENING IN INCHES U.S. SIEVE NUMBERS
D100 D60
CuLL PL
GRAIN SIZE IN MILLIMETERS
PE
RC
EN
T F
INE
R B
Y W
EIG
HT
coarse
3
%Gravel %Sand %Silt %Clay
100 1403 2
D10
4
fine coarseSILT OR CLAY
4
D30
8.0
13.5
23.0
2.5
105
105
105
106
20016 20 30 4016 60
fine
Elev
105
105
105
106
LEAN CLAY with SAND (CL)
LEAN CLAY (CL)
FAT CLAY (CH)
LEAN CLAY with SAND (CL)
40
44
52
40
17
18
18
16
23
26
34
24
0.0
0.0
0.0
0.0
84.1
88.7
94.9
81.4
Silt and clay fractions were determined using 0.002 mm as the maximum particle size for clay.
8.0
13.5
23.0
2.5
4.75
4.75
4.75
4.75
15.9
11.3
5.1
18.6
Arias Geoprofessionals
Project: Mitchell Lake Wetland
Location: See Boring Location Plan
Job No.: 2017-698
20
17
-69
8.G
PJ
6/1
1/1
8 (
GR
AIN
SIZ
E A
RIA
S,U
S_
LA
B.G
DT
,LIB
RA
RY
20
13
-01
.GL
B)
142 Chula Vista DriveSan Antonio, Texas 78232Phone: (210) 308-5884
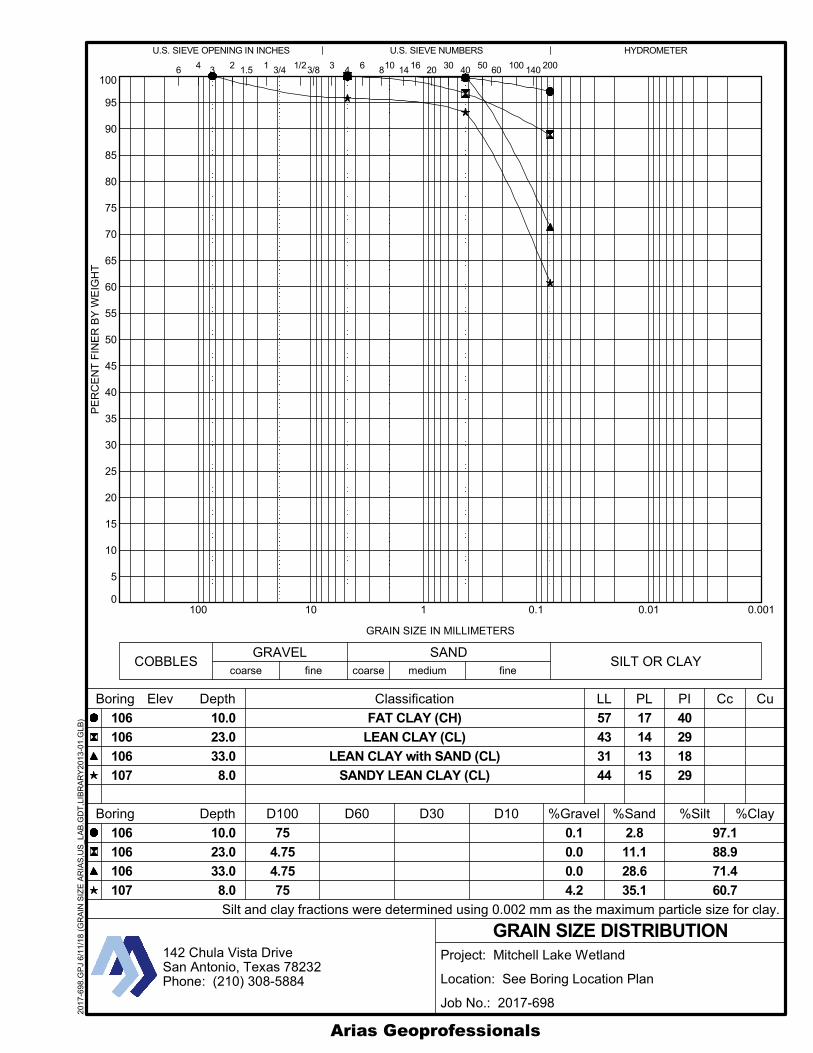
0
5
10
15
20
25
30
35
40
45
50
55
60
65
70
75
80
85
90
95
100
0.0010.010.1110100
Depth
1.5
medium
6 810 14
Classification
503/4 1/23/8
Boring
Boring Depth
GRAIN SIZE DISTRIBUTION
COBBLESGRAVEL SAND
PI Cc
HYDROMETERU.S. SIEVE OPENING IN INCHES U.S. SIEVE NUMBERS
D100 D60
CuLL PL
GRAIN SIZE IN MILLIMETERS
PE
RC
EN
T F
INE
R B
Y W
EIG
HT
coarse
3
%Gravel %Sand %Silt %Clay
100 1403 2
D10
4
fine coarseSILT OR CLAY
4
D30
10.0
23.0
33.0
8.0
106
106
106
107
20016 20 30 4016 60
fine
Elev
106
106
106
107
FAT CLAY (CH)
LEAN CLAY (CL)
LEAN CLAY with SAND (CL)
SANDY LEAN CLAY (CL)
57
43
31
44
17
14
13
15
40
29
18
29
0.1
0.0
0.0
4.2
97.1
88.9
71.4
60.7
Silt and clay fractions were determined using 0.002 mm as the maximum particle size for clay.
10.0
23.0
33.0
8.0
75
4.75
4.75
75
2.8
11.1
28.6
35.1
Arias Geoprofessionals
Project: Mitchell Lake Wetland
Location: See Boring Location Plan
Job No.: 2017-698
20
17
-69
8.G
PJ
6/1
1/1
8 (
GR
AIN
SIZ
E A
RIA
S,U
S_
LA
B.G
DT
,LIB
RA
RY
20
13
-01
.GL
B)
142 Chula Vista DriveSan Antonio, Texas 78232Phone: (210) 308-5884
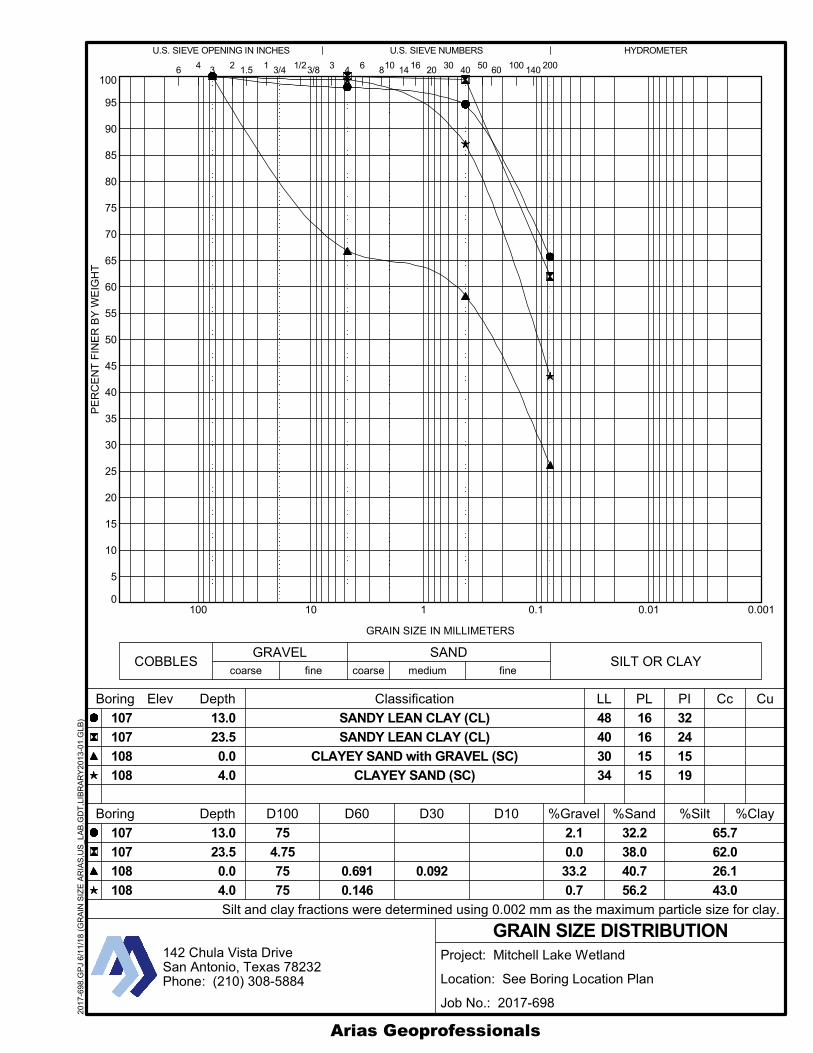
0
5
10
15
20
25
30
35
40
45
50
55
60
65
70
75
80
85
90
95
100
0.0010.010.1110100
Depth
1.5
medium
6 810 14
Classification
503/4 1/23/8
Boring
Boring Depth
GRAIN SIZE DISTRIBUTION
COBBLESGRAVEL SAND
PI Cc
HYDROMETERU.S. SIEVE OPENING IN INCHES U.S. SIEVE NUMBERS
D100 D60
CuLL PL
GRAIN SIZE IN MILLIMETERS
PE
RC
EN
T F
INE
R B
Y W
EIG
HT
coarse
3
%Gravel %Sand %Silt %Clay
100 1403 2
D10
4
fine coarseSILT OR CLAY
4
D30
13.0
23.5
0.0
4.0
107
107
108
108
20016 20 30 4016 60
fine
Elev
107
107
108
108
SANDY LEAN CLAY (CL)
SANDY LEAN CLAY (CL)
CLAYEY SAND with GRAVEL (SC)
CLAYEY SAND (SC)
48
40
30
34
16
16
15
15
32
24
15
19
0.691
0.146
0.092
2.1
0.0
33.2
0.7
65.7
62.0
26.1
43.0
Silt and clay fractions were determined using 0.002 mm as the maximum particle size for clay.
13.0
23.5
0.0
4.0
75
4.75
75
75
32.2
38.0
40.7
56.2
Arias Geoprofessionals
Project: Mitchell Lake Wetland
Location: See Boring Location Plan
Job No.: 2017-698
20
17
-69
8.G
PJ
6/1
1/1
8 (
GR
AIN
SIZ
E A
RIA
S,U
S_
LA
B.G
DT
,LIB
RA
RY
20
13
-01
.GL
B)
142 Chula Vista DriveSan Antonio, Texas 78232Phone: (210) 308-5884
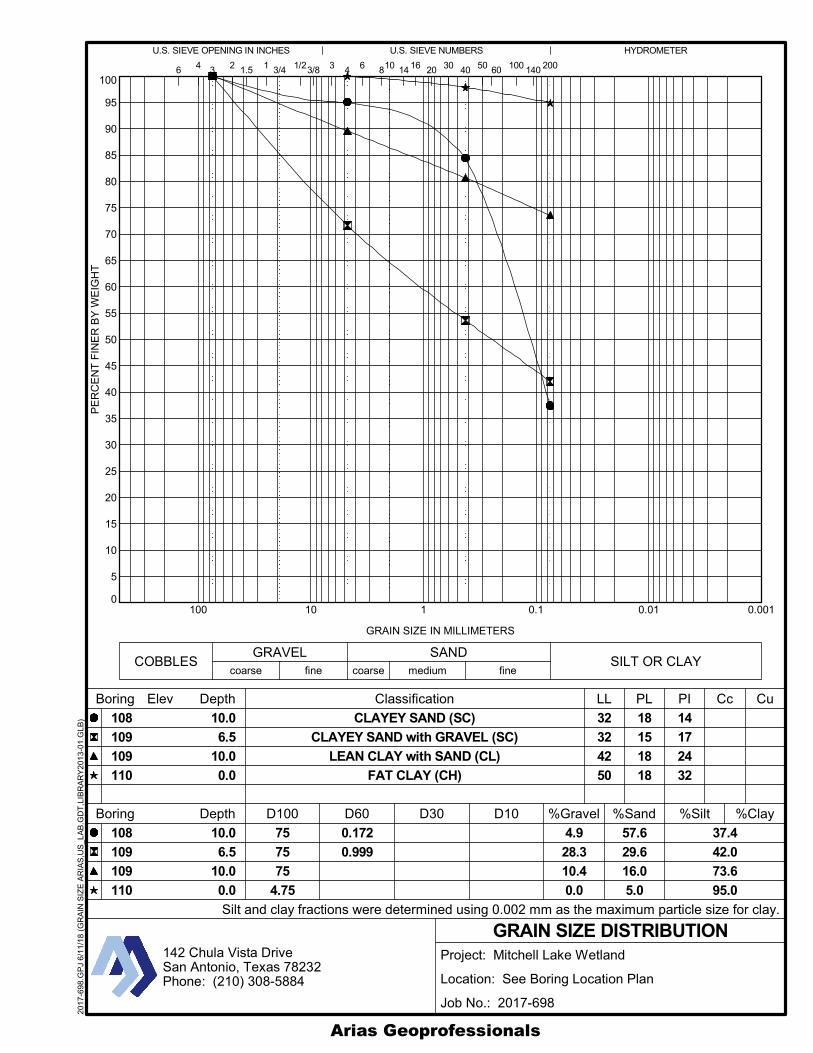
0
5
10
15
20
25
30
35
40
45
50
55
60
65
70
75
80
85
90
95
100
0.0010.010.1110100
Depth
1.5
medium
6 810 14
Classification
503/4 1/23/8
Boring
Boring Depth
GRAIN SIZE DISTRIBUTION
COBBLESGRAVEL SAND
PI Cc
HYDROMETERU.S. SIEVE OPENING IN INCHES U.S. SIEVE NUMBERS
D100 D60
CuLL PL
GRAIN SIZE IN MILLIMETERS
PE
RC
EN
T F
INE
R B
Y W
EIG
HT
coarse
3
%Gravel %Sand %Silt %Clay
100 1403 2
D10
4
fine coarseSILT OR CLAY
4
D30
10.0
6.5
10.0
0.0
108
109
109
110
20016 20 30 4016 60
fine
Elev
108
109
109
110
CLAYEY SAND (SC)
CLAYEY SAND with GRAVEL (SC)
LEAN CLAY with SAND (CL)
FAT CLAY (CH)
32
32
42
50
18
15
18
18
14
17
24
32
0.172
0.999
4.9
28.3
10.4
0.0
37.4
42.0
73.6
95.0
Silt and clay fractions were determined using 0.002 mm as the maximum particle size for clay.
10.0
6.5
10.0
0.0
75
75
75
4.75
57.6
29.6
16.0
5.0
Arias Geoprofessionals
Project: Mitchell Lake Wetland
Location: See Boring Location Plan
Job No.: 2017-698
20
17
-69
8.G
PJ
6/1
1/1
8 (
GR
AIN
SIZ
E A
RIA
S,U
S_
LA
B.G
DT
,LIB
RA
RY
20
13
-01
.GL
B)
142 Chula Vista DriveSan Antonio, Texas 78232Phone: (210) 308-5884
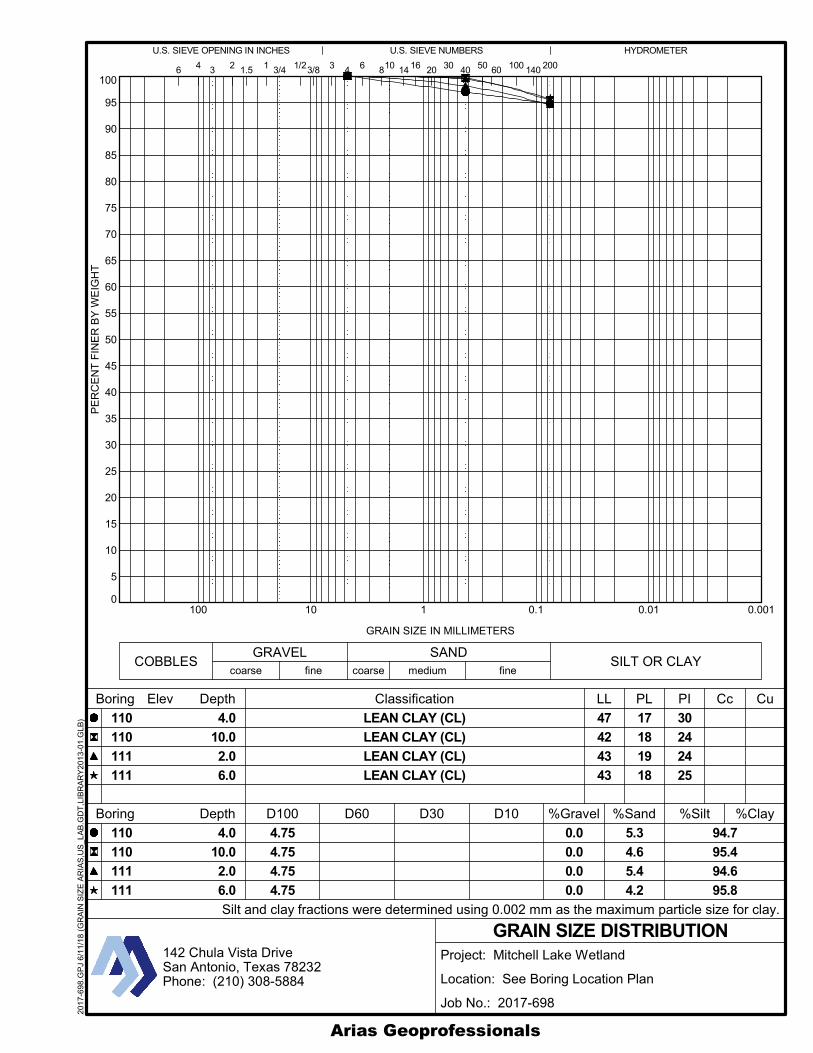
0
5
10
15
20
25
30
35
40
45
50
55
60
65
70
75
80
85
90
95
100
0.0010.010.1110100
Depth
1.5
medium
6 810 14
Classification
503/4 1/23/8
Boring
Boring Depth
GRAIN SIZE DISTRIBUTION
COBBLESGRAVEL SAND
PI Cc
HYDROMETERU.S. SIEVE OPENING IN INCHES U.S. SIEVE NUMBERS
D100 D60
CuLL PL
GRAIN SIZE IN MILLIMETERS
PE
RC
EN
T F
INE
R B
Y W
EIG
HT
coarse
3
%Gravel %Sand %Silt %Clay
100 1403 2
D10
4
fine coarseSILT OR CLAY
4
D30
4.0
10.0
2.0
6.0
110
110
111
111
20016 20 30 4016 60
fine
Elev
110
110
111
111
LEAN CLAY (CL)
LEAN CLAY (CL)
LEAN CLAY (CL)
LEAN CLAY (CL)
47
42
43
43
17
18
19
18
30
24
24
25
0.0
0.0
0.0
0.0
94.7
95.4
94.6
95.8
Silt and clay fractions were determined using 0.002 mm as the maximum particle size for clay.
4.0
10.0
2.0
6.0
4.75
4.75
4.75
4.75
5.3
4.6
5.4
4.2
Arias Geoprofessionals
Project: Mitchell Lake Wetland
Location: See Boring Location Plan
Job No.: 2017-698
20
17
-69
8.G
PJ
6/1
1/1
8 (
GR
AIN
SIZ
E A
RIA
S,U
S_
LA
B.G
DT
,LIB
RA
RY
20
13
-01
.GL
B)
142 Chula Vista DriveSan Antonio, Texas 78232Phone: (210) 308-5884
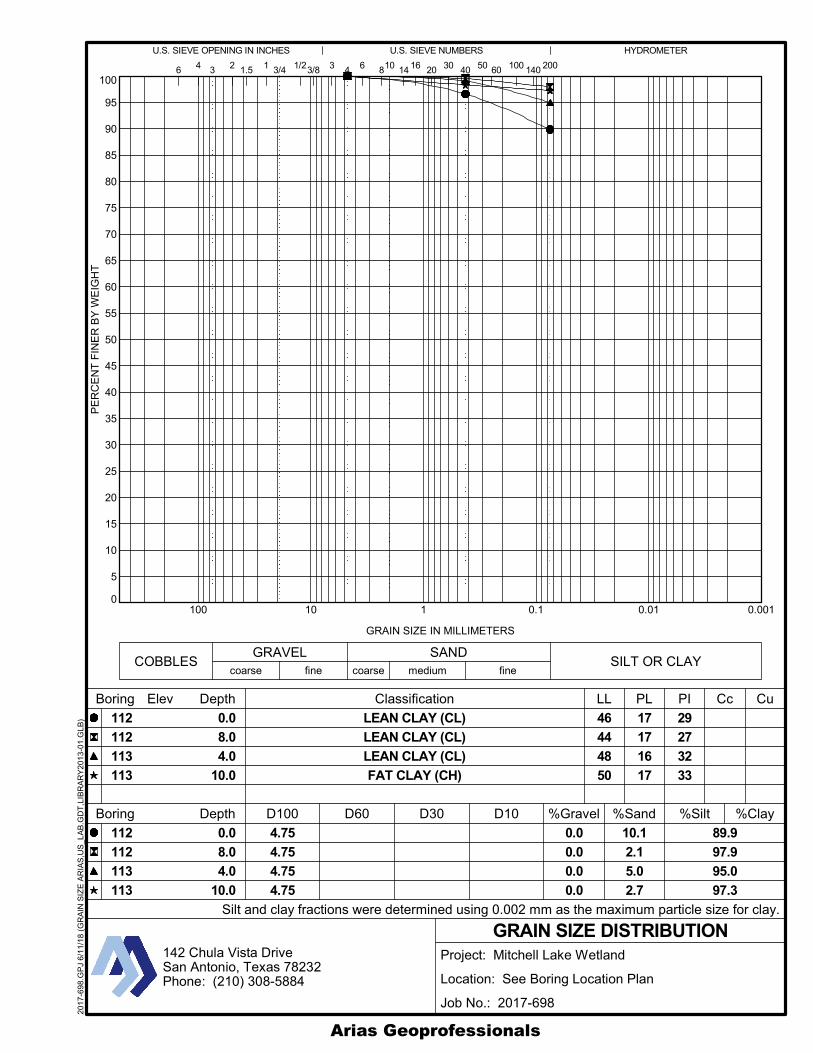
0
5
10
15
20
25
30
35
40
45
50
55
60
65
70
75
80
85
90
95
100
0.0010.010.1110100
Depth
1.5
medium
6 810 14
Classification
503/4 1/23/8
Boring
Boring Depth
GRAIN SIZE DISTRIBUTION
COBBLESGRAVEL SAND
PI Cc
HYDROMETERU.S. SIEVE OPENING IN INCHES U.S. SIEVE NUMBERS
D100 D60
CuLL PL
GRAIN SIZE IN MILLIMETERS
PE
RC
EN
T F
INE
R B
Y W
EIG
HT
coarse
3
%Gravel %Sand %Silt %Clay
100 1403 2
D10
4
fine coarseSILT OR CLAY
4
D30
0.0
8.0
4.0
10.0
112
112
113
113
20016 20 30 4016 60
fine
Elev
112
112
113
113
LEAN CLAY (CL)
LEAN CLAY (CL)
LEAN CLAY (CL)
FAT CLAY (CH)
46
44
48
50
17
17
16
17
29
27
32
33
0.0
0.0
0.0
0.0
89.9
97.9
95.0
97.3
Silt and clay fractions were determined using 0.002 mm as the maximum particle size for clay.
0.0
8.0
4.0
10.0
4.75
4.75
4.75
4.75
10.1
2.1
5.0
2.7
Arias Geoprofessionals
Project: Mitchell Lake Wetland
Location: See Boring Location Plan
Job No.: 2017-698
20
17
-69
8.G
PJ
6/1
1/1
8 (
GR
AIN
SIZ
E A
RIA
S,U
S_
LA
B.G
DT
,LIB
RA
RY
20
13
-01
.GL
B)
142 Chula Vista DriveSan Antonio, Texas 78232Phone: (210) 308-5884

0
5
10
15
20
25
30
35
40
45
50
55
60
65
70
75
80
85
90
95
100
0.0010.010.1110100
Depth
1.5
medium
6 810 14
Classification
503/4 1/23/8
Boring
Boring Depth
GRAIN SIZE DISTRIBUTION
COBBLESGRAVEL SAND
PI Cc
HYDROMETERU.S. SIEVE OPENING IN INCHES U.S. SIEVE NUMBERS
D100 D60
CuLL PL
GRAIN SIZE IN MILLIMETERS
PE
RC
EN
T F
INE
R B
Y W
EIG
HT
coarse
3
%Gravel %Sand %Silt %Clay
100 1403 2
D10
4
fine coarseSILT OR CLAY
4
D30
0.0
6.0
8.0
2.0
114
114
114
115
20016 20 30 4016 60
fine
Elev
114
114
114
115
LEAN CLAY with SAND (CL)
LEAN CLAY (CL)
LEAN CLAY (CL)
33
44
46
15
15
18
18
29
28
0.0
0.0
0.0
0.0
70.1
85.1
97.0
85.7
Silt and clay fractions were determined using 0.002 mm as the maximum particle size for clay.
0.0
6.0
8.0
2.0
4.75
4.75
4.75
4.75
29.9
14.9
3.0
14.3
Arias Geoprofessionals
Project: Mitchell Lake Wetland
Location: See Boring Location Plan
Job No.: 2017-698
20
17
-69
8.G
PJ
6/1
1/1
8 (
GR
AIN
SIZ
E A
RIA
S,U
S_
LA
B.G
DT
,LIB
RA
RY
20
13
-01
.GL
B)
142 Chula Vista DriveSan Antonio, Texas 78232Phone: (210) 308-5884

0
5
10
15
20
25
30
35
40
45
50
55
60
65
70
75
80
85
90
95
100
0.0010.010.1110100
Depth
1.5
medium
6 810 14
Classification
503/4 1/23/8
Boring
Boring Depth
GRAIN SIZE DISTRIBUTION
COBBLESGRAVEL SAND
PI Cc
HYDROMETERU.S. SIEVE OPENING IN INCHES U.S. SIEVE NUMBERS
D100 D60
CuLL PL
GRAIN SIZE IN MILLIMETERS
PE
RC
EN
T F
INE
R B
Y W
EIG
HT
coarse
3
%Gravel %Sand %Silt %Clay
100 1403 2
D10
4
fine coarseSILT OR CLAY
4
D30
8.0
2.0
6.0
13.0
115
116
116
116
20016 20 30 4016 60
fine
Elev
115
116
116
116
LEAN CLAY (CL)
FAT CLAY (CH)
LEAN CLAY (CL)
LEAN CLAY (CL)
42
50
46
45
17
19
16
17
25
31
30
28
0.0
0.0
0.0
0.0
96.2
94.3
97.8
93.1
Silt and clay fractions were determined using 0.002 mm as the maximum particle size for clay.
8.0
2.0
6.0
13.0
4.75
4.75
4.75
4.75
3.8
5.7
2.2
6.9
Arias Geoprofessionals
Project: Mitchell Lake Wetland
Location: See Boring Location Plan
Job No.: 2017-698
20
17
-69
8.G
PJ
6/1
1/1
8 (
GR
AIN
SIZ
E A
RIA
S,U
S_
LA
B.G
DT
,LIB
RA
RY
20
13
-01
.GL
B)
142 Chula Vista DriveSan Antonio, Texas 78232Phone: (210) 308-5884
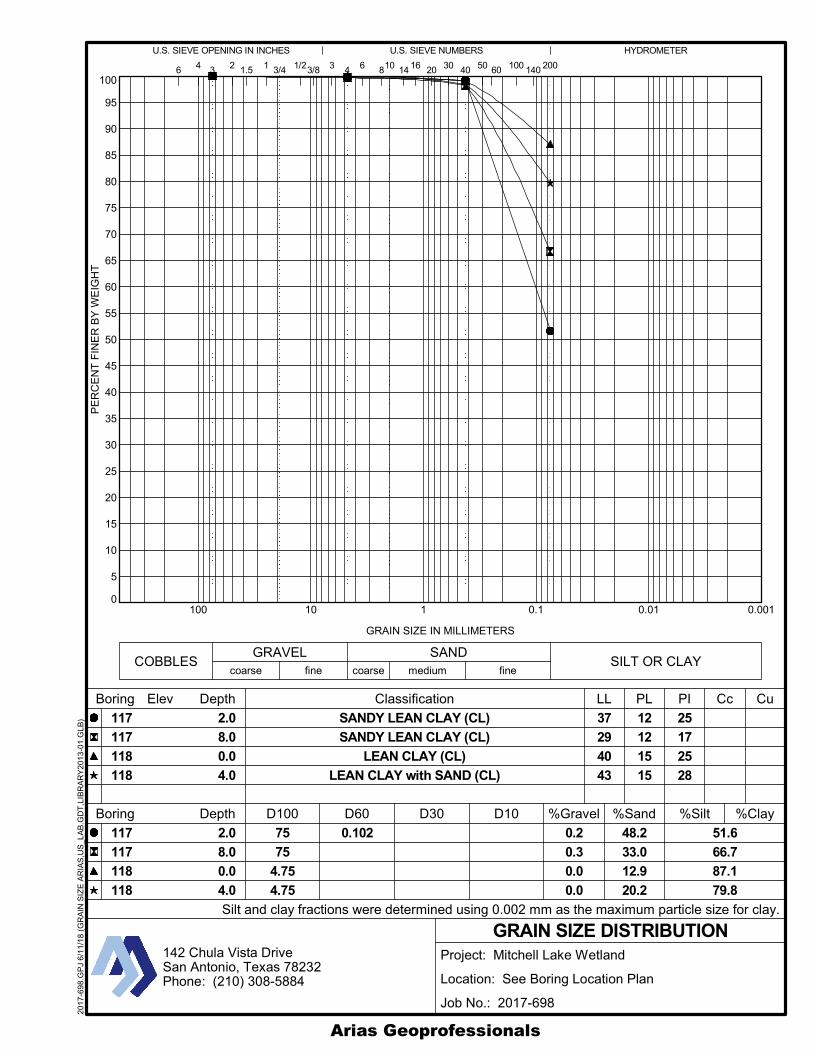
0
5
10
15
20
25
30
35
40
45
50
55
60
65
70
75
80
85
90
95
100
0.0010.010.1110100
Depth
1.5
medium
6 810 14
Classification
503/4 1/23/8
Boring
Boring Depth
GRAIN SIZE DISTRIBUTION
COBBLESGRAVEL SAND
PI Cc
HYDROMETERU.S. SIEVE OPENING IN INCHES U.S. SIEVE NUMBERS
D100 D60
CuLL PL
GRAIN SIZE IN MILLIMETERS
PE
RC
EN
T F
INE
R B
Y W
EIG
HT
coarse
3
%Gravel %Sand %Silt %Clay
100 1403 2
D10
4
fine coarseSILT OR CLAY
4
D30
2.0
8.0
0.0
4.0
117
117
118
118
20016 20 30 4016 60
fine
Elev
117
117
118
118
SANDY LEAN CLAY (CL)
SANDY LEAN CLAY (CL)
LEAN CLAY (CL)
LEAN CLAY with SAND (CL)
37
29
40
43
12
12
15
15
25
17
25
28
0.102 0.2
0.3
0.0
0.0
51.6
66.7
87.1
79.8
Silt and clay fractions were determined using 0.002 mm as the maximum particle size for clay.
2.0
8.0
0.0
4.0
75
75
4.75
4.75
48.2
33.0
12.9
20.2
Arias Geoprofessionals
Project: Mitchell Lake Wetland
Location: See Boring Location Plan
Job No.: 2017-698
20
17
-69
8.G
PJ
6/1
1/1
8 (
GR
AIN
SIZ
E A
RIA
S,U
S_
LA
B.G
DT
,LIB
RA
RY
20
13
-01
.GL
B)
142 Chula Vista DriveSan Antonio, Texas 78232Phone: (210) 308-5884
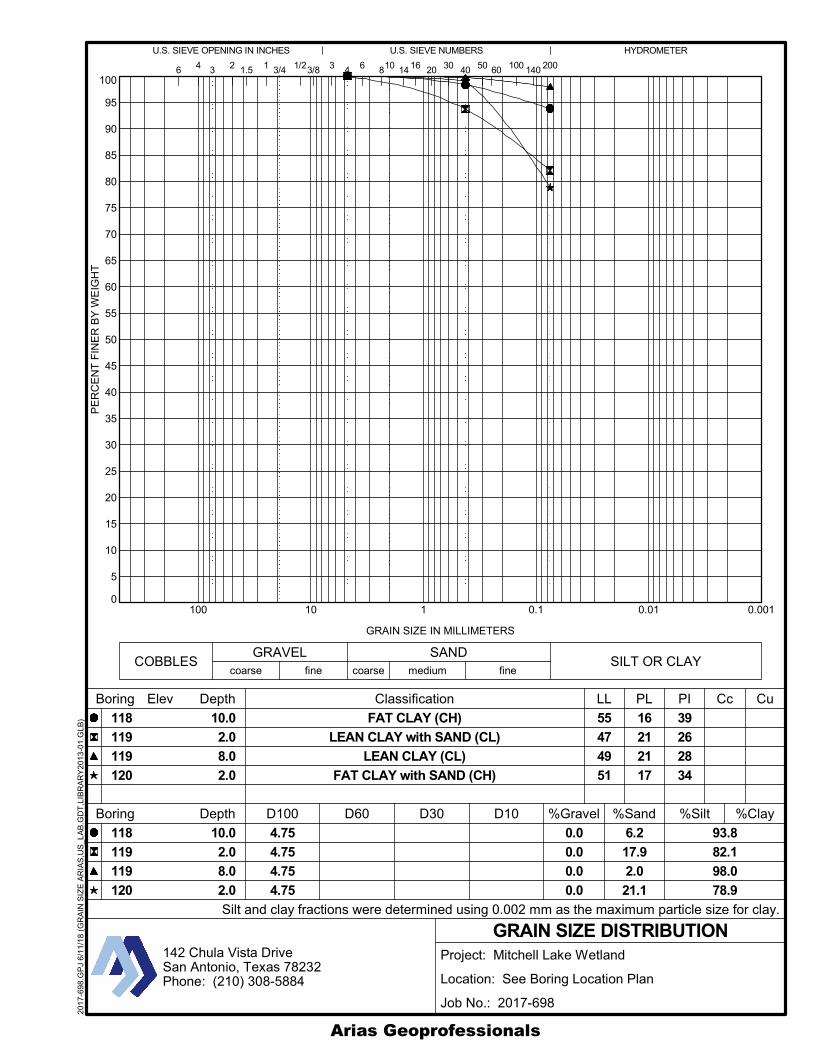
0
5
10
15
20
25
30
35
40
45
50
55
60
65
70
75
80
85
90
95
100
0.0010.010.1110100
Depth
1.5
medium
6 810 14
Classification
503/4 1/23/8
Boring
Boring Depth
GRAIN SIZE DISTRIBUTION
COBBLESGRAVEL SAND
PI Cc
HYDROMETERU.S. SIEVE OPENING IN INCHES U.S. SIEVE NUMBERS
D100 D60
CuLL PL
GRAIN SIZE IN MILLIMETERS
PE
RC
EN
T F
INE
R B
Y W
EIG
HT
coarse
3
%Gravel %Sand %Silt %Clay
100 1403 2
D10
4
fine coarseSILT OR CLAY
4
D30
10.0
2.0
8.0
2.0
118
119
119
120
20016 20 30 4016 60
fine
Elev
118
119
119
120
FAT CLAY (CH)
LEAN CLAY with SAND (CL)
LEAN CLAY (CL)
FAT CLAY with SAND (CH)
55
47
49
51
16
21
21
17
39
26
28
34
0.0
0.0
0.0
0.0
93.8
82.1
98.0
78.9
Silt and clay fractions were determined using 0.002 mm as the maximum particle size for clay.
10.0
2.0
8.0
2.0
4.75
4.75
4.75
4.75
6.2
17.9
2.0
21.1
Arias Geoprofessionals
Project: Mitchell Lake Wetland
Location: See Boring Location Plan
Job No.: 2017-698
20
17
-69
8.G
PJ
6/1
1/1
8 (
GR
AIN
SIZ
E A
RIA
S,U
S_
LA
B.G
DT
,LIB
RA
RY
20
13
-01
.GL
B)
142 Chula Vista DriveSan Antonio, Texas 78232Phone: (210) 308-5884
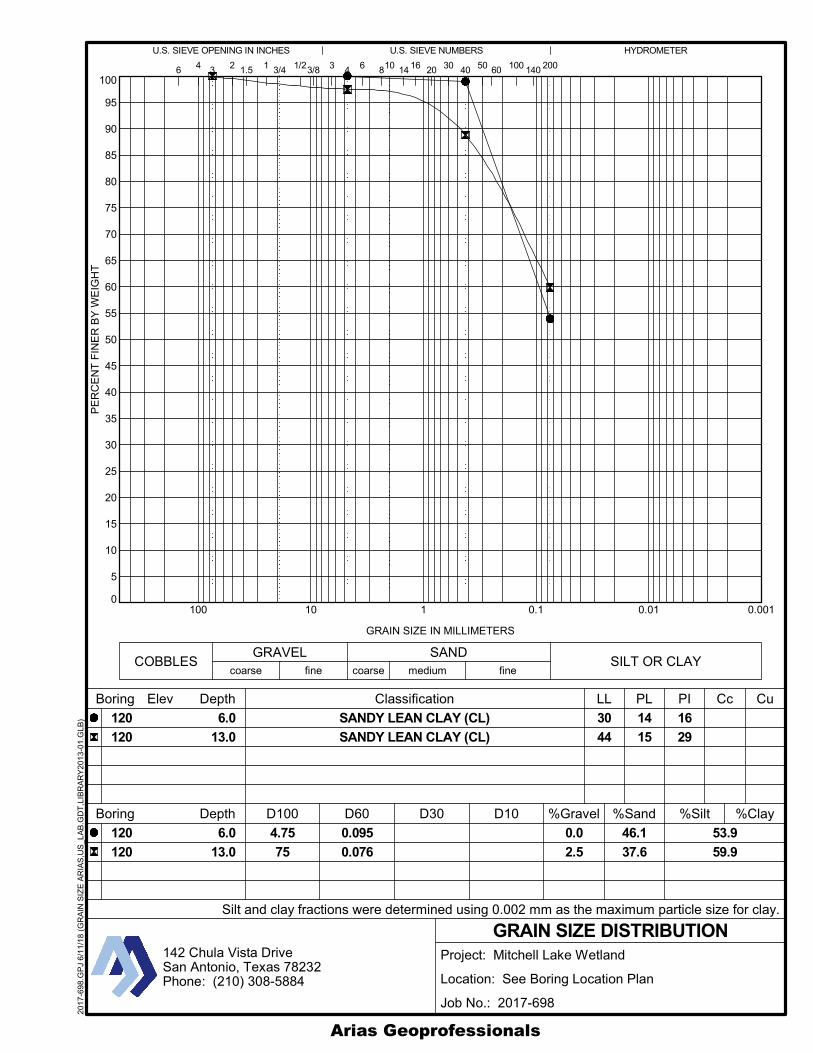
0
5
10
15
20
25
30
35
40
45
50
55
60
65
70
75
80
85
90
95
100
0.0010.010.1110100
Depth
1.5
medium
6 810 14
Classification
503/4 1/23/8
Boring
Boring Depth
GRAIN SIZE DISTRIBUTION
COBBLESGRAVEL SAND
PI Cc
HYDROMETERU.S. SIEVE OPENING IN INCHES U.S. SIEVE NUMBERS
D100 D60
CuLL PL
GRAIN SIZE IN MILLIMETERS
PE
RC
EN
T F
INE
R B
Y W
EIG
HT
coarse
3
%Gravel %Sand %Silt %Clay
100 1403 2
D10
4
fine coarseSILT OR CLAY
4
D30
6.0
13.0
120
120
20016 20 30 4016 60
fine
Elev
120
120
SANDY LEAN CLAY (CL)
SANDY LEAN CLAY (CL)
30
44
14
15
16
29
0.095
0.076
0.0
2.5
53.9
59.9
Silt and clay fractions were determined using 0.002 mm as the maximum particle size for clay.
6.0
13.0
4.75
75
46.1
37.6
Arias Geoprofessionals
Project: Mitchell Lake Wetland
Location: See Boring Location Plan
Job No.: 2017-698
20
17
-69
8.G
PJ
6/1
1/1
8 (
GR
AIN
SIZ
E A
RIA
S,U
S_
LA
B.G
DT
,LIB
RA
RY
20
13
-01
.GL
B)
142 Chula Vista DriveSan Antonio, Texas 78232Phone: (210) 308-5884
Arias Geoprofessionals E-1 Arias Job No. 2017-698
APPENDIX E: ONE-DIMENSIONAL CONSOLIDATION TEST RESULTS
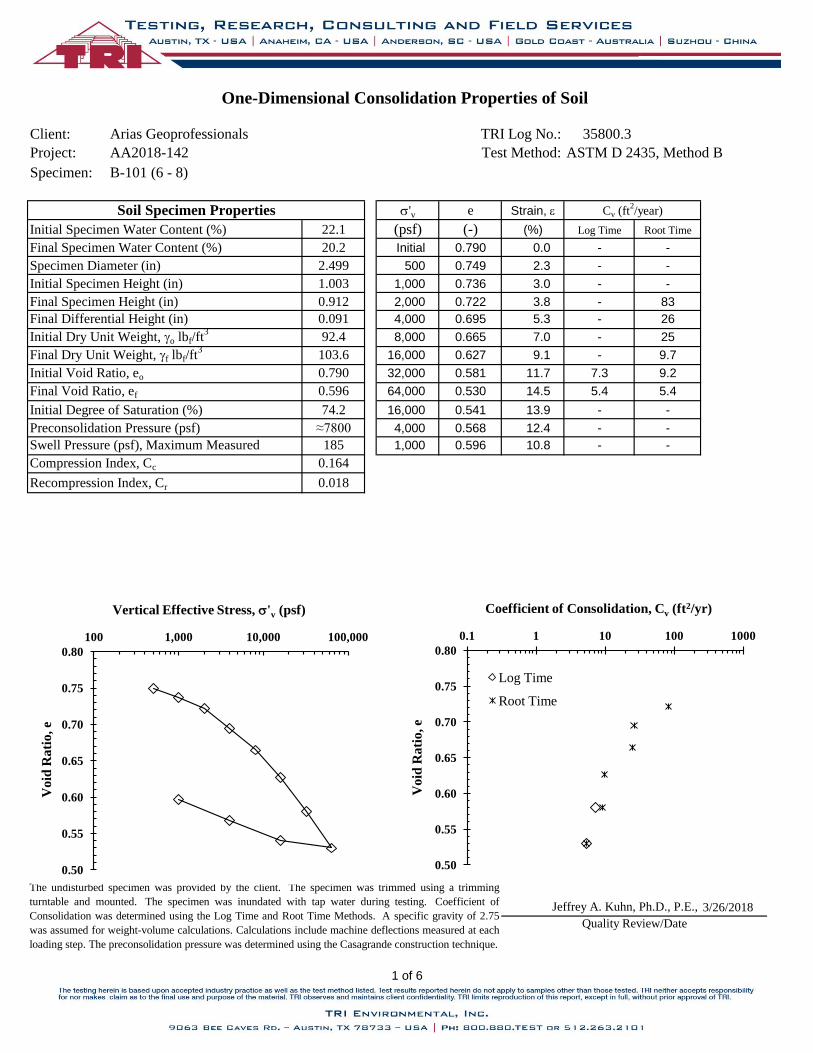
Client: Arias Geoprofessionals TRI Log No.: 35800.3
Project: AA2018-142 Test Method: ASTM D 2435, Method B
Specimen: B-101 (6 - 8)
s'v e Strain, e
22.1 (psf) (-) (%) Log Time Root Time
20.2 Initial 0.790 0.0 - -
2.499 500 0.749 2.3 - -
1.003 1,000 0.736 3.0 - -
0.912 2,000 0.722 3.8 - 83
0.091 4,000 0.695 5.3 - 26
92.4 8,000 0.665 7.0 - 25
103.6 16,000 0.627 9.1 - 9.7
0.790 32,000 0.581 11.7 7.3 9.2
0.596 64,000 0.530 14.5 5.4 5.4
74.2 16,000 0.541 13.9 - -
≈7800 4,000 0.568 12.4 - -
185 1,000 0.596 10.8 - -
0.164
0.018
3/26/2018
Initial Void Ratio, eo
Final Void Ratio, ef
Jeffrey A. Kuhn, Ph.D., P.E.,
Compression Index, Cc
Recompression Index, Cr
The undisturbed specimen was provided by the client. The specimen was trimmed using a trimming
turntable and mounted. The specimen was inundated with tap water during testing. Coefficient of
Consolidation was determined using the Log Time and Root Time Methods. A specific gravity of 2.75
was assumed for weight-volume calculations. Calculations include machine deflections measured at each
loading step. The preconsolidation pressure was determined using the Casagrande construction technique.
Quality Review/Date
One-Dimensional Consolidation Properties of Soil
Soil Specimen Properties
Initial Specimen Water Content (%)
Specimen Diameter (in)
Final Differential Height (in)
Initial Specimen Height (in)
Final Specimen Height (in)
Initial Degree of Saturation (%)
Preconsolidation Pressure (psf)
Swell Pressure (psf), Maximum Measured
Final Dry Unit Weight, gf lbf/ft3
Final Specimen Water Content (%)
Initial Dry Unit Weight, go lbf/ft3
Cv (ft2/year)
0.50
0.55
0.60
0.65
0.70
0.75
0.80
100 1,000 10,000 100,000
Void
Rati
o, e
Vertical Effective Stress, s'v (psf)
0.50
0.55
0.60
0.65
0.70
0.75
0.80
0.1 1 10 100 1000
Vo
id R
ati
o, e
Coefficient of Consolidation, Cv (ft2/yr)
Log Time
Root Time
0.5
0
0.5
5
0.6
0
0.6
5
0.7
0
0.7
5
0.8
0
10
01
,00
01
0,0
00
10
0,0
00
Void Ratio, e
Verti
ca
l E
ffecti
ve S
tres
s, s
' v(p
sf)
Cc
Cas
agra
nd
e C
on
stru
ctio
n f
or
Pre
cons
olid
atio
n S
tres
s
1 of 6
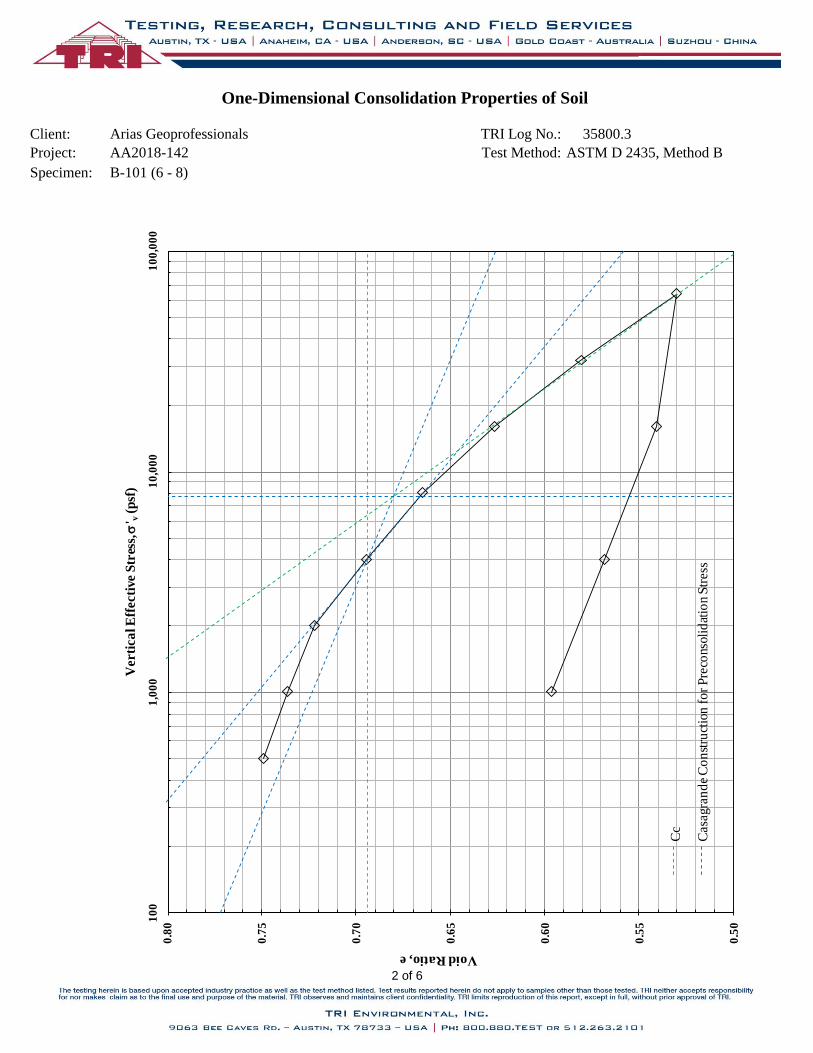
Client: Arias Geoprofessionals TRI Log No.: 35800.3
Project: AA2018-142 Test Method: ASTM D 2435, Method B
Specimen: B-101 (6 - 8)
One-Dimensional Consolidation Properties of Soil
0.5
0
0.5
5
0.6
0
0.6
5
0.7
0
0.7
5
0.8
0
10
01
,00
01
0,0
00
10
0,0
00
Void Ratio, e
Verti
ca
l E
ffecti
ve S
tres
s, s
' v(p
sf)
Cc
Cas
agra
nd
e C
on
stru
ctio
n f
or
Pre
cons
olid
atio
n S
tres
s
-
-
-
-
-
-
-
-
-
-
-
-
-
0.5
0
0.5
5
0.6
0
0.6
5
0.7
0
0.7
5
0.8
0
10
01
,00
01
0,0
00
10
0,0
00
Void Ratio, e
Verti
ca
l E
ffecti
ve S
tres
s, s
' v(p
sf)
Cc
Cas
agra
nd
e C
on
stru
ctio
n f
or
Pre
cons
olid
atio
n S
tres
s
2 of 6
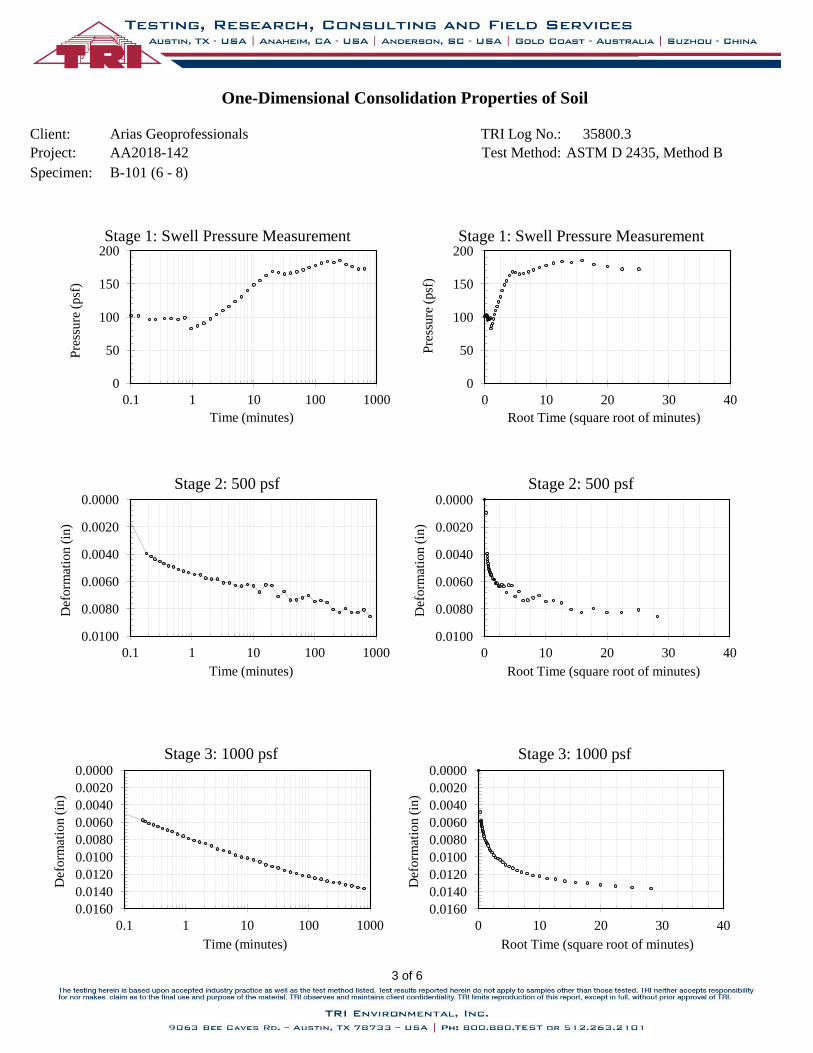
Client: Arias Geoprofessionals TRI Log No.: 35800.3
Project: AA2018-142 Test Method: ASTM D 2435, Method B
Specimen: B-101 (6 - 8)
One-Dimensional Consolidation Properties of Soil
0.5
0
0.5
5
0.6
0
0.6
5
0.7
0
0.7
5
0.8
0
10
01
,00
01
0,0
00
10
0,0
00
Void Ratio, e
Verti
ca
l E
ffecti
ve S
tres
s, s
' v(p
sf)
Cc
Cas
agra
nd
e C
on
stru
ctio
n f
or
Pre
cons
olid
atio
n S
tres
s
0
50
100
150
200
0.1 1 10 100 1000
Pre
ssure
(psf
)
Time (minutes)
Stage 1: Swell Pressure Measurement
0
50
100
150
200
0 10 20 30 40
Pre
ssure
(psf
) Root Time (square root of minutes)
Stage 1: Swell Pressure Measurement
0.0000
0.0020
0.0040
0.0060
0.0080
0.0100
0.1 1 10 100 1000
Def
orm
atio
n (
in)
Time (minutes)
Stage 2: 500 psf 0.0000
0.0020
0.0040
0.0060
0.0080
0.0100
0 10 20 30 40
Def
orm
atio
n (
in)
Root Time (square root of minutes)
Stage 2: 500 psf
0.0000
0.0020
0.0040
0.0060
0.0080
0.0100
0.0120
0.0140
0.0160
0.1 1 10 100 1000
Def
orm
atio
n (
in)
Time (minutes)
Stage 3: 1000 psf 0.0000
0.0020
0.0040
0.0060
0.0080
0.0100
0.0120
0.0140
0.0160
0 10 20 30 40
Def
orm
atio
n (
in)
Root Time (square root of minutes)
Stage 3: 1000 psf
0.5
0
0.5
5
0.6
0
0.6
5
0.7
0
0.7
5
0.8
0
10
01
,00
01
0,0
00
10
0,0
00
Void Ratio, e
Verti
ca
l E
ffecti
ve S
tres
s, s
' v(p
sf)
Cc
Cas
agra
nd
e C
on
stru
ctio
n f
or
Pre
cons
olid
atio
n S
tres
s
3 of 6
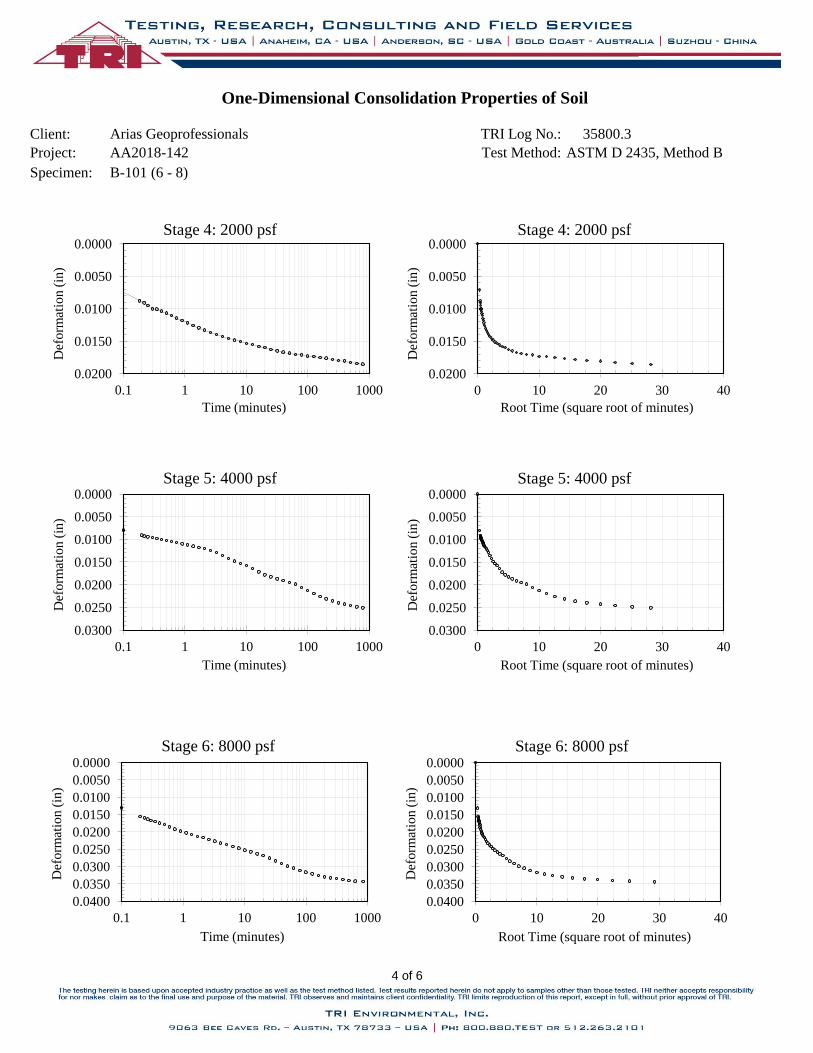
Client: Arias Geoprofessionals TRI Log No.: 35800.3
Project: AA2018-142 Test Method: ASTM D 2435, Method B
Specimen: B-101 (6 - 8)
One-Dimensional Consolidation Properties of Soil
0.5
0
0.5
5
0.6
0
0.6
5
0.7
0
0.7
5
0.8
0
10
01
,00
01
0,0
00
10
0,0
00
Void Ratio, e
Verti
ca
l E
ffecti
ve S
tres
s, s
' v(p
sf)
Cc
Cas
agra
nd
e C
on
stru
ctio
n f
or
Pre
cons
olid
atio
n S
tres
s
0.0000
0.0050
0.0100
0.0150
0.0200
0.1 1 10 100 1000
Def
orm
atio
n (
in)
Time (minutes)
Stage 4: 2000 psf 0.0000
0.0050
0.0100
0.0150
0.0200
0 10 20 30 40
Def
orm
atio
n (
in)
Root Time (square root of minutes)
Stage 4: 2000 psf
0.0000
0.0050
0.0100
0.0150
0.0200
0.0250
0.0300
0.1 1 10 100 1000
Def
orm
atio
n (
in)
Time (minutes)
Stage 5: 4000 psf 0.0000
0.0050
0.0100
0.0150
0.0200
0.0250
0.0300
0 10 20 30 40
Def
orm
atio
n (
in)
Root Time (square root of minutes)
Stage 5: 4000 psf
0.0000
0.0050
0.0100
0.0150
0.0200
0.0250
0.0300
0.0350
0.0400
0.1 1 10 100 1000
Def
orm
atio
n (
in)
Time (minutes)
Stage 6: 8000 psf 0.0000
0.0050
0.0100
0.0150
0.0200
0.0250
0.0300
0.0350
0.0400
0 10 20 30 40
Def
orm
atio
n (
in)
Root Time (square root of minutes)
Stage 6: 8000 psf 0
.50
0.5
5
0.6
0
0.6
5
0.7
0
0.7
5
0.8
0
10
01
,00
01
0,0
00
10
0,0
00
Void Ratio, e
Verti
ca
l E
ffecti
ve S
tres
s, s
' v(p
sf)
Cc
Cas
agra
nd
e C
on
stru
ctio
n f
or
Pre
cons
olid
atio
n S
tres
s
4 of 6
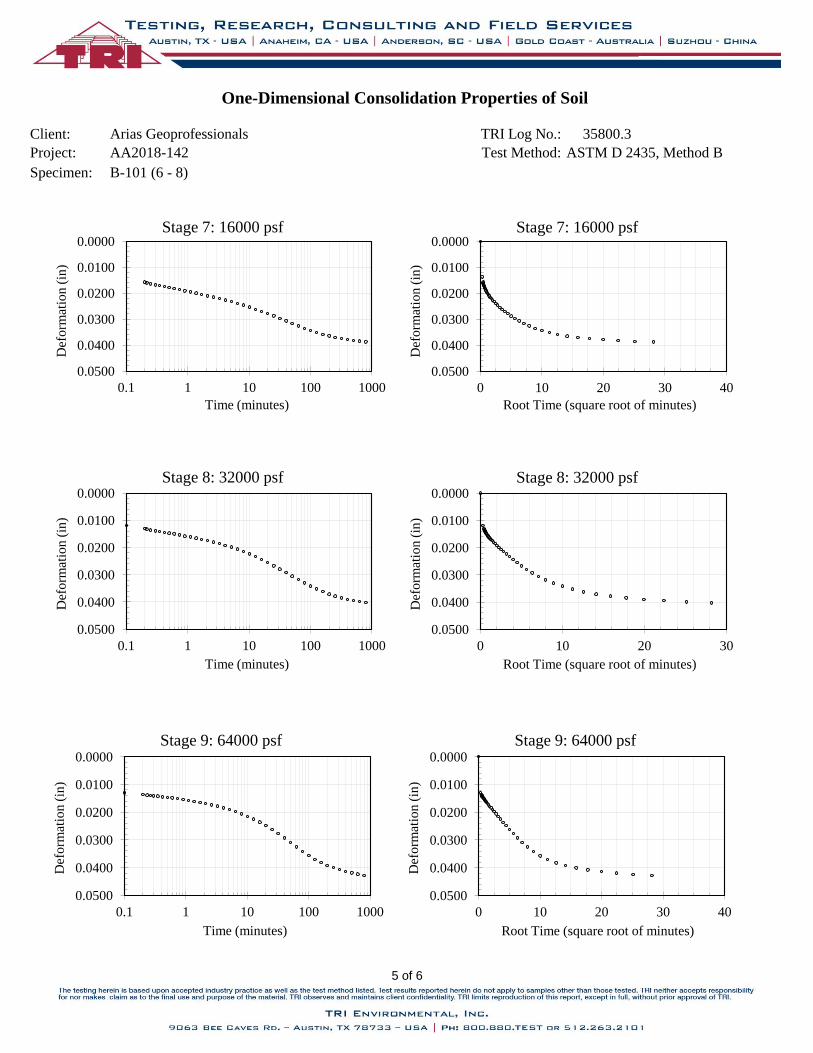
Client: Arias Geoprofessionals TRI Log No.: 35800.3
Project: AA2018-142 Test Method: ASTM D 2435, Method B
Specimen: B-101 (6 - 8)
One-Dimensional Consolidation Properties of Soil
0.5
0
0.5
5
0.6
0
0.6
5
0.7
0
0.7
5
0.8
0
10
01
,00
01
0,0
00
10
0,0
00
Void Ratio, e
Verti
ca
l E
ffecti
ve S
tres
s, s
' v(p
sf)
Cc
Cas
agra
nd
e C
on
stru
ctio
n f
or
Pre
cons
olid
atio
n S
tres
s
0.0000
0.0100
0.0200
0.0300
0.0400
0.0500
0.1 1 10 100 1000
Def
orm
atio
n (
in)
Time (minutes)
Stage 7: 16000 psf 0.0000
0.0100
0.0200
0.0300
0.0400
0.0500
0 10 20 30 40
Def
orm
atio
n (
in)
Root Time (square root of minutes)
Stage 7: 16000 psf
0.0000
0.0100
0.0200
0.0300
0.0400
0.0500
0.1 1 10 100 1000
Def
orm
atio
n (
in)
Time (minutes)
Stage 8: 32000 psf 0.0000
0.0100
0.0200
0.0300
0.0400
0.0500
0 10 20 30
Def
orm
atio
n (
in)
Root Time (square root of minutes)
Stage 8: 32000 psf
0.0000
0.0100
0.0200
0.0300
0.0400
0.0500
0.1 1 10 100 1000
Def
orm
atio
n (
in)
Time (minutes)
Stage 9: 64000 psf 0.0000
0.0100
0.0200
0.0300
0.0400
0.0500
0 10 20 30 40
Def
orm
atio
n (
in)
Root Time (square root of minutes)
Stage 9: 64000 psf 0
.50
0.5
5
0.6
0
0.6
5
0.7
0
0.7
5
0.8
0
10
01
,00
01
0,0
00
10
0,0
00
Void Ratio, e
Verti
ca
l E
ffecti
ve S
tres
s, s
' v(p
sf)
Cc
Cas
agra
nd
e C
on
stru
ctio
n f
or
Pre
cons
olid
atio
n S
tres
s
5 of 6
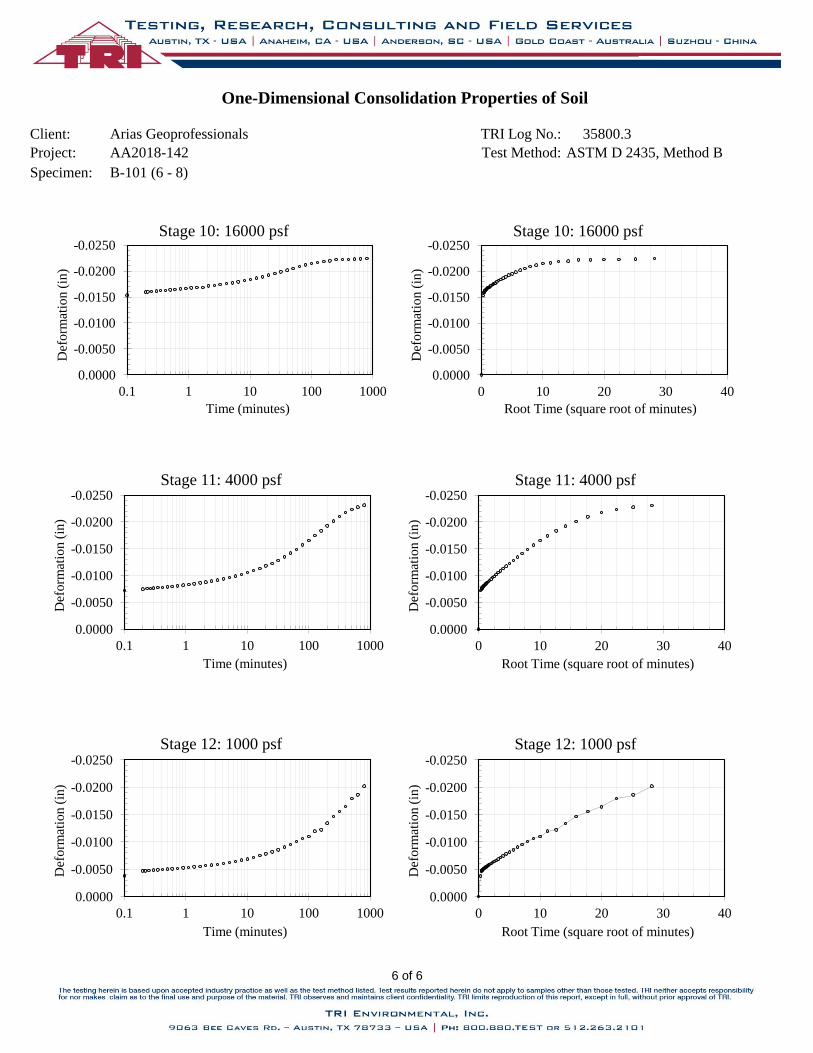
Client: Arias Geoprofessionals TRI Log No.: 35800.3
Project: AA2018-142 Test Method: ASTM D 2435, Method B
Specimen: B-101 (6 - 8)
One-Dimensional Consolidation Properties of Soil
0.5
0
0.5
5
0.6
0
0.6
5
0.7
0
0.7
5
0.8
0
10
01
,00
01
0,0
00
10
0,0
00
Void Ratio, e
Verti
ca
l E
ffecti
ve S
tres
s, s
' v(p
sf)
Cc
Cas
agra
nd
e C
on
stru
ctio
n f
or
Pre
cons
olid
atio
n S
tres
s
-0.0250
-0.0200
-0.0150
-0.0100
-0.0050
0.0000
0.1 1 10 100 1000
Def
orm
atio
n (
in)
Time (minutes)
Stage 10: 16000 psf -0.0250
-0.0200
-0.0150
-0.0100
-0.0050
0.0000
0 10 20 30 40
Def
orm
atio
n (
in)
Root Time (square root of minutes)
Stage 10: 16000 psf
-0.0250
-0.0200
-0.0150
-0.0100
-0.0050
0.0000
0.1 1 10 100 1000
Def
orm
atio
n (
in)
Time (minutes)
Stage 11: 4000 psf -0.0250
-0.0200
-0.0150
-0.0100
-0.0050
0.0000
0 10 20 30 40
Def
orm
atio
n (
in)
Root Time (square root of minutes)
Stage 11: 4000 psf
-0.0250
-0.0200
-0.0150
-0.0100
-0.0050
0.0000
0.1 1 10 100 1000
Def
orm
atio
n (
in)
Time (minutes)
Stage 12: 1000 psf -0.0250
-0.0200
-0.0150
-0.0100
-0.0050
0.0000
0 10 20 30 40
Def
orm
atio
n (
in)
Root Time (square root of minutes)
Stage 12: 1000 psf 0
.50
0.5
5
0.6
0
0.6
5
0.7
0
0.7
5
0.8
0
10
01
,00
01
0,0
00
10
0,0
00
Void Ratio, e
Verti
ca
l E
ffecti
ve S
tres
s, s
' v(p
sf)
Cc
Cas
agra
nd
e C
on
stru
ctio
n f
or
Pre
cons
olid
atio
n S
tres
s
6 of 6
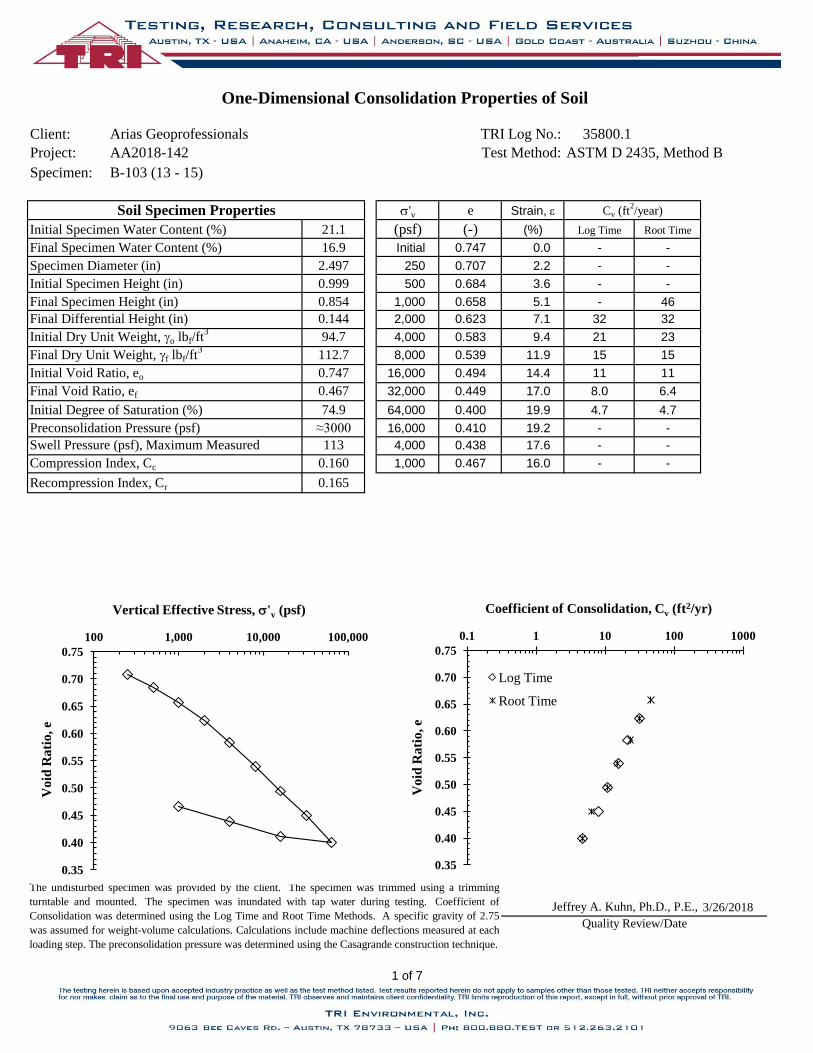
Client: Arias Geoprofessionals TRI Log No.: 35800.1
Project: AA2018-142 Test Method: ASTM D 2435, Method B
Specimen: B-103 (13 - 15)
s'v e Strain, e
21.1 (psf) (-) (%) Log Time Root Time
16.9 Initial 0.747 0.0 - -
2.497 250 0.707 2.2 - -
0.999 500 0.684 3.6 - -
0.854 1,000 0.658 5.1 - 46
0.144 2,000 0.623 7.1 32 32
94.7 4,000 0.583 9.4 21 23
112.7 8,000 0.539 11.9 15 15
0.747 16,000 0.494 14.4 11 11
0.467 32,000 0.449 17.0 8.0 6.4
74.9 64,000 0.400 19.9 4.7 4.7
≈3000 16,000 0.410 19.2 - -
113 4,000 0.438 17.6 - -
0.160 1,000 0.467 16.0 - -
0.165
3/26/2018
Initial Degree of Saturation (%)
Preconsolidation Pressure (psf)
Swell Pressure (psf), Maximum Measured
Final Dry Unit Weight, gf lbf/ft3
Final Specimen Water Content (%)
Initial Dry Unit Weight, go lbf/ft3
Cv (ft2/year)
Specimen Diameter (in)
Final Differential Height (in)
Initial Specimen Height (in)
Final Specimen Height (in)
Initial Void Ratio, eo
Final Void Ratio, ef
Jeffrey A. Kuhn, Ph.D., P.E.,
Compression Index, Cc
Recompression Index, Cr
The undisturbed specimen was provided by the client. The specimen was trimmed using a trimming
turntable and mounted. The specimen was inundated with tap water during testing. Coefficient of
Consolidation was determined using the Log Time and Root Time Methods. A specific gravity of 2.75
was assumed for weight-volume calculations. Calculations include machine deflections measured at each
loading step. The preconsolidation pressure was determined using the Casagrande construction technique.
Quality Review/Date
One-Dimensional Consolidation Properties of Soil
Soil Specimen Properties
Initial Specimen Water Content (%)
0.35
0.40
0.45
0.50
0.55
0.60
0.65
0.70
0.75
100 1,000 10,000 100,000
Void
Rati
o, e
Vertical Effective Stress, s'v (psf)
0.35
0.40
0.45
0.50
0.55
0.60
0.65
0.70
0.75
0.1 1 10 100 1000
Vo
id R
ati
o, e
Coefficient of Consolidation, Cv (ft2/yr)
Log Time
Root Time
0.3
5
0.4
0
0.4
5
0.5
0
0.5
5
0.6
0
0.6
5
0.7
0
0.7
5
10
01
,00
01
0,0
00
10
0,0
00
Void Ratio, e
Verti
ca
l E
ffecti
ve S
tres
s, s
' v(p
sf)
Cc
Cas
agra
nd
e C
on
stru
ctio
n f
or
Pre
cons
olid
atio
n S
tres
s
1 of 7
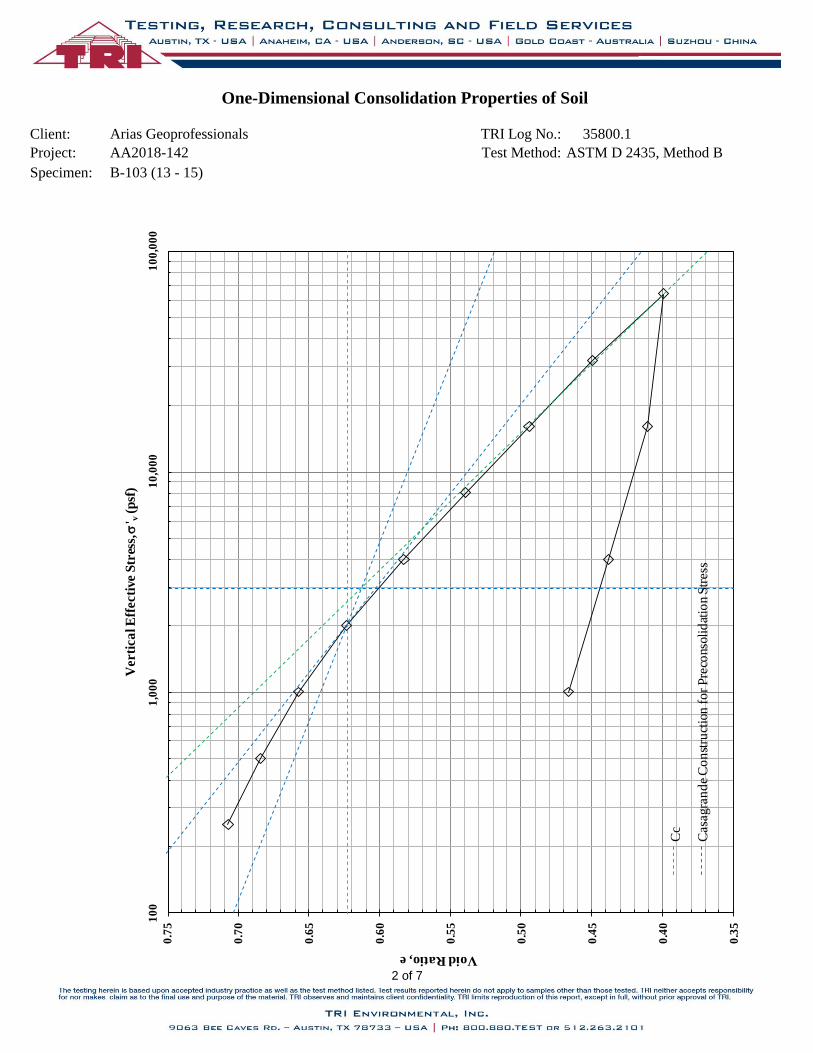
Client: Arias Geoprofessionals TRI Log No.: 35800.1
Project: AA2018-142 Test Method: ASTM D 2435, Method B
Specimen: B-103 (13 - 15)
One-Dimensional Consolidation Properties of Soil
0.3
5
0.4
0
0.4
5
0.5
0
0.5
5
0.6
0
0.6
5
0.7
0
0.7
5
10
01
,00
01
0,0
00
10
0,0
00
Void Ratio, e
Verti
ca
l E
ffecti
ve S
tres
s, s
' v(p
sf)
Cc
Cas
agra
nd
e C
on
stru
ctio
n f
or
Pre
cons
olid
atio
n S
tres
s
-
-
-
-
-
-
-
-
-
-
-
-
-
0.3
5
0.4
0
0.4
5
0.5
0
0.5
5
0.6
0
0.6
5
0.7
0
0.7
5
10
01
,00
01
0,0
00
10
0,0
00
Void Ratio, e
Verti
ca
l E
ffecti
ve S
tres
s, s
' v(p
sf)
Cc
Cas
agra
nd
e C
on
stru
ctio
n f
or
Pre
cons
olid
atio
n S
tres
s
2 of 7
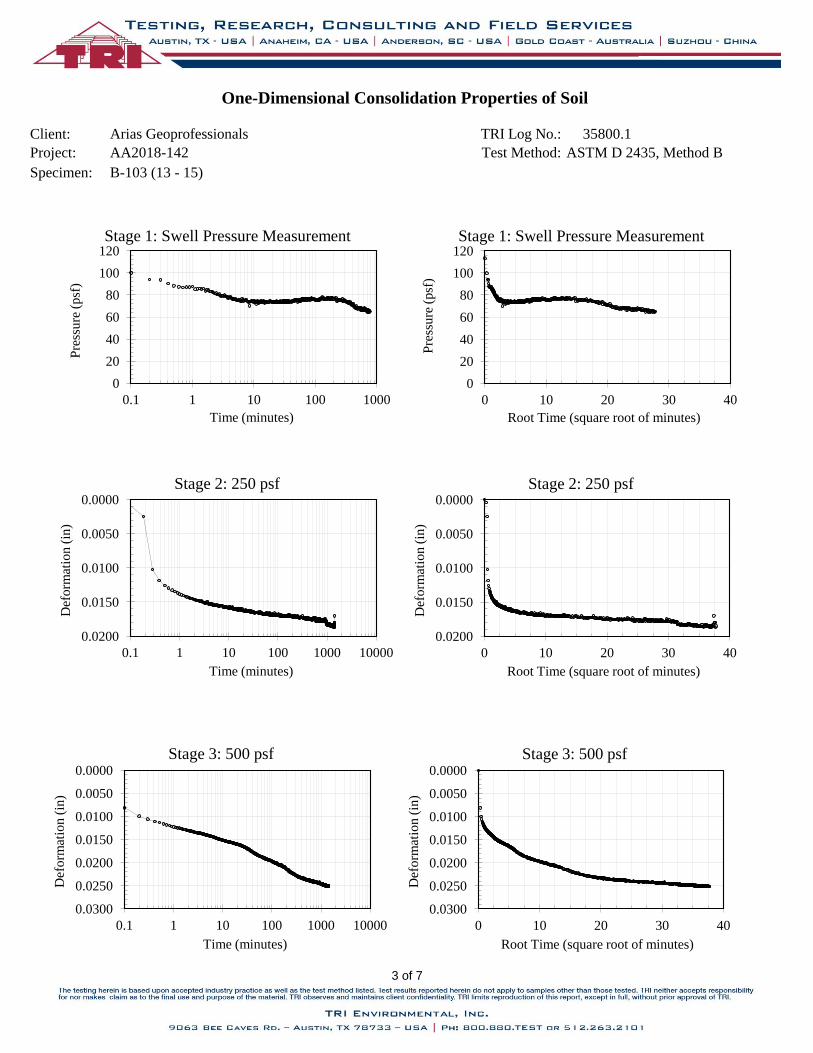
Client: Arias Geoprofessionals TRI Log No.: 35800.1
Project: AA2018-142 Test Method: ASTM D 2435, Method B
Specimen: B-103 (13 - 15)
One-Dimensional Consolidation Properties of Soil
0.3
5
0.4
0
0.4
5
0.5
0
0.5
5
0.6
0
0.6
5
0.7
0
0.7
5
10
01
,00
01
0,0
00
10
0,0
00
Void Ratio, e
Verti
ca
l E
ffecti
ve S
tres
s, s
' v(p
sf)
Cc
Cas
agra
nd
e C
on
stru
ctio
n f
or
Pre
cons
olid
atio
n S
tres
s
0
20
40
60
80
100
120
0.1 1 10 100 1000
Pre
ssure
(psf
)
Time (minutes)
Stage 1: Swell Pressure Measurement
0
20
40
60
80
100
120
0 10 20 30 40
Pre
ssure
(psf
) Root Time (square root of minutes)
Stage 1: Swell Pressure Measurement
0.0000
0.0050
0.0100
0.0150
0.0200
0.1 1 10 100 1000 10000
Def
orm
atio
n (
in)
Time (minutes)
Stage 2: 250 psf 0.0000
0.0050
0.0100
0.0150
0.0200
0 10 20 30 40
Def
orm
atio
n (
in)
Root Time (square root of minutes)
Stage 2: 250 psf
0.0000
0.0050
0.0100
0.0150
0.0200
0.0250
0.0300
0.1 1 10 100 1000 10000
Def
orm
atio
n (
in)
Time (minutes)
Stage 3: 500 psf 0.0000
0.0050
0.0100
0.0150
0.0200
0.0250
0.0300
0 10 20 30 40
Def
orm
atio
n (
in)
Root Time (square root of minutes)
Stage 3: 500 psf
0.3
5
0.4
0
0.4
5
0.5
0
0.5
5
0.6
0
0.6
5
0.7
0
0.7
5
10
01
,00
01
0,0
00
10
0,0
00
Void Ratio, e
Verti
ca
l E
ffecti
ve S
tres
s, s
' v(p
sf)
Cc
Cas
agra
nd
e C
on
stru
ctio
n f
or
Pre
cons
olid
atio
n S
tres
s
3 of 7
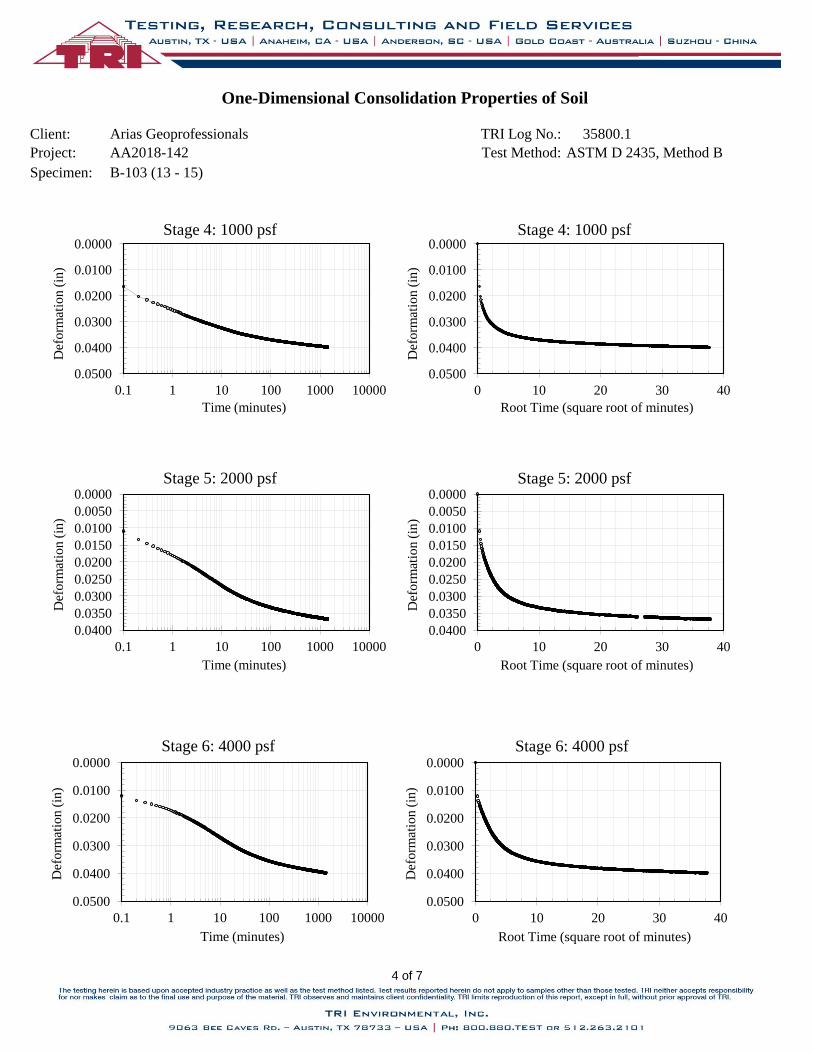
Client: Arias Geoprofessionals TRI Log No.: 35800.1
Project: AA2018-142 Test Method: ASTM D 2435, Method B
Specimen: B-103 (13 - 15)
One-Dimensional Consolidation Properties of Soil
0.3
5
0.4
0
0.4
5
0.5
0
0.5
5
0.6
0
0.6
5
0.7
0
0.7
5
10
01
,00
01
0,0
00
10
0,0
00
Void Ratio, e
Verti
ca
l E
ffecti
ve S
tres
s, s
' v(p
sf)
Cc
Cas
agra
nd
e C
on
stru
ctio
n f
or
Pre
cons
olid
atio
n S
tres
s
0.0000
0.0100
0.0200
0.0300
0.0400
0.0500
0.1 1 10 100 1000 10000
Def
orm
atio
n (
in)
Time (minutes)
Stage 4: 1000 psf 0.0000
0.0100
0.0200
0.0300
0.0400
0.0500
0 10 20 30 40
Def
orm
atio
n (
in)
Root Time (square root of minutes)
Stage 4: 1000 psf
0.0000
0.0050
0.0100
0.0150
0.0200
0.0250
0.0300
0.0350
0.0400
0.1 1 10 100 1000 10000
Def
orm
atio
n (
in)
Time (minutes)
Stage 5: 2000 psf 0.0000
0.0050
0.0100
0.0150
0.0200
0.0250
0.0300
0.0350
0.0400
0 10 20 30 40
Def
orm
atio
n (
in)
Root Time (square root of minutes)
Stage 5: 2000 psf
0.0000
0.0100
0.0200
0.0300
0.0400
0.0500
0.1 1 10 100 1000 10000
Def
orm
atio
n (
in)
Time (minutes)
Stage 6: 4000 psf 0.0000
0.0100
0.0200
0.0300
0.0400
0.0500
0 10 20 30 40
Def
orm
atio
n (
in)
Root Time (square root of minutes)
Stage 6: 4000 psf 0
.35
0.4
0
0.4
5
0.5
0
0.5
5
0.6
0
0.6
5
0.7
0
0.7
5
10
01
,00
01
0,0
00
10
0,0
00
Void Ratio, e
Verti
ca
l E
ffecti
ve S
tres
s, s
' v(p
sf)
Cc
Cas
agra
nd
e C
on
stru
ctio
n f
or
Pre
cons
olid
atio
n S
tres
s
4 of 7
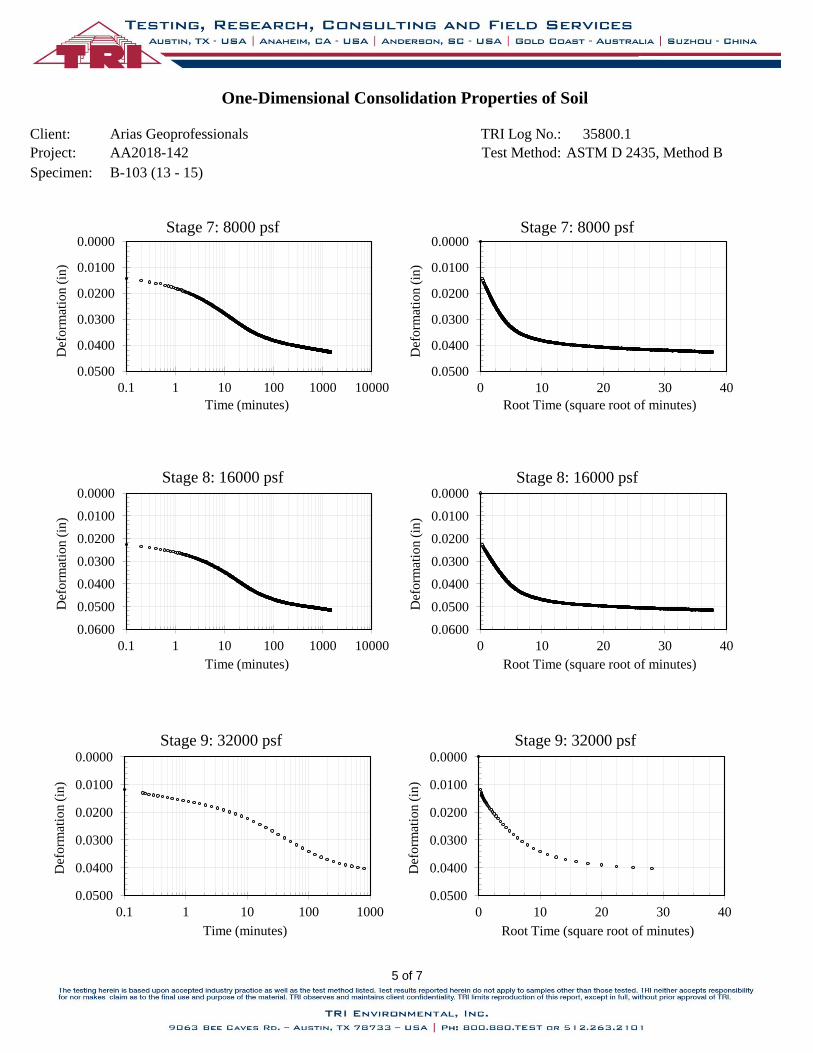
Client: Arias Geoprofessionals TRI Log No.: 35800.1
Project: AA2018-142 Test Method: ASTM D 2435, Method B
Specimen: B-103 (13 - 15)
One-Dimensional Consolidation Properties of Soil
0.3
5
0.4
0
0.4
5
0.5
0
0.5
5
0.6
0
0.6
5
0.7
0
0.7
5
10
01
,00
01
0,0
00
10
0,0
00
Void Ratio, e
Verti
ca
l E
ffecti
ve S
tres
s, s
' v(p
sf)
Cc
Cas
agra
nd
e C
on
stru
ctio
n f
or
Pre
cons
olid
atio
n S
tres
s
0.0000
0.0100
0.0200
0.0300
0.0400
0.0500
0.1 1 10 100 1000 10000
Def
orm
atio
n (
in)
Time (minutes)
Stage 7: 8000 psf 0.0000
0.0100
0.0200
0.0300
0.0400
0.0500
0 10 20 30 40
Def
orm
atio
n (
in)
Root Time (square root of minutes)
Stage 7: 8000 psf
0.0000
0.0100
0.0200
0.0300
0.0400
0.0500
0.0600
0.1 1 10 100 1000 10000
Def
orm
atio
n (
in)
Time (minutes)
Stage 8: 16000 psf 0.0000
0.0100
0.0200
0.0300
0.0400
0.0500
0.0600
0 10 20 30 40
Def
orm
atio
n (
in)
Root Time (square root of minutes)
Stage 8: 16000 psf
0.0000
0.0100
0.0200
0.0300
0.0400
0.0500
0.1 1 10 100 1000
Def
orm
atio
n (
in)
Time (minutes)
Stage 9: 32000 psf 0.0000
0.0100
0.0200
0.0300
0.0400
0.0500
0 10 20 30 40
Def
orm
atio
n (
in)
Root Time (square root of minutes)
Stage 9: 32000 psf 0
.35
0.4
0
0.4
5
0.5
0
0.5
5
0.6
0
0.6
5
0.7
0
0.7
5
10
01
,00
01
0,0
00
10
0,0
00
Void Ratio, e
Verti
ca
l E
ffecti
ve S
tres
s, s
' v(p
sf)
Cc
Cas
agra
nd
e C
on
stru
ctio
n f
or
Pre
cons
olid
atio
n S
tres
s
5 of 7
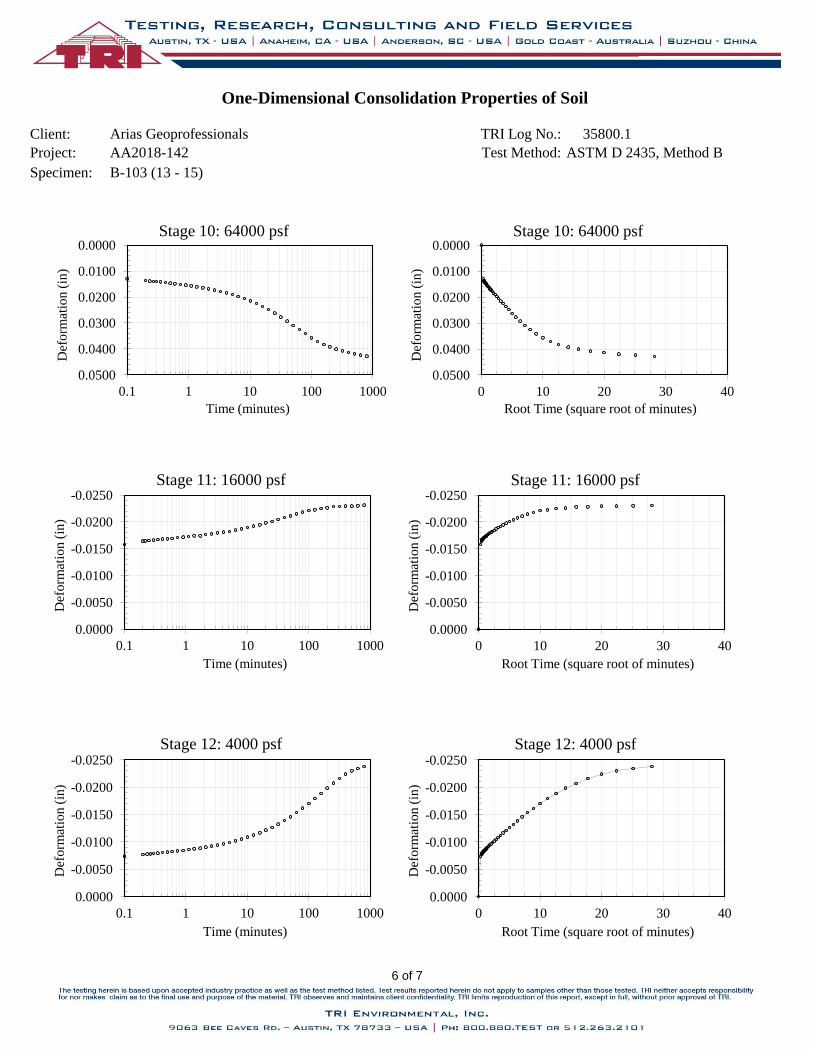
Client: Arias Geoprofessionals TRI Log No.: 35800.1
Project: AA2018-142 Test Method: ASTM D 2435, Method B
Specimen: B-103 (13 - 15)
One-Dimensional Consolidation Properties of Soil
0.3
5
0.4
0
0.4
5
0.5
0
0.5
5
0.6
0
0.6
5
0.7
0
0.7
5
10
01
,00
01
0,0
00
10
0,0
00
Void Ratio, e
Verti
ca
l E
ffecti
ve S
tres
s, s
' v(p
sf)
Cc
Cas
agra
nd
e C
on
stru
ctio
n f
or
Pre
cons
olid
atio
n S
tres
s
0.0000
0.0100
0.0200
0.0300
0.0400
0.0500
0.1 1 10 100 1000
Def
orm
atio
n (
in)
Time (minutes)
Stage 10: 64000 psf 0.0000
0.0100
0.0200
0.0300
0.0400
0.0500
0 10 20 30 40
Def
orm
atio
n (
in)
Root Time (square root of minutes)
Stage 10: 64000 psf
-0.0250
-0.0200
-0.0150
-0.0100
-0.0050
0.0000
0.1 1 10 100 1000
Def
orm
atio
n (
in)
Time (minutes)
Stage 11: 16000 psf -0.0250
-0.0200
-0.0150
-0.0100
-0.0050
0.0000
0 10 20 30 40
Def
orm
atio
n (
in)
Root Time (square root of minutes)
Stage 11: 16000 psf
-0.0250
-0.0200
-0.0150
-0.0100
-0.0050
0.0000
0.1 1 10 100 1000
Def
orm
atio
n (
in)
Time (minutes)
Stage 12: 4000 psf -0.0250
-0.0200
-0.0150
-0.0100
-0.0050
0.0000
0 10 20 30 40
Def
orm
atio
n (
in)
Root Time (square root of minutes)
Stage 12: 4000 psf 0
.35
0.4
0
0.4
5
0.5
0
0.5
5
0.6
0
0.6
5
0.7
0
0.7
5
10
01
,00
01
0,0
00
10
0,0
00
Void Ratio, e
Verti
ca
l E
ffecti
ve S
tres
s, s
' v(p
sf)
Cc
Cas
agra
nd
e C
on
stru
ctio
n f
or
Pre
cons
olid
atio
n S
tres
s
6 of 7
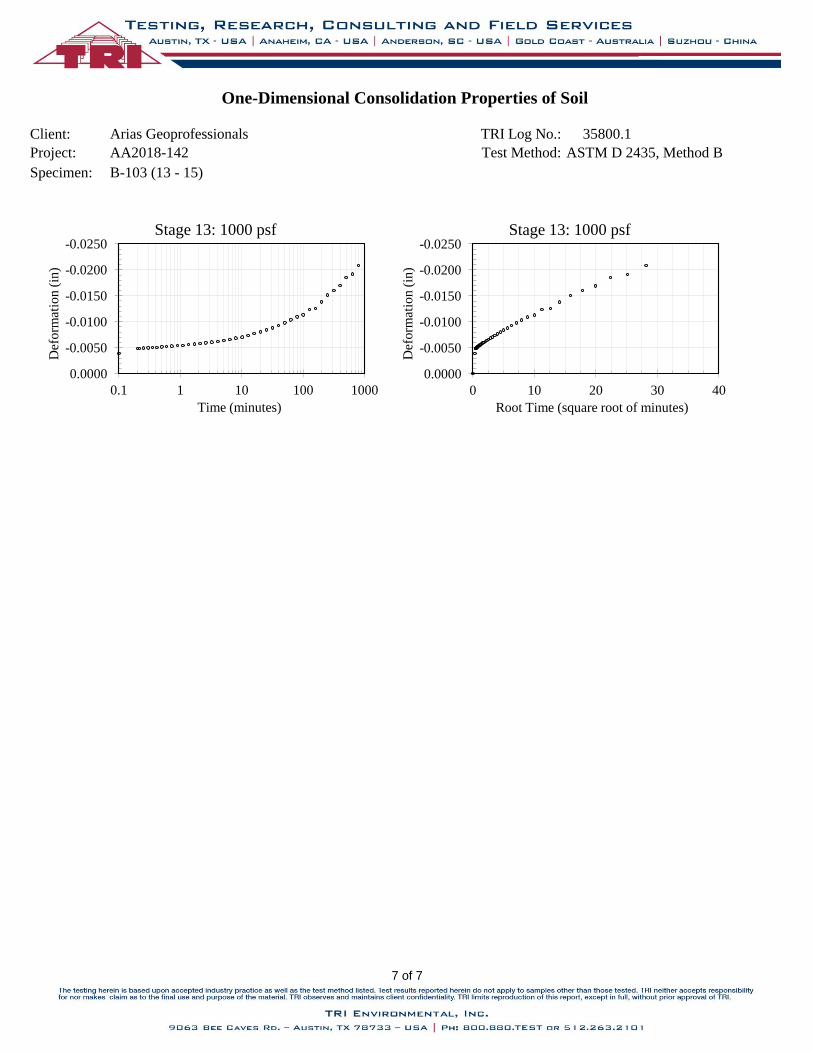
Client: Arias Geoprofessionals TRI Log No.: 35800.1
Project: AA2018-142 Test Method: ASTM D 2435, Method B
Specimen: B-103 (13 - 15)
One-Dimensional Consolidation Properties of Soil
0.3
5
0.4
0
0.4
5
0.5
0
0.5
5
0.6
0
0.6
5
0.7
0
0.7
5
10
01
,00
01
0,0
00
10
0,0
00
Void Ratio, e
Verti
ca
l E
ffecti
ve S
tres
s, s
' v(p
sf)
Cc
Cas
agra
nd
e C
on
stru
ctio
n f
or
Pre
cons
olid
atio
n S
tres
s
-0.0250
-0.0200
-0.0150
-0.0100
-0.0050
0.0000
0.1 1 10 100 1000
Def
orm
atio
n (
in)
Time (minutes)
Stage 13: 1000 psf -0.0250
-0.0200
-0.0150
-0.0100
-0.0050
0.0000
0 10 20 30 40
Def
orm
atio
n (
in)
Root Time (square root of minutes)
Stage 13: 1000 psf
0.3
5
0.4
0
0.4
5
0.5
0
0.5
5
0.6
0
0.6
5
0.7
0
0.7
5
10
01
,00
01
0,0
00
10
0,0
00
Void Ratio, e
Verti
ca
l E
ffecti
ve S
tres
s, s
' v(p
sf)
Cc
Cas
agra
nd
e C
on
stru
ctio
n f
or
Pre
cons
olid
atio
n S
tres
s
7 of 7
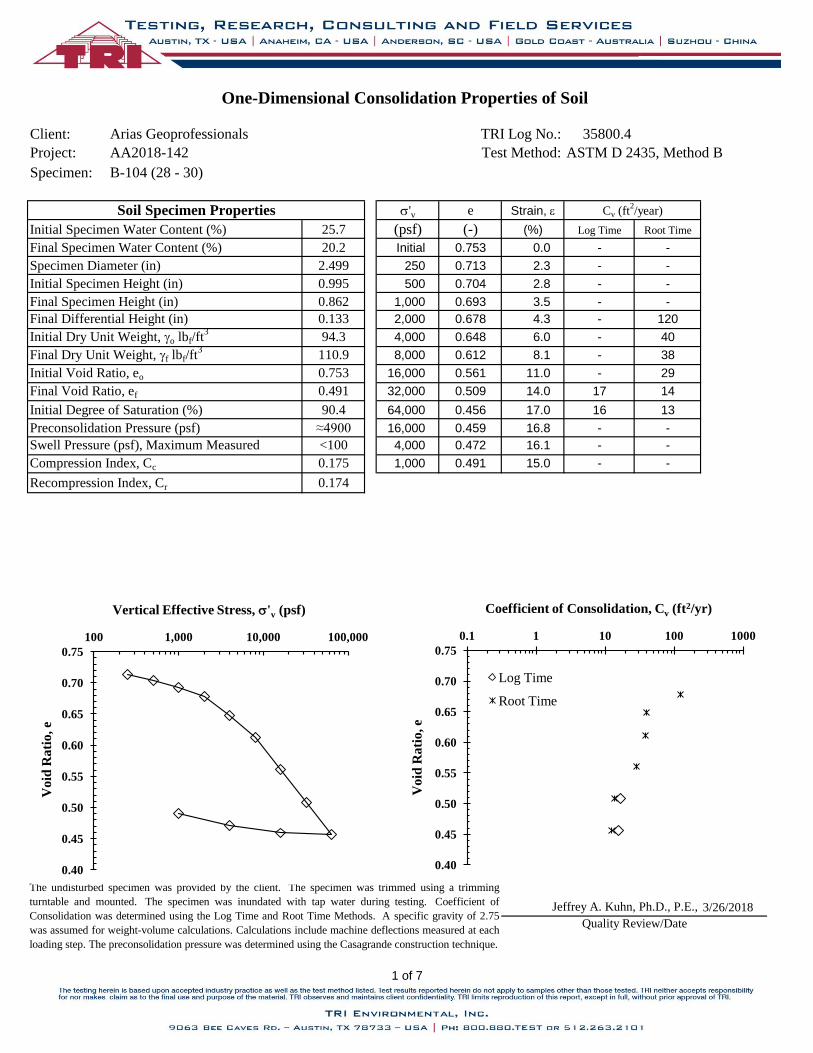
Client: Arias Geoprofessionals TRI Log No.: 35800.4
Project: AA2018-142 Test Method: ASTM D 2435, Method B
Specimen: B-104 (28 - 30)
s'v e Strain, e
25.7 (psf) (-) (%) Log Time Root Time
20.2 Initial 0.753 0.0 - -
2.499 250 0.713 2.3 - -
0.995 500 0.704 2.8 - -
0.862 1,000 0.693 3.5 - -
0.133 2,000 0.678 4.3 - 120
94.3 4,000 0.648 6.0 - 40
110.9 8,000 0.612 8.1 - 38
0.753 16,000 0.561 11.0 - 29
0.491 32,000 0.509 14.0 17 14
90.4 64,000 0.456 17.0 16 13
≈4900 16,000 0.459 16.8 - -
<100 4,000 0.472 16.1 - -
0.175 1,000 0.491 15.0 - -
0.174
3/26/2018
Initial Degree of Saturation (%)
Preconsolidation Pressure (psf)
Swell Pressure (psf), Maximum Measured
Final Dry Unit Weight, gf lbf/ft3
Final Specimen Water Content (%)
Initial Dry Unit Weight, go lbf/ft3
Cv (ft2/year)
Specimen Diameter (in)
Final Differential Height (in)
Initial Specimen Height (in)
Final Specimen Height (in)
Initial Void Ratio, eo
Final Void Ratio, ef
Jeffrey A. Kuhn, Ph.D., P.E.,
Compression Index, Cc
Recompression Index, Cr
The undisturbed specimen was provided by the client. The specimen was trimmed using a trimming
turntable and mounted. The specimen was inundated with tap water during testing. Coefficient of
Consolidation was determined using the Log Time and Root Time Methods. A specific gravity of 2.75
was assumed for weight-volume calculations. Calculations include machine deflections measured at each
loading step. The preconsolidation pressure was determined using the Casagrande construction technique.
Quality Review/Date
One-Dimensional Consolidation Properties of Soil
Soil Specimen Properties
Initial Specimen Water Content (%)
0.40
0.45
0.50
0.55
0.60
0.65
0.70
0.75
100 1,000 10,000 100,000
Void
Rati
o, e
Vertical Effective Stress, s'v (psf)
0.40
0.45
0.50
0.55
0.60
0.65
0.70
0.75
0.1 1 10 100 1000
Vo
id R
ati
o, e
Coefficient of Consolidation, Cv (ft2/yr)
Log Time
Root Time
0.4
5
0.5
0
0.5
5
0.6
0
0.6
5
0.7
0
0.7
5
10
01
,00
01
0,0
00
10
0,0
00
Void Ratio, e
Ver
tica
l Eff
ecti
ve S
tres
s, s
' v(p
sf)
Cc
Cas
agra
nd
e C
on
stru
ctio
n f
or
Pre
cons
olid
atio
n S
tres
s
1 of 7
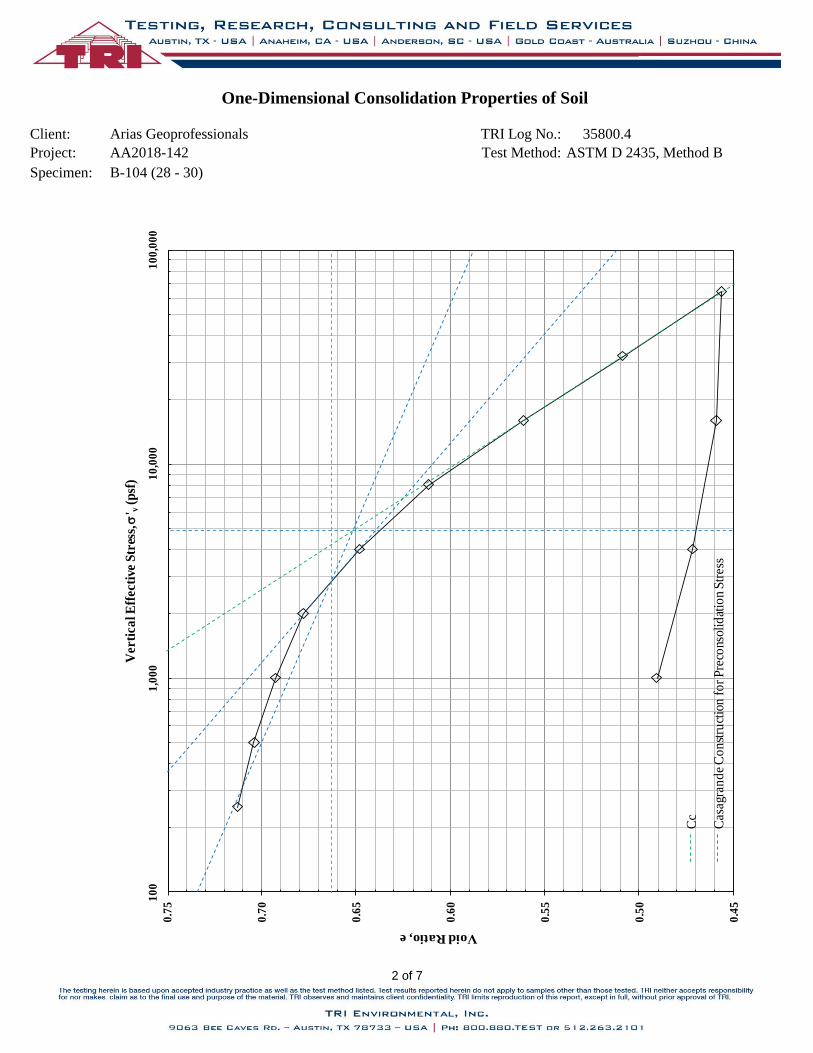
Client: Arias Geoprofessionals TRI Log No.: 35800.4
Project: AA2018-142 Test Method: ASTM D 2435, Method B
Specimen: B-104 (28 - 30)
One-Dimensional Consolidation Properties of Soil
0.4
5
0.5
0
0.5
5
0.6
0
0.6
5
0.7
0
0.7
5
10
01
,00
01
0,0
00
10
0,0
00
Void Ratio, e
Ver
tica
l Eff
ecti
ve S
tres
s, s
' v(p
sf)
Cc
Cas
agra
nd
e C
on
stru
ctio
n f
or
Pre
cons
olid
atio
n S
tres
s
-
-
-
-
-
-
-
-
-
-
-
-
-
0.4
5
0.5
0
0.5
5
0.6
0
0.6
5
0.7
0
0.7
5
10
01
,00
01
0,0
00
10
0,0
00
Void Ratio, e
Ver
tica
l Eff
ecti
ve S
tres
s, s
' v(p
sf)
Cc
Cas
agra
nd
e C
on
stru
ctio
n f
or
Pre
cons
olid
atio
n S
tres
s
2 of 7
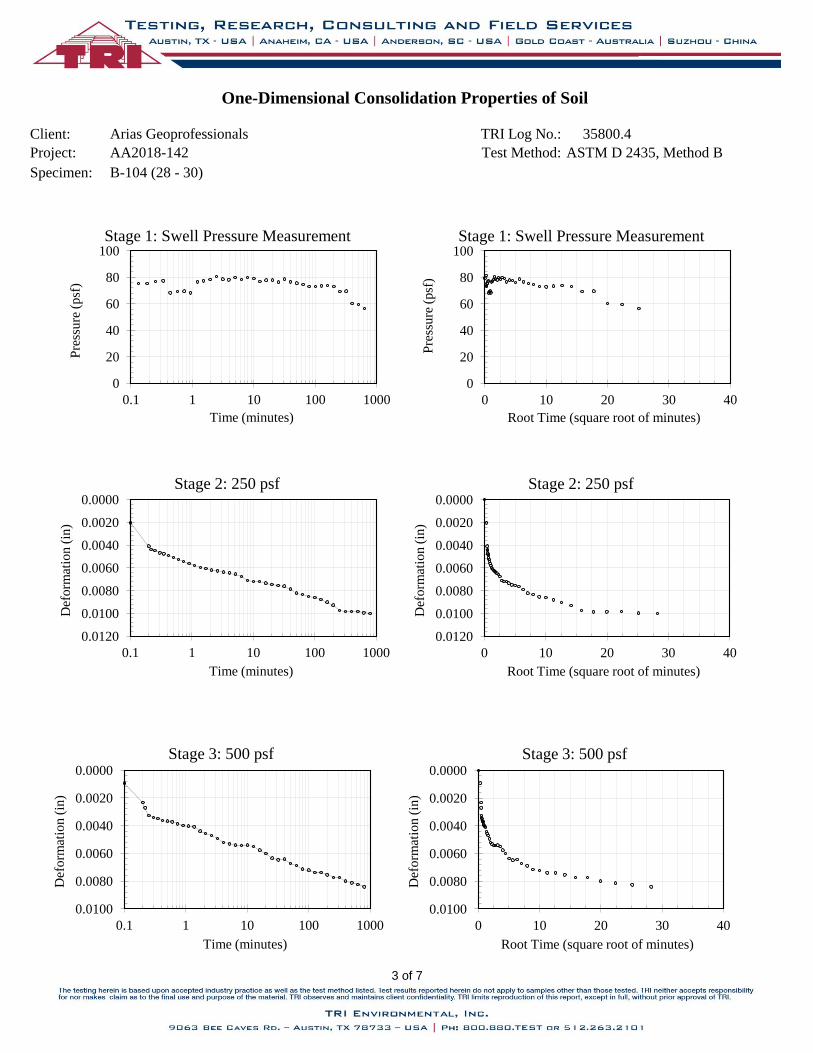
Client: Arias Geoprofessionals TRI Log No.: 35800.4
Project: AA2018-142 Test Method: ASTM D 2435, Method B
Specimen: B-104 (28 - 30)
One-Dimensional Consolidation Properties of Soil
0.4
5
0.5
0
0.5
5
0.6
0
0.6
5
0.7
0
0.7
5
10
01
,00
01
0,0
00
10
0,0
00
Void Ratio, e
Ver
tica
l Eff
ecti
ve S
tres
s, s
' v(p
sf)
Cc
Cas
agra
nd
e C
on
stru
ctio
n f
or
Pre
cons
olid
atio
n S
tres
s
0
20
40
60
80
100
0.1 1 10 100 1000
Pre
ssure
(psf
)
Time (minutes)
Stage 1: Swell Pressure Measurement
0
20
40
60
80
100
0 10 20 30 40
Pre
ssure
(psf
) Root Time (square root of minutes)
Stage 1: Swell Pressure Measurement
0.0000
0.0020
0.0040
0.0060
0.0080
0.0100
0.0120
0.1 1 10 100 1000
Def
orm
atio
n (
in)
Time (minutes)
Stage 2: 250 psf 0.0000
0.0020
0.0040
0.0060
0.0080
0.0100
0.0120
0 10 20 30 40
Def
orm
atio
n (
in)
Root Time (square root of minutes)
Stage 2: 250 psf
0.0000
0.0020
0.0040
0.0060
0.0080
0.0100
0.1 1 10 100 1000
Def
orm
atio
n (
in)
Time (minutes)
Stage 3: 500 psf 0.0000
0.0020
0.0040
0.0060
0.0080
0.0100
0 10 20 30 40
Def
orm
atio
n (
in)
Root Time (square root of minutes)
Stage 3: 500 psf
0.4
5
0.5
0
0.5
5
0.6
0
0.6
5
0.7
0
0.7
5
10
01
,00
01
0,0
00
10
0,0
00
Void Ratio, e
Ver
tica
l Eff
ecti
ve S
tres
s, s
' v(p
sf)
Cc
Cas
agra
nd
e C
on
stru
ctio
n f
or
Pre
cons
olid
atio
n S
tres
s
3 of 7
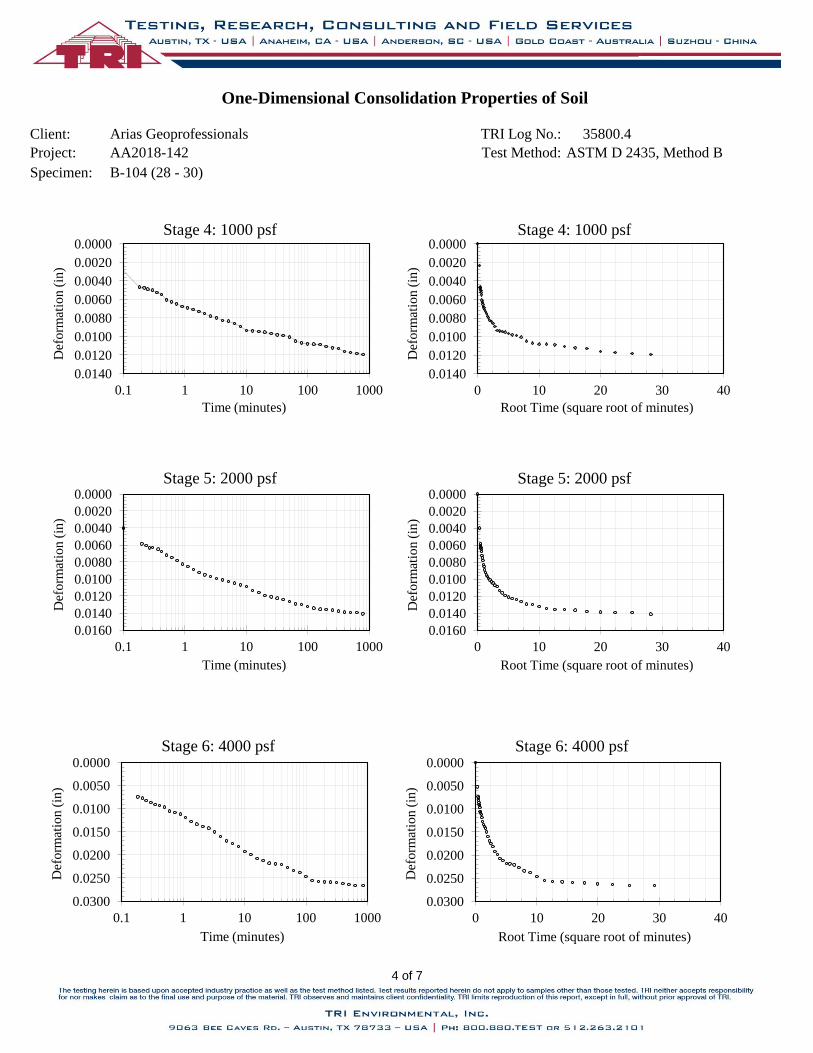
Client: Arias Geoprofessionals TRI Log No.: 35800.4
Project: AA2018-142 Test Method: ASTM D 2435, Method B
Specimen: B-104 (28 - 30)
One-Dimensional Consolidation Properties of Soil
0.4
5
0.5
0
0.5
5
0.6
0
0.6
5
0.7
0
0.7
5
10
01
,00
01
0,0
00
10
0,0
00
Void Ratio, e
Ver
tica
l Eff
ecti
ve S
tres
s, s
' v(p
sf)
Cc
Cas
agra
nd
e C
on
stru
ctio
n f
or
Pre
cons
olid
atio
n S
tres
s
0.0000
0.0020
0.0040
0.0060
0.0080
0.0100
0.0120
0.0140
0.1 1 10 100 1000
Def
orm
atio
n (
in)
Time (minutes)
Stage 4: 1000 psf 0.0000
0.0020
0.0040
0.0060
0.0080
0.0100
0.0120
0.0140
0 10 20 30 40
Def
orm
atio
n (
in)
Root Time (square root of minutes)
Stage 4: 1000 psf
0.0000
0.0020
0.0040
0.0060
0.0080
0.0100
0.0120
0.0140
0.0160
0.1 1 10 100 1000
Def
orm
atio
n (
in)
Time (minutes)
Stage 5: 2000 psf 0.0000
0.0020
0.0040
0.0060
0.0080
0.0100
0.0120
0.0140
0.0160
0 10 20 30 40
Def
orm
atio
n (
in)
Root Time (square root of minutes)
Stage 5: 2000 psf
0.0000
0.0050
0.0100
0.0150
0.0200
0.0250
0.0300
0.1 1 10 100 1000
Def
orm
atio
n (
in)
Time (minutes)
Stage 6: 4000 psf 0.0000
0.0050
0.0100
0.0150
0.0200
0.0250
0.0300
0 10 20 30 40
Def
orm
atio
n (
in)
Root Time (square root of minutes)
Stage 6: 4000 psf 0
.45
0.5
0
0.5
5
0.6
0
0.6
5
0.7
0
0.7
5
10
01
,00
01
0,0
00
10
0,0
00
Void Ratio, e
Ver
tica
l Eff
ecti
ve S
tres
s, s
' v(p
sf)
Cc
Cas
agra
nd
e C
on
stru
ctio
n f
or
Pre
cons
olid
atio
n S
tres
s
4 of 7
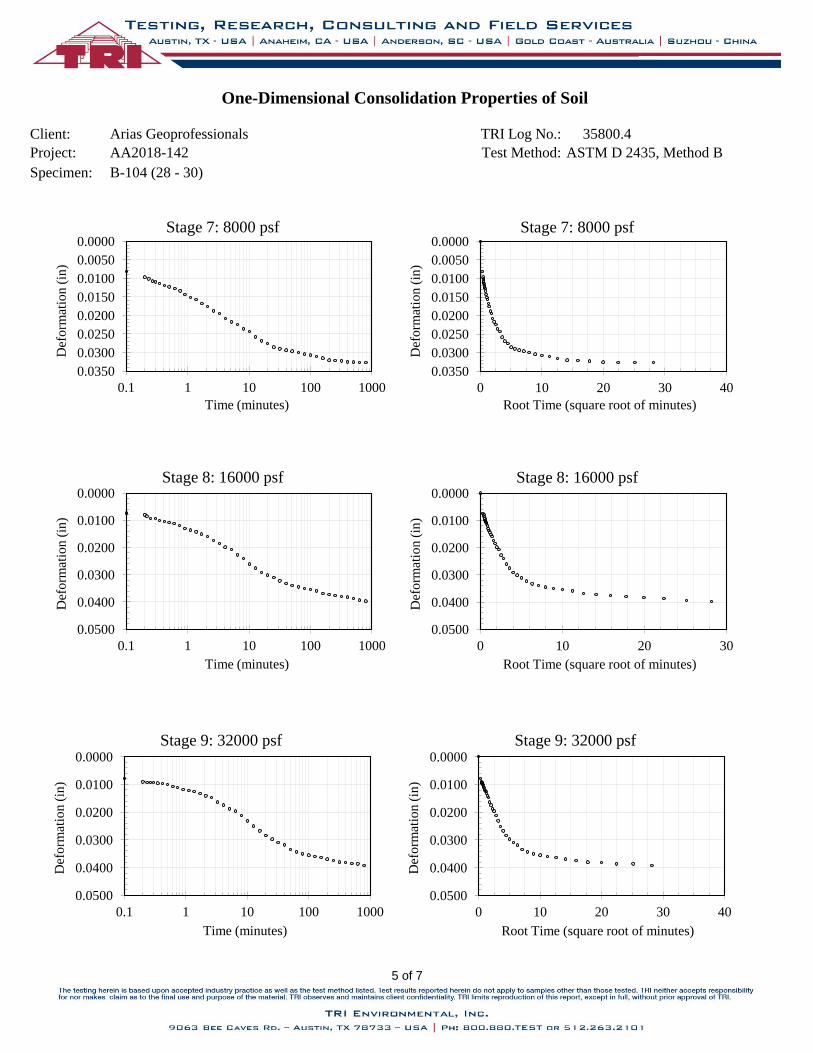
Client: Arias Geoprofessionals TRI Log No.: 35800.4
Project: AA2018-142 Test Method: ASTM D 2435, Method B
Specimen: B-104 (28 - 30)
One-Dimensional Consolidation Properties of Soil
0.4
5
0.5
0
0.5
5
0.6
0
0.6
5
0.7
0
0.7
5
10
01
,00
01
0,0
00
10
0,0
00
Void Ratio, e
Ver
tica
l Eff
ecti
ve S
tres
s, s
' v(p
sf)
Cc
Cas
agra
nd
e C
on
stru
ctio
n f
or
Pre
cons
olid
atio
n S
tres
s
0.0000
0.0050
0.0100
0.0150
0.0200
0.0250
0.0300
0.0350
0.1 1 10 100 1000
Def
orm
atio
n (
in)
Time (minutes)
Stage 7: 8000 psf 0.0000
0.0050
0.0100
0.0150
0.0200
0.0250
0.0300
0.0350
0 10 20 30 40
Def
orm
atio
n (
in)
Root Time (square root of minutes)
Stage 7: 8000 psf
0.0000
0.0100
0.0200
0.0300
0.0400
0.0500
0.1 1 10 100 1000
Def
orm
atio
n (
in)
Time (minutes)
Stage 8: 16000 psf 0.0000
0.0100
0.0200
0.0300
0.0400
0.0500
0 10 20 30
Def
orm
atio
n (
in)
Root Time (square root of minutes)
Stage 8: 16000 psf
0.0000
0.0100
0.0200
0.0300
0.0400
0.0500
0.1 1 10 100 1000
Def
orm
atio
n (
in)
Time (minutes)
Stage 9: 32000 psf 0.0000
0.0100
0.0200
0.0300
0.0400
0.0500
0 10 20 30 40
Def
orm
atio
n (
in)
Root Time (square root of minutes)
Stage 9: 32000 psf 0
.45
0.5
0
0.5
5
0.6
0
0.6
5
0.7
0
0.7
5
10
01
,00
01
0,0
00
10
0,0
00
Void Ratio, e
Ver
tica
l Eff
ecti
ve S
tres
s, s
' v(p
sf)
Cc
Cas
agra
nd
e C
on
stru
ctio
n f
or
Pre
cons
olid
atio
n S
tres
s
5 of 7
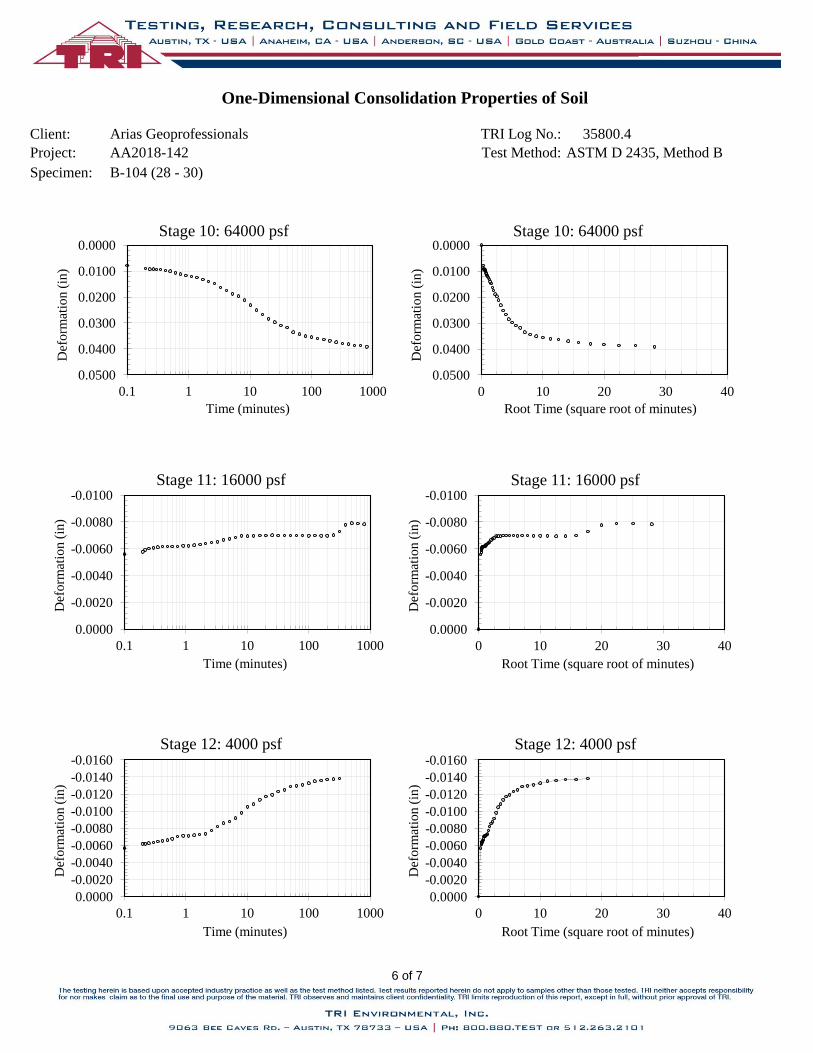
Client: Arias Geoprofessionals TRI Log No.: 35800.4
Project: AA2018-142 Test Method: ASTM D 2435, Method B
Specimen: B-104 (28 - 30)
One-Dimensional Consolidation Properties of Soil
0.4
5
0.5
0
0.5
5
0.6
0
0.6
5
0.7
0
0.7
5
10
01
,00
01
0,0
00
10
0,0
00
Void Ratio, e
Ver
tica
l Eff
ecti
ve S
tres
s, s
' v(p
sf)
Cc
Cas
agra
nd
e C
on
stru
ctio
n f
or
Pre
cons
olid
atio
n S
tres
s
0.0000
0.0100
0.0200
0.0300
0.0400
0.0500
0.1 1 10 100 1000
Def
orm
atio
n (
in)
Time (minutes)
Stage 10: 64000 psf 0.0000
0.0100
0.0200
0.0300
0.0400
0.0500
0 10 20 30 40
Def
orm
atio
n (
in)
Root Time (square root of minutes)
Stage 10: 64000 psf
-0.0100
-0.0080
-0.0060
-0.0040
-0.0020
0.0000
0.1 1 10 100 1000
Def
orm
atio
n (
in)
Time (minutes)
Stage 11: 16000 psf -0.0100
-0.0080
-0.0060
-0.0040
-0.0020
0.0000
0 10 20 30 40
Def
orm
atio
n (
in)
Root Time (square root of minutes)
Stage 11: 16000 psf
-0.0160
-0.0140
-0.0120
-0.0100
-0.0080
-0.0060
-0.0040
-0.0020
0.0000
0.1 1 10 100 1000
Def
orm
atio
n (
in)
Time (minutes)
Stage 12: 4000 psf -0.0160
-0.0140
-0.0120
-0.0100
-0.0080
-0.0060
-0.0040
-0.0020
0.0000
0 10 20 30 40
Def
orm
atio
n (
in)
Root Time (square root of minutes)
Stage 12: 4000 psf 0
.45
0.5
0
0.5
5
0.6
0
0.6
5
0.7
0
0.7
5
10
01
,00
01
0,0
00
10
0,0
00
Void Ratio, e
Ver
tica
l Eff
ecti
ve S
tres
s, s
' v(p
sf)
Cc
Cas
agra
nd
e C
on
stru
ctio
n f
or
Pre
cons
olid
atio
n S
tres
s
6 of 7
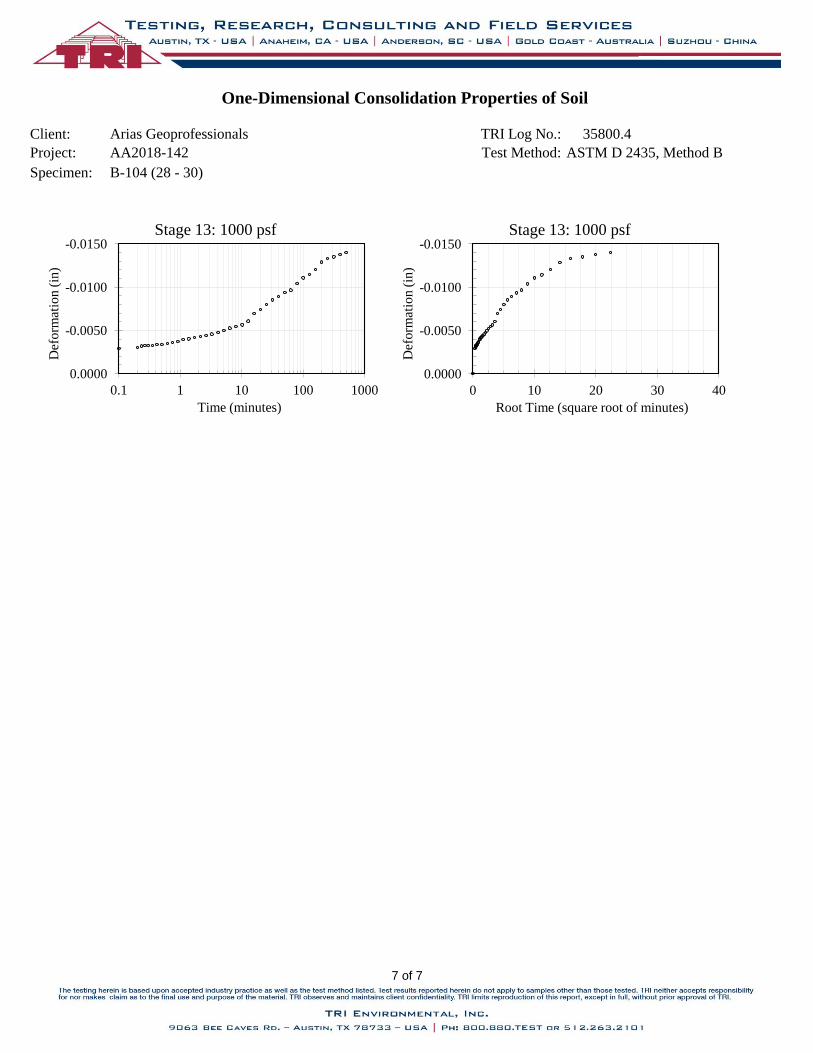
Client: Arias Geoprofessionals TRI Log No.: 35800.4
Project: AA2018-142 Test Method: ASTM D 2435, Method B
Specimen: B-104 (28 - 30)
One-Dimensional Consolidation Properties of Soil
0.4
5
0.5
0
0.5
5
0.6
0
0.6
5
0.7
0
0.7
5
10
01
,00
01
0,0
00
10
0,0
00
Void Ratio, e
Ver
tica
l Eff
ecti
ve S
tres
s, s
' v(p
sf)
Cc
Cas
agra
nd
e C
on
stru
ctio
n f
or
Pre
cons
olid
atio
n S
tres
s
-0.0150
-0.0100
-0.0050
0.0000
0.1 1 10 100 1000
Def
orm
atio
n (
in)
Time (minutes)
Stage 13: 1000 psf -0.0150
-0.0100
-0.0050
0.0000
0 10 20 30 40
Def
orm
atio
n (
in)
Root Time (square root of minutes)
Stage 13: 1000 psf
0.4
5
0.5
0
0.5
5
0.6
0
0.6
5
0.7
0
0.7
5
10
01
,00
01
0,0
00
10
0,0
00
Void Ratio, e
Ver
tica
l Eff
ecti
ve S
tres
s, s
' v(p
sf)
Cc
Cas
agra
nd
e C
on
stru
ctio
n f
or
Pre
cons
olid
atio
n S
tres
s
7 of 7
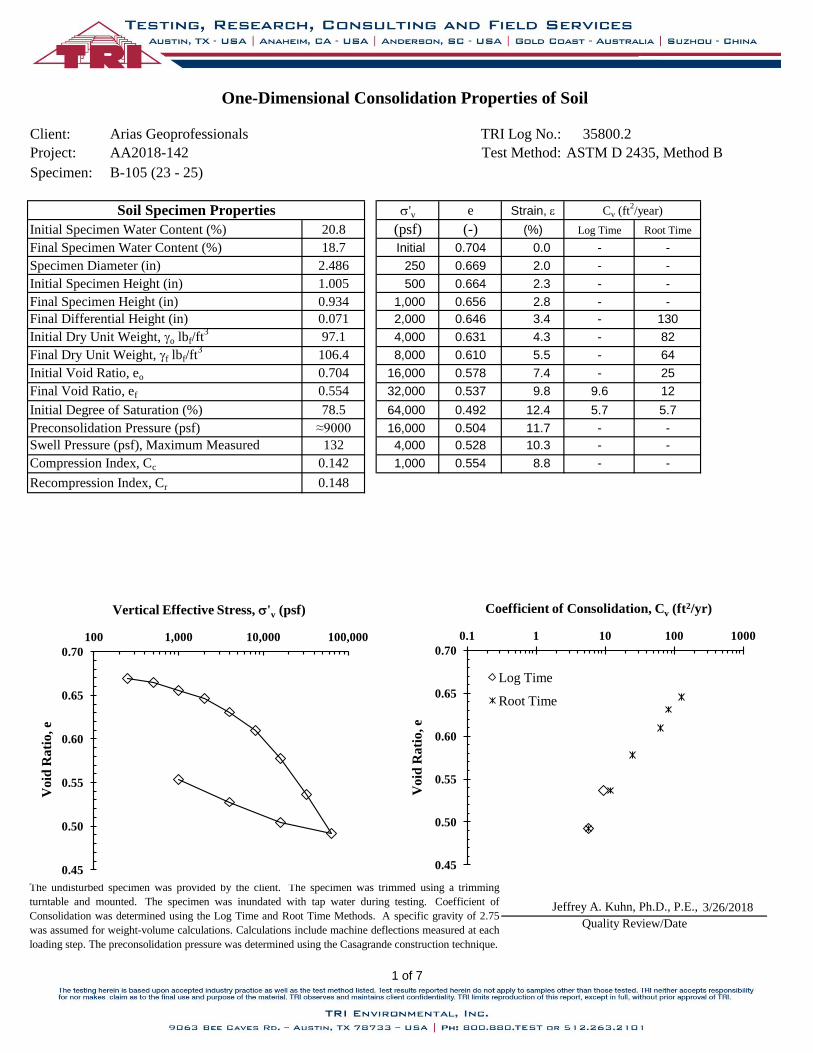
Client: Arias Geoprofessionals TRI Log No.: 35800.2
Project: AA2018-142 Test Method: ASTM D 2435, Method B
Specimen: B-105 (23 - 25)
s'v e Strain, e
20.8 (psf) (-) (%) Log Time Root Time
18.7 Initial 0.704 0.0 - -
2.486 250 0.669 2.0 - -
1.005 500 0.664 2.3 - -
0.934 1,000 0.656 2.8 - -
0.071 2,000 0.646 3.4 - 130
97.1 4,000 0.631 4.3 - 82
106.4 8,000 0.610 5.5 - 64
0.704 16,000 0.578 7.4 - 25
0.554 32,000 0.537 9.8 9.6 12
78.5 64,000 0.492 12.4 5.7 5.7
≈9000 16,000 0.504 11.7 - -
132 4,000 0.528 10.3 - -
0.142 1,000 0.554 8.8 - -
0.148
3/26/2018
Initial Void Ratio, eo
Final Void Ratio, ef
Jeffrey A. Kuhn, Ph.D., P.E.,
Compression Index, Cc
Recompression Index, Cr
The undisturbed specimen was provided by the client. The specimen was trimmed using a trimming
turntable and mounted. The specimen was inundated with tap water during testing. Coefficient of
Consolidation was determined using the Log Time and Root Time Methods. A specific gravity of 2.75
was assumed for weight-volume calculations. Calculations include machine deflections measured at each
loading step. The preconsolidation pressure was determined using the Casagrande construction technique.
Quality Review/Date
One-Dimensional Consolidation Properties of Soil
Soil Specimen Properties
Initial Specimen Water Content (%)
Specimen Diameter (in)
Final Differential Height (in)
Initial Specimen Height (in)
Final Specimen Height (in)
Initial Degree of Saturation (%)
Preconsolidation Pressure (psf)
Swell Pressure (psf), Maximum Measured
Final Dry Unit Weight, gf lbf/ft3
Final Specimen Water Content (%)
Initial Dry Unit Weight, go lbf/ft3
Cv (ft2/year)
0.45
0.50
0.55
0.60
0.65
0.70
100 1,000 10,000 100,000
Void
Rati
o, e
Vertical Effective Stress, s'v (psf)
0.45
0.50
0.55
0.60
0.65
0.70
0.1 1 10 100 1000
Vo
id R
ati
o, e
Coefficient of Consolidation, Cv (ft2/yr)
Log Time
Root Time
0.4
5
0.5
0
0.5
5
0.6
0
0.6
5
0.7
0
10
01
,00
01
0,0
00
10
0,0
00
Void Ratio, e
Verti
ca
l E
ffecti
ve S
tres
s, s
' v(p
sf)
Cc
Cas
agra
nd
e C
on
stru
ctio
n f
or
Pre
cons
olid
atio
n S
tres
s
1 of 7
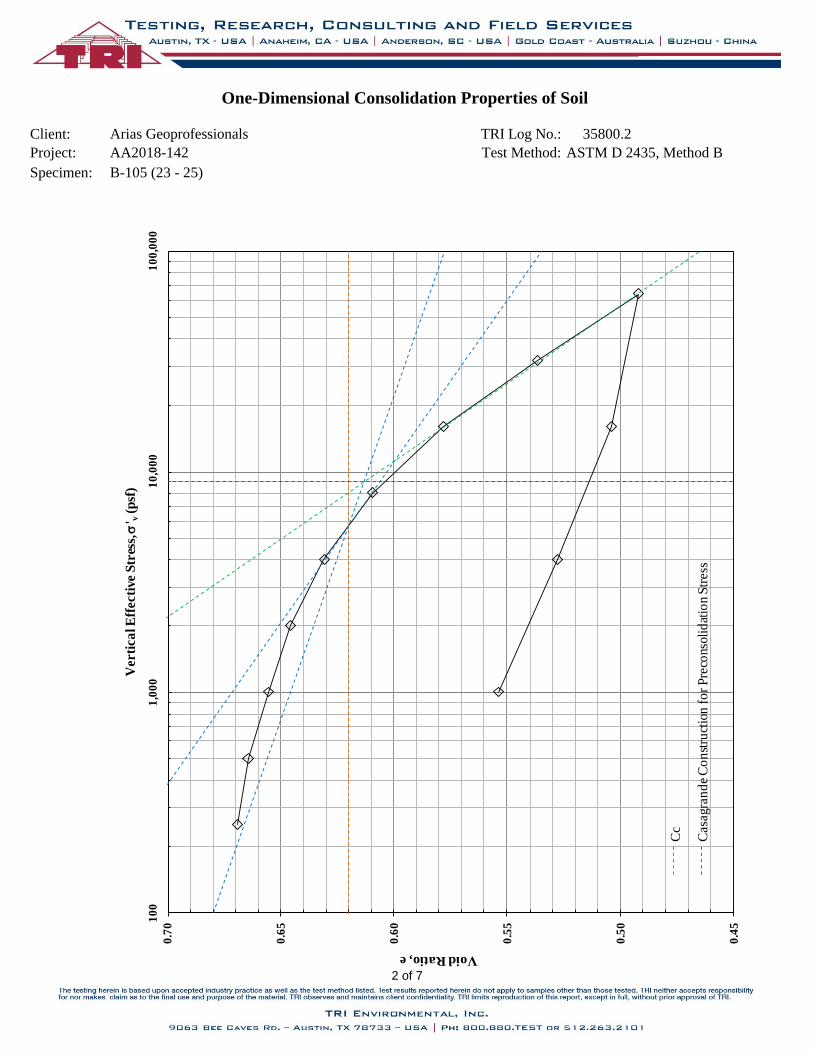
Client: Arias Geoprofessionals TRI Log No.: 35800.2
Project: AA2018-142 Test Method: ASTM D 2435, Method B
Specimen: B-105 (23 - 25)
One-Dimensional Consolidation Properties of Soil
0.4
5
0.5
0
0.5
5
0.6
0
0.6
5
0.7
0
10
01
,00
01
0,0
00
10
0,0
00
Void Ratio, e
Verti
ca
l E
ffecti
ve S
tres
s, s
' v(p
sf)
Cc
Cas
agra
nd
e C
on
stru
ctio
n f
or
Pre
cons
olid
atio
n S
tres
s
-
-
-
-
-
-
-
-
-
-
-
-
-
0.4
5
0.5
0
0.5
5
0.6
0
0.6
5
0.7
0
10
01
,00
01
0,0
00
10
0,0
00
Void Ratio, e
Verti
ca
l E
ffecti
ve S
tres
s, s
' v(p
sf)
Cc
Cas
agra
nd
e C
on
stru
ctio
n f
or
Pre
cons
olid
atio
n S
tres
s
2 of 7
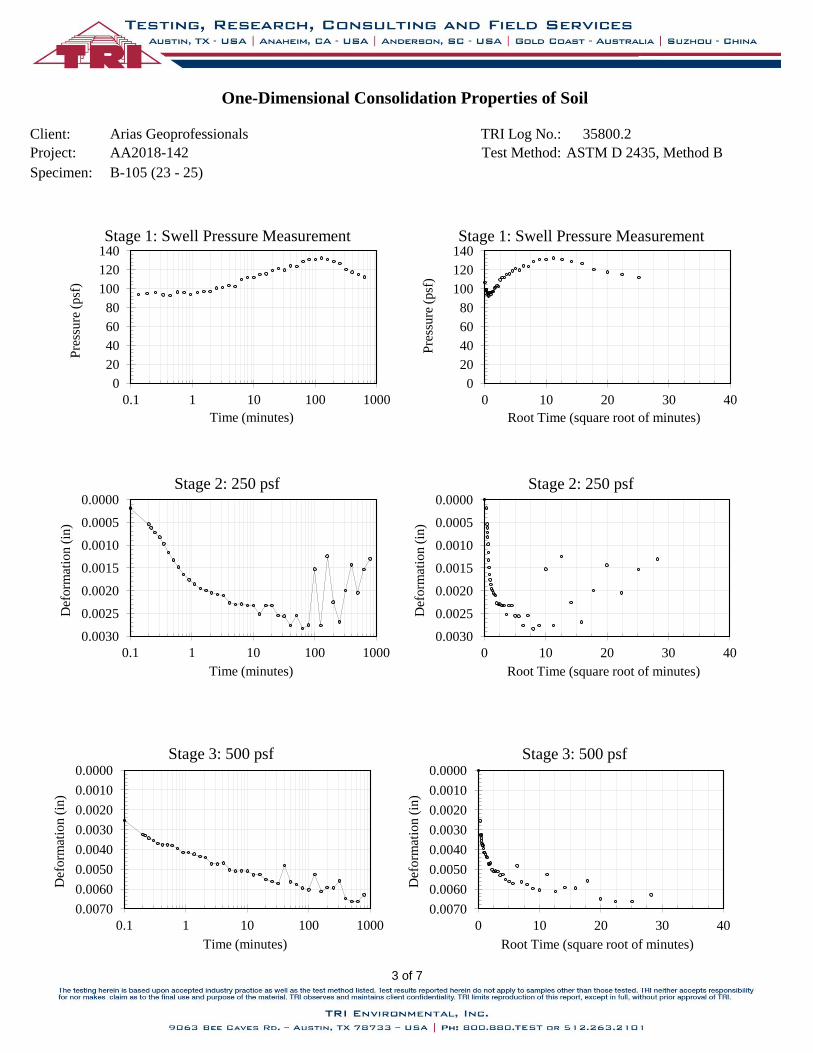
Client: Arias Geoprofessionals TRI Log No.: 35800.2
Project: AA2018-142 Test Method: ASTM D 2435, Method B
Specimen: B-105 (23 - 25)
One-Dimensional Consolidation Properties of Soil
0.4
5
0.5
0
0.5
5
0.6
0
0.6
5
0.7
0
10
01
,00
01
0,0
00
10
0,0
00
Void Ratio, e
Verti
ca
l E
ffecti
ve S
tres
s, s
' v(p
sf)
Cc
Cas
agra
nd
e C
on
stru
ctio
n f
or
Pre
cons
olid
atio
n S
tres
s
0
20
40
60
80
100
120
140
0.1 1 10 100 1000
Pre
ssure
(psf
)
Time (minutes)
Stage 1: Swell Pressure Measurement
0
20
40
60
80
100
120
140
0 10 20 30 40
Pre
ssure
(psf
) Root Time (square root of minutes)
Stage 1: Swell Pressure Measurement
0.0000
0.0005
0.0010
0.0015
0.0020
0.0025
0.0030
0.1 1 10 100 1000
Def
orm
atio
n (
in)
Time (minutes)
Stage 2: 250 psf 0.0000
0.0005
0.0010
0.0015
0.0020
0.0025
0.0030
0 10 20 30 40
Def
orm
atio
n (
in)
Root Time (square root of minutes)
Stage 2: 250 psf
0.0000
0.0010
0.0020
0.0030
0.0040
0.0050
0.0060
0.0070
0.1 1 10 100 1000
Def
orm
atio
n (
in)
Time (minutes)
Stage 3: 500 psf 0.0000
0.0010
0.0020
0.0030
0.0040
0.0050
0.0060
0.0070
0 10 20 30 40
Def
orm
atio
n (
in)
Root Time (square root of minutes)
Stage 3: 500 psf
0.4
5
0.5
0
0.5
5
0.6
0
0.6
5
0.7
0
10
01
,00
01
0,0
00
10
0,0
00
Void Ratio, e
Verti
ca
l E
ffecti
ve S
tres
s, s
' v(p
sf)
Cc
Cas
agra
nd
e C
on
stru
ctio
n f
or
Pre
cons
olid
atio
n S
tres
s
3 of 7
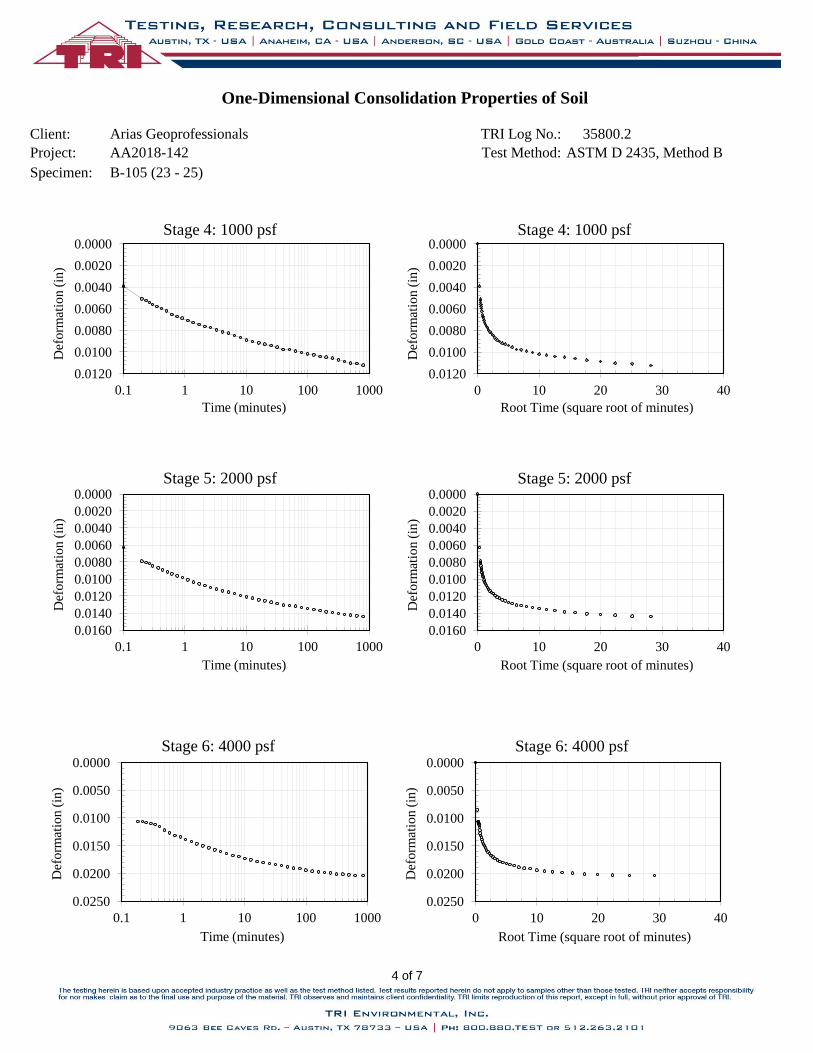
Client: Arias Geoprofessionals TRI Log No.: 35800.2
Project: AA2018-142 Test Method: ASTM D 2435, Method B
Specimen: B-105 (23 - 25)
One-Dimensional Consolidation Properties of Soil
0.4
5
0.5
0
0.5
5
0.6
0
0.6
5
0.7
0
10
01
,00
01
0,0
00
10
0,0
00
Void Ratio, e
Verti
ca
l E
ffecti
ve S
tres
s, s
' v(p
sf)
Cc
Cas
agra
nd
e C
on
stru
ctio
n f
or
Pre
cons
olid
atio
n S
tres
s
0.0000
0.0020
0.0040
0.0060
0.0080
0.0100
0.0120
0.1 1 10 100 1000
Def
orm
atio
n (
in)
Time (minutes)
Stage 4: 1000 psf 0.0000
0.0020
0.0040
0.0060
0.0080
0.0100
0.0120
0 10 20 30 40
Def
orm
atio
n (
in)
Root Time (square root of minutes)
Stage 4: 1000 psf
0.0000
0.0020
0.0040
0.0060
0.0080
0.0100
0.0120
0.0140
0.0160
0.1 1 10 100 1000
Def
orm
atio
n (
in)
Time (minutes)
Stage 5: 2000 psf 0.0000
0.0020
0.0040
0.0060
0.0080
0.0100
0.0120
0.0140
0.0160
0 10 20 30 40
Def
orm
atio
n (
in)
Root Time (square root of minutes)
Stage 5: 2000 psf
0.0000
0.0050
0.0100
0.0150
0.0200
0.0250
0.1 1 10 100 1000
Def
orm
atio
n (
in)
Time (minutes)
Stage 6: 4000 psf 0.0000
0.0050
0.0100
0.0150
0.0200
0.0250
0 10 20 30 40
Def
orm
atio
n (
in)
Root Time (square root of minutes)
Stage 6: 4000 psf 0
.45
0.5
0
0.5
5
0.6
0
0.6
5
0.7
0
10
01
,00
01
0,0
00
10
0,0
00
Void Ratio, e
Verti
ca
l E
ffecti
ve S
tres
s, s
' v(p
sf)
Cc
Cas
agra
nd
e C
on
stru
ctio
n f
or
Pre
cons
olid
atio
n S
tres
s
4 of 7
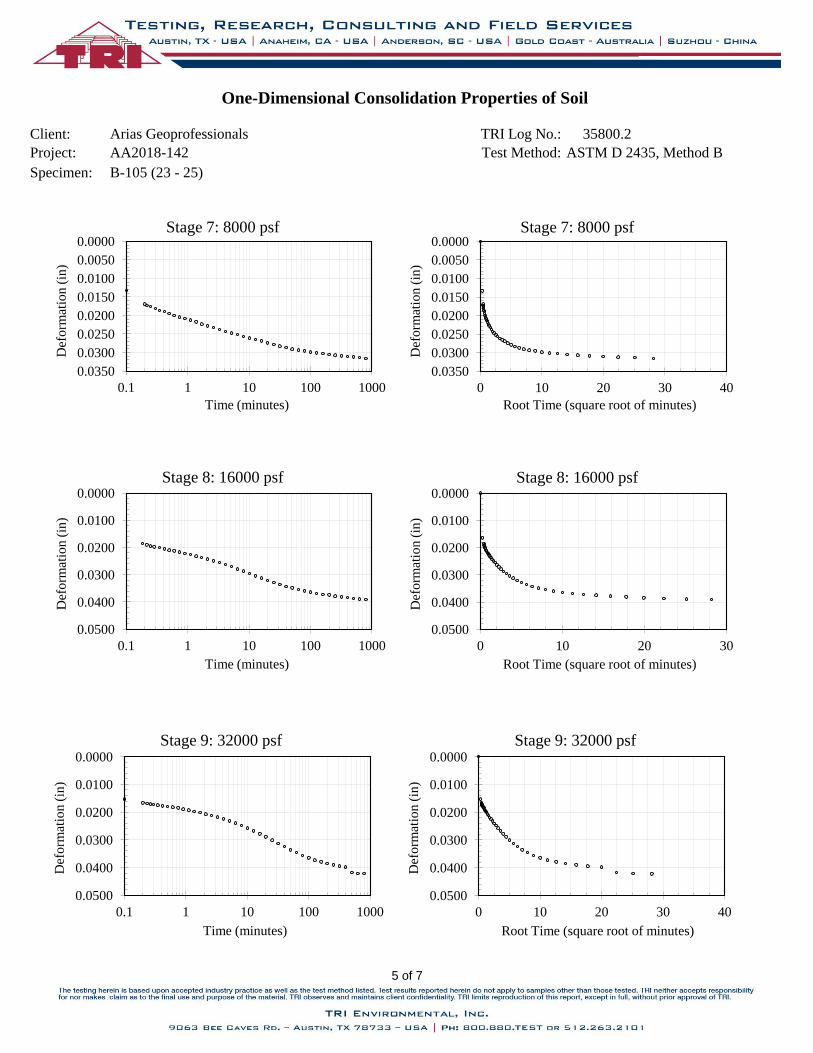
Client: Arias Geoprofessionals TRI Log No.: 35800.2
Project: AA2018-142 Test Method: ASTM D 2435, Method B
Specimen: B-105 (23 - 25)
One-Dimensional Consolidation Properties of Soil
0.4
5
0.5
0
0.5
5
0.6
0
0.6
5
0.7
0
10
01
,00
01
0,0
00
10
0,0
00
Void Ratio, e
Verti
ca
l E
ffecti
ve S
tres
s, s
' v(p
sf)
Cc
Cas
agra
nd
e C
on
stru
ctio
n f
or
Pre
cons
olid
atio
n S
tres
s
0.0000
0.0050
0.0100
0.0150
0.0200
0.0250
0.0300
0.0350
0.1 1 10 100 1000
Def
orm
atio
n (
in)
Time (minutes)
Stage 7: 8000 psf 0.0000
0.0050
0.0100
0.0150
0.0200
0.0250
0.0300
0.0350
0 10 20 30 40
Def
orm
atio
n (
in)
Root Time (square root of minutes)
Stage 7: 8000 psf
0.0000
0.0100
0.0200
0.0300
0.0400
0.0500
0.1 1 10 100 1000
Def
orm
atio
n (
in)
Time (minutes)
Stage 8: 16000 psf 0.0000
0.0100
0.0200
0.0300
0.0400
0.0500
0 10 20 30
Def
orm
atio
n (
in)
Root Time (square root of minutes)
Stage 8: 16000 psf
0.0000
0.0100
0.0200
0.0300
0.0400
0.0500
0.1 1 10 100 1000
Def
orm
atio
n (
in)
Time (minutes)
Stage 9: 32000 psf 0.0000
0.0100
0.0200
0.0300
0.0400
0.0500
0 10 20 30 40
Def
orm
atio
n (
in)
Root Time (square root of minutes)
Stage 9: 32000 psf 0
.45
0.5
0
0.5
5
0.6
0
0.6
5
0.7
0
10
01
,00
01
0,0
00
10
0,0
00
Void Ratio, e
Verti
ca
l E
ffecti
ve S
tres
s, s
' v(p
sf)
Cc
Cas
agra
nd
e C
on
stru
ctio
n f
or
Pre
cons
olid
atio
n S
tres
s
5 of 7
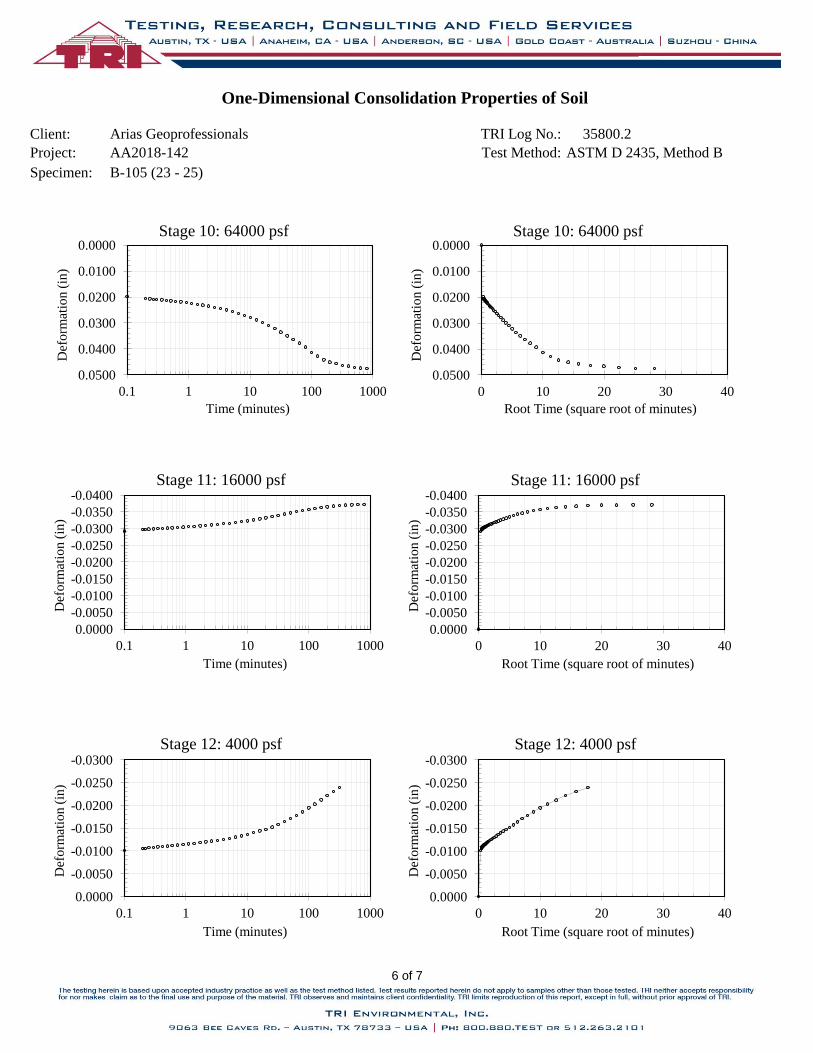
Client: Arias Geoprofessionals TRI Log No.: 35800.2
Project: AA2018-142 Test Method: ASTM D 2435, Method B
Specimen: B-105 (23 - 25)
One-Dimensional Consolidation Properties of Soil
0.4
5
0.5
0
0.5
5
0.6
0
0.6
5
0.7
0
10
01
,00
01
0,0
00
10
0,0
00
Void Ratio, e
Verti
ca
l E
ffecti
ve S
tres
s, s
' v(p
sf)
Cc
Cas
agra
nd
e C
on
stru
ctio
n f
or
Pre
cons
olid
atio
n S
tres
s
0.0000
0.0100
0.0200
0.0300
0.0400
0.0500
0.1 1 10 100 1000
Def
orm
atio
n (
in)
Time (minutes)
Stage 10: 64000 psf 0.0000
0.0100
0.0200
0.0300
0.0400
0.0500
0 10 20 30 40
Def
orm
atio
n (
in)
Root Time (square root of minutes)
Stage 10: 64000 psf
-0.0400
-0.0350
-0.0300
-0.0250
-0.0200
-0.0150
-0.0100
-0.0050
0.0000
0.1 1 10 100 1000
Def
orm
atio
n (
in)
Time (minutes)
Stage 11: 16000 psf -0.0400
-0.0350
-0.0300
-0.0250
-0.0200
-0.0150
-0.0100
-0.0050
0.0000
0 10 20 30 40
Def
orm
atio
n (
in)
Root Time (square root of minutes)
Stage 11: 16000 psf
-0.0300
-0.0250
-0.0200
-0.0150
-0.0100
-0.0050
0.0000
0.1 1 10 100 1000
Def
orm
atio
n (
in)
Time (minutes)
Stage 12: 4000 psf -0.0300
-0.0250
-0.0200
-0.0150
-0.0100
-0.0050
0.0000
0 10 20 30 40
Def
orm
atio
n (
in)
Root Time (square root of minutes)
Stage 12: 4000 psf 0
.45
0.5
0
0.5
5
0.6
0
0.6
5
0.7
0
10
01
,00
01
0,0
00
10
0,0
00
Void Ratio, e
Verti
ca
l E
ffecti
ve S
tres
s, s
' v(p
sf)
Cc
Cas
agra
nd
e C
on
stru
ctio
n f
or
Pre
cons
olid
atio
n S
tres
s
6 of 7
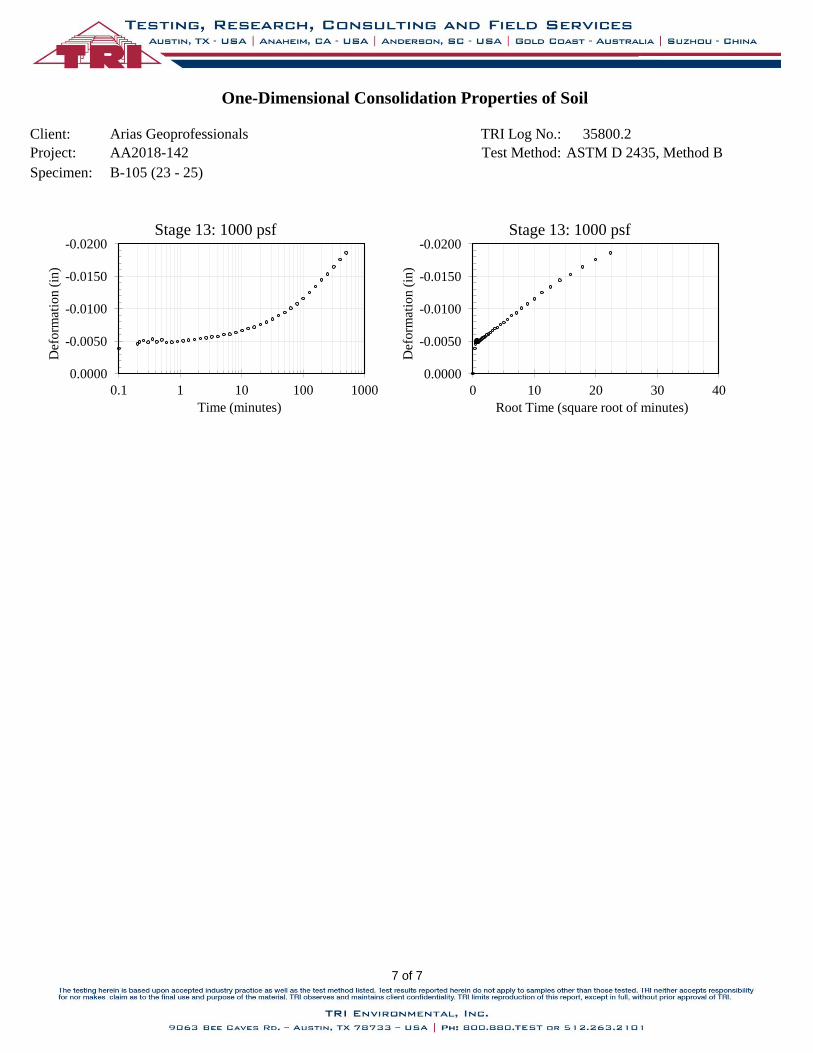
Client: Arias Geoprofessionals TRI Log No.: 35800.2
Project: AA2018-142 Test Method: ASTM D 2435, Method B
Specimen: B-105 (23 - 25)
One-Dimensional Consolidation Properties of Soil
0.4
5
0.5
0
0.5
5
0.6
0
0.6
5
0.7
0
10
01
,00
01
0,0
00
10
0,0
00
Void Ratio, e
Verti
ca
l E
ffecti
ve S
tres
s, s
' v(p
sf)
Cc
Cas
agra
nd
e C
on
stru
ctio
n f
or
Pre
cons
olid
atio
n S
tres
s
-0.0200
-0.0150
-0.0100
-0.0050
0.0000
0.1 1 10 100 1000
Def
orm
atio
n (
in)
Time (minutes)
Stage 13: 1000 psf -0.0200
-0.0150
-0.0100
-0.0050
0.0000
0 10 20 30 40
Def
orm
atio
n (
in)
Root Time (square root of minutes)
Stage 13: 1000 psf
0.4
5
0.5
0
0.5
5
0.6
0
0.6
5
0.7
0
10
01
,00
01
0,0
00
10
0,0
00
Void Ratio, e
Verti
ca
l E
ffecti
ve S
tres
s, s
' v(p
sf)
Cc
Cas
agra
nd
e C
on
stru
ctio
n f
or
Pre
cons
olid
atio
n S
tres
s
7 of 7
Arias Geoprofessionals F-1 Arias Job No. 2017-698
APPENDIX F: DIRECT SHEAR TEST RESULTS
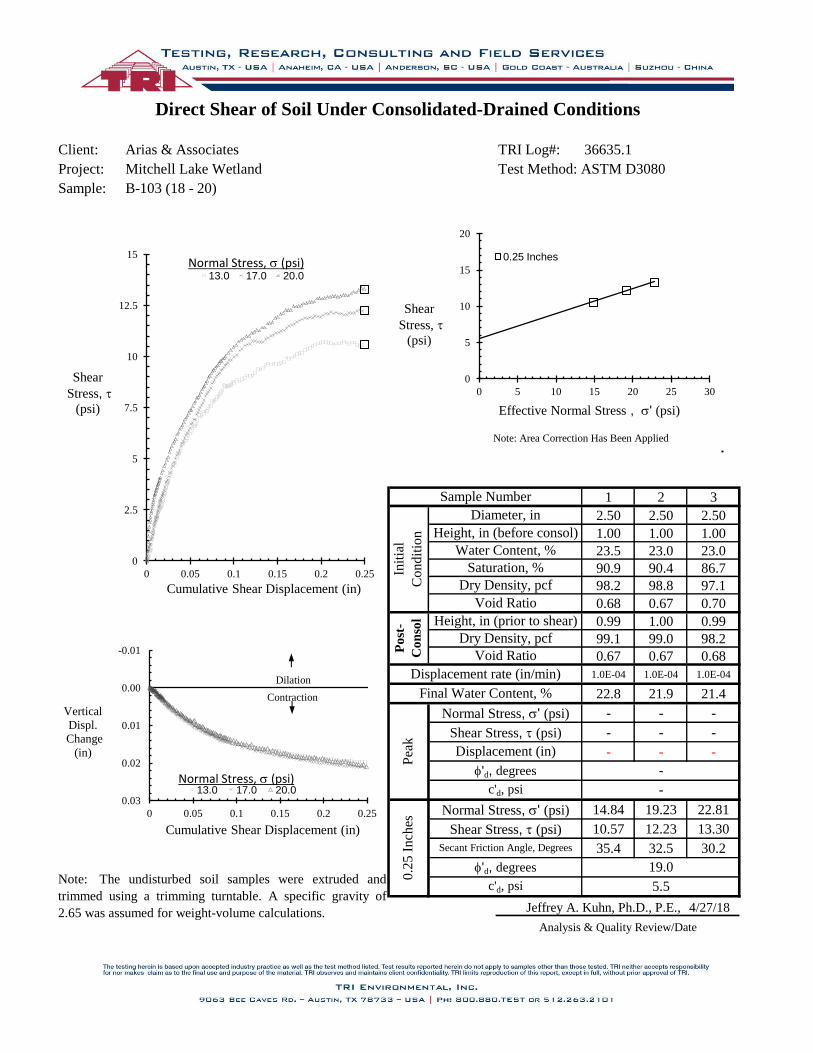
Client: Arias & Associates TRI Log#:
Project: Mitchell Lake Wetland Test Method: ASTM D3080
Sample: B-103 (18 - 20)
1 2 3
2.50 2.50 2.50
1.00 1.00 1.00
23.5 23.0 23.0
90.9 90.4 86.7
98.2 98.8 97.1
0.68 0.67 0.70
0.99 1.00 0.99
99.1 99.0 98.2
0.67 0.67 0.68
1.0E-04 1.0E-04 1.0E-04
22.8 21.9 21.4
- - -
- - -
- - -
14.84 19.23 22.81
10.57 12.23 13.30
35.4 32.5 30.2
Jeffrey A. Kuhn, Ph.D., P.E., 4/27/18
Analysis & Quality Review/Date
Normal Stress, s' (psi)
Normal Stress, s' (psi)
Shear Stress, t (psi)
Direct Shear of Soil Under Consolidated-Drained Conditions
Dry Density, pcf
Sample Number
Init
ial
Condit
ion
36635.1
Water Content, %
Dry Density, pcf
Saturation, %
Void Ratio
Height, in (prior to shear)
Note: The undisturbed soil samples were extruded and
trimmed using a trimming turntable. A specific gravity of
2.65 was assumed for weight-volume calculations.
Displacement rate (in/min)
c'd, psi
f'd, degrees
-f'd, degrees
c'd, psi -
19.0
5.5
Pea
k
Displacement (in)
0.2
5 I
nch
es
Final Water Content, %
Shear Stress, t (psi)
Secant Friction Angle, Degrees
Void Ratio
Diameter, in
Height, in (before consol)
Po
st-
Co
nso
l
0
5
10
15
20
0 5 10 15 20 25 30
Shear
Stress, t (psi)
Effective Normal Stress , s' (psi)
0.25 Inches
Note: Area Correction Has Been Applied
0
2.5
5
7.5
10
12.5
15
0 0.05 0.1 0.15 0.2 0.25
Shear
Stress, t (psi)
Cumulative Shear Displacement (in)
13.0 17.0 20.0 Normal Stress, s (psi)
-0.01
0.00
0.01
0.02
0.03
0 0.05 0.1 0.15 0.2 0.25
Vertical
Displ.
Change
(in)
Cumulative Shear Displacement (in)
13.0 17.0 20.0
Dilation
Contraction
Normal Stress, s (psi)
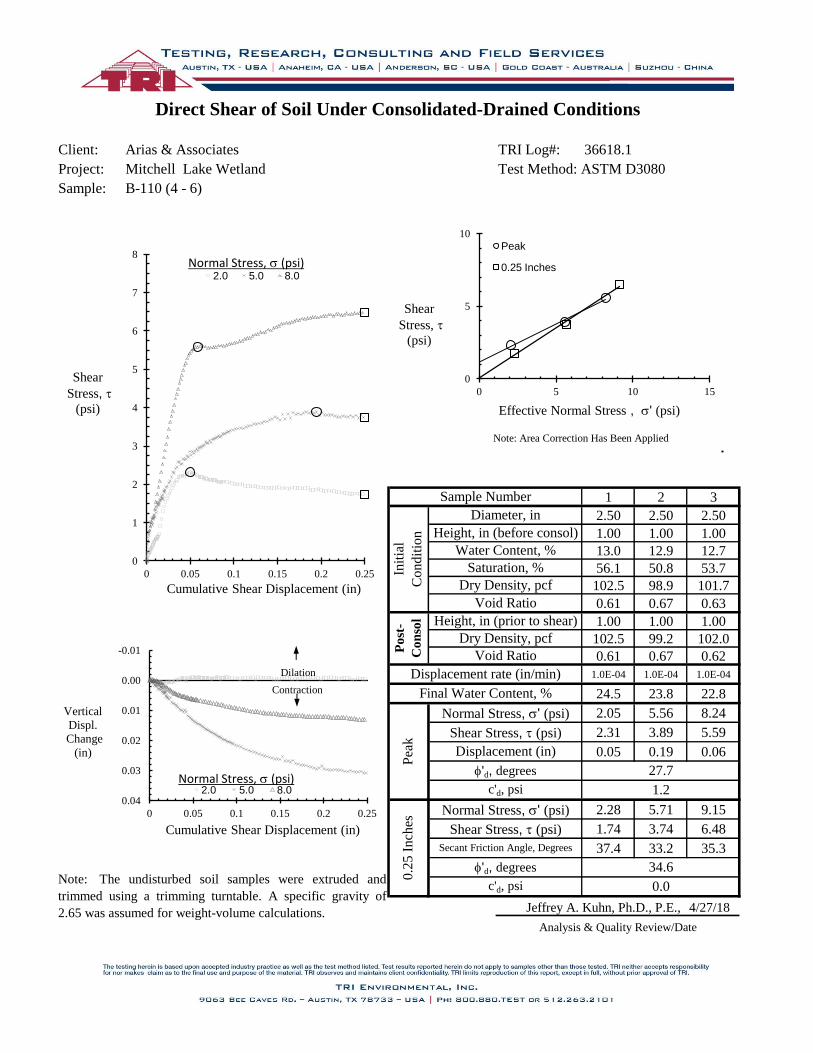
Client: Arias & Associates TRI Log#:
Project: Mitchell Lake Wetland Test Method: ASTM D3080
Sample: B-110 (4 - 6)
1 2 3
2.50 2.50 2.50
1.00 1.00 1.00
13.0 12.9 12.7
56.1 50.8 53.7
102.5 98.9 101.7
0.61 0.67 0.63
1.00 1.00 1.00
102.5 99.2 102.0
0.61 0.67 0.62
1.0E-04 1.0E-04 1.0E-04
24.5 23.8 22.8
2.05 5.56 8.24
2.31 3.89 5.59
0.05 0.19 0.06
2.28 5.71 9.15
1.74 3.74 6.48
37.4 33.2 35.3
Jeffrey A. Kuhn, Ph.D., P.E., 4/27/18
Analysis & Quality Review/Date
Normal Stress, s' (psi)
Normal Stress, s' (psi)
Shear Stress, t (psi)
Direct Shear of Soil Under Consolidated-Drained Conditions
Dry Density, pcf
Sample Number
Init
ial
Condit
ion
36618.1
Water Content, %
Dry Density, pcf
Saturation, %
Void Ratio
Height, in (prior to shear)
Note: The undisturbed soil samples were extruded and
trimmed using a trimming turntable. A specific gravity of
2.65 was assumed for weight-volume calculations.
Displacement rate (in/min)
c'd, psi
f'd, degrees
27.7f'd, degrees
c'd, psi 1.2
34.6
0.0
Pea
k
Displacement (in)
0.2
5 I
nch
es
Final Water Content, %
Shear Stress, t (psi)
Secant Friction Angle, Degrees
Void Ratio
Diameter, in
Height, in (before consol)
Po
st-
Co
nso
l
0
5
10
0 5 10 15
Shear
Stress, t (psi)
Effective Normal Stress , s' (psi)
Peak
0.25 Inches
Note: Area Correction Has Been Applied
0
1
2
3
4
5
6
7
8
0 0.05 0.1 0.15 0.2 0.25
Shear
Stress, t (psi)
Cumulative Shear Displacement (in)
2.0 5.0 8.0 Normal Stress, s (psi)
-0.01
0.00
0.01
0.02
0.03
0.04
0 0.05 0.1 0.15 0.2 0.25
Vertical
Displ.
Change
(in)
Cumulative Shear Displacement (in)
2.0 5.0 8.0
Dilation
Contraction
Normal Stress, s (psi)

Client: Arias & Associates TRI Log#:
Project: Mitchell Lake Wetland Test Method: ASTM D3080
Sample: B-113 (4' - 6')
1 2 3
2.50 2.50 2.50
1.00 1.00 1.00
14.4 14.4 14.3
64.3 69.3 67.9
103.8 106.7 106.1
0.59 0.55 0.56
1.00 1.00 1.00
103.8 106.7 106.1
0.59 0.55 0.56
1.0E-04 1.0E-04 1.0E-04
23.6 25.5 24.5
2.01 5.58 9.10
3.12 4.68 5.47
0.03 0.06 0.13
2.26 5.84 9.15
2.30 3.58 5.53
45.5 31.5 31.2
Jeffrey A. Kuhn, Ph.D., P.E., 4/27/18
Analysis & Quality Review/Date
Normal Stress, s' (psi)
Normal Stress, s' (psi)
Shear Stress, t (psi)
Direct Shear of Soil Under Consolidated-Drained Conditions
Dry Density, pcf
Sample Number
Init
ial
Condit
ion
36618.2
Water Content, %
Dry Density, pcf
Saturation, %
Void Ratio
Height, in (prior to shear)
Note: The undisturbed soil samples were extruded and
trimmed using a trimming turntable. A specific gravity of
2.65 was assumed for weight-volume calculations.
Displacement rate (in/min)
c'd, psi
f'd, degrees
18.4f'd, degrees
c'd, psi 2.6
25.1
1.1
Pea
k
Displacement (in)
0.2
5 I
nch
es
Final Water Content, %
Shear Stress, t (psi)
Secant Friction Angle, Degrees
Void Ratio
Diameter, in
Height, in (before consol)
Po
st-
Co
nso
l
0
5
10
0 5 10 15
Shear
Stress, t (psi)
Effective Normal Stress , s' (psi)
Peak
0.25 Inches
Note: Area Correction Has Been Applied
0
1
2
3
4
5
6
7
8
0 0.05 0.1 0.15 0.2 0.25
Shear
Stress, t (psi)
Cumulative Shear Displacement (in)
2.0 5.0 8.0 Normal Stress, s (psi)
-0.02
-0.01
0.00
0.01
0.02
0 0.05 0.1 0.15 0.2 0.25
Vertical
Displ.
Change
(in)
Cumulative Shear Displacement (in)
2.0 5.0 8.0
Dilation
Contraction
Normal Stress, s (psi)

Client: Arias & Associates TRI Log#:
Project: Mitchell Lake Wetland Test Method: ASTM D3080
Sample: B-114 (6' - 8')
1 2 3
2.50 2.50 2.50
1.00 1.00 1.00
16.1 17.0 16.9
71.3 80.8 73.2
103.5 106.2 102.6
0.60 0.56 0.61
1.00 1.00 1.00
103.4 106.3 103.0
0.60 0.56 0.60
1.0E-04 1.0E-04 1.0E-04
22.6 23.3 22.2
3.06 7.21 10.40
3.49 5.22 5.88
0.03 0.06 0.06
3.43 8.01 11.50
2.72 5.36 5.99
38.5 33.8 27.5
Jeffrey A. Kuhn, Ph.D., P.E., 4/27/18
Analysis & Quality Review/Date
Normal Stress, s' (psi)
Normal Stress, s' (psi)
Shear Stress, t (psi)
Direct Shear of Soil Under Consolidated-Drained Conditions
Dry Density, pcf
Sample Number
Init
ial
Condit
ion
36618.3
Water Content, %
Dry Density, pcf
Saturation, %
Void Ratio
Height, in (prior to shear)
Note: The undisturbed soil samples were extruded and
trimmed using a trimming turntable. A specific gravity of
2.65 was assumed for weight-volume calculations.
Displacement rate (in/min)
c'd, psi
f'd, degrees
18.2f'd, degrees
c'd, psi 2.6
22.5
1.5
Pea
k
Displacement (in)
0.2
5 I
nch
es
Final Water Content, %
Shear Stress, t (psi)
Secant Friction Angle, Degrees
Void Ratio
Diameter, in
Height, in (before consol)
Po
st-
Co
nso
l
0
5
10
0 5 10 15
Shear
Stress, t (psi)
Effective Normal Stress , s' (psi)
Peak
0.25 Inches
Note: Area Correction Has Been Applied
0
1
2
3
4
5
6
7
8
0 0.05 0.1 0.15 0.2 0.25
Shear
Stress, t (psi)
Cumulative Shear Displacement (in)
3.0 7.0 10.0 Normal Stress, s (psi)
-0.01
0.00
0.01
0.02
0.03
0 0.05 0.1 0.15 0.2 0.25
Vertical
Displ.
Change
(in)
Cumulative Shear Displacement (in)
3.0 7.0 10.0
Dilation
Contraction
Normal Stress, s (psi)
Arias Geoprofessionals G-1 Arias Job No. 2017-698
APPENDIX G: CONSOLIDATED-UNDRAINED TRIAXIAL TEST
RESULTS

Client: Arias & Associates TRI Log #:
Project: Mitchell Lake Wetland Test Method:
Sample: B-102 (10 - 12)
Identification
Depth/Elev. (ft)
Eff. Consol. Stress (psi)
Avg. Diameter (in)
Avg. Height (in)
Avg. Water Content (%)
Bulk Density (pcf)
Dry Density (pcf) Void Ratio
Saturation (%) Area (in2)
Void Ratio, n
Specific Gravity (Assumed)
Total Back-Pressure (psi) Avg. Water Content (%)
B-Value, End of Saturation Rate of Strain (%/hr)
Jeffrey A. Kuhn , Ph.D., P.E., 4/27/2018
Analysis & Quality Review/Date
Effective Cohesion (psi) - 2.9
Note: Multi-stage testing was performed for this sample. The first two stages were terminated in accordance with stress path
tangency and/or peak principal stress ratio.
Please note that the presented M-C parameters are based on a linear regression in modified stress space, across all assigned
effective consolidation stresses. This fit does not purported to capture typical curvature of envelopes that may, in particular, be
observed across broader range in effective stresses. Please note that the stresses associated with peak principal stress ratioare
presented in tabular form on the first page of the report. There are alternate interpretations to theses two failure criterion including but
not limited to strain compatibility and post-peak.
36.1
Effective Friction Angle (degrees) - 29.6
Major Effective Stress (psi), s1'f - - - 19.2 28.4
Secant Friction Angle (degrees) - - - 46.7 39.6 37.6
Pore Water Pressure, Duf (psi) - - - 2.9 3.7 4.2
Principal Stress Difference (psi), (s1-s3)f - - - 16.2 22.1
Minor Effective Stress (psi), s3'f - - - 3.0 6.3 8.7
27.3
Failure Criterion: Peak Principal Stress Difference, (s1'-s3')max Ratio, (s1'/s3')max
Axial Strain at Failure (%), ea,f - - - 1.2 1.3 0.7
At Failure
0.96 - - 0.50 0.50 0.50
54.1 54.1 54.1 - - 24.4
2.70
0.72 0.59 0.50
Shear / Post-Shear
91.2 - - 1.41 1.45 1.47
97.9 - - 0.59 0.50 0.41
1.38 1.39 1.40 Mounting Method Wet
121.8 132.1 139.9 Post-Consolidation / Pre-Shear
24.4 - -
2.80 2.55 2.38 Consolidation Isotropic
6.0 10.0 13.0Specimen Preparation Trimmed
Initial Specimen Properties
- - -Specimen Condition Undisturbed / Intact
- - -
Specimens Test Setup
Multi-Stage Consolidated-Undrained Triaxial Compression
36618.7
ASTM D4767 Mod
1 of 5
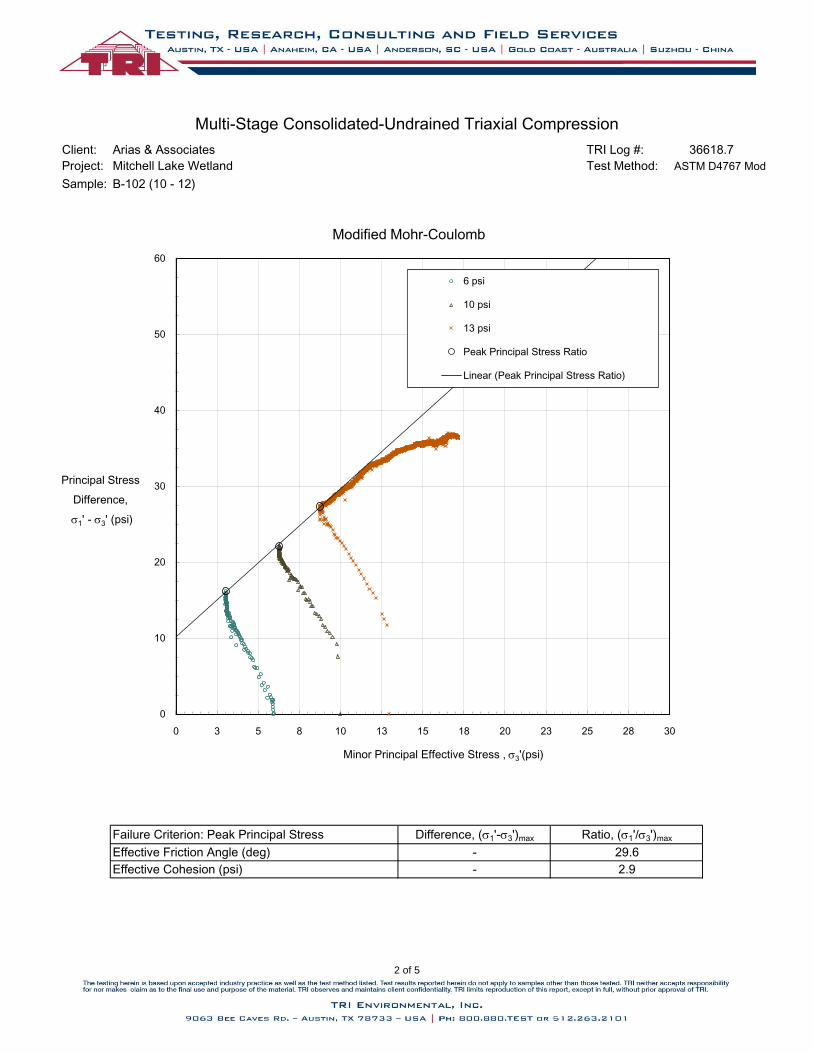
Client: Arias & Associates TRI Log #:
Project: Mitchell Lake Wetland Test Method:
Sample: B-102 (10 - 12)
Multi-Stage Consolidated-Undrained Triaxial Compression
36618.7
ASTM D4767 Mod
3
Effective Friction Angle (deg) - 29.6
Effective Cohesion (psi) - 2.9
Failure Criterion: Peak Principal Stress Difference, (s1'-s3')max Ratio, (s1'/s3')max
0
10
20
30
40
50
60
0 3 5 8 10 13 15 18 20 23 25 28 30
Principal Stress
Difference,
s1' - s3' (psi)
Minor Principal Effective Stress , s3'(psi)
Modified Mohr-Coulomb
6 psi
10 psi
13 psi
Peak Principal Stress Ratio
Linear (Peak Principal Stress Ratio)
2 of 5
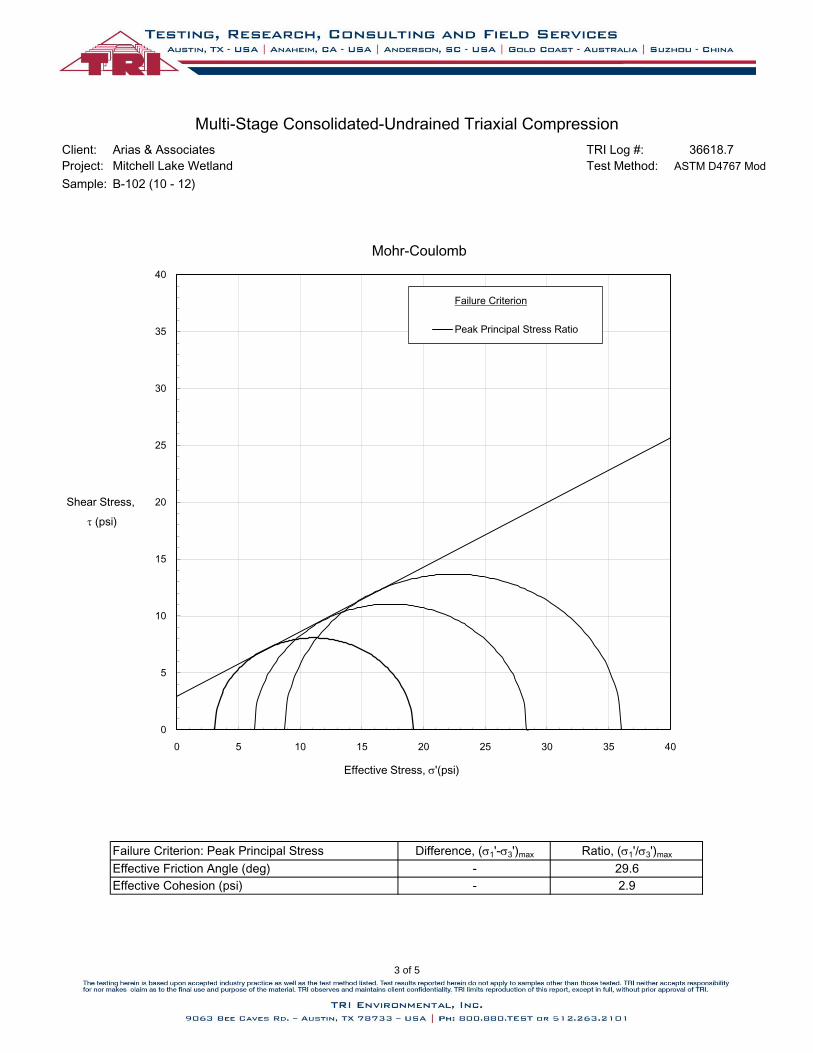
Client: Arias & Associates TRI Log #:
Project: Mitchell Lake Wetland Test Method:
Sample: B-102 (10 - 12)
Multi-Stage Consolidated-Undrained Triaxial Compression
36618.7
ASTM D4767 Mod
Effective Cohesion (psi) - 2.9
Failure Criterion: Peak Principal Stress Difference, (s1'-s3')max Ratio, (s1'/s3')max
Effective Friction Angle (deg) - 29.6
0
5
10
15
20
25
30
35
40
0 5 10 15 20 25 30 35 40
Shear Stress,
t (psi)
Effective Stress, s'(psi)
Mohr-Coulomb
Failure Criterion
Peak Principal Stress Ratio
3 of 5
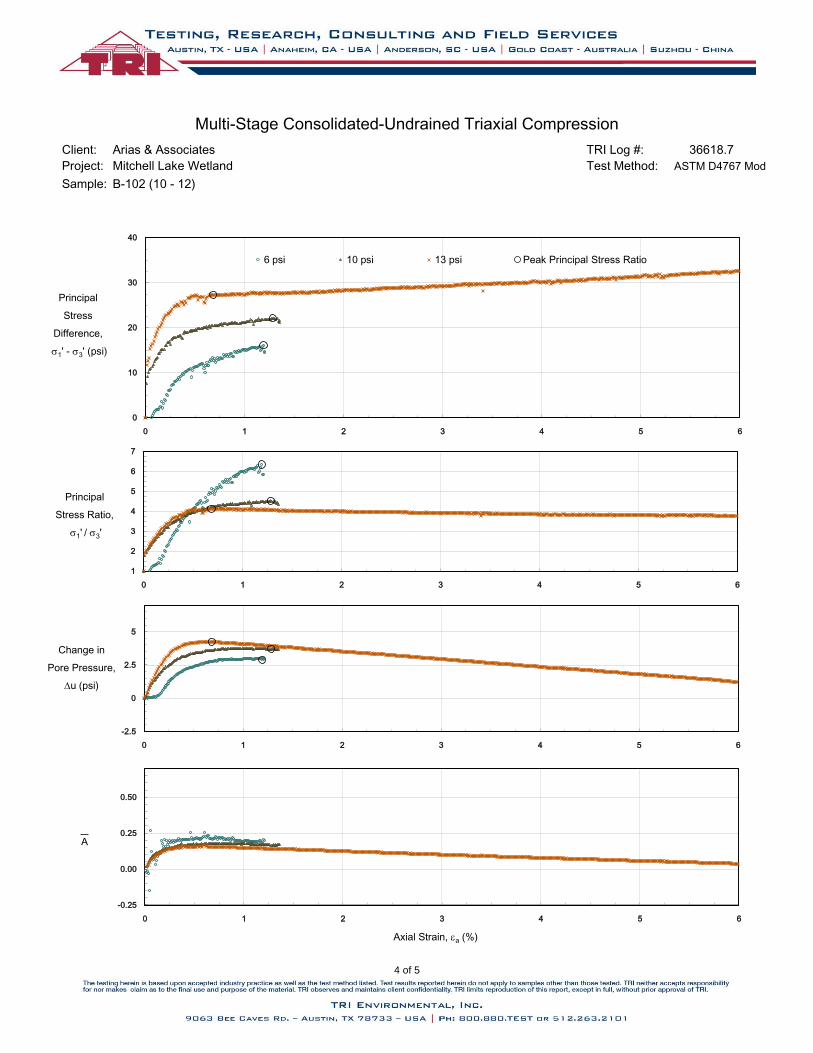
Client: Arias & Associates TRI Log #:
Project: Mitchell Lake Wetland Test Method:
Sample: B-102 (10 - 12)
Multi-Stage Consolidated-Undrained Triaxial Compression
36618.7
ASTM D4767 Mod
-2.5
0
2.5
5
0 1 2 3 4 5 6
Change in
Pore Pressure,
Du (psi)
-0.25
0.00
0.25
0.50
0 1 2 3 4 5 6
A
Axial Strain, ea (%)
1
2
3
4
5
6
7
0 1 2 3 4 5 6
Principal
Stress Ratio,
s1' / s3'
0
10
20
30
40
0 1 2 3 4 5 6
Principal
Stress
Difference,
s1' - s3' (psi)
6 psi 10 psi 13 psi Peak Principal Stress Ratio
4 of 5
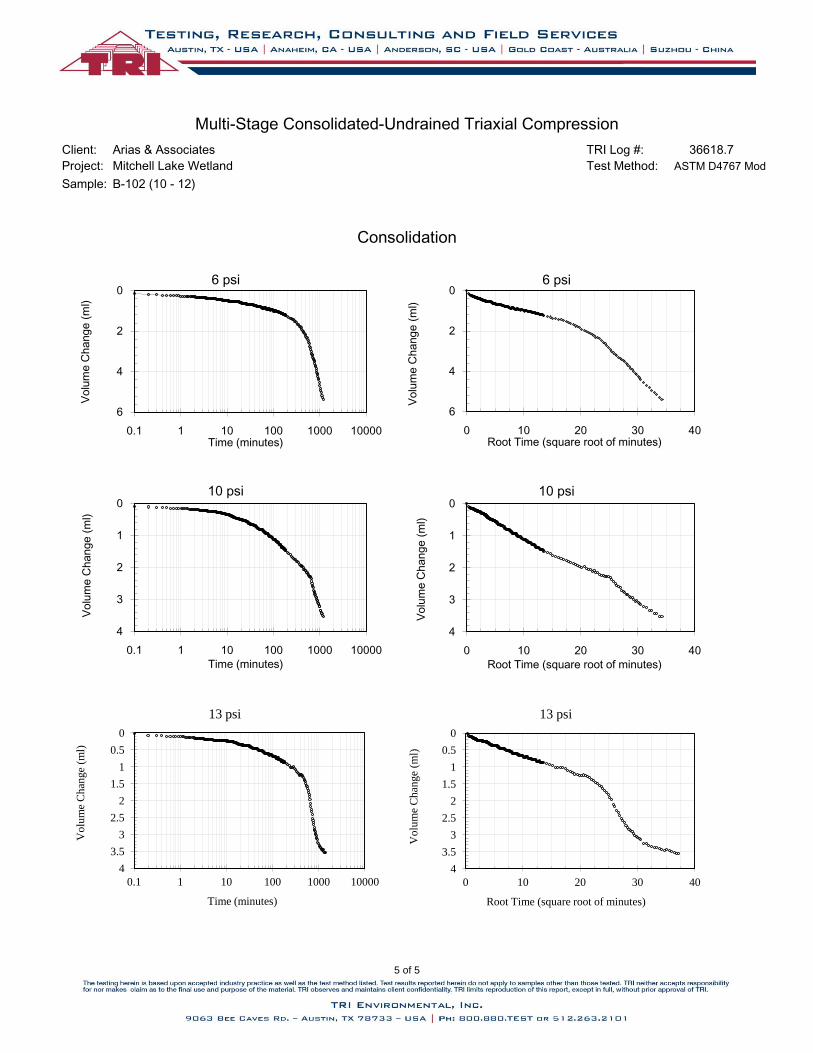
Client: Arias & Associates TRI Log #:
Project: Mitchell Lake Wetland Test Method:
Sample: B-102 (10 - 12)
Multi-Stage Consolidated-Undrained Triaxial Compression
36618.7
ASTM D4767 Mod
Xmin
Xmax
Xmajor
Xminor
Consolidation
0
2
4
6
0.1 1 10 100 1000 10000
Volu
me C
hange (
ml)
Time (minutes)
6 psi 0
2
4
6
0 10 20 30 40
Volu
me C
hange (
ml)
Root Time (square root of minutes)
6 psi
0
1
2
3
4
0.1 1 10 100 1000 10000
Volu
me C
hange (
ml)
Time (minutes)
10 psi 0
1
2
3
4
0 10 20 30 40
Volu
me C
hange (
ml)
Root Time (square root of minutes)
10 psi
0
0.5
1
1.5
2
2.5
3
3.5
4
0.1 1 10 100 1000 10000
Vo
lum
e C
han
ge
(ml)
Time (minutes)
13 psi
0
0.5
1
1.5
2
2.5
3
3.5
4
0 10 20 30 40
Vo
lum
e C
han
ge
(ml)
Root Time (square root of minutes)
13 psi
5 of 5
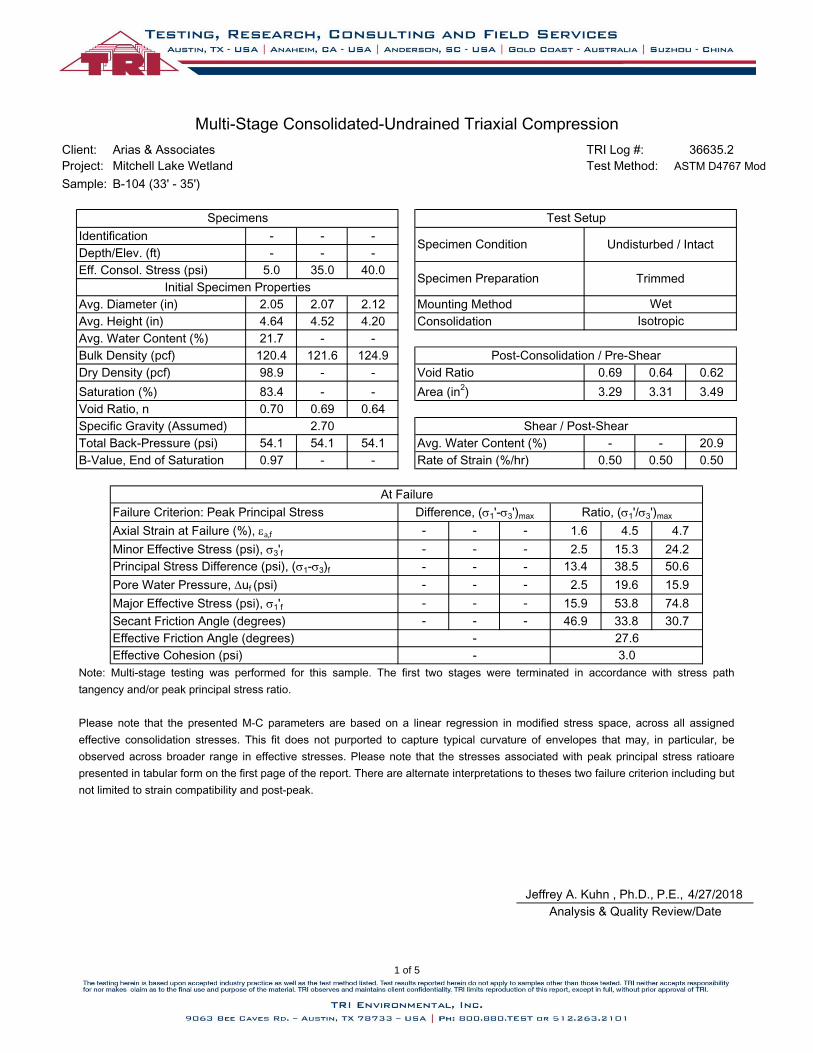
Client: Arias & Associates TRI Log #:
Project: Mitchell Lake Wetland Test Method:
Sample: B-104 (33' - 35')
Identification
Depth/Elev. (ft)
Eff. Consol. Stress (psi)
Avg. Diameter (in)
Avg. Height (in)
Avg. Water Content (%)
Bulk Density (pcf)
Dry Density (pcf) Void Ratio
Saturation (%) Area (in2)
Void Ratio, n
Specific Gravity (Assumed)
Total Back-Pressure (psi) Avg. Water Content (%)
B-Value, End of Saturation Rate of Strain (%/hr)
Jeffrey A. Kuhn , Ph.D., P.E.,
Specimens Test Setup
Multi-Stage Consolidated-Undrained Triaxial Compression
36635.2
ASTM D4767 Mod
- - -Specimen Condition Undisturbed / Intact
- - -
5.0 35.0 40.0Specimen Preparation Trimmed
Initial Specimen Properties
2.05 2.07 2.12 Mounting Method Wet
120.4 121.6 124.9 Post-Consolidation / Pre-Shear
21.7 - -
4.64 4.52 4.20 Consolidation Isotropic
0.70 0.69 0.64
Shear / Post-Shear
83.4 - - 3.29 3.31 3.49
98.9 - - 0.69 0.64 0.62
54.1 54.1 54.1 - - 20.9
2.70
At Failure
0.97 - - 0.50 0.50 0.50
Failure Criterion: Peak Principal Stress Difference, (s1'-s3')max Ratio, (s1'/s3')max
Axial Strain at Failure (%), ea,f - - - 1.6 4.5 4.7
Minor Effective Stress (psi), s3'f - - - 2.5 15.3 24.2
50.6
Pore Water Pressure, Duf (psi) - - - 2.5 19.6 15.9
Principal Stress Difference (psi), (s1-s3)f - - - 13.4 38.5
74.8
Effective Friction Angle (degrees) - 27.6
Major Effective Stress (psi), s1'f - - - 15.9 53.8
Secant Friction Angle (degrees) - - - 46.9 33.8 30.7
4/27/2018
Analysis & Quality Review/Date
Effective Cohesion (psi) - 3.0
Note: Multi-stage testing was performed for this sample. The first two stages were terminated in accordance with stress path
tangency and/or peak principal stress ratio.
Please note that the presented M-C parameters are based on a linear regression in modified stress space, across all assigned
effective consolidation stresses. This fit does not purported to capture typical curvature of envelopes that may, in particular, be
observed across broader range in effective stresses. Please note that the stresses associated with peak principal stress ratioare
presented in tabular form on the first page of the report. There are alternate interpretations to theses two failure criterion including but
not limited to strain compatibility and post-peak.
1 of 5
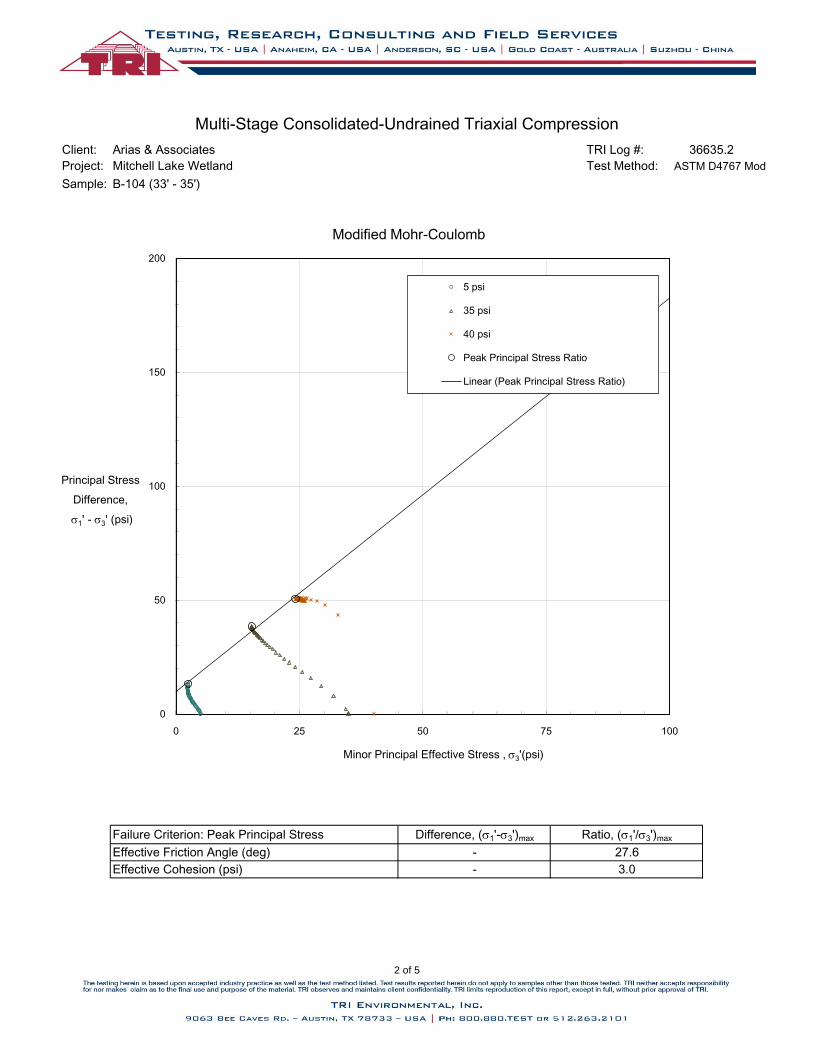
Client: Arias & Associates TRI Log #:
Project: Mitchell Lake Wetland Test Method:
Sample: B-104 (33' - 35')
Multi-Stage Consolidated-Undrained Triaxial Compression
36635.2
ASTM D4767 Mod
3
Effective Friction Angle (deg) - 27.6
Effective Cohesion (psi) - 3.0
Failure Criterion: Peak Principal Stress Difference, (s1'-s3')max Ratio, (s1'/s3')max
0
50
100
150
200
0 25 50 75 100
Principal Stress
Difference,
s1' - s3' (psi)
Minor Principal Effective Stress , s3'(psi)
Modified Mohr-Coulomb
5 psi
35 psi
40 psi
Peak Principal Stress Ratio
Linear (Peak Principal Stress Ratio)
2 of 5
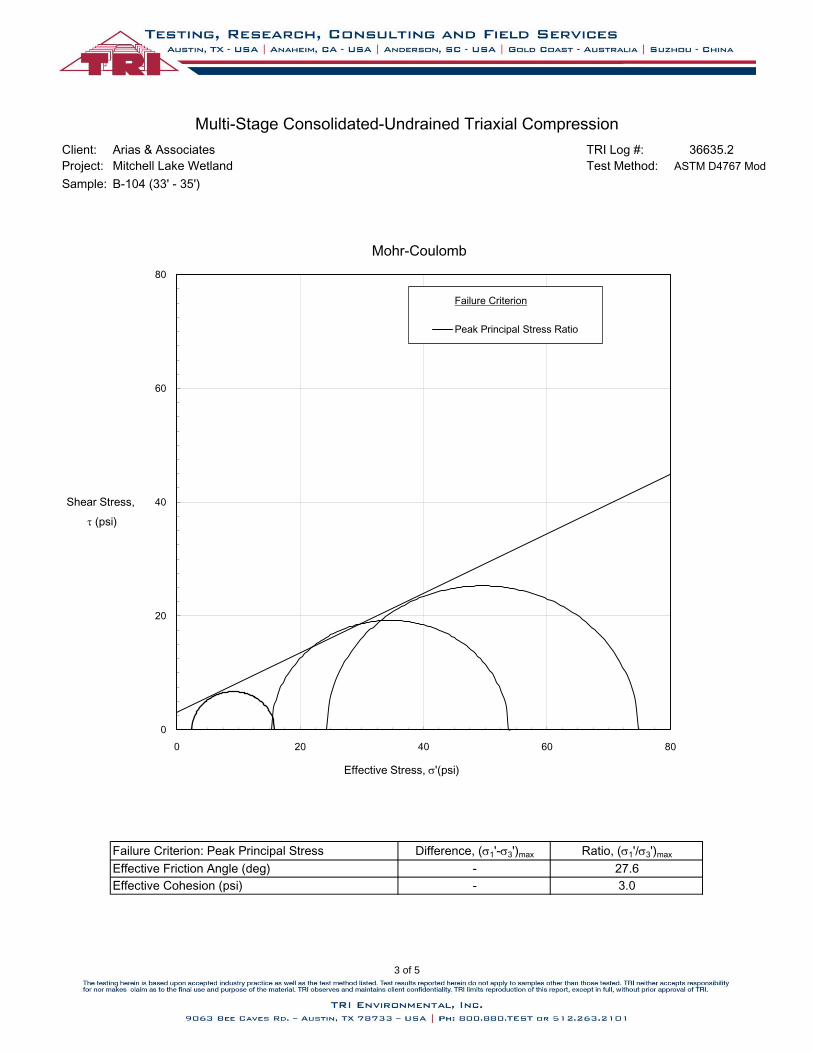
Client: Arias & Associates TRI Log #:
Project: Mitchell Lake Wetland Test Method:
Sample: B-104 (33' - 35')
Multi-Stage Consolidated-Undrained Triaxial Compression
36635.2
ASTM D4767 Mod
Failure Criterion: Peak Principal Stress Difference, (s1'-s3')max Ratio, (s1'/s3')max
Effective Friction Angle (deg) - 27.6
Effective Cohesion (psi) - 3.0
0
20
40
60
80
0 20 40 60 80
Shear Stress,
t (psi)
Effective Stress, s'(psi)
Mohr-Coulomb
Failure Criterion
Peak Principal Stress Ratio
3 of 5
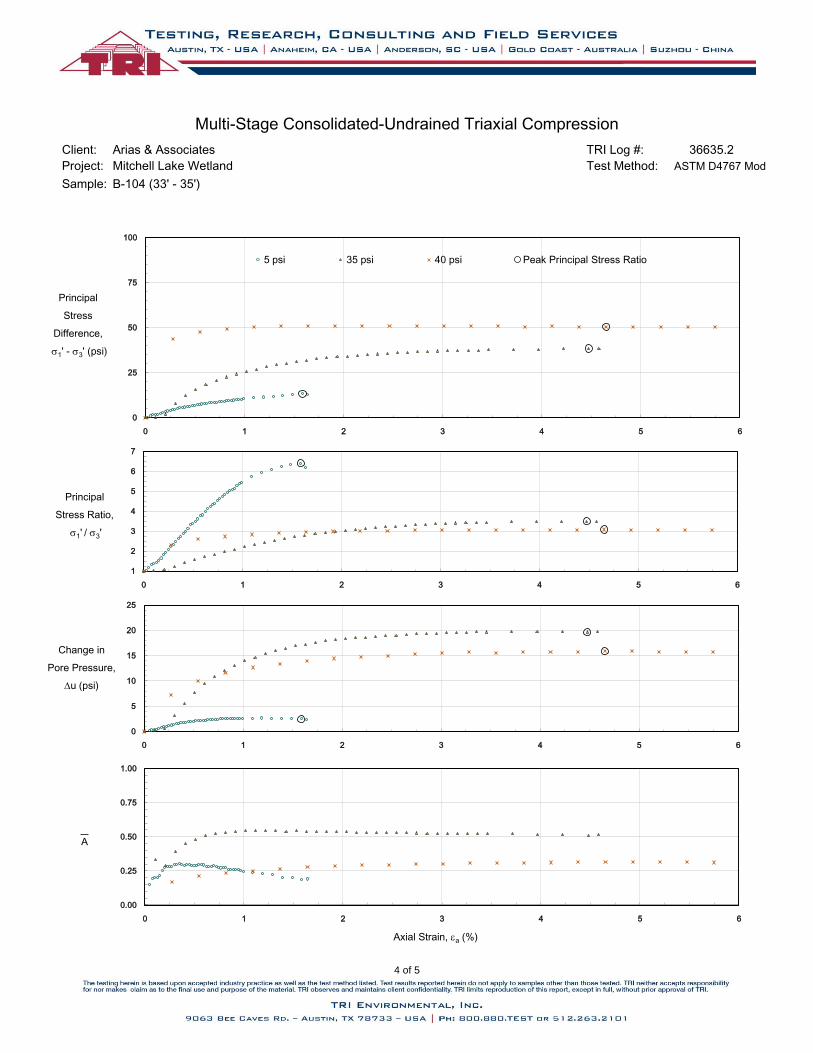
Client: Arias & Associates TRI Log #:
Project: Mitchell Lake Wetland Test Method:
Sample: B-104 (33' - 35')
Multi-Stage Consolidated-Undrained Triaxial Compression
36635.2
ASTM D4767 Mod
0
5
10
15
20
25
0 1 2 3 4 5 6
Change in
Pore Pressure,
Du (psi)
0.00
0.25
0.50
0.75
1.00
0 1 2 3 4 5 6
A
Axial Strain, ea (%)
1
2
3
4
5
6
7
0 1 2 3 4 5 6
Principal
Stress Ratio,
s1' / s3'
0
25
50
75
100
0 1 2 3 4 5 6
Principal
Stress
Difference,
s1' - s3' (psi)
5 psi 35 psi 40 psi Peak Principal Stress Ratio
4 of 5
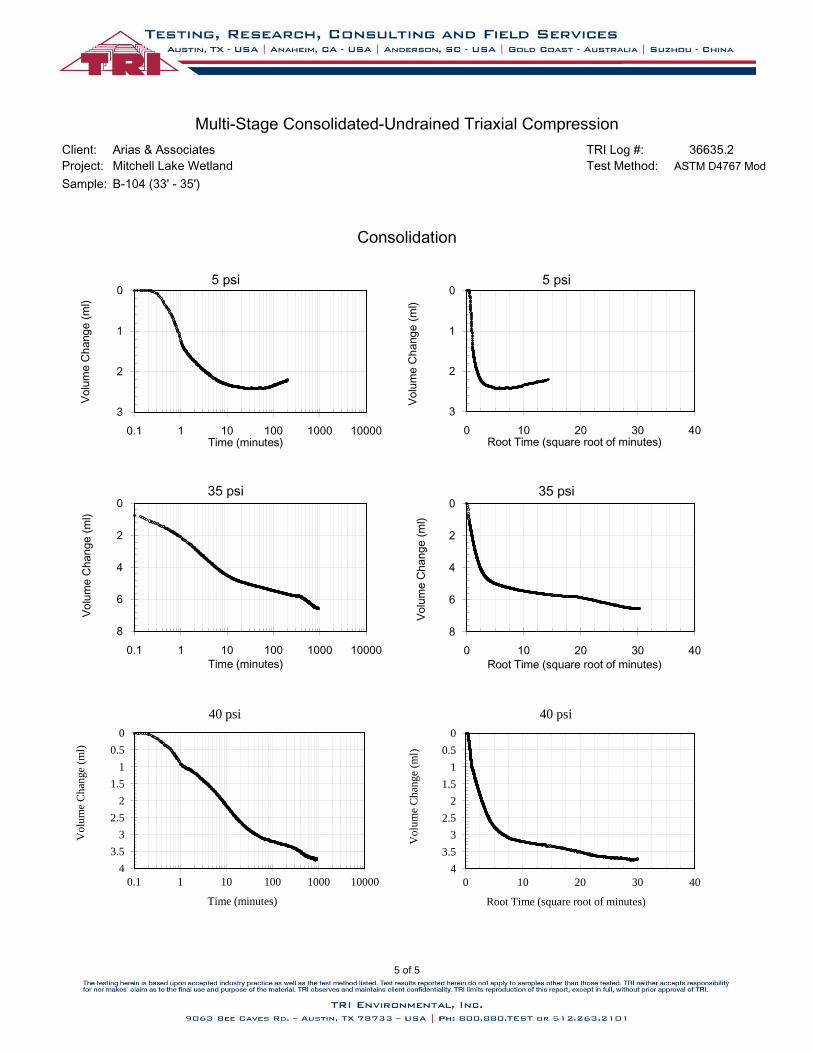
Client: Arias & Associates TRI Log #:
Project: Mitchell Lake Wetland Test Method:
Sample: B-104 (33' - 35')
Multi-Stage Consolidated-Undrained Triaxial Compression
36635.2
ASTM D4767 Mod
Xmin
Xmax
Xmajor
Xminor
Consolidation
0
1
2
3
0.1 1 10 100 1000 10000
Volu
me C
hange (
ml)
Time (minutes)
5 psi 0
1
2
3
0 10 20 30 40
Volu
me C
hange (
ml)
Root Time (square root of minutes)
5 psi
0
2
4
6
8
0.1 1 10 100 1000 10000
Volu
me C
hange (
ml)
Time (minutes)
35 psi 0
2
4
6
8
0 10 20 30 40
Volu
me C
hange (
ml)
Root Time (square root of minutes)
35 psi
0
0.5
1
1.5
2
2.5
3
3.5
4
0.1 1 10 100 1000 10000
Vo
lum
e C
han
ge
(ml)
Time (minutes)
40 psi
0
0.5
1
1.5
2
2.5
3
3.5
4
0 10 20 30 40
Vo
lum
e C
han
ge
(ml)
Root Time (square root of minutes)
40 psi
5 of 5
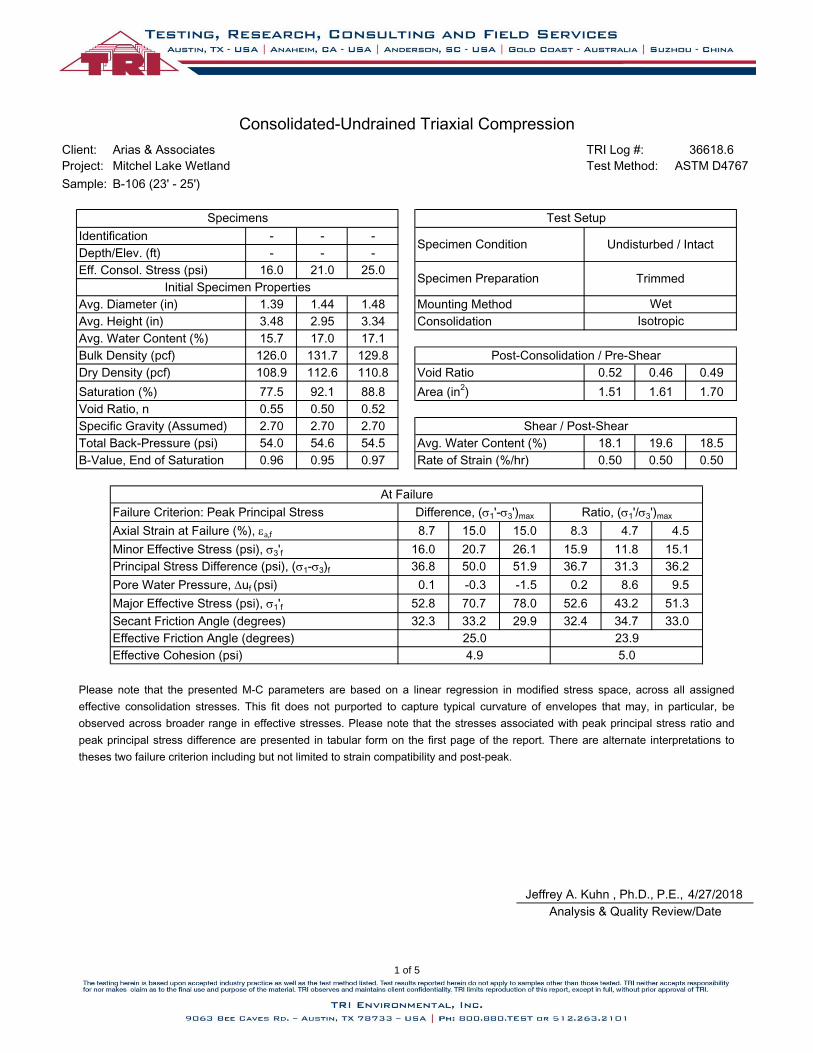
Client: Arias & Associates TRI Log #:
Project: Mitchel Lake Wetland Test Method:
Sample: B-106 (23' - 25')
Identification
Depth/Elev. (ft)
Eff. Consol. Stress (psi)
Avg. Diameter (in)
Avg. Height (in)
Avg. Water Content (%)
Bulk Density (pcf)
Dry Density (pcf) Void Ratio
Saturation (%) Area (in2)
Void Ratio, n
Specific Gravity (Assumed)
Total Back-Pressure (psi) Avg. Water Content (%)
B-Value, End of Saturation Rate of Strain (%/hr)
Jeffrey A. Kuhn , Ph.D., P.E.,
Consolidated-Undrained Triaxial Compression
Initial Specimen Properties
1.39 1.44 1.48
ASTM D4767
36618.6
- -
Specimens
TrimmedSpecimen Preparation
Post-Consolidation / Pre-Shear
77.5
54.6
Mounting Method Wet
126.0 131.7
92.1
0.52
2.70 2.70 2.70
54.0
88.8
Shear / Post-Shear
0.55
- - -
0.96 0.95 0.97
Specimen Condition Undisturbed / Intact-
54.5 18.1
16.0 21.0 25.0
129.8
108.9 112.6 110.8
3.48 2.95 3.34
15.7 17.0 17.1
Consolidation Isotropic
Test Setup
0.50 0.50 0.50
0.52 0.46 0.49
1.51 1.61 1.70
19.6 18.5
9.50.1
36.7
78.0
-0.3 -1.5
20.7 26.1
36.8 50.0 51.9
0.2 8.6
15.9 11.8
51.3
15.1
31.3
16.0
32.4
23.9
5.0
25.0
4.9
52.6 43.2
34.7 33.0
52.8 70.7
Secant Friction Angle (degrees) 32.3 33.2 29.9
At Failure
Failure Criterion: Peak Principal Stress
Axial Strain at Failure (%), ea,f
Ratio, (s1'/s3')max
8.3 4.7 4.5
0.50
Difference, (s1'-s3')max
8.7 15.0 15.0
Minor Effective Stress (psi), s3'f
Principal Stress Difference (psi), (s1-s3)f
Pore Water Pressure, Duf (psi)
Major Effective Stress (psi), s1'f
Effective Friction Angle (degrees)
Effective Cohesion (psi)
36.2
4/27/2018
Analysis & Quality Review/Date
Please note that the presented M-C parameters are based on a linear regression in modified stress space, across all assigned
effective consolidation stresses. This fit does not purported to capture typical curvature of envelopes that may, in particular, be
observed across broader range in effective stresses. Please note that the stresses associated with peak principal stress ratio and
peak principal stress difference are presented in tabular form on the first page of the report. There are alternate interpretations to
theses two failure criterion including but not limited to strain compatibility and post-peak.
1 of 5
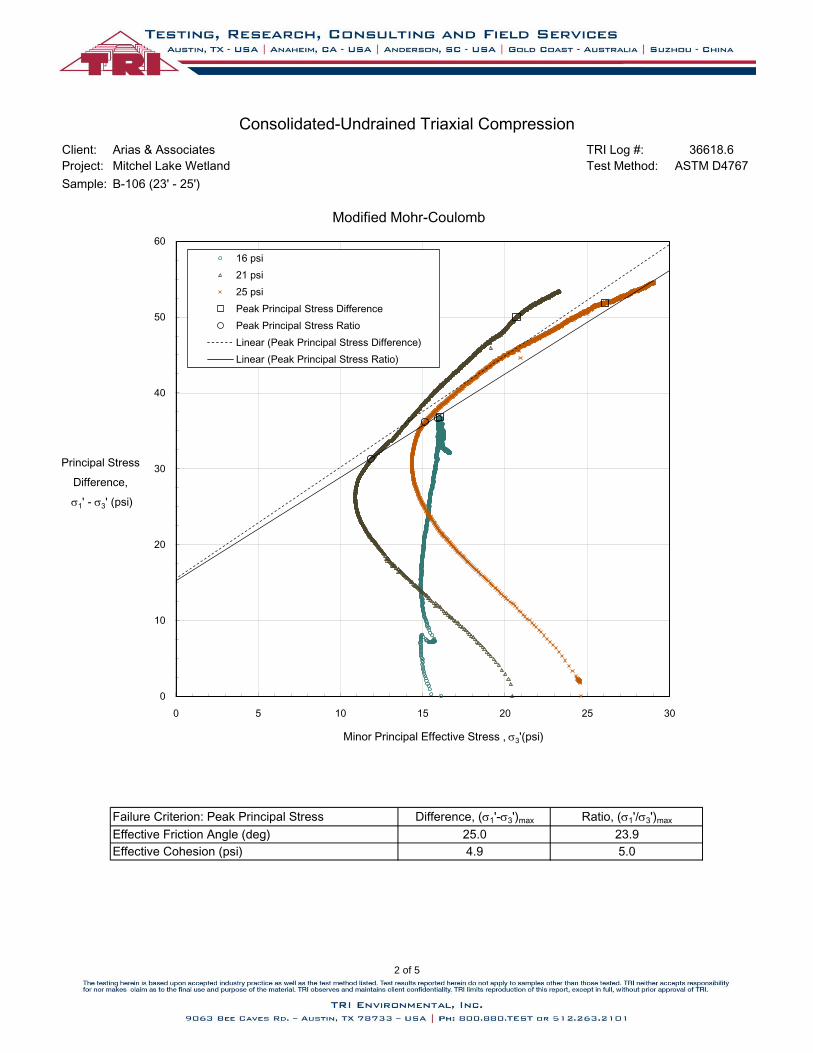
Client: Arias & Associates TRI Log #:
Project: Mitchel Lake Wetland Test Method:
Sample: B-106 (23' - 25')
Consolidated-Undrained Triaxial Compression
ASTM D4767
36618.6
3
Ratio, (s1'/s3')max
25.0 23.9
4.9 5.0
Difference, (s1'-s3')max
Effective Friction Angle (deg)
Effective Cohesion (psi)
Failure Criterion: Peak Principal Stress
0
10
20
30
40
50
60
0 5 10 15 20 25 30
Principal Stress
Difference,
s1' - s3' (psi)
Minor Principal Effective Stress , s3'(psi)
Modified Mohr-Coulomb
16 psi
21 psi
25 psi
Peak Principal Stress Difference
Peak Principal Stress Ratio
Linear (Peak Principal Stress Difference)
Linear (Peak Principal Stress Ratio)
2 of 5
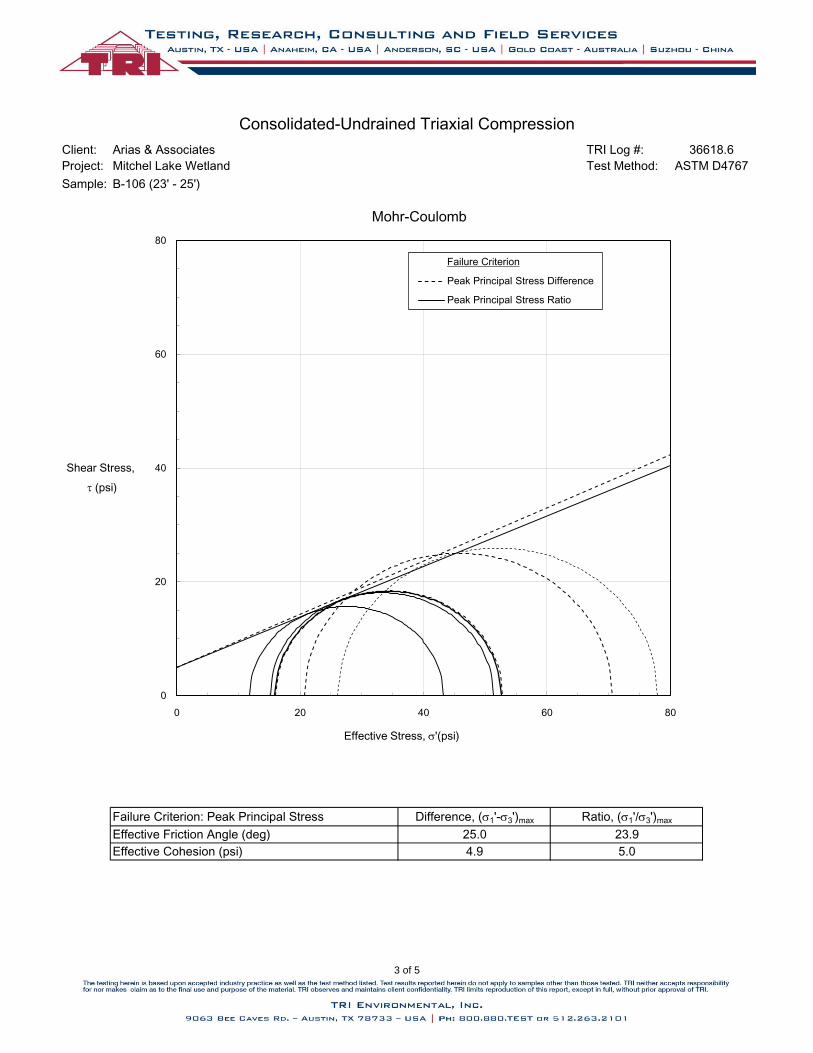
Client: Arias & Associates TRI Log #:
Project: Mitchel Lake Wetland Test Method:
Sample: B-106 (23' - 25')
Consolidated-Undrained Triaxial Compression
ASTM D4767
36618.6
Difference, (s1'-s3')max Ratio, (s1'/s3')max
5.04.9
25.0 23.9
Failure Criterion: Peak Principal Stress
Effective Friction Angle (deg)
Effective Cohesion (psi)
80
0
20
40
60
80
0 20 40 60 80
Shear Stress,
t (psi)
Effective Stress, s'(psi)
Mohr-Coulomb
Failure Criterion
Peak Principal Stress Difference
Peak Principal Stress Ratio
3 of 5
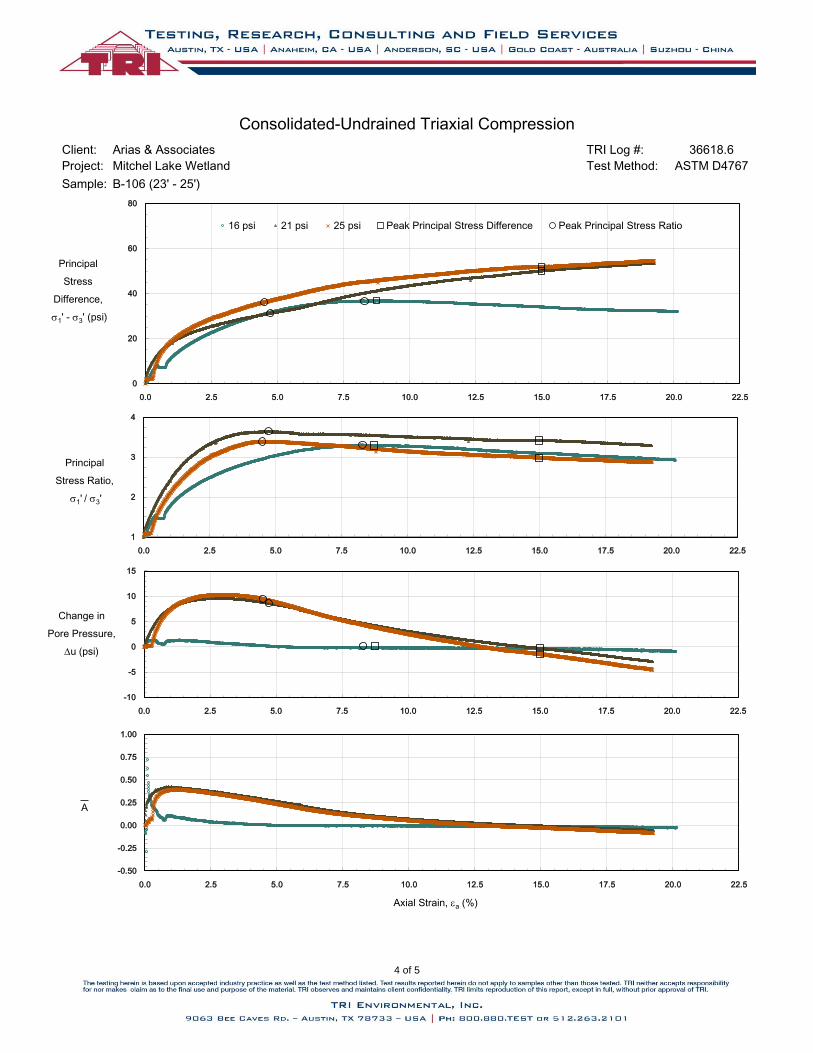
Client: Arias & Associates TRI Log #:
Project: Mitchel Lake Wetland Test Method:
Sample: B-106 (23' - 25')
Consolidated-Undrained Triaxial Compression
ASTM D4767
36618.6
-10
-5
0
5
10
15
0.0 2.5 5.0 7.5 10.0 12.5 15.0 17.5 20.0 22.5
Change in
Pore Pressure,
Du (psi)
-0.50
-0.25
0.00
0.25
0.50
0.75
1.00
0.0 2.5 5.0 7.5 10.0 12.5 15.0 17.5 20.0 22.5
A
Axial Strain, ea (%)
1
2
3
4
0.0 2.5 5.0 7.5 10.0 12.5 15.0 17.5 20.0 22.5
Principal
Stress Ratio,
s1' / s3'
0
20
40
60
80
0.0 2.5 5.0 7.5 10.0 12.5 15.0 17.5 20.0 22.5
Principal
Stress
Difference,
s1' - s3' (psi)
16 psi 21 psi 25 psi Peak Principal Stress Difference Peak Principal Stress Ratio
4 of 5
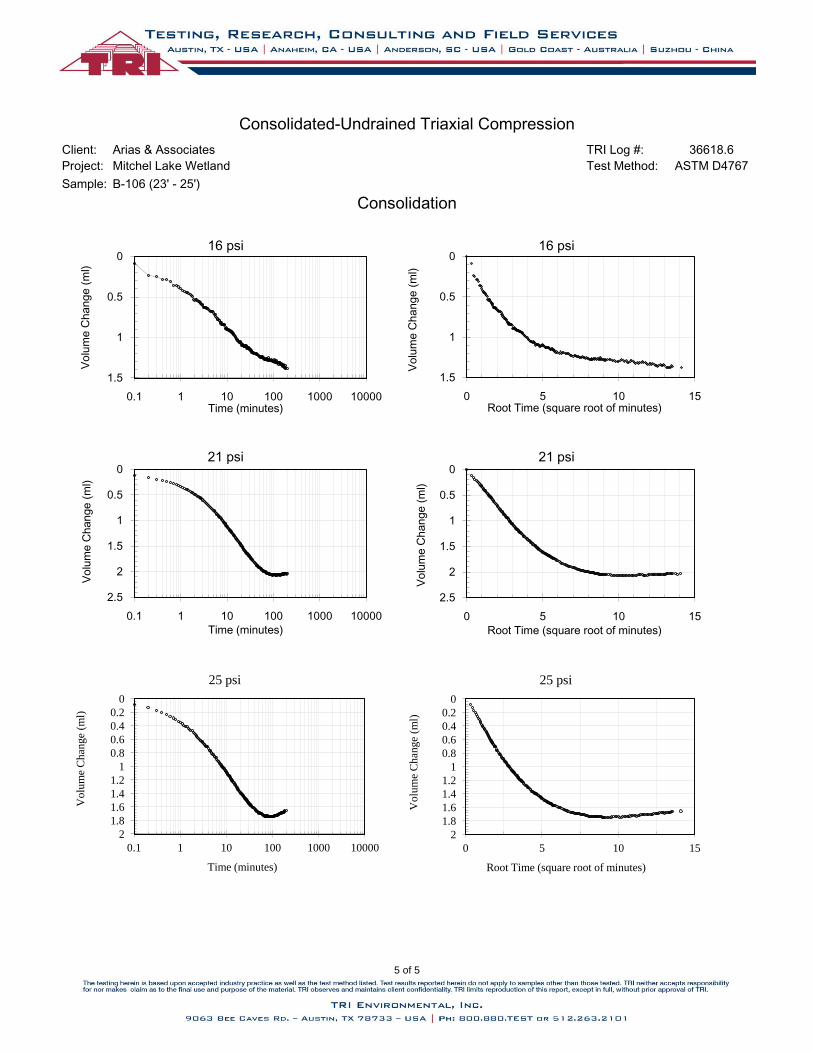
Client: Arias & Associates TRI Log #:
Project: Mitchel Lake Wetland Test Method:
Sample: B-106 (23' - 25')
Consolidated-Undrained Triaxial Compression
ASTM D4767
36618.6
Xmin
Xmax
Xmajor
Xminor
Consolidation
0
0.5
1
1.5
0.1 1 10 100 1000 10000
Vo
lum
e C
ha
ng
e (
ml)
Time (minutes)
16 psi 0
0.5
1
1.5
0 5 10 15
Volu
me C
hange (
ml)
Root Time (square root of minutes)
16 psi
0
0.5
1
1.5
2
2.5
0.1 1 10 100 1000 10000
Volu
me C
hange (
ml)
Time (minutes)
21 psi 0
0.5
1
1.5
2
2.5
0 5 10 15
Volu
me C
hange (
ml)
Root Time (square root of minutes)
21 psi
0
0.2
0.4
0.6
0.8
1
1.2
1.4
1.6
1.8
2
0.1 1 10 100 1000 10000
Vo
lum
e C
han
ge
(ml)
Time (minutes)
25 psi
0
0.2
0.4
0.6
0.8
1
1.2
1.4
1.6
1.8
2
0 5 10 15
Vo
lum
e C
han
ge
(ml)
Root Time (square root of minutes)
25 psi
5 of 5
Arias Geoprofessionals H-1 Arias Job No. 2017-698
APPENDIX H: HYDRAULIC CONDUCTIVITY
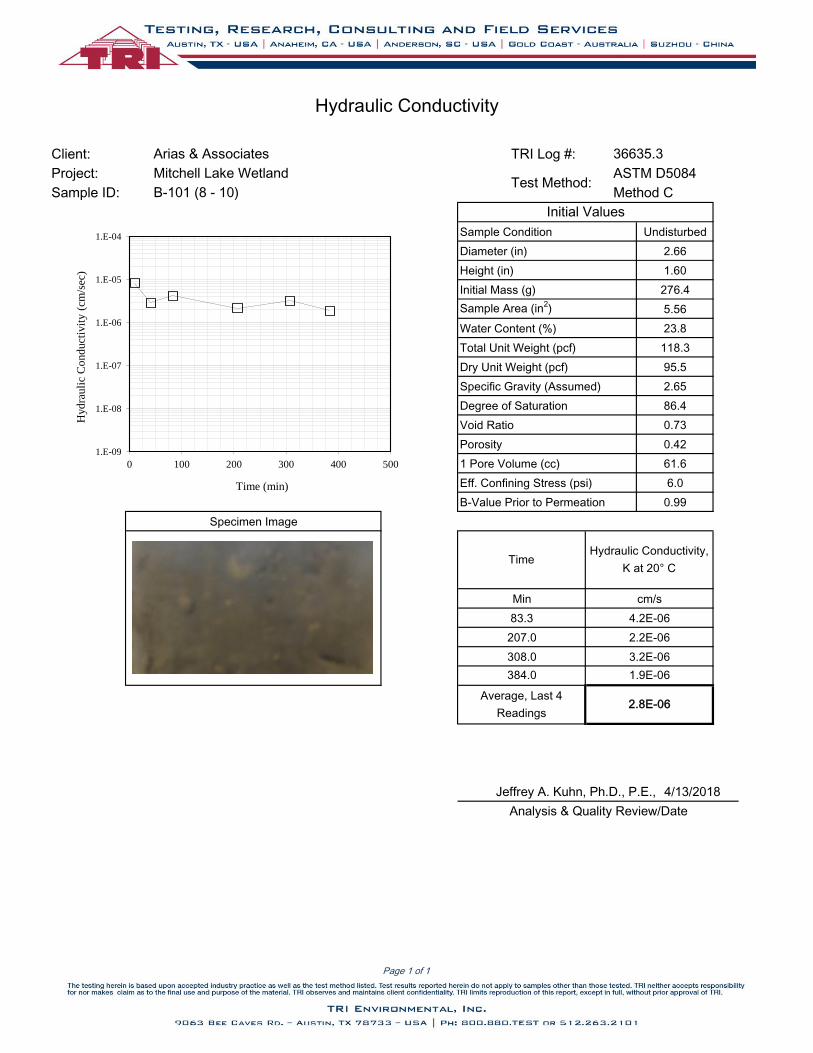
Client: TRI Log #:
Project: ASTM D5084
Sample ID: Method C
Sample Condition
Diameter (in)
Height (in)
Initial Mass (g)
Sample Area (in2)
Water Content (%)
Total Unit Weight (pcf)
Dry Unit Weight (pcf)
Specific Gravity (Assumed)
Degree of Saturation
Void Ratio
Porosity
1 Pore Volume (cc)
Eff. Confining Stress (psi)
B-Value Prior to Permeation
NA
2.8E-06
Specimen Image
Analysis & Quality Review/Date
4/13/2018Jeffrey A. Kuhn, Ph.D., P.E.,
cm/s
TimeHydraulic Conductivity,
K at 20° C
4.2E-06
2.2E-06
384.0
Average, Last 4
Readings
1.9E-06
207.0
61.6
2.66
1.60
23.8
2.65
5.56
308.0 3.2E-06
6.0
0.99
83.3
Min
Initial Values
Hydraulic Conductivity
Arias & Associates 36635.3
Mitchell Lake Wetland
B-101 (8 - 10)Test Method:
Undisturbed
276.4
118.3
95.5
86.4
0.73
0.421.E-09
1.E-08
1.E-07
1.E-06
1.E-05
1.E-04
0 100 200 300 400 500
Hyd
rauli
c C
ond
uct
ivit
y (
cm/s
ec)
Time (min)
Page 1 of 1
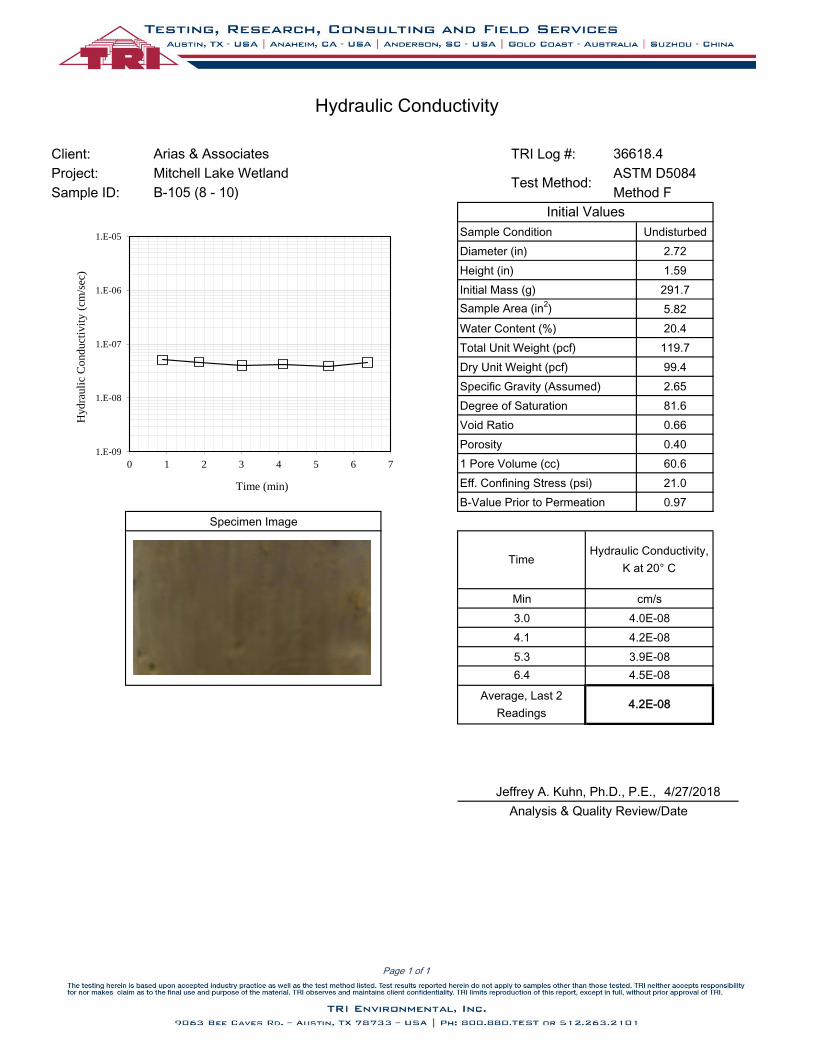
Client: TRI Log #:
Project: ASTM D5084
Sample ID: Method F
Sample Condition
Diameter (in)
Height (in)
Initial Mass (g)
Sample Area (in2)
Water Content (%)
Total Unit Weight (pcf)
Dry Unit Weight (pcf)
Specific Gravity (Assumed)
Degree of Saturation
Void Ratio
Porosity
1 Pore Volume (cc)
Eff. Confining Stress (psi)
B-Value Prior to Permeation
Initial Values
Hydraulic Conductivity
Arias & Associates 36618.4
Mitchell Lake Wetland
B-105 (8 - 10)Test Method:
Undisturbed
291.7
119.7
99.4
81.6
0.66
0.40
5.3 3.9E-08
21.0
0.97
3.0
Min
60.6
2.72
1.59
20.4
2.65
5.82
NA
4.2E-08
Specimen Image
Analysis & Quality Review/Date
4/27/2018Jeffrey A. Kuhn, Ph.D., P.E.,
cm/s
TimeHydraulic Conductivity,
K at 20° C
4.0E-08
4.2E-08
6.4
Average, Last 2
Readings
4.5E-08
4.1
1.E-09
1.E-08
1.E-07
1.E-06
1.E-05
0 1 2 3 4 5 6 7
Hyd
rauli
c C
ond
uct
ivit
y (
cm/s
ec)
Time (min)
Page 1 of 1
Arias Geoprofessionals I-1 Arias Job No. 2017-698
APPENDIX I: ASFE INFORMATION – GEOTECHNICAL REPORT
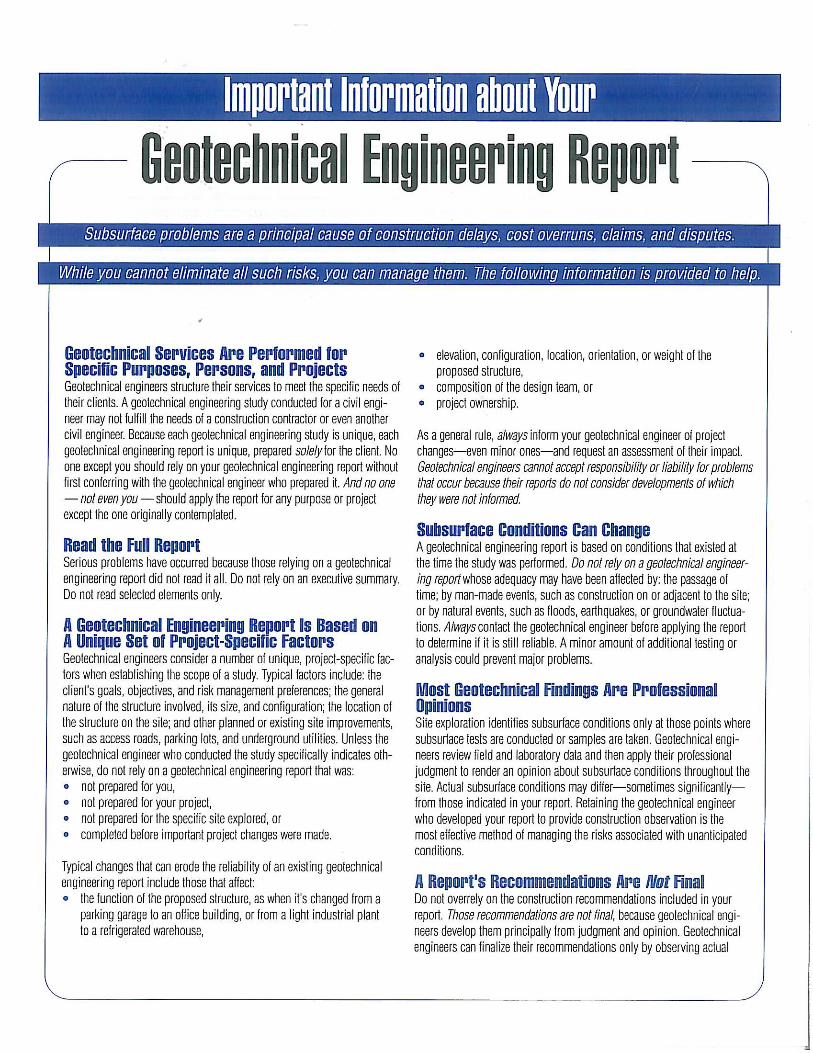
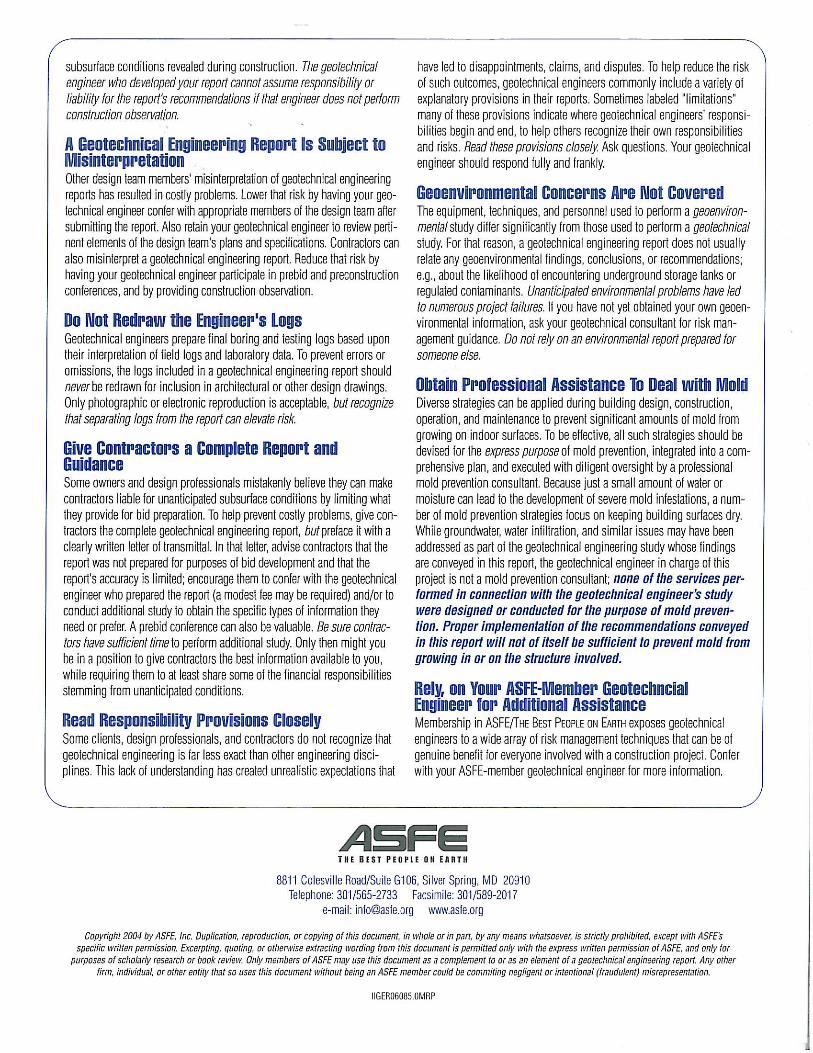
Arias Geoprofessionals J-1 Arias Job No. 2017-698
APPENDIX J: PROJECT QUALITY ASSURANCE
8811 Colesville Road Suite G106 Silver Spring, Maryland 20910 Voice: 301.565.2733 Fax: 301.589.2017 E-mail: [email protected] Internet: www.asfe.org
PROJECT QUALITY ASSURANCE
1
Construction materials engineering and testing (CoMET) consultants perform quality-assurance (QA) services to evaluate the degree to which constructors are achieving the specified conditions they’re contractually obligated to achieve. Done right, QA can save you time and money; prevent unanticipated-conditions claims, change orders, and disputes; and reduce short-term and long-term risks, especially by detecting molehills before they grow into mountains.
Many owners don’t do QA right because they follow bad advice; e.g., “CoMET consultants are all the same. They all have accredited facilities and certified personnel. Go with the low bidder.” But there’s no such thing as a standard QA scope of service, meaning that – to bid low – each interested firms must propose the cheapest QA service it can live with, jeopardizing service quality and aggravating risk for the entire project team. Besides, the advice is based on misinformation.
Fact: Most CoMET firms are not accredited, and the quality of those that are varies significantly. Accreditation – which is important – nonetheless means that a facility met an accrediting body’s minimum criteria. Some firms practice at a much higher level; others just barely scrape by. And what an accrediting body typically evaluates – management, staff, facilities, and equipment – can change substantially before the next review, two, three, or more years from now.
Fact: It’s dangerous to assume CoMET personnel are certified. Many have no credentials at all; some are certified by organizations of questionable merit, while others have a valid certification, but not for the services they’re assigned.
Some CoMET firms – the “low-cost providers” – want you to believe that price is the only difference between QA providers. It’s not, of course. Firms that sell low price typically lack the facilities, equipment, personnel, and insurance quality-oriented firms invest in to achieve the reliability concerned owners need to achieve quality in quality assurance.
A Message to Owners
Done right, QA can save you time and
money; prevent claims and disputes; and
reduce risks. Many owners don’t do QA
right because they follow bad advice.
Most CoMET firms are not accredited.
It’s dangerous to assume CoMET
personnel are certified.
PROJECT QUALITY ASSURANCE
To derive maximum value from your investment in QA, require the CoMET firm’s project manager to serve actively on the project team from beginning to end, a level of service that’s relatively inexpensive and can pay huge dividends. During the project’s planning and design stages, experienced CoMET professionals can help the design team develop uniform technical specifications and establish appropriate observation, testing, and instrumentation procedures and protocols. They can also analyze plans and specs much as constructors do, looking for the little errors, omissions, conflicts, and ambiguities that often become the basis for big extras and big claims. They can provide guidance about operations that need closer review than others, because of their criticality or potential for error or abuse. They can also relate their experience with the various constructors that have expressed interest in your project.
CoMET consultants’ construction-phase QA services focus on two distinct issues: those that relate to geotechnical engineering and those that relate to the other elements of construction.
The geotechnical issues are critically important because they are essential to the “observational method” geotechnical engineers use to significantly reduce the amount of sampling they’d otherwise require. They apply the observational method by developing a sampling plan for a project, and then assigning field representatives to ensure
samples are properly obtained, packaged, and transported. The engineers review the samples and, typically, have them tested in their own laboratories. They use the information they derive to characterize the site’s subsurface and develop preliminary recommendations for the structure’s foundations and for the specifications of various “geo” elements, like excavations, site grading, foundation-bearing grades, and roadway and parking-lot preparation and surfacing.
Geotechnical engineers cannot finalize
their recommendations until they or
their field representatives are on site to
observe what’s excavated to verify that
the subsurface conditions the engineers
predicted are those that actually exist.
When unanticipated conditions are observed, recommendations and/or specifications should be modified.
Responding to client requests, many geotechnical-engineering firms have expanded their field-services mix, so they’re able to perform overall construction QA, encompassing – in addition to geotechnical issues – reinforced concrete, structural steel, welds, fireproofing, and so on. Unfortunately, that’s caused some confusion. Believing that all CoMET consultants are alike, some owners take bids for the overall CoMET package, including the geotechnical field observation. Entrusting geotechnical field observation to someone other than the geotechnical engineer of record (GER) creates a significant risk.
Firms that sell low price typically lack the facilities, equipment, personnel,
and insurance quality-oriented firms invest in to achieve the reliability
concerned owners need to achieve quality in quality assurance.
To derive maximum value, require the project manager to
serve actively on the project team from beginning to end.
2
3
PROJECT QUALITY ASSURANCE
GERs have developed a variety of protocols to optimize the quality of their field-observation procedures. Quality-focused GERs meet with their field representatives before they leave for a project site, to brief them on what to look for and where, when, and how to look. (No one can duplicate this briefing, because no one else knows as much about a project’s geotechnical issues.) And once they arrive at a project site, the field representatives know to maintain timely, effective communication with the GER, because that’s what the GER has trained them to do. By contrast, it’s extremely rare for a different firm’s field personnel to contact the GER, even when they’re concerned or confused about what they observe, because they regard the GER’s firm as “the competition.”
Divorcing the GER from geotechnical field operations is almost always penny-wise and pound-foolish. Still, because owners are given bad advice, it’s commonly done, helping to explain why “geo” issues are the number-one source of construction-industry claims and disputes.
To derive the biggest bang for the QA buck, identify three or even four quality-focused CoMET consultants. (If you don’t know any,
use the “Find a Geoprofessional” service available free at www.asfe.org.) Ask about the firms’ ongoing and recent projects and the clients and client representatives involved; insist upon receiving verification of all claimed accreditations, certifications, licenses, and insurance coverages.
Insist upon receiving verification of all
claimed accreditations, certifications,
licenses, and insurance coverages.
Once you identify the two or three most qualified firms, meet with their representatives, preferably at their own facility, so you can inspect their laboratory, speak with management and technical staff, and form an opinion about the firm’s capabilities and attitude.
Insist that each firm’s designated project manager participate in the meeting. You will benefit when that individual is a seasoned QA professional familiar with construction’s rough-and-tumble. Ask about others the firm will assign, too. There’s no substitute for experienced personnel who are familiar with the codes and standards involved and know how to: • read and interpret plans and specifications; • perform the necessary observation,
inspection, and testing; • document their observations and findings; • interact with constructors’ personnel; and • respond to the unexpected.
Important: Many of the services CoMET QA field representatives perform – like observing operations and outcomes – require the good judgment afforded by extensive training and experience, especially in situations where standard operating procedures do not apply. You need to know who will be exercising that judgment: a 15-year “veteran” or a rookie?
Geotechnical engineers cannot finalize their recommendations until they are
on site to verify that the subsurface conditions they predicted are those that
actually exist. Entrusting geotechnical field observation to someone other than
the geotechnical engineer of record (GER) creates a significant risk.
Divorcing the GER from geotechnical field operations is almost
always penny-wise and pound-foolish, helping to explain
why “geo” issues are the number-one source of construction-
industry claims and disputes.
4
PROJECT QUALITY ASSURANCE
Also consider the tools CoMET personnel use. Some firms are passionate about proper calibration; others, less so. Passion is a good thing! Ask to see the firm’s calibration records. If the firm doesn’t have any, or if they are not current, be cautious. You cannot trust test results derived using equipment that may be out of calibration. Also ask a firm’s representatives about their reporting practices, including report distribution, how they handle notifications of nonconformance, and how they resolve complaints.
For financing purposes, some owners require the constructor to pay for CoMET services. Consider an alternative approach so you don’t convert the constructor into the CoMET consultant’s client. If it’s essential for you to fund QA via the constructor, have the CoMET fee included as an allowance in the bid documents. This arrangement ensures that you remain the CoMET consultant’s client, and it prevents the CoMET fee from becoming part of the constructor’s bid-price competition. (Note that the International Building Code (IBC) requires the owner to pay for Special Inspection (SI) services commonly performed by the CoMET consultant as a service separate from QA, to help ensure the SI services’ integrity. Because failure to comply could result in denial of an occupancy or use permit, having a contractual agreement that conforms to the IBC mandate is essential.)
If it’s essential for you to fund QA via the
constructor, have the CoMET fee included as
an allowance in the bid documents. Note,
too, that the International Building Code
(IBC) requires the owner to pay for Special
Inspection (SI) services.
CoMET consultants can usually quote their fees as unit fees, unit fees with estimated total (invoiced on a unit-fee basis), or lump-sum (invoiced on a percent-completion basis referenced to a schedule of values). No matter which method is used, estimated quantities need to be realistic. Some CoMET firms lower their total-fee estimates by using quantities they know are too low and then request change orders long before QA is complete.
Once you and the CoMET consultant settle on the scope of service and fee, enter into a written contract. Established CoMET firms have their own contracts; most owners sign them. Some owners prefer to use different contracts, but that can be a mistake when the contract was prepared for construction services. Professional services are different. Wholly avoidable problems occur when a contract includes provisions that don’t apply to the services involved and fail to include those that do.
Many of the services CoMET QA field representatives perform
require good judgment.
Scope flexibility is needed to deal promptly
with the unanticipated.
Some owners create wholly avoidable
problems by using a contract prepared for
construction services.
8811 Colesville Road Suite G106 Silver Spring, Maryland 20910 Voice: 301.565.2733 Fax: 301.589.2017 E-mail: [email protected] Internet: www.asfe.org
PROJECT QUALITY ASSURANCE
This final note: CoMET consultants perform QA for owners, not constructors. While constructors are commonly allowed to review QA reports as a courtesy, you need to make it clear that constructors do not have a legal right to rely on those reports; i.e., if constructors want to forgo their own observation and testing and rely on results derived from a scope created to meet only the needs of the owner, they
must do so at their own risk. In all too many cases where owners have not made that clear, some constructors have alleged that they did have a legal right to rely on QA reports and, as a result, the CoMET consultant – not they – are responsible for their failure to deliver what they contractually promised to provide. The outcome can be delays and disputes that entangle you and all other principal project participants. Avoid that. Rely on a CoMET firm that possesses the resources and attitude needed to manage this and other risks as an element of a quality-focused service. Involve the firm early. Keep it engaged. And listen to what the CoMET consultant says. A good CoMET consultant can provide great value.
For more information, speak with your ASFE-Member CoMET consultant or contact ASFE directly.
5