Embed Size (px)
Citation preview

0
© Copyright 2015, Sawtooth Software, Inc.
1457 E 840 N Orem, Utah
+1 801 477 4700
www.sawtoothsoftware.com
Sawtooth Software
RESEARCH PAPER SERIES
Choice Experiments for
Pharmaceutical Market Research
Keith Chrzan
Sawtooth Software, Inc.

1
Choice Experiments for Pharmaceutical Marketing Research
Keith Chrzan, Sawtooth Software
Marketing researchers in many industries, academic departments and government agencies use choice experiments to understand how people make decisions. Most industries have aspects that make their choice modelling efforts unique and interesting. FMCG markets typically deal with large numbers of brands, prices and promotions and often need to show their choice sets as shelf displays with product package images; many technology categories feature complex bundles of product and service offerings often best represented as menus. Consumer durable manufacturers often need to understand customers’ preferences for large or very large numbers of attributes. And the list goes on. Perhaps no industry faces the number of challenges or deploys the variety of model formats that pharmaceutical researchers do in understanding physicians’ prescribing decisions. Below, a brief description of the challenges facing pharmaceutical marketing researchers precedes a review of the varieties of choice models available to them. A final section offers some recommendations to improve physician choice models, or at least to make them simpler for respondents and analysts. Challenges With its limited universe of expensive respondents pharmaceutical marketing research resembles B2B research among executive decision makers. These two factors, a finite sample frame and the need to offer honoraria (often $100 or more) combine to keep physician samples smaller than those in consumer research studies. Whereas the latter may include 1,000 or more respondents with multiple separately reportable subgroups of 200 respondents or more, physician studies typically make do with samples in the low hundreds and with correspondingly smaller subgroups (usually physician specialties). Often we take this constraint as a given, a cost of doing surveys among physicians. Aspects intrinsic to pharmaceutical research contribute challenges of their own. First the attributes may include medical terminology of taxing cognitive complexity which may be better understood by some physician specialties than by others. Moreover, physicians’ choices often influence (and are influenced by) decisions made by other stakeholders - usually payers, who influence the extent to which insurance will reimburse different drug therapies, and patients, who have their own therapy preferences and who in any case often make the final decision about whether or not to follow their doctors’ advice. Finally, some elements of the choice experiment compound the problem of limited sample size. A physician may well not prescribe the same therapy for all of the patients she treats for a given ailment, so asking a respondent to make discrete choices among products may frustrate her and lead to less accurate data. Thus modelers need to account for this patient heterogeneity in the design and analysis of choice experiments. In an extreme case an experiment may model physicians’ choices as a function of drug attributes and patient characteristics, a model form that explodes the number of parameters (utilities) to be estimated, putting even more pressure on limited sample size. These elements lead to the variety of choice model formats seen in pharmaceutical marketing research. Varieties of Pharmaceutical Choice Models The examples below use a simple choice experiment of five attributes with three levels each to illustrate the range of choice model formats available to pharmaceutical marketing researchers. First, a standard

2
choice-based conjoint (CBC) model, one asking respondents to make discrete choices among multiple products, may work for some applications:
Figure 1: Standard CBC
This standard CBC format is the one most frequently used in most industries, and coupled with a statistical model known as multinomial logit (MNL), a set of experimentally designed questions like this one will enable the researcher to estimate utilities, run simulations and so on. For the reasons noted above, formats that incorporate patient heterogeneity have been more the norm in pharmaceutical marketing research. One way has physician respondents allocate their next 10 (or next 100) patients with the subject medical condition to the different therapies.
Figure 2: Allocation CBC
An allocation model will produce utilities very similar to those from a standard CBC, so their interpretation, their use in simulations and so on will be the same. The utilities will tend to be smaller to reflect the more splitting of votes inherent in an allocation but they will have the same interpretation as utilities from a standard CBC based on discrete choices. Alternatively, if the researcher knows in advance about specific patient types of interest, we could structure the CBC as a grid question, in this case three rows of responses, one per patient type and one discrete choice per row:

3
Figure 3: Multi-Choice CBC Grid
In this case the client will probably want a report and simulator that separates the three patient types. Whether this is best run as three separate models or as a single HB model using patient type as a covariate and then separately reporting by patient type post hoc remains unknown, though Sawtooth Software plans to investigate the question. Sometimes, however, a small number of patient types will not suffice to capture the rich variety of patients a physician treats, so an even more taxing task for the physician may result, a Multi-Choice CBC Allocation Grid:
Figure 4: Multi-Choice CBC Allocation Grid
Now each row must sum to 10 (or 100) patients and again the question of whether this is best run as three models or one with covariates arises. With the physician having to perform multiple allocations

4
per choice task, each CBC question can become time consuming and the researcher will be inclined to reduce the number of choice questions per respondent (this is problematic, because the number of respondents may be small in the first place). Before wrapping up the subject of patient heterogeneity it is worth a detour to note that not all physician CBC studies will have multiple product profiles that vary from one choice set to the next. In many applications a single new product (“Product J”) has distinct, changing attribute levels, while the other alternatives are fixed. Call this a Single Product CBC:
Figure 5: Single Product CBC
This is essentially a standard CBC question with one varying alternative and five fixed alternatives. If space allows one could also show this so that all of the therapy choices had boxes the size of Product J’s, in order to prevent a bias in favor of Product J. If the other therapy choices share attributes with Product J those could be shown, even if they do not change from one question to the next. This model has four more constants (for fixed alternatives) than does the CBC in Figure 1 so it has 15 parameters to estimate ([5*3]-5)+5 compared to just 11 in the Figure 1 CBC. Moreover it has to estimate these parameters with fewer observations because each choice question shows only one profile with attributes and levels instead of three, putting quite a bit more stress on our limited sample size. Of course this question could also be framed as an allocation, a discrete choice grid or even an allocation grid to accommodate patient heterogeneity, complicating the design, administration and analysis accordingly, as in Figure 6:

5
Figure 6: Single Product CBC with Grid Allocation
Of course this grid could have products across the top and patient types down the side if that would make more sense to respondents. Sometimes the new product is fixed (drugs are molecules, after all, and not amenable to change regardless of the value of those changes to the marketing department). Or perhaps the drug has already entered the market. In these cases the product may appear as a concept description (Product X) and the experiment could focus even more on patient heterogeneity. Such an experiment would have experimentally described attributes and levels that describe the patient, not the therapies:
6
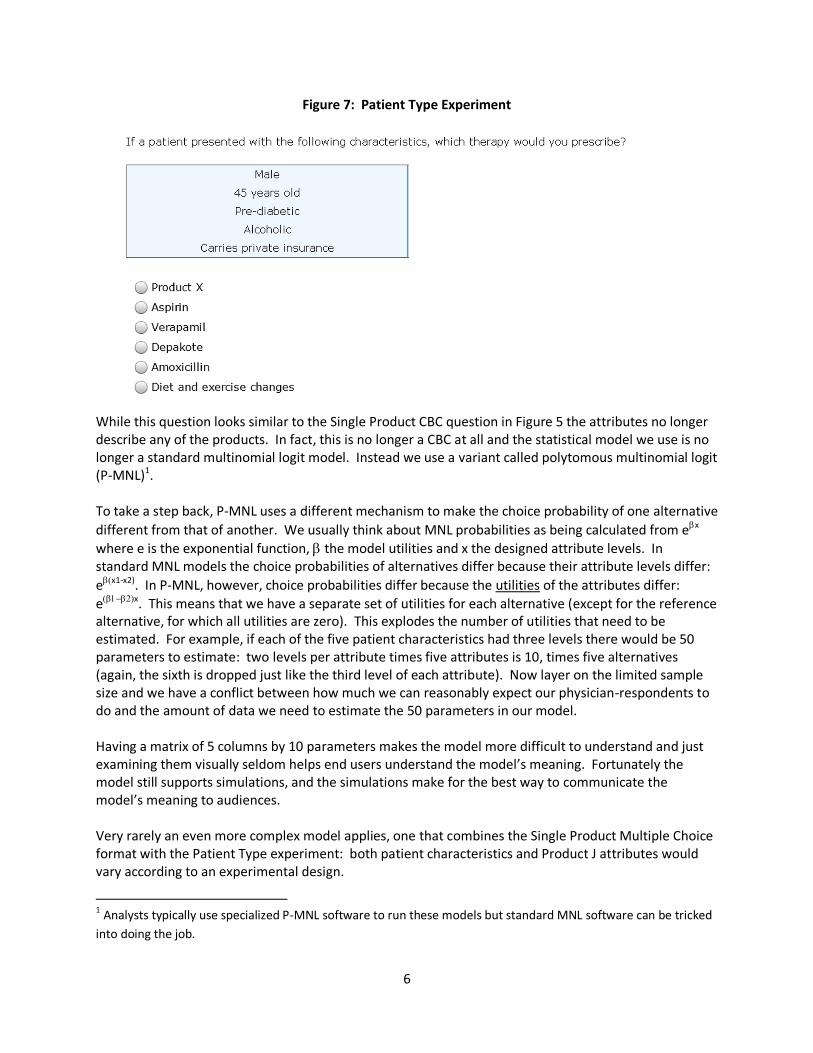
Figure 7: Patient Type Experiment
While this question looks similar to the Single Product CBC question in Figure 5 the attributes no longer describe any of the products. In fact, this is no longer a CBC at all and the statistical model we use is no longer a standard multinomial logit model. Instead we use a variant called polytomous multinomial logit (P-MNL)1. To take a step back, P-MNL uses a different mechanism to make the choice probability of one alternative
different from that of another. We usually think about MNL probabilities as being calculated from ex
where e is the exponential function, the model utilities and x the designed attribute levels. In standard MNL models the choice probabilities of alternatives differ because their attribute levels differ:
ex1-x2). In P-MNL, however, choice probabilities differ because the utilities of the attributes differ:
ex. This means that we have a separate set of utilities for each alternative (except for the reference alternative, for which all utilities are zero). This explodes the number of utilities that need to be estimated. For example, if each of the five patient characteristics had three levels there would be 50 parameters to estimate: two levels per attribute times five attributes is 10, times five alternatives (again, the sixth is dropped just like the third level of each attribute). Now layer on the limited sample size and we have a conflict between how much we can reasonably expect our physician-respondents to do and the amount of data we need to estimate the 50 parameters in our model. Having a matrix of 5 columns by 10 parameters makes the model more difficult to understand and just examining them visually seldom helps end users understand the model’s meaning. Fortunately the model still supports simulations, and the simulations make for the best way to communicate the model’s meaning to audiences. Very rarely an even more complex model applies, one that combines the Single Product Multiple Choice format with the Patient Type experiment: both patient characteristics and Product J attributes would vary according to an experimental design.
1 Analysts typically use specialized P-MNL software to run these models but standard MNL software can be tricked
into doing the job.

7
Figure 8 – Hybrid Choice Experiment
The model for this format would combine standard and P-MNL, giving it more parameters to estimate and making it even more demanding in terms of sample size and even more in need of a simulator to facilitate understanding what the model means. Interactions between patient characteristics and the attributes of Product J would complicate matters further and add many more parameters to the model. Recommendations Here are three things pharmaceutical choice modelers can do to improve the quality of their choice models and the experience of their physician respondents: a truth, a freebie and a trick. The truth: Clients don’t want to hear it, but paying for larger samples will make for better models. There are things researchers can do to ameliorate small sample sizes (ensure respondents understand questions, pretest surveys, use pop-ups to define terms, use constrained estimation to prevent utility reversals), but having more sample will increase the accuracy of physician choice models independently of those other efforts. When possible, marketing researchers should make the effort to get their sponsors to finance larger sample sizes.

8
The freebie: Somehow many researchers have gotten the idea that they should only show two product profiles per choice set. In cases of complex and wordy attribute levels this is true, but often it is not. Showing three or four would improve the efficiency of the experimental design faster than it will make the respondent task more difficult. Adding a third or fourth alternative to each choice set has the same effect as adding more sample – it decreases the standard errors of utility estimates, often at little or no cost. Respondents may not read all the information in the product descriptions and often use screening rules based on a subset of attributes to make their decisions, so doubling the number of designed alternatives in a choice question usually doesn’t double the time or effort on the part of respondents. The trick: In some cases we can use a technique called data fusion to reduce the number of allocation questions we ask respondents. For example, imagine a difficult allocation experiment with a dozen allocation questions where we vary the description of Product J and we have respondents choose among Product J and seven branded fixed alternatives. Instead we do a two-part CBC. One part would feature just two allocation questions (one designed to give Product J a high share and one with a relatively impoverished version of Product J to earn it a low share). Different respondents might well see different strong and weak versions of Product J. The second part would be a standard product-based CBC that only included the attributes and levels of Product J. It turns out we can use the MNL choice rule (or HB analysis) to fuse the CBC and the two allocation questions together, using the allocation questions to scale the attributes and levels of the Product J CBC questions to make them appropriate for simulations. We’ve used this trick on several occasions to greatly simplify the survey burden on respondents, believing that in so doing we reduce the error that goes into our models. Conclusion A variety of choice model formats are available to enable researchers to model prescribing decisions realistically. Some of these models are complex and sample hungry, yet pharmaceutical marketing researchers often have to make do with relatively small sample sizes. Some changes to the design of experiments may ameliorate some of these challenges.