Embed Size (px)
Citation preview
Technische Universitat MunchenInstitut fur Technische ChemieProf. Dr. Johannes A. Lercher
Universite LavalDepartement de Genie ChimiqueProf. Serge Kaliaguine Ph.D.
SBA-16 MaterialsSynthesis, Diffusion and Sorption Properties
Author: Oliver Christian GobinAdviser: Prof. Serge Kaliaguine Ph.D.Laval University, Ste-Foy, Quebec, Canada, January 2006
Contents
Acknowledgments iii
Symbols and abbreviations iv
1. Introduction and motivation 1
2. Fundamentals of bi-porous materials 22.1. Porous materials . . . . . . . . . . . . . . . . . . . . . . . . . . . . . . . 22.2. Synthesis of mesoporous siliceous materials . . . . . . . . . . . . . . . . . 3
2.2.1. Silica polymerization . . . . . . . . . . . . . . . . . . . . . . . . . 32.2.2. Concept of templating . . . . . . . . . . . . . . . . . . . . . . . . 4
2.3. Overview of micro and mesoporous materials . . . . . . . . . . . . . . . . 62.3.1. Materials with hexagonal symmetry . . . . . . . . . . . . . . . . . 72.3.2. Materials with cubic symmetry . . . . . . . . . . . . . . . . . . . 8
2.4. Evolution of bi-porous materials . . . . . . . . . . . . . . . . . . . . . . . 10
3. Methods and calculations 143.1. Physisorption . . . . . . . . . . . . . . . . . . . . . . . . . . . . . . . . . 14
3.1.1. Theoretical isotherms . . . . . . . . . . . . . . . . . . . . . . . . . 153.1.2. The BET-surface analysis . . . . . . . . . . . . . . . . . . . . . . 163.1.3. Micropore analysis . . . . . . . . . . . . . . . . . . . . . . . . . . 173.1.4. Pore size distributions . . . . . . . . . . . . . . . . . . . . . . . . 183.1.5. Measurements . . . . . . . . . . . . . . . . . . . . . . . . . . . . . 20
3.2. X-ray diffraction (XRD) . . . . . . . . . . . . . . . . . . . . . . . . . . . 203.3. Small angle X-ray scattering (SAXS) . . . . . . . . . . . . . . . . . . . . 213.4. Transmission electron microscopy (TEM) . . . . . . . . . . . . . . . . . . 213.5. Scanning electron microscopy (SEM) . . . . . . . . . . . . . . . . . . . . 223.6. Zero length column (ZLC) chromatography . . . . . . . . . . . . . . . . . 23
3.6.1. Introduction . . . . . . . . . . . . . . . . . . . . . . . . . . . . . . 233.6.2. Experimental set-up . . . . . . . . . . . . . . . . . . . . . . . . . 243.6.3. Differential ZLC Model . . . . . . . . . . . . . . . . . . . . . . . . 253.6.4. Measurements . . . . . . . . . . . . . . . . . . . . . . . . . . . . . 26
3.7. Adsorption of hydrocarbons . . . . . . . . . . . . . . . . . . . . . . . . . 273.7.1. Experimental set-up . . . . . . . . . . . . . . . . . . . . . . . . . 273.7.2. Data analysis and calculations . . . . . . . . . . . . . . . . . . . . 28
i
4. Synthesis and characterization 294.1. Synthesis of SBA-16 materials . . . . . . . . . . . . . . . . . . . . . . . . 294.2. Results and Discussions . . . . . . . . . . . . . . . . . . . . . . . . . . . 30
4.2.1. Morphology . . . . . . . . . . . . . . . . . . . . . . . . . . . . . . 304.2.2. Crystallographic structure . . . . . . . . . . . . . . . . . . . . . . 314.2.3. Mesoporous properties . . . . . . . . . . . . . . . . . . . . . . . . 344.2.4. Microporous and intrawall properties . . . . . . . . . . . . . . . . 37
4.3. Conclusions . . . . . . . . . . . . . . . . . . . . . . . . . . . . . . . . . . 41
5. Diffusional properties 425.1. Theory . . . . . . . . . . . . . . . . . . . . . . . . . . . . . . . . . . . . . 425.2. Measurements and calculations . . . . . . . . . . . . . . . . . . . . . . . 425.3. Results and Discussions . . . . . . . . . . . . . . . . . . . . . . . . . . . 435.4. Conclusions . . . . . . . . . . . . . . . . . . . . . . . . . . . . . . . . . . 50
6. Adsorption of hydrocarbons 516.1. Results and Discussion . . . . . . . . . . . . . . . . . . . . . . . . . . . . 51
7. Conclusions and perspectives 56
A. Derivation of model equations 57A.1. Differential ZLC-Model . . . . . . . . . . . . . . . . . . . . . . . . . . . . 57
B. Source codes 60B.1. Matlab source codes . . . . . . . . . . . . . . . . . . . . . . . . . . . . . 60B.2. SigmaPlot macros . . . . . . . . . . . . . . . . . . . . . . . . . . . . . . . 63
References 64
ii
Acknowledgments
First, I would like to thank my thesis adviser, Professor Serge Kaliaguine, for givingme the opportunity to work in his group at Laval University and to explore the fieldof materials chemistry and chemical engineering science. I am deeply grateful for hisvaluable advice, motivation and competent guidance during my stay in Canada. I reallyappreciated the freedom I was given.
I wish especially to thank my thesis co-adviser Professor Freddy Kleitz, who introducedand guided me during the synthesis and characterization of SBA-16 materials. I like tothank him for the fruitful and stimulating discussions and for all the advice he gave me.
I wish also to thank Professor Mladen Eic in the Department of Chemical Engineeringof University of New Brunswick in Fredericton, for the chance to work in his group duringthe second part of my stay in Canada.
I am sincerely grateful to Professor Johannes A. Lercher, who established a connectionwith Professor Serge Kaliaguine and gave me the possibility to write my seminar thesis.
I am very grateful for the help from all my colleagues at Laval University andUniversity of New Brunswick. I also like to give special thanks to Dr. Qinglin Huang forintroducing me to the ZLC technique and for all his advice and help during the analysisof the diffusion and sorption experiments.
Special thanks are due to Dr. Hendrik Dathe and Peter Haider, who supervised meduring my preparatory work at Professor Lercher’s group prior to my stay in Canada.Both Hendrik and Peter introduced me in experimental work and gave me new ideas,as for instance the use of statistical methods in formulating and solving problems inchemistry.
I gratefully thank Professor Freddy Kleitz and Professor Dongyuan Zhao for per-forming the XRD, SAXS and TEM investigations on the SBA-16 series and AnastasiaSchneider for the proof-reading of the manuscript.
Finally, I wish to thank my family for their invaluable personal and financial support,their understanding and patience.
This work is dedicated to my family, my mother, my father and my brother.
iii
Symbols and abbreviations
Latin symbols
A, B (-) dimensionless parameters (ZLC value)a, b, c (m) unit cell parametersc (mol m−3) concentration of the sorbates in the fluid phasedhkl (m) spacing between the (hkl) planesD (m) diameterD (m s−1) intracrystalline diffusivityE (J) energyF (m3 s−1) flow ratehw (m) wall thicknessh (-) Miller indexH (J) enthalpyk (-) Miller index, control variableK (-) adsorption equilibrium constantKH (-) Henry constantl (-) Miller indexn (-) BET parameter, degree of order, control variablep (Pa) pressureq (mol m−3) concentration of the adsorbed phaseq (m−1) q-value of a scattering experimentQhkl (-) crystallographic parameter depending on the space groupr radial coordinater, R (m) radiusR (m2 kg s−2 mol−1 K−1) molar universal gas constantS (m2 kg−1) specific surface areat (s) time variable or coordinatet (m) statistical thickness of the adsorbed nitrogen layerT (K) temperatureL (-) dimensionless parameter (ZLC value)v (m s−1) velocity of the fluidV (m3 kg−1) specific volumex (-) relative pressure (x = p/p0)x, y, z coordinates
iv

Symbols and abbreviations
Greek symbols
β (-) positive root (ZLC value)ε (-) porosityλ (m) wavelenghλ constant (ZLC value)µ (-) number of cavities per unit cellπ (-) number Piγ () surface tensionγ (-) dimensionless parameter (ZLC value)ρ (kg m−3) densityθ (degree) angleθ (-) normalized isotherm
Indices
0 reference or initial value1,2 first and second microporosityads adsorptionc coredes desorptioneff effectiveexp experimental valueext external propertyf fluid-phasehkl value as a function of the Miller indicesi, j, k, m, n control variablesmax maximumme mesoporous propertymi microporous propertymin minimums solid-phaset total
v
Symbols and abbreviations
Abbreviations
BET Brunauer-Emmett-Teller plotBJH Barret-Joyner-Halenda methodCMT critical micelle temperatureCMC critical micelle concentrationCMK ordered mesoporous carbon numberDSBM Dual Site-Bond ModelEDX energy dispersive X-ray microanalysisFCC fluid catalytic crackingFID flame ionization detectorHR-TEM high resolution transmission electron microscopyI inorganic component (silica source)IUPAC International Union of Pure and Applied ChemistryKIT-x Korean Institute of Technology number xKJS Kruk-Jaroniec-Sakamoto methodMCM-x Mobil Composition of Matter number xMD molecular dynamics simulationMSC model of spherical cavitiesN non-ionic surfactantNLDFT non local density function theoryNMR nuclear magnetic resonancePAA poly(acrylic acid)PE polyethylenePEO poly(ethylene oxide)PEP positron emission profilingPFG pulsed field gradientPI polyimidePluronic P123 (ethylene oxide)20-(propylene oxide)70-(ethylene oxide)20
Pluronic F127 (ethylene oxide)106-(propylene oxide)70-(ethylene oxide)106
PPO poly(propylene oxide)PS polystyrolPSD pore size distributionQENS quasi-elastic neutron scatteringS surfactantSAXS small angle X-ray scatteringSBA-x Santa-Barbara number xSEM scanning electron microscopySTP standard temperature and pressure conditionsTEM transmission electron microscopyTEOM tapered element oscillating microbalanceTEOS tetraethyl orthosilicateTAP temporal analysis of productsTST transition state theoryXRD X-ray diffractionZLC zero length column chromatography
vi
1. Introduction and motivation
The focus of this seminar thesis is the synthesis and characterization of a recentlydeveloped kind of porous silicate material. The development of new kinds of highlyspecialized materials and their characterization is fundamental for many fields of in-dustrial application and engineering science. The proper characterization involves theirmicroscopic as well as their macroscopic properties. Often only one of these properties iswell investigated, but only the combination of both properties leads to a holistic analysis.
In this thesis, a series of SBA-16 materials was synthesized and characterized bymicroscopic and macroscopic techniques, as for instance the diffusion of hydrocarbonsthrough SBA-16 particles. It is build-up on several prior studies on a series of SBA-15materials investigated by Huang et al. The comparison and discussion of differences willbe a major issue.
The structure of this thesis is in brief:
• Chapter 2 gives an overview on relevant aspects on porous materials and on theirevolution during the synthesis. The time and temperature dependent self-assemblyof these materials is fundamental to this thesis, because precisely these parameterswere used to obtain SBA-16 materials with strongly varying structural properties.
• The third chapter gathers the relevant characterization techniques and discussestheir applicability and their mathematical or numerical implementation.
• Chapter 4 gives a brief summary of the synthesis of SBA-16 materials. The mainaspect of this chapter is the proper investigation of microporous properties ofthe SBA-16 series. This involves the exact determination of pore structure andcrystallographic characteristics.
• Chapter 5 combines the prior results with a macroscopic method to measureintracrystalline diffusivities, the so called zero length column (ZLC) method. It isthe first time, that diffusivities in such a structure as SBA-16 were investigated.
• Chapter 6 involves the adsorption of hydrocarbons on the SBA-16 series, which aredirectly related to the diffusion studies. Unfortunately this chapter has becomerather short, due to a lack of experimental data.
1
2. Fundamentals of bi-porous materials
2.1. Porous materials
Porous materials have attracted the interest of scientists and industry due to variousapplications for instance in molecular separation, heterogeneous catalysis, adsorptiontechnology or opto-electronics as well as new challenges in the fundamental materialresearch.
In general the surface area of a porous material is higher than the surface of ananalogous non-porous material. Thereby the internal surface area is usually mush higherthan the one contributed by the external surface. Due to the fact that heterogeneouscatalyzed chemical reactions basically occur on surfaces or at phase boundaries, a highersurface area would, theoretically, directly yield to an improved reactivity. In realitydifferent kind of limitations can occur and have to be taken into consideration. Apartof the surface area other important characteristics of porous solids are the crystallinityor regularity if present, the distribution of pore sizes and the chemistry of the walls. Inan ideal porous material these attributes should be tailored exactly to the needs of theapplication. To be commercially interesting, such a material should be inexpensive andhighly stable for regeneration. Materials based on silicate show up such kind of flexibilityand have hence found wide fields of industrial applications.
In this chapter I will give a brief introduction to porous materials with a focus onordered silicate materials with a micro and mesoporosity. According to the IUPACdefinition [1] micropores are pores with diameter under 2 nm, mesopores with diameterbetween 2 and 50 nm and macropores have diameters greater than 50 nm. Correspondingto this definition, materials can be ’labeled’ as solids with a certain porosity. Examplesof microporous materials are Zeolites. A well-known mesoporous material is MCM-41(Mobil Composition of Matter No 41) with highly ordered pores. In this work bi-porousmaterials should be defined as materials containing both micro and mesopores. TheMCM-41 bi-porous counterpart is SBA-15 (Santa Barbara No 15). Macroporous materialsare for example porous glasses or gels.
Zeolites are highly crystalline aluminosilicates with an extremely narrow distributionof micropores. Due to the well defined structure and large surface area, zeolites arewidely deployed in very specific applications for example in the oil industry as catalyst forcracking, alkylation or shape selective catalysis, as molecular sieves or as adsorbates. Themost important limitation for application are their small pore sizes up to only 1.2 nm sofar. Molecules that just suit the pore size are inhibited and do not show high diffusivities,larger molecules with critical diameters even lager than the pore, will not be able toenter the pore. Hence for catalysis of large molecules or to improve the diffusivities
2
Chapter 2. Fundamentals of bi-porous materials
larger pores are required. A new kind of material very similar to SBA-15, but havingwalls make of ZSM-5, seems to combine the crystallographic advantages of Zeolites andthe pore structure of MCM-41 or SBA-15. Also this material have a superior thermal,hydrothermal and mechanical stability compared to SBA-15. It is made by replicationusing CMK-3 materials [2].
Another important type of porous materials, but not on the basis of silicate, areporous carbons [3, 4, 5]. Ordered porous carbons can be made by nanocasting usingmesoporous silicate as template [6, 7, 8]. One gets a negative replication of the mesoporoustemplate. Porous carbons exhibit interesting properties such as the hydrophobic natureof their surface, chemical inertness, good mechanical and thermal stability as well havingadvantages to form membranes, tubes or fibers [9]. Other types of porous materials arefor example porous coordination solids or porous heteropolyanion salts.
The main focus of this work will be porous materials based on silicate containing bothmicro- and mesopores or only mesopores. Zeolites and other types of porous materialswill not be a major issue.
2.2. Synthesis of mesoporous siliceous materials
2.2.1. Silica polymerization
The classical way of silica polymerization, the so called sol-gel process, is carried out inan aqueous solution as Iler [10] investigated in 1979. This process is rather uncontrolledleading to non or poorly ordered structures with broad pore size and molecular weightsdistributions. These porous silica are known as sol-gel materials like aerogels or xerogels.The pathways leading to ordered porous materials are very similar to the sol-gel processand will be described in the next section.
As stated before, the polymerization is carried out in an aqueous solution by addinga catalyst and a source of silica. The silica source is an important factor for thereaction conditions. Common molecular sources are alkoxysilanes like tetramethyl- andtetraethylorthosilicate or sodium silicate. Non-molecular silica source are for examplealready polymerized sol-gel materials which are leading to non-homogeneous solutions.
The first step of polymerization is the formation of silanol groups by hydrolysis ofthe alkoxide precursors, the gel, in aqueous solution:
≡ Si−OR + H2O ≡ Si−OH + ROH (2.1)
The actual polymerization occurs through water (oxolations) or alcohol (alcoxolations)producing condensations:
≡ Si−OH + HO− Si ≡ ≡ Si−O− Si ≡ + ROH (2.2)
≡ Si−OH + RO− Si ≡ ≡ Si−O− Si ≡ + H2O (2.3)
· · · ⇒ polysilicates
3
Chapter 2. Fundamentals of bi-porous materials
This polycondensation reaction leads to more or less cross linked polysilicates which areprecipitating during the reaction. This dispersion is called the sol. All the reactionsare strongly pH dependent. They can be catalyzed by acid or base catalyst underformation of cationic (under acidic conditions) or anionic silicate species. Acid catalystsproduces weakly-crosslinked gels which easily compact under drying conditions, yieldinglow-porosity microporous xerogel structures. Conditions of neutral to basic pH result inrelatively micro- and mesoporous xerogels after drying.
Under some conditions, base-catalyzed and two-step acid-base catalyzed gels (initialpolymerization under acidic conditions and further gelation under basic conditions)exhibit hierarchical structure and complex network topology [11, 12].
2.2.2. Concept of templating
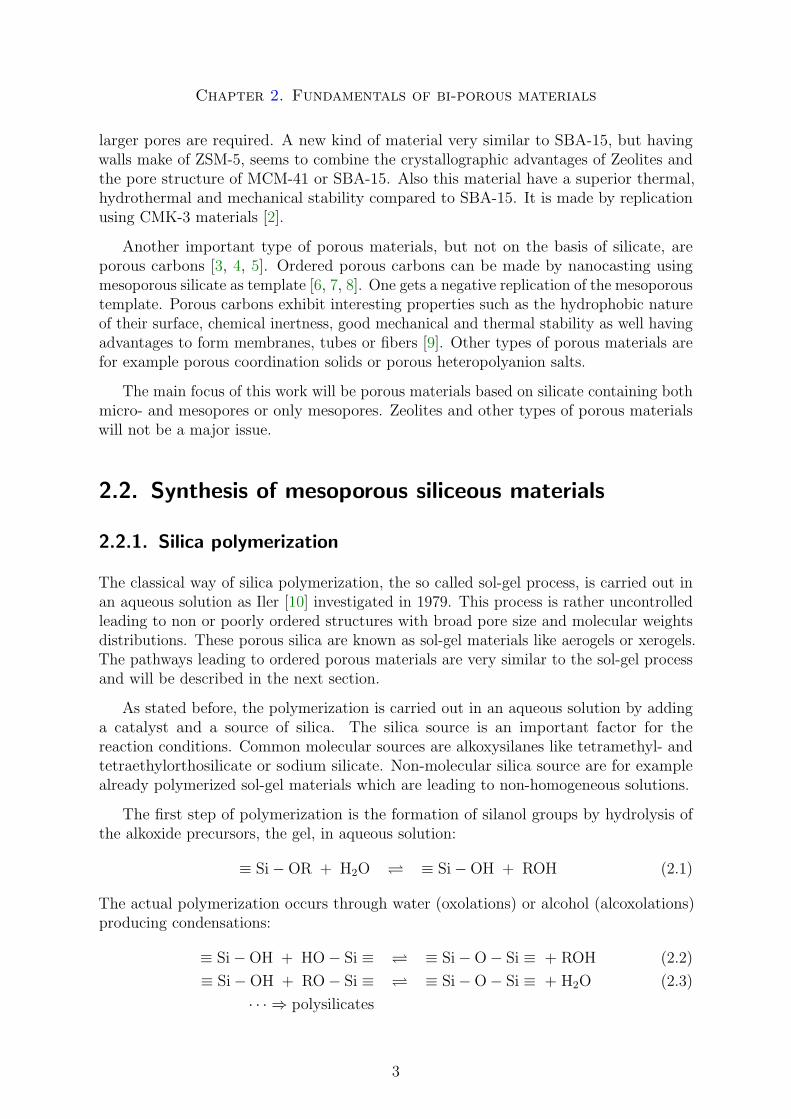
The main concept to obtain well defined and structured polysilicates is to use a surfactanttemplated polymerization instead of an uncontrolled reaction. In general the Iyotropic(i.e. amphiphilic) molecules of the surfactant form a liquid crystal by aggregation inaqueous solution [13, 14]. Of cause the proper formation of the liquid crystal matrix isstrongly dependent on the conditions in the solution. The structure of the liquid crystalis the so called mesostructure. Important parameters for the mesophase formation arefor instance the temperature (CMT), the concentration (CMC) or the pH-value of thesolution. Depending on these conditions, the structure of the mesophase can be forexample ordered in spherical, cylindrical, lamellar or cubic phase or disordered. Twodistinct families of phases exists. One type is based on periodic continuous minimalboundary surfaces of the phase components, the other type is micellar being based onpacking of discrete micellar aggregates. Especially for the cubic phase the cubic micellar’I’ and the bicontinuous cubic phases can be well-defined. Later in this chapter someexamples of materials synthesized in a micellar or bicontinuous mesophase will be given.A detailed study of the polymorphism of lipid water systems was done by Seddon andTempler [15]. In Figure 2.1 examples of Iyotropic mesophases in such liquid crystalsystems are visualized.
To act as a structure directing agent, the mesophase has to interact in some way withthe silica precursors. There have been many different attempts to develop pathways toinfluence the interactions between mesophase and polycondensation reaction of the silicasource. These are in particular alkaline routes (S+I−), acidic routes (S+X−I+) or non-ionic(S0I0) and neutral (N0I0) routes. Where S is standing for the surfactant molecules, I forthe silica source, X− for halides and N for a non ionic surfactant. The difference of theroutes is mostly the kind of driving force, with can be ionic-ionic, ionic-metal in the caseof the ionic routes or hydrogen-bonding interactions in the case of non-ionic routes.
The ionic routes were developed in the early 1990s by Beck et al. [13, 14] and havebeen intensively studied so far. They lead to monoporous1 materials like the MCMfamily. These ionic routes will not be of major interest for this work. For completenessthey will just be briefly described. In contrast newer non ionic routes yield to bi-porous
1monoporous: only mesopores
4
Chapter 2. Fundamentals of bi-porous materials
Figure 2.1.: Examples of Iyotropic structures of surfactant/water systems. (A) inversehexagonal HII phase; (B) Lα fluid lamellar phase; (C) inverse bicontinuouscubic phase Pn3m; (D) Schwarz’s P-surface (Pm3m); (E) inverse bicontinu-ous cubic phase Ia3d in ’rod-like’ representation; (F) ’rod-like’ representationof subfigure (C), from Seddon and Templer [15].
materials with generally larger primary mesopores and thicker walls than the counterpartstemplated with ionic surfactants.
The size and the range of the interactions in the solution with the silicate moleculescan be furthermore varied by changing the ionic strange of the solution using inorganicsalts to form halides or metal cations in alkaline or acidic medium (S+I−, S+X−I+).For the non-ionic route, cosurfactants like alcohols can be added to vary the moleculeinteraction in solution.
Ionic routes
The first attempts to synthesize ordered mesoporous silica were done under ionic condi-tions. Under these conditions the inorganic silicates I and also the surfactant moleculesS are charged depending on the pH-value of the solution.
5
Chapter 2. Fundamentals of bi-porous materials
The well known mesoporous candidates from the MCM family are typically synthesizedunder alkaline conditions. Under these condition the silicates are deprotonated and formanions I− and the surfactant molecules form cations S+ respectively. Three differentmesophases could be observed for this system leading to three structures, the hexagonalMCM-41, the cubic MCM-48 and the lamellar MCM-50. The exact reaction conditionscan be found in many publications [16, 17].
The first attempts to synthesize templated mesoporous silica under acidic conditionswere carried out by Huo et al. [18, 19, 20].At these conditions the cationic surfactantmolecules are surrounded by negative halides. A triple layer of surfactant, halides andthe cationic silicate species (S+X−I+) is the considerated mechanism for the mesophaseformation. Mesoporous materials synthesized using this route are for instance the SBA-3materials.
Non-ionic routes
More important for this work are the non-ionic routes templated with amphiphilic triblockcopolymers. These routes are relatively new and have shown a high flexibility in tailoringthe synthesis conditions and the mesostructure of the liquid crystal template. Especiallythe easy variation of hydrophobic/hydrophilic copolymer blocks and thus their volumefraction simply by using different chain length or cosurfactants provides a high degree ofcontrol. Commonly used block components are hydrophobic polymers like PPO, PS, PIor PE and hydrophilic polymers like PEO and PAA.
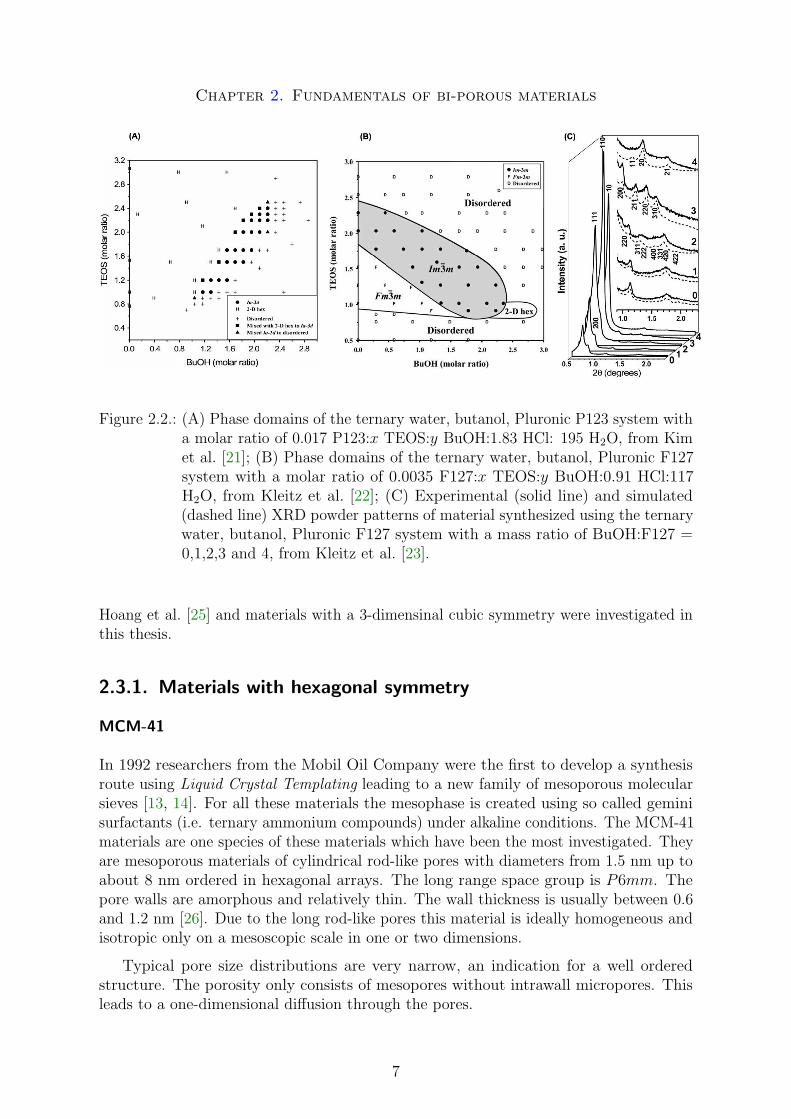
Relevant for this thesis is the ternary water, butanol, triblock copolymer (PluronicP123 or F127) system at low acid concentrations. Kleitz et al. [23] recently establishedseveral diagrams of the synthesis product phases, which clearly visualize the effects ofconcentration of several components. In Figure 2.2 two product phase diagrams forthese systems are shown. Figure 1A and 1B are reflecting the phase domains of themesophase leading to SBA-15 (2-D hex domain), SBA-16 (Im3m domain), KIT-5 (Fm3mdomain) and KIT-6 (Ia3d domain) or mixed and disordered materials. Figure 1C showsthe influence of the cosurfactant/surfactant ratio leading to KIT-5, SBA-16 or SBA-15materials if the mass ratio of BuOH:F127 is less than 2, 2 and higher 3 respectively. Adetailed discussion of these routes at low acid concentration was published recently byKleitz et al. [22, 24].
2.3. Overview of micro and mesoporous materials
The main purpose of this section is to give an overview of highly ordered porous materialswith both meso and micropores relevant for this work. Their crystallographic andstructure properties will be the major interest, focusing on important aspects for thelater diffusion studies on these materials.
The diffusion and sorption of hydrocarbons has been carried out on two major typesof materials. Materials with a 2-dimensional hexagonal were examinated recently by
6
Chapter 2. Fundamentals of bi-porous materials
Figure 2.2.: (A) Phase domains of the ternary water, butanol, Pluronic P123 system witha molar ratio of 0.017 P123:x TEOS:y BuOH:1.83 HCl: 195 H2O, from Kimet al. [21]; (B) Phase domains of the ternary water, butanol, Pluronic F127system with a molar ratio of 0.0035 F127:x TEOS:y BuOH:0.91 HCl:117H2O, from Kleitz et al. [22]; (C) Experimental (solid line) and simulated(dashed line) XRD powder patterns of material synthesized using the ternarywater, butanol, Pluronic F127 system with a mass ratio of BuOH:F127 =0,1,2,3 and 4, from Kleitz et al. [23].
Hoang et al. [25] and materials with a 3-dimensinal cubic symmetry were investigated inthis thesis.
2.3.1. Materials with hexagonal symmetry
MCM-41
In 1992 researchers from the Mobil Oil Company were the first to develop a synthesisroute using Liquid Crystal Templating leading to a new family of mesoporous molecularsieves [13, 14]. For all these materials the mesophase is created using so called geminisurfactants (i.e. ternary ammonium compounds) under alkaline conditions. The MCM-41materials are one species of these materials which have been the most investigated. Theyare mesoporous materials of cylindrical rod-like pores with diameters from 1.5 nm up toabout 8 nm ordered in hexagonal arrays. The long range space group is P6mm. Thepore walls are amorphous and relatively thin. The wall thickness is usually between 0.6and 1.2 nm [26]. Due to the long rod-like pores this material is ideally homogeneous andisotropic only on a mesoscopic scale in one or two dimensions.
Typical pore size distributions are very narrow, an indication for a well orderedstructure. The porosity only consists of mesopores without intrawall micropores. Thisleads to a one-dimensional diffusion through the pores.
7
Chapter 2. Fundamentals of bi-porous materials
MCM-41 materials have found various application in catalysis [27, 28, 29] and varioustechniques for characterization have been developed [3, 26, 30, 31, 32, 33, 34, 35, 36,37, 38, 39]. They have a very high BET surface area up to 1000-1200 m2/g. Themorphology, pore sizes and BET surface areas are highly adjustable during synthesis.Also the chemistry of the walls can be easily changed by incorporation of heteroatomsor grafting techniques [40, 41, 42, 43]. The most important limitation for example asFCC catalyst is the low hydrothermal stability of these materials [44, 45], caused by therather thin and amorphous pore walls.
SBA-15
Very similar to MCM-41 materials are SBA-15 materials prepared under acidic conditionswith the triblock copolymer Pluronic P123 (EO20PO70EO20) surfactant as template[46, 47] (see Figure 2.2). The mesopores are ordered in hexagonal arrays providing thesame long range space group as for MCM-41 materials (P6mm). However, due to theproperties of the Pluronic type surfactant [48] SBA-15 materials show up importantdifferences in porosity and adsorption properties compared to MCM-41 materials. Ina regular synthesis, SBA-15 materials have much thicker but still amorphous wallsand primary mesopore diameters between 5 nm to 15 nm. The BET surface area ofSBA-15 is generally lower than the one of MCM-41. Due to thicker pore walls, they arehydrothermal more stable [43, 49]. Also due to the Pluronic surfactant type, SBA-15materials generally have a second intrawall porosity consisting of micropores or smallermesopores. These unordered pores interconnect the primary mesopore channels. It ispossible to tailor the micro/mesopore ratio to the needs of the application, still conservingthe rather thick pore walls. The intrawall microporosity is caused by the penetration ofthe hydrophobic PO groups of the blockcopolymer chain into the silica matrix. The wallthickness is caused by the length of these polymer chains.
2.3.2. Materials with cubic symmetry
SBA-16 and KIT-5
SBA-16 is a porous silica with large (5-15 nm) cage-like mesopores arranged in a threedimensional cubic body-centered Im3m symmetry [46, 50]. Like SBA-15 it is synthesizedunder acidic conditions using a non ionic Pluronic surfactant (Figure 2.2) and is thereforeproviding an intrawall complementary porosity [25]. The mesophase can be created usingmixtures of Pluronic P123 and Pluronic F127 (EO106PO70EO106) or in a ternary water,butanol and Pluronic F127 system. Caused by the longer PO chains in Pluronic F127compared to Pluronic P123 SBA-16 generally has thicker pore walls than SBA-15.
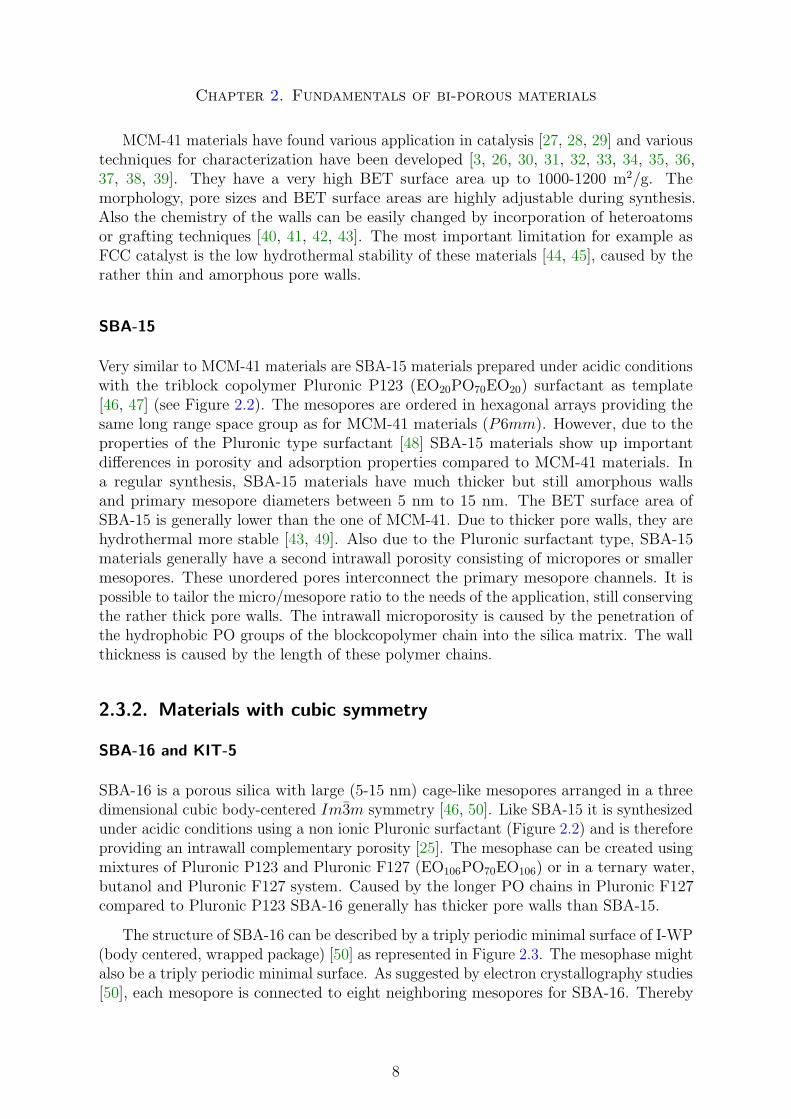
The structure of SBA-16 can be described by a triply periodic minimal surface of I-WP(body centered, wrapped package) [50] as represented in Figure 2.3. The mesophase mightalso be a triply periodic minimal surface. As suggested by electron crystallography studies[50], each mesopore is connected to eight neighboring mesopores for SBA-16. Thereby
8
Chapter 2. Fundamentals of bi-porous materials
Figure 2.3.: Schoen’s I-WP triply periodic minimal surface as a representation of thestucture of SBA-16 materials and the corresponding mesophase, from Brakke[51].
the pore entrance size from one mesopore to another is usually significantly smaller thanthe primary mesopore size, making this size the limiting factor for applications involvingintraparticle mass transfer. The desorption out of this kind of structure is dominated byso called pore blocking and networking effects [52, 53]. The primary mesopore size canrelatively easy be obtained by diffraction or physisorption measurements in combinationwith an adapted geometric model like the model of spherical cavities or the triply periodicI-WP surface [52, 53]. In contrast, the pore entrance size is more difficult to obtain.Analyzing the PSD of the desorption physisorption isotherm a first guess of a maximaldiameter is possible. If the desorption occurs spinodal at a pressure of about 0.48 - 0.50p/p0 the pore entrance diameters are less than 4 nm. Lager sizes will cause a shift of thedesorption isotherm towards higher pressures [54]. Pore entrance sizes greater than 4nm can thus relatively straightforward be characterized by physisorption measurements.Using probe molecules of large kinetic diameters and analyzing their sorption propertiesit is also possible to characterize entrance sizes below 4 nm.
KIT-5 is also a porous silica with very similar properties than SBA-16. The mesoporesare ordered in a cubic face-centered Fm3m symmetry. Like SBA-16 KIT-5 can besynthesized in a ternary water, butanol and Pluronic F127 surfactant system (Figure2.2).
In contrast to the triply periodic bicontinuous minimal surface of the SBA-16mesophase, for KIT-5 it is possible to have a cubic micellar mesophase. In this caseeach mesopore would only be statistically connected to each other, but arranged in aface-centered symmetry. The further structural properties, including the pore entrancesto the primary mesopores, are very similar to SBA-16.
9
Chapter 2. Fundamentals of bi-porous materials
MCM-48 and KIT-6
MCM-48 and KIT-6 are both materials with a 3-dimensional Ia3d structure. The bestrepresentation of the structure is a gyroid minimal surface [55]. MCM-48 is synthesizedin a similar way to MCM-41 under alkaline conditions with genimi surfactants. The porewall thickness of MCM-48 is about 0.8 to 1.0 nm [55] just like for MCM-41 materials. Thepore sizes are also in the same range as for MCM-41 materials. KIT-6 can be synthesizedusing as mesophase the ternary system shown in Figure 2.2A. Pore wall thickness andpore dimensions are in the same range as for SBA-15 materials.
The gyroid structure, which can be interpreted as two interwoven cylindrical channels,leads to adsorption properties which are similar to the one of the 2-dimensional hexagonalmaterials. The desorption is not kinetically limited and near equilibrium. Pore blockingeffects are not occurring. These materials seem to combine the advantages of the 2-dimensional hexagonal with the one of a 3-dimensional structure. In this thesis theproperties of these materials will not be further investigated, only for completeness andto promote further studies a short overview was given.
2.4. Evolution of bi-porous materials
In this section, especially the time and temperature dependency of mesophase andsilica condensation and hence of the calcinated materials will be discussed. A goodunderstanding of this behavior is important for the later work, where precisely thesesynthesis parameters were varied. Also they have been in the last few years some otherinteresting studies predominantly focusing on these synthesis parameters [25, 54].
As it will be shown later in the synthesis section, generally the synthesis of thesematerials is divided in a reaction period, where mostly the polymerization takes placeand an aging (or hydrothermal treatment) period, where the molecules crystallize in partand try to reach a thermodynamic stable minimum. The reaction period is generallywell stirred, whereas the aging period usually takes place under static conditions. Thesynthesis conditions during the reaction period are often kept constant. In this thesisthe temperature and the time of the aging period were varied. Other parameters as forinstance the pH-value of the solution or cosurfactants are of cause influencing all thesteps involved during the formation of the materials, but for this study only the evolutionperiod during the aging step is of importance and will be discussed in this section. Alsoonly relevant surfactants, i.e. Pluronic block-copolymers are being considerated. Detailedstudies discussing other systems and parameters can be found elsewhere in literature[22, 46, 56, 57].
Evolution during the reaction period
The intrawall micropores of materials synthesized using Pluronic as surfactant are formedas a result of the penetration of the poly(ethylene oxide) PEO chains into the silica
10
Chapter 2. Fundamentals of bi-porous materials
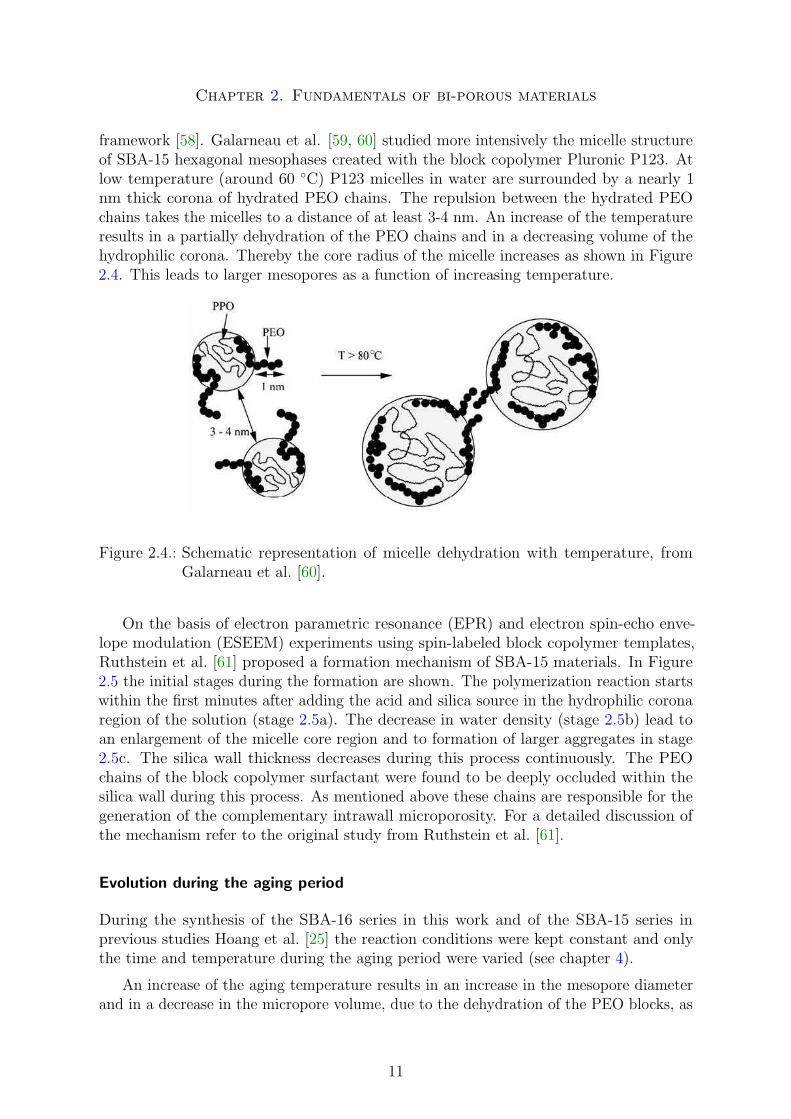
framework [58]. Galarneau et al. [59, 60] studied more intensively the micelle structureof SBA-15 hexagonal mesophases created with the block copolymer Pluronic P123. Atlow temperature (around 60 ◦C) P123 micelles in water are surrounded by a nearly 1nm thick corona of hydrated PEO chains. The repulsion between the hydrated PEOchains takes the micelles to a distance of at least 3-4 nm. An increase of the temperatureresults in a partially dehydration of the PEO chains and in a decreasing volume of thehydrophilic corona. Thereby the core radius of the micelle increases as shown in Figure2.4. This leads to larger mesopores as a function of increasing temperature.
Figure 2.4.: Schematic representation of micelle dehydration with temperature, fromGalarneau et al. [60].
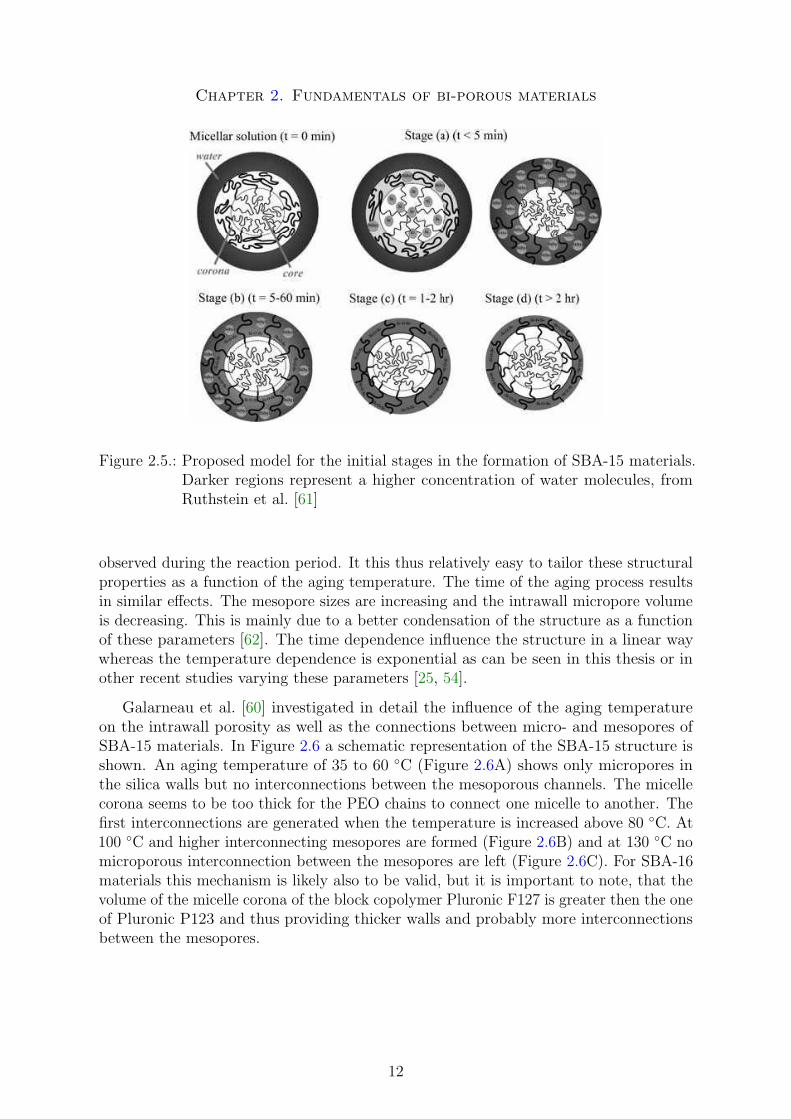
On the basis of electron parametric resonance (EPR) and electron spin-echo enve-lope modulation (ESEEM) experiments using spin-labeled block copolymer templates,Ruthstein et al. [61] proposed a formation mechanism of SBA-15 materials. In Figure2.5 the initial stages during the formation are shown. The polymerization reaction startswithin the first minutes after adding the acid and silica source in the hydrophilic coronaregion of the solution (stage 2.5a). The decrease in water density (stage 2.5b) lead toan enlargement of the micelle core region and to formation of larger aggregates in stage2.5c. The silica wall thickness decreases during this process continuously. The PEOchains of the block copolymer surfactant were found to be deeply occluded within thesilica wall during this process. As mentioned above these chains are responsible for thegeneration of the complementary intrawall microporosity. For a detailed discussion ofthe mechanism refer to the original study from Ruthstein et al. [61].
Evolution during the aging period
During the synthesis of the SBA-16 series in this work and of the SBA-15 series inprevious studies Hoang et al. [25] the reaction conditions were kept constant and onlythe time and temperature during the aging period were varied (see chapter 4).
An increase of the aging temperature results in an increase in the mesopore diameterand in a decrease in the micropore volume, due to the dehydration of the PEO blocks, as
11
Chapter 2. Fundamentals of bi-porous materials
Figure 2.5.: Proposed model for the initial stages in the formation of SBA-15 materials.Darker regions represent a higher concentration of water molecules, fromRuthstein et al. [61]
observed during the reaction period. It this thus relatively easy to tailor these structuralproperties as a function of the aging temperature. The time of the aging process resultsin similar effects. The mesopore sizes are increasing and the intrawall micropore volumeis decreasing. This is mainly due to a better condensation of the structure as a functionof these parameters [62]. The time dependence influence the structure in a linear waywhereas the temperature dependence is exponential as can be seen in this thesis or inother recent studies varying these parameters [25, 54].
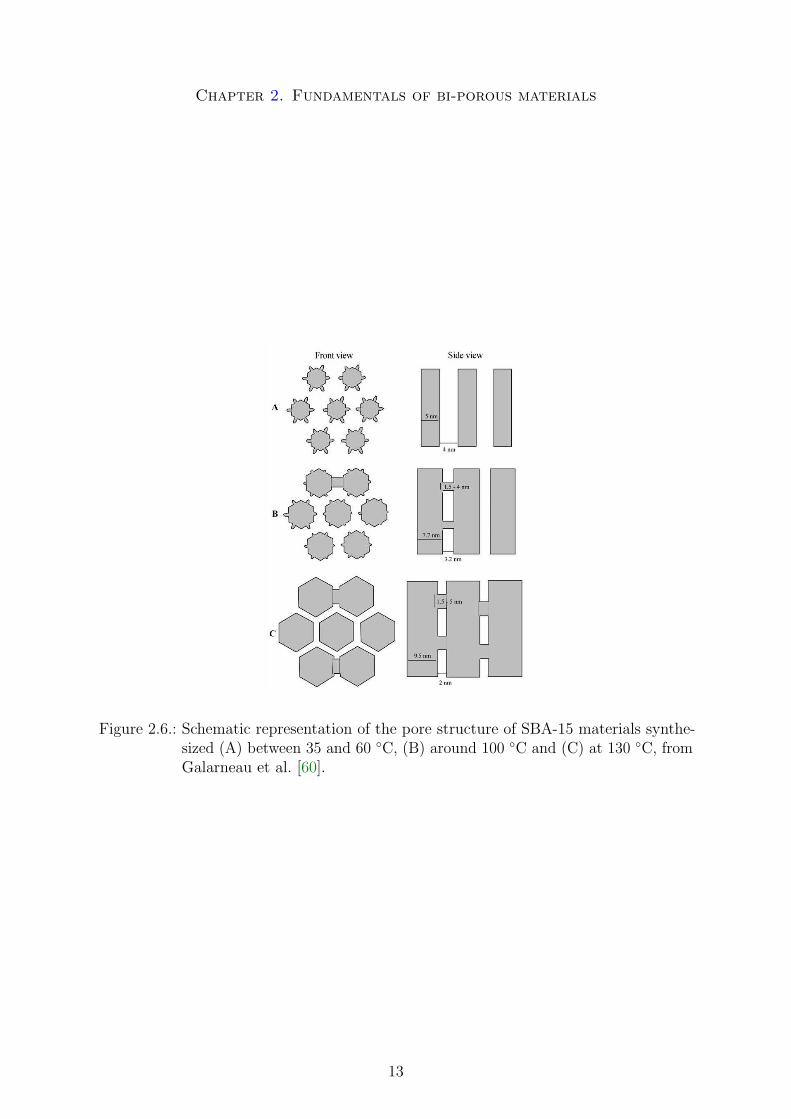
Galarneau et al. [60] investigated in detail the influence of the aging temperatureon the intrawall porosity as well as the connections between micro- and mesopores ofSBA-15 materials. In Figure 2.6 a schematic representation of the SBA-15 structure isshown. An aging temperature of 35 to 60 ◦C (Figure 2.6A) shows only micropores inthe silica walls but no interconnections between the mesoporous channels. The micellecorona seems to be too thick for the PEO chains to connect one micelle to another. Thefirst interconnections are generated when the temperature is increased above 80 ◦C. At100 ◦C and higher interconnecting mesopores are formed (Figure 2.6B) and at 130 ◦C nomicroporous interconnection between the mesopores are left (Figure 2.6C). For SBA-16materials this mechanism is likely also to be valid, but it is important to note, that thevolume of the micelle corona of the block copolymer Pluronic F127 is greater then the oneof Pluronic P123 and thus providing thicker walls and probably more interconnectionsbetween the mesopores.
12
Chapter 2. Fundamentals of bi-porous materials
Figure 2.6.: Schematic representation of the pore structure of SBA-15 materials synthe-sized (A) between 35 and 60 ◦C, (B) around 100 ◦C and (C) at 130 ◦C, fromGalarneau et al. [60].
13
3. Methods and calculations
3.1. Physisorption
A common method for determination of pore volume, pore sizes, areas or volumes is thesorption of probe molecules on a porous solid. Nitrogen or argon physisorption has foundto be a generally accepted method for this kind of characterization of porous materials.
The adsorption of a gas on a solid can be quantitatively described by an adsorptionisotherm, which represents the amount of condensed molecules (the adsorbates) in aporous solid (the absorbent) as a function of the partial pressure of the gas-phase at aconstant temperature. Because of the temperature dependence of sorption in general, itis necessary to measure under isothermic conditions.
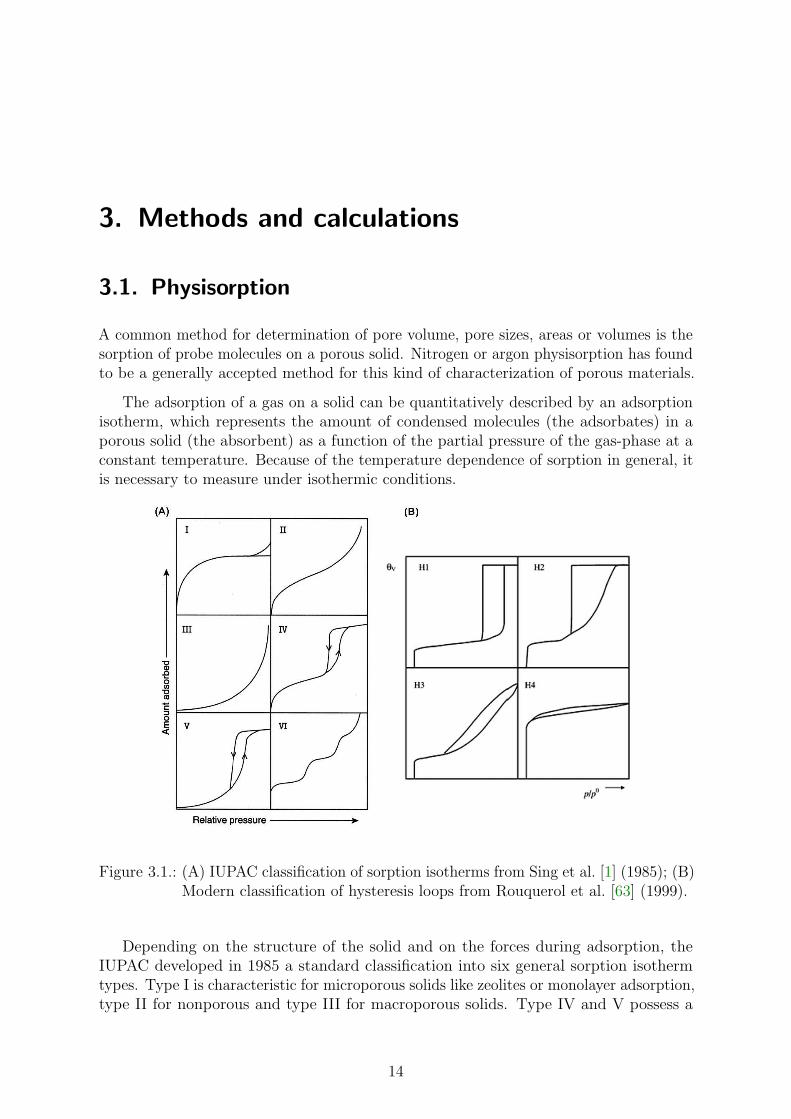
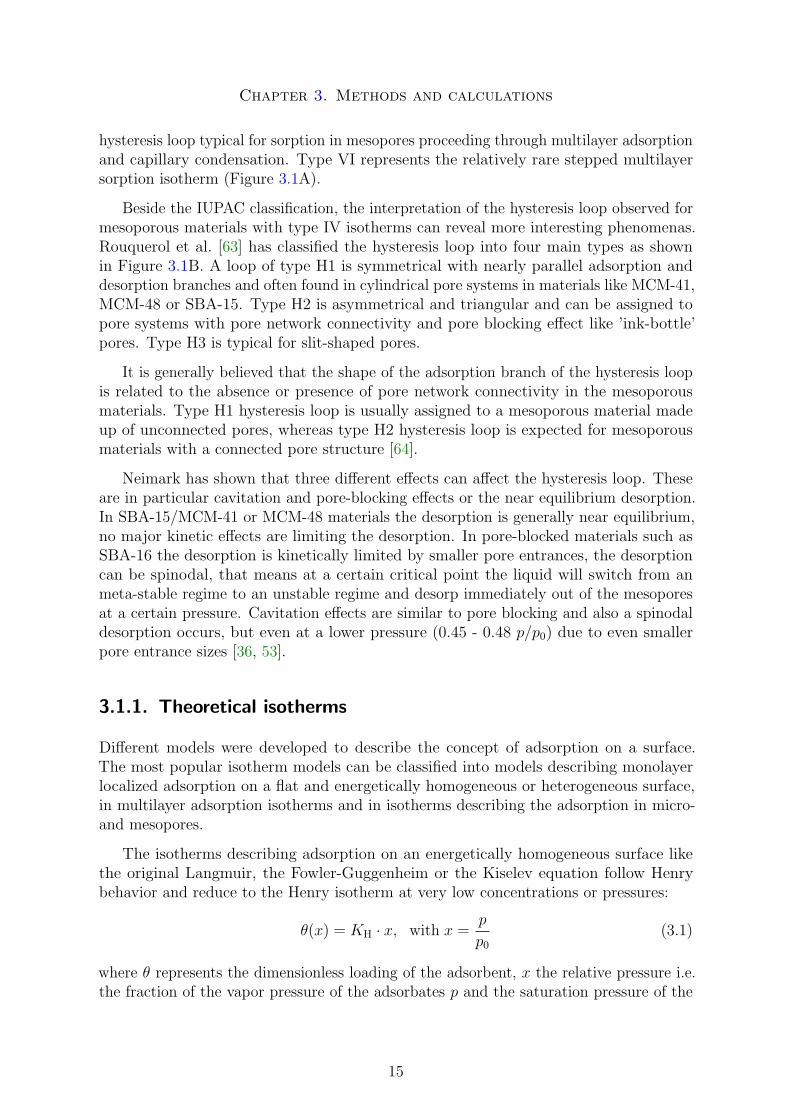
Figure 3.1.: (A) IUPAC classification of sorption isotherms from Sing et al. [1] (1985); (B)Modern classification of hysteresis loops from Rouquerol et al. [63] (1999).
Depending on the structure of the solid and on the forces during adsorption, theIUPAC developed in 1985 a standard classification into six general sorption isothermtypes. Type I is characteristic for microporous solids like zeolites or monolayer adsorption,type II for nonporous and type III for macroporous solids. Type IV and V possess a
14
Chapter 3. Methods and calculations
hysteresis loop typical for sorption in mesopores proceeding through multilayer adsorptionand capillary condensation. Type VI represents the relatively rare stepped multilayersorption isotherm (Figure 3.1A).
Beside the IUPAC classification, the interpretation of the hysteresis loop observed formesoporous materials with type IV isotherms can reveal more interesting phenomenas.Rouquerol et al. [63] has classified the hysteresis loop into four main types as shownin Figure 3.1B. A loop of type H1 is symmetrical with nearly parallel adsorption anddesorption branches and often found in cylindrical pore systems in materials like MCM-41,MCM-48 or SBA-15. Type H2 is asymmetrical and triangular and can be assigned topore systems with pore network connectivity and pore blocking effect like ’ink-bottle’pores. Type H3 is typical for slit-shaped pores.
It is generally believed that the shape of the adsorption branch of the hysteresis loopis related to the absence or presence of pore network connectivity in the mesoporousmaterials. Type H1 hysteresis loop is usually assigned to a mesoporous material madeup of unconnected pores, whereas type H2 hysteresis loop is expected for mesoporousmaterials with a connected pore structure [64].
Neimark has shown that three different effects can affect the hysteresis loop. Theseare in particular cavitation and pore-blocking effects or the near equilibrium desorption.In SBA-15/MCM-41 or MCM-48 materials the desorption is generally near equilibrium,no major kinetic effects are limiting the desorption. In pore-blocked materials such asSBA-16 the desorption is kinetically limited by smaller pore entrances, the desorptioncan be spinodal, that means at a certain critical point the liquid will switch from anmeta-stable regime to an unstable regime and desorp immediately out of the mesoporesat a certain pressure. Cavitation effects are similar to pore blocking and also a spinodaldesorption occurs, but even at a lower pressure (0.45 - 0.48 p/p0) due to even smallerpore entrance sizes [36, 53].
3.1.1. Theoretical isotherms
Different models were developed to describe the concept of adsorption on a surface.The most popular isotherm models can be classified into models describing monolayerlocalized adsorption on a flat and energetically homogeneous or heterogeneous surface,in multilayer adsorption isotherms and in isotherms describing the adsorption in micro-and mesopores.
The isotherms describing adsorption on an energetically homogeneous surface likethe original Langmuir, the Fowler-Guggenheim or the Kiselev equation follow Henrybehavior and reduce to the Henry isotherm at very low concentrations or pressures:
θ(x) = KH · x, with x =p
p0
(3.1)
where θ represents the dimensionless loading of the adsorbent, x the relative pressure i.e.the fraction of the vapor pressure of the adsorbates p and the saturation pressure of the
15
Chapter 3. Methods and calculations
pure adsorbates p0 and K a constant. K describes, in the case of the Henry isotherm,Henry’s constant KH.
Equation (3.1) is the simplest isotherm, describing the linear part of adsorption thatmay be observed for relatively high temperatures and very low pressures. The slope ofthis linear region is the dimensionless Henry constant. This adsorption law is formallyidentical to the well known Henry law for gas absorption in liquids and describes theintrinsic affinity of the adsorbent for a specific sorbate. Defined in this way the Henryconstant is an equilibrium constant and shows van’t Hoff temperature dependence:
K = K∞ · e−∆E0
RT (3.2)
where ∆E0 represents the change in internal energy or enthalpy of adsorption.
3.1.2. The BET-surface analysis
Brunnauer, Emmett and Teller introduced the concept of multilayer adsorption. Herethe first layer of adsorbed molecules acts as new substrate for further adsorption. Theclassical 2-parameter equation is the well known BET-equation:
θBET(x) =n
nm
=1
1− x· Kx
1 + (K − 1)x(3.3)
with the total amount of adsorbates n, the amount of adsorbates in a monolayer nm, therelative concentration or pressure x and a constant K which is related to the net heat ofadsorption of the monolayer. It is important to note that this classical form is only validfor an infinite number of layers on a flat surface taking into account the same heat ofadsorption for each layer. To calculate the parameters nm and K equation (3.3) can berewritten into the classic BET linear form:
x
n(1− x)=
1
nmK(1 + (K − 1) x) =
1
nmK+
K − 1
nmKx (3.4)
Now a plot of x/n(1− x) against x should yield in a straight line in a pressure range ofabout 0.05 to 0.3 p/p0. From the slope and the intercept it is now possible to determinethe above two parameters. The specific surface SBET occupied by the monolayer of theadsorbates can be obtained from nm and the net heat of adsorption from K. Somerestrictions to the parameter K can be used to optimize the BET analysis. For instanceK always has to be positive and larger than zero. Also it should not be too high or toolow. Sing et al. [1] analyzed the influence of K.
The BET equation was implemented in two different ways. The first algorithm tries tofind the maximum surface area and to optimize the parameter K in the relative pressurerange from 0.06 to 0.15. This leads of course to a variable pressure range from sample tosample, but eliminates erroneous data points in the measurements and yields in morephysical consistent values of K. The second way was the strict application of the BETplot in same pressure range as above, but without any more sophisticated algorithm. Inappendix B.1 the implementation in Matlab used to calculate these parameters is listed.
16
Chapter 3. Methods and calculations
The analysis of the adsorption isotherm by the BET method is a common method todetermine the surface area of a porous material, but is mostly restricted to mesoporousor macroporous materials. The application of the BET method to materials containingmicropores has to be done with care and only an apparent surface area can be obtained.
Other analytical isotherms will not be further discussed here, because they are notrelevant for this work.
3.1.3. Micropore analysis
Different methods were established for a quantitative determination of the microporevolume and size. The most direct way is to use probe molecules with varying kineticdiameters as sorbates and to compare their sorption isotherms or to analyze the kineticsof diffusion and sorption.
Other common methods are comparative plots like the t-plot or the αs-plot method,the Dubinin-Radushkevich (DR), Dubinin-Astakhov (DA), Horvath-Kawazoe (HK), Saito-Foley and methods based on the density functional theory (DFT) [65, 66, 67, 68, 69].
In this section only the comparative plot methods will be discussed. The principleof comparative plots is to compare a physical quantity by plotting two measurementsagainst each other. If the mechanism of change is the same in both measurements, theplot would yield in a straight line. In the case of physisorption data the t-plot methodand the αs-plot have found broad application to determine micropore, mesopore volume,internal and external surface area of micro- and mesoporous materials [31]. Generallythe αs method is more accurate than the t-plot especially for the low and high pressureregions, because it uses a measured reference isotherm.
The following equations where implemented as t-curves in Matlab for the t-plotmethod. In principle these are type II isotherms, reflecting the statistical thickness ofthe adsorbed Nitrogen multilayer:
tBoer = 0.1 · 15.47 · Vads
SBET
(3.5)
tHarkins(nm) = 0.1 ·(
60.65
0.03071− log x
)0.3968
(3.6)
tHarkins2(nm) = 0.1 ·√
13.99
0.34− log x(3.7)
tHasley(nm) = 0.1 · 3.54 ·(
5
− ln x
)1/3
(3.8)
Equation (3.5) is the original t-plot equation by Deboer et al. [68] which gives a relationshipof the statistical film thickness and the experimental isotherm. Vads is the adsorptionisotherm (STP). Equations (3.6) and (3.7) are both by Harkins and Jura. Equation(3.6) shows a good agreement with experimental data for cylindrical pores and has beenused to modify the Kelvin equation in the modified BJH method as developed by Kruk
17
Chapter 3. Methods and calculations
et al. [70] in 1997. The last equation (3.8) is from Hasley/FHH and is more useful formicroporous materials. In this work only equation (3.6) will be further applied if nototherwise specified.
The reference isotherm for the αs method in this work is Nitrogen on the macroporoussilica gel LiChrospher Si-4000 [31, 58] which is also of type II. Stepwise linear interpolationwas used for filling the gaps in the reference dataset. Furthermore for all linear curvefitting the variance of the fit was calculated and minimized to ensure a good representationof the linear region.
The presence of micropores is indicated by a positive intercept of a linear fit of the lowpressure or the first linear region, of both t- and αs-plots. It is caused by a relatively largenitrogen uptake at a very low pressures, due to the stronger adsorption in micropores.Hence, it is possible to calculate the micropore volume Vmi from the intercept. From thehigh pressure linear region of the αs-plot it is possible to determine the external surfacearea Sext of the porous material. Deviations from linearity are often caused by capillarycondensation in mesopores or different types of pores, as for instance slit-shaped pores.Detailed calculations and further interpretation of these methods can be found elsewhere[31, 68].
3.1.4. Pore size distributions
The pore size distribution reflects in some way the distribution of any one dimensionalgeometric parameter of a porous material. Of cause any arbitrary parameter can be usedto generate other kinds of distributions, such as pore volume distributions.
Looking at this definition, one easily realizes that the exact description of the porousgeometry is fundamental to obtain valid distributions for any geometric parameter of theporous systems.
The typical pore size distribution (PSD) can be obtained in a statistical or in aclassical way. The basic concept of the statistical way, which is in parts equal with thethermodynamic way, is to represent the experimental physisorption isotherm as a setof independent, non-connected pores. This can be done by multiplication of the sum ofall pore sizes of the system (the actual PSD) with the theoretical representation of theadsorption data, as expressed by the following integral equation:
Nexp(x) =
∫ Rmax
Rmin
Ntheo(x, r) · PSD(r) dr (3.9)
where Nexp(x) is the experimental isotherm as a function of the relative pressure andNtheo(x, r) the theoretical isotherm as a function of the relative pressure and the poreradius (or any other one dimensional geometric parameter of the porous system). Toobtain the PSD, this equation has to be solved by inversion of the integral equation.
The main challenge is now to find a appropriate theory to compute the theoreticalisotherm. An analytical solution by statistical mechanics and thermodynamics is the(non local) density function theory (NLDFT). Also well known are numerical solutions
18
Chapter 3. Methods and calculations
by Monte Carlo simulations. The classical way is known as the BJH-method and hasbeen developed 1951 by Barrett et al. [71]. It is based on classical thermodynamics anduses the Kelvin equation to calculate the radius of the pore and an adequate analyticalequation for the statistical film thickness of the adsorbates. The Kelvin equation is onlyvalid for a limited number of geometries and is a function of the shape. These are forexample cylindrical, spherical or slit-shaped mesopores.
Kruk et al. [70] proposed in 1997 a modified version of the BJH method. Theyintroduced a correction therm for the original statistical film thickness equation andwere able to accurately reproduce the pore size distributions of MCM-41 materials. Theoriginal and the modified BJH methods will be further studied in the following section.
The original and modified BJH method
As mentioned before, the original BJH method [71] is based on a model for capillarycondensation and evaporation in cylindrical pores using the classical Kelvin equation:
ln x = − 2γVL
RTrc(x)(3.10)
where VL represents the molar volume of the liquid, γ the surface tension and rc = r−t(x)with rc as the ’core’ radius and r as the physical radius of the pore. The treatmentof ’core’ radius and pore radius is the main difference of different BJH methods. Theoriginal BJH assumes a constant ratio of ’core’ to pore radius.
The Kelvin equation in (3.10) quantifies the deviation in equilibrium vapor pressureabove a curved surface from that above a plane surface at the same temperature. Inother words, it gives a basic relationship between curvature and thermodynamic activityof a liquid film.
Original BJH method In the original BJH method [71] a calculation scheme has beendeveloped to solve the following integral equation:
Nexp(x) =
∫ ∞
Rmin
π · (r − t)2 · PSD(r) dr (3.11)
The calculation scheme can be written the following way:
Nexp(x) =k∑
i=1
∆Vi(ri ≤ rc(xk))︸ ︷︷ ︸1st part
+n∑
i=k+1
∆Si · ti(ri > rc(xk))︸ ︷︷ ︸2nd part
(3.12)
or as an indexwise scheme:
Vn =r(xn)2
(rc,n + ∆tn)2 ·
∆Nexp(x, n)−∆tn ·n−1∑j=1
r(xn)2
(rc,n + ∆tj)2 ·∆tj ·
2Vj
r(xj)︸ ︷︷ ︸∆Sn
(3.13)
19
Chapter 3. Methods and calculations
This recursive defined equation has to be implemented starting ’backward’ from thepoint where all pores are filled up with liquid (the last point of the desorption or adsorptionbranch). The PSD follows from the above using its definition: PSDn = Vn/2∆rn. Theimplementation of the above calculation scheme is listed in appendix B.2.
Modified BJH method (KJS) As stated before the most important difference of themodified BJH method or KJS method [70] is the treatment of the core radius of the kelvinequation. Introducing the statistical thickness and a correction factor, Kruk, Jaroniecand Sajary [70] were able to modify equation (3.10) to better represent the experimentaldata of SBA-15 measurements. The modified equation to calculate the core radius is thefollowing:
rc(x)(nm) =2γVL
RT ln x+ tHarkins(x) + 0.3 (3.14)
3.1.5. Measurements
Nitrogen physisorption isotherms were measured using an Omnisorp-100 static-volumetricsorptometer at liquid nitrogen temperature (77 K). The calcinated samples were firstactivated under vacuum for 6 h at 250 ◦C. After the measurements the weight of thesamples was determined on an analytical balance at room temperature.
3.2. X-ray diffraction (XRD)
X-ray diffraction (XRD) is an extensively used technique in material science to determinecrystallographic and textural properties and inner stress due to defects. Even whileordered mesoporous materials are amorphous materials on a short range scale, thelong range order still produces distinct diffraction patterns at angles in the range of0◦ < 2θ < 5◦ when the Bragg conditions are fulfilled.
The Bragg’s law states, that at distinct (hkl) planes, a reflection will be observedduring X-ray irradiation:
n · λ = 2 · dhkl · sin θhkl (3.15)
where λ is the wavelength of the X-ray beam, θ the so called glancing angle, d the spacingbetween the (hkl) planes in the lattice and n the order of diffraction (n ∈ N+). hkl arethe Miller indices.
The unit-cell parameter a of the crystallographic structure was obtained by solvingthe following equation depending on the type of space group:
a =√
Qhkl · dhkl (3.16)
where Qhkl is:Qhkl = h2 + k2 + l2 (3.17)
20
Chapter 3. Methods and calculations
for a cubic space group like the cubic body centered (Im3m) SBA-16 or
Qhkl =4
3
(h2 + hk + k2
)+
(a
c· l
)2
(3.18)
for a hexagonal space group P6. In the case of the 2-dimensional SBA-15 or MCM-41 ma-terials with space group P6mm, there is no periodicity along the direction correspondingto the c-index.
The exact determination of the space group is often not as straightforward as it mightlook like. To minimize assumptions and ambiguities of powder X-ray diffraction, themeasurements should be accompanied by additional methods such as electron diffractionor microscopy. Also simulations of diffractogramms might be very useful. In contrast thedetermination of the structure using single crystal X-ray diffraction is more reliable, butdue to the synthesis process of micro- and mesoporous materials based on silica no singlecrystall is formed. In this thesis the XRD measurements where accompanied by smallangle X-ray scattering and transmission electron microscopy for the confirmation of theIm3m symmetry of the SBA-16 series.
The powder X-ray diffraction patterns were recorded with a Bruker D4 powder X-raydiffractometer using Cu-Kα radiation.
Additionally, the powder X-ray diffraction patterns of calcined samples were analyzedwith a STOE STADI P θ-θ powder X-ray diffractometer in reflection geometry (Bragg-Brentano) using Cu-Kα1+2 radiation with secondary monochromator and a scintillationdetector. XRD patterns were recorded in the ranges of 0.7-2.5 (2θ) with step: 0.1 (2θ),time/step: 10 s.
3.3. Small angle X-ray scattering (SAXS)
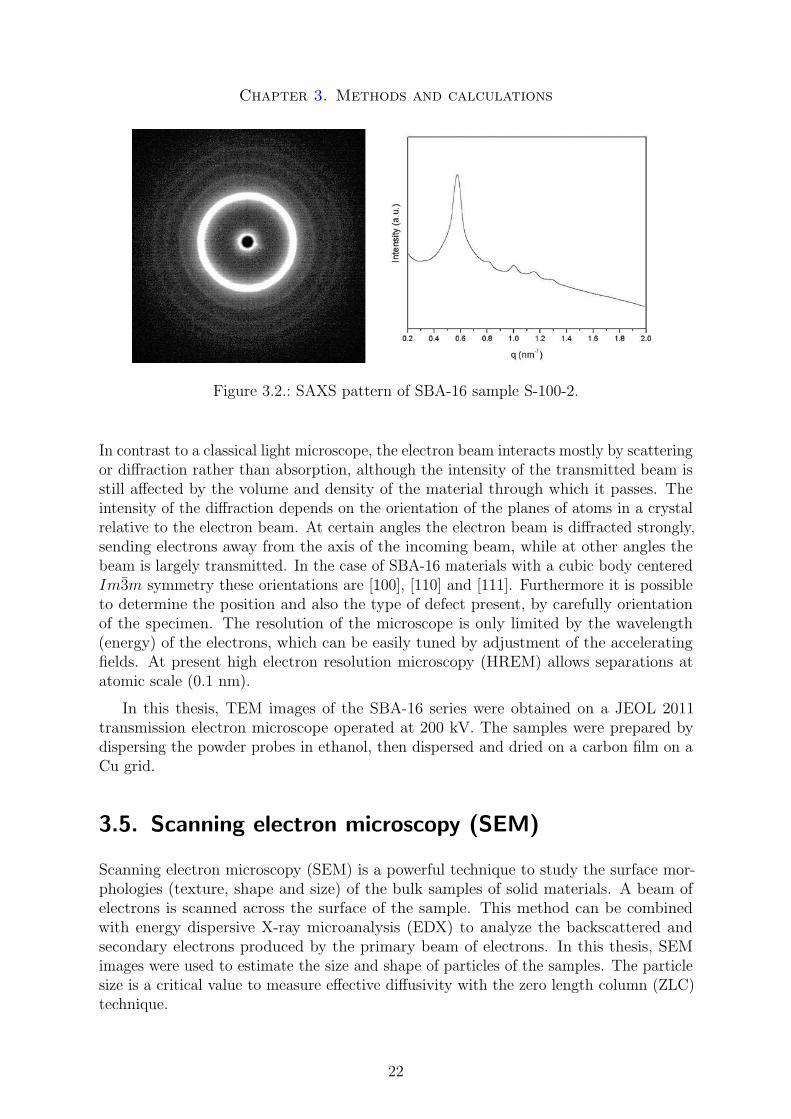
Small angle X-ray scattering (SAXS) is a powerful technique to study structural propertieson a nanometer length scale in the range from 1 to 300 nanometers. These are typicallymacromolecules, colloids or for instance mesoporous materials. It is performed by focusingan X-ray beam onto a sample and observing a coherent scattering pattern that arisesfrom electron density inhomogeneities within the sample. A typical SAXS pattern of theSBA-16 sample S-100-2 is shown in Figure 3.2.
The SAXS patterns of the SBA-16 series were acquired on a Nanostar U small-angleX-ray scattering system using Cu-Kα radiation. The d-spacings were calculated directlyfrom the scattering patterns by d = 2π/q.
3.4. Transmission electron microscopy (TEM)
Transmission electron microscopy (TEM) is a technique whereby a beam of electrons isfocused onto a sample (specimen) to create an image of very small structures of materials.
21
Chapter 3. Methods and calculations
Figure 3.2.: SAXS pattern of SBA-16 sample S-100-2.
In contrast to a classical light microscope, the electron beam interacts mostly by scatteringor diffraction rather than absorption, although the intensity of the transmitted beam isstill affected by the volume and density of the material through which it passes. Theintensity of the diffraction depends on the orientation of the planes of atoms in a crystalrelative to the electron beam. At certain angles the electron beam is diffracted strongly,sending electrons away from the axis of the incoming beam, while at other angles thebeam is largely transmitted. In the case of SBA-16 materials with a cubic body centeredIm3m symmetry these orientations are [100], [110] and [111]. Furthermore it is possibleto determine the position and also the type of defect present, by carefully orientationof the specimen. The resolution of the microscope is only limited by the wavelength(energy) of the electrons, which can be easily tuned by adjustment of the acceleratingfields. At present high electron resolution microscopy (HREM) allows separations atatomic scale (0.1 nm).
In this thesis, TEM images of the SBA-16 series were obtained on a JEOL 2011transmission electron microscope operated at 200 kV. The samples were prepared bydispersing the powder probes in ethanol, then dispersed and dried on a carbon film on aCu grid.
3.5. Scanning electron microscopy (SEM)
Scanning electron microscopy (SEM) is a powerful technique to study the surface mor-phologies (texture, shape and size) of the bulk samples of solid materials. A beam ofelectrons is scanned across the surface of the sample. This method can be combinedwith energy dispersive X-ray microanalysis (EDX) to analyze the backscattered andsecondary electrons produced by the primary beam of electrons. In this thesis, SEMimages were used to estimate the size and shape of particles of the samples. The particlesize is a critical value to measure effective diffusivity with the zero length column (ZLC)technique.
22
Chapter 3. Methods and calculations
For all SEM images, a JEOL JSM-840 scanning electron microscope operated at 15kV was used. The samples were coated by a thin layer of gold before analysis.
3.6. Zero length column (ZLC) chromatography
A number of theoretical and experimental techniques exists nowadays to study diffusionin porous materials. This section gives a brief overview over the zero length column (ZLC)method, which was used to determine the effective diffusivity of several hydrocarbonsthrough the porous structure of selected SBA-16 samples. SBA-15 and Zeolite materialswere analyzed recently on the same set-up and the results will be compared in chapter 5of this thesis. Also a more detailed theoretical study of diffusion in general will be donein chapter 5.
3.6.1. Introduction
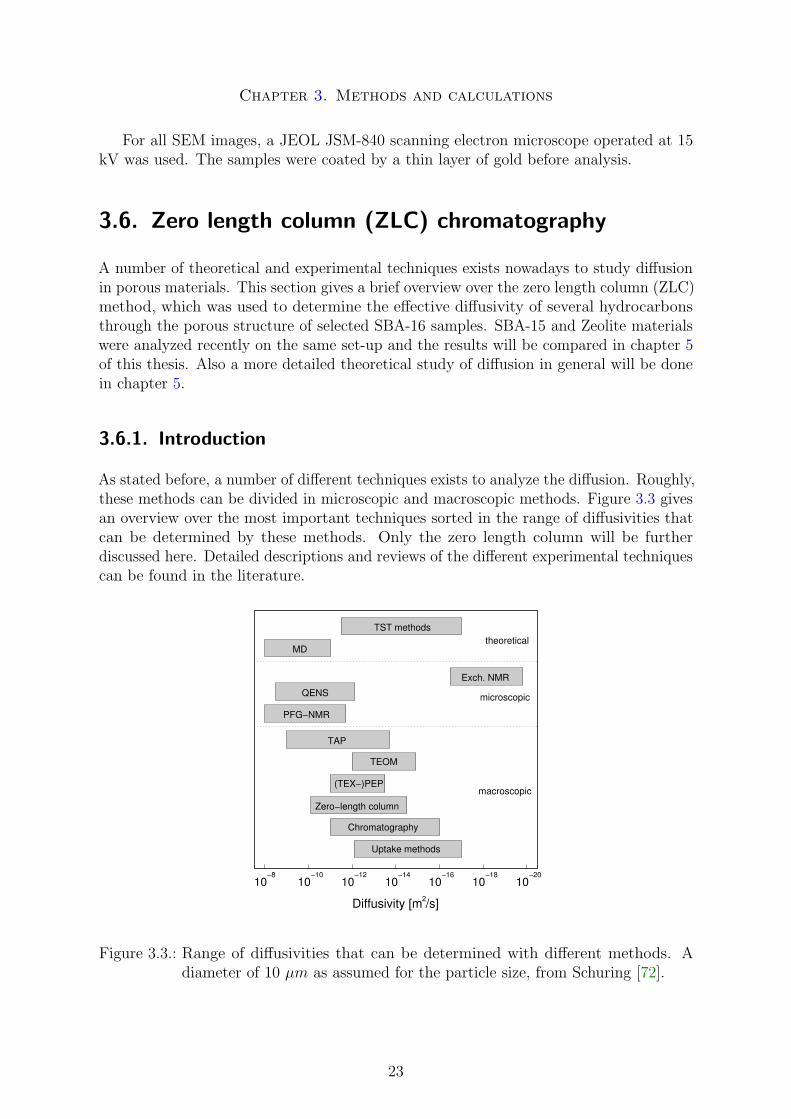
As stated before, a number of different techniques exists to analyze the diffusion. Roughly,these methods can be divided in microscopic and macroscopic methods. Figure 3.3 givesan overview over the most important techniques sorted in the range of diffusivities thatcan be determined by these methods. Only the zero length column will be furtherdiscussed here. Detailed descriptions and reviews of the different experimental techniquescan be found in the literature.
10−8
10−10
10−12
10−14
10−16
10−18
10−20
Diffusivity [m /s]2
Chromatography
(TEX−)PEP
TEOM
Zero−length column
TAP
PFG−NMR
Exch. NMR
QENS microscopic
macroscopic
MD
TST methodstheoretical
Uptake methods
Range of diffusivities that can be determined with different methods. As some of
Figure 3.3.: Range of diffusivities that can be determined with different methods. Adiameter of 10 µm as assumed for the particle size, from Schuring [72].
23
Chapter 3. Methods and calculations
The zero length column method uses a very small gas volume which is equilibratedwith the sorbate of interest and than purged with an inert gas at a high flow rate inorder to further decrease external mass transfer resistances. The experimental set-upand procedure was very similar to the one used by Jiang and Eic [73].
3.6.2. Experimental set-up
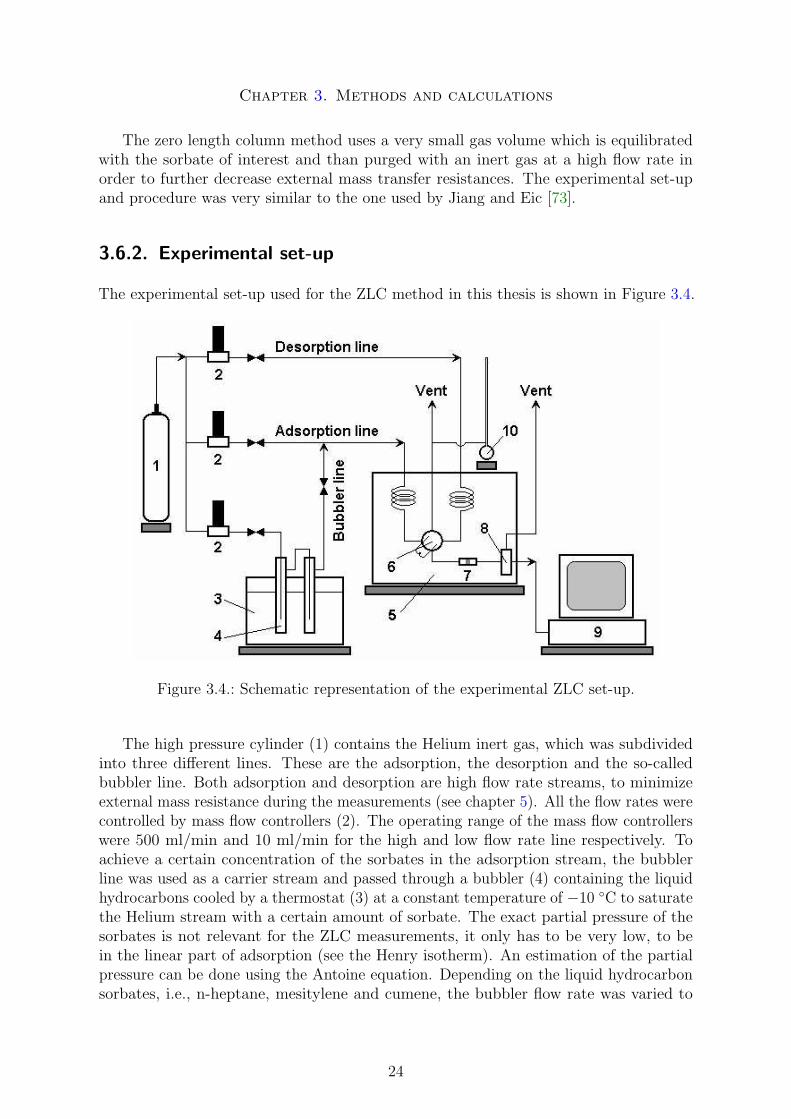
The experimental set-up used for the ZLC method in this thesis is shown in Figure 3.4.
Figure 3.4.: Schematic representation of the experimental ZLC set-up.
The high pressure cylinder (1) contains the Helium inert gas, which was subdividedinto three different lines. These are the adsorption, the desorption and the so-calledbubbler line. Both adsorption and desorption are high flow rate streams, to minimizeexternal mass resistance during the measurements (see chapter 5). All the flow rates werecontrolled by mass flow controllers (2). The operating range of the mass flow controllerswere 500 ml/min and 10 ml/min for the high and low flow rate line respectively. Toachieve a certain concentration of the sorbates in the adsorption stream, the bubblerline was used as a carrier stream and passed through a bubbler (4) containing the liquidhydrocarbons cooled by a thermostat (3) at a constant temperature of −10 ◦C to saturatethe Helium stream with a certain amount of sorbate. The exact partial pressure of thesorbates is not relevant for the ZLC measurements, it only has to be very low, to bein the linear part of adsorption (see the Henry isotherm). An estimation of the partialpressure can be done using the Antoine equation. Depending on the liquid hydrocarbonsorbates, i.e., n-heptane, mesitylene and cumene, the bubbler flow rate was varied to
24
Chapter 3. Methods and calculations
control the amount of sorbates in the stream. It is than connected with the adsorptionline with a T Swagelok union before passing through the sample. Both desorption andadsorption lines are connected through a 6-way switching valve (6).
The central part of the ZLC system is the zero length cell (7), which consists of a1/8 Swagelok union. Two 1/8 sintered disks are placed on one end of the union to holdthe powder samples between them. The outlet of the ZLC cell is connected to a flameionization detector FID (8). The 6-way switching valve, ZLC cell and FID detector wereplaced in a gas chromatograph oven (5) (Hewlett Packard Series II 5890). The reading ofthe FID was directly transferred and saved (9). Flow rates of desorption and adsorptionstreams were calibrated using a soap-bubble flow meter (10).
3.6.3. Differential ZLC Model
The basis of the ZLC model is formed by the Fick’s second law of diffusion, whichdescribes the mass balance through the solid-phase via diffusion. Mass transfer alsooccurs via the constant flow through the reactor bed. Both mass balances have to besolved simultaneously. Only the important details of the derivation will be discussed inthis section, in appendix A a detailed derivation can be found.
This technique has been applied mainly to gaseous systems [74, 75, 76, 77, 78, 79, 80]but the application to liquid systems have also been reported [81, 82]. The applicationto zeolite powders has been extended to pellet systems as well The diffusion of non-hydrocarbon sorbates has been demonstrated. Furthermore, several criterions for ZLCtechnique were also reported [83, 84, 85, 86, 87].
Model assumptions
The following assumptions were made during the model derivation:
1. The bed is isothermal
2. No external film resistance
3. The adsorption equilibrium isotherm is linear (Henry isotherm)
4. The gas hold-up in the fluid-phase was neglected in comparison with the adsorbed-phase accumulation
5. The particles are spherical and of constant size
Assumptions (1-3) can be controlled and checked during the measurement. This will bediscussed in chapter 5. The effect of assumption (4) has to be minimized by a cleverdesign of the set-up. Assumption (5) is more critical. Only taking into consideration thebiggest particles, this assumption is good enough for the model. This will be discussedin detail in chapter 5.
25
Chapter 3. Methods and calculations
Model equations and solution
The mass transfer via diffusion through spherical particles in radial coordinates is givenby:
∂q
∂t= Deff ·
(∂2q
∂r2+
2
r
∂q
∂r
)(3.19)
where q is the concentration of the adsorbed-phase, Deff the effective diffusion constantand r the radial coordinate. The fluid-phase mass balance in one dimension is given by:
∂c
∂t= Dz
∂2c
∂z2− c
∂v
∂z− v
∂c
∂z−
(1− ε
ε
)∂q
∂t(3.20)
where c is the concentration of sorbates in the fluid-phase, v the velocity of the fluidε the porosity of the bed, Dz the axial diffusion coefficient and z the axial coordinate.Only taking the relevant terms under assumption of stationarity, under negligence of thefluid-phase hold-up and introducing the volumes of solid-phase one gets (see appendixA):
Vs∂q
∂t+ F · c(t) = 0 (3.21)
In this equation Vs is the solid volume and F the fluid flow rate.
Equation (3.19) and (3.20) are a set of coupled differential equations. Brandaniand Ruthven presented 1995 an analytical solution to this problem. It can be solvedanalytically using the above assumptions and initial and boundary conditions (seeappendix A). The following set of equations is the analytical ZLC solution for the modeland describes the desorption out of a porous 3-dimensional material:
c(t)
c0
=∞∑
n=1
2L
β2n + L(L− 1)
· exp
(−β2
n
Deff
R2t
)(3.22)
0 = βn · cot βn + L− 1 (3.23)
L =1
3
F
Vs
· R2
KHDeff
(3.24)
where R is the mean particle radius, KH is the dimensionless Henry constant. βn are thepositive roots of equation (3.23) and L a value which introduces the flow rate into theset of equations.
In chapter 5 two different techniques will be implemented to solve these equations.In brief these are the long time analysis and the direct implementation of the aboveequations.
3.6.4. Measurements
In a typical ZLC measurement, a small amount of the SBA-16 samples (1-2 mg) wasplaced between the two sintered disks in the ZLC cell and placed inside the chromatographoven. Then the samples were activated at 270 ◦C over night for at least 6 hours under
26
Chapter 3. Methods and calculations
low Helium flow rate. After the activation the two high flow lines were set between 50and 200 ml/min. Most measurements were done at 100 ml/min. The bubbler flow ratewas set to a convenient value in the range of 0 to 5 ml/min.
The adsorption step was maintained until equilibrium conditions were reached, usuallythis was the case after about one hour. Then the 6-way switching valve was switchedto desorption. The relative concentrations (c/c0) of the effluent sorbates from the ZLCcolumn were determined using a flame ionization detector and transferred to a computer.
By regeneration of the samples at 270 ◦C over night, several adsorption and desorptioncycles could be performed before changing the sample.
3.7. Adsorption of hydrocarbons
3.7.1. Experimental set-up
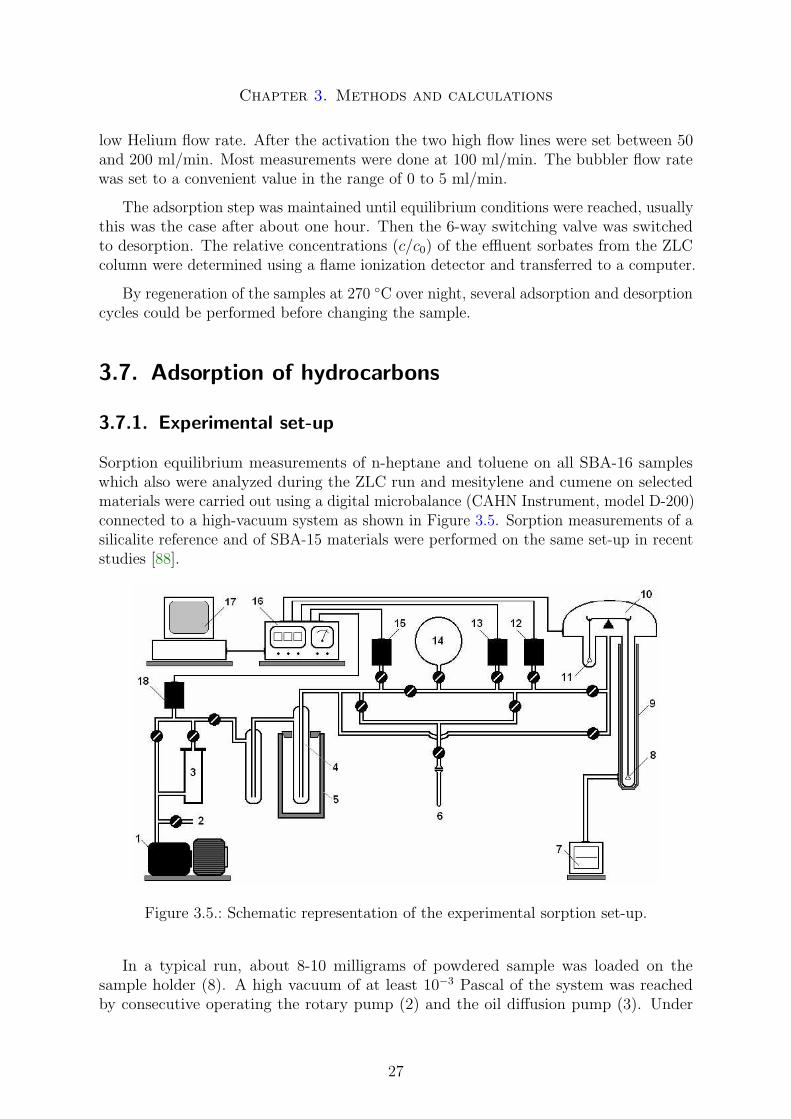
Sorption equilibrium measurements of n-heptane and toluene on all SBA-16 sampleswhich also were analyzed during the ZLC run and mesitylene and cumene on selectedmaterials were carried out using a digital microbalance (CAHN Instrument, model D-200)connected to a high-vacuum system as shown in Figure 3.5. Sorption measurements of asilicalite reference and of SBA-15 materials were performed on the same set-up in recentstudies [88].
Figure 3.5.: Schematic representation of the experimental sorption set-up.
In a typical run, about 8-10 milligrams of powdered sample was loaded on thesample holder (8). A high vacuum of at least 10−3 Pascal of the system was reachedby consecutive operating the rotary pump (2) and the oil diffusion pump (3). Under
27
Chapter 3. Methods and calculations
that pressure, the powder was activated at 270 ◦C using the heating tape (9) in order toeliminate possible adsorbed impurities and hygroscopic moisture. After at least 6 hours,the sample was cooled down to the required experimental temperature. The electronicbalance (10) was used to accurately monitor the weight of the sample. The equilibriumpressure was determined by both pressure transducers (12) and (13) and read on theCAHN D-200 microbalance (16). Adsorption step was started by introducing a dosedamount of hydrocarbon vapor directly to the sample chamber of the electronic balanceand recording the weight change after reaching a stable equilibrium pressure. Furtherconsecutive runs were taken by stepwise incrementation of the vapor pressure.
3.7.2. Data analysis and calculations
The adsorption isotherms were obtained from the dependence of adsorption capacitiesexpressed in millimol of sorbate per gram of sample or in cm3 of liquid sorbate pergram of sample with equilibrium pressure p or relative pressure p/p0 respectively. Themaximum adsorption capacities Q (mmol/g) were assumed as the maximum value ofsorbate loading in the adsorption isotherms. The Henry constants KH were calculatedfrom the linear part of the isotherm at very low pressures. The concentration of sorbatewas calculated by assuming that the density of the silicate powder is 2.2 cm3/g. Theisosteric heats of adsorption Hads of the sorbates on the samples were derived from thetemperature dependence of adsorption data, using the Clausius-Clapeyron equation foran ideal gas-phase: (
∂ ln p
∂1/T
)q
=δHads
R(3.25)
where p is the equilibrium pressure at absolute temperature T at constant adsorbedconcentration q and R is the gas constant.
28
4. Synthesis and characterization
4.1. Synthesis of SBA-16 materials
A series of SBA-16 materials was synthesized exactly as reported recently by Kim et al.[21], Kleitz et al. [23] using poly(ethylene oxide)-poly(propylene oxide)- poly(ethylene ox-ide) triblock copolymer in a ternary copolymer-butanol-water system and low-acid concen-trations [21, 22, 24]. The aqueous mixture of Pluronic F127 copolymer (EO106PO70EO106)with Butanol (1-Butanol, Aldrich 99%) was used to create a mesostructure to achieve anordered self-assembly of the silica source tetraethyl orthosilicate (TEOS, Aldrich 98%).
TEOS
HCl
Pluronic F127
Butanol
H2O
24 h stirring
45 °C
1 day - 45 °C1 day - 60 °C2 days - 60 °C1 day - 80 °C2 days - 80 °C3 days - 80 °C4 days - 80 °C5 days - 80 °C1 day - 100 °C2 days - 100 °C
drying
100 °CEtOH
extractiondrying
100 °CCalcination
550 °C
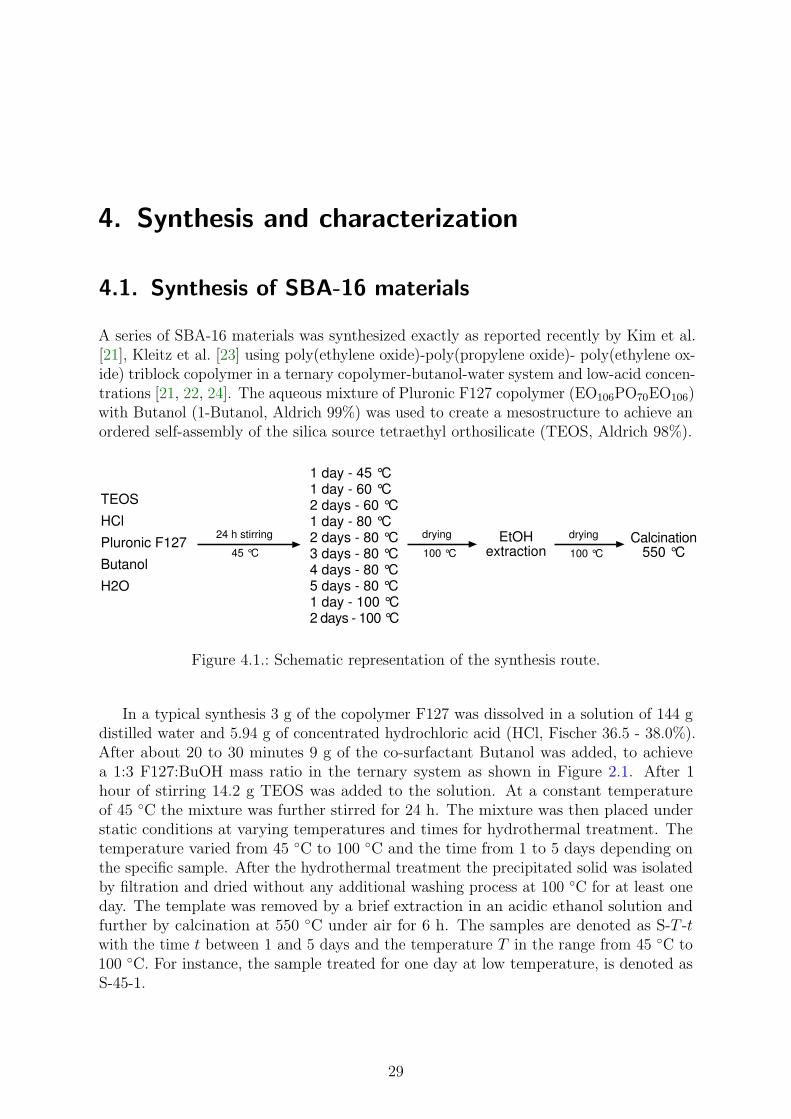
Figure 4.1.: Schematic representation of the synthesis route.
In a typical synthesis 3 g of the copolymer F127 was dissolved in a solution of 144 gdistilled water and 5.94 g of concentrated hydrochloric acid (HCl, Fischer 36.5 - 38.0%).After about 20 to 30 minutes 9 g of the co-surfactant Butanol was added, to achievea 1:3 F127:BuOH mass ratio in the ternary system as shown in Figure 2.1. After 1hour of stirring 14.2 g TEOS was added to the solution. At a constant temperatureof 45 ◦C the mixture was further stirred for 24 h. The mixture was then placed understatic conditions at varying temperatures and times for hydrothermal treatment. Thetemperature varied from 45 ◦C to 100 ◦C and the time from 1 to 5 days depending onthe specific sample. After the hydrothermal treatment the precipitated solid was isolatedby filtration and dried without any additional washing process at 100 ◦C for at least oneday. The template was removed by a brief extraction in an acidic ethanol solution andfurther by calcination at 550 ◦C under air for 6 h. The samples are denoted as S-T -twith the time t between 1 and 5 days and the temperature T in the range from 45 ◦C to100 ◦C. For instance, the sample treated for one day at low temperature, is denoted asS-45-1.
29
Chapter 4. Synthesis and characterization
4.2. Results and Discussions
4.2.1. Morphology
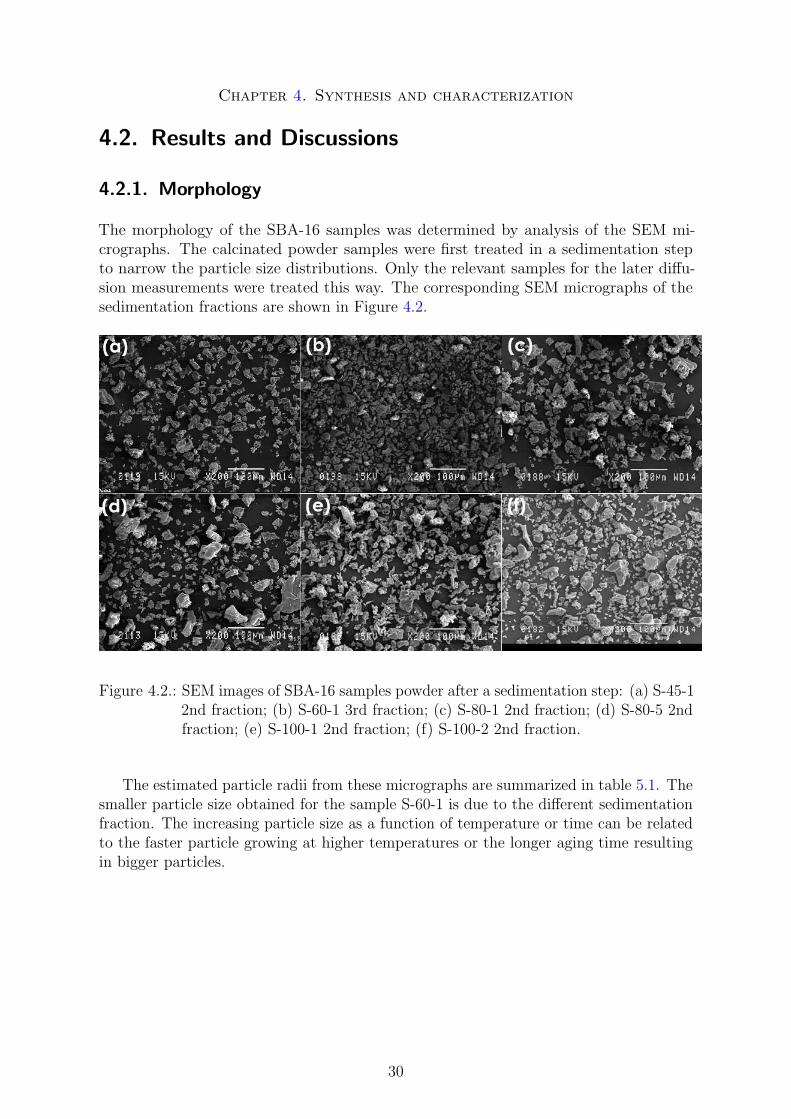
The morphology of the SBA-16 samples was determined by analysis of the SEM mi-crographs. The calcinated powder samples were first treated in a sedimentation stepto narrow the particle size distributions. Only the relevant samples for the later diffu-sion measurements were treated this way. The corresponding SEM micrographs of thesedimentation fractions are shown in Figure 4.2.
Figure 4.2.: SEM images of SBA-16 samples powder after a sedimentation step: (a) S-45-12nd fraction; (b) S-60-1 3rd fraction; (c) S-80-1 2nd fraction; (d) S-80-5 2ndfraction; (e) S-100-1 2nd fraction; (f) S-100-2 2nd fraction.
The estimated particle radii from these micrographs are summarized in table 5.1. Thesmaller particle size obtained for the sample S-60-1 is due to the different sedimentationfraction. The increasing particle size as a function of temperature or time can be relatedto the faster particle growing at higher temperatures or the longer aging time resultingin bigger particles.
30
Chapter 4. Synthesis and characterization
4.2.2. Crystallographic structure
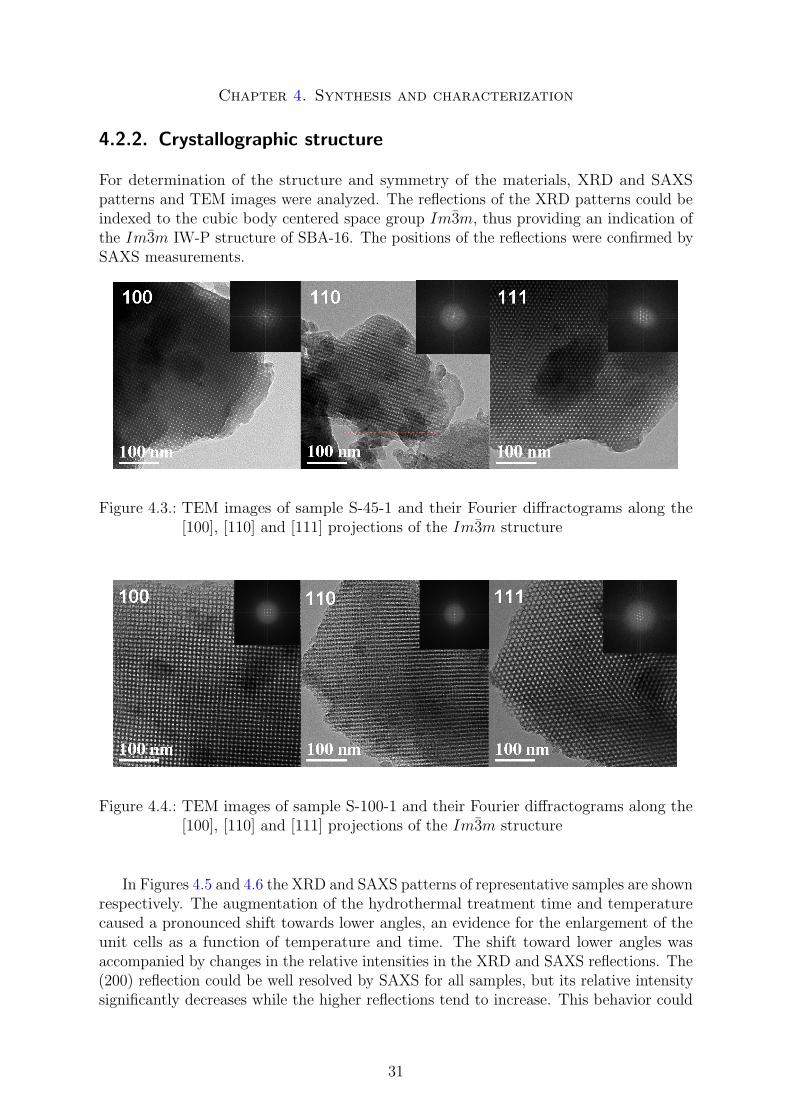
For determination of the structure and symmetry of the materials, XRD and SAXSpatterns and TEM images were analyzed. The reflections of the XRD patterns could beindexed to the cubic body centered space group Im3m, thus providing an indication ofthe Im3m IW-P structure of SBA-16. The positions of the reflections were confirmed bySAXS measurements.
Figure 4.3.: TEM images of sample S-45-1 and their Fourier diffractograms along the[100], [110] and [111] projections of the Im3m structure
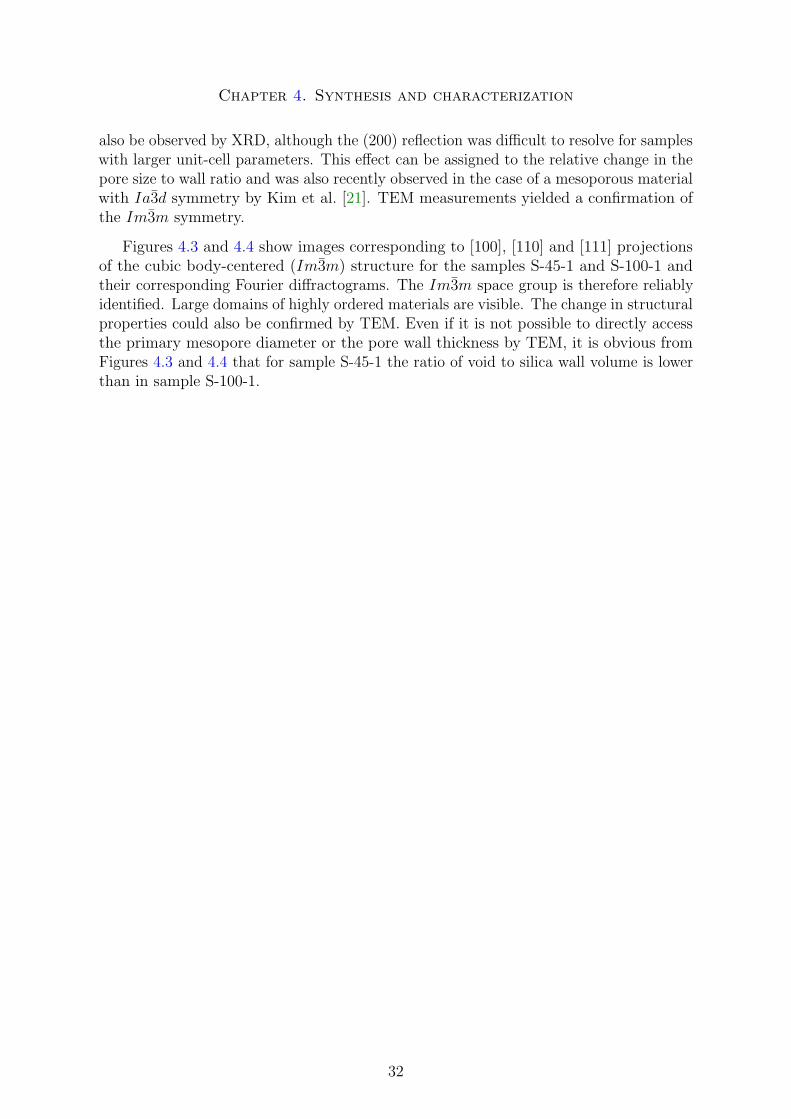
Figure 4.4.: TEM images of sample S-100-1 and their Fourier diffractograms along the[100], [110] and [111] projections of the Im3m structure
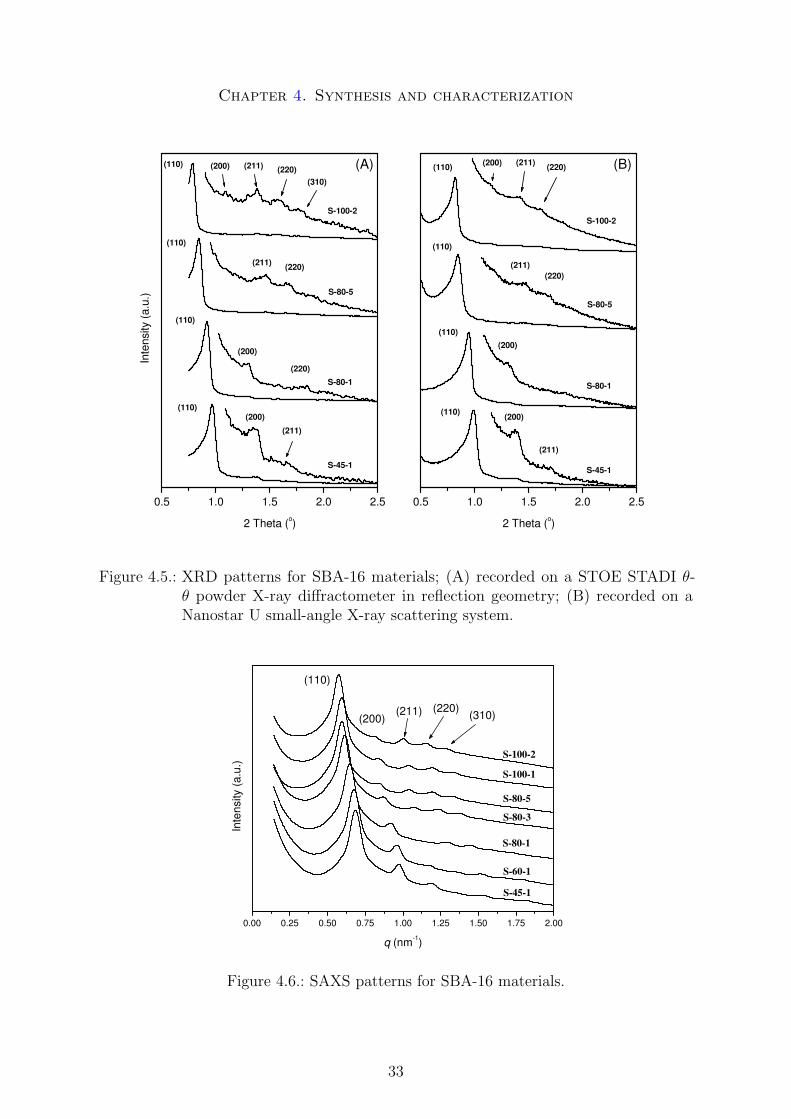
In Figures 4.5 and 4.6 the XRD and SAXS patterns of representative samples are shownrespectively. The augmentation of the hydrothermal treatment time and temperaturecaused a pronounced shift towards lower angles, an evidence for the enlargement of theunit cells as a function of temperature and time. The shift toward lower angles wasaccompanied by changes in the relative intensities in the XRD and SAXS reflections. The(200) reflection could be well resolved by SAXS for all samples, but its relative intensitysignificantly decreases while the higher reflections tend to increase. This behavior could
31
Chapter 4. Synthesis and characterization
also be observed by XRD, although the (200) reflection was difficult to resolve for sampleswith larger unit-cell parameters. This effect can be assigned to the relative change in thepore size to wall ratio and was also recently observed in the case of a mesoporous materialwith Ia3d symmetry by Kim et al. [21]. TEM measurements yielded a confirmation ofthe Im3m symmetry.
Figures 4.3 and 4.4 show images corresponding to [100], [110] and [111] projectionsof the cubic body-centered (Im3m) structure for the samples S-45-1 and S-100-1 andtheir corresponding Fourier diffractograms. The Im3m space group is therefore reliablyidentified. Large domains of highly ordered materials are visible. The change in structuralproperties could also be confirmed by TEM. Even if it is not possible to directly accessthe primary mesopore diameter or the pore wall thickness by TEM, it is obvious fromFigures 4.3 and 4.4 that for sample S-45-1 the ratio of void to silica wall volume is lowerthan in sample S-100-1.
32
Chapter 4. Synthesis and characterization
0.5 1.0 1.5 2.0 2.5
S-100-2
S-80-5
S-80-1
S-45-1
(110)
(110)
(110)
(220)
(211)
(220)
(310)(220)
(211)
(200)
(200)
Inte
nsity
(a.u
.)
2 Theta (o)
(200)(110)
(211) (A)
0.5 1.0 1.5 2.0 2.5
(200)
S-100-2
S-80-5
S-80-1
S-45-1
(110)
(110)
(110)
(211)
(220)
(220)
(211)
(200)
2 Theta (o)
(200)(110)
(211) (B)
Figure 4.5.: XRD patterns for SBA-16 materials; (A) recorded on a STOE STADI θ-θ powder X-ray diffractometer in reflection geometry; (B) recorded on aNanostar U small-angle X-ray scattering system.
0.00 0.25 0.50 0.75 1.00 1.25 1.50 1.75 2.00
(310)(220)(211)
(200)
(110)
S-100-2
S-100-1
S-80-5
S-80-3
S-80-1
S-60-1
S-45-1
Inte
nsity
(a.u
.)
q (nm-1)
Figure 4.6.: SAXS patterns for SBA-16 materials.
33
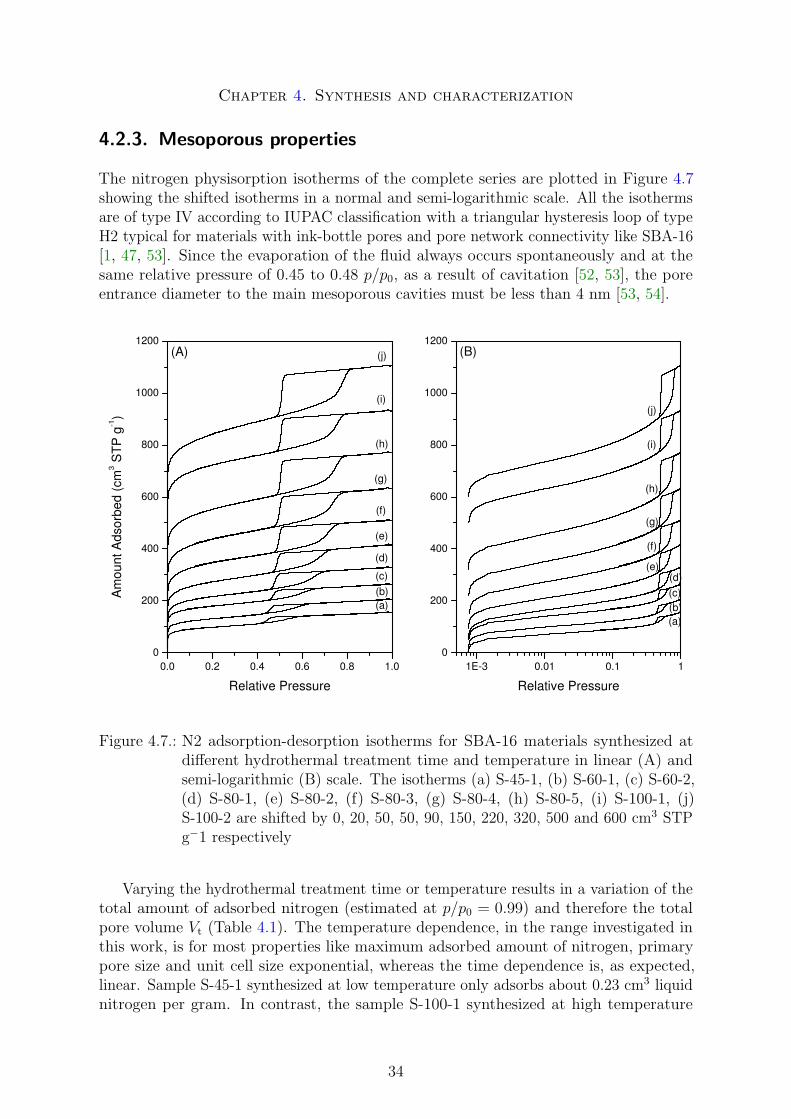
Chapter 4. Synthesis and characterization
4.2.3. Mesoporous properties
The nitrogen physisorption isotherms of the complete series are plotted in Figure 4.7showing the shifted isotherms in a normal and semi-logarithmic scale. All the isothermsare of type IV according to IUPAC classification with a triangular hysteresis loop of typeH2 typical for materials with ink-bottle pores and pore network connectivity like SBA-16[1, 47, 53]. Since the evaporation of the fluid always occurs spontaneously and at thesame relative pressure of 0.45 to 0.48 p/p0, as a result of cavitation [52, 53], the poreentrance diameter to the main mesoporous cavities must be less than 4 nm [53, 54].
1E-3 0.01 0.1 10
200
400
600
800
1000
1200(B)
(j)
(i)
(g)
(f)
(h)
(e)(d)
(c)(b)(a)
Relative Pressure
0.0 0.2 0.4 0.6 0.8 1.00
200
400
600
800
1000
1200
Am
ount
Ads
orbe
d (c
m3 S
TP g
-1)
(A) (j)
(i)
(h)
(g)
(f)
(e)
(d)
(b)(c)
(a)
Relative Pressure
Figure 4.7.: N2 adsorption-desorption isotherms for SBA-16 materials synthesized atdifferent hydrothermal treatment time and temperature in linear (A) andsemi-logarithmic (B) scale. The isotherms (a) S-45-1, (b) S-60-1, (c) S-60-2,(d) S-80-1, (e) S-80-2, (f) S-80-3, (g) S-80-4, (h) S-80-5, (i) S-100-1, (j)S-100-2 are shifted by 0, 20, 50, 50, 90, 150, 220, 320, 500 and 600 cm3 STPg−1 respectively
Varying the hydrothermal treatment time or temperature results in a variation of thetotal amount of adsorbed nitrogen (estimated at p/p0 = 0.99) and therefore the totalpore volume Vt (Table 4.1). The temperature dependence, in the range investigated inthis work, is for most properties like maximum adsorbed amount of nitrogen, primarypore size and unit cell size exponential, whereas the time dependence is, as expected,linear. Sample S-45-1 synthesized at low temperature only adsorbs about 0.23 cm3 liquidnitrogen per gram. In contrast, the sample S-100-1 synthesized at high temperature
34
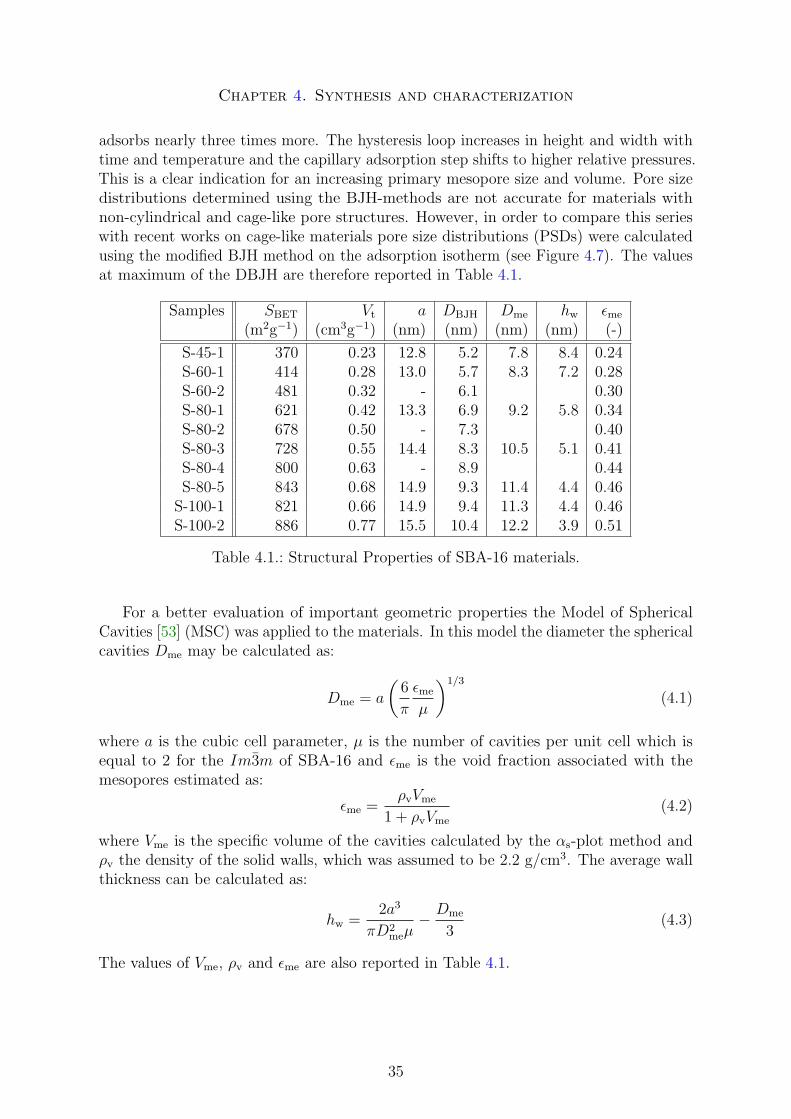
Chapter 4. Synthesis and characterization
adsorbs nearly three times more. The hysteresis loop increases in height and width withtime and temperature and the capillary adsorption step shifts to higher relative pressures.This is a clear indication for an increasing primary mesopore size and volume. Pore sizedistributions determined using the BJH-methods are not accurate for materials withnon-cylindrical and cage-like pore structures. However, in order to compare this serieswith recent works on cage-like materials pore size distributions (PSDs) were calculatedusing the modified BJH method on the adsorption isotherm (see Figure 4.7). The valuesat maximum of the DBJH are therefore reported in Table 4.1.
Samples SBET Vt a DBJH Dme hw εme
(m2g−1) (cm3g−1) (nm) (nm) (nm) (nm) (-)
S-45-1 370 0.23 12.8 5.2 7.8 8.4 0.24S-60-1 414 0.28 13.0 5.7 8.3 7.2 0.28S-60-2 481 0.32 - 6.1 0.30S-80-1 621 0.42 13.3 6.9 9.2 5.8 0.34S-80-2 678 0.50 - 7.3 0.40S-80-3 728 0.55 14.4 8.3 10.5 5.1 0.41S-80-4 800 0.63 - 8.9 0.44S-80-5 843 0.68 14.9 9.3 11.4 4.4 0.46
S-100-1 821 0.66 14.9 9.4 11.3 4.4 0.46S-100-2 886 0.77 15.5 10.4 12.2 3.9 0.51
Table 4.1.: Structural Properties of SBA-16 materials.
For a better evaluation of important geometric properties the Model of SphericalCavities [53] (MSC) was applied to the materials. In this model the diameter the sphericalcavities Dme may be calculated as:
Dme = a
(6
π
εme
µ
)1/3
(4.1)
where a is the cubic cell parameter, µ is the number of cavities per unit cell which isequal to 2 for the Im3m of SBA-16 and εme is the void fraction associated with themesopores estimated as:
εme =ρvVme
1 + ρvVme
(4.2)
where Vme is the specific volume of the cavities calculated by the αs-plot method andρv the density of the solid walls, which was assumed to be 2.2 g/cm3. The average wallthickness can be calculated as:
hw =2a3
πD2meµ
− Dme
3(4.3)
The values of Vme, ρv and εme are also reported in Table 4.1.
35
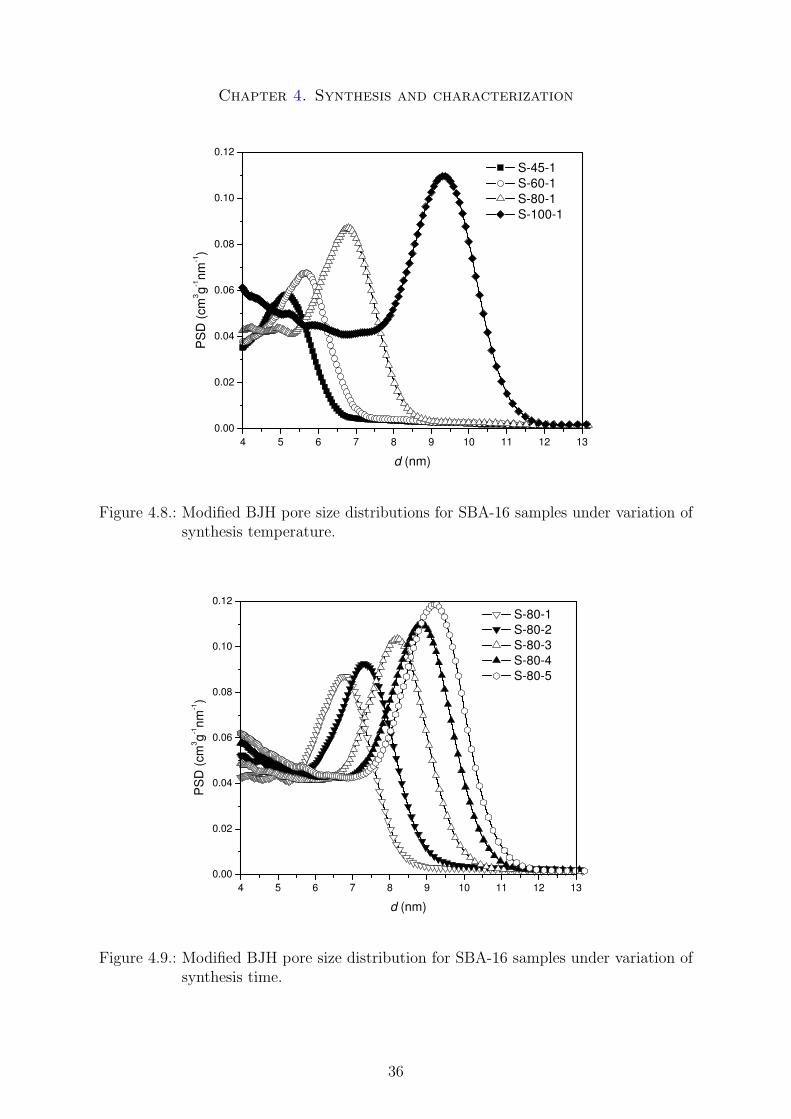
Chapter 4. Synthesis and characterization
4 5 6 7 8 9 10 11 12 130.00
0.02
0.04
0.06
0.08
0.10
0.12
S-45-1 S-60-1 S-80-1 S-100-1
PS
D (c
m3 g-1
nm-1)
d (nm)
Figure 4.8.: Modified BJH pore size distributions for SBA-16 samples under variation ofsynthesis temperature.
4 5 6 7 8 9 10 11 12 130.00
0.02
0.04
0.06
0.08
0.10
0.12
S-80-1 S-80-2 S-80-3 S-80-4 S-80-5
PS
D (c
m3 g-1
nm-1)
d (nm)
Figure 4.9.: Modified BJH pore size distribution for SBA-16 samples under variation ofsynthesis time.
36
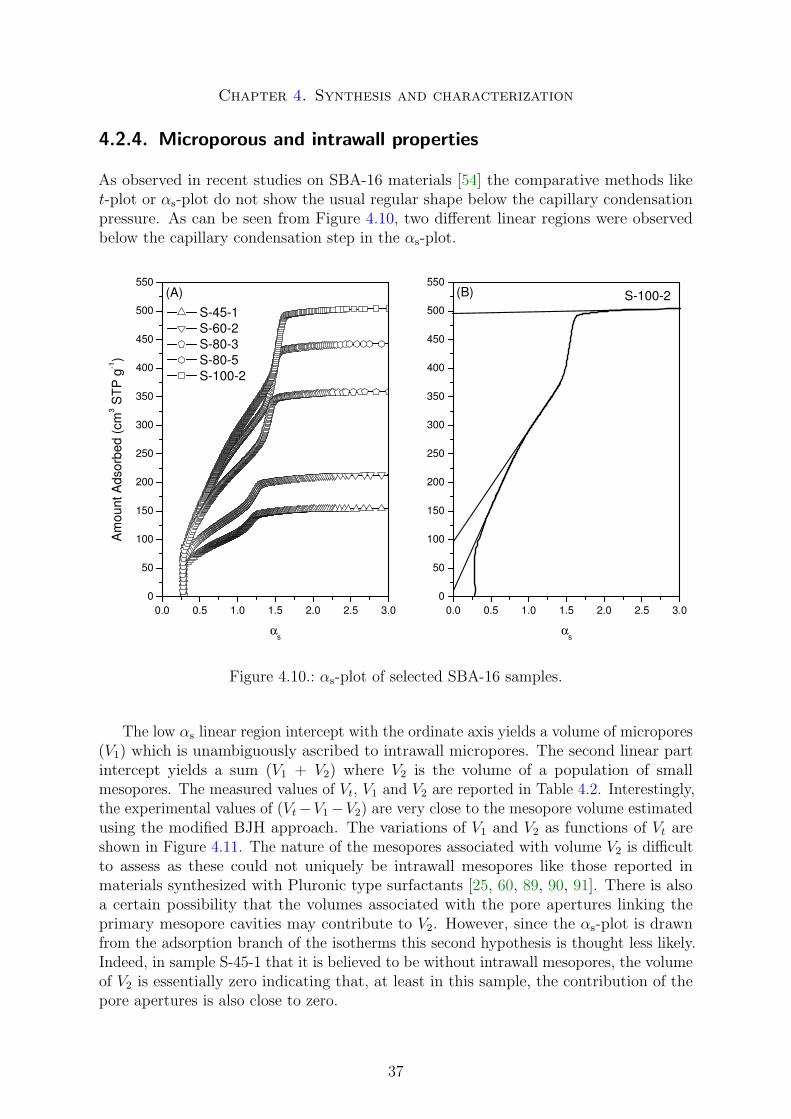
Chapter 4. Synthesis and characterization
4.2.4. Microporous and intrawall properties
As observed in recent studies on SBA-16 materials [54] the comparative methods liket-plot or αs-plot do not show the usual regular shape below the capillary condensationpressure. As can be seen from Figure 4.10, two different linear regions were observedbelow the capillary condensation step in the αs-plot.
0.0 0.5 1.0 1.5 2.0 2.5 3.00
50
100
150
200
250
300
350
400
450
500
550
0.0 0.5 1.0 1.5 2.0 2.5 3.00
50
100
150
200
250
300
350
400
450
500
550
S-45-1 S-60-2 S-80-3 S-80-5 S-100-2
Am
ount
Ads
orbe
d (c
m3 S
TP g
-1)
αs
(A) S-100-2
αs
(B)
Figure 4.10.: αs-plot of selected SBA-16 samples.
The low αs linear region intercept with the ordinate axis yields a volume of micropores(V1) which is unambiguously ascribed to intrawall micropores. The second linear partintercept yields a sum (V1 + V2) where V2 is the volume of a population of smallmesopores. The measured values of Vt, V1 and V2 are reported in Table 4.2. Interestingly,the experimental values of (Vt−V1−V2) are very close to the mesopore volume estimatedusing the modified BJH approach. The variations of V1 and V2 as functions of Vt areshown in Figure 4.11. The nature of the mesopores associated with volume V2 is difficultto assess as these could not uniquely be intrawall mesopores like those reported inmaterials synthesized with Pluronic type surfactants [25, 60, 89, 90, 91]. There is alsoa certain possibility that the volumes associated with the pore apertures linking theprimary mesopore cavities may contribute to V2. However, since the αs-plot is drawnfrom the adsorption branch of the isotherms this second hypothesis is thought less likely.Indeed, in sample S-45-1 that it is believed to be without intrawall mesopores, the volumeof V2 is essentially zero indicating that, at least in this sample, the contribution of thepore apertures is also close to zero.
37
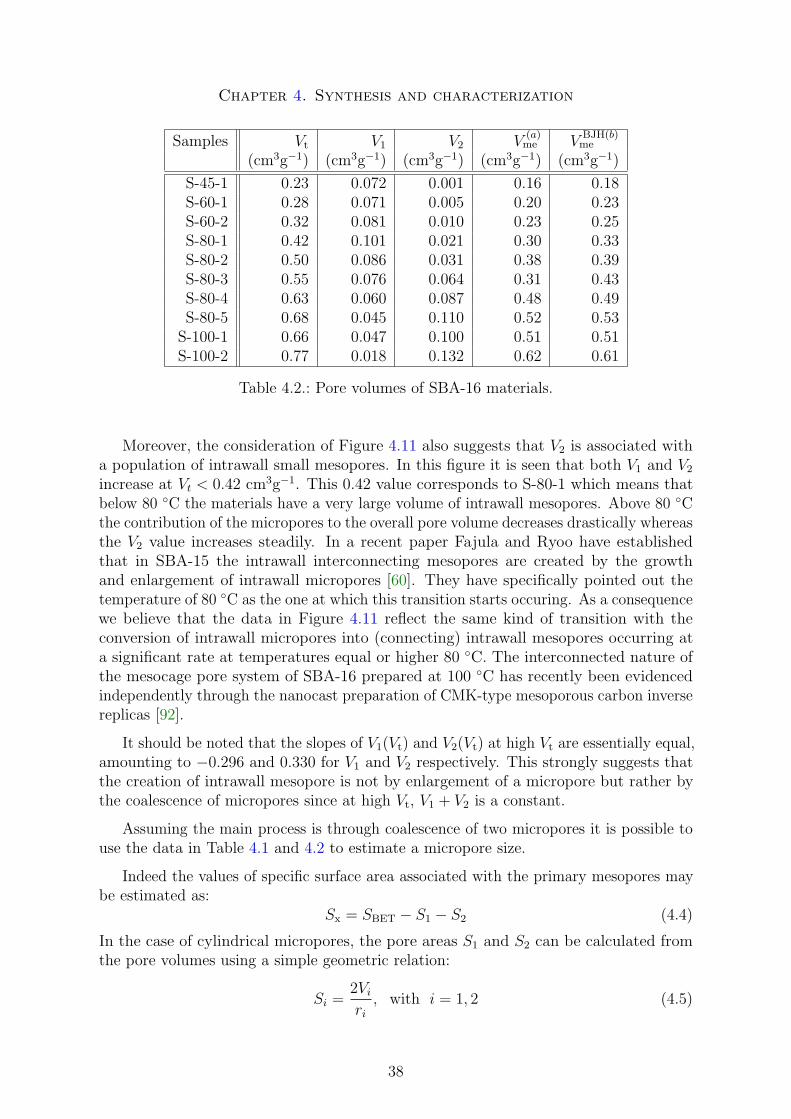
Chapter 4. Synthesis and characterization
Samples Vt V1 V2 V(a)me V
BJH(b)me
(cm3g−1) (cm3g−1) (cm3g−1) (cm3g−1) (cm3g−1)
S-45-1 0.23 0.072 0.001 0.16 0.18S-60-1 0.28 0.071 0.005 0.20 0.23S-60-2 0.32 0.081 0.010 0.23 0.25S-80-1 0.42 0.101 0.021 0.30 0.33S-80-2 0.50 0.086 0.031 0.38 0.39S-80-3 0.55 0.076 0.064 0.31 0.43S-80-4 0.63 0.060 0.087 0.48 0.49S-80-5 0.68 0.045 0.110 0.52 0.53
S-100-1 0.66 0.047 0.100 0.51 0.51S-100-2 0.77 0.018 0.132 0.62 0.61
Table 4.2.: Pore volumes of SBA-16 materials.
Moreover, the consideration of Figure 4.11 also suggests that V2 is associated witha population of intrawall small mesopores. In this figure it is seen that both V1 and V2
increase at Vt < 0.42 cm3g−1. This 0.42 value corresponds to S-80-1 which means thatbelow 80 ◦C the materials have a very large volume of intrawall mesopores. Above 80 ◦Cthe contribution of the micropores to the overall pore volume decreases drastically whereasthe V2 value increases steadily. In a recent paper Fajula and Ryoo have establishedthat in SBA-15 the intrawall interconnecting mesopores are created by the growthand enlargement of intrawall micropores [60]. They have specifically pointed out thetemperature of 80 ◦C as the one at which this transition starts occuring. As a consequencewe believe that the data in Figure 4.11 reflect the same kind of transition with theconversion of intrawall micropores into (connecting) intrawall mesopores occurring ata significant rate at temperatures equal or higher 80 ◦C. The interconnected nature ofthe mesocage pore system of SBA-16 prepared at 100 ◦C has recently been evidencedindependently through the nanocast preparation of CMK-type mesoporous carbon inversereplicas [92].
It should be noted that the slopes of V1(Vt) and V2(Vt) at high Vt are essentially equal,amounting to −0.296 and 0.330 for V1 and V2 respectively. This strongly suggests thatthe creation of intrawall mesopore is not by enlargement of a micropore but rather bythe coalescence of micropores since at high Vt, V1 + V2 is a constant.
Assuming the main process is through coalescence of two micropores it is possible touse the data in Table 4.1 and 4.2 to estimate a micropore size.
Indeed the values of specific surface area associated with the primary mesopores maybe estimated as:
Sx = SBET − S1 − S2 (4.4)
In the case of cylindrical micropores, the pore areas S1 and S2 can be calculated fromthe pore volumes using a simple geometric relation:
Si =2Vi
ri
, with i = 1, 2 (4.5)
38
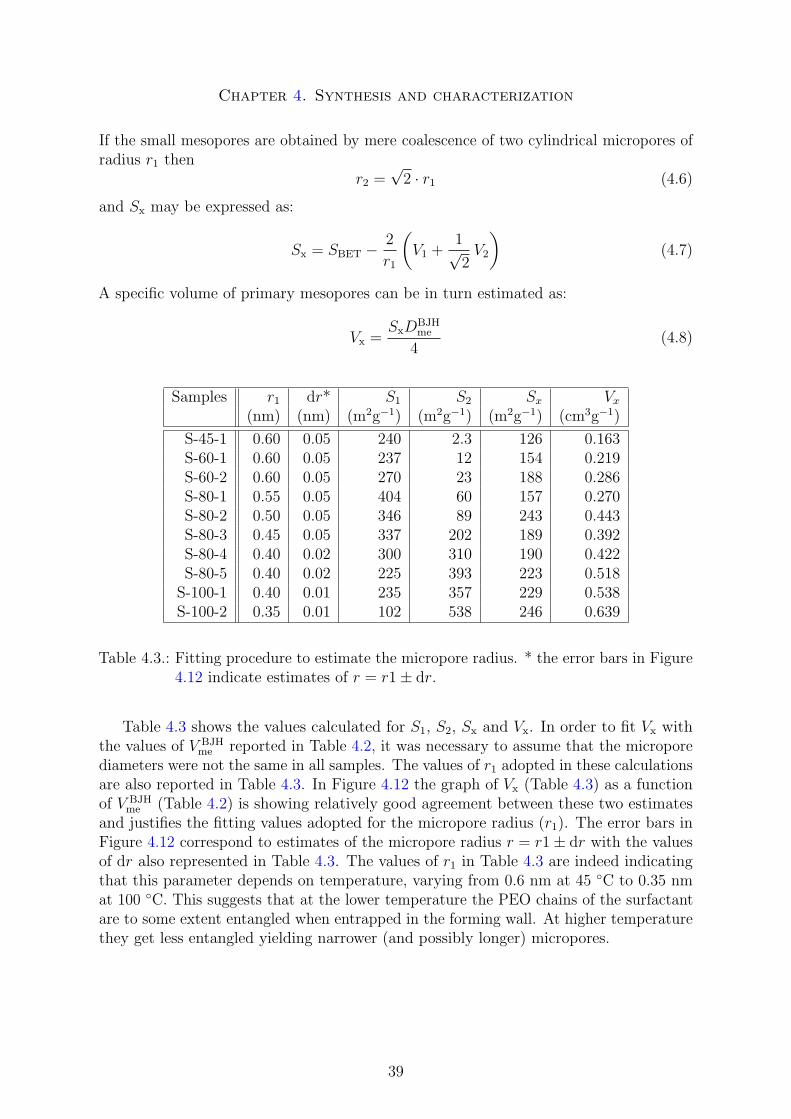
Chapter 4. Synthesis and characterization
If the small mesopores are obtained by mere coalescence of two cylindrical micropores ofradius r1 then
r2 =√
2 · r1 (4.6)
and Sx may be expressed as:
Sx = SBET −2
r1
(V1 +
1√2
V2
)(4.7)
A specific volume of primary mesopores can be in turn estimated as:
Vx =SxD
BJHme
4(4.8)
Samples r1 dr* S1 S2 Sx Vx
(nm) (nm) (m2g−1) (m2g−1) (m2g−1) (cm3g−1)
S-45-1 0.60 0.05 240 2.3 126 0.163S-60-1 0.60 0.05 237 12 154 0.219S-60-2 0.60 0.05 270 23 188 0.286S-80-1 0.55 0.05 404 60 157 0.270S-80-2 0.50 0.05 346 89 243 0.443S-80-3 0.45 0.05 337 202 189 0.392S-80-4 0.40 0.02 300 310 190 0.422S-80-5 0.40 0.02 225 393 223 0.518
S-100-1 0.40 0.01 235 357 229 0.538S-100-2 0.35 0.01 102 538 246 0.639
Table 4.3.: Fitting procedure to estimate the micropore radius. * the error bars in Figure4.12 indicate estimates of r = r1± dr.
Table 4.3 shows the values calculated for S1, S2, Sx and Vx. In order to fit Vx withthe values of V BJH
me reported in Table 4.2, it was necessary to assume that the microporediameters were not the same in all samples. The values of r1 adopted in these calculationsare also reported in Table 4.3. In Figure 4.12 the graph of Vx (Table 4.3) as a functionof V BJH
me (Table 4.2) is showing relatively good agreement between these two estimatesand justifies the fitting values adopted for the micropore radius (r1). The error bars inFigure 4.12 correspond to estimates of the micropore radius r = r1± dr with the valuesof dr also represented in Table 4.3. The values of r1 in Table 4.3 are indeed indicatingthat this parameter depends on temperature, varying from 0.6 nm at 45 ◦C to 0.35 nmat 100 ◦C. This suggests that at the lower temperature the PEO chains of the surfactantare to some extent entangled when entrapped in the forming wall. At higher temperaturethey get less entangled yielding narrower (and possibly longer) micropores.
39
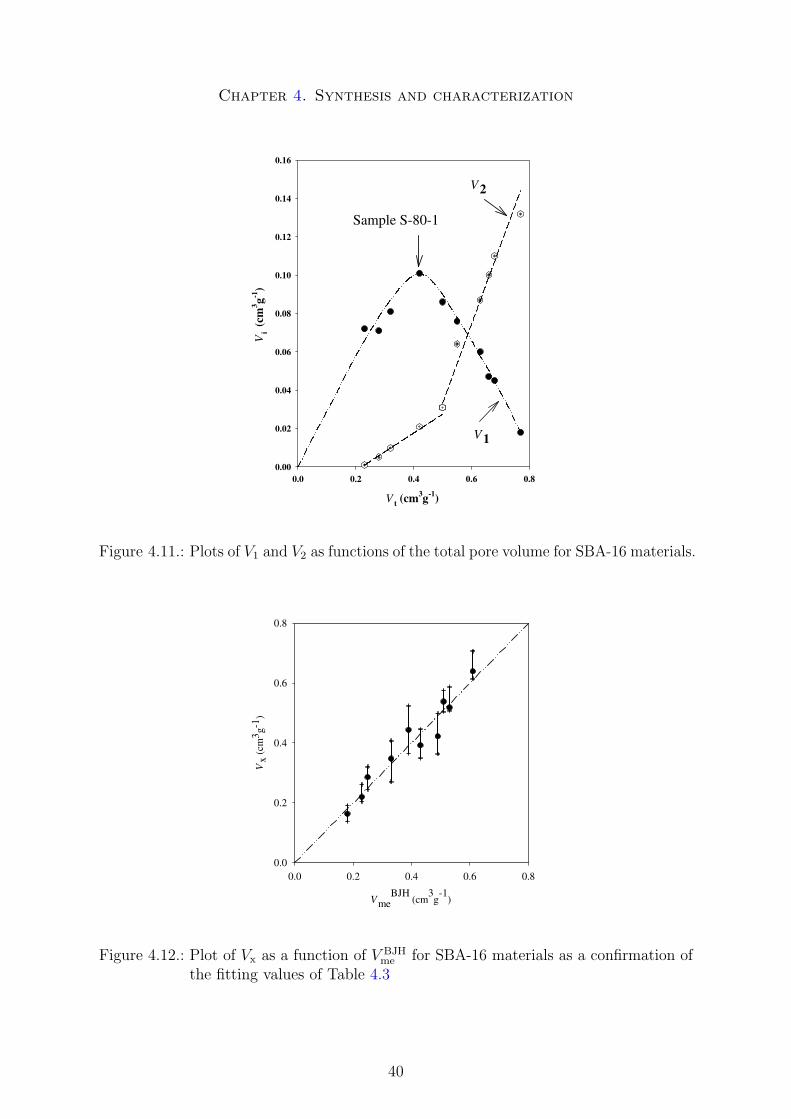
Chapter 4. Synthesis and characterization
V t (cm3g-1)
0.0 0.2 0.4 0.6 0.8
Vi (
cm3 g-1
)
0.00
0.02
0.04
0.06
0.08
0.10
0.12
0.14
0.16
V1
V2
Sample S-80-1
Figure 4.11.: Plots of V1 and V2 as functions of the total pore volume for SBA-16 materials.
0.0 0.2 0.4 0.6 0.8
Vx
(cm
3 g-1
)
0.0
0.2
0.4
0.6
0.8
VmeBJH
(cm3g
-1)
Figure 4.12.: Plot of Vx as a function of V BJHme for SBA-16 materials as a confirmation of
the fitting values of Table 4.3
40
Chapter 4. Synthesis and characterization
4.3. Conclusions
A series of high-quality SBA-16 materials was prepared with different structural propertiesfocusing on the systematic control of intrawall porosity. The mesophase was createdusing butanol as cosolute. The symmetry and the high quality of the samples wasestablished from XRD, SAXS and TEM measurements. By varying the hydrothermaltemperature and time, materials with a high fraction of intrawall micropores and thickwall (S-45-1) up to mesoporous materials with few micropores, thinner walls and largeprimary mesopores (S-100-2) could be obtained. Using the αs-plot, it was possible todistinguish two different types of intrawall pores. Moreover the variations in intrawallpore volumes allowed to suggest that the intrawall small mesopores are generated by thecoalescence of two micropores, this process happening at a significant rate at temperatureexceeding 80 ◦C. These data also allowed a rough estimate of the micropore radius whichvaries from 0.6 nm at 45 ◦C to 0.35 nm at 100 ◦C. The Model of Spherical Cavities [53]allowed to calculate provided estimates of the primary mesopore size, pore wall thicknessand primary mesopore void fraction, which are important structural properties for thecorrect evaluation of diffusion results. These will be reported in the next chapter of thisthesis.
41
5. Diffusional properties
5.1. Theory
In the case of uniform spherical particles being in linear adsorption equilibrium at verylow partial pressures of the sorbate under negligence of the hold-up in the ZLC-bedand assuming perfect mixing throughout the ZLC cell the normalized effluent sorbateconcentration c/c0 is described by the set of equations (3.22 - 3.24).
By fitting this set of equations against the experimental data in the complete timerange, it is possible to calculate the effective diffusion time constant Deff/R
2. Howeverto minimize particle size distribution effects which only appear at short times [83], theso-called long-time solution is more accurate. It is obtained by neglecting all the higherorder terms of the sum in equation (3.22) [93] and yields to a straight line on a semilogarithmic plot of the normalized effluent sorbate concentration versus the time. Fromthe slope:
m = −β21
Deff
R2(5.1)
and the intercept:
i =2L
β21 + L(L− 1)
(5.2)
of the plot and under consideration of equation (3.23) the effective diffusion time constantis obtained. The implementation of the long-time solution in Matlab is listed in appendixB.3.
5.2. Measurements and calculations
The ZLC set-up was described in detail by Jiang and Eic [73]. The ZLC column andswitching valve were placed in a gas chromatograph oven (Hewlett- Packard Series II5890). The flow rates were controlled by mass flow controllers.
A small amount of the SBA-16 sample powder (1-2 mg) was loaded into the ZLCcolumn and activated at 270 ◦C overnight or for at least 6 hours to eliminate possibleimpurities and moisture in particular. Helium of 99.95% purity was used as the inertcarrier gas. n-heptane, cumene or mesitylene (99% grade, Aldrich) were kept in thebubbler, and its vapor was carried by a small flow of helium before being diluted in themain He stream. The sorbate concentration was adjusted and maintained at a low levelcorresponding to the linear region of the adsorption isotherm (Henry’s law region) [77].
42
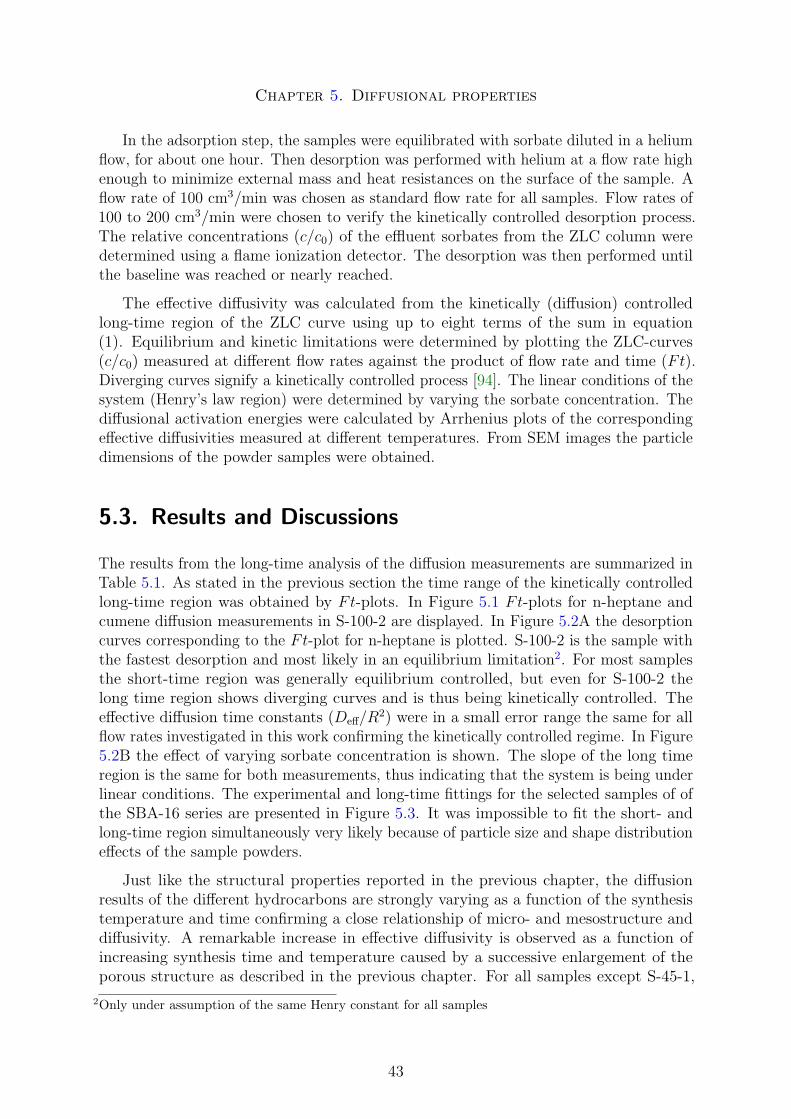
Chapter 5. Diffusional properties
In the adsorption step, the samples were equilibrated with sorbate diluted in a heliumflow, for about one hour. Then desorption was performed with helium at a flow rate highenough to minimize external mass and heat resistances on the surface of the sample. Aflow rate of 100 cm3/min was chosen as standard flow rate for all samples. Flow rates of100 to 200 cm3/min were chosen to verify the kinetically controlled desorption process.The relative concentrations (c/c0) of the effluent sorbates from the ZLC column weredetermined using a flame ionization detector. The desorption was then performed untilthe baseline was reached or nearly reached.
The effective diffusivity was calculated from the kinetically (diffusion) controlledlong-time region of the ZLC curve using up to eight terms of the sum in equation(1). Equilibrium and kinetic limitations were determined by plotting the ZLC-curves(c/c0) measured at different flow rates against the product of flow rate and time (Ft).Diverging curves signify a kinetically controlled process [94]. The linear conditions of thesystem (Henry’s law region) were determined by varying the sorbate concentration. Thediffusional activation energies were calculated by Arrhenius plots of the correspondingeffective diffusivities measured at different temperatures. From SEM images the particledimensions of the powder samples were obtained.
5.3. Results and Discussions
The results from the long-time analysis of the diffusion measurements are summarized inTable 5.1. As stated in the previous section the time range of the kinetically controlledlong-time region was obtained by Ft-plots. In Figure 5.1 Ft-plots for n-heptane andcumene diffusion measurements in S-100-2 are displayed. In Figure 5.2A the desorptioncurves corresponding to the Ft-plot for n-heptane is plotted. S-100-2 is the sample withthe fastest desorption and most likely in an equilibrium limitation2. For most samplesthe short-time region was generally equilibrium controlled, but even for S-100-2 thelong time region shows diverging curves and is thus being kinetically controlled. Theeffective diffusion time constants (Deff/R
2) were in a small error range the same for allflow rates investigated in this work confirming the kinetically controlled regime. In Figure5.2B the effect of varying sorbate concentration is shown. The slope of the long timeregion is the same for both measurements, thus indicating that the system is being underlinear conditions. The experimental and long-time fittings for the selected samples of ofthe SBA-16 series are presented in Figure 5.3. It was impossible to fit the short- andlong-time region simultaneously very likely because of particle size and shape distributioneffects of the sample powders.
Just like the structural properties reported in the previous chapter, the diffusionresults of the different hydrocarbons are strongly varying as a function of the synthesistemperature and time confirming a close relationship of micro- and mesostructure anddiffusivity. A remarkable increase in effective diffusivity is observed as a function ofincreasing synthesis time and temperature caused by a successive enlargement of theporous structure as described in the previous chapter. For all samples except S-45-1,
2Only under assumption of the same Henry constant for all samples
43
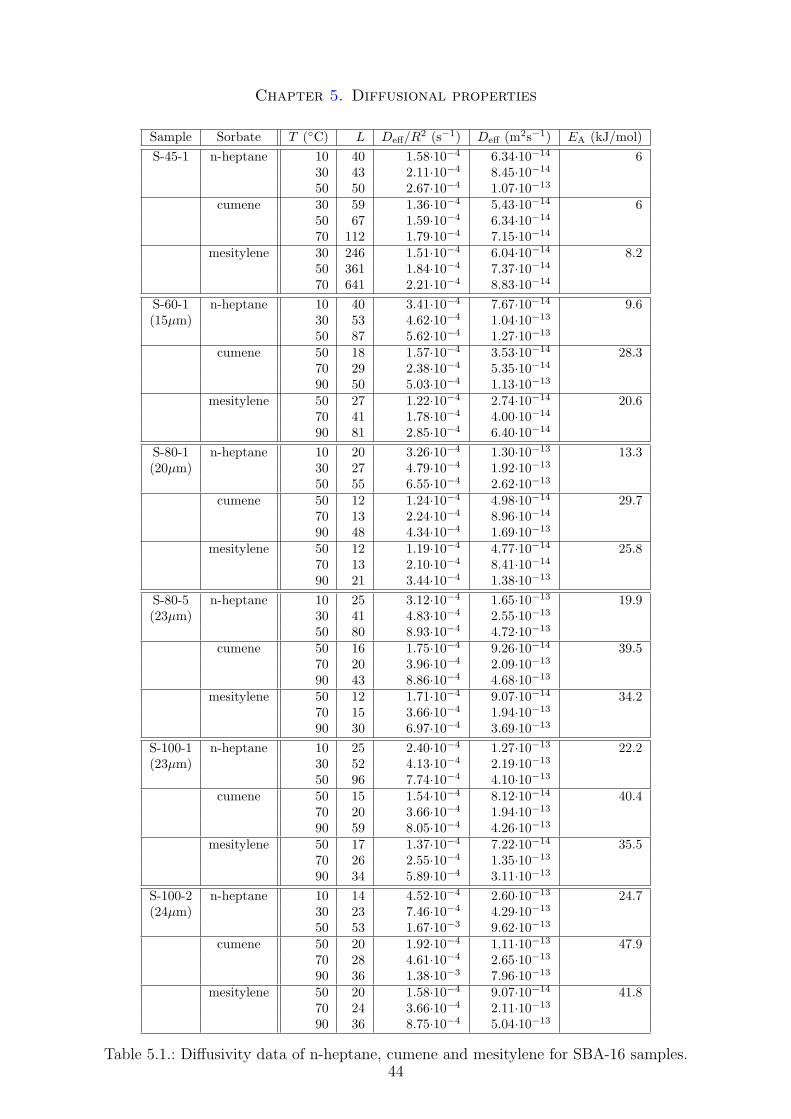
Chapter 5. Diffusional properties
Sample Sorbate T (◦C) L Deff/R2 (s−1) Deff (m2s−1) EA (kJ/mol)S-45-1 n-heptane 10 40 1.58·10−4 6.34·10−14 6
30 43 2.11·10−4 8.45·10−14
50 50 2.67·10−4 1.07·10−13
cumene 30 59 1.36·10−4 5.43·10−14 650 67 1.59·10−4 6.34·10−14
70 112 1.79·10−4 7.15·10−14
mesitylene 30 246 1.51·10−4 6.04·10−14 8.250 361 1.84·10−4 7.37·10−14
70 641 2.21·10−4 8.83·10−14
S-60-1 n-heptane 10 40 3.41·10−4 7.67·10−14 9.6(15µm) 30 53 4.62·10−4 1.04·10−13
50 87 5.62·10−4 1.27·10−13
cumene 50 18 1.57·10−4 3.53·10−14 28.370 29 2.38·10−4 5.35·10−14
90 50 5.03·10−4 1.13·10−13
mesitylene 50 27 1.22·10−4 2.74·10−14 20.670 41 1.78·10−4 4.00·10−14
90 81 2.85·10−4 6.40·10−14
S-80-1 n-heptane 10 20 3.26·10−4 1.30·10−13 13.3(20µm) 30 27 4.79·10−4 1.92·10−13
50 55 6.55·10−4 2.62·10−13
cumene 50 12 1.24·10−4 4.98·10−14 29.770 13 2.24·10−4 8.96·10−14
90 48 4.34·10−4 1.69·10−13
mesitylene 50 12 1.19·10−4 4.77·10−14 25.870 13 2.10·10−4 8.41·10−14
90 21 3.44·10−4 1.38·10−13
S-80-5 n-heptane 10 25 3.12·10−4 1.65·10−13 19.9(23µm) 30 41 4.83·10−4 2.55·10−13
50 80 8.93·10−4 4.72·10−13
cumene 50 16 1.75·10−4 9.26·10−14 39.570 20 3.96·10−4 2.09·10−13
90 43 8.86·10−4 4.68·10−13
mesitylene 50 12 1.71·10−4 9.07·10−14 34.270 15 3.66·10−4 1.94·10−13
90 30 6.97·10−4 3.69·10−13
S-100-1 n-heptane 10 25 2.40·10−4 1.27·10−13 22.2(23µm) 30 52 4.13·10−4 2.19·10−13
50 96 7.74·10−4 4.10·10−13
cumene 50 15 1.54·10−4 8.12·10−14 40.470 20 3.66·10−4 1.94·10−13
90 59 8.05·10−4 4.26·10−13
mesitylene 50 17 1.37·10−4 7.22·10−14 35.570 26 2.55·10−4 1.35·10−13
90 34 5.89·10−4 3.11·10−13
S-100-2 n-heptane 10 14 4.52·10−4 2.60·10−13 24.7(24µm) 30 23 7.46·10−4 4.29·10−13
50 53 1.67·10−3 9.62·10−13
cumene 50 20 1.92·10−4 1.11·10−13 47.970 28 4.61·10−4 2.65·10−13
90 36 1.38·10−3 7.96·10−13
mesitylene 50 20 1.58·10−4 9.07·10−14 41.870 24 3.66·10−4 2.11·10−13
90 36 8.75·10−4 5.04·10−13
Table 5.1.: Diffusivity data of n-heptane, cumene and mesitylene for SBA-16 samples.44
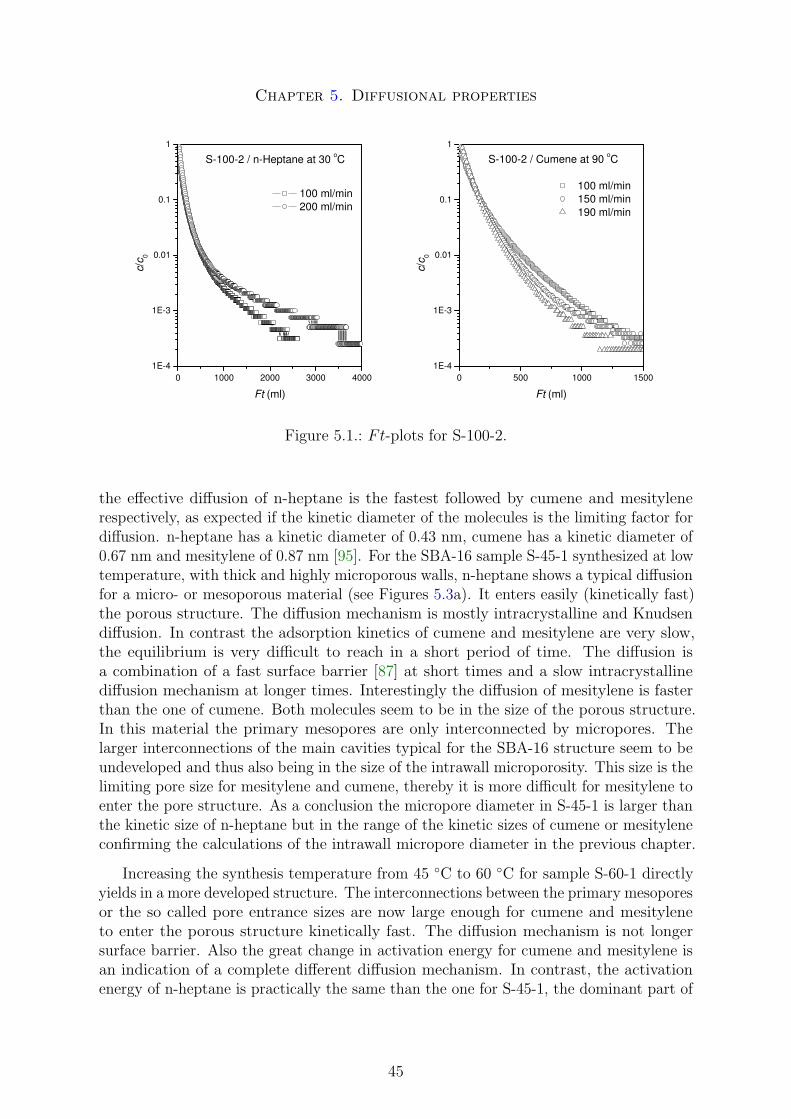
Chapter 5. Diffusional properties
0 1000 2000 3000 40001E-4
1E-3
0.01
0.1
1
100 ml/min 200 ml/min
S-100-2 / n-Heptane at 30 oC
c/c 0
Ft (ml)
0 500 1000 15001E-4
1E-3
0.01
0.1
1
100 ml/min 150 ml/min 190 ml/min
S-100-2 / Cumene at 90 oC
c/c 0
Ft (ml)
Figure 5.1.: Ft-plots for S-100-2.
the effective diffusion of n-heptane is the fastest followed by cumene and mesitylenerespectively, as expected if the kinetic diameter of the molecules is the limiting factor fordiffusion. n-heptane has a kinetic diameter of 0.43 nm, cumene has a kinetic diameter of0.67 nm and mesitylene of 0.87 nm [95]. For the SBA-16 sample S-45-1 synthesized at lowtemperature, with thick and highly microporous walls, n-heptane shows a typical diffusionfor a micro- or mesoporous material (see Figures 5.3a). It enters easily (kinetically fast)the porous structure. The diffusion mechanism is mostly intracrystalline and Knudsendiffusion. In contrast the adsorption kinetics of cumene and mesitylene are very slow,the equilibrium is very difficult to reach in a short period of time. The diffusion isa combination of a fast surface barrier [87] at short times and a slow intracrystallinediffusion mechanism at longer times. Interestingly the diffusion of mesitylene is fasterthan the one of cumene. Both molecules seem to be in the size of the porous structure.In this material the primary mesopores are only interconnected by micropores. Thelarger interconnections of the main cavities typical for the SBA-16 structure seem to beundeveloped and thus also being in the size of the intrawall microporosity. This size is thelimiting pore size for mesitylene and cumene, thereby it is more difficult for mesitylene toenter the pore structure. As a conclusion the micropore diameter in S-45-1 is larger thanthe kinetic size of n-heptane but in the range of the kinetic sizes of cumene or mesityleneconfirming the calculations of the intrawall micropore diameter in the previous chapter.
Increasing the synthesis temperature from 45 ◦C to 60 ◦C for sample S-60-1 directlyyields in a more developed structure. The interconnections between the primary mesoporesor the so called pore entrance sizes are now large enough for cumene and mesityleneto enter the porous structure kinetically fast. The diffusion mechanism is not longersurface barrier. Also the great change in activation energy for cumene and mesitylene isan indication of a complete different diffusion mechanism. In contrast, the activationenergy of n-heptane is practically the same than the one for S-45-1, the dominant part of
45
Chapter 5. Diffusional properties
0 200 400 600 800 1000 1200 1400
1E-3
0.01
0.1
1S-100-2 / n-Heptane at 30 oC
100 ml/min 200 ml/min
c / c
0
Time (s)
0 200 400 600 800 1000 1200
0.01
0.1
1
c0
2 c0
c / c
0
Time (s)
S-80-1 / Cumene at 70 °C
Figure 5.2.: Experimental ZLC curves at varying flow rate (A) and varying sorbateconcentration (B).
diffusion still takes place in the micropores. Due to the change in activation energy itmight be that the dominant part of diffusion of cumene and mesitylene now takes placethrough the open pore structure and not through the intrawall micropores. Therebythe change in activation energy is less pronounced for mesitylene (see Figure 5.5), thussome microporous limitations are still occurring. However the easiest way to pass fromone mesopore to another are for both molecules the larger interconnections betweenthe primary mesopores. It is obvious that each time a molecule passes a mesopore it isattracted by the pore wall and is thus sliding on the microporous walls from one cavity toanother. The diffusion mechanism could be dominated by a surface or so called slip-typediffusion [96, 97]. This type of diffusion is strongly temperature dependent and thuscould explain the high activations energies observed for all hydrocarbons for the samplessynthesized at 80 ◦C to 100 ◦C.
For these samples the effective diffusion increases in a linear way as a function of themesoporosity as plotted in Figure 5.4. The activation energy is also increasing linear asa function of the mesoporosity (Figure 5.5). This suggests the same diffusion mechanismfor all these samples. In the SBA-15 series [25, 98] the activation energy decreased as afunction of the mesoporosity as expected if Knudsen and intracrystalline diffusion are thedominating mechanisms. However, this phenomenon can not be explained by a simplediffusion mechanism, it has to be related to the structure of SBA-16 materials which canbe represented by a triply periodic minimal surface of I-WP (body centered, wrappedpackage) as stated in the previous chapter. Also the pore blocking and pore networkeffects which are directly related to the I-WP structure have to be taken into consideration.Assuming a surface diffusion as dominant diffusion mechanism in such a specific structure,it is obvious that in a material with large mesopore diameters like S-100-2 of about 13.3nm and still relatively small pore entrance sizes of under 4 nm (probably around 2-3
46
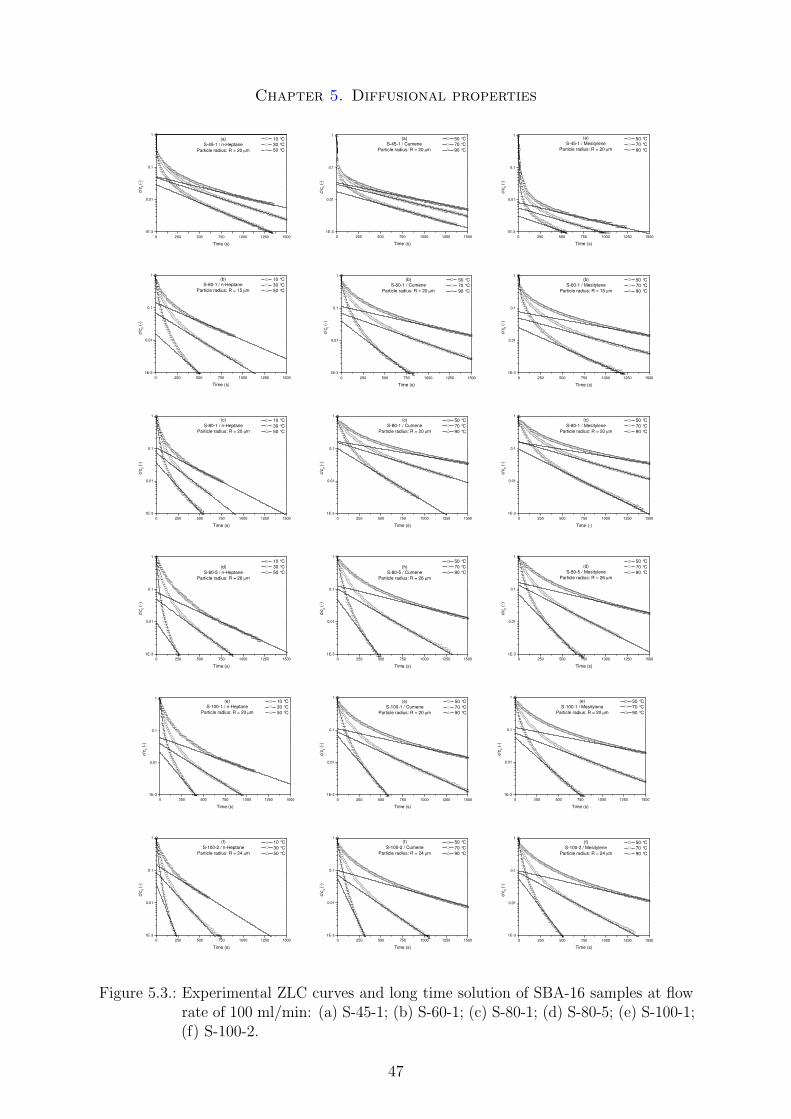
Chapter 5. Diffusional properties
0 250 500 750 1000 1250 15001E-3
0.01
0.1
1 10 °C 30 °C 50 °C
c/c 0
(-)
Time (s)
(a)S-45-1 / n-Heptane
Particle radius: R = 20 µm
0 250 500 750 1000 1250 15001E-3
0.01
0.1
1
c/c 0 (-
)
Time (s)
50 °C 70 °C 90 °C
(a)S-45-1 / Cumene
Particle radius: R = 20 µm
0 250 500 750 1000 1250 15001E-3
0.01
0.1
1 (a)S-45-1 / Mesitylene
Particle radius: R = 20 µm
c/c 0 (-
)
Time (s)
50 °C 70 °C 90 °C
0 250 500 750 1000 1250 15001E-3
0.01
0.1
1
c/c 0 (-
)
Time (s)
10 °C 30 °C 50 °C
(b)S-60-1 / n-Heptane
Particle radius: R = 15 µm
0 250 500 750 1000 1250 15001E-3
0.01
0.1
1
c/c 0 (-
)
Time (s)
50 °C 70 °C 90 °C
(b)S-60-1 / Cumene
Particle radius: R = 20 µm
0 250 500 750 1000 1250 15001E-3
0.01
0.1
1
c/c 0 (-
)
Time (s)
50 °C 70 °C 90 °C
(b)S-60-1 / Mesitylene
Particle radius: R = 15 µm
0 250 500 750 1000 1250 15001E-3
0.01
0.1
1
c/c 0 (-
)
Time (s)
10 °C 30 °C 50 °C
(c)S-80-1 / n-Heptane
Particle radius: R = 20 µm
0 250 500 750 1000 1250 15001E-3
0.01
0.1
1
c/c 0 (-
)
Time (s)
50 °C 70 °C 90 °C
(c)S-80-1 / Cumene
Particle radius: R = 20 µm
0 250 500 750 1000 1250 15001E-3
0.01
0.1
1
c/c 0 (-
)
Time (-)
50 °C 70 °C 90 °C
(c)S-80-1 / Mesitylene
Particle radius: R = 20 µm
0 250 500 750 1000 1250 15001E-3
0.01
0.1
1
c/c 0 (-
)
Time (s)
10 °C 30 °C 50 °C
(d)S-80-5 / n-Heptane
Particle radius: R = 26 µm
0 250 500 750 1000 1250 15001E-3
0.01
0.1
1
c/c 0 (-
)
Time (s)
50 °C 70 °C 90 °C
(h)S-80-5 / Cumene
Particle radius: R = 26 µm
0 250 500 750 1000 1250 15001E-3
0.01
0.1
1
c/c 0 (-
)
Time (s)
50 °C 70 °C 90 °C
(d)S-80-5 / Mesitylene
Particle radius: R = 26 µm
0 250 500 750 1000 1250 15001E-3
0.01
0.1
1
c/c 0 (-
)
Time (s)
10 °C 30 °C 50 °C
(e)S-100-1 / n-Heptane
Particle radius: R = 20 µm
0 250 500 750 1000 1250 15001E-3
0.01
0.1
1 50 °C 70 °C 90 °C
c/c 0 (-
)
Time (s)
(e)S-100-1 / Cumene
Particle radius: R = 20 µm
0 250 500 750 1000 1250 15001E-3
0.01
0.1
1 50 °C 70 °C 90 °C
c/c 0 (-
)
Time (s)
(e)S-100-1 / Mesitylene
Particle radius: R = 20 µm
0 250 500 750 1000 1250 15001E-3
0.01
0.1
1 10 °C 30 °C 50 °C
c/c 0 (-
)
Time (s)
(f)S-100-2 / n-Heptane
Particle radius: R = 24 µm
0 250 500 750 1000 1250 15001E-3
0.01
0.1
1 50 °C 70 °C 90 °C
c/c 0 (-
)
Time (s)
(f)S-100-2 / Cumene
Particle radius: R = 24 µm
0 250 500 750 1000 1250 15001E-3
0.01
0.1
1 50 °C 70 °C 90 °C
c/c 0 (-
)
Time (s)
(f)S-100-2 / Mesitylene
Particle radius: R = 24 µm
Figure 5.3.: Experimental ZLC curves and long time solution of SBA-16 samples at flowrate of 100 ml/min: (a) S-45-1; (b) S-60-1; (c) S-80-1; (d) S-80-5; (e) S-100-1;(f) S-100-2.
47
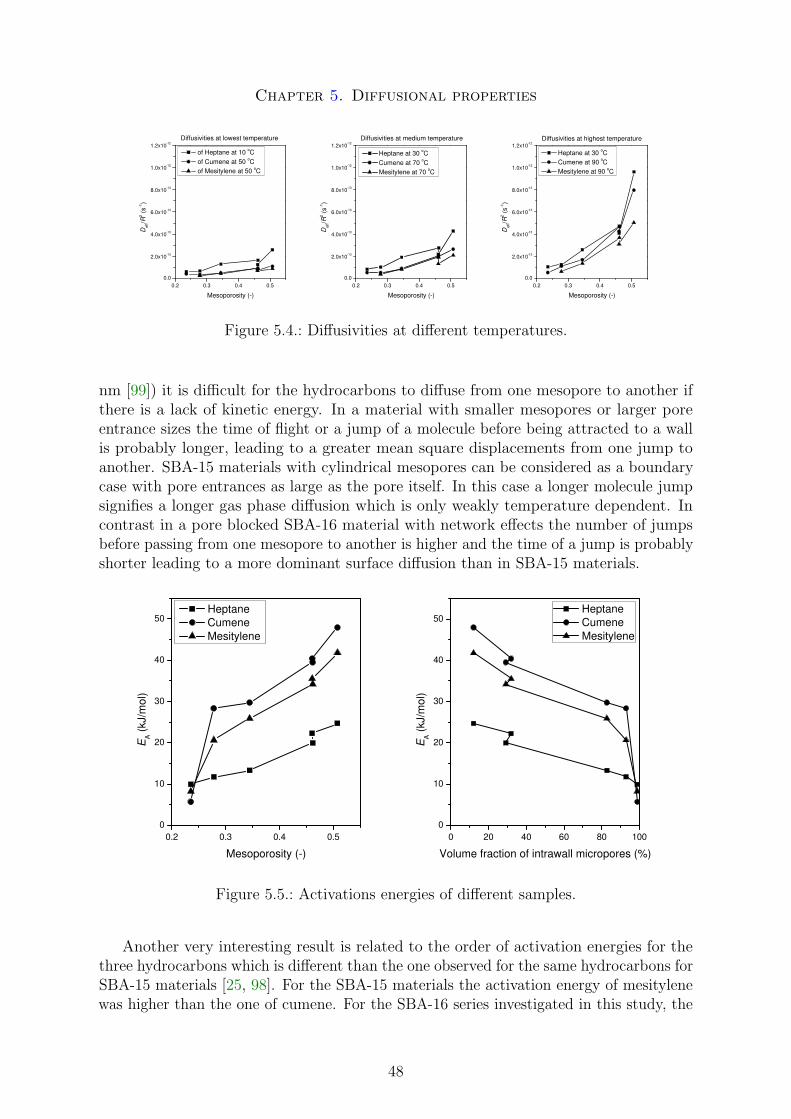
Chapter 5. Diffusional properties
0.2 0.3 0.4 0.50.0
2.0x10⁻¹³
4.0x10⁻¹³
6.0x10⁻¹³
8.0x10⁻¹³
1.0x10⁻¹²
1.2x10⁻¹²Diffusivities at lowest temperature
Def
f/R2 (s
-1)
Mesoporosity (-)
of Heptane at 10 oC of Cumene at 50 oC of Mesitylene at 50 oC
0.2 0.3 0.4 0.50.0
2.0x10⁻¹³
4.0x10⁻¹³
6.0x10⁻¹³
8.0x10⁻¹³
1.0x10⁻¹²
1.2x10⁻¹²Diffusivities at medium temperature
Def
f/R2 (s
-1)
Mesoporosity (-)
Heptane at 30 oC Cumene at 70 oC Mesitylene at 70 oC
0.2 0.3 0.4 0.50.0
2.0x10⁻¹³
4.0x10⁻¹³
6.0x10⁻¹³
8.0x10⁻¹³
1.0x10⁻¹²
1.2x10⁻¹²Diffusivities at highest temperature
Def
f/R2 (s
-1)
Mesoporosity (-)
Heptane at 30 oC Cumene at 90 oC Mesitylene at 90 oC
Figure 5.4.: Diffusivities at different temperatures.
nm [99]) it is difficult for the hydrocarbons to diffuse from one mesopore to another ifthere is a lack of kinetic energy. In a material with smaller mesopores or larger poreentrance sizes the time of flight or a jump of a molecule before being attracted to a wallis probably longer, leading to a greater mean square displacements from one jump toanother. SBA-15 materials with cylindrical mesopores can be considered as a boundarycase with pore entrances as large as the pore itself. In this case a longer molecule jumpsignifies a longer gas phase diffusion which is only weakly temperature dependent. Incontrast in a pore blocked SBA-16 material with network effects the number of jumpsbefore passing from one mesopore to another is higher and the time of a jump is probablyshorter leading to a more dominant surface diffusion than in SBA-15 materials.
0.2 0.3 0.4 0.50
10
20
30
40
50
EA (k
J/m
ol)
Mesoporosity (-)
Heptane Cumene Mesitylene
0 20 40 60 80 1000
10
20
30
40
50
EA (k
J/m
ol)
Volume fraction of intrawall micropores (%)
Heptane Cumene Mesitylene
Figure 5.5.: Activations energies of different samples.
Another very interesting result is related to the order of activation energies for thethree hydrocarbons which is different than the one observed for the same hydrocarbons forSBA-15 materials [25, 98]. For the SBA-15 materials the activation energy of mesitylenewas higher than the one of cumene. For the SBA-16 series investigated in this study, the
48
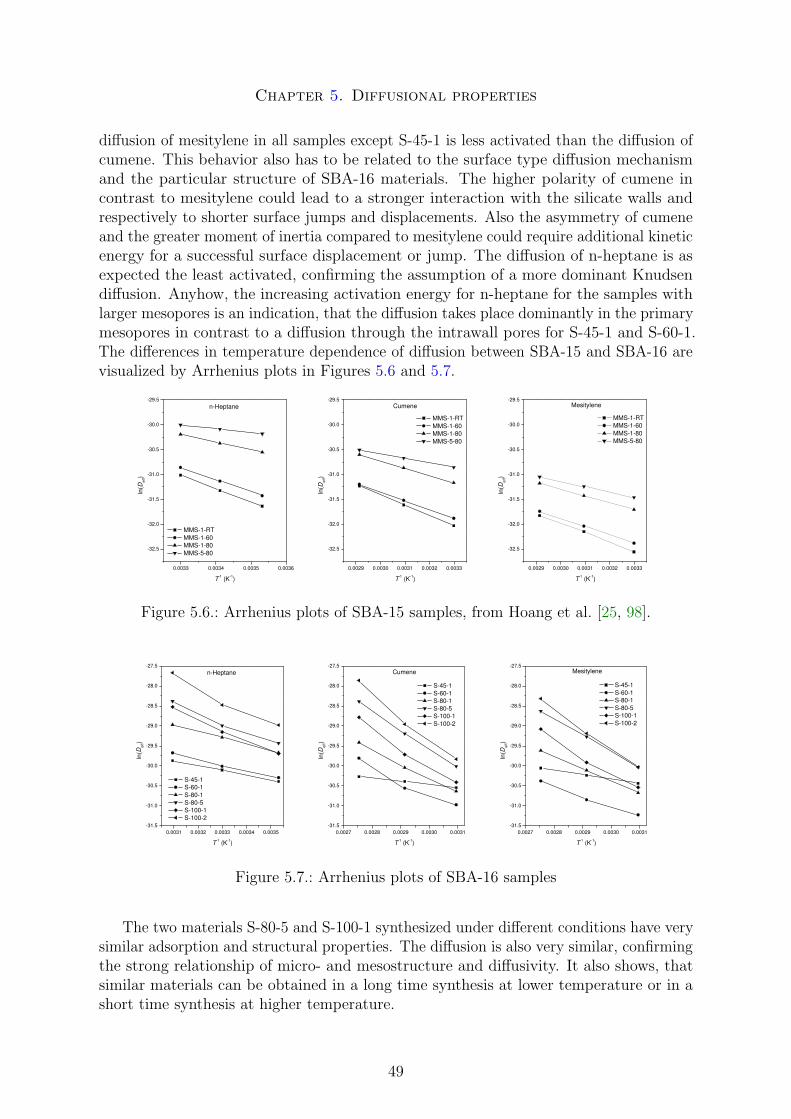
Chapter 5. Diffusional properties
diffusion of mesitylene in all samples except S-45-1 is less activated than the diffusion ofcumene. This behavior also has to be related to the surface type diffusion mechanismand the particular structure of SBA-16 materials. The higher polarity of cumene incontrast to mesitylene could lead to a stronger interaction with the silicate walls andrespectively to shorter surface jumps and displacements. Also the asymmetry of cumeneand the greater moment of inertia compared to mesitylene could require additional kineticenergy for a successful surface displacement or jump. The diffusion of n-heptane is asexpected the least activated, confirming the assumption of a more dominant Knudsendiffusion. Anyhow, the increasing activation energy for n-heptane for the samples withlarger mesopores is an indication, that the diffusion takes place dominantly in the primarymesopores in contrast to a diffusion through the intrawall pores for S-45-1 and S-60-1.The differences in temperature dependence of diffusion between SBA-15 and SBA-16 arevisualized by Arrhenius plots in Figures 5.6 and 5.7.
0.0033 0.0034 0.0035 0.0036
-32.5
-32.0
-31.5
-31.0
-30.5
-30.0
-29.5
MMS-1-RTMMS-1-60MMS-1-80MMS-5-80
ln(D
eff)
T-1 (K-1)
n-Heptane
0.0029 0.0030 0.0031 0.0032 0.0033
-32.5
-32.0
-31.5
-31.0
-30.5
-30.0
-29.5
MMS-1-RTMMS-1-60MMS-1-80MMS-5-80
ln(D
eff)
T-1 (K-1)
Cumene
0.0029 0.0030 0.0031 0.0032 0.0033
-32.5
-32.0
-31.5
-31.0
-30.5
-30.0
-29.5
MMS-1-RTMMS-1-60MMS-1-80MMS-5-80
ln(D
eff)
T-1 (K-1)
Mesitylene
Figure 5.6.: Arrhenius plots of SBA-15 samples, from Hoang et al. [25, 98].
0.0031 0.0032 0.0033 0.0034 0.0035-31.5
-31.0
-30.5
-30.0
-29.5
-29.0
-28.5
-28.0
-27.5
S-45-1 S-60-1 S-80-1 S-80-5 S-100-1 S-100-2
ln(D
eff)
T-1 (K-1)
n-Heptane
0.0027 0.0028 0.0029 0.0030 0.0031-31.5
-31.0
-30.5
-30.0
-29.5
-29.0
-28.5
-28.0
-27.5
S-45-1 S-60-1 S-80-1 S-80-5 S-100-1 S-100-2
ln(D
eff)
T-1 (K-1)
Cumene
0.0027 0.0028 0.0029 0.0030 0.0031-31.5
-31.0
-30.5
-30.0
-29.5
-29.0
-28.5
-28.0
-27.5
S-45-1 S-60-1 S-80-1 S-80-5 S-100-1 S-100-2
ln(D
eff)
T-1 (K-1)
Mesitylene
Figure 5.7.: Arrhenius plots of SBA-16 samples
The two materials S-80-5 and S-100-1 synthesized under different conditions have verysimilar adsorption and structural properties. The diffusion is also very similar, confirmingthe strong relationship of micro- and mesostructure and diffusivity. It also shows, thatsimilar materials can be obtained in a long time synthesis at lower temperature or in ashort time synthesis at higher temperature.
49
Chapter 5. Diffusional properties
To compare the effective diffusion results with other studies the particle sizes of theSBA-16 samples have to be obtained. As stated before only the biggest particles arerelevant for the long-time analysis. The obtained sizes and the effective diffusion areshown in Table 5.1. The effective diffusion is for all samples faster than the one in SBA-15materials. This can be certainly related to the 3-D pore structure of SBA-16 in contrastto the only 1-D mesopore diffusion and the more inhibited 3-D intrawall diffusion ofSBA-15.
5.4. Conclusions
The diffusion properties of probe molecules, i.e. n-heptane, cumene and mesitylene inSBA-16 materials with a 3-D cubic mesoporous structure were investigated using the ZLCtechnique. The strong relationship of micro- and mesostructure and diffusivity alreadyobserved for SBA-15 materials could be confirmed. For a complete description of thediffusional properties micro- and mesoporous limitations have to be taken into account.As a result of the 3-D mesoporous structure the effective diffusivities are very high incontrast to the diffusion in SBA-15 or microporous zeolites. The diffusivities are highlytemperature dependent leading to activation energies nearly as high as in microporousmaterials. However the high activation energies are not related to microporous limitations.The particular structure, which consists in a pore blocked structure with network effects,in combination with a highly temperature dependent surface diffusion mechanism leadsto such a temperature dependency. This result is very important for the use of SBA-16as a catalyst. Only at higher temperatures the SBA-16 materials will present a highactivity. The systematically highest activation energy for cumene observed in this studycan also be related to the particular SBA-16 structure and to the diffusion mechanism.This will be further investigated by analyzing the adsorption properties of SBA-16 in thenext chapter.
50
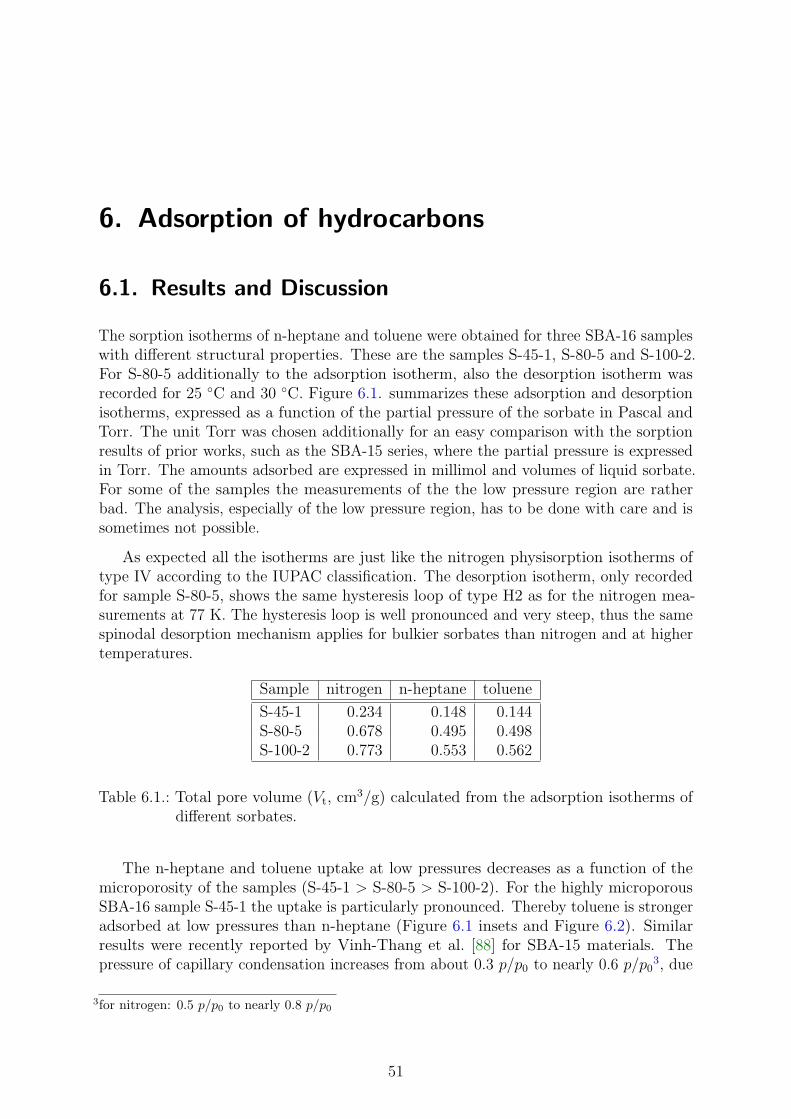
6. Adsorption of hydrocarbons
6.1. Results and Discussion
The sorption isotherms of n-heptane and toluene were obtained for three SBA-16 sampleswith different structural properties. These are the samples S-45-1, S-80-5 and S-100-2.For S-80-5 additionally to the adsorption isotherm, also the desorption isotherm wasrecorded for 25 ◦C and 30 ◦C. Figure 6.1. summarizes these adsorption and desorptionisotherms, expressed as a function of the partial pressure of the sorbate in Pascal andTorr. The unit Torr was chosen additionally for an easy comparison with the sorptionresults of prior works, such as the SBA-15 series, where the partial pressure is expressedin Torr. The amounts adsorbed are expressed in millimol and volumes of liquid sorbate.For some of the samples the measurements of the the low pressure region are ratherbad. The analysis, especially of the low pressure region, has to be done with care and issometimes not possible.
As expected all the isotherms are just like the nitrogen physisorption isotherms oftype IV according to the IUPAC classification. The desorption isotherm, only recordedfor sample S-80-5, shows the same hysteresis loop of type H2 as for the nitrogen mea-surements at 77 K. The hysteresis loop is well pronounced and very steep, thus the samespinodal desorption mechanism applies for bulkier sorbates than nitrogen and at highertemperatures.
Sample nitrogen n-heptane toluene
S-45-1 0.234 0.148 0.144S-80-5 0.678 0.495 0.498S-100-2 0.773 0.553 0.562
Table 6.1.: Total pore volume (Vt, cm3/g) calculated from the adsorption isotherms ofdifferent sorbates.
The n-heptane and toluene uptake at low pressures decreases as a function of themicroporosity of the samples (S-45-1 > S-80-5 > S-100-2). For the highly microporousSBA-16 sample S-45-1 the uptake is particularly pronounced. Thereby toluene is strongeradsorbed at low pressures than n-heptane (Figure 6.1 insets and Figure 6.2). Similarresults were recently reported by Vinh-Thang et al. [88] for SBA-15 materials. Thepressure of capillary condensation increases from about 0.3 p/p0 to nearly 0.6 p/p0
3, due
3for nitrogen: 0.5 p/p0 to nearly 0.8 p/p0
51
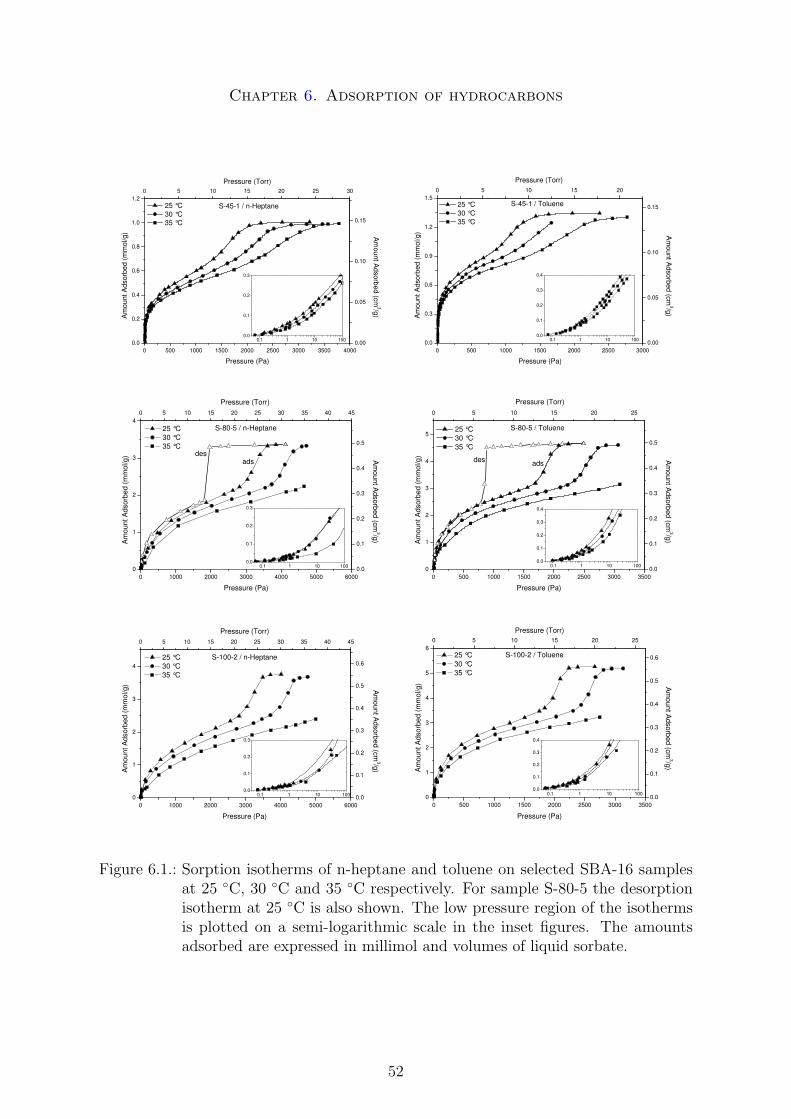
Chapter 6. Adsorption of hydrocarbons
0 500 1000 1500 2000 2500 3000 3500 40000.0
0.2
0.4
0.6
0.8
1.0
1.2
0.1 1 10 1000.0
0.1
0.2
0.3
0 5 10 15 20 25 30
0.00
0.05
0.10
0.15
25 °C 30 °C 35 °C
Am
ount
Ads
orbe
d (m
mol
/g)
Pressure (Pa)
S-45-1 / n-Heptane
Pressure (Torr)
Am
ount Adsorbed (cm
3/g)
0.1 1 10 1000.0
0.1
0.2
0.3
0.4
0 5 10 15 20
0.00
0.05
0.10
0.15
0 500 1000 1500 2000 2500 30000.0
0.3
0.6
0.9
1.2
1.5
Pressure (Torr)
25 °C 30 °C 35 °C
Am
ount
Ads
orbe
d (m
mol
/g)
Pressure (Pa)
S-45-1 / Toluene
Am
ount Adsorbed (cm
3/g)
0.1 1 10 1000.0
0.1
0.2
0.3
0 5 10 15 20 25 30 35 40 45
0.0
0.1
0.2
0.3
0.4
0.5
0 1000 2000 3000 4000 5000 60000
1
2
3
4 A
mount A
dsorbed (cm3/g)
Pressure (Torr)
25 °C 30 °C 35 °C
Am
ount
Ads
orbe
d (m
mol
/g)
Pressure (Pa)
S-80-5 / n-Heptane
desads
0.1 1 10 1000.0
0.1
0.2
0.3
0.4
0 5 10 15 20 25
0.0
0.1
0.2
0.3
0.4
0.5
0 500 1000 1500 2000 2500 3000 35000
1
2
3
4
5
ads
Pressure (Torr)
25 °C 30 °C 35 °C
Am
ount
Ads
orbe
d (m
mol
/g)
Pressure (Pa)
S-80-5 / Toluene
des Am
ount Adsorbed (cm
3/g)
0.1 1 10 1000.0
0.1
0.2
0.3
0 5 10 15 20 25 30 35 40 45
0.0
0.1
0.2
0.3
0.4
0.5
0.6
0 1000 2000 3000 4000 5000 60000
1
2
3
4 25 °C 30 °C 35 °C
Pressure (Torr)
Am
ount
Ads
orbe
d (m
mol
/g)
Pressure (Pa)
S-100-2 / n-Heptane
Am
ount Adsorbed (cm
3/g)
0.1 1 10 1000.0
0.1
0.2
0.3
0.4
0 5 10 15 20 25
0.0
0.1
0.2
0.3
0.4
0.5
0.6
0 500 1000 1500 2000 2500 3000 35000
1
2
3
4
5
6
Pressure (Torr)
25 °C 30 °C 35 °C
Am
ount
Ads
orbe
d (m
mol
/g)
Pressure (Pa)
S-100-2 / Toluene
Am
ount Adsorbed (cm
3/g)
Figure 6.1.: Sorption isotherms of n-heptane and toluene on selected SBA-16 samplesat 25 ◦C, 30 ◦C and 35 ◦C respectively. For sample S-80-5 the desorptionisotherm at 25 ◦C is also shown. The low pressure region of the isothermsis plotted on a semi-logarithmic scale in the inset figures. The amountsadsorbed are expressed in millimol and volumes of liquid sorbate.
52
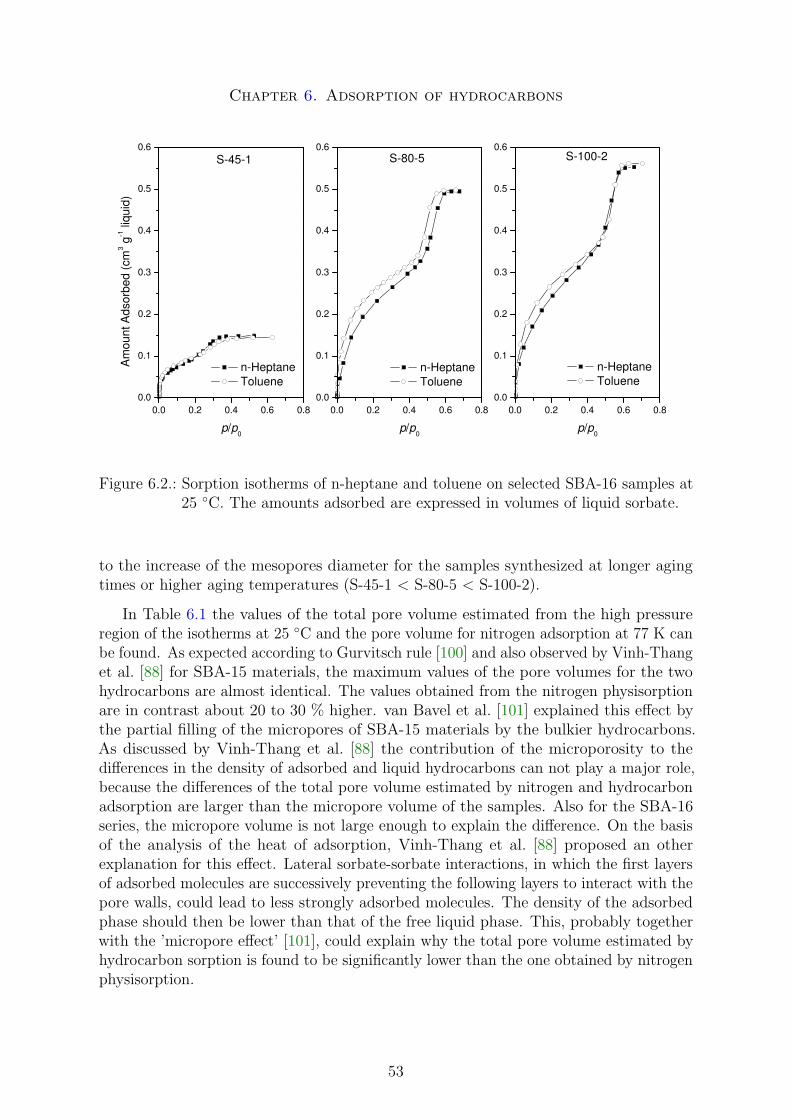
Chapter 6. Adsorption of hydrocarbons
0.0 0.2 0.4 0.6 0.80.0
0.1
0.2
0.3
0.4
0.5
0.6
Am
ount
Ads
orbe
d (c
m3 g
-1 li
quid
)
p/p0
S-45-1
0.0 0.2 0.4 0.6 0.80.0
0.1
0.2
0.3
0.4
0.5
0.6
p/p0
S-80-5
0.0 0.2 0.4 0.6 0.80.0
0.1
0.2
0.3
0.4
0.5
0.6
n-Heptane Toluene
n-Heptane Toluene
n-Heptane Toluene
p/p0
S-100-2
Figure 6.2.: Sorption isotherms of n-heptane and toluene on selected SBA-16 samples at25 ◦C. The amounts adsorbed are expressed in volumes of liquid sorbate.
to the increase of the mesopores diameter for the samples synthesized at longer agingtimes or higher aging temperatures (S-45-1 < S-80-5 < S-100-2).
In Table 6.1 the values of the total pore volume estimated from the high pressureregion of the isotherms at 25 ◦C and the pore volume for nitrogen adsorption at 77 K canbe found. As expected according to Gurvitsch rule [100] and also observed by Vinh-Thanget al. [88] for SBA-15 materials, the maximum values of the pore volumes for the twohydrocarbons are almost identical. The values obtained from the nitrogen physisorptionare in contrast about 20 to 30 % higher. van Bavel et al. [101] explained this effect bythe partial filling of the micropores of SBA-15 materials by the bulkier hydrocarbons.As discussed by Vinh-Thang et al. [88] the contribution of the microporosity to thedifferences in the density of adsorbed and liquid hydrocarbons can not play a major role,because the differences of the total pore volume estimated by nitrogen and hydrocarbonadsorption are larger than the micropore volume of the samples. Also for the SBA-16series, the micropore volume is not large enough to explain the difference. On the basisof the analysis of the heat of adsorption, Vinh-Thang et al. [88] proposed an otherexplanation for this effect. Lateral sorbate-sorbate interactions, in which the first layersof adsorbed molecules are successively preventing the following layers to interact with thepore walls, could lead to less strongly adsorbed molecules. The density of the adsorbedphase should then be lower than that of the free liquid phase. This, probably togetherwith the ’micropore effect’ [101], could explain why the total pore volume estimated byhydrocarbon sorption is found to be significantly lower than the one obtained by nitrogenphysisorption.
53
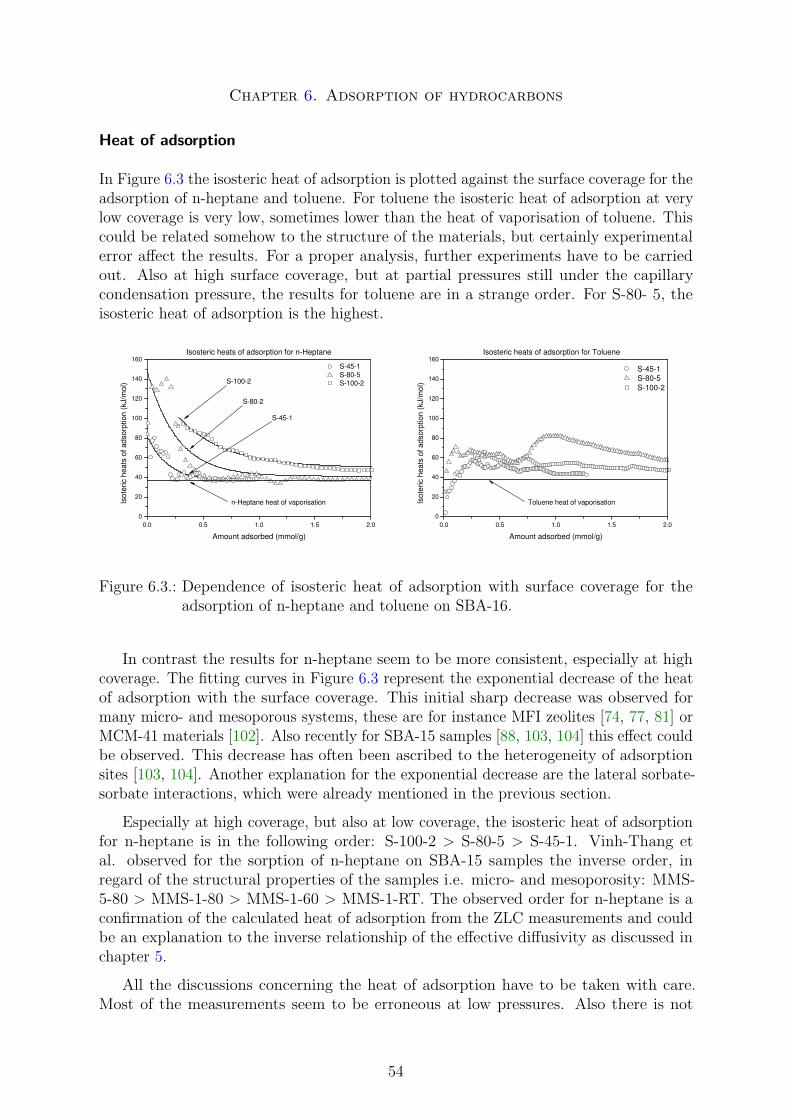
Chapter 6. Adsorption of hydrocarbons
Heat of adsorption
In Figure 6.3 the isosteric heat of adsorption is plotted against the surface coverage for theadsorption of n-heptane and toluene. For toluene the isosteric heat of adsorption at verylow coverage is very low, sometimes lower than the heat of vaporisation of toluene. Thiscould be related somehow to the structure of the materials, but certainly experimentalerror affect the results. For a proper analysis, further experiments have to be carriedout. Also at high surface coverage, but at partial pressures still under the capillarycondensation pressure, the results for toluene are in a strange order. For S-80- 5, theisosteric heat of adsorption is the highest.
0.0 0.5 1.0 1.5 2.00
20
40
60
80
100
120
140
160 S-45-1 S-80-5 S-100-2
Isot
eric
hea
ts o
f ads
orpt
ion
(kJ/
mol
)
Amount adsorbed (mmol/g)
Isosteric heats of adsorption for n-Heptane
S-100-2
S-80-2
S-45-1
n-Heptane heat of vaporisation
0.0 0.5 1.0 1.5 2.00
20
40
60
80
100
120
140
160
S-45-1 S-80-5 S-100-2
Isot
eric
hea
ts o
f ads
orpt
ion
(kJ/
mol
)
Amount adsorbed (mmol/g)
Isosteric heats of adsorption for Toluene
Toluene heat of vaporisation
Figure 6.3.: Dependence of isosteric heat of adsorption with surface coverage for theadsorption of n-heptane and toluene on SBA-16.
In contrast the results for n-heptane seem to be more consistent, especially at highcoverage. The fitting curves in Figure 6.3 represent the exponential decrease of the heatof adsorption with the surface coverage. This initial sharp decrease was observed formany micro- and mesoporous systems, these are for instance MFI zeolites [74, 77, 81] orMCM-41 materials [102]. Also recently for SBA-15 samples [88, 103, 104] this effect couldbe observed. This decrease has often been ascribed to the heterogeneity of adsorptionsites [103, 104]. Another explanation for the exponential decrease are the lateral sorbate-sorbate interactions, which were already mentioned in the previous section.
Especially at high coverage, but also at low coverage, the isosteric heat of adsorptionfor n-heptane is in the following order: S-100-2 > S-80-5 > S-45-1. Vinh-Thang etal. observed for the sorption of n-heptane on SBA-15 samples the inverse order, inregard of the structural properties of the samples i.e. micro- and mesoporosity: MMS-5-80 > MMS-1-80 > MMS-1-60 > MMS-1-RT. The observed order for n-heptane is aconfirmation of the calculated heat of adsorption from the ZLC measurements and couldbe an explanation to the inverse relationship of the effective diffusivity as discussed inchapter 5.
All the discussions concerning the heat of adsorption have to be taken with care.Most of the measurements seem to be erroneous at low pressures. Also there is not
54

Chapter 6. Adsorption of hydrocarbons
enough reliable experimental data available for an accurate or even statistical analysis.Anyhow, some interesting effects could be distinguished, which surely require furtherinvestigation in the future.
55
7. Conclusions and perspectives
For the first time, SBA-16 materials containing both micro and mesopores with amesostructure, where pore blocking and network effects play a major role, were synthesizedand characterized by diffusion and sorption experiments.
Using a new kind of synthesis route under low acid concentration and with butanolas cosurfacting agent, it was possible to obtain a high-quality SBA-16 series by variationof the time or temperature of the aging or hydrothermal treatment step. Thereby theintrawall porosity was systematically controlled in order to get materials with a highfraction of intrawall micropores and thick walls up to materials with few micropores, thinwalls and large primary mesoprores. For all materials the pore entrance size remainedunder 4 nm.
Using the ZLC method to measure the intracrystalline diffusivities of n-heptane,cumene and mesitylene, interesting effects could be observed which are certainly related tothe specific structure of SBA-16. Further investigation should be taken into considerationespecially with respect to the mesostructure of materials showing pore blocking andnetwork effects, as for instance KIT-5 materials. Also higher hydrothermal treatmenttemperatures would cause an enlargement of the pore entrances, which could have veryinteresting properties, with less pronounced pore blocking effects. Furthermore, diffusionalstudies on MCM-48 and KIT-6 materials, showing both a rather near equilibriumdesorption just like MCM-41 or SBA-15, would be very interesting. The sorptionexperiments, with are directly related to the diffusional properties, should be repeated inan in-depth analysis, to complete and to explain in a more quantitative way the observedeffects.
56
A. Derivation of model equations
A.1. Differential ZLC-Model
Derivation of the mathematical ZLC model, from Brandani et al. [74].
As stated in the experimental section the two governing equations are the fluid-phase and the solid-phase mass balance in radial coordinates, without negligence of thefluid-phase hold-up:
Vsdq
dt+ Vf
dc
dt+ F · c(t) = 0 (A.1)
∂q
∂t= D ·
(∂2q
∂r2+
2
r
∂q
∂r
)(A.2)
where q is the value of q averaged over the particle.
The initial conditions of the system are:
q(r, 0) = q0KHc0 ; c(0) = c0 (A.3)
and the boundary condition: (∂q
∂r
)r=0
= 0 (A.4)
Equation A.1 can be considered as a boundary condition on the solid-phase mass balance:
4
3πR3 dq
dt= 4πR2D
(∂q
∂r
)r=R
(A.5)
with equilibrium at the surface:
q(R, t) = KHc(t) (A.6)
The fluid-phase mass balance A.1 can then be written as:
3
RDVs
∂q
∂r+
Vf
KH
∂q
∂t+
F
KH
q
∣∣∣∣r=R
= 0 (A.7)
Introducing the change of variable (ζ = rq), equation A.2 reduces to:
∂ζ
∂t= D
∂2ζ
∂r2(A.8)
Since q(r, t) is always finite the boundary condition in equation A.4, can be rewritten as:
ζ(0, t) = 0 (A.9)
57
Chapter A. Appendix A: Derivation of model equations
Equation A.8 can be solved through separation of variables:
ζ(r, t) = Q(r) · T (t) (A.10)
QdT
dt= DT
d2Q
dr2(A.11)
or1
DT
dT
dt=
1
Q
d2Q
dr2= −λ2 (A.12)
where λ is a constant. These differential equations are seperable and give the followingsolution:
T = C exp(−λ2Dt) ; Q = A sin(λr) + B cos(λr) (A.13)
where λ must be real (ζ is always finite). Furthermore, from equation (A.9) it followsthat B must be zero. The general solution is given by:
q =a
rsin(λr) · exp(−Dλ2t) (A.14)
where a = AC.
Substituting in the fluid-phase mass balance (A.7):
3DVs
R
(λ
Rcos(λR)− 1
R2sin(λR)
)− Dλ2Vf
KHRsin(λR) +
F
KHRsin(λR) = 0 (A.15)
which give as the characteristic equation:
βn cot βn + L− 1− γβ2n = 0 (A.16)
with
L =1
3
F
KHVs
R2
D; γ =
1
3
Vf
KHVs
β = λR (A.17)
The general solution is therefore given by:
q(r, t) =∑ an
rsin
(βn
r
R
)· exp
(−β2
n
D
R2t
)(A.18)
And for the initial condition:
q(r, 0) = q0 =∑ an
rsin
(βn
r
R
)(A.19)
To evaluate an, we have to consider the following integral:∫ R
0
sin(βn
r
R
)sin
(βm
r
R
)dr (A.20)
After integrating twice by parts and taking into account equation (A.16) and (A.19) weget for an (see Brandani et al. [74]):
an =
∫ R
0rq0 sin (βnr/R) dr + γR2q0 sin βn∫ R
0sin2 (βnr/R) dr + γR sin2 βn
(A.21)
58
Chapter A. Appendix A: Derivation of model equations
taking into account equation A.16:
an
q0
=2R
sin βn
· L
β2n + (1− L + γβ2
n)2 + L− 1 + γβ2n
(A.22)
The solution of the problem is therefore given by:
q(r, t)
q0
=R
r
∑ 2L
β2n + (1− L + γβ2
n)2 + L− 1 + γβ2n
· sin (βnr/R)
sin βn
· exp
(−β2
n
D
R2t
)(A.23)
for r = R and under assumption of linearity of the system1, we get the desorption curve:
c(t)
c0
=∑ 2L
β2n + (1− L + γβ2
n)2 + L− 1 + γβ2n
· exp
(−β2
n
D
R2t
)(A.24)
where βn are the possitive roots of equation A.16. Under negligence of the fluid-phasehold-up (γ = 0), the solution reduces to:
c(t)
c0
=∑ 2L
β2n + L(L− 1)
· exp
(−β2
n
D
R2t
)(A.25)
which is the final form of the ZLC model used in this thesis (see equation (3.22)).
1The adsorbed-phase concentration q can be described as a linear function of the fluid-phase concentrationc.
59
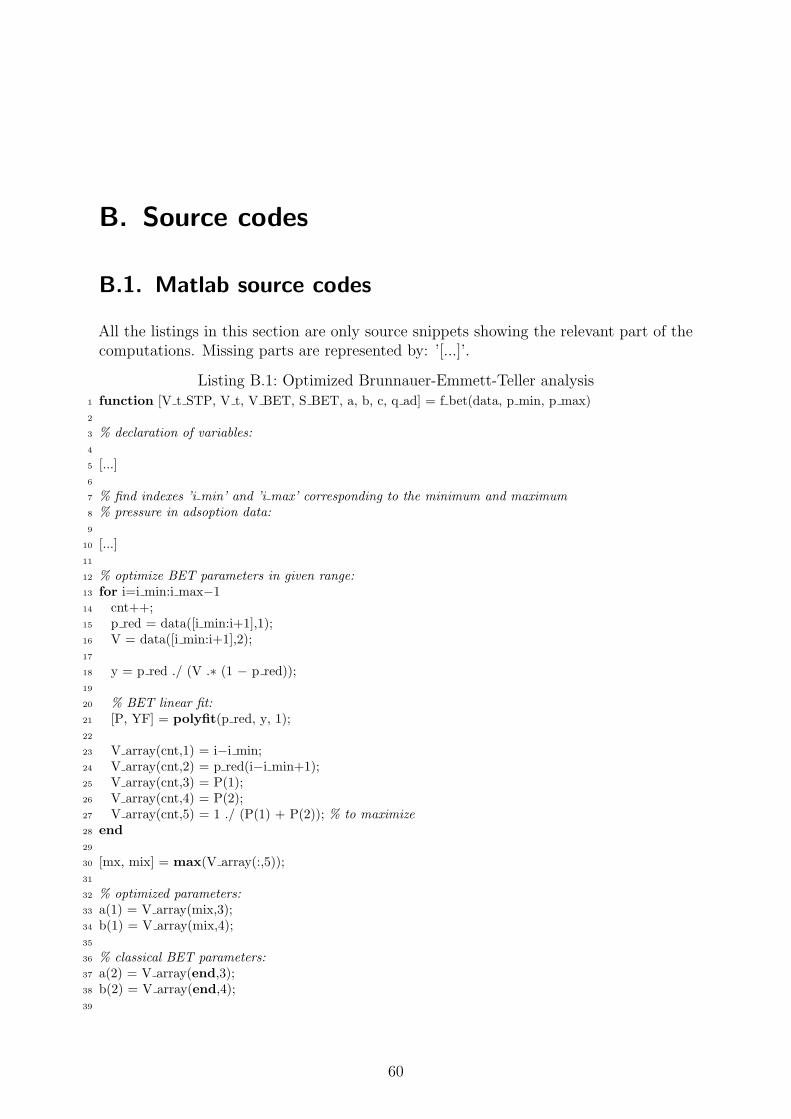
B. Source codes
B.1. Matlab source codes
All the listings in this section are only source snippets showing the relevant part of thecomputations. Missing parts are represented by: ’[...]’.
Listing B.1: Optimized Brunnauer-Emmett-Teller analysis1 function [V t STP, V t, V BET, S BET, a, b, c, q ad] = f bet(data, p min, p max)2
3 % declaration of variables:4
5 [...]6
7 % find indexes ’i min’ and ’i max’ corresponding to the minimum and maximum8 % pressure in adsoption data:9
10 [...]11
12 % optimize BET parameters in given range:13 for i=i min:i max−114 cnt++;15 p red = data([i min:i+1],1);16 V = data([i min:i+1],2);17
18 y = p red ./ (V .∗ (1 − p red));19
20 % BET linear fit:21 [P, YF] = polyfit(p red, y, 1);22
23 V array(cnt,1) = i−i min;24 V array(cnt,2) = p red(i−i min+1);25 V array(cnt,3) = P(1);26 V array(cnt,4) = P(2);27 V array(cnt,5) = 1 ./ (P(1) + P(2)); % to maximize28 end29
30 [mx, mix] = max(V array(:,5));31
32 % optimized parameters:33 a(1) = V array(mix,3);34 b(1) = V array(mix,4);35
36 % classical BET parameters:37 a(2) = V array(end,3);38 b(2) = V array(end,4);39
60
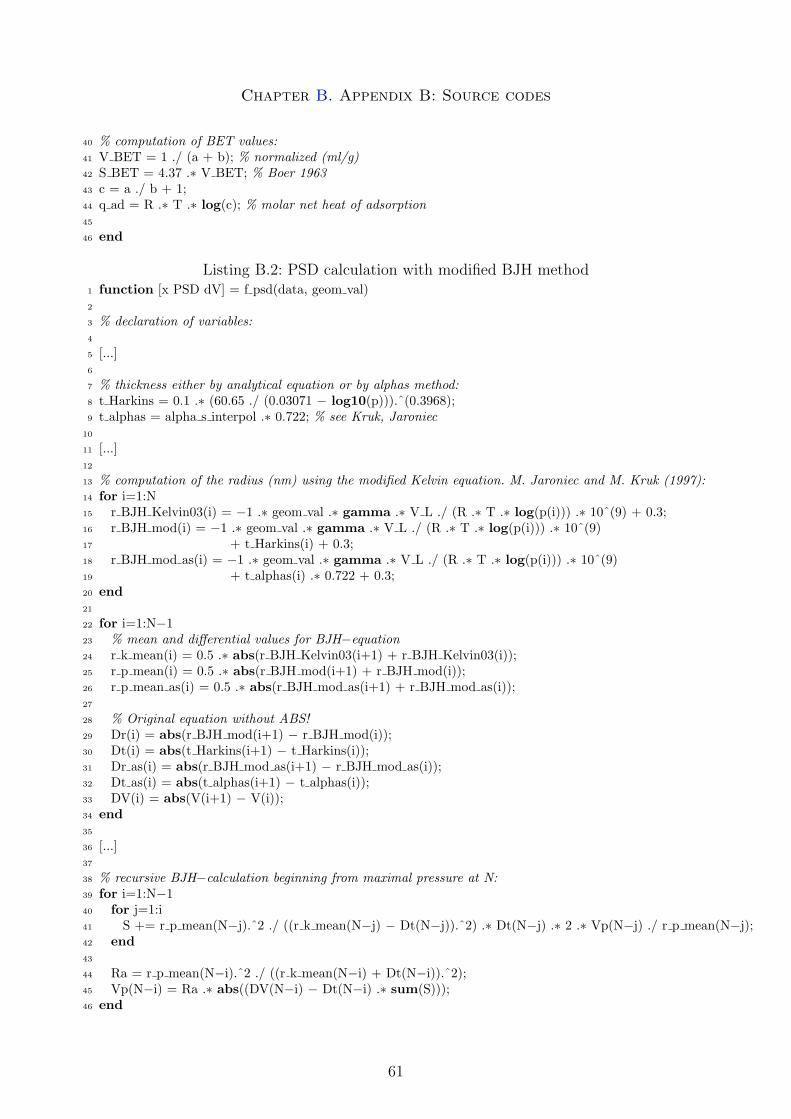
Chapter B. Appendix B: Source codes
40 % computation of BET values:41 V BET = 1 ./ (a + b); % normalized (ml/g)42 S BET = 4.37 .∗ V BET; % Boer 196343 c = a ./ b + 1;44 q ad = R .∗ T .∗ log(c); % molar net heat of adsorption45
46 end
Listing B.2: PSD calculation with modified BJH method1 function [x PSD dV] = f psd(data, geom val)2
3 % declaration of variables:4
5 [...]6
7 % thickness either by analytical equation or by alphas method:8 t Harkins = 0.1 .∗ (60.65 ./ (0.03071 − log10(p))).ˆ(0.3968);9 t alphas = alpha s interpol .∗ 0.722; % see Kruk, Jaroniec
10
11 [...]12
13 % computation of the radius (nm) using the modified Kelvin equation. M. Jaroniec and M. Kruk (1997):14 for i=1:N15 r BJH Kelvin03(i) = −1 .∗ geom val .∗ gamma .∗ V L ./ (R .∗ T .∗ log(p(i))) .∗ 10ˆ(9) + 0.3;16 r BJH mod(i) = −1 .∗ geom val .∗ gamma .∗ V L ./ (R .∗ T .∗ log(p(i))) .∗ 10ˆ(9)17 + t Harkins(i) + 0.3;18 r BJH mod as(i) = −1 .∗ geom val .∗ gamma .∗ V L ./ (R .∗ T .∗ log(p(i))) .∗ 10ˆ(9)19 + t alphas(i) .∗ 0.722 + 0.3;20 end21
22 for i=1:N−123 % mean and differential values for BJH−equation24 r k mean(i) = 0.5 .∗ abs(r BJH Kelvin03(i+1) + r BJH Kelvin03(i));25 r p mean(i) = 0.5 .∗ abs(r BJH mod(i+1) + r BJH mod(i));26 r p mean as(i) = 0.5 .∗ abs(r BJH mod as(i+1) + r BJH mod as(i));27
28 % Original equation without ABS!29 Dr(i) = abs(r BJH mod(i+1) − r BJH mod(i));30 Dt(i) = abs(t Harkins(i+1) − t Harkins(i));31 Dr as(i) = abs(r BJH mod as(i+1) − r BJH mod as(i));32 Dt as(i) = abs(t alphas(i+1) − t alphas(i));33 DV(i) = abs(V(i+1) − V(i));34 end35
36 [...]37
38 % recursive BJH−calculation beginning from maximal pressure at N:39 for i=1:N−140 for j=1:i41 S += r p mean(N−j).ˆ2 ./ ((r k mean(N−j) − Dt(N−j)).ˆ2) .∗ Dt(N−j) .∗ 2 .∗ Vp(N−j) ./ r p mean(N−j);42 end43
44 Ra = r p mean(N−i).ˆ2 ./ ((r k mean(N−i) + Dt(N−i)).ˆ2);45 Vp(N−i) = Ra .∗ abs((DV(N−i) − Dt(N−i) .∗ sum(S)));46 end
61
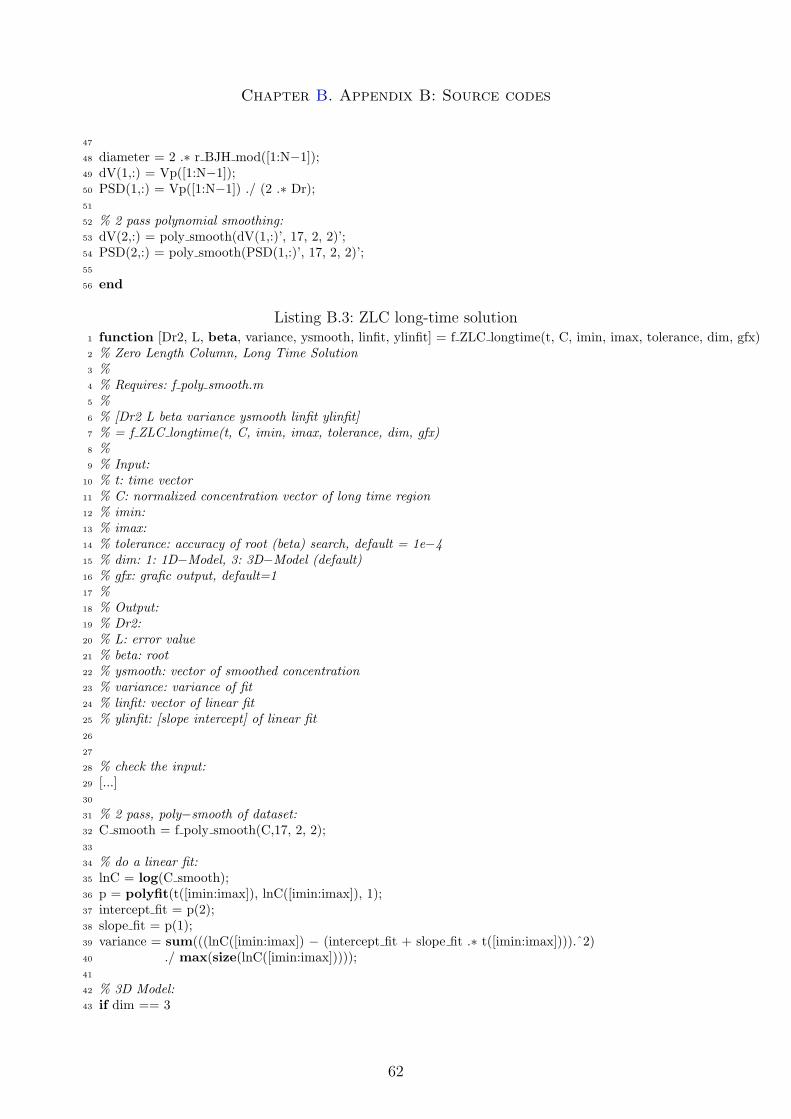
Chapter B. Appendix B: Source codes
47
48 diameter = 2 .∗ r BJH mod([1:N−1]);49 dV(1,:) = Vp([1:N−1]);50 PSD(1,:) = Vp([1:N−1]) ./ (2 .∗ Dr);51
52 % 2 pass polynomial smoothing:53 dV(2,:) = poly smooth(dV(1,:)’, 17, 2, 2)’;54 PSD(2,:) = poly smooth(PSD(1,:)’, 17, 2, 2)’;55
56 end
Listing B.3: ZLC long-time solution1 function [Dr2, L, beta, variance, ysmooth, linfit, ylinfit] = f ZLC longtime(t, C, imin, imax, tolerance, dim, gfx)2 % Zero Length Column, Long Time Solution3 %4 % Requires: f poly smooth.m5 %6 % [Dr2 L beta variance ysmooth linfit ylinfit]7 % = f ZLC longtime(t, C, imin, imax, tolerance, dim, gfx)8 %9 % Input:
10 % t: time vector11 % C: normalized concentration vector of long time region12 % imin:13 % imax:14 % tolerance: accuracy of root (beta) search, default = 1e−415 % dim: 1: 1D−Model, 3: 3D−Model (default)16 % gfx: grafic output, default=117 %18 % Output:19 % Dr2:20 % L: error value21 % beta: root22 % ysmooth: vector of smoothed concentration23 % variance: variance of fit24 % linfit: vector of linear fit25 % ylinfit: [slope intercept] of linear fit26
27
28 % check the input:29 [...]30
31 % 2 pass, poly−smooth of dataset:32 C smooth = f poly smooth(C,17, 2, 2);33
34 % do a linear fit:35 lnC = log(C smooth);36 p = polyfit(t([imin:imax]), lnC([imin:imax]), 1);37 intercept fit = p(2);38 slope fit = p(1);39 variance = sum(((lnC([imin:imax]) − (intercept fit + slope fit .∗ t([imin:imax]))).ˆ2)40 ./ max(size(lnC([imin:imax]))));41
42 % 3D Model:43 if dim == 3
62
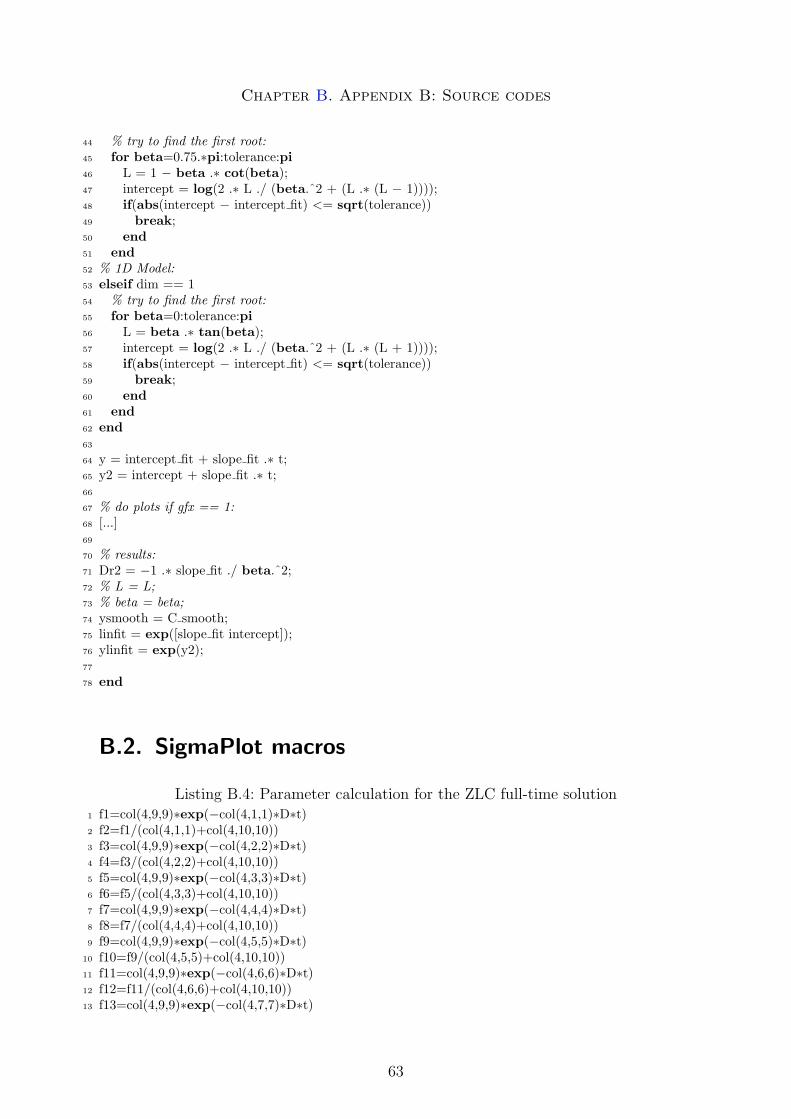
Chapter B. Appendix B: Source codes
44 % try to find the first root:45 for beta=0.75.∗pi:tolerance:pi46 L = 1 − beta .∗ cot(beta);47 intercept = log(2 .∗ L ./ (beta.ˆ2 + (L .∗ (L − 1))));48 if(abs(intercept − intercept fit) <= sqrt(tolerance))49 break;50 end51 end52 % 1D Model:53 elseif dim == 154 % try to find the first root:55 for beta=0:tolerance:pi56 L = beta .∗ tan(beta);57 intercept = log(2 .∗ L ./ (beta.ˆ2 + (L .∗ (L + 1))));58 if(abs(intercept − intercept fit) <= sqrt(tolerance))59 break;60 end61 end62 end63
64 y = intercept fit + slope fit .∗ t;65 y2 = intercept + slope fit .∗ t;66
67 % do plots if gfx == 1:68 [...]69
70 % results:71 Dr2 = −1 .∗ slope fit ./ beta.ˆ2;72 % L = L;73 % beta = beta;74 ysmooth = C smooth;75 linfit = exp([slope fit intercept]);76 ylinfit = exp(y2);77
78 end
B.2. SigmaPlot macros
Listing B.4: Parameter calculation for the ZLC full-time solution1 f1=col(4,9,9)∗exp(−col(4,1,1)∗D∗t)2 f2=f1/(col(4,1,1)+col(4,10,10))3 f3=col(4,9,9)∗exp(−col(4,2,2)∗D∗t)4 f4=f3/(col(4,2,2)+col(4,10,10))5 f5=col(4,9,9)∗exp(−col(4,3,3)∗D∗t)6 f6=f5/(col(4,3,3)+col(4,10,10))7 f7=col(4,9,9)∗exp(−col(4,4,4)∗D∗t)8 f8=f7/(col(4,4,4)+col(4,10,10))9 f9=col(4,9,9)∗exp(−col(4,5,5)∗D∗t)
10 f10=f9/(col(4,5,5)+col(4,10,10))11 f11=col(4,9,9)∗exp(−col(4,6,6)∗D∗t)12 f12=f11/(col(4,6,6)+col(4,10,10))13 f13=col(4,9,9)∗exp(−col(4,7,7)∗D∗t)
63
References
14 f14=f13/(col(4,7,7)+col(4,10,10))15 f15=col(4,9,9)∗exp(−col(4,8,8)∗D∗t)16 f16=f15/(col(4,8,8)+col(4,10,10))17 f=f2+f4+f6+f8+f10+f12+f14+f1618 fit f to y19
20 [initial parameters]21 D = 0.00522
23 [constraints]24 D > 025
26 [variables]27
28 t=col(1)29 y=col(2)30
31 [option]32 iterations = 10033 tolerance = 0.0000001
64
Bibliography
[1] K. S. W. Sing, D. H. Everett, R. A. W. Haul, L. Moscou, R. A. Pierotti, J. Rou-querol, and T. Siemieniewska. Reporting Physisorption Data for Gas Solid Systemswith Special Reference to the Determination of Surface-Area and Porosity (Recom-mendations 1984). Pure and Applied Chemistry, 57(4):603–619, 1985.
[2] C. G. Sonwane and Q. Li. Molecular simulation of RMM: Ordered mesoporous SBA-15 type material having microporous ZSM-5 walls. Journal of Physical ChemistryB, 109(38):17993–17997, 2005.
[3] M. Kruk, M. Jaroniec, R. Ryoo, and S. H. Joo. Characterization of orderedmesoporous carbons synthesized using MCM-48 silicas as templates. Journal ofPhysical Chemistry B, 104(33):7960–7968, 2000.
[4] M. Kruk, M. Jaroniec, T. W. Kim, and R. Ryoo. Synthesis and characterization ofhexagonally ordered carbon nanopipes. Chemistry of Materials, 15(14):2815–2823,2003.
[5] H. J. Shin, R. Ryoo, M. Kruk, and M. Jaroniec. Modification of SBA-15 pore con-nectivity by high-temperature calcination investigated by carbon inverse replication.Chemical Communications, (4):349–350, 2001.
[6] A. H. Lu, W. Schmidt, A. Taguchi, B. Spliethoff, B. Tesche, and F. Schuth. Takingnanocasting one step further: Replicating CMK-3 as a silica material. AngewandteChemie-International Edition, 41(18):3489–+, 2002.
[7] A. H. Lu, A. Kiefer, W. Schmidt, and F. Schuth. Synthesis of polyacrylonitrile-based ordered mesoporous carbon with tunable pore structures. Chemistry ofMaterials, 16(1):100–103, 2004.
[8] A. Vinu, M. Miyahara, V. Sivamurugan, T. Mori, and K. Ariga. Large pore cagetype mesoporous carbon, carbon nanocage: a superior adsorbent for biomaterials.Journal of Materials Chemistry, 15(48):5122–5127, 2005.
[9] B. Sakintuna and Y. Yurum. Templated porous carbons: A review article. Industrialand Engineering Chemistry Research, 44(9):2893–2902, 2005.
[10] R. K. Iler. The Chemistry of Silica: Solubility, Polymerization, Colloid and SurfaceProperties and Biochemistry. New York, 1979.
[11] C. J. Brinker. Structure of sol-gel-derived glasses. Glass Science and Technology,4A:169–230, 1990.
65
References
[12] C. J. Brinker, W. D. Drotning, and G. W. Scherer. A comparison between thedensification kinetics of colloidal and polymeric silica gels. In Better CeramicsThrough Chemistry, volume 32, New York, 1984. Materials Research Society.
[13] J. S. Beck, J. C. Vartuli, W. J. Roth, M. E. Leonowicz, C. T. Kresge, K. D. Schmitt,C. T. W. Chu, D. H. Olson, E. W. Sheppard, S. B. McCullen, J. B. Higgins, andJ. L. Schlenker. A New Family of Mesoporous Molecular-Sieves Prepared withLiquid-Crystal Templates. Journal of the American Chemical Society, 114(27):10834–10843, 1992.
[14] C. T. Kresge, M. E. Leonowicz, W. J. Roth, J. C. Vartuli, and J. S. Beck. OrderedMesoporous Molecular-Sieves Synthesized by a Liquid-Crystal Template Mechanism.Nature, 359(6397):710–712, 1992.
[15] J.M. Seddon and R.H. Templer. Polymorphism of Lipid-Water Systems. InR. Lipowsky and E. Sackmann, editors, Handbook of Biological Physics, pages97–160. Elsevier Science B.V., 1995.
[16] P. Behrens, A. Glaue, C. Haggenmuller, and G. Schechner. Structure-directedmaterials syntheses: Synthesis field diagrams for the preparation of mesostructuredsilicas. Solid State Ionics, 101:255–260, 1997.
[17] C. A. Fyfe and G. Y. Fu. Structure Organization of Silicate Polyanions withSurfactants - a New Approach to the Syntheses, Structure Transformations, andFormation Mechanisms of Mesostructural Materials. Journal of the AmericanChemical Society, 117(38):9709–9714, 1995.
[18] Q. S. Huo, D. I. Margolese, U. Ciesla, P. Y. Feng, T. E. Gier, P. Sieger, R. Leon,P. M. Petroff, F. Schuth, and G. D. Stucky. Generalized Synthesis of PeriodicSurfactant Inorganic Composite-Materials. Nature, 368(6469):317–321, 1994.
[19] Q. S. Huo, R. Leon, P. M. Petroff, and G. D. Stucky. Mesostructure Design withGemini Surfactants - Supercage Formation in a 3-Dimensional Hexagonal Array.Science, 268(5215):1324–1327, 1995.
[20] Q. S. Huo, D. I. Margolese, and G. D. Stucky. Surfactant control of phases inthe synthesis of mesoporous silica-based materials. Chemistry of Materials, 8(5):1147–1160, 1996.
[21] T. W. Kim, F. Kleitz, B. Paul, and R. Ryoo. MCM-48-like large mesoporoussilicas with tailored pore structure: Facile synthesis domain in a ternary triblockcopolymer-butanol-water system. Journal of the American Chemical Society, 127(20):7601–7610, 2005.
[22] F. Kleitz, T. W. Kim, and R. Ryoo. Phase domain of the cubic im3m mesoporoussilica in the EO106PO70EO106-butanol-H2O system. Langmuir, 22(1):440–445,2006.
66
References
[23] F. Kleitz, L. A. Solvyov, G. M. Anilkumar, S. H. Choi, and R. Ryoo. Transformationof highly ordered large pore silica mesophases (Fm3m, Im3m and p6mm) in aternary triblock copolymer-butanol-water system. Chemical Communications, (13):1536–1537, 2004.
[24] F. Kleitz, T. W. Kim, and R. Ryoo. Design of mesoporous silica at low acidconcentrations in triblock copolymer-butanol-water systems. Bulletin of the KoreanChemical Society, 26(11):1653–1668, 2005.
[25] V. T. Hoang, Q. L. Huang, M. Eic, T. O. Do, and S. Kaliaguine. Structure anddiffusion characterization of SBA-15 materials. Langmuir, 21(5):2051–2057, 2005.
[26] A. V. Neimark, P. I. Ravikovitch, M. Grun, F. Schuth, and K. K. Unger. Pore sizeanalysis of MCM-41 type adsorbents by means of nitrogen and argon adsorption.Journal of Colloid and Interface Science, 207(1):159–169, 1998.
[27] U. Ciesla and F. Schuth. Ordered mesoporous materials. Microporous and Meso-porous Materials, 27(2-3):131–149, 1999.
[28] A. Sayari. Catalysis by crystalline mesoporous molecular sieves. Chemistry ofMaterials, 8(8):1840–1852, 1996.
[29] X. S. Zhao, G. Q. M. Lu, and G. J. Millar. Advances in mesoporous molecularsieve MCM-41. Industrial and Engineering Chemistry Research, 35(7):2075–2090,1996.
[30] M. Jaroniec, M. Kruk, and A. Sayari. Adsorption methods for characterization ofsurface and structural properties of mesoporous molecular sieves. In MesoporousMolecular Sieves 1998, volume 117 of Studies in Surface Science and Catalysis,pages 325–332. Elsevier Science Publ B V, Amsterdam, 1998.
[31] M. Jaroniec, M. Kruk, and J. P. Olivier. Standard nitrogen adsorption data forcharacterization of nanoporous silicas. Langmuir, 15(16):5410–5413, 1999.
[32] M. Jaroniec, J. Choma, and M. Kruk. On the applicability of the Horwath-Kawazoemethod for pore size analysis of MCM-41 and related mesoporous materials. InCharacterization of Porous Solids V, volume 128 of Studies in Surface Science andCatalysis, pages 225–234. Elsevier Science Bv, Amsterdam, 2000.
[33] M. Kruk and M. Jaroniec. Gas adsorption characterization of ordered organic-inorganic nanocomposite materials. Chemistry of Materials, 13(10):3169–3183,2001.
[34] M. Kruk, V. Antochshuk, M. Jaroniec, and A. Sayari. New approach to evaluatepore size distributions and surface areas for hydrophobic mesoporous solids. Journalof Physical Chemistry B, 103(48):10670–10678, 1999.
[35] W. W. Lukens, P. Schmidt-Winkel, D. Y. Zhao, J. L. Feng, and G. D. Stucky.Evaluating pore sizes in mesoporous materials: A simplified standard adsorptionmethod and a simplified Broekhoff-de Boer method. Langmuir, 15(16):5403–5409,1999.
67
References
[36] A. V. Neimark and P. I. Ravikovitch. Density functional theory of adsorptionhysteresis and nanopore characterization. In Characterization of Porous SolidsV, volume 128 of Studies in Surface Science and Catalysis, pages 51–60. ElsevierScience Bv, Amsterdam, 2000.
[37] P. I. Ravikovitch, D. Wei, W. T. Chueh, G. L. Haller, and A. V. Neimark. Evaluationof pore structure parameters of MCM-41 catalyst supports and catalysts by meansof nitrogen and argon adsorption. Journal of Physical Chemistry B, 101(19):3671–3679, 1997.
[38] P. I. Ravikovitch, G. L. Haller, and A. V. Neimark. Density functional theorymodel for calculating pore size distributions: pore structure of nanoporous catalysts.Advances in Colloid and Interface Science, 77:203–226, 1998.
[39] A. Sayari, P. Liu, M. Kruk, and M. Jaroniec. Characterization of large-poreMCM-41 molecular sieves obtained via hydrothermal restructuring. Chemistry ofMaterials, 9(11):2499–2506, 1997.
[40] M. H. Lim and A. Stein. Comparative studies of grafting and direct syntheses ofinorganic-organic hybrid mesoporous materials. Chemistry of Materials, 11(11):3285–3295, 1999.
[41] T. Maschmeyer, F. Rey, G. Sankar, and J. M. Thomas. Heterogeneous CatalystsObtained by Grafting Metallocene Complexes onto Mesoporous Silica. Nature, 378(6553):159–162, 1995.
[42] K. Moller and T. Bein. Inclusion chemistry in periodic mesoporous hosts. Chemistryof Materials, 10(10):2950–2963, 1998.
[43] P. Wu, T. Tatsumi, T. Komatsu, and T. Yashima. Postsynthesis, characterization,and catalytic properties in alkene epoxidation of hydrothermally stable mesoporousTi-SBA-15. Chemistry of Materials, 14(4):1657–1664, 2002.
[44] J. M. Kim, J. H. Kwak, S. Jun, and R. Ryoo. Ion-Exchange and Thermal-Stabilityof Mcm-41. Journal of Physical Chemistry, 99(45):16742–16747, 1995.
[45] R. Ryoo and S. Jun. Improvement of hydrothermal stability of MCM-41 using salteffects during the crystallization process. Journal of Physical Chemistry B, 101(3):317–320, 1997.
[46] D. Y. Zhao, J. L. Feng, Q. S. Huo, N. Melosh, G. H. Fredrickson, B. F. Chmelka,and G. D. Stucky. Triblock copolymer syntheses of mesoporous silica with periodic50 to 300 angstrom pores. Science, 279(5350):548–552, 1998.
[47] D. Y. Zhao, Q. S. Huo, J. L. Feng, B. F. Chmelka, and G. D. Stucky. Non-ionic triblock and star diblock copolymer and oligomeric surfactant syntheses ofhighly ordered, hydrothermally stable, mesoporous silica structures. Journal of theAmerican Chemical Society, 120(24):6024–6036, 1998.
68
References
[48] P. Alexandridis and T. A. Hatton. Poly(ethylene oxide)-poly(propylene oxide )-poly(ethylene oxide) block copolymer surfactants in aqueous solutions and at interfaces:thermodynamics, structure, dynamics, and modeling. Colloids and Surfaces A:Physicochem. Eng. Aspects, 96:1–46, 1995.
[49] Y. Han, S. Wu, Y. Y. Sun, D. S. Li, F. S. Xiao, J. Liu, and X. Z. Zhang. Hy-drothermally stable ordered hexagonal mesoporous aluminosilicates assembled froma triblock copolymer and preformed aluminosilicate precursors in strongly acidicmedia. Chemistry of Materials, 14(3):1144–1148, 2002.
[50] Y. Sakamoto, M. Kaneda, O. Terasaki, D. Y. Zhao, J. M. Kim, G. Stucky, H. J.Shim, and R. Ryoo. Direct imaging of the pores and cages of three-dimensionalmesoporous materials. Nature, 408(6811):449–453, 2000.
[51] Ken Brakke. Surface Evolver, 2005.
[52] P. I. Ravikovitch and A. V. Neimark. Density functional theory of adsorption inspherical cavities and pore size characterization of templated nanoporous silicaswith cubic and three-dimensional hexagonal structures. Langmuir, 18(5):1550–1560,2002.
[53] P. I. Ravikovitch and A. V. Neimark. Experimental confirmation of differentmechanisms of evaporation from ink-bottle type pores: Equilibrium, pore blocking,and cavitation. Langmuir, 18(25):9830–9837, 2002.
[54] T. W. Kim, R. Ryoo, M. Kruk, K. P. Gierszal, M. Jaroniec, S. Kamiya, andO. Terasaki. Tailoring the pore structure of SBA-16 silica molecular sieve throughthe use of copolymer blends and control of synthesis temperature and time. Journalof Physical Chemistry B, 108(31):11480–11489, 2004.
[55] K. Schumacher, P. I. Ravikovitch, A. Du Chesne, A. V. Neimark, and K. K. Unger.Characterization of MCM-48 materials. Langmuir, 16(10):4648–4654, 2000.
[56] P. Y. Feng, X. H. Bu, and D. J. Pine. Control of pore sizes in mesoporoussilica templated by liquid crystals in block copolymer-cosurfactant-water systems.Langmuir, 16(12):5304–5310, 2000.
[57] D. Y. Zhao, J. Y. Sun, Q. Z. Li, and G. D. Stucky. Morphological control of highlyordered mesoporous silica SBA-15. Chemistry of Materials, 12(2):275–+, 2000.
[58] R. Ryoo, C. H. Ko, M. Kruk, V. Antochshuk, and M. Jaroniec. Block-copolymer-templated ordered mesoporous silica: Array of uniform mesopores or mesopore-micropore network? Journal of Physical Chemistry B, 104(48):11465–11471, 2000.
[59] A. Galarneau, H. Cambon, F. Di Renzo, and F. Fajula. True microporosity andsurface area of mesoporous SBA-15 silicas as a function of synthesis temperature.Langmuir, 17(26):8328–8335, 2001.
69
References
[60] A. Galarneau, N. Cambon, F. Di Renzo, R. Ryoo, M. Choi, and F. Fajula. Mi-croporosity and connections between pores in SBA-15 mesostructured silicas as afunction of the temperature of synthesis. New Journal of Chemistry, 27(1):73–79,2003.
[61] S. Ruthstein, V. Frydman, and D. Goldfarb. Study of the Initial Formation Stages ofthe Mesoporous Material SBA-15 Using Spin-Labeled Block Co-polymer Templates.Journal of Physical Chemistry B, 108(26):9016–9022, 2004.
[62] D. Brunel, N. Bellocq, P. Sutra, A. Cauvel, M. Lasperas, P. Moreau, F. Di Renzo,A. Galarneau, and F. Fajula. Transition-metal ligands bound onto the micelle-templated silica surface. Coordination Chemistry Reviews, 180:1085–1108, 1998.
[63] F. Rouquerol, J. Rouquerol, and K. Sing. Adsorption by powders and porous solids.Acad. Press, 1999, 1999.
[64] C. Sangwichien, G. L. Aranovich, and M. D. Donohue. Density functional theorypredictions of adsorption isotherms with hysteresis loops. Colloids and Surfacesa-Physicochemical and Engineering Aspects, 206(1-3):313–320, 2002.
[65] M. M. Dubinin, E. D. Zaverina, and L. V. Radushkevich. Sorbtsiya I Struktura Ak-tivnykh Uglei .1. Issledovanie Adsorbtsii Organicheskikh Parov. Zhurnal FizicheskoiKhimii, 21(11):1351–1362, 1947.
[66] M. M. Dubinin, A. V. Neimark, and V. V. Serpinskii. Modification of the Theoryof a 3-Dimensional Filling of Micropores. Bulletin of the Russian Academy ofSciences-Division of Chemical Science, 41(1):5–9, 1992.
[67] P. I. Ravikovitch, S. C. Odomhnaill, A. V. Neimark, F. Schuth, and K. K. Unger.Capillary hysteresis in nanopores: Theoretical and experimental studies of nitrogenadsorption on MCM-41. Langmuir, 11(12):4765–4772, 1995.
[68] J. H. Deboer, B. C. Lippens, B. G. Linsen, Broekhof.Jc, Vandenhe.A, and T. J.Osinga. T-Curve of Multimolecular N2-Adsorption. Journal of Colloid and InterfaceScience, 21(4):405–&, 1966.
[69] J. H. Deboer, B. G. Linsen, Broekhof.Jc, and T. J. Osinga. Studies on Pore Systemsin Catalysts .15. Influence of Geometrical Factor on T Curve Measured on Aerosil.Journal of Catalysis, 11(1):46–&, 1968.
[70] M. Kruk, M. Jaroniec, and A. Sayari. Application of large pore MCM-41 molecularsieves to improve pore size analysis using nitrogen adsorption measurements.Langmuir, 13(23):6267–6273, 1997.
[71] E.P. Barrett, L.G. Joyner, and P.P. Halenda. The Determination of Pore Volumeand Area Distributions in Porous Substances. I. Computations from NitrogenIsotherms. Journal of the American Chemical Society, 73:373–380, 1951.
[72] Danny Schuring. Diffusion in Zeolites: Towards a Microscopic Understanding.PhD thesis, University Eindhoven, 2002.
70
References
[73] M. Jiang and M. Eic. Transport Properties of Ethane, Butane and Their BinaryMixtures in MFI-Type Zeolite and Zeolite-Membrane Systems. Adsorption, 9:225–234, 2003.
[74] S. Brandani, J. Hufton, and D. Ruthven. Self-Diffusion of Propane and Propylenein 5a and 13x Zeolite Crystals Studied by the Tracer Zlc Method. Zeolites, 15(7):624–631, 1995.
[75] S. Brandani and D. M. Ruthven. Analysis of ZLC desorption curves for gaseoussystems. Adsorption-Journal of the International Adsorption Society, 2(2):133–143,1996.
[76] S. Brandani, M. Jama, and D. M. Ruthven. Counterdiffusion of p-xylene/benzeneand p-xylene/o-xylene in silicalite studied by the zero-length column technique.Industrial and Engineering Chemistry Research, 39(3):821–828, 2000.
[77] S. Brandani, M. A. Jama, and D. M. Ruthven. ZLC Measurements under non-linearconditions. Chemical Engineering Science, 55(7):1205–1212, 2000.
[78] C. L. Cavalcante and D. M. Ruthven. Adsorption of Branched and Cyclic Paraffinsin Silicalite .1. Equilibrium. Industrial and Engineering Chemistry Research, 34(1):177–184, 1995.
[79] C. L. Cavalcante and D. M. Ruthven. Adsorption of Branched and Cyclic Paraffinsin Silicalite .2. Kinetics. Industrial and Engineering Chemistry Research, 34(1):185–191, 1995.
[80] W. L. Duncan and K. P. Moller. A ’zero length’ criterion for ZLC chromatography.Chemical Engineering Science, 55:5415–5420, 2000.
[81] S. Brandani and D. M. Ruthven. Analysis of Zlc Desorption Curves for Liquid-Systems. Chemical Engineering Science, 50(13):2055–2059, 1995.
[82] D. M. Ruthven and P. Stapleton. Measurement of Liquid-Phase Counter-Diffusionin Zeolite Crystals by the Zlc Method. Chemical Engineering Science, 48(1):89–98,1993.
[83] W. L. Duncan and K. P. Moller. The effect of a crystall siye distribution on ZLCexperiments. Chemical Engineering Science, 57:2641 – 2652, 2002.
[84] S. Brandani and D. M. Ruthven. Moments analysis of the zero length columnmethod. Industrial and Engineering Chemistry Research, 35(1):315–319, 1996.
[85] S. Brandani, C. Cavalcante, A. Guimaraes, and D. Ruthven. Heat effects in ZLCexperiments. Adsorption-Journal of the International Adsorption Society, 4(3-4):275–285, 1998.
[86] C. L. Cavalcante, S. Brandani, and D. M. Ruthven. Evaluation of the main diffusionpath in zeolites from ZLC desorption curves. Zeolites, 18(4):282–285, 1997.
71
References
[87] D. Ruthven and F. Brandani. ZLC response for systems with surface resistancecontrol. Adsorption-Journal of the International Adsorption Society, 11(1):31–34,2005.
[88] H. Vinh-Thang, Q. L. Huang, M. Eic, D. Trong-On, and S. Kaliaguine. Adsorptionof C-7 hydrocarbons on biporous SBA-15 mesoporous silica. Langmuir, 21(11):5094–5101, 2005.
[89] F. Kleitz, S. H. Choi, and R. Ryoo. Cubic Ia3d large mesoporous silica: synthesisand replication to platinum nanowires, carbon nanorods and carbon nanotubes.Chemical Communications, (17):2136–2137, 2003.
[90] K. Miyazawa and S. Inagaki. Control of the microporosity within the pore wallsof ordered mesoporous silica SBA-15. Chemical Communications, (21):2121–2122,2000.
[91] P. I. Ravikovitch and A. V. Neimark. Characterization of micro- and mesoporosityin SBA-15 materials from adsorption data by the NLDFT method. Journal ofPhysical Chemistry B, 105(29):6817–6823, 2001.
[92] T. W. Kim, R. Ryoo, K. P. Gierszal, M. Jaroniec, L. A. Solovyov, Y. Sakamoto,and O. Terasaki. Characterization of mesoporous carbons synthesized with SBA-16silica template. Journal of Materials Chemistry, 15(15):1560–1571, 2005.
[93] M. Eic and D. M. Ruthven. A New Experimental-Technique for Measurement ofIntracrystalline Diffusivity. Zeolites, 8(1):40–45, 1988.
[94] F. Brandani, D. Ruthven, and C. G. Coe. Measurement of adsorption equilibriumby the zero length column (ZLC) technique part 1: Single-component systems.Industrial and Engineering Chemistry Research, 42(7):1451–1461, 2003.
[95] V. R. Choudhary, V. S. Nayak, and T. V. Choudhary. Single-Component Sorp-tion/Diffusion of Cyclic Compounds from Their Bulk Liquid Phase in H-ZSM-5Zeolite. Industrial and Engineering Chemistry Research, 36:1812 – 1818, 1997.
[96] M. Schunack, T. R. Linderoth, F. Rosei, E. Laegsgaard, I. Stensgaard, and F. Be-senbacher. Long Jumps in the Surface Diffusion of Large Molecules. PhysicalReview Letters, 88(15), 2002.
[97] S. C. Wang, J.D. Wrigley, and G. Ehrlich. Atomic jump lenghts in surface diffusion:Re, Mo, Ir and Rh on W(211). Journal of Chemical Physics, 91(8):5087 – 5096,1989.
[98] V. T. Hoang, Q. L. Huang, M. Eic, T. O. Do, and S. Kaliaguine. Effect of theIntrawall Microporosity on the Diffusion Characterization of Biporous SBA-15Materials. Studies in Surface Science and Catalysis, in press, 2005.
[99] J. M. Esparza, M. L. Ojeda, A. Campero, G. Hernandez, C. Felipe, M. Asomoza,S. Cordero, I. Kornhauser, and F. Rojas. Development and sorption characterizationof some model mesoporous and microporous silica adsorbents. Journal of MolecularCatalysis a-Chemical, 228(1-2):97–110, 2005.
72
References
[100] L. J. Gurvitsch. Russian Journal of Physical Chemistry, 47:805, 1915.
[101] E. van Bavel, V. Meynen, P. Cool, K. Lebeau, and E. F. Vansant. Adsorptionof Hydrocarbons on Mesoporous SBA-15 and PHTS Materials. Langmuir, 21:2447–2453., 2005.
[102] Y. Sun, Y. Han, L. Yuan, S. Ma, D. Jiang, and F.-S. Xiao. Microporosity in Or-dered Mesoporous Aluminosilicates Characterized by Catalytic Probing Reactions.Journal of Physical Chemistry B, 107(8):1853–1857, 2003.
[103] B. L. Newalkar, N. V. Choudary, P. Kumar, S. Komarneni, and T. S. G. Bhat.Exploring the potential of mesoporous silica, SBA-15, as an adsorbent for lighthydrocarbon separation. Chemistry of Materials, 14(1):304–309, 2002.
[104] C. Seebacher, C. Hellriegel, F.-W. Deeg, C. Brauchle, S. Altmaier, P. Behrens,and K. Mullen. Observation of Translational Diffusion of Single TerrylenediimideMolecules in a Mesostructured Molecular Sieve. Journal of Physical Chemistry B,106(22):5591–5595, 2002.
73