Embed Size (px)
Citation preview


BOARD OF DIRECTORSRichard C. AlberdingRetired Hewlett-Packard Executive
Brian J. JackmanLead DirectorRetired Tellabs, Inc. Executive
Steven LevyRetired Lehman Brothers Executive
Giacomo MariniFounder and Managing DirectorNoventi
John SheehanSenior ConsultantLondon Perret Roche Group
Martin H. SingerChief Executive Officer and Chairman of the Board
Carl A. ThomsenSenior Vice President,Retired Chief Financial Officer, and Secretary Stratex Networks, Inc.
ELECTED OFFICERSMartin H. SingerChief Executive Officer and Chairman of the Board
Steve DeppeExecutive Vice President,Strategy and Business Development
Jeffery A. MillerVice President and General ManagerBroadband Technology Group
Biju NairVice President, General Manager Mobility Solutions Group
John SchoenChief Financial Officer
APPOINTED OFFICERSVarda GoldmanVice President and General Counsel
Luis RugelesVice President, General ManagerRF Solutions
Les SgnilekVice President, Finance
CORPORATE INFORMATION
TRANSFER AGENTWells Fargo BankShareowner Services161 North Concord Exchange South St. Paul, MN 55075-1139Tel: 1-800-468-9716Fax: 1-651-450-4078
INDEPENDENT PUBLIC ACCOUNTANTS Grant Thornton, LLP Chicago, IL
LEGAL COUNSELWilson Sonsini Goodrich & Rosati Palo Alto, CA
ANNUAL MEETINGThe Annual Meeting for Shareholders will be held at 10:00 a.m. on Tuesday June 5, 2007 at the corporate offices of PCTEL located at:8725 West Higgins Road., Suite 400 Chicago, IL 60631 U.S.A.
INVESTOR RELATIONSFor further information on the Company, additional copies of the report,Form 10-K filed with the Securities and Exchange Commission or other financial information, please contact:
PCTEL, Inc.8725 West Higgins Rd., Suite 400 Chicago, IL 60631 U.S.A.Tel: 1-773-243-3000Fax: 1-773-243-3050
You may also contact us by sending an e-mail to:[email protected] by visiting our web site at www.pctel.com
GLOBAL HEADQUARTERS PCTEL Inc.8725 West Higgins Rd., Suite 400 Chicago, IL 60631 U.S.A.Tel: 1-773-243-3000Fax: 1-773-243-3050www.pctel.com
OTHER OFFICES Broadband Technology Group
471 Brighton Drive Bloomingdale, IL 60108 U.S.A.Tel: 630-372-6800 Fax: 630-372-8077
20410 Observation Drive, Suite 200 Germantown, MD 20876 U.S.A. Tel: 1-301-515-0036Fax: 1-301-515-0037
Maxrad (Tianjin) Electronics Co., Ltd. Pengan Road 3#Pengan Industrial ParkBeichen District, Tianjin CityPR ChinaTel: +86-22-2666-6741Fax: +86-22-2666-7439

UNITED STATES SECURITIES AND EXCHANGE COMMISSIONWashington, DC 20549
Form 10-K¥ ANNUAL REPORT PURSUANT TO SECTION 13 OR 15(d) OF THE
SECURITIES EXCHANGE ACT OF 1934For the fiscal year ended December 31, 2006
OR
n TRANSITION REPORT PURSUANT TO SECTION 13 OR 15(d) OF THESECURITIES EXCHANGE ACT OF 1934For the transition period from to
Commission File Number 000-27115
PCTEL, Inc.(Exact Name of Business Issuer as Specified in Its Charter)
Delaware 77-0364943(State or Other Jurisdiction ofIncorporation or Organization)
(I.R.S. EmployerIdentification Number)
8725 W. Higgins Road, Suite 400,Chicago IL
(Address of Principal Executive Office)
60631(Zip Code)
(773) 243-3000(Registrant’s Telephone Number, Including Area Code)
Securities registered pursuant to Section 12(b) of the Act:
Title of each class Name of each exchange on which registered
Common Stock, $.001 Par Value Per Share The Nasdaq Global Market
Securities registered pursuant to Section 12(g) of the Act:None.
Indicate by check mark whether the registrant is a well-known seasoned issuer, as defined in Rule 405 of the SecuritiesAct. Yes [ ] No ¥
Indicate by check mark if the registrant is not required to file reports pursuant to Section 13 or Section 15(d) of the Act. Yes [ ] No ¥
Indicate by check mark whether the registrant (1) has filed all reports required to be filed by Section 13 or 15(d) of the Securities Exchange Actof 1934 during the preceding 12 months (or for such shorter period that the registrant was required to file such reports), and (2) has beensubject to such filing requirements for the past 90 days. Yes ¥ No n
Indicate by check mark if disclosure of delinquent filers pursuant to Item 405 of Regulation S-K (§ 229.405 of this chapter) is not containedherein, and will not be contained, to the best of registrant’s knowledge, in definitive proxy or information statements incorporated by referencein Part III of this Form 10-K or any amendment to this Form 10-K. ¥
Indicate by check mark whether the registrant is a large accelerated filer, an accelerated filer, or a non-accelerated filer. See definition of“accelerated filer and large accelerated filer” in Rule 12b-2 of the Exchange Act.:[ ] Large accelerated filer ¥ Accelerated filer [ ] Non-accelerated filer
Indicate by check mark whether the registrant is a shell company (as defined in Rule 12b-2 of the Act). Yes [ ] No ¥
As of June 30, 2006, the last business day of Registrant’s most recently completed second fiscal quarter, there were 22,181,273 shares ofRegistrant’s common stock outstanding, and the aggregate market value of such shares held by non-affiliates of Registrant (based upon theclosing sale price of such shares on the Nasdaq Global Market on June 30, 2006) was approximately $125,980,987. Shares of Registrant’scommon stock held by each executive officer and director and by each entity that owns 5% or more of Registrant’s outstanding common stockhave been excluded in that such persons may be deemed to be affiliates. This determination of affiliate status is not necessarily a conclusivedetermination for other purposes.
Indicate the number of shares outstanding of each of the registrant’s classes of common stock, as of the latest practicable date.
Title Outstanding
Common Stock, par value $.001 per share 22,145,841 as of March 1, 2007
DOCUMENTS INCORPORATED BY REFERENCECertain sections of Registrant’s definitive Proxy Statement relating to its 2007 Annual Stockholders’ Meeting to be held on June 5,2007 are incorporated by reference into Part III of this Annual Report on Form 10-K.

PCTEL, Inc.Form 10-K
For the Year Ended December 31, 2006
TABLE OF CONTENTS
PART IItem 1 Business . . . . . . . . . . . . . . . . . . . . . . . . . . . . . . . . . . . . . . . . . . . . . . . . . . . . . . . . . . . . . . . . . 1
Item 1A Risk Factors . . . . . . . . . . . . . . . . . . . . . . . . . . . . . . . . . . . . . . . . . . . . . . . . . . . . . . . . . . . . . . 5
Item 1B Unresolved Staff Comments . . . . . . . . . . . . . . . . . . . . . . . . . . . . . . . . . . . . . . . . . . . . . . . . . . 11
Item 2 Properties . . . . . . . . . . . . . . . . . . . . . . . . . . . . . . . . . . . . . . . . . . . . . . . . . . . . . . . . . . . . . . . . 12
Item 3 Legal Proceedings . . . . . . . . . . . . . . . . . . . . . . . . . . . . . . . . . . . . . . . . . . . . . . . . . . . . . . . . . . 12
Item 4 Submission of Matters to a Vote of Security Holders . . . . . . . . . . . . . . . . . . . . . . . . . . . . . . . . 12
PART IIItem 5 Market for Registrant’s Common Equity, Related Stockholder Matters, and Issuer Purchases of
Equity Securities . . . . . . . . . . . . . . . . . . . . . . . . . . . . . . . . . . . . . . . . . . . . . . . . . . . . . . . . . . . 14
Item 6 Selected Financial Data . . . . . . . . . . . . . . . . . . . . . . . . . . . . . . . . . . . . . . . . . . . . . . . . . . . . . . 17
Item 7 Management’s Discussion and Analysis of Financial Condition and Results of Operations . . . . . 18
Item 7A Quantitative and Qualitative Disclosures about Market Risk . . . . . . . . . . . . . . . . . . . . . . . . . . . 29
Item 8 Financial Statements and Supplementary Data . . . . . . . . . . . . . . . . . . . . . . . . . . . . . . . . . . . . . 31
Item 9 Changes in and Disagreements with Accountants on Accounting and Financial Disclosure . . . . 70
Item 9A Controls and Procedures . . . . . . . . . . . . . . . . . . . . . . . . . . . . . . . . . . . . . . . . . . . . . . . . . . . . . 70
Item 9B Other Information . . . . . . . . . . . . . . . . . . . . . . . . . . . . . . . . . . . . . . . . . . . . . . . . . . . . . . . . . . 71
PART IIIItem 10 Director and Executive Officers of the Registrant and Corporate Governance Matters . . . . . . . . 71
Item 11 Executive Compensation . . . . . . . . . . . . . . . . . . . . . . . . . . . . . . . . . . . . . . . . . . . . . . . . . . . . . 71
Item 12 Security Ownership of Certain Beneficial Owners and Management and Related StockholderMatters . . . . . . . . . . . . . . . . . . . . . . . . . . . . . . . . . . . . . . . . . . . . . . . . . . . . . . . . . . . . . . . . . . 71
Item 13 Certain Relationships and Related Transactions, and Director Independence . . . . . . . . . . . . . . . 71
Item 14 Principal Accountant Fees and Services . . . . . . . . . . . . . . . . . . . . . . . . . . . . . . . . . . . . . . . . . . 71
PART IVItem 15 Exhibits and Financial Statement Schedules . . . . . . . . . . . . . . . . . . . . . . . . . . . . . . . . . . . . . . . 73
Schedule II — Valuation and Qualifying Accounts . . . . . . . . . . . . . . . . . . . . . . . . . . . . . . . . . . 73
Index to Exhibits . . . . . . . . . . . . . . . . . . . . . . . . . . . . . . . . . . . . . . . . . . . . . . . . . . . . . . . . . . 73
Signatures. . . . . . . . . . . . . . . . . . . . . . . . . . . . . . . . . . . . . . . . . . . . . . . . . . . . . . . . . . . . . . . . 77
Exhibits . . . . . . . . . . . . . . . . . . . . . . . . . . . . . . . . . . . . . . . . . . . . . . . . . . . . . . . . . . . . . . . . .
i

PART I
Item 1: Business
This report contains forward-looking statements within the meaning of Section 27A of the Securities Act of1933 and Section 21E of the Securities Exchange Act of 1934. These statements include, among other things,statements concerning the future operations, financial condition and prospects, and business strategies. The words“believe,” “expect,” “anticipate” and other similar expressions generally identify forward-looking statements.Investors in the common stock are cautioned not to place undue reliance on these forward-looking statements.These forward-looking statements are subject to substantial risks and uncertainties that could cause the futurebusiness, financial condition, or results of operations to differ materially from the historical results or currentlyanticipated results.
Overview
PCTEL focuses on wireless broadband mobility. We design and develop innovative antennas that extend thereach of broadband and other wireless networks and that simplify the implementation of those networks. Weprovide highly specialized software-defined radios that facilitate the design and optimization of broadband wirelessnetworks and we develop software that simplifies and secures wireless access to the network. We provide ourproducts, both software and RF products, to wireless and private carriers, wireless infrastructure and handsetproviders, wireless equipment distributors, value added resellers (VARs) and other original equipment manufac-turers (OEMs). Additionally, the company has licensed its intellectual property, principally related to a discontinuedmodem business, to semiconductor, PC manufacturers, modem suppliers, and others.
The company operates in three separate product segments: a Broadband Technology Group, the MobilitySolutions Group, and Licensing. PCTEL maintains expertise in several technology areas. These include DSPchipset programming, Radio Frequency, software engineering, mobile device operating systems, antenna designand manufacture, mechanical engineering, wireless connectivity, authentication, security, specialized communi-cation devices, advanced algorithm development, and cellular engineering.
PCTEL was incorporated in California in 1994 and reincorporated in Delaware in 1998. The principalexecutive offices are located at 8725 W. Higgins Road, Suite 400, Chicago, Illinois 60631. The telephone number atthat address is (773) 243-3000 and the web site is www.pctel.com. The contents of the web site are not incorporatedby reference into this Annual Report on Form 10-K.
Broadband Technology Group
The Broadband Technology Group (BTG) designs, distributes, and supports innovative antenna solutions forpublic safety applications, unlicensed and licensed wireless broadband, fleet management, network timing, andother GPS applications. The BTG’s portfolio of OEM receivers and interference management solutions are used tomeasure, monitor and optimize cellular networks.
Our antenna products originated through a series of acquisitions starting with MAXRAD, Inc, which wasacquired in January 2004. MAXRAD’s antenna solutions consist of antennas designed to enhance the performanceof broadband wireless, in-building wireless, wireless Internet service providers and Land Mobile Radio (LMR)applications. As a result of the October 2004 acquisition of certain antenna product lines from Andrew Corporation(“Andrew”), the product portfolio expanded to include GPS (Global Positioning Systems), satellite communica-tions (Mobile SATCOM) and on-glass mobile antennas. In July 2005, we again expanded the product portfolio withthe purchase of Sigma Wireless Technologies Limited (“Sigma” or “SWT”), located in Dublin, Ireland. Sigmaprovides integrated variable electrical tilt base stations antennas (iVET), Public Mobile Radio (PMR), and DigitalPublic Mobile Radio (DPMR) antenna products.
Antenna products are sold to end user customers and dealers through distributors and via direct sales channelsto wireless carriers and equipment manufacturers. The products are sold under the MAXRAD, AntennaSpecialists», Micro-Pulse, and iVET brands.
1

Revenue growth for antenna products is tied to emerging wireless applications in broadband wireless, in-building wireless, wireless Internet service providers, GPS and Mobile SATCOM. The LMR, PMR, DPMR, and on-glass mobile antenna applications represent mature markets. Our newest products address UMTS and WiMAXstandards and applications.
There are many competitors for antenna products, as the market is highly fragmented. Competitors includesuch names as Laird (Cushcraft, Centurion, and Antennex brands), Mobile Mark, Radiall/Larsen, Comtelco,Wilson, Andrew Corporation, and Kathrein. BTG seeks out product applications that command a premium forproduct performance and customer service, and seeks to avoid product applications characterized bycommoditization.
BTG’s OEM receiver and interference management solutions consist of software-defined radio productsdesigned to measure and monitor cellular networks. The products originated through the business of DTI, Inc.,which was acquired in March 2003. The technology is sold in two forms; as OEM radio frequency receivers or asintegrated systems solutions. The SeeGullTM family of OEM receivers collects and measure RF data, such as signalstrength and base station identification in order to analyze wireless signals. The CLARIFYTM interferencemanagement product is a receiver system solution that uses patent pending technology to identify and measurewireless network interference. Customers of BTG’s OEM receiver and interference management solutions arewireless network operators, wireless infrastructure suppliers, and wireless test and measurement solution providers.
Revenue growth for OEM receivers and interference management solutions is tied to the deployment of newwireless technology, such as 2.5G and 3G, and the need for existing wireless networks to be tuned and reconfiguredon a regular basis. Competitors for these products are OEM’s such as Agilent Technologies, Rohde and Schwarz,Anritsu, Panasonic, and Berkley Varitronics. The products compete on the basis of product performance at a pricepoint that is generally lower than the competition.
Revenue for both antenna and receiver products follow the seasonal capital spending patterns of the wirelessnetwork operators and OEM’s. Revenue for BTG within each fiscal year is historically seasonal, with a trend of thefirst quarter typically being the lowest and the fourth quarter typically being the highest.
Mobility Solutions Group
The Mobility Solutions Group (MSG) produces mobility software products for WiFi, cellular, IP MultimediaSubsystem (IMS), and wired applications. In the wireless domain, our products support Wi-Fi (802.11 a/b/g), allmajor cellular data networking technologies, and IMS. For wired access, the company’s products support traditionalanalog dial-up, DSL, and Ethernet connectivity. Revenue in this segment is dominated by the company’s RoamingClient product. The Roaming Client is a PC or PocketPC-based application developed to allow users to easily locateand connect to Wi-Fi and Wireless Wide Area Networks (WWANs-GPRS, CDMA 1x or other 2.5G cellularnetworks, EVDO, WCDMA, WiMAX) data networks. Customers for these products are not typically individualend-users, but cellular carriers, Internet access service providers, manufacturers, distributors, integrators, or otherservice aggregators.
Revenue for the Roaming Client is correlated to the success of data services offered by the customer base. Wedescribe the roll out of such data services to be in the early stage of market development. It is too early to assess ifthe market will develop seasonal revenue patterns within the calendar year.
Competitors for the Roaming Client range from operating system suppliers such as Apple or Microsoft (whichoffers a level of WLAN client support through its Windows XP and Vista offerings) to WLAN NIC (NetworkInterface Card) suppliers (that bundle minimal clients with their hardware offering) to service aggregators thatprovide a client as part of their service offering such as iPASS. The company believes it is unique in that many ofthese competitors are potential customers for the branded client offering. There are few ‘client only’ competitors inthe WLAN space, such as Smith Micro, and Birdstep (through its acquisition of Alice Systems in November 2004).The single biggest competitive condition for the Roaming Client is product performance. The Roaming Clientdistinguishes itself from its competition on the following dimensions: usability, ability to roam across all existingwireless standards, its security module, the availability of a centralized configuration server that can manageprofiles and policy, and the tested compatibility with hundreds of wireless modems.
2

Licensing
PCTEL has an intellectual property portfolio consisting of over 100 U.S. patents and applications, primarily inanalog modem technology. It also has proprietary DSP based embedded modem technology. We had an activelicensing program since 2002 designed to monetize the value of its modem related intellectual property. Companiesunder license at the end of 2006 include Agere, US Robotics, 3COM, Intel, Conexant, Broadcom, SiliconLaboratories, Texas Instruments, Smartlink, and ESS Technologies.
Developments
The company continues to look for opportunities in wireless markets both through internal development andthrough acquisitions.
The following significant acquisition events related to wireless markets took place in our history.
• Acquisition of cyberPIXIE, Inc. in May 2002, which was the genesis of the company’s Mobility SolutionsGroup.
• Acquisition of Dynamic Telecommunications, Inc. (DTI) in March 2003. The OEM receiver and interfer-ence measurement product lines within BTG came from DTI.
• Acquisition of MAXRAD, Inc. in January 2004, product lines from Andrew Corporation in October 2004,and Sigma in July 2005. These acquisitions provided the antenna product lines within BTG.
During 2006, we restructured Sigma’s manufacturing operations by closing its antenna manufacturing facilityin Dublin, Ireland and redistributing that capacity primarily to a contract manufacturer in eastern Europe, with theremainder to its existing antenna factory in Bloomingdale, Illinois. We recognized restructuring costs as well ascosts for the impairment of assets related to that restructuring.
Sales, Marketing and Support
We sell our products directly to wireless carriers, private carriers, test equipment providers, and wireless equipmentmanufacturers (infrastructure and handsets). We also sell products indirectly through distributors in the U.S. and outsidethe U.S. Our direct sales force is technologically sophisticated and sales executives have strong industry domainknowledge. Our direct sales force supports the sales efforts of our distributors and OEM resellers.
Our marketing strategy is focused on building market awareness and acceptance of our new products. Themarketing organization also provides a wide range of programs, materials and events to support the salesorganization. We spent approximately $13.3, $13.1, and $11.2 million for the fiscal years 2006, 2005 and2004, respectively, for sales and marketing support.
As of December 31, 2006, we employed 50 individuals in sales and marketing with offices in the U.S., Japan,Hong Kong, Ireland and United Kingdom.
Major Customers
One customer has accounted for revenue greater than 10% during the last three fiscal years as follows:
Customer 2006 2005 2004
Years EndedDecember 31,
TESSCO Technologies . . . . . . . . . . . . . . . . . . . . . . . . . . . . . . . . . . . . . . . . . . . 9% 11% 10%
TESSCO, a distributor of wireless products is a customer in the Broadband Technology Group.
International Activities
The following table illustrates the percentage of revenues from domestic sales and foreign sales during the lastthree fiscal years:
2006 2005 2004
Years EndedDecember 31,
Domestic sales . . . . . . . . . . . . . . . . . . . . . . . . . . . . . . . . . . . . . . . . . . . . . . . . 69% 76% 77%Foreign sales . . . . . . . . . . . . . . . . . . . . . . . . . . . . . . . . . . . . . . . . . . . . . . . . . . 31% 24% 23%
100% 100% 100%
3

Backlog
Sales of our products are generally made pursuant to standard purchase orders, which are officiallyacknowledged according to standard terms and conditions. The backlog, while useful for scheduling productionor software release dates, is not a meaningful indicator of future revenues as the order to ship cycle is extremelyshort.
Research and Development
We recognize that a strong technical base is essential to the long-term success and we have made a substantialinvestment in research and development. We will continue to devote substantial resources to product developmentand patent submissions. The patent submissions for the two wireless product segments are primarily for defensivepurposes, rather than for potential license revenue generation. We monitor changing customer needs and workclosely with the customers, partners and market research organizations to track changes in the marketplace,including emerging industry standards.
Research and development expenses include costs for software and hardware development, prototyping,certification and pre-production costs. We spent approximately $13.8, $10.0, and $8.6 million for the fiscal years2006, 2005 and 2004, respectively, in research and development.
Manufacturing
BTG does final assembly of most of its antenna products and all of its OEM receiver and interferencemanagement product lines. We also have arrangements with several contract manufacturers but are not dependenton any one. Should any of these manufacturers be unsatisfactory, other manufacturers are available. We have noguaranteed supply or long-term contract agreements with any other of our suppliers.
MSG products are software licenses and related engineering fees to customize the product for customernetworks. The software product delivery cycle is comprised of delivering a product master of the software fromwhich customers make copies for their subscribers.
Employees
As of December 31, 2006, we had 352 full-time equivalent employees, including 155 in operations, 50 in salesand marketing, 102 in research and development, and 45 in general and administrative functions. The total full-timeequivalent employee number includes 26 temporary employees and contractors for manufacturing assembly andengineering support. Headcount decreased 113 from December 31, 2005 due to reductions in Dublin, Irelandmanufacturing operations and due to the reduction of temporary employees in Bloomingdale operations positions.The reduction in Bloomingdale operations employees is due to outsourcing and manufacturing efficiencies.
As part of the Dublin restructuring plan, we negotiated employee severance benefits with the labor union forthe Dublin operations. Effective with a settlement in June 2006 and the completion of our restructuring plan inSeptember 2006, none of the current Dublin employees are represented by a labor union. None of our otheremployees are represented by a labor union. We consider employee relations to be good.
Web Site Postings
The annual report on Form 10-K, quarterly reports on Form 10-Q, current reports on Form 8-K, andamendments to such reports, are available free of charge through our web site as soon as reasonably practicableafter we electronically file such material with, or furnish it to, the United States Securities and ExchangeCommission, at the following address: www.pctel.com. The information within, or that can be accessed throughthe web site is not part of this report.
4

Item 1A: Risk Factors
Factors That May Affect Our Business, Financial Condition and Future Operating Results
This annual report on Form 10-K, including Management’s Discussion and Analysis of Financial Conditionand Results of Operations, contains forward-looking statements. These forward-looking statements are subject tosubstantial risks and uncertainties that could cause our future business, financial condition or results of operationsto differ materially from our historical results or currently anticipated results, including those set forth below.Investors should carefully review the information contained in this Item IA.
Risks Related to Our Business
Competition within the wireless connectivity products industries is intense and is expected to increasesignificantly. Our failure to compete successfully could materially harm our prospects and financialresults.
The wireless products connectivity markets are intensely competitive. We may not be able to competesuccessfully against current or potential competitors. We expect competition to increase in the future as currentcompetitors enhance their product offerings, new suppliers enter the wireless connectivity products markets, newcommunication technologies are introduced and additional networks are deployed. Our client software competeswith software developed internally by Network Interface Card (NIC) vendors, service providers for wirelessnetworks, and with software developed by large systems integrators. Increased competition could materially andadversely affect our business and operating results through pricing pressures, the loss of market share and otherfactors.
The antenna market is highly fragmented and is served by many local product providers. We may not be able todisplace established competitors from their customer base with our products. We may not achieve the design winsnecessary to participate in WCDMA network deployments where our products compete. Where we have designwins, we may not be the sole source supplier or may receive only a small portion of the business from each customer.
Many of our present and potential competitors have substantially greater financial, marketing, technical andother resources with which to pursue engineering, manufacturing, marketing, and distribution of their products.These competitors may succeed in establishing technology standards or strategic alliances in the connectivityproducts markets, obtain more rapid market acceptance for their products, or otherwise gain a competitiveadvantage. We can offer no assurance that we will succeed in developing products or technologies that are moreeffective than those developed by our competitors. We can offer no assurance that we will be able to competesuccessfully against existing and new competitors as the connectivity wireless markets evolve and the level ofcompetition increases.
Our ability to grow our business may be threatened if the demand for wireless data services does notcontinue to grow.
Our ability to compete successfully in the wireless market is dependent on the continued trend toward wirelesstelecommunications and data communications services. If the rate of growth slows and service providers reducetheir capital investments in wireless infrastructure or fail to expand into new geographic markets, our revenue maydecline. Wireless data solutions are relatively unproven in the marketplace and some of the wireless technologieshave only been commercially introduced in the last few years. We began offering wireless products in the secondquarter of fiscal year 2002. If wireless data access technology turns out to be unsuitable for widespread commercialdeployment, we may not be able to generate enough sales to grow our business. We have listed below some of thefactors that we believe are key to the success or failure of wireless access technology:
• reliability and security of wireless access technology and the perception by end-users of its reliability andsecurity,
• capacity to handle growing demands for faster transmission of increasing amounts of data, voice and video,
5

• the availability of sufficient frequencies for network service providers to deploy products at commerciallyreasonable rates,
• cost-effectiveness and performance compared to wireline or other high speed access solutions, whose pricesand performance continue to improve,
• suitability for a sufficient number of geographic regions, and
• availability of sufficient site locations for wireless access.
The factors listed above influence our customers’ purchase decisions when selecting wireless versus otherhigh-speed data access technology. Future legislation, legal decisions and regulation relating to the wirelesstelecommunications industry may slow or delay the deployment of wireless networks.
Wireless access solutions compete with other high-speed access solutions such as digital subscriber lines,cable modem technology, fiber optic cable and other high-speed wire line and satellite technologies. If the marketfor our wireless solutions fails to develop or develops more slowly than we expect due to this competition, our salesopportunities will be harmed. Many of these alternative technologies can take advantage of existing installedinfrastructure and are generally perceived to be reliable and secure. As a result, they have already achievedsignificantly greater market acceptance and penetration than wireless data access technologies. Moreover, currentwireless data access technologies have inherent technical limitations that may inhibit their widespread adoption inmany areas.
We expect wireless data access technologies to face increasing competitive pressures from both current andfuture alternative technologies. In light of these factors, many service providers may be reluctant to invest heavily inwireless data access solutions, including Wi-Fi. If service providers do not continue to establish Wi-Fi “hot spots,”we may not be able to generate sales for our Wi-Fi products and our revenue may decline.
Our wireless business is dependent upon the continued growth of evolving telecommunications andinternet industries.
Our future success is dependent upon the continued growth of the data communications and wirelessindustries, particularly with regard to Internet usage. The global data communications and Internet industriesare relatively new and evolving rapidly and it is difficult to predict potential growth rates or future trends intechnology development for these industries. The deregulation, privatization and economic globalization of theworldwide telecommunications market that have resulted in increased competition and escalating demand for newtechnologies and services may not continue in a manner favorable to us or our business strategies. In addition, thegrowth in demand for wireless and Internet services, and the resulting need for high speed or enhanced datacommunications products and wireless systems, may not continue at its current rate or at all.
Our future success depends on our ability to develop and successfully introduce new and enhancedproducts for the wireless market, which meet the needs of customers.
Our revenue depends on our ability to anticipate our existing and prospective customers’ needs and developproducts that address those needs. Our future success will depend on our ability to introduce new products for thewireless market, anticipate improvements and enhancements in wireless technology and wireless standards, and todevelop products that are competitive in the rapidly changing wireless industry. Introduction of new products andproduct enhancements will require coordination of our efforts with those of our customers, suppliers, andmanufacturers to rapidly achieve volume production. If we fail to coordinate these efforts, develop productenhancements or introduce new products that meet the needs of our customers as scheduled, our operating resultswill be materially and adversely affected and our business and prospects will be harmed. We cannot assure you thatproduct introductions will meet the anticipated release schedules or that our wireless products will be competitive inthe market. Furthermore, given the emerging nature of the wireless market, there can be no assurance our productsand technology will not be rendered obsolete by alternative or competing technologies.
6

We may experience integration or other problems with potential acquisitions, which could have anadverse effect on our business or results of operations. New acquisitions could dilute the interests ofexisting stockholders, and the announcement of new acquisitions could result in a decline in the price ofour common stock.
We may in the future make acquisitions of, or large investments in, businesses that offer products, services, andtechnologies that we believe would complement our products or services, including wireless products andtechnology. We may also make acquisitions of, or investments in, businesses that we believe could expand ourdistribution channels. Even if we were to announce an acquisition, we may not be able to complete it. Additionally,any future acquisition or substantial investment would present numerous risks, including:
• difficulty in integrating the technology, operations, internal accounting controls or work force of theacquired business with our existing business,
• disruption of our on-going business,
• difficulty in realizing the potential financial or strategic benefits of the transaction,
• difficulty in maintaining uniform standards, controls, procedures and policies,
• dealing with tax, employment, logistics, and other related issues unique to international organizations andassets we acquire,
• possible impairment of relationships with employees and customers as a result of integration of newbusinesses and management personnel, and
• impairment of assets related to resulting goodwill, and reductions in our future operating results fromamortization of intangible assets.
We expect that future acquisitions could provide for consideration to be paid in cash, shares of our commonstock, or a combination of cash and our common stock. If consideration for a transaction is paid in common stock,this would further dilute our existing stockholders.
Our gross profit may vary based on the mix of sales of our products and licenses of our intellectualproperty, and these variations may cause our net income to decline.
We derive a portion of our sales from our software-based connectivity products. Due in part to the competitivepricing pressures that affect our products and in part to increasing component and manufacturing costs, we expectgross profit from both existing and future products to decrease over time. In addition, licensing revenues from ourintellectual property historically have provided higher margins than our product sales. Changes in the mix ofproducts sold and the percentage of our sales in any quarter attributable to products as compared to licensingrevenues could cause our quarterly results to vary and could result in a decrease in gross profit and net income.
Any delays in our normally lengthy sales cycles could result in customers canceling purchases of ourproducts.
Sales cycles for our products with major customers are lengthy, often lasting nine months or longer. Inaddition, it can take an additional nine months or more before a customer commences volume production ofequipment that incorporates our products. Sales cycles with our major customers are lengthy for a number ofreasons, including:
• our original equipment manufacturer customers and carriers usually complete a lengthy technical evaluationof our products, over which we have no control, before placing a purchase order,
• the commercial introduction of our products by an original equipment manufacturer and carriers is typicallylimited during the initial release to evaluate product performance, and
• the development and commercial introduction of products incorporating new technologies frequently aredelayed.
7

A significant portion of our operating expenses is relatively fixed and is based in large part on our forecasts ofvolume and timing of orders. The lengthy sales cycles make forecasting the volume and timing of product ordersdifficult. In addition, the delays inherent in lengthy sales cycles raise additional risks of customer decisions tocancel or change product phases. If customer cancellations or product changes were to occur, this could result in theloss of anticipated sales without sufficient time for us to reduce our operating expenses.
Our revenues and operating results may fluctuate each quarter due to both domestic and internationalseasonal trends.
The MSG market is in the initial market stages and has yet to display discernable revenue patterns by quarter.Revenue for the BTG market follows the seasonal capital spending patterns of the wireless network operators andOEM’s. Revenue for BTG within each fiscal year is historically seasonal, with a trend of the first quarter typicallybeing the lowest and the fourth quarter typically being the highest. These seasonality trends will cause our revenuesand operating results to vary from quarter to quarter.
We rely on independent companies to manufacture, assemble and test our products. If these companiesdo not meet their commitments to us, our ability to sell products to our customers would be impaired.
We have limited manufacturing capability. For some product lines we outsource the manufacturing, assembly,and testing of printed circuit board subsystems. For other product lines, we purchase completed hardware platformsand add our proprietary software. While there is no unique capability with these suppliers, any failure by thesesuppliers to meet delivery commitments would cause us to delay shipments and potentially be unable to accept neworders for product.
In addition, in the event that these suppliers discontinued the manufacture of materials used in our products, wewould be forced to incur the time and expense of finding a new supplier or to modify our products in such a way thatsuch materials were not necessary. Either of these alternatives could result in increased manufacturing costs andincreased prices of our products.
We assemble our antenna products in our facilities located in Illinois and China. We may experience delays,disruptions, capacity constraints or quality control problems at our assembly facilities, which could result in loweryields or delays of product shipments to our customers. In addition, we are having an increasing number of ourantenna products manufactured in China and Russia via contract manufacturers. Any disruption of our own orcontract manufacturers’ operations could cause us to delay product shipments, which would negatively impact oursales, competitive reputation and position. In addition, if we do not accurately forecast demand for our products, wewill have excess or insufficient parts to build our product, either of which could seriously affect our operatingresults.
In order for us to operate at a profitable level and continue to introduce and develop new products foremerging markets, we must attract and retain our executive officers and qualified technical, sales, sup-port and other administrative personnel.
Our performance is substantially dependent on the performance of our current executive officers and certainkey engineering, sales, marketing, financial, technical and customer support personnel. If we lose the services of ourexecutives or key employees, replacements could be difficult to recruit and, as a result, we may not be able to growour business.
Competition for personnel, especially qualified engineering personnel, is intense. We are particularlydependent on our ability to identify, attract, motivate and retain qualified engineers with the requisite education,background and industry experience. As of December 31, 2006, we employed a total of 102 people in ourengineering department. If we lose the services of one or more of our key engineering personnel, our ability tocontinue to develop products and technologies responsive to our markets may be impaired.
8

Failure to manage our technological and product growth could strain our management, financial andadministrative resources.
Our ability to successfully sell our products and implement our business plan in rapidly evolving marketsrequires an effective management planning process. Future product expansion efforts could be expensive and put astrain on our management by significantly increasing the scope of their responsibilities and by increasing thedemands on their management abilities. To effectively manage our growth in these new technologies, we mustenhance our marketing, sales, research and development areas.
We may be subject to litigation regarding intellectual property associated with our wireless business andthis could be costly to defend and could prevent us from using or selling the challenged technology.
In recent years, there has been significant litigation in the United States involving intellectual property rights.We have from time to time in the past received correspondence from third parties alleging that we infringe the thirdparty’s intellectual property rights. We expect potential claims to increase in the future, including with respect to ourwireless business. Intellectual property claims against us, and any resulting lawsuit, may result in our incurringsignificant expenses and could subject us to significant liability for damages and invalidate what we currentlybelieve are our proprietary rights. These lawsuits, regardless of their merits or success, would likely be time-consuming and expensive to resolve and could divert management’s time and attention. This could have a materialand adverse effect on our business, results of operation, financial condition and prospects. Any potential intellectualproperty litigation against us related to our wireless business could also force us to do one or more of the following:
• cease selling, incorporating or using technology, products or services that incorporate the infringedintellectual property,
• obtain from the holder of the infringed intellectual property a license to sell or use the relevant technology,which license may not be available on acceptable terms, if at all, or
• redesign those products or services that incorporate the disputed intellectual property, which could result insubstantial unanticipated development expenses.
If we are subject to a successful claim of infringement related to our wireless intellectual property and we failto develop non-infringing intellectual property or license the infringed intellectual property on acceptable terms andon a timely basis, operating results could decline and our ability to grow and sustain our wireless business could bematerially and adversely affected. As a result, our business, financial condition, results of operation and prospectscould be impaired.
We may in the future initiate claims or litigation against third parties for infringement of our intellectualproperty rights or to determine the scope and validity of our proprietary rights or the proprietary rights of ourcompetitors. These claims could also result in significant expense and the diversion of technical and managementpersonnel’s attention.
Undetected software errors or failures found in new products may result in a loss of customers or adelay in market acceptance of our products.
Our products may contain undetected software errors or failures when first introduced or as new versions arereleased. To date, we have not been made aware of any significant software errors or failures in our products.However, despite testing by us and by current and potential customers, errors may be found in new products aftercommencement of commercial shipments, resulting in loss of customers or delay in market acceptance.
Our financial position and results of operations may be adversely affected if tax authorities challenge usand the tax challenges result in unfavorable outcomes.
We currently have international subsidiaries located in Japan, China, Ireland, United Kingdom, Serbia, andIsrael as well as an international branch office located in Hong Kong. The complexities resulting from operating inseveral different tax jurisdictions increase our exposure to worldwide tax challenges.
9

Conducting business in international markets involves foreign exchange rate exposure that may lead toreduced profitability.
We have operations in Ireland, United Kingdom, Japan, Serbia, Israel, and China. We believe that foreignexchange exposures may lead to reduced profitability.
Risks Related to Our Industry
Our industry is characterized by rapidly changing technologies. If we are not successful in responding torapidly changing technologies, our products may become obsolete and we may not be able to competeeffectively.
The wireless data access business is characterized by rapidly changing technologies, short product life cyclesand frequent new product introductions. To remain competitive, we must continue to successfully introduce newproducts.
Both the cellular (2.5G and 3G) and Wi-Fi (802.11, WiMAX) spaces are rapidly changing and prone tostandardization. We must continue to evaluate, develop and introduce technologically advanced products that willposition us for possible growth in the wireless data access market. If we are not successful in doing so, our productsmay became obsolete and we may not be able to compete effectively.
Changes in laws or regulations, in particular, future FCC Regulations affecting the broadband market,internet service providers, or the communications industry, could negatively affect our ability to developnew technologies or sell new products and therefore, reduce our profitability.
The jurisdiction of the Federal Communications Commission, or FCC, extends to the entire communicationsindustry, including our customers and their products and services that incorporate our products. Future FCCregulations affecting the broadband access services industry, our customers or our products may harm our business.For example, future FCC regulatory policies that affect the availability of data and Internet services may impede ourcustomers’ penetration into their markets or affect the prices that they are able to charge. In addition, FCCregulatory policies that affect the specifications of wireless data devices may impede certain of our customers’ability to manufacture their products profitably, which could, in turn, reduce demand for our products. Furthermore,international regulatory bodies are beginning to adopt standards for the communications industry. Although ourbusiness has not been hurt by any regulations to date, in the future, delays caused by our compliance with regulatoryrequirements may result in order cancellations or postponements of product purchases by our customers, whichwould reduce our profitability.
Risks Related to our Common Stock
The trading price of our stock price may be volatile based on a number of factors, some of which arenot in our control.
The trading price of our common stock has been highly volatile. The common stock price has fluctuated from alow of $7.44 to a high of $11.64 during 2006. Our stock price could be subject to wide fluctuations in response to avariety of factors, many of which are out of our control, including:
• announcements of technological innovations,
• new products or services offered by us or our competitors,
• actual or anticipated variations in quarterly operating results,
• changes in financial estimates by securities analysts,
• conditions or trends in our industry,
• our announcement of significant acquisitions, strategic partnerships, joint ventures or capital commitments,
• additions or departures of key personnel,
10

• mergers and acquisitions, and
• sales of common stock by our stockholders or us.
In addition, the NASDAQ Global Market, where many publicly held telecommunications companies,including PCTEL, are traded, often experiences extreme price and volume fluctuations. These fluctuations oftenhave been unrelated or disproportionate to the operating performance of these companies. In the past, followingperiods of volatility in the market price of an individual company’s securities, securities class action litigation oftenhas been instituted against that company. This type of litigation, if instituted, could result in substantial costs and adiversion of management’s attention and resources.
Provisions in our charter documents may inhibit a change of control or a change of management, whichmay cause the market price for our common stock to fall and may inhibit a takeover or change in ourcontrol that a stockholder may consider favorable.
Provisions in our charter documents could discourage potential acquisition proposals and could delay orprevent a change in control transaction that our stockholders may favor. These provisions could have the effect ofdiscouraging others from making tender offers for our shares, and as a result, these provisions may prevent themarket price of our common stock from reflecting the effects of actual or rumored takeover attempts and mayprevent stockholders from reselling their shares at or above the price at which they purchased their shares. Theseprovisions may also prevent changes in our management that our stockholders may favor. Our charter documents donot permit stockholders to act by written consent, do not permit stockholders to call a stockholders meeting, andprovide for a classified board of directors, which means stockholders can only elect, or remove, a limited number ofour directors in any given year.
Our board of directors has the authority to issue up to 5,000,000 shares of preferred stock in one or more series.The board of directors can fix the price, rights, preferences, privileges and restrictions of this preferred stockwithout any further vote or action by our stockholders. The rights of the holders of our common stock will beaffected by, and may be adversely affected by, the rights of the holders of any preferred stock that may be issued inthe future. Further, the issuance of shares of preferred stock may delay or prevent a change in control transactionwithout further action by our stockholders. As a result, the market price of our common stock may drop.
Under regulations required by the Sarbanes-Oxley Act of 2002, if we are unable to successfullyimplement processes and procedures to achieve and maintain effective internal control over ourfinancial reporting, our ability to provide reliable and timely financial reports could be harmed.
We must comply with the rules promulgated under section 404 of the Sarbanes-Oxley Act of 2002. Section 404requires an annual management report assessing the effectiveness of our internal control over financial reporting, areport by our independent registered public accounting firm addressing this assessment, and a report by ourindependent registered public accounting firm addressing the effectiveness of our internal control.
While we are expending significant resources in developing the necessary documentation and testingprocedures required by Section 404, we cannot be certain that the actions we are taking to improve, achieveand maintain our internal control over financial reporting will be adequate or that we will be able to implement ourplanned processes and procedures. If we do not complete our compliance activities under Section 404 in a timelymanner, or the processes and procedures that we implement for our internal control over financial reporting areinadequate, our ability to provide reliable and timely financial reports, and consequently our business and operatingresults, could be harmed. This in turn could result in an adverse reaction in the financial markets due to a loss ofconfidence in the reliability of our financial reports, which could cause the market price of our common stock todecline.
Item 1B: Unresolved Staff Comments
None
11
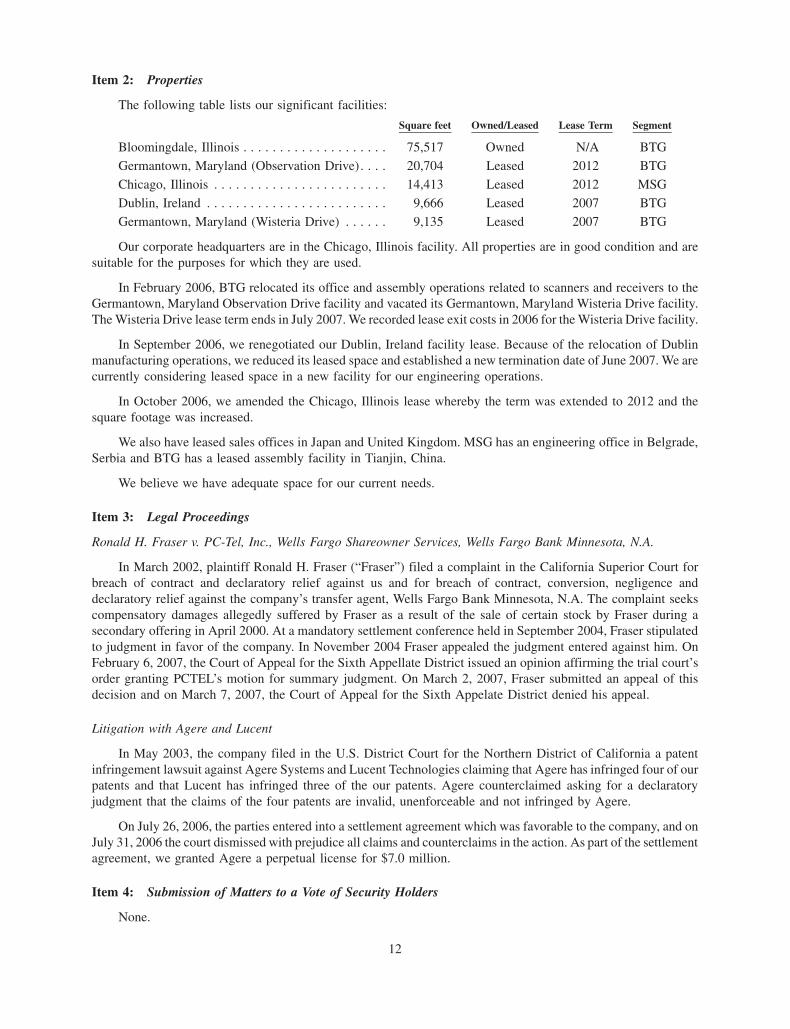
Item 2: Properties
The following table lists our significant facilities:
Square feet Owned/Leased Lease Term Segment
Bloomingdale, Illinois . . . . . . . . . . . . . . . . . . . . 75,517 Owned N/A BTG
Germantown, Maryland (Observation Drive). . . . 20,704 Leased 2012 BTG
Chicago, Illinois . . . . . . . . . . . . . . . . . . . . . . . . 14,413 Leased 2012 MSG
Dublin, Ireland . . . . . . . . . . . . . . . . . . . . . . . . . 9,666 Leased 2007 BTG
Germantown, Maryland (Wisteria Drive) . . . . . . 9,135 Leased 2007 BTG
Our corporate headquarters are in the Chicago, Illinois facility. All properties are in good condition and aresuitable for the purposes for which they are used.
In February 2006, BTG relocated its office and assembly operations related to scanners and receivers to theGermantown, Maryland Observation Drive facility and vacated its Germantown, Maryland Wisteria Drive facility.The Wisteria Drive lease term ends in July 2007. We recorded lease exit costs in 2006 for the Wisteria Drive facility.
In September 2006, we renegotiated our Dublin, Ireland facility lease. Because of the relocation of Dublinmanufacturing operations, we reduced its leased space and established a new termination date of June 2007. We arecurrently considering leased space in a new facility for our engineering operations.
In October 2006, we amended the Chicago, Illinois lease whereby the term was extended to 2012 and thesquare footage was increased.
We also have leased sales offices in Japan and United Kingdom. MSG has an engineering office in Belgrade,Serbia and BTG has a leased assembly facility in Tianjin, China.
We believe we have adequate space for our current needs.
Item 3: Legal Proceedings
Ronald H. Fraser v. PC-Tel, Inc., Wells Fargo Shareowner Services, Wells Fargo Bank Minnesota, N.A.
In March 2002, plaintiff Ronald H. Fraser (“Fraser”) filed a complaint in the California Superior Court forbreach of contract and declaratory relief against us and for breach of contract, conversion, negligence anddeclaratory relief against the company’s transfer agent, Wells Fargo Bank Minnesota, N.A. The complaint seekscompensatory damages allegedly suffered by Fraser as a result of the sale of certain stock by Fraser during asecondary offering in April 2000. At a mandatory settlement conference held in September 2004, Fraser stipulatedto judgment in favor of the company. In November 2004 Fraser appealed the judgment entered against him. OnFebruary 6, 2007, the Court of Appeal for the Sixth Appellate District issued an opinion affirming the trial court’sorder granting PCTEL’s motion for summary judgment. On March 2, 2007, Fraser submitted an appeal of thisdecision and on March 7, 2007, the Court of Appeal for the Sixth Appelate District denied his appeal.
Litigation with Agere and Lucent
In May 2003, the company filed in the U.S. District Court for the Northern District of California a patentinfringement lawsuit against Agere Systems and Lucent Technologies claiming that Agere has infringed four of ourpatents and that Lucent has infringed three of the our patents. Agere counterclaimed asking for a declaratoryjudgment that the claims of the four patents are invalid, unenforceable and not infringed by Agere.
On July 26, 2006, the parties entered into a settlement agreement which was favorable to the company, and onJuly 31, 2006 the court dismissed with prejudice all claims and counterclaims in the action. As part of the settlementagreement, we granted Agere a perpetual license for $7.0 million.
Item 4: Submission of Matters to a Vote of Security Holders
None.
12

Additional Item: Executive Officers of the Registrant
The following table sets forth information with respect to our executive officers as of March 1, 2007:
Name Age Position
Martin H. Singer . . . . . . . . . 55 Chief Executive Officer, Chairman of the Board
John Schoen . . . . . . . . . . . . 51 Chief Financial Officer and SecretaryJeffrey A. Miller . . . . . . . . .
51Vice President and General Manager, Broadband TechnologyGroup
Biju Nair . . . . . . . . . . . . . . .41
Vice President and General Manager, Mobility SolutionsGroup
Steven L. Deppe . . . . . . . . . 58 Executive Vice President, Strategy and Business Development
Dr. Singer has been our Chief Executive Officer and Chairman of the Board since October 2001. Prior to that,Dr. Singer served as our non-executive Chairman of the Board from February 2001 until October 2001, and he hasbeen a director since August 1999. From October 2000 to May 2001, Dr. Singer was an independent consultant.From December 1997 to August 2000, Dr. Singer served as President and Chief Executive Officer of SAFCOTechnologies, a wireless communications company. He left SAFCO in August 2000 after its sale to AgilentTechnologies. From September 1994 to December 1997, Dr. Singer served as Vice President and General Managerof the wireless access business development division for Motorola, a communications equipment company. Prior tothis period, Dr. Singer held senior management and technical positions in Motorola, Tellabs, AT&T and Bell Labs.Dr. Singer holds a Bachelor of Arts degree in psychology from the University of Michigan, and a Master of Artsdegree and a Ph.D. in experimental psychology from Vanderbilt University. Dr. Singer currently serves as theChairman of the Midwest council of the AeA (American Electronics Association). He is also on the advisory boardfor the Master of Management & Manufacturing program at Northwestern University (Kellogg) and serves on thestanding advisory group for the Public Company Accounting Oversight Board, the organization established tomanage the implementation of the Sarbanes-Oxley Act of 2002. Dr. Singer has 7 patents in telecommunications.
Mr. John Schoen has been the Chief Financial Officer and Secretary since November 2001. Prior to that,Mr. Schoen was a Business Development Manager at Agilent Technologies, Inc. from July 2000 to November 2001.From May 1999 to July 2000, Mr. Schoen served as Chief Operating Officer and Chief Financial Officer of SAFCOTechnologies, Inc. before its acquisition by Agilent Technologies Inc. Prior to this period, Mr. Schoen held variousfinancial positions for over 19 years in Motorola Inc., including Controller of its Wireless Access BusinessDevelopment Division. Mr. Schoen received a Bachelor of Science in Accounting from DePaul University and is aCertified Public Accountant.
Mr. Jeffrey A. Miller has been the Vice President and General Manager of Broadband Technology Group sinceOctober 2006. Prior to that, Mr. Miller was Vice President of Global Sales since July 2004 before taking on hisBroadband Technology Group role. Mr. Miller was Vice President of Business Development and Licensing fromJanuary 2003 before taking on his Global Sales role. Prior to that position, in September 2002 Mr. Miller wasappointed Vice President of Product Management & New Technology. From November 2001 when he joinedPCTEL, until September of 2002, Mr. Miller was Vice President of Engineering. Prior to joining PCTEL, Mr. Millerwas Functional Manager of Wireless Optimization Products, Wireless Network Test Division of Agilent Tech-nologies Inc. from July 2000 to November 2001. From January 1998 to July 2000, Mr. Miller served as VicePresident of Engineering of SAFCO Technologies, Inc. and led its Test and Measurement Group before itsacquisition by Agilent Technologies Inc. From September 1992 to January 1998, Mr. Miller was a PrincipalConsultant with Malcolm, Miller & Associates providing consulting services to wireless network operators andinfrastructure suppliers. From 1978 through September of 1992, Mr. Miller held various technical and managementpositions at Motorola, Inc.’s Cellular Infrastructure Group. Mr. Miller received a Bachelor of Science in ComputerScience from University of Illinois.
Mr. Biju Nair has been the Vice President and General Manager of the Mobility Solutions Group since May2003. Prior to that position, in September 2002 Mr. Nair was appointed the Vice President of Product Development.From January 2002, when he joined PCTEL, until September 2002, Mr. Nair served as the Director & GeneralManager, Wireless Products. Prior to joining PCTEL, Mr. Nair served, from July 2000 to January 2002, as the
13

Global Manager of Wireless Planning, Design and Management solutions at Agilent Technologies. Prior to itsacquisition by Agilent Technologies, Mr. Nair served from April 1994 to July 2000 as Vice President and GeneralManager of Global Software Products at SAFCO Technologies in Chicago. In that capacity, he designed OPAS, theindustry’s leading wireless post processing software and led the launch of its VoicePrint test and measurementproduct. Mr. Nair holds B.S and M.S degrees in Electronics and Computer Engineering and an advanced degree inComputer Science from Illinois Institute of Technology in Chicago. Mr. Nair is the author of numerous publicationsfor the wireless industry and has presented technical papers at major wireless seminars and panels.
Mr. Steven L. Deppe has been Executive Vice President, Business Development since October 2006. Prior tothat position, Mr. Deppe was Vice President and General Manager of the Antenna Products Group. Mr. Deppe heldthat position since joining PCTEL in January 2004. Prior to joining PCTEL, Mr. Deppe was President and CEO ofMAXRAD, Inc. since 1996.
PART II
Item 5: Market for Registrant’s Common Equity and Related Stockholder Matters and Issuer Purchasesof Equity Securities
Price Range of Common Stock
Our common stock has been traded on the NASDAQ Global Market under the symbol PCTI since our initialpublic offering on October 19, 1999. The following table shows the high and low sale prices of our common stock asreported by the NASDAQ Global Market for the periods indicated.
High Low
Fiscal 2006:Fourth Quarter . . . . . . . . . . . . . . . . . . . . . . . . . . . . . . . . . . . . . . . . . . . . . . . . . $11.49 $8.61
Third Quarter . . . . . . . . . . . . . . . . . . . . . . . . . . . . . . . . . . . . . . . . . . . . . . . . . . $11.25 $8.26
Second Quarter . . . . . . . . . . . . . . . . . . . . . . . . . . . . . . . . . . . . . . . . . . . . . . . . . $11.64 $8.50
First Quarter . . . . . . . . . . . . . . . . . . . . . . . . . . . . . . . . . . . . . . . . . . . . . . . . . . . $ 9.76 $7.44
Fiscal 2005:Fourth Quarter . . . . . . . . . . . . . . . . . . . . . . . . . . . . . . . . . . . . . . . . . . . . . . . . . $10.16 $8.60
Third Quarter . . . . . . . . . . . . . . . . . . . . . . . . . . . . . . . . . . . . . . . . . . . . . . . . . . $ 9.46 $7.77
Second Quarter . . . . . . . . . . . . . . . . . . . . . . . . . . . . . . . . . . . . . . . . . . . . . . . . . $ 8.17 $6.70
First Quarter . . . . . . . . . . . . . . . . . . . . . . . . . . . . . . . . . . . . . . . . . . . . . . . . . . . $ 8.33 $6.97
The closing sale price of our common stock as reported on the NASDAQ Global Market on March 1, 2007 was$10.55 per share. As of that date there were 43 holders of record of the common stock.
14

Five-Year Cumulative Total Return Comparison
Notwithstanding any statement to the contrary in any of our previous or future filings with the SEC, thiscompany performance graph shall not be deemed “filed” with the SEC or “soliciting material” under the ExchangeAct and shall not be incorporated by reference in any such filings.
The graph below compares the annual percentage change in the cumulative return to our stockholders with thecumulative return of the Nasdaq Composite Index and the S&P information Technology Index for the periodbeginning December 31, 2001 and ending December 31, 2006. Returns for the indices are weighted based on marketcapitalization at the beginning of each measurement point. Note that historic stock price performance is notnecessarily indicative of future stock price performance.
$0
$20
$40
$60
$80
$100
$120
$140
PCTEL, Inc. NASDAQ Composite S & P Information Technology
12/0612/0512/0412/0312/0212/01
Dividends
We have never declared or paid cash dividends on the capital stock. We currently intend to retain all of theearnings, if any, for use in the business and does not anticipate paying any cash dividends in the foreseeable future.
Unregistered Sales of Equity Securities
None.
15

Securities Authorized for Issuance Under Equity Compensation Plans
Our shareholders have previously approved all stock option under our common stock reserved for issuance.The following table provided summary information as of December 31, 2006 for all stock option plans.
Number of Shares ofCommon Stock to
be Issued uponExercise of
OutstandingOptions
WeightedAverage
Exercise Priceof Outstanding
Options
Number of Shares ofCommon Stock
Remaining Availablefor Future Issuance
under our StockOption Plans
Approved by Shareholders . . . . . . . . . . . . . 3,965,627 $9.63 8,089,441
Not Approved by Shareholders. . . . . . . . . . — — —
3,965,627 $9.63 8,089,441
Issuer Purchases of Equity Securities
The following table provides the activity of our repurchase program during the three months ended Decem-ber 31, 2006:
Total Numberof Shares
AveragePrice PaidPer Share
Total Number ofShares Purchasedas Part of Publicly
Announced Program
Maximum Numberof Shares That May
Yet Be PurchasedUnder the Program
October 1, 2006 -October 31, 2006 . . . . . . . . . . . . . . . . . — — 2,086,900 413,100
November 1, 2006 -November 30, 2006 . . . . . . . . . . . . . . . 227,100 9.40 2,314,000 186,000
December 1, 2006 -December 31, 2006 . . . . . . . . . . . . . . . — — 2,314,000 186,000
In August 2002, the Board of Directors authorized the repurchase of up to 1,000,000 shares of the commonstock, which was completed in February 2003. In February and November 2003, we extended the stock repurchaseprogram to repurchase up to 1,000,000 and 500,000 additional shares, respectively, on the open market from time totime. The extensions of the stock repurchase program were announced in the Quarterly Report on Form 10-Q for thequarterly period ended March 31, 2003 and in the Annual Report on Form 10-K for the period ended December 31,2003, respectively. As of December 31, 2006, we had repurchased 2,314,000 shares from the total 2,500,000 sharesauthorized to be repurchased.
16

Item 6: Selected Consolidated Financial Data
The following selected consolidated financial data should be read in conjunction with “Management’sDiscussion and Analysis of Financial Condition and Results of Operations,” the Consolidated Financial Statementsand related notes and other financial information appearing elsewhere in this Form 10-K. The statement ofoperations data for the years ended December 31, 2006, 2005, and 2004 and the balance sheet data as ofDecember 31, 2006 and 2005 are derived from audited financial statements included elsewhere in this Form 10-K.The statement of operations data for the years ended December 31, 2003 and 2002 and the balance sheet data as ofDecember 31, 2004, 2003, and 2002 are derived from audited financial statements not included in this Form 10-K.
2006 2005 2004 2003 2002Years Ended December 31,
(in thousands, except per share data)
Consolidated Statement of Operations Data:Revenues . . . . . . . . . . . . . . . . . . . . . . . . . . . . . $ 86,562 $ 77,746 $ 48,221 $ 45,600 $ 48,779
Cost of revenues . . . . . . . . . . . . . . . . . . . . . . . . $ 39,990 40,878 19,786 13,464 27,841
Modem inventory recovery . . . . . . . . . . . . . . . . — — (3,208) (1,800) (7,221)
Gross profit . . . . . . . . . . . . . . . . . . . . . . . . . . . 46,572 36,868 31,643 33,936 28,159
Operating expenses:
Research and development . . . . . . . . . . . . . . 13,762 10,015 8,614 7,895 10,129
Sales and marketing . . . . . . . . . . . . . . . . . . . 13,287 13,074 11,247 7,725 7,821
General and administrative . . . . . . . . . . . . . . 14,127 16,836 15,416 11,036 5,835
Impairment of goodwill and intangibleassets . . . . . . . . . . . . . . . . . . . . . . . . . . . . 20,349 — — — —
Acquired in-process research anddevelopment . . . . . . . . . . . . . . . . . . . . . . . — — — 1,100 102
Amortization of other intangible assets . . . . . 3,593 4,137 2,972 1,124 88Restructuring charges, net . . . . . . . . . . . . . . . 389 (70) (66) 3,462 850
Gain on sale of assets and related royalties . . (1,000) (2,100) (2,000) (5,476) —
Total operating expenses . . . . . . . . . . . . . . 64,507 41,892 36,183 26,866 24,825
Income (loss) from operations . . . . . . . . . . . . . . (17,935) (5,024) (4,540) 7,070 3,334
Other income, net . . . . . . . . . . . . . . . . . . . . . . . 3,303 1,546 1,261 1,383 3,254
Income (loss) before provision (benefit) forincome taxes. . . . . . . . . . . . . . . . . . . . . . . . . (14,632) (3,478) (3,279) 8,453 6,588
Provision (benefit) for income taxes . . . . . . . . . (4,613) 235 (541) 2,575 435
Net income (loss) . . . . . . . . . . . . . . . . . . . . . . . (10,019) $ (3,713) $ (2,738) $ 5,878 $ 6,153
Basic earnings (loss) per share . . . . . . . . . . . . . $ (0.48) $ (0.18) $ (0.14) $ 0.29 $ 0.31
Shares used in computing basic earnings (loss)per share . . . . . . . . . . . . . . . . . . . . . . . . . . . 20,810 20,146 20,074 20,145 19,806
Diluted earnings (loss) per share . . . . . . . . . . . . $ (0.48) $ (0.18) $ (0.14) $ 0.28 $ 0.31
Shares used in computing diluted earnings(loss) per share . . . . . . . . . . . . . . . . . . . . . . . 20,810 20,146 20,074 20,975 20,004
Consolidated Balance Sheet Data:Cash, cash equivalents and short-term
investments . . . . . . . . . . . . . . . . . . . . . . . . . . $ 59,148 $ 58,966 $ 83,887 $125,184 $111,391
Working capital . . . . . . . . . . . . . . . . . . . . . . . . 84,379 69,695 88,621 112,689 106,618
Total assets . . . . . . . . . . . . . . . . . . . . . . . . . . . 132,720 144,505 142,105 143,241 129,426
Total stockholders’ equity . . . . . . . . . . . . . . . . . 120,693 124,027 122,923 122,906 112,553
17

Item 7: Management’s Discussion and Analysis of Financial Condition and Results of Operations
This report contains forward-looking statements within the meaning of Section 27A of the Securities Act of1933 and Section 21E of the Securities Exchange Act of 1934. These statements include, among other things,statements concerning the future operations, financial condition and prospects, and business strategies. The words“believe,” “expect,” “anticipate” and other similar expressions generally identify forward-looking statements.Investors in the common stock are cautioned not to place undue reliance on these forward-looking statements. Theseforward-looking statements are subject to substantial risks and uncertainties that could cause the future business,financial condition, or results of operations to differ materially from the historical results or currently anticipatedresults. Investors should carefully review the information contained in “Item 1A: Risk Factors” and elsewhere in, orincorporated by reference into, this report.
Introduction
PCTEL focuses on wireless broadband mobility. We design and develop innovative antennas that extend thereach of broadband and other wireless networks and that simplify the implementation of those networks. Weprovide highly specialized software-defined radios that facilitate the design and optimization of broadband wirelessnetworks and we develop software that simplifies and secures wireless access to the network. We provide ourproducts, both software and RF products, to wireless and private carriers, wireless infrastructure and handsetproviders, wireless equipment distributors, VARs and other OEMs. Additionally, the company licenses itsintellectual property, principally related to a discontinued modem business, to semiconductor, PC manufacturers,modem suppliers, and others.
The company operates in three separate product segments: a Broadband Technology Group, the MobilitySolutions Group, and Licensing. PCTEL maintains expertise in several technology areas. These include DSPchipset programming, Radio Frequency, software engineering, mobile device operating systems, antenna designand manufacture, mechanical engineering, wireless connectivity, authentication, security, specialized communi-cation devices, advanced algorithm development, and cellular engineering. In 2006, we reorganized from foursegments to three segments. The revenues and gross profits by segment have been restated to reflect our currentsegment reporting structure.
Growth in product revenue is dependent both on gaining further revenue traction in the existing product profileas well as further acquisitions to support the wireless initiatives. Revenue growth for antenna products is correlatedto emerging wireless applications in broadband wireless, in-building wireless, wireless Internet service providers,GPS and Mobile SATCOM. The LMR, PMR, DPMR and on-glass mobile antenna applications represent maturemarkets. Revenue for scanners and receivers is tied to the deployment of new wireless technology, such as 2.5G and3G, and the need for existing wireless networks to be tuned and reconfigured on a regular basis. Revenue growth inthe MSG segment is correlated to the success of data services offered by the customer base. The roll out of such dataservices is in the early stage of market development.
Licensing revenue is dependent on the signing of new license agreements and the success of the licensees in themarketplace. New licenses often contain up front payments pertaining to past royalty liability, or one time paymentsif the license is perpetual. This can make licensing revenue uneven. During 2006, we were successful in licensingour modem technology to what we believe is the last of the significant users of our modem technology that are notalready under license. Management anticipates that licensing revenue will decline in 2007 to approximately$1.0 million or less and shrink significantly from there in 2008 and beyond.
18

Results of Operations
Years ended December 31, 2006, 2005 and 2004(All amounts in tables, other than percentages, are in thousands)
RevenuesBTG MSG Licensing Modems Total
Revenue 2006 . . . . . . . . . . . . . . . . . . . . . . . . $68,088 $9,793 $8,681 — $86,562
% change from year ago period . . . . . . . . . . . (1)% 41% 279% n/a 11%
Revenue 2005 . . . . . . . . . . . . . . . . . . . . . . . . $68,535 $6,922 $2,289 — $77,746
% change from year ago period . . . . . . . . . . . 84% 35% (61)% n/a 61%
Revenue 2004 . . . . . . . . . . . . . . . . . . . . . . . . $37,156 $5,129 $5,936 — $48,221
% change from year ago period . . . . . . . . . . . 361% 228% (68)% n/a 6%
BTG revenues were $68.1 million in 2006, down 1% compared to 2005. Within BTG in 2006, revenuesdeclined for antenna products, but increased for OEM receivers. Antenna revenues declined in 2006 from acombination of exiting certain product lines as well as 2005 containing revenue related to non-repeatable events,such as public safety spending and satellite radio demonstration systems. The 2006 revenue growth for receivers isdue to the roll out of UMTS networks and the related need for 3G scanners. We also grew revenues from carriers inneed of greater capacity from their existing infrastructure. Our receiver products enable cellular network engineersto optimize the performance of the current networks.
BTG revenues were $68.5 million in 2005, an increase of 84% compared with 2004. The increase in 2005 isattributable to organic growth in both antennas and receivers, having the antenna product lines from AndrewCorporation for a full fiscal year, and the addition of the iVET antenna products ($4.0 million) since July 2005.Organic antenna products benefited from revenue growth related to what turned out to be non-repeatable events,such as public safety spending from Hurricane Katrina. The 2005 organic receiver growth is due to the roll out ofUMTS networks and the related need for 3G scanners. We also grew revenues from carriers in need of greatercapacity from their existing infrastructure.
MSG revenues were $9.8 million in 2006, 41% higher than 2005. In 2006, we secured additional business withVodafone, landed a major enterprise customer, fielded our Roaming Client software at eight carriers, andparticipated in 23 IMS software trials. MSG revenue in 2005 was 35% higher than 2004 due to an increase inthe number of subscribers with the carrier customer base. The MSG market is in the initial market stages in terms ofthe number of subscribers with the carrier customer base.
Licensing revenues were $8.7 million in 2006, $6.4 million higher than 2005. Licensing revenues in 2006include a perpetual license of $7.0 million for Agere. In June 2006, we granted a perpetual license to Agere for$7.0 million in conjunction with the settlement of the patent infringement litigation between the parties. See “Item 3:Legal Proceedings” for a discussion of the Agere settlement. Excluding the Agere license, licensing revenuedeclined 27% in 2006 and also declined in each of the prior two years due to the completion of older licensingagreements related to the modem technology. In 2005, we recorded license revenue from U.S. Robotics of$0.5 million as part of a patent infringement settlement, but revenue declined 61% due to decline in modemlicensing revenues. Licensing revenue is expected to continue to shrink in 2007. During 2006, thew we weresuccessful in licensing our modem technology to what we believe is the last of the significant users of its modemtechnology that are not already under license.
19

Gross Profit
BTG MSG Licensing Modems Total
Gross Profit 2006. . . . . . . . . . . . . . . . . . . . . . $28,175 $9,739 $8,658 — $46,572
Percentage of revenue . . . . . . . . . . . . . . . . . . 41% 99% 100% n/a 54%
% of revenue change from year ago period . . . 1% 2% 3% n/a 6%Gross Profit 2005. . . . . . . . . . . . . . . . . . . . . . $27,899 $6,762 $2,207 — $36,868
Percentage of revenue . . . . . . . . . . . . . . . . . . 41% 98% 96% n/a 47%
% of revenue change from year ago period . . . (7)% 1% 1% n/a (18)%
Gross Profit 2004. . . . . . . . . . . . . . . . . . . . . . $17,805 $4,937 $5,693 $3,208 $31,643
Percentage of revenue . . . . . . . . . . . . . . . . . . 48% 96% 96% n/a 66%
% of revenue change from year ago period . . . (27)% 2% (4)% n/a (9)%
Our product segments vary from each other in gross profit percent. Gross profit as a percentage of total revenuewas 54% in 2006, 47% in 2005, and 66% in 2004. The increase in margin in 2006 was due to favorable changes inthe product mix. The mix in 2006 reflects an increase in licensing and MSG revenue, as well as an increase inrevenues from the scanner product line within the BTG segment. The decline in gross profit from 2004 to 2005 wasdue to the higher mix of BTG revenues and decline in licensing revenues in 2005. Our 2004 results include norevenues for modems, but gross profit of $3.2 million related to favorable cost recoveries.
BTG margin was virtually unchanged in 2006 compared to 2005. Favorable product mix offset inventoryprovisions and manufacturing variances incurred in the Dublin antenna factory. The inventory provisions related topruning the product portfolio of some slower moving antennas within the On-Glass and GPS product lines. Thedecline in margin in 2005 from 2004 was due to the impacts of the antenna product lines acquired from Sigma andfrom Andrew Corporation compared to legacy MAXRAD products and receiver products. Sigma antenna productmargins negatively impacted the segment because of underutilized capacity. We expect long-term margins in thissegment to be in the 43% to 45% range.
MSG margin was 99% in 2006, 98% in 2005 and 96% in 2004. The cost of goods sold in the segment relatesprimarily to third party licenses included in the Roaming Client product. Increases in gross margins in 2006 and2005 correspond to increases in revenue during each of those years. We expect long-term gross profit in thissegment to be between 96% and 99%.
Licensing margin was 100% in 2006, 96% in 2005, and 96% in 2004. The increase in gross margin in 2006 isdue to the increases to revenues in 2006, while the decline in gross margin in 2005 is due to the decrease in revenuesin 2005. We expect long-term gross profit in this segment to be between 97% and 99%.
Research and Development
2006 2005 2004
Research and development . . . . . . . . . . . . . . . . . . . . . . . . . . . . . . . . $13,762 $10,015 $8,614
Percentage of revenues . . . . . . . . . . . . . . . . . . . . . . . . . . . . . . . . . . 15.9% 12.9% 17.9%
% of revenue change from prior period . . . . . . . . . . . . . . . . . . . . . . 3.0% (5.0)% 0.6%
Research and development expenses include costs for software and hardware development, prototyping,certification and pre-production costs. All costs incurred prior to establishing the technological feasibility ofcomputer software products to be sold are research and development costs and expensed as incurred in accordancewith FAS 86. No significant costs have been incurred subsequent to determining the technological feasibility.
Research and development expenses increased $3.7 million from 2005 to 2006. Approximately $0.9 million ofthe increase in 2006 expenses is due to the full year impact from the acquisition of the product lines acquired fromSigma. In addition, we invested $2.8 million in headcount and expenses for all product lines.
The increase from 2004 to 2005 is related to the acquisition of the product lines from Andrew Corporation inOctober 2004 and the product lines acquired from Sigma in July 2005.
20

Full-time equivalent employees in research and development at December 31, 2004, 2005 and 2006 were 66,69 and 102, respectively.
Sales and Marketing
2006 2005 2004
Sales and marketing. . . . . . . . . . . . . . . . . . . . . . . . . . . . . . . . . . . . $13,287 $13,074 $11,247
Percentage of revenues . . . . . . . . . . . . . . . . . . . . . . . . . . . . . . . . . 15.3% 16.8% 23.3%
% change from prior period . . . . . . . . . . . . . . . . . . . . . . . . . . . . . . (1.5)% (6.5)% 6.4%
Sales and marketing expenses include costs associated with the sales and marketing employees, salesrepresentatives, product line management, and trade show expenses.
Sales and marketing expenses increased $0.2 million from 2005 compared to 2006. There were no significantchanges between 2006 and 2005. Sales and marketing expenses increased in 2005 due to the impact of the antennaproduct acquisitions and restricted stock amortization, offsetting decreases from the closure of the Milpitas,California office and reduction of other corporate expenses.
Employees in sales and marketing at December 31, 2004, 2005, and 2006 were 40, 49 and 50, respectively.
General and Administrative
2006 2005 2004
General and administrative . . . . . . . . . . . . . . . . . . . . . . . . . . . . . . . $14,127 $16,836 $15,416
Percentage of revenues . . . . . . . . . . . . . . . . . . . . . . . . . . . . . . . . . 16.3% 21.7% 32.0%
% change from prior period . . . . . . . . . . . . . . . . . . . . . . . . . . . . . . (5.4)% (10.3)% 7.8%
General and administrative expenses include costs associated with the general management, finance, humanresources, information technology, legal, insurance, public company costs, and other operating expenses to theextent not otherwise allocated to other functions.
General and administrative expenses decreased $2.7 million in 2006 due primarily to lower litigation expensesand lower expenses for professional services. In addition, 2005 included approximately $0.8 million related totransition services for the acquisition of the product lines from Andrew Corporation and the move and dispositionfrom the Hanover Park, Illinois facility. The increase in expenses from 2004 to 2005 is due to the impact of theSigma and Andrew acquisitions and from increases in restricted stock amortization.
Employees in general and administrative functions at December 31, 2004, 2005 and 2006 were 53, 45, and 45,respectively.
Impairment of Goodwill and Other Intangible Assets
2006 2005 2004
Impairment of Goodwill and Other Intangible Assets . . . . . . . . . . . . . . . . . $20,349 — —
Percentage of revenues . . . . . . . . . . . . . . . . . . . . . . . . . . . . . . . . . . . . . . . 23.5% — —
In conjunction with the completion of the restructuring of Dublin operations, we reevaluated the carrying valueof the goodwill and intangible assets for technology and customer relationships, as required by Statement ofFinancial Accounting Standards No. 144 “Accounting for the Impairment or Disposal of Long Lived Assets” andStatement of Accounting Standards No. 142 “Goodwill and Intangible Assets”. Based on revised projections forfuture revenues, profits, and cash flows, we concluded that the carrying value of intangible assets was impaired by$6.0 million and the carrying value of the goodwill was impaired by $14.3 million. The total impairment cost wasrecorded in the third quarter of 2006. The method of determining the impairment was the same methodology usedfor our annual impairment test.
21

Amortization of other Intangible Assets
2006 2005 2004
Amortization of other intangible assets . . . . . . . . . . . . . . . . . . . . . . . . $3,593 $4,137 $2,972Percentage of revenues . . . . . . . . . . . . . . . . . . . . . . . . . . . . . . . . . . . . 4.2% 5.3% 6.2%
The amortization of intangible assets relate to the acquisitions of DTI in 2003, MAXRAD in 2004, antennaproduct lines of Andrew Corporation in 2004, and the acquisition of Sigma in 2005. The decrease in amortization in2006 is due to the impairment charge in 2006 for the intangible assets related to the product lines acquired fromSigma. The increase in amortization from 2004 to 2005 relates to the full year impact of the amortization related tothe antenna product lines from Andrew Corporation, and amortization related to the product lines acquired fromSigma in July 2005.
Restructuring Charges, net
2006 2005 2004
Restructuring charges . . . . . . . . . . . . . . . . . . . . . . . . . . . . . . . . . . . . . . . $389 $ (70) $ (66)
Percentage of revenues . . . . . . . . . . . . . . . . . . . . . . . . . . . . . . . . . . . . . . 0.4% �0.1% �0.1%
Dublin Restructuring
The 2006 restructuring expense relates to our Dublin, Ireland restructuring activity. On April 7, 2006, wereached an agreement in principle with the labor union responsible for our manufacturing and certain otherpersonnel in its Dublin, Ireland factory to discontinue the manufacture of the iVET, PMR and DPMR lines of ourantenna products at that location. The agreement was formally signed on April 20, 2006. This agreement enabled usto wind down our manufacturing operations at the Dublin facility, terminate 65 redundant employee positions,downsize its space under the current lease at this location, and reduce its pension obligations to terminated andremaining employees. Manufacturing of the lines of antenna products was relocated either to a contract manu-facturer in St. Petersburg, Russia, or to the company’s BTG facility in Bloomingdale, Illinois. The process ofwinding down manufacturing operations in Dublin and relocating the products to their new manufacturing locationswas completed in September 2006. The general and administrative support functions were eliminated in December2006.
We continue to maintain antenna research and development, as well as sales and marketing activities in asmaller space within the existing facility in Dublin. We believe that our restructuring activities will enable us toimprove the gross profit margins of the antenna product lines that were included with our acquisition of SigmaWireless Technologies in July 2005.
We incurred restructuring costs related to the discontinuation of our Dublin manufacturing operations. Thecategories of costs are: severance pay for employees whose jobs were made redundant, future minimum leasepayments through June 2007 on the existing Dublin facility which will be vacated, and, termination of the employeepension defined benefit plan. The severance, future lease payments, and a portion of the termination of theemployee pension defined benefit plan result in cash expenditures. We also incurred restructuring costs related tothe impairment of fixed assets and inventory.
For the year ended December 31, 2006, we recorded restructuring expense of $0.4 million, which included thenet benefit related to the termination of the pension plan of $2.6 million, offsetting employee severance of$1.5 million, inventory write-offs of $0.8 million, fixed asset write-offs of $0.6 million, and facility lease costs of$0.1 million.
We negotiated the terms of the pension termination with the Sigma labor union in June 2006. Under the termsof the settlement, we funded the cash shortfall in our PCTEL Europe Pension Plan as calculated by a third partyactuary less any severance amounts given to employees that exceeded 3 weeks severance for every year of service.The funding shortfall was based on pension requirements in accordance with Irish regulations. We funded pensionobligations of $0.6 million and recorded a net gain of $2.6 million on the termination.
22

Total net severance costs of approximately $1.5 million are comprised of a gross cost of $2.4 million less agovernment rebate of $0.9 million.
The write-offs for inventory related to disposals of inventory that was not compatible with the new man-ufacturing model. The fixed asset write-offs related to assets identified that are no longer required at the Dublinfacility. We downsized the facility at the end of the third quarter of 2006. The restructuring expense for leasetermination costs relates to the future lease payments for the facility space no longer required.
Modem restructuring
2005 restructuring activity consisted of a $0.1 million favorable adjustment to the reserve related to the 2003sale of the HSP modem product line based on a final negotiation of the California lease liability. 2004 restructuringactivity consisted of $0.2 million favorable adjustments to reserves related to the 2003 sale of the HSP modemproduct line, offset by $0.1 million of expense related to the discontinuation of the Soft AP product line.
Gain on sale of assets and related royalties
2006 2005 2004
Gain on sale of assets and related royalties . . . . . . . . . . . . . . . . . . . . . $1,000 $2,100 $2,000
Percentage of revenues . . . . . . . . . . . . . . . . . . . . . . . . . . . . . . . . . . . . 1.2% 2.7% 4.1%
We received $1.0 million of royalty payments from Conexant during 2006 and received $2.0 million of royaltypayments from Conexant during each of 2005 and 2004. In 2005, we also recorded $0.1 million related to the sale ofintellectual property.
In May 2003, we completed the sale of certain of our assets to Conexant Systems, Inc., (“Conexant”). Inexchange for the assets acquired from us, Conexant delivered approximately $10.75 million in cash to us, whichrepresents $8.25 million plus the book value of the acquired inventory and fixed assets being transferred toConexant. Conexant assumed certain liabilities. The total proceeds of $10.75 million netted a gain on sale of assetsof $4.5 million.
Concurrently with the completion of the asset transaction with Conexant, PCTEL and Conexant alsocompleted an Intellectual Property Assignment Agreement (“IPA”) and Cross-License Agreement. We providedConexant with a non-exclusive, worldwide license to certain of our soft modem patents. In consideration for therights obtained by Conexant from us under this agreement, and taking into account the value of patent rightsobtained by us from Conexant under this agreement, during the period beginning on July 1, 2003 and ending onJune 30, 2007, Conexant agreed to pay to us, on a quarterly basis, royalties in the amount of ten percent (10%) of therevenue received during the royalty period, up to a maximum amount of $0.5 million per quarter with respect toeach calendar quarter during the royalty period, contingent upon sales by Conexant during the period. Futurepayments by Conexant to us in connection with the IPA will be recorded as part of the gain on sale of assets andrelated royalties in the statement of operations. We amended the cross license agreement with Conexant in August2005. The period for which the royalties are payable was extended to end on June 30, 2009. The quarterly royaltymaximum was amended to be $250,000 per quarter for the period January 1, 2006 through December 31, 2007 and$200,000 per quarter for the period January 1, 2008 through June 30, 2009.
Other Income, Net
2006 2005 2004
Other income, net . . . . . . . . . . . . . . . . . . . . . . . . . . . . . . . . . . . . . . . . $3,303 $1,547 $1,261
Percentage of revenues . . . . . . . . . . . . . . . . . . . . . . . . . . . . . . . . . . . . 3.8% 2.0% 2.6%
Other income, net, consists primarily of interest income. Interest income increased in 2006 primarily due tohigher short-term interest rates. Our increase in cash equivalents and short-term investments net of short-term bankdebt, of $11.6 million during 2006 also favorably impacted interest income. In addition, other income in 2005included $0.5 million of foreign exchange losses related to the Sigma acquisition. Despite lower average cash
23

equivalents in 2005 and the foreign exchange loss, other income, net, increased in 2005 compared to 2004 due tohigher short-term interest rates. We used $25.5 million for the Sigma acquisition in 2005.
Provision (Benefit) for Income Taxes
2006 2005 2004
Provision (benefit) for income taxes . . . . . . . . . . . . . . . . . . . . . . . . . . $(4,613) $ 235 $ (541)
Effective tax rate . . . . . . . . . . . . . . . . . . . . . . . . . . . . . . . . . . . . . . . . 31.5% �6.8% �16.5%
Significant management judgment is required to assess the likelihood that our deferred tax assets will berecovered from future taxable income. We have gross deferred tax assets of $19.0 million and a valuation allowanceof $18.9 million against the deferred tax assets as a result of uncertainties regarding realizability. The valuationallowance increased $4.9 million in 2006. The increase in the valuation allowance is primarily due to increase in thedeferred asset for intangible asset amortization. On a periodic basis, management evaluates the recoverability ofdeferred tax assets and the need for a valuation allowance. At such time as it is determined that it is more likely thannot that the deferred tax assets are realizable, the valuation allowance will be reduced.
The effective tax rate differed from the statutory federal rate of 35% during 2006 principally due to the reversalof the tax accrual of $5.2 million and due to the increase in the valuation allowance for deferred tax assets. On aregular basis, we assess the need for tax contingency reserves based on the analysis of asserted and non-assertedclaims. Management’s assessment in 2006 resulted in a release of a tax contingency reserve of $5.2 million relatedto the modem business. In addition, different rates for foreign income and losses and permanent items impacted theeffective tax rate.
The effective tax rate differed from the statutory federal rate of 35% during 2005 principally due to an increasein the valuation allowance for deferred tax assets, different rates for foreign income and losses, and revisions madeby management to other deferred tax assets. During the fourth quarter 2005, we changed our estimate regarding thecharacter in taxation of certain leasing income received in 2004. As a result, we reversed the tax expense we bookedin 2004 to reflect the change in estimate regarding our filing position. The increase in the deferred tax valuationallowance primarily consisted of an increase in the deferred tax asset related to net operating losses. The effectivetax rate was below the statutory federal rate of 35% during 2004 principally due to permanent differences includingadjustments to the deferred tax valuation allowance.
Liquidity and Capital Resources
2006 2005 2004
Net loss . . . . . . . . . . . . . . . . . . . . . . . . . . . . . . . . . . . . . . . . . . . $(10,019) $ (3,713) $ (2,738)
Charges for depreciation, amortization, stock-basedcompensation, and other non-cash items . . . . . . . . . . . . . . . . . 21,347 8,013 4,132
Changes in operating assets and liabilities . . . . . . . . . . . . . . . . . . 1,091 (5,284) (8,818)
Net cash provided by (used in) operating activities . . . . . . . . . . . 12,419 (983) (7,424)
Net cash used in investing activities . . . . . . . . . . . . . . . . . . . . . . (13,878) (25,171) (15,538)
Net cash provided by financing activities . . . . . . . . . . . . . . . . . . 2,436 682 824
Cash, cash equivalents and short-term investments at end ofyear . . . . . . . . . . . . . . . . . . . . . . . . . . . . . . . . . . . . . . . . . . . . $ 59,148 $ 58,307 $ 83,887
Short-term investments at end of year . . . . . . . . . . . . . . . . . . . . . $ 11,623 — —
Short-term borrowings . . . . . . . . . . . . . . . . . . . . . . . . . . . . . . . . $ 869 — —
Working capital at the end of year . . . . . . . . . . . . . . . . . . . . . . . $ 84,379 $ 69,809 $ 87,771
Our cash and short-term investments, net of short-term borrowings were approximately $69.9 million atDecember 31, 2006 and we had working capital of $84.4 million. The increase of $11.6 million of cash and short-term investments net of borrowings is due to higher cash from operations and less cash used for investing activities.We made no acquisitions in 2006, after spending $25.2 million for Sigma in 2005 and $18.2 million for MAXRADin 2004.
24

We believe that the existing sources of liquidity, consisting of cash, short-term investments and cash fromoperations, will be sufficient to meet the working capital needs for the foreseeable future. We continue to evaluateopportunities for development of new products and potential acquisitions of technologies or businesses that couldcomplement the business. We may use available cash or other sources of funding for such purposes.
We generated $12.4 million of net cash from operating activities in 2006. Increased sales and favorable productmix contributed to the higher cash flows from operating results compared to both 2005 and 2004. Changes inoperating assets and liabilities provided $1.1 million in cash flows in 2006 as increases in accrued liabilities andreductions in inventories offset payments for accounts payable and changes in deferred revenue. In 2005, we used$3.8 million related to a reduction in accrued liabilities, primarily for the payment of transition services-relatedcosts with Andrew Corporation ($2.6 million), $0.7 million for retention bonuses and $0.6 million for the earnoutfor the DTI acquisition. We also used $1.1 million in cash from growth in accounts receivable which was driven bythe increase in sales in the fourth quarter 2005 compared to the fourth quarter 2004. Inventories declined$1.5 million due to the transition of the Andrew product lines into the antenna operations, and also due toinventory reductions with scanners. The cash used from operating activities declined by $6.4 million in 2005compared to 2004 which included uses of cash of $4.6 million for receivables, $3.2 million for royalties, and$1.7 million for income taxes in 2004.
In 2006, we consumed $13.9 million of cash for investing activities. We used $4.0 million for capitalexpenditures and $11.6 million for short-term investments. In addition, we received $1.0 million related to the saleof assets and related royalties related to Conexant in 2006. In 2005, we spent $25.2 million for the Sigmaacquisition. We also used $4.3 million for capital expenditures and received $2.2 million in proceeds on sale of fixedassets and $2.1 million related to the sale of assets and related royalties related to Conexant. In 2004, we used$18.2 million for the acquisitions of MAXRAD, $10.9 million for the acquisition of the Andrew product lines and$1.5 million for an earn-out payment made in connection with the DTI acquisition of 2003. Additionally, we used$6.1 million for capital expenditures, $4.9 million of which was the purchase of the larger building for the AntennaProducts Group.
Cash flow from financing activities was $2.4 million in 2006, $0.7 million in 2005, and $0.8 million in 2004.2006 financing cash flows included $3.4 million from the issuance of common stock related to stock optionexercises and shares purchased through the Employee Stock Purchase Plan (ESPP). This increase in cash was offsetby the $2.1 million used to repurchase of our stock pursuant to our share buyback program. In 2006, we alsoborrowed $0.8 million for working capital needs in Ireland and China. In 2005, financing cash flows included$1.7 million of proceeds from issuance of common stock related to stock option exercises and shares purchasedthrough the ESPP offset by $0.8 million used to repurchase our common stock pursuant to our share buybackprogram. In 2004, we received $5.1 million in proceeds from issuance of common stock related to stock options andshares purchased through the ESPP, offset by $4.3 million used for the repurchase of our common stock.
Contractual Obligations and Commercial Commitments
The following summarizes the contractual lease obligations for office and product assembly facilities, motorvehicles, and equipment and the effect such obligations are expected to have on the liquidity and cash flows in futureperiods (in thousands):
TotalLess than
1 year 1-3 years 3-5 yearsMore than
5 years
Payments Due by Period
Operating leases(a). . . . . . . . . . . . . . . . . . . $ 5,132 $ 985 $2,495 $1,610 $42
Purchase obligations(b) . . . . . . . . . . . . . . . 5,447 5,447 — — —
Total . . . . . . . . . . . . . . . . . . . . . . . . . . . . . $10,579 $6,432 $2,495 $1,610 $42
(a) See Note 9, Commitments and Contingencies, in the Notes to Consolidated Financial Statements for a furtherdiscussion of leases.
25

(b) Purchase obligations of $5.4 million represent purchase orders or contracts for the purchase of inventory, aswell as for other goods and services, in the ordinary course of business, and exclude the balances for purchasescurrently recognized as liabilities on the balance sheet.
Off-Balance Sheet Arrangements
None.
Critical Accounting Policies
The preparation of our consolidated financial statements in accordance with generally accepted accountingprinciples requires us to make estimates and judgments that affect the reported amounts of assets and liabilities andthe disclosure of contingent assets and liabilities at the date of the financial statements, and the reported amounts ofrevenue and expenses during the period reported. By their nature, these estimates and judgments are subject to aninherent degree of uncertainty. Management bases its estimates and judgments on historical experience, markettrends, and other factors that are believed to be reasonable under the circumstances. Actual results may differ fromthese estimates under different assumptions or conditions.
Revenue recognition
We sell antenna products and software defined radio products, and licenses the modem technology through thelicensing program. We record the sale of these products, including related maintenance, and the licensing of theintellectual property as revenue.
In accordance with SAB No. 104, we recognize revenue when the following criteria are met: persuasiveevidence of an arrangement exists, delivery has occurred or services have been rendered, price is fixed anddeterminable, and collectibility is reasonably assured. We recognize revenue for sales of the antenna products andsoftware defined radio products, when title transfers, which is predominantly upon shipment from the factory. Wesell these products into both commercial and secure application government markets. Revenue is recognized forantenna products sold to major distributors upon shipment from the factory. We allow our major antenna productdistributors to return product under specified terms and conditions. We accrue for product returns in accordancewith FAS 48, “Revenue Recognition When Right of Return Exists”.
We recognize revenue from the Wi-Fi and cellular mobility software, including related maintenance rights,under “SOP 97-2 Software Revenue Recognition,” as amended by SOP-98 “Modification of SOP-72, SoftwareRevenue Recognition with Respect to Certain Transactions.” If the software license is perpetual and vendor specificobjective evidence can be established for the software license and any related maintenance rights, the softwarelicense revenue is recognized upon delivery of the software and the maintenance is recorded pro-rata over the life ofthe maintenance rights. If part of the licensing agreement requires engineering services to customize software forthe customer needs, the revenue for these services is recognized upon completion of engineering customization. Ifvendor specific objective evidence cannot be established, and the only undelivered item is maintenance, thesoftware license revenue, the revenue associated with engineering services, if applicable, and the related main-tenance rights are combined and recognized pro-rata over the expected term of the maintenance rights. If vendorspecific evidence cannot be established on any of the non-maintenance elements, the revenue is recorded pro-rataover the life of the contractual obligation.
We record intellectual property licensing revenue when it has a licensing agreement, the amount of relatedroyalties is known for the accounting period reported, and collectibility is reasonably assured. Knowledge of theroyalty amount specific to an accounting period is either in the form of a royalty report specific to a quarter, acontractual fixed payment in the license agreement specific to a quarter, or the pro-rata amortization of a fixedpayment related to multiple quarters over those quarters using the operating lease method. If a license agreementprovides for a fixed payment related to periods prior to the license effective date (the past) and volume-basedroyalties going forward, the fixed payment is recognized at the license effective date and the volume based royaltiesare recognized as royalty reports are received. If the license provides for a fixed payment for the past and for a finitefuture period, to be followed by volume based royalties thereafter, the fixed payment is recorded under the operatinglease method and recognized pro-rata from the effective date through the end of the period covered by the fixed
26

payment. If a one-time license payment is made for a perpetual license, with no future obligations, revenue isrecognized under the capitalized lease method upon the effective date.
There is one exception to the recognition of intellectual property licensing as revenue. We signed a licensingagreement with Conexant Systems, Inc. (“Conexant”) simultaneously with the sale of its HSP modem product lineto Conexant in 2003. Because the HSP modem product line also requires a license to our patent portfolio, the gainon sale of the product line and the licensing stream are not separable for accounting purposes. Ongoing royaltiesfrom Conexant are presented in the income statement as Gain on Sale of Assets and Related Royalties.
Allowance for Doubtful Accounts
We maintain an allowance for doubtful accounts for estimated uncollectible accounts receivable. Theallowance is based on our assessment of known delinquent accounts, historical experience, and other currentlyavailable evidence of the collectability and the aging of accounts receivable. Although management believes thecurrent allowance is sufficient to cover existing exposures, there can be no assurance against the deterioration of amajor customer’s creditworthiness, or against defaults that are higher than what has been experienced historically.
Inventories
Inventories are stated at the lower of cost or market and include material, labor and overhead costs. Inventoriesas of December 31, 2006 and 2005 were composed of raw materials, subassemblies, work-in-process, and finishedgoods. We regularly monitor inventory quantities on hand. Reserves for excess inventory are calculated based onour estimate of inventory in excess of normal and planned usage. Obsolete reserves are based on our identificationof inventory where carrying value is above net realizable value. These reserves are based on our estimates andjudgments regarding the utilization of the inventory. Due to competitive pressures and technological innovation, wemay have excess inventory in the future. Write-downs of inventories would have a negative impact on gross profit.
Warranty Costs
We offer repair and replacement warranties of primarily two years for antenna products and one year forscanners and receivers. The company’s warranty reserve is based on historical sales and costs of repair andreplacement trends. If we were to experience an increase in warranty claims compared with our historicalexperience, gross profit would be adversely affected.
Stock-based compensation
In the first fiscal quarter of 2006, we adopted SFAS No. 123(R), “Share Based Payments,” which revisesSFAS No. 123, “Accounting for Stock Based Compensation.” SFAS No. 123(R) requires the company to recordcompensation expense for share-based payments, including employee stock options, at fair value. Prior to fiscal2006, we had accounted for our stock based compensation awards pursuant to Accounting Principles Opinion(APB) No. 25, “Accounting for Stock Issued to Employees”, and its related interpretations, which allowed use of theintrinsic value method. Under the intrinsic value method, compensation expense for stock option based employeecompensation was not recognized in the income statement as all stock options granted by us that had an exerciseprice equal to the market value of the underlying common stock on the option grant date. Prior to fiscal 2006, weused the actual forfeiture method allowed under SFAS No. 123, which assumed that all options vest and pro formaexpense was adjusted when options were forfeited. In 2006, we incorporated a forfeiture rate based on historicaldata in the expense calculation.
We elected to use the modified prospective transition method to adopt SFAS No. 123». Under this transitionmethod, compensation expense includes expense for all share-based payments granted prior to, but not yet vested asof January 1, 2006, based on the grant date fair value estimated in accordance with the original provisions ofSFAS No. 123, and the expense for all share-based payments granted subsequent to January 1, 2006 based on thegrant date fair value estimated in accordance with the provisions of SFAS No. 123(R). As required under themodified prospective transition method we have not restated prior period results. As part of the adoption ofSFAS No. 123(R), we used the alternative transition method in SFAS 123» to establish the beginning balance of the
27

additional paid in capital (APIC) pool related to employee compensation. We determined that it is in a net shortfallposition and thus, started at $0 for the APIC pool at January 1, 2006.
Goodwill and Intangible Assets
Under the provisions of SFAS No. 142, “Goodwill and Other Intangible Assets,” we test goodwill of eachoperating segment for impairment on an annual basis. Goodwill is assigned to each business segment. During thisreview, the significant assumptions used in determining the original cost of long-lived assets are reevaluated. Wedetermine whether there has been a permanent impairment of the value of goodwill by comparing future estimatedundiscounted cash flows by reporting unit to the segment’s carrying value.
In conjunction with the completion of the restructuring of Dublin operations, we reevaluated the carrying valueof the goodwill and intangible assets for technology and customer relationships, as required by Statement ofFinancial Accounting Standards No. 121 “Accounting for the Impairment of Long Lived Assets and for Long LivedAssets to be Disposed Of” and Statement of Accounting Standards No. 142 “Goodwill and Intangible Assets”. Weconcluded that the carrying value of intangible assets was impaired by $6.0 million and the carrying value of thegoodwill was impaired by $14.3 million. The total impairment cost was recorded in the third quarter of 2006.
We conducted the annual impairment test of goodwill as of October 31, 2006. The estimate of future cash flowsfor this test was based on historical sales trends, financial projections, market analysis, capital expenditure needs,working capital needs, analyst reports, and other data pertinent to the valuation as provided by us and obtained frompublic, financial, and industry sources. Our assumptions required significant judgment and actual cash flows maydiffer from those forecasted. For discounting the future cash flows, a third-party valuation firm provided theweighted average cost of capital (WACC). The third party valuation firm also reviewed the financial models. Thisimpairment review performed indicated no impairment of goodwill other than the impairment related to Sigma. Ifactual results are different from the our forecasts, future tests may indicate an impairment of goodwill or otherintangible assets, which could result in non-cash charges, adversely affecting the our results of operations.
Income Taxes
We provide for income taxes under the provisions of SFAS No. 109, “Accounting for Income Taxes.”SFAS No. 109 requires an asset and liability based approach in accounting for income taxes. Deferred income taxassets and liabilities are recorded based on the differences between the financial statement and tax bases of assetsand liabilities using enacted tax rates. Valuation allowances are provided against tax assets which are not likely to berealized. On a regular basis, management assesses the needs for tax contingency reserves based on the analysis ofasserted and non-asserted claims. Changes in expectations could result in changes to the valuation allowances.
We have international subsidiaries located in Japan, China, Ireland, United Kingdom, Serbia, and Israel as wellas an international branch office located in Hong Kong. The complexities brought on by operating in severaldifferent tax jurisdictions inevitably lead to an increased exposure to worldwide taxes. Should review of the taxfilings result in unfavorable adjustments to our tax returns, the operating results, cash flows, and financial positioncould be materially and adversely affected. We believe there will not be any significant adjustments related toforeign taxes.
As part of the process of preparing the consolidated financial statements, we are required to estimate theincome taxes, which involves estimating the actual current tax together with assessing temporary differencesresulting from differing treatment of items for tax and accounting purposes. These differences result in deferred taxassets and liabilities. Significant management judgment is required to assess the likelihood that the deferred taxassets will be recovered from future taxable income. We maintain a valuation allowance against the deferred taxassets. In the event it was determined that we could realize the deferred tax assets in the future in excess of the netrecorded amount, an adjustment to the deferred tax asset would increase income in the period such determinationwas made.
28

Defined Benefit Plans
Effective June 2006, we no longer have any defined benefit plans. See Note 7, Restructuring, and Note 14,Employee Benefit Plans, in the Notes to the Consolidated Financial Statements.
Recent Accounting Pronouncements
In September 2006, the Securities and Exchange Commission issued Staff Accounting Bulletin (“SAB”)No. 108, Considering the Effects of Prior Year Misstatements when Quantifying Current Year Misstatements.SAB No. 108 requires analysis of misstatements using both an income statement (rollover) approach and a balancesheet (iron curtain) approach in assessing materiality and provides for a one-time cumulative effect transitionadjustment. SAB No. 108 is effective for our fiscal year 2006 annual financial statements. Currently, we prepare ananalysis for all misstatements using the dual approach. The dual approach incorporates both the income statementand balance sheet for measuring materiality. There is no impact to adoption of this pronouncement at December 31,2006.
In September 2006, the Financial Accounting Standards Board (FASB) issued Statement of FinancialAccounting Standards (SFAS) No. 157, Fair Value Measurements, which defines fair value, establishes a frame-work for measuring fair value in generally accepted accounting principles, and expands disclosures about fair valuemeasurements. SFAS No. 157 does not require any new fair value measurements, but provides guidance on how tomeasure fair value by providing a fair value hierarchy used to classify the source of the information. SFAS 157 iseffective for financial statements issued for fiscal years beginning after November 15, 2007. We will adoptSFAS 157 on its effective date. We are still in the process of determining any potential impact that the adoption ofSFAS No. 157 will have on our financial statements.
In July 2006, FASB released FASB Interpretation No. 48, “Accounting for Uncertainty in Income Taxes, aninterpretation of FASB Statement No. 109” (FIN 48). FIN 48 clarifies the accounting and reporting for uncertaintiesin income tax positions. FIN 48 prescribes a recognition threshold and measurement attribute for the financialstatement recognition and measurement of a tax position taken or expected to be taken in a tax return. FIN 48 alsoprovides guidance on derecognition, classification, interest and penalties, accounting in interim periods, disclosureand transition. FIN 48 is effective for fiscal years ending after December 15, 2006. We will adopt FIN 48 as ofJanuary 1, 2007, as required. The cumulative effects, if any, of applying this Interpretation will be recorded as anadjustment to retained earnings as of the beginning of the period of adoption. We are currently evaluating theprovisions of FIN 48 and have not yet completed our determination of the impact of adoption on our results ofoperations or financial position.
In May 2005, the Financial Accounting Standards Board (FASB) issued Statement of Financial AccountingStandards (SFAS) No. 154, “Accounting Changes and Error Corrections”, a replacement of APB Opinion No. 20and FASB Statement No. 3. This statement applies to all voluntary changes in accounting principle, and requiresretrospective application to prior periods’ financial statements for changes in accounting principle. SFAS No. 154will be effective for us beginning in fiscal year 2007. We do not believe this statement will have a material impact onour financial statements.
Effective January 1, 2006, we adopted SFAS No. 123(R), “Share Based Payments,” as described in Note 11,Stock-Based Compensation, in the Notes to the Consolidated Financial Statements.
Item 7A: Quantitative and Qualitative Disclosures about Market Risk
We are exposed to market risk from changes in interest rates, foreign exchange rates, credit risk, and industryrisk as follows:
Interest Rate Risk
We manage the sensitivity of our results of operations to interest rate risk on cash equivalents by maintaining aconservative investment portfolio. The primary objective of our investment activities is to preserve principalwithout significantly increasing risk. To achieve this objective, we maintain our portfolio of cash equivalents andshort-term investments in money market funds, certificates of deposit, commercial paper and municipal bonds with
29

maturities. During the fourth quarter of 2006, we elected to invest in securities with original maturities greater than90 days. Due to changes in interest rates, our future investment income may fall short of expectations. Ahypothetical increase or decrease of 10% in market interest rates would not result in a material decrease ininterest income earned through maturity on investments held at December 31, 2006. We do not hold or issuederivative, derivative commodity instruments or other financial instruments for trading purposes.
The interest rate on our short-term debt in Tianjin is currently fixed. The interest rate on our short-term debt inIreland does fluctuate based on the LIBOR rate. We intend to repay this short-term debt in 2007.
Foreign Currency Risk
We are exposed to currency fluctuations due to our foreign operations and because we sell our productsinternationally. We manage the sensitivity of our international sales by denominating the majority of transactions inU.S. dollars. If the United States dollar uniformly increased or decreased in strength by 10% relative to thecurrencies in which our sales were denominated, our net loss would not have changed by a material amount for theyear ended December 31, 2006. For purposes of this calculation, we have assumed that the exchange rates wouldchange in the same direction relative to the United States dollar. Our exposure to foreign exchange rate fluctuations,however, arises in part from translation of the financial statements of foreign subsidiaries into U.S. dollars inconsolidation. As exchange rates vary, these results, when translated, may vary from expectations and adverselyimpact overall expected profitability.
Credit Risk
The financial instruments that potentially subject us to credit risk consist primarily of trade receivables. Fortrade receivables, credit risk is the potential for a loss due to a customer not meeting its payment obligations. Ourcustomers are concentrated in the wireless industry. Estimates are used in determining an allowance for amountswhich we may not be able to collect, based on current trends, the length of time receivables are past due andhistorical collection experience. Provisions for and recovery of bad debts are recorded as sales and marketingexpense in the consolidated statements of operations. We perform ongoing evaluations of customers’ credit limitsand financial condition. Generally, we do not require collateral from customers. As of December 31, 2006, the creditrisk was diversified as a result of acquisitions. One customer accounted for 9% of gross accounts receivable with thetwo next largest balances accounting for 7% and 5%, respectively. As of December 31, 2005, one customeraccounted for 16% of gross accounts receivable with the next largest balance accounting for 5%.
30

Item 8: Financial Statements and Supplementary Data
PCTEL, INC.
INDEX TO THE CONSOLIDATED FINANCIAL STATEMENTS
Page
Reports of Independent Registered Public Accounting Firms . . . . . . . . . . . . . . . . . . . . . . . . . . . . . . . . . 32
Consolidated Balance Sheets as of December 31, 2006 and 2005 . . . . . . . . . . . . . . . . . . . . . . . . . . . . . . 35
Consolidated Statements of Operations for the years ended December 31, 2006, 2005 and 2004 . . . . . . . 36
Consolidated Statements of Stockholders’ Equity for the years ended December 31, 2006, 2005 and2004. . . . . . . . . . . . . . . . . . . . . . . . . . . . . . . . . . . . . . . . . . . . . . . . . . . . . . . . . . . . . . . . . . . . . . . . . 37
Consolidated Statements of Cash Flows for the years ended December 31, 2006, 2005 and 2004 . . . . . . 38
Notes to the Consolidated Financial Statements . . . . . . . . . . . . . . . . . . . . . . . . . . . . . . . . . . . . . . . . . . . 39
Schedule II Valuation and Qualifying Accounts . . . . . . . . . . . . . . . . . . . . . . . . . . . . . . . . . . . . . . . . . . . 73
31

REPORT OF INDEPENDENT REGISTERED PUBLIC ACCOUNTING FIRM
To the Board of Directors and StockholdersPCTEL, Inc.:
We have audited management’s assessment, included in the accompanying Management’s Report on InternalControl Over Financial Reporting appearing under Item 9A that PCTEL, Inc. and subsidiaries (the Company)(a Delaware Corporation) maintained effective internal control over financial reporting as of December 31, 2006,based on criteria established in Internal Control — Integrated Framework issued by the Committee of SponsoringOrganizations of the Treadway Commission (COSO). The Company’s management is responsible for maintainingeffective internal control over financial reporting and for its assessment of the effectiveness of internal control overfinancial reporting. Our responsibility is to express an opinion on management’s assessment and an opinion on theeffectiveness of the Company’s internal control over financial reporting based on our audit.
We conducted our audit in accordance with the standards of the Public Company Accounting Oversight Board(United States). Those standards require that we plan and perform the audit to obtain reasonable assurance aboutwhether effective internal control over financial reporting was maintained in all material respects. Our auditincluded obtaining an understanding of internal control over financial reporting, evaluating management’sassessment, testing and evaluating the design and operating effectiveness of internal control, and performingsuch other procedures as we considered necessary in the circumstances. We believe that our audit provides areasonable basis for our opinions.
A company’s internal control over financial reporting is a process designed to provide reasonable assuranceregarding the reliability of financial reporting and the preparation of financial statements for external purposes inaccordance with generally accepted accounting principles. A company’s internal control over financial reportingincludes those policies and procedures that (1) pertain to the maintenance of records that, in reasonable detail,accurately and fairly reflect the transactions and dispositions of the assets of the company; (2) provide reasonableassurance that transactions are recorded as necessary to permit preparation of financial statements in accordancewith generally accepted accounting principles, and that receipts and expenditures of the company are being madeonly in accordance with authorizations of management and directors of the company; and (3) provide reasonableassurance regarding prevention or timely detection of unauthorized acquisition, use, or disposition of the company’sassets that could have a material effect on the financial statements.
Because of its inherent limitations, internal control over financial reporting may not prevent or detectmisstatements. Also, projections of any evaluation of effectiveness to future periods are subject to the risk thatcontrols may become inadequate because of changes in conditions, or that the degree of compliance with thepolicies or procedures may deteriorate.
In our opinion, management’s assessment that PCTEL, Inc. maintained effective internal control over financialreporting as of December 31, 2006, is fairly stated, in all material respects, based on COSO. Also in our opinion,PCTEL, Inc. maintained, in all material respects, effective internal control over financial reporting as ofDecember 31, 2006, based on COSO.
We have also audited, in accordance with the standards of the Public Company Accounting Oversight Board(United States), the balance sheet of PCTEL, Inc. as of December 31, 2006 and the related statements of operations,stockholders’ equity and cash flows for the year then ended and our report dated March 16, 2007 expressed anunqualified opinion on those financial statements and included an explanatory paragraph regarding the Company’sadoption of Statement of Financial Accounting Standards (“SFAS”) No. 123(R), Share-Based Payment, in 2006.
/s/ GRANT THORNTON LLP
Chicago, IllinoisMarch 16, 2007
32

REPORT OF INDEPENDENT REGISTERED PUBLIC ACCOUNTING FIRM
To the Board of Directors and StockholdersPCTEL, Inc.:
We have audited the accompanying consolidated balance sheet of PCTEL, Inc. and subsidiaries (“theCompany”) as of December 31, 2006, and the related consolidated statements of operations, stockholders’ equity,and cash flows for the year then ended. These financial statements are the responsibility of the Company’smanagement. Our responsibility is to express an opinion on these financial statements based on our audit.
We conducted our audit in accordance with standards of the Public Company Accounting Oversight Board(United States). Those standards require that we plan and perform the audit to obtain reasonable assurance aboutwhether the financial statements are free of material misstatement. An audit includes examining, on a test basis,evidence supporting the amounts and disclosures in the financial statements. An audit also includes assessing theaccounting principles used and significant estimates made by management, as well as evaluating the overallfinancial statement presentation. We believe that our audit provide a reasonable basis for our opinion.
In our opinion, the consolidated financial statements referred to above present fairly, in all material respects,the financial position of PCTEL, Inc. as of December 31, 2006 and the results of its operations, its changes instockholders’ equity and its cash flows for the year then ended in conformity with accounting principles generallyaccepted in the United States of America.
As discussed in Notes 1 and 11 to the consolidated financial statements, effective January 1, 2006, theCompany adopted Statement of Financial Accounting Standards Number 123 (revised 2004), Shared-BasedPayment.
We have also audited, in accordance with the standards of the Public Company Accounting Oversight Board(United States), the effectiveness of the Company’s internal control over financial reporting as of December 31,2006, based on criteria established in Internal Control-Integrated Framework issued by the Committee ofSponsoring Organizations of the Treadway Commission and our report dated March 16, 2007 expressed anunqualified opinion on management’s assessment and the effectiveness of the Company’s internal control overfinancial reporting.
/s/ GRANT THORNTON LLP
Chicago, IllinoisMarch 16, 2007
33

REPORT OF PRICEWATERHOUSECOOPERS LLP, INDEPENDENT REGISTERED PUBLICACCOUNTING FIRM
To the Board of Directors and Shareholders of PCTEL, Inc.:
In our opinion, the consolidated financial statements listed in the accompanying index present fairly, in allmaterial respects, the financial position of PCTEL Inc. and its subsidiaries at December 31, 2005 and theresults of their operations and their cash flows for each of the two years in the period ended December 31,2005 in conformity with accounting principles generally accepted in the United States of America. In addition,in our opinion, the financial statement schedule listed in the accompanying index presents fairly, in all materialrespects, the 2005 and 2004 information set forth therein when read in conjunction with the related consoli-dated financial statements. These financial statements and financial statement schedule are the responsibility ofthe Company’s management. Our responsibility is to express an opinion on these financial statements andfinancial statement schedule based on our audits. We conducted our audits of these statements in accordancewith the standards of the Public Company Accounting Oversight Board (United States). Those standardsrequire that we plan and perform the audit to obtain reasonable assurance about whether the financial state-ments are free of material misstatement. An audit of financial statements includes examining, on a test basis,evidence supporting the amounts and disclosures in the financial statements, assessing the accounting princi-ples used and significant estimates made by management, and evaluating the overall financial statement pre-sentation. We believe that our audits provide a reasonable basis for our opinion.
/s/ PricewaterhouseCoopers LLPChicago, IllinoisMarch 16, 2006
34

PCTEL, INC.
CONSOLIDATED BALANCE SHEETS(in thousands, except share data)
December 31,2006
December 31,2005
ASSETSCURRENT ASSETS:
Cash and cash equivalents . . . . . . . . . . . . . . . . . . . . . . . . . . . . . . . . . . . . . . . . $ 59,148 $ 58,307
Short-term investments . . . . . . . . . . . . . . . . . . . . . . . . . . . . . . . . . . . . . . . . . . 11,623 —
Restricted cash . . . . . . . . . . . . . . . . . . . . . . . . . . . . . . . . . . . . . . . . . . . . . . . . — 208
Accounts receivable, net of allowance for doubtful accounts of $333 and $318,respectively . . . . . . . . . . . . . . . . . . . . . . . . . . . . . . . . . . . . . . . . . . . . . . . . . 14,034 13,725
Inventories, net . . . . . . . . . . . . . . . . . . . . . . . . . . . . . . . . . . . . . . . . . . . . . . . . 7,258 9,547
Prepaid expenses and other current assets . . . . . . . . . . . . . . . . . . . . . . . . . . . . 2,059 3,109
Total current assets . . . . . . . . . . . . . . . . . . . . . . . . . . . . . . . . . . . . . . . . . . . 94,122 84,896
PROPERTY AND EQUIPMENT, net . . . . . . . . . . . . . . . . . . . . . . . . . . . . . . . . . 12,357 11,190
GOODWILL . . . . . . . . . . . . . . . . . . . . . . . . . . . . . . . . . . . . . . . . . . . . . . . . . . . 17,569 31,020
OTHER INTANGIBLE ASSETS, net . . . . . . . . . . . . . . . . . . . . . . . . . . . . . . . . . 7,451 16,457
OTHER ASSETS . . . . . . . . . . . . . . . . . . . . . . . . . . . . . . . . . . . . . . . . . . . . . . . . 1,221 941
TOTAL ASSETS . . . . . . . . . . . . . . . . . . . . . . . . . . . . . . . . . . . . . . . . . . . . . . . . $132,720 $144,504
LIABILITIES AND STOCKHOLDERS’ EQUITYCURRENT LIABILITIES:
Accounts payable . . . . . . . . . . . . . . . . . . . . . . . . . . . . . . . . . . . . . . . . . . . . . . $ 885 $ 2,251
Income taxes payable . . . . . . . . . . . . . . . . . . . . . . . . . . . . . . . . . . . . . . . . . . . 59 5,297
Deferred revenue. . . . . . . . . . . . . . . . . . . . . . . . . . . . . . . . . . . . . . . . . . . . . . . 1,025 1,944
Other accrued liabilities . . . . . . . . . . . . . . . . . . . . . . . . . . . . . . . . . . . . . . . . . 6,905 5,595
Short-term debt . . . . . . . . . . . . . . . . . . . . . . . . . . . . . . . . . . . . . . . . . . . . . . . . 869 —
Total current liabilities . . . . . . . . . . . . . . . . . . . . . . . . . . . . . . . . . . . . . . . . . 9,743 15,087
Pension Liability . . . . . . . . . . . . . . . . . . . . . . . . . . . . . . . . . . . . . . . . . . . . . . . — 3,046
Other long-term accrued liabilities . . . . . . . . . . . . . . . . . . . . . . . . . . . . . . . . . . 2,284 2,344
Total liabilities . . . . . . . . . . . . . . . . . . . . . . . . . . . . . . . . . . . . . . . . . . . . . . 12,027 20,477
CONTINGENCIES AND COMMITMENTS (Note 9)
STOCKHOLDERS’ EQUITY:
Common stock, $0.001 par value, 100,000,000 shares authorized, 22,065,145and 21,423,372 shares issued and outstanding at December 31, 2006 and2005, respectively . . . . . . . . . . . . . . . . . . . . . . . . . . . . . . . . . . . . . . . . . . . . 22 22
Additional paid-in capital . . . . . . . . . . . . . . . . . . . . . . . . . . . . . . . . . . . . . . . . 165,556 160,825
Accumulated deficit . . . . . . . . . . . . . . . . . . . . . . . . . . . . . . . . . . . . . . . . . . . . (46,671) (36,652)
Accumulated other comprehensive income . . . . . . . . . . . . . . . . . . . . . . . . . . . . 1,786 (168)
Total stockholders’ equity . . . . . . . . . . . . . . . . . . . . . . . . . . . . . . . . . . . . . . 120,693 124,027
TOTAL LIABILITIES AND STOCKHOLDERS’ EQUITY . . . . . . . . . . . . . . . $132,720 $144,504
The accompany notes are an integral part of these consolidated financial statements
35

PCTEL, INC.
CONSOLIDATED STATEMENTS OF OPERATIONS(in thousands, except per share data)
2006 2005 2004Years Ended December 31,
REVENUES . . . . . . . . . . . . . . . . . . . . . . . . . . . . . . . . . . . . . . . . . . . . . . . $ 86,562 $77,746 $48,221
COST OF REVENUES . . . . . . . . . . . . . . . . . . . . . . . . . . . . . . . . . . . . . . . 39,990 40,878 19,786
MODEM INVENTORY AND ROYALTY EXPENSE RECOVERY . . . . . — — (3,208)
GROSS PROFIT . . . . . . . . . . . . . . . . . . . . . . . . . . . . . . . . . . . . . . . . . . . . 46,572 36,868 31,643
OPERATING EXPENSES:Research and development . . . . . . . . . . . . . . . . . . . . . . . . . . . . . . . . . . . . 13,762 10,015 8,614
Sales and marketing . . . . . . . . . . . . . . . . . . . . . . . . . . . . . . . . . . . . . . . . 13,287 13,074 11,247
General and administrative . . . . . . . . . . . . . . . . . . . . . . . . . . . . . . . . . . . 14,127 16,836 15,416
Impairment of goodwill and intangible assets . . . . . . . . . . . . . . . . . . . . . . 20,349 — —
Amortization of intangible assets . . . . . . . . . . . . . . . . . . . . . . . . . . . . . . . 3,593 4,137 2,972
Restructuring charges, net . . . . . . . . . . . . . . . . . . . . . . . . . . . . . . . . . . . . 389 (70) (66)
Gain on sale of assets and related royalties. . . . . . . . . . . . . . . . . . . . . . . . (1,000) (2,100) (2,000)
Total operating expenses . . . . . . . . . . . . . . . . . . . . . . . . . . . . . . . . . . . 64,507 41,892 36,183
LOSS FROM OPERATIONS . . . . . . . . . . . . . . . . . . . . . . . . . . . . . . . . . . (17,935) (5,024) (4,540)
OTHER INCOME, NET . . . . . . . . . . . . . . . . . . . . . . . . . . . . . . . . . . . . . . 3,303 1,546 1,261
LOSS BEFORE PROVISION FOR INCOME TAXES . . . . . . . . . . . . . . . (14,632) (3,478) (3,279)
PROVISION (BENEFIT) FOR INCOME TAXES . . . . . . . . . . . . . . . . . . (4,613) 235 (541)
NET LOSS . . . . . . . . . . . . . . . . . . . . . . . . . . . . . . . . . . . . . . . . . . . . . . . . $(10,019) $ (3,713) $ (2,738)
Basic loss per share . . . . . . . . . . . . . . . . . . . . . . . . . . . . . . . . . . . . . . . . . . $ (0.48) $ (0.18) $ (0.14)
Shares used in computing basic loss per share . . . . . . . . . . . . . . . . . . . . . . . 20,810 20,146 20,074
Diluted loss per share . . . . . . . . . . . . . . . . . . . . . . . . . . . . . . . . . . . . . . . . . $ (0.48) $ (0.18) $ (0.14)
Shares used in computing diluted loss per share . . . . . . . . . . . . . . . . . . . . . . 20,810 20,146 20,074
The accompany notes are an integral part of these consolidated financial statements
36

PCTEL, INC.
CONSOLIDATED STATEMENTS OF STOCKHOLDERS’ EQUITY(in thousands)
CommonStock
AdditionalPaid-InCapital
RetainedDeficit
AccumulatedOther
ComprehensiveIncome(Loss)
TotalStockholders’
Equity
BALANCE, DECEMBER 31, 2003 . . . . . . . 20 152,996 (30,201) 91 122,906
Stock-based compensation . . . . . . . . . . . . — 1,425 — — 1,425
Issuance of shares for stock purchase andoption plans . . . . . . . . . . . . . . . . . . . . . 1 5,063 — — 5,064
Tax benefit from stock options exercises . . — 584 — — 584
Repurchase of common stock . . . . . . . . . . — (4,310) — — (4,310)
Net loss . . . . . . . . . . . . . . . . . . . . . . . . . . — — (2,738) — (2,738)
Change in cumulative translationadjustment . . . . . . . . . . . . . . . . . . . . . . — — — 18 18
Unrealized loss on available-for-salesecurities . . . . . . . . . . . . . . . . . . . . . . . — — — (26) (26)
BALANCE, DECEMBER 31, 2004 . . . . . . . 21 155,758 (32,939) 83 122,923
Stock-based compensation . . . . . . . . . . . . — 4,051 — — 4,051
Issuance of shares for stock purchase andoption plans . . . . . . . . . . . . . . . . . . . . . 1 1,763 — — 1,764
Tax benefit from stock options exercises . . — 12 — — 12
Repurchase of common stock . . . . . . . . . . — (759) — — (759)
Net loss . . . . . . . . . . . . . . . . . . . . . . . . . . — — (3,713) — (3,713)
Change in cumulative translationadjustment . . . . . . . . . . . . . . . . . . . . . . — — — (251) (251)
BALANCE, DECEMBER 31, 2005 . . . . . . . 22 160,825 (36,652) (168) 124,027
Stock-based compensation . . . . . . . . . . . . — 4,502 — — 4,502
Issuance of shares for stock purchase andoption plans . . . . . . . . . . . . . . . . . . . . . — 3,383 — — 3,383
Cancellation of shares for payment ofwithholding tax . . . . . . . . . . . . . . . . . . . — (1,376) — — (1,376)
Tax benefit from stock options exercises . . — 355 — — 355
Repurchase of common stock . . . . . . . . . . — (2,133) — — (2,133)
Net loss . . . . . . . . . . . . . . . . . . . . . . . . . . — — (10,019) — (10,019)
Change in cumulative translationadjustment . . . . . . . . . . . . . . . . . . . . . . — — — 1,954 1,954
BALANCE, DECEMBER 31, 2006 . . . . . . . 22 165,556 (46,671) 1,786 120,693
The accompany notes are an integral part of these consolidated financial statements
37

PCTEL, INC.
CONSOLIDATED STATEMENTS OF CASH FLOWS(in thousands)
2006 2005 2004Years Ended December 31,
Operating Activities:Net loss . . . . . . . . . . . . . . . . . . . . . . . . . . . . . . . . . . . . . . . . . . . . . . . . $(10,019) $ (3,713) $ (2,738)Adjustments to reconcile net loss to net cash provided by (used in)
operating activities:Depreciation and amortization . . . . . . . . . . . . . . . . . . . . . . . . . . . . . . 5,528 5,829 4,093Impairment of goodwill and other intangible assets . . . . . . . . . . . . . . 20,349 — —Stock-based compensation . . . . . . . . . . . . . . . . . . . . . . . . . . . . . . . . 4,502 4,051 1,425Gain on sale of assets and related royalties . . . . . . . . . . . . . . . . . . . . (1,000) (2,100) (2,000)Loss on disposal/sale of property and equipment . . . . . . . . . . . . . . . . 168 222 30Payment of withholding tax on stock-based compensation . . . . . . . . . (1,376) — —Tax benefit from stock-based compensation . . . . . . . . . . . . . . . . . . . . 208 12 584Reversal of income tax reserve . . . . . . . . . . . . . . . . . . . . . . . . . . . . . (5,234) — —Restructuring costs . . . . . . . . . . . . . . . . . . . . . . . . . . . . . . . . . . . . . . (1,798) — —
Changes in operating assets and liabilities, net of acquisitions:Accounts receivable . . . . . . . . . . . . . . . . . . . . . . . . . . . . . . . . . . . . . (197) (1,065) (4,610)Inventories . . . . . . . . . . . . . . . . . . . . . . . . . . . . . . . . . . . . . . . . . . . . 1,608 1,472 (799)Prepaid expenses and other assets . . . . . . . . . . . . . . . . . . . . . . . . . . . 762 (600) (997)Accounts payable . . . . . . . . . . . . . . . . . . . . . . . . . . . . . . . . . . . . . . . (1,436) (1,008) 44Accrued royalties . . . . . . . . . . . . . . . . . . . . . . . . . . . . . . . . . . . . . . . — — (3,206)Income taxes payable . . . . . . . . . . . . . . . . . . . . . . . . . . . . . . . . . . . . (4) (395) (1,688)Other accrued liabilities . . . . . . . . . . . . . . . . . . . . . . . . . . . . . . . . . . 1,912 (3,829) 3,271Deferred revenue . . . . . . . . . . . . . . . . . . . . . . . . . . . . . . . . . . . . . . . (1,554) 141 (833)
Net cash provided by (used in) operating activities . . . . . . . . . . . . . 12,419 (983) (7,424)Investing Activities:
Capital expenditures . . . . . . . . . . . . . . . . . . . . . . . . . . . . . . . . . . . . . . . (4,033) (4,270) (6,090)Proceeds from disposal of property and equipment . . . . . . . . . . . . . . . . 268 2,155 3Purchase of short-term investments . . . . . . . . . . . . . . . . . . . . . . . . . . . . (11,623) — —Proceeds on sale of assets and related royalties . . . . . . . . . . . . . . . . . . . 1,000 2,100 2,000Proceeds from sales and maturities of available-for-sale investments . . . — — 19,151Purchase of assets/businesses, net of cash acquired . . . . . . . . . . . . . . . . 510 (25,156) (29,062)Payment of DTI acquisition earn out . . . . . . . . . . . . . . . . . . . . . . . . . . . — — (1,540)
Net cash used in provided by investing activities . . . . . . . . . . . . . . . . (13,878) (25,171) (15,538)Financing Activities:
Proceeds from issuance of common stock . . . . . . . . . . . . . . . . . . . . . . . 3,383 1,769 5,064Payments for repurchase of common stock . . . . . . . . . . . . . . . . . . . . . . (2,133) (759) (4,310)Tax benefits from stock-based compensation . . . . . . . . . . . . . . . . . . . . . 146 — —Repayment of Sigma overdraft . . . . . . . . . . . . . . . . . . . . . . . . . . . . . . . — (328) —Proceeds from short-term borrowings . . . . . . . . . . . . . . . . . . . . . . . . . . 832 — —Decrease in restricted cash . . . . . . . . . . . . . . . . . . . . . . . . . . . . . . . . . . 208 — 70
Net cash provided by financing activities . . . . . . . . . . . . . . . . . . . . . . 2,436 682 824Net increase (decrease) in cash and cash equivalents . . . . . . . . . . . . . . . . . 977 (25,472) (22,138)Effect of exchange rate changes on cash . . . . . . . . . . . . . . . . . . . . . . . . . . (136) (108) 18Cash and cash equivalents, beginning of year . . . . . . . . . . . . . . . . . . . . . . 58,307 83,887 106,007Cash and Cash Equivalents, End of Year . . . . . . . . . . . . . . . . . . . . . . . . $ 59,148 $ 58,307 $ 83,887
Other information:Cash paid/(refunds received) for income taxes . . . . . . . . . . . . . . . . . . . . $ (734) $ 144 $ 739Cash paid for interest . . . . . . . . . . . . . . . . . . . . . . . . . . . . . . . . . . . . . . $ 36 — —Increases to deferred stock compensation, net . . . . . . . . . . . . . . . . . . . . $ 545 $ 2,582 $ 1,870Issuance of restricted common stock, net of cancellations . . . . . . . . . . . $ 3,275 $ 4,942 $ 3,295
The accompany notes are an integral part of these consolidated financial statements
38

PCTEL, Inc.
NOTES TO THE CONSOLIDATED FINANCIAL STATEMENTSFor the Year Ended: December 31, 2006
1. Organization and Summary of Significant Accounting Policies
Nature of Operations
PCTEL was incorporated in California in 1994 and reincorporated in Delaware in 1998. PCTEL provideswireless connectivity products and technology to wireless carriers, aggregators of Internet connectivity, wirelessInternet service providers (WISP’s), PC OEM’s, and wireless equipment manufacturers. The company bringstogether expertise in RF platform design, mobility software, and hardware. Additionally, the company licenses bothpatented and proprietary access technology, principally related to analog modems, to modem solution providers.
The company principally operates in three business segments.
Broadband Technology Group
The Broadband Technology Group (BTG) designs, distributes, and supports innovative antenna solutions forpublic safety applications, unlicensed and licensed wireless broadband, fleet management, network timing, andother GPS applications. The BTG’s portfolio of OEM receivers and interference management solutions are used tomeasure, monitor and optimize cellular networks.
The company’s antenna products originated through a series of acquisitions starting with MAXRAD, Inc,which was acquired in January 2004. MAXRAD’s antenna solutions consist of antennas designed to enhance theperformance of broadband wireless, in-building wireless, wireless Internet service providers and Land MobileRadio (LMR) applications. As a result of the October 2004 acquisition of certain antenna product lines fromAndrew Corporation (“Andrew”), the product portfolio expanded to include GPS (Global Positioning Systems),satellite communications (Mobile SATCOM) and on-glass mobile antennas. In July 2005, the company againexpanded the product portfolio with the purchase of Sigma Wireless Technologies Limited (“Sigma” or “SWT”),located in Dublin, Ireland. Sigma provides integrated variable electrical tilt base stations antennas (iVET), PublicMobile Radio (PMR), and Digital Public Mobile Radio (DPMR) antenna products.
BTG’s OEM receiver and interference management solutions consist of software-defined radio productsdesigned to measure and monitor cellular networks. The products originated through the business of DTI, Inc.,which was acquired in March 2003. The technology is sold in two forms; as OEM radio frequency receivers or asintegrated systems solutions.
Mobility Solutions Group
The Mobility Solutions Group (MSG) produces mobility software products for WiFi, cellular, IP MultimediaSubsystem (IMS), and wired applications.
Licensing
PCTEL has an intellectual property portfolio consisting of over 130 U.S. patents and applications, primarily inanalog modem technology. It also has proprietary DSP based embedded modem technology. The company has hadan active licensing program since 2002 designed to monetize the value of its modem related intellectual property.
Basis of Consolidation
These consolidated financial statements include the accounts of the company and its subsidiaries. Allintercompany accounts and transactions have been eliminated.
39

Use of Estimates
The preparation of financial statements in conformity with generally accepted accounting principles requiresmanagement to make estimates and assumptions that affect the reported amounts of assets and liabilities anddisclosure of contingent assets and liabilities at the date of the financial statements and the reported amounts ofrevenues and expenses during the periods reported. Actual results could differ from those estimates.
Reclassifications
Certain previously reported amounts have been reclassified to conform to the current year’s presentation.
Foreign Currency Translation
The functional currency for the company’s foreign operations is predominantly the applicable local currency.Accounts of foreign operations are translated into U.S. dollars using the year-end exchange rate for assets andliabilities and average monthly rates for revenue and expense accounts. Adjustments resulting from translation areincluded in accumulated other comprehensive income (loss), a separate component of shareholders’ equity. Gainsand losses resulting from other transactions originally in foreign currencies and then translated into U.S. dollars areincluded in net income. Net foreign exchange gains resulting from foreign currency transactions included in otherexpense (income), net were $114,000 for the year ended December 31, 2006. Net foreign exchange losses resultingfrom foreign currency transactions included in other expense (income), net were $557,000 and $22,000 for the yearsended December 31, 2005 and 2004, respectively.
Cash Equivalents and Short-Term Investments
The company’s cash equivalents and short-term investments are invested in highly liquid, low risk moneymarkets, commercial paper, certificates of deposit, and municipal bonds. The cash equivalents include investmentswith original maturities less than 90 days. The short-term investments include investments with original maturitiesgreater than 90 days. All short-term investments are treated as held to maturity and are valued at amortized cost. AtDecember 31, 2006, none of the short-term investments had a remaining maturity greater than 90 days. AtDecember 31, 2006 and 2005, the company had $2.1 million of cash equivalents in foreign bank accounts.
At December 31, 2005, the company had certificates of deposit that supported a stand-by letter of credit inconnection with the lease obligation for the Chicago office. This amount was reported as restricted cash on thebalance sheet for the year ended December 31, 2005. Under terms of an amended lease agreement signed in October2006, the company paid a cash deposit and the letter of credit was returned to us.
40
PCTEL, Inc.
NOTES TO THE CONSOLIDATED FINANCIAL STATEMENTS — (Continued)For the Year Ended: December 31, 2006

Cash equivalents and short-term investments consist of the following:
2006 2005December 31,
Cash and Cash EquivalentsMoney market funds . . . . . . . . . . . . . . . . . . . . . . . . . . . . . . . . . . . . . . . . . . . . $18,242 $58,966
Certificates of deposit . . . . . . . . . . . . . . . . . . . . . . . . . . . . . . . . . . . . . . . . . . . 12,000 —
Commercial paper . . . . . . . . . . . . . . . . . . . . . . . . . . . . . . . . . . . . . . . . . . . . . . 23,905 —
Municipal bonds . . . . . . . . . . . . . . . . . . . . . . . . . . . . . . . . . . . . . . . . . . . . . . . 5,001 —
Total . . . . . . . . . . . . . . . . . . . . . . . . . . . . . . . . . . . . . . . . . . . . . . . . . . . . . . . 59,148 58,966
Short-Term InvestmentsCommercial paper . . . . . . . . . . . . . . . . . . . . . . . . . . . . . . . . . . . . . . . . . . . . . . 7,934 —
Municipal bonds . . . . . . . . . . . . . . . . . . . . . . . . . . . . . . . . . . . . . . . . . . . . . . . 3,689 —
Total . . . . . . . . . . . . . . . . . . . . . . . . . . . . . . . . . . . . . . . . . . . . . . . . . . . . . . . 11,623 —
Cash equivalents and short-term investments . . . . . . . . . . . . . . . . . . . . . . . . . . $70,771 $58,966
Allowance for Doubtful Accounts
The company maintains an allowance for doubtful accounts for estimated uncollectible accounts receivable.The allowance is based on the company’s assessment of known delinquent accounts, historical experience, andother currently available evidence of the collectability and the aging of accounts receivable. The company’s totalallowance for doubtful accounts was $0.3 million at December 31, 2006 and December 31, 2005, respectively. Theprovision for doubtful accounts is included in sales and marketing expense.
Inventories
Inventories are stated at the lower of cost or market and include material, labor and overhead costs using theFIFO method of costing. Inventories as of December 31, 2006 were composed of raw materials, sub assemblies,finished goods and work-in-process. The company regularly monitors inventory quantities on hand and, based onthe current estimated requirements, it was determined that any excess inventory was reserved as of December 31,2006 and 2005. Due to competitive pressures and technological innovation, there may be excess inventory in thefuture. As of December 31, 2006 and December 31, 2005, the allowance for inventory losses was $0.9 million.Write-downs of inventories would have a negative impact on gross margin.
Inventories consist of the following (in thousands):
2006 2005December 31,
Raw materials . . . . . . . . . . . . . . . . . . . . . . . . . . . . . . . . . . . . . . . . . . . . . . . . . . $6,089 $7,299
Work in process . . . . . . . . . . . . . . . . . . . . . . . . . . . . . . . . . . . . . . . . . . . . . . . . . 417 309
Finished goods . . . . . . . . . . . . . . . . . . . . . . . . . . . . . . . . . . . . . . . . . . . . . . . . . . 1,635 2,804
Excess & obsolescence reserve . . . . . . . . . . . . . . . . . . . . . . . . . . . . . . . . . . . . . . (883) (865)
Inventories, net . . . . . . . . . . . . . . . . . . . . . . . . . . . . . . . . . . . . . . . . . . . . . . . . $7,258 $9,547
Prepaid and other current assets
Prepaid assets are stated at cost and are amortized over their useful lives (up to one year) of the assets.
41
PCTEL, Inc.
NOTES TO THE CONSOLIDATED FINANCIAL STATEMENTS — (Continued)For the Year Ended: December 31, 2006

Property and Equipment
Property and equipment are stated at cost and are depreciated using the straight-line method over the estimateduseful lives of the assets. The company depreciates computers over three years, office equipment and manufacturingequipment over five years, furniture and fixtures over seven years, and buildings over 30 years. Leaseholdimprovements are amortized over the shorter of the corresponding lease term or useful life. Gains and losses on thedisposal of fixed assets are included in operating expenses. Maintenance and repairs are expensed as incurred.
Property and equipment consists of the following (in thousands):
2006 2005December 31,
Building . . . . . . . . . . . . . . . . . . . . . . . . . . . . . . . . . . . . . . . . . . . . . . . . . . . . . $ 5,810 $ 5,344
Land . . . . . . . . . . . . . . . . . . . . . . . . . . . . . . . . . . . . . . . . . . . . . . . . . . . . . . . 1,770 1,770
Computer and office equipment . . . . . . . . . . . . . . . . . . . . . . . . . . . . . . . . . . . . 3,238 2,519
Manufacturing Equipment . . . . . . . . . . . . . . . . . . . . . . . . . . . . . . . . . . . . . . . . 4,559 3,585
Furniture and fixtures . . . . . . . . . . . . . . . . . . . . . . . . . . . . . . . . . . . . . . . . . . . 1,043 817
Leasehold improvements . . . . . . . . . . . . . . . . . . . . . . . . . . . . . . . . . . . . . . . . . 155 65
Motor Vehicles . . . . . . . . . . . . . . . . . . . . . . . . . . . . . . . . . . . . . . . . . . . . . . . . 43 116
Total property and equipment . . . . . . . . . . . . . . . . . . . . . . . . . . . . . . . . . . . 16,618 14,216
Less: Accumulated depreciation and amortization . . . . . . . . . . . . . . . . . . . . . . (4,261) (3,026)
Property and equipment, net . . . . . . . . . . . . . . . . . . . . . . . . . . . . . . . . . . . . $12,357 $11,190
Depreciation expense was approximately $1.9, $1.7 and $1.1 million for the years ended December 31, 2006,2005 and 2004, respectively.
Revenue Recognition
The company sells antenna products, software defined radio products, and licenses the modem technologythrough the licensing program. The company records the sale of these products, including related maintenance, andthe licensing of the intellectual property as revenue.
In accordance with SAB No. 104, the company recognizes revenue when the following criteria are met:persuasive evidence of an arrangement exists, delivery has occurred or services have been rendered, price is fixedand determinable, and collectibility is reasonably assured. The company recognizes revenue for sales of the antennaproducts and software defined radio products, when title transfers, which is predominantly upon shipment from thefactory. Revenue is recognized for antenna products sold to major distributors upon shipment from the factory. Thecompany allows its major antenna product distributors to return product under specified terms and conditions. Thecompany accrues for product returns in accordance with FAS 48, “Revenue Recognition When Right of ReturnExists”.
The company recognizes revenue from the Wi-Fi and cellular mobility software, including related mainte-nance rights, under “SOP 97-2 Software Revenue Recognition” as amended by SOP-98 “Modification of SOP-72,Software Recognition with Respect to Certain Transactions.” If the software license is perpetual and vendor specificobjective evidence can be established for the software license and any related maintenance rights, the softwarelicense revenue is recognized upon delivery of the software and the maintenance is recorded pro-rata over the life ofthe maintenance rights. If part of the licensing agreement requires engineering services to customize software forthe customer needs, the revenue for these services is recognized upon completion of engineering documentation. Ifvendor specific objective evidence cannot be established, and the only undelivered item is maintenance, the
42
PCTEL, Inc.
NOTES TO THE CONSOLIDATED FINANCIAL STATEMENTS — (Continued)For the Year Ended: December 31, 2006

software license revenue, the revenue associated with engineering services, if applicable, and the related main-tenance rights are combined and recognized pro-rata over the expected term of the maintenance rights. If vendorspecific evidence cannot be established on any of the non-maintenance elements, the revenue is recorded pro-rataover the life of the contractual obligation. At December 31, 2006, the company had unbilled revenue ofapproximately $0.8 million for mobility software products. At December 31, 2005, the company had unbilledrevenue of approximately $0.3 million.
The company records intellectual property licensing revenue when it has a licensing agreement, the amount ofrelated royalties is known for the accounting period reported, and collectibility is reasonably assured. Knowledge ofthe royalty amount specific to an accounting period is either in the form of a royalty report specific to a quarter, acontractual fixed payment in the license agreement specific to a quarter, or the pro-rata amortization of a fixedpayment related to multiple quarters over those quarters using the operating lease method. If a license agreementprovides for a fixed payment related to periods prior to the license effective date (the past) and volume-basedroyalties going forward, the fixed payment is recognized at the license effective date and the volume based royaltiesare recognized as royalty reports are received. If the license provides for a fixed payment for the past and for a finitefuture period, to be followed by volume based royalties thereafter, the fixed payment is recorded under the operatinglease method and recognized pro-rata from the effective date through the end of the period covered by the fixedpayment. If a one-time license payment is made for a perpetual license, with no future obligations on behalf of us,revenue is recognized under the capitalized lease method upon the effective date.
There is one exception to the recognition of intellectual property licensing as revenue. The company signed alicensing agreement with Conexant simultaneously with the sale of its HSP modem product line to Conexant in2003. Because the HSP modem product line also requires a license to the company’s patent portfolio, the gain onsale of the product line and the licensing stream are not separable for accounting purposes. Ongoing royalties fromConexant are presented in the income statement as Gain on Sale of Assets and Related Royalties.
Research & Development and Software Development Costs
The company expenses research and development costs as incurred. All costs incurred prior to establishing thetechnological feasibility of computer software products to be sold are research and development costs and expensedas incurred in accordance with SFAS 86, “Accounting for the Costs of Computer Software to Be Sold, Leased, orOtherwise Marketed”. To date, the company has expensed all software development costs because costs incurredsubsequent to the products reaching technological feasibility were not significant.
Advertising Costs
Advertising costs are expensed in the period in which they are incurred. Advertising expense was $0.2 millionin fiscal years 2006 and 2005, and $0.3 million in fiscal 2004.
Income Taxes
The company provides for income taxes under the provisions of SFAS No. 109, “Accounting for IncomeTaxes”. SFAS No. 109 requires an asset and liability based approach in accounting for income taxes. Deferredincome tax assets and liabilities are recorded based on the differences between the financial statement and tax basesof assets and liabilities using enacted tax rates. Valuation allowances are provided against deferred tax assets, whichare not likely to be realized. On a periodic basis, management evaluates the recoverability of deferred tax assets andthe need for a valuation allowance.
43
PCTEL, Inc.
NOTES TO THE CONSOLIDATED FINANCIAL STATEMENTS — (Continued)For the Year Ended: December 31, 2006

Stock-Based Compensation
In the first fiscal quarter of 2006, the company adopted SFAS No. 123(R), “Share Based Payments,” whichrevises SFAS No. 123, “Accounting for Stock Based Compensation.” SFAS No. 123(R) requires the company torecord compensation expense for share-based payments, including employee stock options, at fair value. Prior tofiscal 2006, the company had accounted for its stock-based compensation awards pursuant to Accounting PrinciplesOpinion (APB) No. 25, “Accounting for Stock Issued to Employees”, and its related interpretations, which alloweduse of the intrinsic value method. Under the intrinsic value method, compensation expense for stock option basedemployee compensation was not recognized in the income statement as all stock options granted by the companyhad an exercise price equal to the market value of the underlying common stock on the option grant date.
The company elected to use the modified prospective transition method to adopt SFAS No. 123(R). Under thistransition method, compensation expense includes expense for all share-based payments granted prior to, but notyet vested as of January 1, 2006, based on the grant date fair value estimated in accordance with the originalprovisions of SFAS No. 123, and the expense for all share-based payments granted subsequent to January 1, 2006based on the grant date fair value estimated in accordance with the provisions of SFAS No. 123(R). As requiredunder the modified prospective transition method the company has not restated prior period results. As a result,certain components of the company’s quarterly financial statements will not be comparable until the first quarter offiscal 2007, the anniversary of the company’s adoption of SFAS No. 123(R). As part of the adoption ofSFAS No. 123(R), the company used the alternative transition method in SFAS 123(R) to establish the beginningbalance of the additional paid in capital (APIC) pool related to employee compensation. The company determinedthat it is in a net shortfall position and thus, started at $0 for the APIC pool in the quarter ended March 31, 2006.
In the quarter ended March 31, 2005, the company accelerated the vesting of all unvested options to purchaseshares of common stock of PCTEL that were held by current employees, including executive officers, and whichhave an exercise price per share equal to or greater than $10.00. The weighted average price of the sharesaccelerated was $11.24. The effect of this acceleration resulted in PCTEL not being required to recognize share-based compensation expense of $3.8 million in the periods after adoption of SFAS No. 123(R).
The following table illustrates the pro forma effect on net income and earnings per share if the company hadapplied the fair value recognition provisions of SFAS No. 123 to stock options and the Employee Stock PurchasePlan for the years ended December 31, 2005 and 2004:
2005 2004
Year EndedDecember 31,
Net loss — as reported . . . . . . . . . . . . . . . . . . . . . . . . . . . . . . . . . . . . . . . . . . . $(3,713) $(2,738)
Add: Stock-based employee compensation expense included in reported netloss . . . . . . . . . . . . . . . . . . . . . . . . . . . . . . . . . . . . . . . . . . . . . . . . . . . . . . . 4,051 1,425
Deduct: Stock-based employee compensation expense determined under fairvalue based method for all awards . . . . . . . . . . . . . . . . . . . . . . . . . . . . . . . . (9,126) (6,184)
Net loss — proforma . . . . . . . . . . . . . . . . . . . . . . . . . . . . . . . . . . . . . . . . . . . . $(8,788) $(7,497)
Net loss income per share — basic as reported . . . . . . . . . . . . . . . . . . . . . . . . . $ (0.18) $ (0.14)
Net loss income per share — basic proforma . . . . . . . . . . . . . . . . . . . . . . . . . . . $ (0.44) $ (0.37)
Net loss income per share — diluted as reported . . . . . . . . . . . . . . . . . . . . . . . . $ (0.18) $ (0.14)
Net loss income per share — diluted proforma . . . . . . . . . . . . . . . . . . . . . . . . . $ (0.44) $ (0.37)
44
PCTEL, Inc.
NOTES TO THE CONSOLIDATED FINANCIAL STATEMENTS — (Continued)For the Year Ended: December 31, 2006

Goodwill and Other Intangible Assets
The company reports operating results for three segments: Broadband Technology, Mobility Solutions, andLicensing. For evaluation purposes, we test each operating segment for possible goodwill and other intangibleassets impairment annually, by comparing each segment’s net book value to fair value in accordance withSFAS No. 142, “Goodwill and Other Intangible Assets”. The process of evaluating the potential impairment ofgoodwill is subjective. To estimate the fair value of the operating segments, we made estimates and judgments aboutthe future cash flows of our operating segments. The assumptions used in our cash flow forecasts are consistent withplans and estimates we use to manage the underlying operating segments. The company’s assumptions requiresignificant judgment and actual cash flows may differ from those forecasted. A third-party valuation firm providedthe weighted average cost of capital (WACC) used for the company’s evaluation.
Intangible assets consist principally of technology, non-compete agreements, patents, trademarks and trade-names, and customer relationships and are amortized over a period of one to eight years.
Fair Value of Financial Instruments
Cash and cash equivalents, and short-term investments are recognized and measured at fair value in thecompany’s financial statements. Accounts receivable and other investments are financial assets with carrying valuesthat approximate fair value. Accounts payable, other accrued expenses and short-term debt are financial liabilitieswith carrying values that approximate fair value.
Recent Accounting Pronouncements
In September 2006, the Securities and Exchange Commission issued Staff Accounting Bulletin (“SAB”)No. 108, Considering the Effects of Prior Year Misstatements when Quantifying Current Year Misstatements.SAB No. 108 requires analysis of misstatements using both an income statement (rollover) approach and a balancesheet (iron curtain) approach in assessing materiality and provides for a one-time cumulative effect transitionadjustment. SAB No. 108 is effective for the company’s fiscal year 2006 annual financial statements. Currently, thecompany prepares an analysis for all misstatements using the dual approach. The dual approach incorporates boththe income statement and balance sheet for measuring materiality. There is no impact to adoption of thispronouncement at December 31, 2006.
In September 2006, the Financial Accounting Standards Board (FASB) issued Statement of FinancialAccounting Standards (SFAS) No. 157, Fair Value Measurements, which defines fair value, establishes a frame-work for measuring fair value in generally accepted accounting principles, and expands disclosures about fair valuemeasurements. SFAS No. 157 does not require any new fair value measurements, but provides guidance on how tomeasure fair value by providing a fair value hierarchy used to classify the source of the information. SFAS 157 iseffective for financial statements issued for fiscal years beginning after November 15, 2007. We will adoptSFAS 157 on its effective date. The company is in the process of determining any potential impact that the adoptionof SFAS No. 157 will have on our financial statements.
In July 2006, FASB released FASB Interpretation No. 48, “Accounting for Uncertainty in Income Taxes, aninterpretation of FASB Statement No. 109” (FIN 48). FIN 48 clarifies the accounting and reporting for uncertaintiesin income tax positions. FIN 48 prescribes a recognition threshold and measurement attribute for the financialstatement recognition and measurement of a tax position taken or expected to be taken in a tax return. FIN 48 alsoprovides guidance on derecognition, classification, interest and penalties, accounting in interim periods, disclosureand transition. FIN 48 is effective for fiscal years ending after December 15, 2006. We will adopt FIN 48 as ofJanuary 1, 2007, as required. The cumulative effects, if any, of applying this Interpretation will be recorded as anadjustment to retained earnings as of the beginning of the period of adoption. The company is currently evaluating
45
PCTEL, Inc.
NOTES TO THE CONSOLIDATED FINANCIAL STATEMENTS — (Continued)For the Year Ended: December 31, 2006

the provisions of FIN 48 and has not yet completed the determination of the impact of adoption on the company’sresults of operations or financial position.
In May 2005, the Financial Accounting Standards Board (FASB) issued Statement of Financial AccountingStandards (SFAS) No. 154, “Accounting Changes and Error Corrections” , a replacement of APB Opinion No. 20and FASB Statement No. 3. This statement applies to all voluntary changes in accounting principle, and requiresretrospective application to prior periods’ financial statements for changes in accounting principle. SFAS No. 154will be effective for the company beginning in fiscal year 2007. The company does not believe this statement willhave a material impact on the company’s financial statements.
Effective January 1, 2006, the company adopted SFAS No. 123(R), “Share Based Payments, “as described inNote 11, Stock-Based Compensation, in the Notes to the Consolidated Financial Statements.
2. Earnings Per Share
The company computes earnings per share in accordance with SFAS No. 128, “Earnings Per Share”.SFAS No. 128 requires companies to compute net income per share under two different methods, basic anddiluted, and present per share data for all periods in which statements of operations are presented. Basic earnings pershare is computed by dividing net income/(net loss) by the weighted average number of shares of common stockoutstanding, less shares subject to repurchase. Diluted earnings per share are computed by dividing net income bythe weighted average number of common stock and common stock equivalents outstanding. Common stockequivalents consist of stock options using the treasury stock method. Common stock options are excluded from thecomputation of diluted earnings per share if their effect is anti-dilutive. The weighted average common stock optiongrants excluded from the calculations of diluted net loss per share for the year ended December 31, 2006 were701,591. The weighted average common stock option grants and restricted shares excluded from the calculations ofdiluted net loss per share for the years ended December 31, 2005 and December 31, 2004 were 554,699 and684,763, respectively.
46
PCTEL, Inc.
NOTES TO THE CONSOLIDATED FINANCIAL STATEMENTS — (Continued)For the Year Ended: December 31, 2006

The following table provides a reconciliation of the numerators and denominators used in calculating basic anddiluted earnings per share for the years ended December 31, 2006, 2005 and 2004, respectively (in thousands,except per share data):
2006 2005 2004Years Ended December 31,
Numerator:Net Loss . . . . . . . . . . . . . . . . . . . . . . . . . . . . . . . . . . . . . . . . . . . (10,019) (3,713) (2,738)
Denominator:
Basic loss per share:
Weighted average common shares outstanding . . . . . . . . . . . . . . 21,975 21,250 20,467
Less: Weighted average shares subject to repurchase . . . . . . . . . (1,165) (1,104) (610)
Weighted average common shares outstanding . . . . . . . . . . . . . . 20,810 20,146 20,074
Basic loss per share . . . . . . . . . . . . . . . . . . . . . . . . . . . . . . . . . . . $ (0.48) $ (0.18) $ (0.14)
Diluted loss per share:
Weighted average common shares outstanding . . . . . . . . . . . . . . 20,810 20,146 20,074
Weighted average shares subject to repurchase . . . . . . . . . . . . . . * * *
Weighted average common stock option grants . . . . . . . . . . . . . * * *
Weighted average common shares and common stockequivalents . . . . . . . . . . . . . . . . . . . . . . . . . . . . . . . . . . . . . . 20,810 20,146 20,074
Diluted loss per share . . . . . . . . . . . . . . . . . . . . . . . . . . . . . . . . . . $ (0.48) $ (0.18) $ (0.14)
* These amounts have been excluded since the effect is anti-dilutive.
3. Acquisitions
Sigma Wireless Technologies
In July 2005, the company purchased all of the outstanding shares of Sigma Wireless Technology Limited(“Sigma”), a developer, manufacturer and distributor of antenna products designed for public safety and for theUMTS cellular networks. With the acquisition of Sigma, the company gained entry into the growing cellular basestation antenna market and also gained a geographic footprint in Europe.
The company paid cash consideration of 19.4 million Euro (approximately $23.1 million), plus assumed anunfunded pension obligation of approximately 2.5 million Euro (approximately $3.0 million), and incurredapproximately 1.7 million Euro (approximately $2.0 million) in transaction costs.
The total purchase price of 23.6 million Euro (approximately $28.2 million) was allocated $8.2 million totangible assets acquired, $7.8 million to liabilities assumed, $2.5 million to core technology, $6.4 million tocustomer relationships, and $0.1 million to order backlog in the accompanying consolidated balance sheets. Theintangible assets have a weighted average amortization period of six years. The $15.7 million excess of the purchaseprice over the fair value of the net tangible and intangible assets was allocated to goodwill. The company willamortize the order backlog over one year and the other intangible assets over six years. The company evaluated thevalue of the assets acquired from Sigma. A third-party valuation firm was engaged to assist in the evaluation. In thethird quarter 2006, the company recorded an impairment charge of $20.3 million in conjunction with therestructuring of the Dublin operations. See Note 4, Goodwill and Other Intangible Assets, and Note 7, Restructuringfor discussion of the Dublin restructuring and the impairment of goodwill and other intangible assets related to the
47
PCTEL, Inc.
NOTES TO THE CONSOLIDATED FINANCIAL STATEMENTS — (Continued)For the Year Ended: December 31, 2006

Sigma product lines. During 2006, the company recorded a final goodwill adjustment of $0.5 million as a result of asettlement with the former owners of Sigma. The purchase accounting was complete in 2006.
The consolidated statements of operations for the year ended December 31, 2005 include the results of Sigmafrom the date of acquisition. During the year ended December 31, 2005, the company recorded additional goodwilladjustments of 0.5 million Euro (approximately $0.6 million) primarily related to inventory and accountsreceivable.
The unaudited pro forma affect on the financial results of PCTEL as if the acquisition had taken place onJanuary 1, 2005 and January 1, 2004 is as follows:
2005 2004
Years EndedDecember 31,
Revenues . . . . . . . . . . . . . . . . . . . . . . . . . . . . . . . . . . . . . . . . . . . . . . . . . . $82,936 $59,197
Loss from operations . . . . . . . . . . . . . . . . . . . . . . . . . . . . . . . . . . . . . . . . . . (4,296)* (7,186)
Net loss . . . . . . . . . . . . . . . . . . . . . . . . . . . . . . . . . . . . . . . . . . . . . . . . . . . (3,283) (5,709)
Basic loss per share . . . . . . . . . . . . . . . . . . . . . . . . . . . . . . . . . . . . . . . . . . . $ (0.16) $ (0.28)
Shares used in computing basic loss per share . . . . . . . . . . . . . . . . . . . . . . . 20,146 20,074
Diluted loss per share . . . . . . . . . . . . . . . . . . . . . . . . . . . . . . . . . . . . . . . . . $ (0.16) $ (0.28)
Shares used in computing diluted loss per share . . . . . . . . . . . . . . . . . . . . . . 20,146 20,074
* The pro forma results include a $2.8 million gain on the sale of Sigma’s Dublin property, including the land andbuilding.
Andrew
On October 29, 2004, PCTEL acquired selected assets associated with Andrew Corporation’s mobile antennabusiness for a total of $10.9 million in cash. The assets acquired consisted of Andrew’s GPS, On-Glass, and AntennaSpecialists» brand of professional antenna products. These product lines were integrated into the operations of theBroadband Technology Group. The purchase price was allocated $5.4 million to net tangible assets acquired,$0.6 million to core technology, $2.6 million to customer relationships, $0.3 million to trademarks and $0.3 millionto order backlog and other intangible assets, net, in the accompanying consolidated balance sheets. The $1.7 millionexcess of the purchase price over the fair value of the net tangible and intangible assets was allocated to goodwill.The company is amortizing the intangible assets over estimated useful lives ranging from six to eight years. During2005, the company adjusted goodwill $0.6 million related to inventory adjustments. The purchase accounting wascomplete at December 31, 2005.
The unaudited pro forma effect on the financial results of PCTEL as if the acquisition had taken place onJanuary 1, 2004 is as follows:
December 31,2004
REVENUES . . . . . . . . . . . . . . . . . . . . . . . . . . . . . . . . . . . . . . . . . . . . . . . . . . . . . . . . $66,566
LOSS FROM OPERATIONS* . . . . . . . . . . . . . . . . . . . . . . . . . . . . . . . . . . . . . . . . . . (3,931)
* The Andrew Acquisition information is carved out of a larger business unit within Andrew. No data is availablebelow loss from operations.
48
PCTEL, Inc.
NOTES TO THE CONSOLIDATED FINANCIAL STATEMENTS — (Continued)For the Year Ended: December 31, 2006

MAXRAD, Inc.
In January, 2004, PCTEL acquired the outstanding capital stock of MAXRAD, Inc, a manufacturer of wirelesscommunications antennas for broadband wireless, in-building wireless and land mobile radio applications.
PCTEL paid $18.2 million, net of cash acquired of $2.4 million, out of the available working capital. Thepurchase price of $20.6 million in cash, of which $0.4 million was paid in April 2004, was allocated $7.6 million tonet tangible assets acquired, $0.9 million to the covenant not to compete, $1.3 million to core technology,$3.2 million to customer lists, $1.4 million to trademarks and $0.1 million to other intangible assets, net, in theaccompanying consolidated balance sheets. The $6.1 million excess of the purchase price over the fair value of thenet tangible and intangible assets was allocated to goodwill. The covenant not to compete was amortized over twoyears and other intangible assets over an estimated useful life of six and eight years.
4. Goodwill and Other Intangible Assets
In conjunction with the completion of the restructuring of Dublin operations, the company reevaluated thecarrying value of the goodwill and intangible assets for technology and customer relationships, as required byStatement of Financial Accounting Standards No. 144 “Accounting for the Impairment or the Disposal of LongLived Assets” and Statement of Accounting Standards No. 142 “Goodwill and Intangible Assets”. Based on revisedprojections for future revenues, profits, and cash flows for the products associated with the Sigma acquisition, thecompany concluded that the carrying value of intangible assets was impaired by $6.0 million and the carrying valueof the goodwill was impaired by $14.3 million. The total impairment cost was recorded in the third quarter of 2006.The method of determining the impairment was the same methodology as used for our annual impairment test.
Goodwill
The company conducted the annual impairment test of goodwill as of October 31, 2006. For this evaluation,each operating segment’s fair value was greater than its net book value and no impairment indicators existed exceptfor the Dublin operations mentioned above. To estimate the fair value of the operating segments, we made estimatesand judgments about the future cash flows of our operating segments. The assumptions used in our cash flowforecasts are consistent with plans and estimates we use to manage the underlying operating segments. Thecompany’s assumptions require significant judgment and actual cash flows may differ from those forecasted.
The summary of goodwill as of December 31 for the years ended 2006 and 2005 is as follows (in thousands):
2006 2005
Mobility Solutions Group . . . . . . . . . . . . . . . . . . . . . . . . . . . . . . . . . . . . . . . . $ 1,256 $ 1,256
Broadband Technology Group . . . . . . . . . . . . . . . . . . . . . . . . . . . . . . . . . . . . . 16,313 29,764
$17,569 $31,020
During 2006, goodwill decreased $13.5 million due to the impairment of goodwill of $14.3 million related tothe Sigma product lines, purchase accounting adjustments of $0.5 million related to the Sigma acquisition, and$0.4 million due to foreign currency translation adjustments.
Intangible Assets
The company amortizes intangible assets with finite lives on a straight-line basis over the estimated usefullives, which range from 1 to 8 years. Amortization expense was approximately $3.6, $4.1 and $3.0 million for theyears ended December 31, 2006, 2005 and 2004, respectively.
The company had intangible assets of $25.3 million with accumulated amortization of $17.9 million atDecember 31, 2006 and intangible assets of $24.7 million with accumulated amortization of $8.2 million at
49
PCTEL, Inc.
NOTES TO THE CONSOLIDATED FINANCIAL STATEMENTS — (Continued)For the Year Ended: December 31, 2006

December 31, 2005. The summary of other intangible assets, net as of December 31 for the years ended 2006 and2005 is as follows (in thousands):
2006 2005
Customer contracts and relationships, net of accumulated amortization of $8,469in 2006 and $2,980 in 2005 . . . . . . . . . . . . . . . . . . . . . . . . . . . . . . . . . . . . . . $4,679 $10,148
Patents and technology, net of accumulated amortization of $6,913 in 2006 and$2,979 in 2005 . . . . . . . . . . . . . . . . . . . . . . . . . . . . . . . . . . . . . . . . . . . . . . . 1,659 4,859
Trademarks and trade names, net of accumulated amortization of $986 in 2006and $673 in 2005 . . . . . . . . . . . . . . . . . . . . . . . . . . . . . . . . . . . . . . . . . . . . . 1,113 1,426
Other, net of accumulated amortization of $1,548 in 2006 and $1,524 in 2005 . . — 24
$7,451 $16,457
The decrease in intangible assets reflects the impairment of the customer relationships and technology relatedto the Sigma product lines of $6.0 million, amortization of $3.6 million, and foreign currency translationadjustments of $0.6 million.
The assigned lives and weighted average amortization periods by intangible asset category is summarizedbelow:
Intangible Assets Assigned Life
WeightedAverage
AmortizationPeriod
Customer contracts and relationships. . . . . . . . . . . . . . . . . . . . . . . . . . . 4 to 6 years 6.0
Patents and technology . . . . . . . . . . . . . . . . . . . . . . . . . . . . . . . . . . . . . 4 to 8 years 5.1
Trademarks and trade names. . . . . . . . . . . . . . . . . . . . . . . . . . . . . . . . . 4 to 8 years 7.2
Other . . . . . . . . . . . . . . . . . . . . . . . . . . . . . . . . . . . . . . . . . . . . . . . . . . 1 to 2 years 1.7
The company’s scheduled amortization expense over the next five years is as follows:
Fiscal Year Amount
2007 . . . . . . . . . . . . . . . . . . . . . . . . . . . . . . . . . . . . . . . . . . . . . . . . . . . . . . . . . . . . . . . . . $2,0952008 . . . . . . . . . . . . . . . . . . . . . . . . . . . . . . . . . . . . . . . . . . . . . . . . . . . . . . . . . . . . . . . . . $1,876
2009 . . . . . . . . . . . . . . . . . . . . . . . . . . . . . . . . . . . . . . . . . . . . . . . . . . . . . . . . . . . . . . . . . $1,876
2010 . . . . . . . . . . . . . . . . . . . . . . . . . . . . . . . . . . . . . . . . . . . . . . . . . . . . . . . . . . . . . . . . . $1,037
2011 . . . . . . . . . . . . . . . . . . . . . . . . . . . . . . . . . . . . . . . . . . . . . . . . . . . . . . . . . . . . . . . . . $ 402
5. Comprehensive Income
The following table provides the calculation of other comprehensive income for the years ended December 31,2006, 2005 and 2004 (in thousands):
2006 2005 2004Years Ended December 31,
Net loss. . . . . . . . . . . . . . . . . . . . . . . . . . . . . . . . . . . . . . . . . . . . . $(10,019) $(3,713) $(2,738)
Other comprehensive income:
Cumulative translation adjustment . . . . . . . . . . . . . . . . . . . . . . . 1,954 (251) 18
Unrealized gains (loss) on available-for-sale Securities . . . . . . . . — — (26)
Comprehensive loss . . . . . . . . . . . . . . . . . . . . . . . . . . . . . . . . . . . . $ (8,065) $(3,964) $(2,746)
50
PCTEL, Inc.
NOTES TO THE CONSOLIDATED FINANCIAL STATEMENTS — (Continued)For the Year Ended: December 31, 2006

6. Short-term borrowings
Ireland
On June 9, 2006, PCTEL Limited (formerly Sigma) entered into a Euro 3.5 million line of credit with Bank ofAmerica. The line of credit is guaranteed by PCTEL, Inc. At December 31, 2006, the company had Euro 0.7 million($0.8 million) outstanding under the line of credit. The maximum borrowings under this line of credit was Euro1.3 million ($1.6 million) in fiscal 2006. The interest rate on this line of credit is the ECB (European Central Bank)rate plus 1.75%. The weighted average interest rate for this borrowing was 5.0% in 2006. This line of credit isrenewable annually.
China
MAXRAD Tianjin, the company’s subsidiary in China, borrowed 780,000 Chinese Yuan ($0.1 million) onJuly 31, 2006 with Bank of America. This amount represented the maximum borrowings allowed under thisagreement. This loan is guaranteed by PCTEL, Inc and is renewable annually. The interest rate on this borrowing isthe China Central Bank rate plus a mark-up of 10%. The weighted average interest rate for this borrowing was 6.4%in 2006. As of December 31, 2006, the company had $0.1 million outstanding under this line of credit.
7. Restructuring
Dublin restructuring
The 2006 restructuring expense relates to the company’s Dublin, Ireland restructuring activity. On April 7,2006, the company reached an agreement in principle with the labor union responsible for the company’smanufacturing and certain other personnel in its Dublin, Ireland factory to discontinue the manufacture of theiVET, PMR and DPMR lines of the company’s antenna products at that location. The agreement was formallysigned on April 20, 2006. This agreement enabled the company to wind down its manufacturing operations at theDublin facility, terminate 65 redundant employee positions, downsize its space under the current lease at thislocation, and reduce its pension obligations to terminated and remaining employees. Manufacturing of the lines ofantenna products was relocated either to a contract manufacturer in St. Petersburg, Russia, or to the company’s BTGfacility in Bloomingdale, Illinois. The process of winding down manufacturing operations in Dublin and relocatingthe products to their new manufacturing locations was completed in September 2006. The general and admin-istrative support functions were eliminated in December 2006.
The company continues to maintain antenna research and development, as well as sales and marketingactivities in a smaller space within the existing facility in Dublin. The company believes that its restructuringactivities will enable it to improve the gross profit margins of the antenna product lines that were included with thecompany’s acquisition of Sigma Wireless Technologies in July 2005.
The company incurred restructuring costs related to the discontinuation of its Dublin manufacturing oper-ations. The categories of costs are: severance pay for employees whose jobs were made redundant, future minimumlease payments through June 2007 on the existing Dublin facility which will be vacated, and, termination of theemployee pension defined benefit plan. The severance, future lease payments, and a portion of the termination ofthe employee pension defined benefit plan result in cash expenditures. The company also incurred restructuringcosts related to the impairment of fixed assets and inventory.
For the year ended December 31, 2006, the company recorded restructuring expense of $0.4 million, whichincluded the net benefit related to the termination of the pension plan of $2.6 million, offsetting employee severanceof $1.5 million, inventory write-offs of $0.8 million, fixed asset write-offs of $0.6 million, and facility lease costs of$0.1 million.
51
PCTEL, Inc.
NOTES TO THE CONSOLIDATED FINANCIAL STATEMENTS — (Continued)For the Year Ended: December 31, 2006

The company negotiated the terms of the pension termination with the Sigma labor union in June 2006. Underthe terms of the settlement, the company funded the cash shortfall in the company’s PCTEL Europe Pension Plan ascalculated by a third party actuary less any severance amounts given to employees that exceeded 3 weeks severancefor every year of service. The funding shortfall was based on pension requirements in accordance with Irishregulations. The company funded pension obligations of $0.6 million and recorded a net gain of $2.6 million on thetermination.
During the year ended December 31, 2006, the company paid employee severance of approximately$2.4 million. Total net severance costs of approximately $1.5 million are comprised of a gross cost of $2.4 millionless a government rebate of $0.9 million.
The write-offs for inventory related to disposals of inventory that was not compatible with the new man-ufacturing model. The fixed asset write-offs related to assets identified that are no longer required at the Dublinfacility. The company downsized the facility at the end of the third quarter of 2006. The restructuring expense forlease termination costs relates to the future lease payments for the facility space no longer required.
The following table summarizes the company’s restructuring activity during 2006 and the status of the reservesat year end (in thousands):
AccrualBalance atDecember
2005Restructuring
ExpenseCash
Payments
Non-cashSettlements/Adjustments
AccrualBalance atDecember
2006
Severance and employment relatedcosts . . . . . . . . . . . . . . . . . . . . . — $ 1,472 $(1,472) — —
Fixed asset and inventory write-offs . . . . . . . . . . . . . . . . . . . . . . — 1,414 — (1,414) —
Pension termination . . . . . . . . . . . . — (2,572) (639) 3,211 —
Facility lease . . . . . . . . . . . . . . . . . — 75 (23) 52
— $ 389 $(2,134) $ 1,797 $52
Modem restructuring
In October 2004, the company discontinued its Soft AP product line. The amount charged to restructuring forseverance costs in California and Taiwan as well as costs associated with the closure of the Taiwan branch office was$0.1 million. The 2004 restructuring costs were paid in full by the end of fiscal 2005.
The following table summarizes the company’s restructuring activity during 2005:
AccrualBalance atDecember
2004Restructuring
ExpenseCash
Payments
Non-cashSettlements/Adjustments
AccrualBalance atDecember
2005
Severance and employmentrelated costs . . . . . . . . . . . . . $ 47 ($3) ($44) — —
Facility lease . . . . . . . . . . . . . . 575 (59) (516) — —
$622 ($62) ($560) $ 0 $ 0
52
PCTEL, Inc.
NOTES TO THE CONSOLIDATED FINANCIAL STATEMENTS — (Continued)For the Year Ended: December 31, 2006

8. Income Taxes
The domestic and foreign components of the loss before provision (benefit) for income taxes were as follows(in thousands):
2006 2005 2004Years Ended December 31,
Domestic . . . . . . . . . . . . . . . . . . . . . . . . . . . . . . . . . . . . . . . . . . . . $ 9,924 $(1,090) $(3,266)
Foreign . . . . . . . . . . . . . . . . . . . . . . . . . . . . . . . . . . . . . . . . . . . . . (24,556) (2,388) (13)
$(14,632) $(3,478) $(3,279)
The provision (benefit) for income taxes consisted of the following (in thousands):
2006 2005 2004Years Ended December 31,
Current:
Federal . . . . . . . . . . . . . . . . . . . . . . . . . . . . . . . . . . . . . . . . . . . . . . $(4,889) 2 $(1,054)
State . . . . . . . . . . . . . . . . . . . . . . . . . . . . . . . . . . . . . . . . . . . . . . . 86 155 (184)
Foreign . . . . . . . . . . . . . . . . . . . . . . . . . . . . . . . . . . . . . . . . . . . . . 31 (309) 380
(4,772) (152) (859)
Deferred:
Federal . . . . . . . . . . . . . . . . . . . . . . . . . . . . . . . . . . . . . . . . . . . . . . 157 335 274
State . . . . . . . . . . . . . . . . . . . . . . . . . . . . . . . . . . . . . . . . . . . . . . . 2 52 43
159 387 317
$(4,613) $ 235 $ (541)
A reconciliation of the provision (benefit) for income taxes at the federal statutory rate compared to theprovision (benefit) at the effective tax rate is as follows (in thousands):
2006 2005 2004Years Ended December 31,
Benefit at federal statutory rate (35%) . . . . . . . . . . . . . . . . . . . . . . . $(5,121) $(1,217) $(1,148)
State income tax, net of federal benefit . . . . . . . . . . . . . . . . . . . . . . 105 113 (330)
Change in valuation allowance . . . . . . . . . . . . . . . . . . . . . . . . . . . . . 4,903 1,501 1,558
Foreign income taxed at different rates . . . . . . . . . . . . . . . . . . . . . . . 290 716 —
Research & development credit . . . . . . . . . . . . . . . . . . . . . . . . . . . . (118) (388) (388)
Return to provision adjustments . . . . . . . . . . . . . . . . . . . . . . . . . . . . (73) (699) (195)
Change in deferred tax liability related to goodwill. . . . . . . . . . . . . . 350 388 317
Tax effect of permanent differences . . . . . . . . . . . . . . . . . . . . . . . . . 330 87 559
Adjustments to deferred tax assets . . . . . . . . . . . . . . . . . . . . . . . . . . — (305) (347)
Reduction of tax reserves. . . . . . . . . . . . . . . . . . . . . . . . . . . . . . . . . (5,235) — (404)
Other . . . . . . . . . . . . . . . . . . . . . . . . . . . . . . . . . . . . . . . . . . . . . . . (44) 39 (163)
$(4,613) $ 235 $ (541)
53
PCTEL, Inc.
NOTES TO THE CONSOLIDATED FINANCIAL STATEMENTS — (Continued)For the Year Ended: December 31, 2006

The current federal expense for 2006 includes the release of a $5.2 million tax contingency reserve related tothe company’s modem operations and utilization of $1.3 million in federal research credits. The company alsoutilized its remaining carryforwards for federal net operating losses in 2006.
Deferred income taxes reflect the net tax effects of temporary differences between the carrying amounts ofassets and liabilities for financial reporting purposes and the amounts used for income tax purposes. The netdeferred tax accounts consist of the following (in thousands):
2006 2005December 31,
Deferred Tax Assets:Accruals and reserves . . . . . . . . . . . . . . . . . . . . . . . . . . . . . . . . . . . . . . . . . . $ 1,712 $ 1,048
Net operating loss carryforwards . . . . . . . . . . . . . . . . . . . . . . . . . . . . . . . . . . 236 2,140
Federal and state credits . . . . . . . . . . . . . . . . . . . . . . . . . . . . . . . . . . . . . . . . 2,919 3,840
Restricted stock . . . . . . . . . . . . . . . . . . . . . . . . . . . . . . . . . . . . . . . . . . . . . . 1,238 976
Depreciation and amortization. . . . . . . . . . . . . . . . . . . . . . . . . . . . . . . . . . . . 12,861 5,810
Gross deferred tax assets . . . . . . . . . . . . . . . . . . . . . . . . . . . . . . . . . . . . . . . 18,966 13,814
Valuation allowance . . . . . . . . . . . . . . . . . . . . . . . . . . . . . . . . . . . . . . . . . . . (18,862) (13,814)
Net deferred tax asset . . . . . . . . . . . . . . . . . . . . . . . . . . . . . . . . . . . . . . . . . . 104 —
Deferred Tax liabilities:Amortization . . . . . . . . . . . . . . . . . . . . . . . . . . . . . . . . . . . . . . . . . . . . . . . . (1,067) (805)
Net Deferred Tax Liability . . . . . . . . . . . . . . . . . . . . . . . . . . . . . . . . . . . . . $ (963) $ (805)
At December 31, 2006, the company had a valuation allowance of $18.9 million against $19.0 million ofdeferred tax assets due to the uncertainty surrounding the realization of these assets. The company’s net deferred taxassets were $0.1 million at December 31, 2006 compared to $0 at December 31, 2005. On a periodic basis,management evaluates the recoverability of deferred tax assets and the need for a valuation allowance. At such timeas it is determined that it is more likely than not that the deferred tax assets are realizable, the valuation allowancewill be reduced. The increase in deferred tax assets in 2006 is due to amortization of intangible assets for taxpurposes, net of federal net operating losses and research credits.
The effective tax rate differed from the statutory federal rate of 35% during 2006 principally due to the releaseof the tax contingency reserve of $5.2 million and due to the increase in the valuation allowance for deferred taxassets. In addition, different rates for foreign income and losses and other permanent items impacted the effectivetax rate. The effective tax rate differed from the statutory federal rate of 35% during 2005 principally due to anincrease in the valuation allowance for deferred tax assets, different rates for foreign income and losses, andrevisions to certain estimates made by management to other deferred tax assets. During the fourth quarter 2005, thecompany changed its estimate regarding the taxation of certain leasing income received in 2004. As a result, thecompany reversed the tax expense it booked in 2004 to reflect the change in estimate regarding its filing position. In2005 the increase in the deferred tax valuation allowance primarily resulted from an increase in deferred tax assetsrelated to net operating losses. The effective tax rate differed from the statutory federal rate of 35% during 2004principally due to permanent differences including adjustments to the deferred tax valuation allowance.
The company believes that approximately $0.9 million of undistributed earnings of foreign subsidiaries arereinvested indefinitely, and no federal income tax should be provided under the plan of investment. The AmericanJobs Creation Act of 2004 (“the Act”) was passed into law on October 22, 2004 and introduced a special one-timedividend received deduction under certain circumstances on the repatriation of certain foreign earnings to a United
54
PCTEL, Inc.
NOTES TO THE CONSOLIDATED FINANCIAL STATEMENTS — (Continued)For the Year Ended: December 31, 2006

States of America taxpayer. The company did not repatriate the earnings of our foreign subsidiaries as dividends totake advantage of this tax credit.
The company has state net operating loss carryforwards of $2.3 million that expire between 2011 and 2016 andforeign net operating loss carryforwards of $0.4 million that have no expiration date. Utilization of the historic netoperating losses of PCTEL Limited have been severely limited due to the Dublin restructuring activities andaccordingly, the company did not reflect a net deferred tax asset related to those net operating losses. As such, thecompany does not consider there to be any future tax benefits for net operating losses in Ireland. The company has$1.7 million of federal research credits that expire between 2020 and 2025 and $1.6 million of state research creditswith no expiration.
9. Commitments and Contingencies
Leases
The company has operating leases for office facilities through 2012. The future minimum rental paymentsunder these leases at December 31, 2006, are as follows (in thousands):
Year Amount
2007 . . . . . . . . . . . . . . . . . . . . . . . . . . . . . . . . . . . . . . . . . . . . . . . . . . . . . . . . . . . . . . . . . $ 985
2008 . . . . . . . . . . . . . . . . . . . . . . . . . . . . . . . . . . . . . . . . . . . . . . . . . . . . . . . . . . . . . . . . . 832
2009 . . . . . . . . . . . . . . . . . . . . . . . . . . . . . . . . . . . . . . . . . . . . . . . . . . . . . . . . . . . . . . . . . 830
2010 . . . . . . . . . . . . . . . . . . . . . . . . . . . . . . . . . . . . . . . . . . . . . . . . . . . . . . . . . . . . . . . . . 833
2011 . . . . . . . . . . . . . . . . . . . . . . . . . . . . . . . . . . . . . . . . . . . . . . . . . . . . . . . . . . . . . . . . . 865
2012 and thereafter . . . . . . . . . . . . . . . . . . . . . . . . . . . . . . . . . . . . . . . . . . . . . . . . . . . . . . 787
Future minimum lease payments . . . . . . . . . . . . . . . . . . . . . . . . . . . . . . . . . . . . . . . . . . . . $5,132
The rent expense under leases in use for the years ended December 31, 2006, 2005 and 2004 was approx-imately $1.1 million, $0.7 million and $0.6 million, respectively.
In February 2006, the company entered into a lease for a new facility in Germantown, Maryland for the scannerand receiver product lines. In February 2006 the company vacated its previous Germantown, Maryland facility. Thelease term for the previous facility ends in July 2007. The company recorded lease exit costs in 2006 for the previousGermantown facility.
In September 2006, the company renegotiated its Dublin, Ireland facility lease. Because of the relocation ofDublin manufacturing, the company reduced its leased space and established a new termination date of July 2007.The company is currently considering leased space in a new facility for its Dublin engineering operations.
In October 2006, the company amended the Chicago, Illinois lease whereby the term was extended to 2012 andthe square footage was increased.
The company does not have any capital leases.
Warranty Reserve and Sales Returns
The company’s BTG segment allows its major distributors and certain other customers to return unusedproduct under specified terms and conditions. In accordance with FAS 48, the company accrues for product returnsbased on historical sales and return trends. The company’s allowance for sales returns was $242,000 and $247,000at December 31, 2006 and December 31, 2005, respectively.
55
PCTEL, Inc.
NOTES TO THE CONSOLIDATED FINANCIAL STATEMENTS — (Continued)For the Year Ended: December 31, 2006

The company offers repair and replacement warranties of primarily two years for antenna products and oneyear for scanners and receivers. The company’s warranty reserve is based on historical sales and costs of repair andreplacement trends. The warranty reserve was $184,000 and $147,000 at December 31, 2006 and December 31,2005, respectively.
Legal Proceedings
Ronald H. Fraser v. PC-Tel, Inc., Wells Fargo Shareowner Services, Wells Fargo Bank Minnesota, N.A.
In March 2002, plaintiff Ronald H. Fraser (“Fraser”) filed a complaint in the California Superior Court forbreach of contract and declaratory relief against the company, and for breach of contract, conversion, negligenceand declaratory relief against the company’s transfer agent, Wells Fargo Bank Minnesota, N.A. The complaint seekscompensatory damages allegedly suffered by Fraser as a result of the sale of certain stock by Fraser during asecondary offering in April, 2000. At a mandatory settlement conference held in September 2004, Fraser stipulatedto judgment in favor of the company. In November 2004 Fraser appealed the judgment entered against him. OnFebruary 6, 2007, the Court of Appeal for the Sixth Appellate District issued an opinion affirming the trial court’sorder granting PCTEL’s motion for summary judgment. On March 2, 2007, Fraser submitted an appeal of thisdecision and on March 7, 2007, the Court of Appeal for the Sixth Appellate District denied his appeal.
Litigation with Agere and Lucent
In May 2003, the company filed in the U.S. District Court for the Northern District of California a patentinfringement lawsuit against Agere Systems and Lucent Technologies claiming that Agere has infringed four of thecompany’s patents and that Lucent has infringed three of the company’s patents. Agere counterclaimed asking for adeclaratory judgment that the claims of the four patents are invalid, unenforceable and not infringed by Agere.
On July 26, 2006, the parties entered into a settlement agreement which was favorable to the company, and onJuly 31, 2006 the court dismissed with prejudice all claims and counterclaims in the action. As part of the settlementagreement, the company granted Agere a perpetual license for $7.0 million.
10. Shareholders Equity
Common Stock
The activity related to common shares outstanding for the years ended December 31 is as follows:
2006 2005 2004
Beginning of year . . . . . . . . . . . . . . . . . . . . . . . . . . . . . . . . . . . . . . . . 21,423 20,620 20,146
Release of shares — Voyager acquisition . . . . . . . . . . . . . . . . . . . . . . . — — 15
Issuance of common stock on exercise of stock options . . . . . . . . . . . . 380 178 589
Issuance of restricted common stock, net of cancellations . . . . . . . . . . . 282 642 282
Issuance of common stock from purchase of Employee Stock PurchasePlan shares . . . . . . . . . . . . . . . . . . . . . . . . . . . . . . . . . . . . . . . . . . . 74 70 49
Issuance of common stock for stock bonuses . . . . . . . . . . . . . . . . . . . . 224 — —
Cancellation of stock for withholding tax . . . . . . . . . . . . . . . . . . . . . . . (91) — —
Common stock buyback . . . . . . . . . . . . . . . . . . . . . . . . . . . . . . . . . . . (227) (87) (461)
End of Year . . . . . . . . . . . . . . . . . . . . . . . . . . . . . . . . . . . . . . . . . . . . 22,065 21,423 20,620
56
PCTEL, Inc.
NOTES TO THE CONSOLIDATED FINANCIAL STATEMENTS — (Continued)For the Year Ended: December 31, 2006

Preferred Stock
The company is authorized to issue up to 5,000,000 shares of preferred stock in one or more series, each with apar value of $0.001 per share. As of December 31, 2006 and 2005, no shares of preferred stock were outstanding
11. Stock-Based Compensation
Stock Options
The Board of Directors may grant employees, directors or consultants the option to purchase the company’scommon stock. The company issues stock options with exercise prices no less than the fair value of the company’sstock on the grant date. Most options contain gradual vesting provisions, whereby 25% vest one year from the dateof grant and thereafter in monthly increments over the remaining three years. Through the end of fiscal 2006, newemployees received stock options for incentive purposes. Effective fiscal 2007, new employees will be grantedrestricted stock for incentive purposes. Recent CEO option grants vest over two years and contain performancemeasures where the number of options may increase. Annual option grants to directors vest over one year. Any newnon-employee director elected to the Board of Directors automatically receives a grant of 15,000 shares of commonstock. The 15,000 share options will vest one-third as of each anniversary of its date of grant until the option is fullyvested, provided that the optionee continues to serve as a director on such dates. After the initial 15,000 shareoptions are granted to the non-employee director, he or she shall automatically be granted an option to purchase10,000 shares each year on January 1, if on such date he or she shall have served on the Board of Directors for atleast six months. The 10,000 share options shall vest completely on the first year anniversary of their date of grant,provided that the optionee continues to serve as a director on such date. Options may be exercised at any time withinten years of the date of grant or within ninety days of termination of employment, or such shorter time as may beprovided in the related stock option agreement. The company issued 530,589 options with a weighted average fairvalue of $3.00 in the year ended December 31, 2006 and 538,850 options with a weighted average fair value of$3.03 for the year ended December 31, 2005. During the year ended December 31, 2006, the company received$2.9 million in proceeds from the exercise of 380,542 options. During the year ended December 31, 2005, thecompany received $1.3 million in proceeds from the exercise of 177,732 options.
Deferred Stock Compensation (Restricted Stock)
The company grants restricted shares as employee incentives as permitted under the company’s 1997 StockPlan. In connection with the grant of restricted stock to employees, the company records deferred stockcompensation representing the fair value of the common stock on the date the restricted stock is granted. Suchamount is presented as a reduction of stockholders’ equity and is amortized ratably over the vesting period of theapplicable shares. The company grants restricted awards that vest over various periods. Annual grants to employeesfor incentive purposes vest annually over five years. For the year ended December 31, 2006, the company issued438,674 shares of restricted stock with a fair value of $3.8 million and recorded terminations of 88,500 for$0.8 million. For the year ended December 31, 2005, the company issued 720,436 shares of restricted stock with afair value of $5.6 million and recorded terminations of 77,200 shares for $0.7 million. During 2006, 289,226restricted shares vested with a value of $2.5 million. During 2005, 149,436 restricted shares vested with a value of$1.2 million. The restricted shares are awarded from the 1997 Stock Plan.
Employee Stock Purchase Plan (“Purchase Plan”)
In May 1998, the company reserved a total of 800,000 shares of common stock for future issuance under thecompany’s Purchase Plan, plus annual increases equal to the lesser of (i) 350,000 shares (ii) 2% of the outstandingshares on such date or (iii) a lesser amount determined by the Board of Directors. The Board of Directors elected notto increase the shares in the Purchase Plan in January 2006 or January 2007 because the remaining shares areexpected to exceed the requirements prior to the termination of the Purchase Plan in 2008. The Purchase Plan
57
PCTEL, Inc.
NOTES TO THE CONSOLIDATED FINANCIAL STATEMENTS — (Continued)For the Year Ended: December 31, 2006

enables eligible employees to purchase common stock at the lower of 85% of the fair market value of the commonstock on the first or last day of each offering period. Each offering period is six months. During 2006 and 2005,74,550 and 69,636 shares were issued under the Purchase Plan, respectively. As of December 31, 2006, the companyhad 1,706,737 shares remaining that can be issued under the Purchase Plan.
Stock Plans
1997 Plan
In November 1996, the Board of Directors adopted and approved the 1997 Stock Option Plan (“1997 Plan”).Under the 1997 Plan, the Board may grant to employees, directors and consultant’s options to purchase the commonstock and/or stock purchase rights at terms and prices determined by the Board. In August 1999, the Board ofDirectors and the stockholders approved an amendment and restatement of the 1997 Plan that increased the numberof authorized shares of the common stock the company may issue under the 1997 Plan to 5,500,000. The planallowed further increases annually the number of shares authorized to issue under the 1997 Plan by an amount equalto the lesser of (i) 700,000 shares, (ii) 4% of the outstanding shares on such date or (iii) a lesser amount determinedby the Board of Directors. In January 2006, 700,000 shares were authorized for the 1997 Plan. Effective at theannual shareholders meeting on June 5, 2006 and prior to the termination of the 1997 Plan, the shareholdersapproved an amended and restated 1997 Plan (“New 1997 Plan”) that expires in 2016. The existing shares availablefor issuance and options outstanding were transferred from the 1997 Plan to the New 1997 Plan. In connection withthe approval of the New 1997 Plan, an additional 716,711 shares were authorized. As of December 31, 2006, a totalof 11,079,124 shares have been authorized under the New 1997 Plan and 2,273,557 shares remain available forfuture grants.
1998 Director Option Plan (“Directors Plan”)
The Directors Plan became effective following the company’s IPO in October 1999. A total of 400,000 shareswere authorized under the Directors Plan. Effective with the annual shareholders meeting in June 2006, theDirectors Plan was merged in the New 1997 Plan. Effective with the merger, 75,000 available shares weretransferred from the Directors Plan to the New 1997 Plan. No further awards will be made under the Director Plan,but it will continue to govern awards previously granted thereunder. Future awards to the Company’s directors willbe made under the New 1997 Plan.
2001 Plan
In August 2001, the Board of Directors adopted and approved the 2001 Non-statutory Stock Option Plan(“2001 Plan”). Options granted under the 2001 Plan may be exercised at any time within ten years from the date ofgrant or within ninety days of termination of employment, or such shorter time as may be provided in the relatedstock option agreement. The 2001 Plan will terminate in 2011. As of December 31, 2006, of the total 750,000 sharesauthorized under the 2001 Plan, 158,520 remain available for future grants.
Executive Plan
In 2001, in connection with the hiring and appointment of two executive officers of PCTEL, the companygranted an aggregate amount of 300,000 options at $8.00 per share outside of any stock option plan, pursuant toindividual stock option agreements. As of December 31, 2006, 53,733 options are outstanding under the ExecutivePlan.
58
PCTEL, Inc.
NOTES TO THE CONSOLIDATED FINANCIAL STATEMENTS — (Continued)For the Year Ended: December 31, 2006

Acceleration of Underwater Options
On January 28, 2005, the Compensation Committee of the Board of Directors approved the acceleration ofvesting of all unvested options to purchase shares of common stock of PCTEL that are held by current employees,including executive officers, and which have an exercise price per share equal to or greater than $10.00. Options topurchase 1,606,805 shares of common stock were accelerated under this approval. The company accelerated theseoptions in order to mitigate the associated future share-based compensation expense under SFAS 123(R). Theacceleration of these options will result in PCTEL not being required to recognize share-based compensationexpense of approximately $3.8 million beginning in the company’s quarter ending March 31, 2006 and through thecompany’s quarter ending March 31, 2008. The pro-forma net loss and pro-forma net loss per share for the yearended December 31, 2005 in Note 1 includes the $3.8 million impact of the acceleration of the underwater options.There was no income statement impact related to the acceleration of options for the year ended December 31, 2005.
A summary of the company’s stock option activity the share available and the stock option activity under all ofthe company’s stock Plans as of December 31, 2006:
SharesAvailable
OptionsOutstanding
SharesAvailable
OptionsOutstanding
SharesAvailable
OptionsOutstanding
2006 2005 2004
Beginning of Year . . . . . . . . 1,807,526 4,112,881 1,834,435 4,362,972 2,882,663 3,486,108
Shares authorized . . . . . . . . . 1,416,711 — 700,000 — 700,000 —
Options granted . . . . . . . . . . (530,589) 530,589 (538,850) 538,850 (1,821,155) 1,821,155
Restricted stock awards . . . . (438,674) — (720,436) — (292,778) —
Restricted shares cancelled . . 126,000 — 77,200 — 11,000 —
Bonus shares awarded . . . . . (223,698) — — — — —
Options exercised. . . . . . . . . — (380,542) — (177,732) — (589,586)
Options forfeited . . . . . . . . . 156,340 (156,340) 359,279 (359,279) 114,142 (114,142)
Options cancelled . . . . . . . . 140,961 (140,961) 251,930 (251,930) 240,563 (240,563)
Shares expired . . . . . . . . . . . — — (156,032) — — —
End of Year . . . . . . . . . . . . 2,454,577 3,965,627 1,807,526 4,112,881 1,834,435 4,362,972
Exercisable . . . . . . . . . . . . . 3,162,192 3,239,426 1,555,523
Weighted average exerciseprice:
Outstanding at Beginningof Year . . . . . . . . . . . . . . 9.54 9.82 9.48
Options granted . . . . . . . . . . 9.37 8.41 10.88
Options exercised. . . . . . . . . 7.55 7.36 7.89
Options forfeited . . . . . . . . . 11.98 13.54 26.51
Options cancelled . . . . . . . . 9.04 7.84 9.63
Outstanding at End ofYear . . . . . . . . . . . . . . . . 9.63 9.54 9.82
Exercisable at End ofYear . . . . . . . . . . . . . . . . 9.78 9.92 9.77
59
PCTEL, Inc.
NOTES TO THE CONSOLIDATED FINANCIAL STATEMENTS — (Continued)For the Year Ended: December 31, 2006

The weighted average contractual life and intrinsic value at December 31, 2006 was the following:
WeightedAverage
ContractualLife
IntrinsicValue
Options Outstanding . . . . . . . . . . . . . . . . . . . . . . . . . . . . . . . . . . . . . . . . . . . 6.96 $2,762
Options Exercisable . . . . . . . . . . . . . . . . . . . . . . . . . . . . . . . . . . . . . . . . . . . 6.46 $2,314
The range of exercise prices for options outstanding and exercisable at December 31, 2006 was $5.96 to$59.00. The following table summarizes information about stock options outstanding under all stock option plans:
Range of Exercise PricesNumber
Outstanding
WeightedAverage
RemainingContractual
Life
Weighted-Average
Exercise PriceNumber
Exercisable
WeightedAverage
Exercise Price
Options Outstanding Options Exercisable
$ 5.96 — $ 7.20 . . . . . . . . . . 477,333 5.44 $ 6.83 466,500 $ 6.84
7.26 — 7.81 . . . . . . . . . . 397,307 6.50 7.49 318,137 7.52
7.83 — 8.40 . . . . . . . . . . 397,594 6.38 7.98 337,928 7.96
8.44 — 9.09 . . . . . . . . . . 446,373 7.62 8.83 199,804 8.92
9.11 — 10.20 . . . . . . . . . . 398,850 8.63 9.44 106,518 9.83
10.25 — 10.70 . . . . . . . . . . 625,000 6.97 10.54 585,252 10.54
10.72 — 11.55 . . . . . . . . . . 462,170 7.30 11.21 387,053 11.25
11.56 — 11.84 . . . . . . . . . . 720,100 7.06 11.72 720,100 11.72
12.16 — 13.30 . . . . . . . . . . 33,400 6.63 12.82 33,400 12.82
59.00 — 59.00 . . . . . . . . . . 7,500 3.08 59.00 7,500 59.00
$ 5.96 — $59.00 . . . . . . . . . . 3,965,627 6.96 $ 9.63 3,162,192 $ 9.78
The table below shows the company’s outstanding restricted stock and unrecognized compensation expense atDecember 31, 2006:
Grant YearShares
Outstanding
WeightedAverage
Fair Value
UnrecognizedCompensation
Expense
WeightedAverage
Life
2002 . . . . . . . . . . . . . . . . . . . . . . . . . . . . . . . . . 129,000 6.63 $ 855 1.84
2003 . . . . . . . . . . . . . . . . . . . . . . . . . . . . . . . . . 59,000 11.59 684 1.68
2004 . . . . . . . . . . . . . . . . . . . . . . . . . . . . . . . . . 107,400 12.27 1,318 1.92
2005 . . . . . . . . . . . . . . . . . . . . . . . . . . . . . . . . . 445,100 7.84 3,491 2.97
2006 . . . . . . . . . . . . . . . . . . . . . . . . . . . . . . . . . 424,248 8.63 3,661 3.95
1,164,748 $10,009
60
PCTEL, Inc.
NOTES TO THE CONSOLIDATED FINANCIAL STATEMENTS — (Continued)For the Year Ended: December 31, 2006

The following table summarizes restricted stock activity for the years ended December 31:
2006 2005 2004
SharesBeginning of Year . . . . . . . . . . . . . . . . . . . . . . . . . . . . . . . . . . 1,103,800 610,000 405,356
Restricted stock awards . . . . . . . . . . . . . . . . . . . . . . . . . . . . . . 438,674 720,436 292,778
Restricted shares vested . . . . . . . . . . . . . . . . . . . . . . . . . . . . . . (289,226) (149,436) (77,134)
Restricted shares cancelled . . . . . . . . . . . . . . . . . . . . . . . . . . . . (88,500) (77,200) (11,000)
End of Year . . . . . . . . . . . . . . . . . . . . . . . . . . . . . . . . . . . . . . 1,164,748 1,103,800 610,000
Weighted Average Fair ValueBeginning of year . . . . . . . . . . . . . . . . . . . . . . . . . . . . . . . . . . 8.51 9.42 7.49
Restricted stock awards . . . . . . . . . . . . . . . . . . . . . . . . . . . . . . 8.64 7.77 11.45
Restricted shares vested . . . . . . . . . . . . . . . . . . . . . . . . . . . . . . 8.55 8.36 9.05
Restricted shares cancelled . . . . . . . . . . . . . . . . . . . . . . . . . . . . 8.09 8.62 10.13
End of year . . . . . . . . . . . . . . . . . . . . . . . . . . . . . . . . . . . . . . . 8.56 8.51 9.42
Common Stock Reserved for Future Issuance
At December 31, 2006, the company had 8,089,441 shares of common stock that could potentially be issuedunder various stock-based compensation plans described in Note 11. A summary of the reserved shares of commonstock for future issuance are as follows:
2006 2005December 31,
1997 Stock Option Plan . . . . . . . . . . . . . . . . . . . . . . . . . . . . . . . . . . . . . . . 5,728,627 4,885,646
2001 Stock Option Plan . . . . . . . . . . . . . . . . . . . . . . . . . . . . . . . . . . . . . . . 600,344 601,094
1998 Director Option Plan . . . . . . . . . . . . . . . . . . . . . . . . . . . . . . . . . . . . . — 400,000
Executive Plan . . . . . . . . . . . . . . . . . . . . . . . . . . . . . . . . . . . . . . . . . . . . . 53,733 86,667
Employee Stock Purchase Plan . . . . . . . . . . . . . . . . . . . . . . . . . . . . . . . . . 1,706,737 1,781,287
Total shares reserved . . . . . . . . . . . . . . . . . . . . . . . . . . . . . . . . . . . . . . . . . 8,089,441 7,754,694
These amounts include the shares available for grant and the options outstanding.
Stock-Based Compensation Expense
Total stock compensation expense for the year ended December 31, 2006 was $4.5 million in the consolidatedstatements of operations, which included $2.4 million of restricted stock amortization, $1.2 million for stock optionexpense, $0.7 million for stock bonuses, and $0.2 million for stock compensation expense for the Employee StockPurchase Plan (ESPP). The company recorded $0.4 million of tax benefits to additional paid in capital related to theexercise of stock options and vesting of restricted stock for the year ended December 31, 2006. The impact ofadopting SFAS 123R on net income related to stock-based equity awards was $1.4 million and $0.07 per basic anddiluted share in the year ended December 31, 2006. This amount represents the stock compensation recorded forstock option and for the ESPP. In fiscal 2005 and 2004 no compensation expense was recorded with respect to stockoptions granted as all options granted had an exercise price equal to the market value of the underlying commonstock on the date of grant. In addition, no compensation expense was recorded for purchases under our EmployeeStock Purchase Plan in accordance with APB 25.
61
PCTEL, Inc.
NOTES TO THE CONSOLIDATED FINANCIAL STATEMENTS — (Continued)For the Year Ended: December 31, 2006

Restricted Stock
The company records the amortization of deferred compensation and stock bonuses within the functionalexpense lines of the income statement. For the year ended December 31, 2006 the company recorded amortizationof deferred compensation of $2.4 million, net of forfeitures. For the year ended December 31, 2005, the companyrecorded amortization of deferred compensation of $2.4 million.
Stock Bonuses
The bonuses for the company’s 2006 Short Term Bonus Incentive Plan will be paid in shares of the company’scommon stock in the first quarter of 2007. The company recorded stock-based compensation expense of$0.7 million for the Short Term Bonus Incentive Plan for the year ended December 31, 2006. The bonuses forthe company’s 2005 Short Term Bonus Incentive Plan and the 2005 CEO Stretch Bonus Plan were paid in shares ofthe company’s common stock in the first quarter of 2006. The company recorded stock-based compensationexpense of $1.5 million for the Short Term Bonus Incentive Plan for the year ended December 31, 2005. Thecompany recorded stock-based compensation expense of $0.2 million for the 2005 CEO Stretch Bonus Plan for theyear ended December 31, 2005.
Stock Options
In the first fiscal quarter of fiscal 2006, the company adopted SFAS No. 123(R), “Share Based Payments,”which revises SFAS No. 123, “Accounting for Stock Based Compensation.” SFAS No. 123(R) requires the companyto record compensation expense for share-based payments, including employee stock options, at fair value. Prior tofiscal 2006, the company had accounted for its stock based compensation awards pursuant to Accounting PrinciplesOpinion (APB) No. 25, “Accounting for Stock Issued to Employees”, and its related interpretations, which alloweduse of the intrinsic value method. Under the intrinsic value method, compensation expense for stock option basedemployee compensation was not recognized in the income statement as all stock options granted by the companyhad an exercise price equal to the market value of the underlying common stock on the option grant date. With theadoption of SFAS 123(R), the company is recognizing compensation expense for stock options on a graded vestingbasis.
The company elected to use the modified prospective transition method to adopt SFAS No. 123(R). Under thistransition method, compensation expense includes expense for all share-based payments granted prior to, but notyet vested as of January 1, 2006, based on the grant date fair value estimated in accordance with the originalprovisions of SFAS No. 123, and the expense for all share-based payments granted subsequent to January 1, 2006based on the grant date fair value estimated in accordance with the provisions of SFAS No. 123(R). As requiredunder the modified prospective transition method the company has not restated prior period results. As a result,certain components of the company’s quarterly financial statements will not be comparable until the first quarter offiscal 2007, the anniversary of the company’s adoption of SFAS No. 123(R).
Total stock compensation expense for stock options was $1.2 million, net of forfeitures for the year endedDecember 31, 2006. As of December 31, 2006, the unrecognized compensation expense related to the unvestedportion of the company’s stock options was approximately $1.6 million, net of estimated forfeitures to berecognized through 2010 over a weighted average period of 1.5 years.
The fair value of each unvested option was estimated on the date of grant using the Black-Scholes optionvaluation model. The Black-Scholes option valuation model was developed for use in estimating the fair value oftraded options, which have no vesting restrictions and are fully transferable. In addition, option valuation modelsrequire the input of highly subjective assumptions including the expected stock price volatility and expected optionlife. Because the company’s employee stock options have characteristics significantly different from those of tradedoptions, and because changes in the subjective input assumptions can materially affect the fair value estimate the
62
PCTEL, Inc.
NOTES TO THE CONSOLIDATED FINANCIAL STATEMENTS — (Continued)For the Year Ended: December 31, 2006

existing models may not necessarily provide a reliable single measure of the fair value of the employee stockoptions. Based on the Black-Scholes option-pricing model, the weighted average estimated fair value of employeestock option grants was $3.00 for 2006, $3.03 for 2005, and $3.63 for 2004.
ESPP
Based on the 15% discount and the fair value of the option feature of this plan, this plan is consideredcompensatory under SFAS 123(R). Compensation expense is calculated using the fair value of the employees’purchase rights under the Black-Scholes model. The company recognized compensation expense of $0.2 million forthe year ended December 31, 2006.
The company calculated the fair value of each option grant and employee stock purchase grant on the date ofgrant using the Black-Scholes option-pricing model as prescribed by SFAS 123 using the following assumptions:
2006 2005 2004 2006 2005 2004Stock Options
Employee StockPurchase Plan
Dividend yield. . . . . . . . . . . . . . . . . . . . . . . . . . None None None None None None
Risk-free interest rate . . . . . . . . . . . . . . . . . . . . 4.8% 3.6% 2.2% 4.7% 3.4% 1.4%Expected volatility . . . . . . . . . . . . . . . . . . . . . . . 48% 50% 45% 48% 37% 41%
Expected life (in years) . . . . . . . . . . . . . . . . . . . 2.4 2.9 3.0 0.5 0.5 0.5
The risk-free interest rate was based on the U.S. Treasury yields with remaining term that approximates theexpected life of the options granted. The company used an expected dividend yield of 0% for all periods because thecompany has never paid and does not anticipate paying dividends in the foreseeable future. The company calculatesthe volatility based on a historical period starting with January 2001. Prior to fiscal 2006, the company used theactual forfeiture method allowed under SFAS No. 123, which assumed that all options vest and pro forma expensewas adjusted when options were forfeited. In 2006, the company incorporated a forfeiture rate based on historicaldata in the expense calculation. The expected life used for options granted in 2006 is based on historical data ofemployee exercise performance. Prior to fiscal 2006, the expected life was based on the average life of outstandingoptions.
Total non-cash compensation is reflected in the statements of operations as follows (in thousands):
2006 2005 2004Years Ended December 31,
Cost of goods sold . . . . . . . . . . . . . . . . . . . . . . . . . . . . . . . . . . . . . . . $ 331 $ 164 —
Research and development . . . . . . . . . . . . . . . . . . . . . . . . . . . . . . . . . 630 309 $ 108
Sales and marketing . . . . . . . . . . . . . . . . . . . . . . . . . . . . . . . . . . . . . . 873 812 303
General and administrative . . . . . . . . . . . . . . . . . . . . . . . . . . . . . . . . . 2,668 2,766 1,014
$4,502 $4,051 $1,425
Employee Withholding Taxes on Stock Awards
Effective January 1, 2006, for ease in administering the issuance of stock awards, the company holds backshares of vested restricted stock awards and short-term incentive plan stock awards for the value of the withholdingtaxes. During the year ended December 31, 2006, the company paid $1.4 million for withholding taxes related tostock awards.
63
PCTEL, Inc.
NOTES TO THE CONSOLIDATED FINANCIAL STATEMENTS — (Continued)For the Year Ended: December 31, 2006

12. Stock Repurchases
In August 2002, the Board of Directors authorized the repurchase of up to 1,000,000 shares of the commonstock. In February and November 2003, the company extended the stock repurchase program to repurchase up to1,000,000 and 500,000 additional shares, respectively, on the open market from time to time. During 2006, thecompany repurchased 227,100 shares for approximately $2.1 million and during 2005 the company repurchased86,900 shares for approximately $0.8 million. Since the inception of the stock repurchase program the company hasrepurchased 2,314,000 shares of the outstanding common stock for approximately $18.7 million.
The following table is a history of the share repurchases by year for the year ended December 31 ($’s inthousands):
STOCK REPURCHASES
Fiscal Year Shares Amount
2002 . . . . . . . . . . . . . . . . . . . . . . . . . . . . . . . . . . . . . . . . . . . . . . . . . . . . . . 775,800 $ 5,282
2003 . . . . . . . . . . . . . . . . . . . . . . . . . . . . . . . . . . . . . . . . . . . . . . . . . . . . . . 762,800 6,224
2004 . . . . . . . . . . . . . . . . . . . . . . . . . . . . . . . . . . . . . . . . . . . . . . . . . . . . . . 461,400 4,3102005 . . . . . . . . . . . . . . . . . . . . . . . . . . . . . . . . . . . . . . . . . . . . . . . . . . . . . . 86,900 759
2006 . . . . . . . . . . . . . . . . . . . . . . . . . . . . . . . . . . . . . . . . . . . . . . . . . . . . . . 227,100 2,134
2,314,000 $18,709
13. Industry Segment, Customer and Geographic Information
The company principally operates in three business segments. They are Broadband Technology Group (BTG),Mobility Solutions Group (MSG), and Licensing. In May 2003, the company sold its modem product line toConexant. Modems was a segment through 2004. Intercompany sales and profits are eliminated. The segmentinformation for the years ended 2005 and 2004 have been restated to reflect the company’s current segmentreporting structure.
PCTEL’s chief operating decision maker (CEO) uses only the below measures in deciding how to allocateresources and assess performance among the segments.
The results of operations by segment are as follows for the years ended December 31 (in thousands):
BTG MSG Licensing Modems Total
2006Revenue . . . . . . . . . . . . . . . . . . . . . . . . . . . . $68,088 $9,793 $8,681 — $ 86,562
Gross Profit . . . . . . . . . . . . . . . . . . . . . . . . . $28,175 $9,739 $8,658 — $ 46,572
Operating Expenses . . . . . . . . . . . . . . . . . . . $ 64,507
Operating (Loss) . . . . . . . . . . . . . . . . . . . . . . $(17,935)
BTG MSG Licensing Modems Total
2005Revenue . . . . . . . . . . . . . . . . . . . . . . . . . . . . $68,535 $6,922 $2,289 — $77,746
Gross Profit . . . . . . . . . . . . . . . . . . . . . . . . . . $27,899 $6,762 $2,207 — $36,868
Operating Expenses . . . . . . . . . . . . . . . . . . . . $41,892
Operating (Loss) . . . . . . . . . . . . . . . . . . . . . . $ (5,024)
64
PCTEL, Inc.
NOTES TO THE CONSOLIDATED FINANCIAL STATEMENTS — (Continued)For the Year Ended: December 31, 2006

BTG MSG Licensing Modems Total
2004Revenue . . . . . . . . . . . . . . . . . . . . . . . . . . . . $37,156 $5,129 $5,936 — $48,221
Gross Profit . . . . . . . . . . . . . . . . . . . . . . . . . . $17,805 $4,937 $5,693 $3,208 $31,643
Operating Expenses . . . . . . . . . . . . . . . . . . . . $36,183
Operating (Loss) . . . . . . . . . . . . . . . . . . . . . . $ (4,450)
The company’s revenue to customers outside of the United States, as a percent of total revenues, is as follows:
2006 2005 2004
Years EndedDecember 31,
Europe . . . . . . . . . . . . . . . . . . . . . . . . . . . . . . . . . . . . . . . . . . . . . . . . . . . . . . 20% 13% 7%
Canada . . . . . . . . . . . . . . . . . . . . . . . . . . . . . . . . . . . . . . . . . . . . . . . . . . . . . . 3% 3% 5%
Latin America . . . . . . . . . . . . . . . . . . . . . . . . . . . . . . . . . . . . . . . . . . . . . . . . . 0% 2% 5%
Asia Pacific . . . . . . . . . . . . . . . . . . . . . . . . . . . . . . . . . . . . . . . . . . . . . . . . . . . 7% 5% 5%
Other. . . . . . . . . . . . . . . . . . . . . . . . . . . . . . . . . . . . . . . . . . . . . . . . . . . . . . . . 1% 1% 1%
31% 24% 23%
One customer has accounted for revenue greater than 10% during the last three fiscal years are as follows:
Customer 2006 2005 2004
Years EndedDecember 31,
TESSCO Technologies . . . . . . . . . . . . . . . . . . . . . . . . . . . . . . . . . . . . . . . . . . . 9% 11% 10%
TESSCO, a distributor of wireless products is a customer in the Broadband Technology Group.
The long-lived assets by geographic region as of December 31, 2006 and 2005 are as follows (in thousands):
2006 2005December 31,
United States . . . . . . . . . . . . . . . . . . . . . . . . . . . . . . . . . . . . . . . . . . . . . . . . . $35,268 $33,152
Ireland and United Kingdom . . . . . . . . . . . . . . . . . . . . . . . . . . . . . . . . . . . . . . $ 3,227 $25,705
Other . . . . . . . . . . . . . . . . . . . . . . . . . . . . . . . . . . . . . . . . . . . . . . . . . . . . . . . $ 103 $ 93
The decrease in the long-lived assets in Ireland and United Kingdom relate to the impairment of the goodwilland intangible assets. See Note 4, Goodwill and Other Intangible Assets for discussion of the impairments.
14. Benefit Plans
401(k) Plan
The 401(k) plan covers all of the employees beginning the first of the month following the month of theiremployment. Under this plan, employees may elect to contribute up to 15% of their current compensation to the401(k) plan up to the statutorily prescribed annual limit. The company may make discretionary contributions to the401(k). The company made $0.6 million in employer contributions to the 401(k) plan for the year endedDecember 31, 2006 and $0.5 million for the years ended December 31, 2005 and December 31, 2004.
65
PCTEL, Inc.
NOTES TO THE CONSOLIDATED FINANCIAL STATEMENTS — (Continued)For the Year Ended: December 31, 2006

Post-retirement Health Insurance
Effective July 2003, the company started a plan to cover post-retirement health insurance for Martin H. Singer,Chairman of the Board and Chief Executive Officer. Based on an actuarial valuation prepared by RSM McGladreyin accordance with FAS 106, the company’s accumulated post retirement benefit obligation for this plan was$141,000 at December 31, 2005. On January 6, 2006, upon authorization of the Compensation Committee of theBoard of Directors, the company and Martin H. Singer, entered into an amended and restated employmentagreement which eliminated the post-retirement healthcare benefits for Mr. Singer and his family that werepreviously included in his original employment agreement. Mr. Singer requested the elimination of these benefitsfor reasons related to future corporate expense, the company’s commitment to defined contribution plans rather thandefined benefit plans, and parity of benefits with other executives of the company. The company reversed theliability of $141,000 in the quarter ended March 31, 2006.
Personal Retirement Savings Account
The Personal Retirement Savings Account (PRSA) covers all current Sigma employees. Under this plan, thereis no limit for employee contributions to the PRSA plan. The company may make discretionary contributions to thisplan. The company made contributions of $27,000 for the year ended December 31, 2006 and $7,000 for the sixmonths ended December 31, 2005.
Executive Deferred Compensation Plan
The company provides an Executive Deferred Compensation Plan for executive officers and senior managers.Under this plan, the company’s executives may defer up to 50% of salary and 100% of cash bonuses with aminimum of $1,500. In addition, the company provides a 4% matching cash contribution which vests over threeyears subject to the executive’s continued service. The executive has a choice of investment alternatives from amenu of mutual funds. The plan is administered by the Compensation Committee and an outside party tracksinvestments and provides our executives with quarterly statements showing relevant contribution and investmentdata. Upon termination of employment, death, disability or retirement, the executive will receive the value of hisaccount in accordance with the provisions of the plan. Upon retirement, the executive may request to receive either alump sum payment, or payments in annual installments over 15 years or over the lifetime of the participant with 20annual payments guaranteed. At the December 31, 2006, the deferred compensation obligation of $0.9 million wasincluded in Other Long-Term Accrued Liabilities. The company funds the obligation related to the ExecutiveDeferred Compensation Plan with corporate-owned life insurance policies. The cash surrender value of suchpolicies is included in Other Assets.
Pension Plan — Ireland
With the acquisition of Sigma in July 2005, the company assumed the liability for the Sigma employeeparticipants in Sigma Communications Group Retirement and Death Benefit Plan (“old plan”). This old plan wasclosed to new employees in December 2003. At July 4, 2005 and December 31, 2005, a third party actuarydetermined the company’s pension assets, accumulated pension obligation, and the projected benefit obligationrelated to the Sigma participants in the old plan. At December 31, 2005, the company’s pension liability related tothe Sigma employees was approximately $3.1 million. In the first quarter of 2006, the company set up a new plan —the PCTEL Europe Pension Plan (the “Plan”) for the 56 employees of Sigma that were participants in the old plan.
As part of the restructuring of the Dublin operations, the company terminated the Plan on June 16, 2006. Thecompany negotiated the terms of the pension termination with the labor union since the labor union represented themajority of the employees in the Plan. Under the terms of the settlement, the company funded 50% of the cashshortfall in the Plan as calculated by the third party actuary less any severance amounts given to employees thatexceeded 3 weeks severance for every year of service. The funding shortfall was based on pension requirements in
66
PCTEL, Inc.
NOTES TO THE CONSOLIDATED FINANCIAL STATEMENTS — (Continued)For the Year Ended: December 31, 2006

accordance with Irish regulations. The pension liability was $3.2 million at the date of the termination. Thecompany incurred approximately $0.6 million in cash expense to fund the pension shortfall and for relatedexpenses. The result was a non-cash net gain on the termination of the pension plan of $2.6 million, which wasrecorded as an offset to restructuring expense.
The effect on operations of the pension plan for the year ended December 31, 2006 and the six months endedDecember 31, 2005, respectively was as follows (in thousands):
2006 2005
Expected return on plan assets . . . . . . . . . . . . . . . . . . . . . . . . . . . . . . . . . . . . . . . . $ 133 $ (86)
Service cost for benefits earned . . . . . . . . . . . . . . . . . . . . . . . . . . . . . . . . . . . . . . . . 150 96
Interest cost on benefit obligation . . . . . . . . . . . . . . . . . . . . . . . . . . . . . . . . . . . . . . (112) 119
Net periodic pension costs . . . . . . . . . . . . . . . . . . . . . . . . . . . . . . . . . . . . . . . . . . $ 171 $129
Excluding the payments related to the termination of the Plan, the company made pension contributions of$183,000 during the year ended December 31, 2006 and $62,000 during the six months ended December 31, 2005.Since the Plan has been terminated, no other payments are required and no cost other costs will be incurred.
The status of the pension plan at December 31, 2005 was as follows (in thousands):
2005
Change in benefit obligationProjected benefit obligation, beginning of year . . . . . . . . . . . . . . . . . . . . . . . . . . . . . . . . . . . . . . 0
Service cost . . . . . . . . . . . . . . . . . . . . . . . . . . . . . . . . . . . . . . . . . . . . . . . . . . . . . . . . . . . . . . . 96
Interest cost . . . . . . . . . . . . . . . . . . . . . . . . . . . . . . . . . . . . . . . . . . . . . . . . . . . . . . . . . . . . . . . 119
Plan participants’ contribution . . . . . . . . . . . . . . . . . . . . . . . . . . . . . . . . . . . . . . . . . . . . . . . . . . 39
Net transfer in . . . . . . . . . . . . . . . . . . . . . . . . . . . . . . . . . . . . . . . . . . . . . . . . . . . . . . . . . . . . . 5,559
Actuarial loss . . . . . . . . . . . . . . . . . . . . . . . . . . . . . . . . . . . . . . . . . . . . . . . . . . . . . . . . . . . . . 86
Foreign currency translation adjustment . . . . . . . . . . . . . . . . . . . . . . . . . . . . . . . . . . . . . . . . . . . (103)
Projected benefit obligation, end of year . . . . . . . . . . . . . . . . . . . . . . . . . . . . . . . . . . . . . . . . . . 5,796
Change in plan assetsFair value of plan assets, beginning of year . . . . . . . . . . . . . . . . . . . . . . . . . . . . . . . . . . . . . . . . 0
Actual return on plan assets . . . . . . . . . . . . . . . . . . . . . . . . . . . . . . . . . . . . . . . . . . . . . . . . . . . 57
Employer contributions . . . . . . . . . . . . . . . . . . . . . . . . . . . . . . . . . . . . . . . . . . . . . . . . . . . . . . 63
Plan participants’ contribution . . . . . . . . . . . . . . . . . . . . . . . . . . . . . . . . . . . . . . . . . . . . . . . . . . 39
Net transfer in . . . . . . . . . . . . . . . . . . . . . . . . . . . . . . . . . . . . . . . . . . . . . . . . . . . . . . . . . . . . . 2,526
Foreign currency translation adjustment . . . . . . . . . . . . . . . . . . . . . . . . . . . . . . . . . . . . . . . . . . . (48)
Fair value of plan assets, end of year . . . . . . . . . . . . . . . . . . . . . . . . . . . . . . . . . . . . . . . . . . . . . 2,637
Funded status . . . . . . . . . . . . . . . . . . . . . . . . . . . . . . . . . . . . . . . . . . . . . . . . . . . . . . . . . . . . . (3,159)
Unrecognized net loss . . . . . . . . . . . . . . . . . . . . . . . . . . . . . . . . . . . . . . . . . . . . . . . . . . . . . . . 112
Net liability at end of year . . . . . . . . . . . . . . . . . . . . . . . . . . . . . . . . . . . . . . . . . . . . . . . . . . . (3,047)
Pension liability recognized on balance sheet . . . . . . . . . . . . . . . . . . . . . . . . . . . . . . . . . . . . . (3,047)
Accumulated benefit obligation. . . . . . . . . . . . . . . . . . . . . . . . . . . . . . . . . . . . . . . . . . . . . . . . 4,108
67
PCTEL, Inc.
NOTES TO THE CONSOLIDATED FINANCIAL STATEMENTS — (Continued)For the Year Ended: December 31, 2006

The following actuarial rate assumptions used in determining the net periodic pension costs recognized inincome during 2005:
Discount rate . . . . . . . . . . . . . . . . . . . . . . . . . . . . . . . . . . . . . . . . . . . . . . . . . . . . . . . . . . . . . 4.25%
Expected rate of return on plan assets . . . . . . . . . . . . . . . . . . . . . . . . . . . . . . . . . . . . . . . . . . 6.50%
Average compensation inflation . . . . . . . . . . . . . . . . . . . . . . . . . . . . . . . . . . . . . . . . . . . . . . . 4.00%
The weighted average actuarial rate assumptions used in determining the benefit obligation at December 31,2005 were as follows
Discount rate . . . . . . . . . . . . . . . . . . . . . . . . . . . . . . . . . . . . . . . . . . . . . . . . . . . . . . . . . . . . . 4.25%
Expected rate of return on plan assets . . . . . . . . . . . . . . . . . . . . . . . . . . . . . . . . . . . . . . . . . . 4.00%
Average compensation inflation . . . . . . . . . . . . . . . . . . . . . . . . . . . . . . . . . . . . . . . . . . . . . . . 2.25%
The company’s pension plan weighted-average asset allocation at fiscal year end 2005 was as follows:
December 312005
Target 5allocation
Equity securities . . . . . . . . . . . . . . . . . . . . . . . . . . . . . . . . . . . . . . . . . 78.2% 50% � 80%
Debt securities . . . . . . . . . . . . . . . . . . . . . . . . . . . . . . . . . . . . . . . . . . . 12.2% 10% � 25%
Property. . . . . . . . . . . . . . . . . . . . . . . . . . . . . . . . . . . . . . . . . . . . . . . . 4.9% 0 � 10%
Cash . . . . . . . . . . . . . . . . . . . . . . . . . . . . . . . . . . . . . . . . . . . . . . . . . . 4.7% 0 � 10%
15. Quarterly Data (Unaudited)
Mar. 31,2006
June 30,2006
Sept. 30,2006
Dec. 31,2006
Quarters Ended,
(in thousands, except per share data)
Revenues . . . . . . . . . . . . . . . . . . . . . . . . . . . . . . . . . . $18,566 $26,758 $ 20,526 $20,712
Gross profit. . . . . . . . . . . . . . . . . . . . . . . . . . . . . . . . . 8,722 17,056 9,908 10,885
Loss from operations . . . . . . . . . . . . . . . . . . . . . . . . . . (2,825) 7,262 (22,278) (94)
Loss before provision for income taxes . . . . . . . . . . . . (2,205) 8,010 (21,288) 851
Net loss . . . . . . . . . . . . . . . . . . . . . . . . . . . . . . . . . . . $ (2,198) $ 6,327 $(20,747) $ 6,599
Basic loss per share. . . . . . . . . . . . . . . . . . . . . . . . . . . $ (0.11) $ 0.30 $ (0.99) $ 0.31
Shares used in computing basic loss per share . . . . . . . 20,645 20,837 20,941 20,976
Diluted earnings loss per share . . . . . . . . . . . . . . . . . . $ (0.11) $ 0.29 $ (0.99) $ 0.30
Shares used in computing diluted loss per share . . . . . . 20,645 21,586 20,941 21,637
68
PCTEL, Inc.
NOTES TO THE CONSOLIDATED FINANCIAL STATEMENTS — (Continued)For the Year Ended: December 31, 2006

Mar. 31,2005
June 30,2005
Sept. 30,2005
Dec. 31,2005
Quarters Ended,
(in thousands, except per share data)
Revenues . . . . . . . . . . . . . . . . . . . . . . . . . . . . . . . . . . . $15,008 $18,313 $21,632 $22,794
Gross profit . . . . . . . . . . . . . . . . . . . . . . . . . . . . . . . . . 7,438 8,704 10,039 10,687
Loss from operations . . . . . . . . . . . . . . . . . . . . . . . . . . (2,697) (813) (896) (619)
Loss before provision for income taxes . . . . . . . . . . . . . (2,156) (382) (822) (117)
Net loss . . . . . . . . . . . . . . . . . . . . . . . . . . . . . . . . . . . . $ (2,317) $ (322) $ (917) $ (156)
Basic loss per share . . . . . . . . . . . . . . . . . . . . . . . . . . . $ (0.12) $ (0.02) $ (0.05) $ (0.01)
Shares used in computing basic loss per share . . . . . . . . 20,043 20,108 20,163 20,257
Diluted earnings loss per share . . . . . . . . . . . . . . . . . . . $ (0.12) $ (0.02) $ (0.05) $ (0.01)
Shares used in computing diluted loss per share . . . . . . 20,043 20,108 20,163 20,257
In the quarter ended December 31, 2006 the company reversed a tax accrual for $5.2 million related to themodem business. During the quarter ended December 31, 2005, the company changed its estimate regarding thecharacter in taxation of certain leasing income received in 2004. See Note 8 related to Income Taxes.
69
PCTEL, Inc.
NOTES TO THE CONSOLIDATED FINANCIAL STATEMENTS — (Continued)For the Year Ended: December 31, 2006

Item 9: Changes in and Disagreements with Accountants on Accounting and Financial Disclosure.
None.
Item 9A: Controls and Procedures
(a) Evaluation of Disclosure Controls and Procedures
Our management evaluated, with the participation of our Chief Executive Officer and our Chief FinancialOfficer, the effectiveness of our disclosure controls and procedures as of the end of the period covered by thisAnnual Report on Form 10-K. Based on this evaluation, our Chief Executive Officer and our Chief Financial Officerhave concluded that our disclosure controls and procedures are effective to ensure that information we are requiredto disclose in our reports that we file or submit under Securities Exchange Act of 1934 (i) is recorded, processed,summarized, and reported within the time periods specified in Securities and Exchange Commission rules andforms, and (ii) is accumulated and communicated to our management, including our Chief Executive Officer andour Chief Financial Officer, as appropriate to allow timely decisions regarding required disclosure. Our disclosurecontrols and procedures are designed to provide reasonable assurance that such information is accumulated andcommunicated to our management.
Our disclosure controls and procedures include components of our internal control over financial reporting.Management’s assessment of the effectiveness of our internal control over financial reporting is expressed at thelevel of reasonable assurance because a control system, no matter how well designed and operated, can provide onlyreasonable, but not absolute, assurance that the control system’s objectives will be met.
(b) Management’s Report on Internal Control Over Financial Reporting
Management of PCTEL is responsible for establishing and maintaining adequate internal control overfinancial reporting as defined in Rules 13a-15(f) and 15d-15(f) under the Securities Exchange Act of 1934.PCTEL’s internal control over financial reporting is a process designed to provide reasonable assurance regardingthe reliability of financial reporting and the preparation of financial statements for external purposes in accordancewith generally accepted accounting principles in the United States of America. Internal control over financialreporting includes those policies and procedures that:
• pertain to the maintenance of records that, in reasonable detail, accurately and fairly reflect the transactionsand dispositions of the assets of PCTEL;
• provide reasonable assurance that transactions are recorded as necessary to permit preparation of financialstatements in accordance with generally accepted accounting principles in the United States of America, andthat receipts and expenditures of PCTEL are being made only in accordance with authorizations ofmanagement and directors of PCTEL; and
• provide reasonable assurance regarding prevention or timely detection of unauthorized acquisition, use ordisposition of PCTEL’s assets that could have a material effect on the financial statements.
The management of PCTEL has assessed the effectiveness of the Company’s internal control over financialreporting as of December 31, 2006. In making its assessment of internal control over financial reporting,management used the criteria described in “Internal Control — Integrated Framework” issued by the Committeeof Sponsoring Organizations of the Treadway Commission (COSO).
Based on our assessment of internal controls over financial reporting, management has concluded that, as ofDecember 31, 2006, our internal control over financial reporting was effective to provide reasonable assuranceregarding the reliability of financial reporting and the preparation of financial statements for external purposes inaccordance with generally accepted accounting principles.
Management’s assessment of the effectiveness of the Company’s internal control over financial reporting as ofDecember 31, 2006 has been audited by Grant Thornton, LLC, an independent registered public accounting firm, asstated in their report which appears herein.
70

(c) Changes in Internal Control Over Financial Reporting
A material weakness is a control deficiency, or combination of control deficiencies, that results in more than aremote likelihood that a material misstatement of the annual or interim financial statements will not be prevented ordetected. During 2006, the company remediated a material weakness related to income taxes.
Except as otherwise discussed above, there have been no changes in the Company’s internal control overfinancial reporting during the most recently completed fiscal quarter that have materially affected, or are reasonablylikely to materially affect, the Company’s internal control over financial reporting.
Item 9B: Other Information
None.
PART III
Item 10: Directors, Executive Officers and Corporate Governance
The information required by this item concerning the company’s directors, code of ethics and compliance withSection 16(a) of the Exchange Act is incorporated by reference to the sections entitled “Election of Directors”,“Corporate Governance”, and “Section 16(a) Beneficial Ownership Reporting Compliance” contained in the ProxyStatement related to PCTEL’s 2007 Annual Meeting of Stockholders, to be filed with the Securities and ExchangeCommission within 120 days of the end of our fiscal year (the “Proxy Statement”).
Certain information required by this item concerning the company’s executive officers is set forth in Item 4 ofthis Report in the section captioned “Executive Officers of the Registrant”.
Item 11: Executive Compensation
The information required by this item is incorporated by reference to the sections captioned “ExecutiveCompensation and Other Matters” and “Compensation Committee Interlocks and Insider Participation” containedin the Proxy Statement.
Item 12: Security Ownership of Certain Beneficial Owners and Management and Related StockholderMatters
The information required by this item, is incorporated by reference to the information set forth in the sectionsentitled “Security Ownership of Certain Beneficial Owners and Management” and “Equity Compensation PlanInformation” contained in the Proxy Statement.
Item 13: Certain Relationships and Related Transactions, and Director Independence
The information required by this item is incorporated by reference to the sections entitled “Certain Rela-tionships and Related Transactions” and “Corporate Governance” contained in the Proxy Statement.
Item 14: Principal Accountant Fees and Services
The information required by this item is incorporated by reference to the section entitled “Ratification ofAppointment of Independent Registered Public Accounting Firm” contained in the Proxy Statement.
71

REPORT OF INDEPENDENT REGISTERED PUBLIC ACCOUNTING FIRM
Board of Directors and ShareholdersPCTEL, Inc.:
We have audited in accordance with the standards of the Public Company Accounting Oversight Board (UnitedStates) the consolidated financial statements of PCTEL, Inc. and Subsidiaries referred to in our report datedMarch 16, 2007, which is included in Item 15 of this form. Our audit was conducted for the purpose of forming anopinion on the basic financial statements taken as a whole. The Valuation and Qualifying Accounts included inSchedule II are presented for purposes of additional analysis and is not a required part of the basic financialstatements. This schedule has been subjected to the auditing procedures applied in the audit of the basic financialstatements and, in our opinion, is fairly stated in all material respects in relation to the basic financial statementstaken as a whole.
/s/ GRANT THORNTON LLP
Chicago, IllinoisMarch 16, 2007
72

PART IV
Item 15: Exhibit and Financial Statement Schedules
(a) (1) Financial Statements
The Consolidated Financial Statements are included in Part II, Item 8 of this Annual Report on Form 10-K onpages 31 to 66.
(a) (2) Financial Statement Schedules
The following financial statement schedule is filed as a part of this Report under “Schedule II” immediatelypreceding the signature page: Schedule II — Valuation and Qualifying Accounts for the three fiscal yearsended December 31, 2006.
SCHEDULE II — VALUATION AND QUALIFYING ACCOUNTS (in thousands)Balance atBeginning
of Year
Charged toCosts andExpenses
Addition(Deductions)
Balance atEnd ofYear
Year Ended December 31, 2004:Allowance for doubtful accounts . . . . . . . . . . . $ 50 306 100 $ 456Inventory reserves . . . . . . . . . . . . . . . . . . . . . . $ 55 357 — $ 412Warranty reserves . . . . . . . . . . . . . . . . . . . . . . $ 46 24 (30) $ 40Deferred tax assest valuation allowance . . . . . . $ 9,985 1,558 322 $11,865
Year Ended December 31, 2005:Allowance for doubtful accounts . . . . . . . . . . . $ 456 268 (406) $ 318Inventory reserves . . . . . . . . . . . . . . . . . . . . . . $ 412 627 (174) $ 865Warranty reserves . . . . . . . . . . . . . . . . . . . . . . $ 40 177 (71) $ 146Deferred tax assest valuation allowance . . . . . . $11,865 1,501 448 $13,814
Year Ended December 31, 2006:Allowance for doubtful accounts . . . . . . . . . . . $ 318 119 (103) $ 333Inventory reserves . . . . . . . . . . . . . . . . . . . . . . $ 865 1,960 (1,943) $ 883Warranty reserves . . . . . . . . . . . . . . . . . . . . . . $ 146 181 (144) $ 183Deferred tax assest valuation allowance . . . . . . $13,814 4,903 145 $18,862
All other schedules called for by Form 10-K are omitted because they are inapplicable or the requiredinformation is shown in the financial statements, or notes thereto, included herein.
(a) (3) Exhibits (numbered in accordance with Item 601 of Regulation S-K)
3.1 Amended and Restated Certificate ofIncorporation of the Registrant, as currently ineffect
Incorporated by reference to the exhibit bearingthe same number filed with the Registrant’sRegistration Statement on Form S-1(Registration Statement No. 333- 84707).
3.3 Amended and Restated Bylaws of the Registrant Incorporated by reference to the exhibit bearingthe same number filed with the Registrant’sAnnual Report on Form 10-K for fiscal yearended December 31, 2001.
4.1 Specimen common stock certificate Incorporated by reference to the exhibit bearingthe same number filed with the Registrant’sRegistration Statement on Form S-1(Registration Statement No. 333- 84707).
73

10.1+ Form of Indemnification Agreement betweenPCTEL and each of directors and officers
Incorporated by reference to the exhibit bearingthe same number filed with the Registrant’sRegistration Statement on Form S-1(Registration Statement No. 333- 84707).
10.5+ 1998 Employee Stock Purchase Plan and form ofagreements thereunder
Incorporated by reference to the exhibit bearingthe same number filed with the Registrant’sRegistration Statement on Form S-1(Registration Statement No. 333- 84707).
10.18+ Form of Management Retention Agreement forOfficers
Incorporated by reference to the exhibit bearingthe same number filed with the Registrant’sAnnual Report on Form 10-K for fiscal yearended December 31, 2001.
10.23+ 2001 Nonstatutory Stock Option Plan and form ofagreements hereunder
Incorporated by reference herein to theRegistrant’s Registration Statement of Form S-8filed on October 3, 2001 (Registration StatementNo. 333-70886).
10.25+ Employment Agreement between Jeffrey A.Miller and the Registrant, dated November 7, 2001
Incorporated by reference to the exhibit bearingthe same number filed with the Registrant’sAnnual Report on Form 10-K for fiscal yearended December 31, 2001.
10.25.1+ Letter agreement dated August 22, 2006 amendingthe Employment Agreement, by and betweenPCTEL, Inc. and Jeff Miller
Incorporated by reference to the exhibit bearingthe same number filed with the Registrant’sQuarterly Report on Form 10-Q for the quarterended September 30, 2006.
10.26+ Employment Agreement between John Schoenand the Registrant, dated November 12, 2001
Incorporated by reference to the exhibit bearingthe same number filed with the Registrant’sAnnual Report on Form 10-K for fiscal yearended December 31, 2001.
10.26.1+ Letter agreement dated August 22, 2006 amendingthe Employment Agreement, by, and betweenPCTEL, Inc. and John Schoen
Incorporated by reference to the exhibit bearingthe same number filed with the Registrant’sQuarterly Report on Form 10-Q for the quarterended September 30, 2006.
10.32+ Stock Option Agreement of Jeffrey A. Miller,dated November 15, 2001
Incorporated by reference herein to theRegistrant’s Registration Statement of Form S-8filed on December 14, 2001 (RegistrationStatement No. 333-75204).
10.35 Lease agreement dated July 30, 2002 betweenPCTEL, Inc. and ASP Wheelie, LLC for anoffice building located at O’Hare Plaza,8725 West Higgins Road, Chicago, IL
Incorporated by reference to the exhibit bearingthe same number filed with the Registrant’sQuarterly Report on Form 10-Q for the quarterended September 30, 2002.
10.35.1 First Amendment to lease dated October 1, 2006between PCTEL, Inc. and O’Hare Plaza I, LLC
Incorporated by reference to the exhibit bearingthe same number filed with the Registrant’sCurrent Report Form 8-K on October 5, 2006.
10.37+ Executive Deferred Compensation Plan Incorporated by reference to the exhibit bearingthe same number filed with the Registrant’sAnnual Report on Form 10-K for the fiscal yearended December 31, 2002.
74

10.38+ Executive Deferred Stock Plan Incorporated by reference to the exhibit bearingthe same number filed with the Registrant’sAnnual Report on Form 10-K for the fiscal yearended December 31, 2002.
10.39+ Board of Directors Deferred Compensation Plan Incorporated by reference to the exhibit bearingthe same number filed with the Registrant’sQuarterly Report on Form 10-Q for the quarterended June 30, 2003.
10.40+ Board of Directors Deferred Stock Plan Incorporated by reference to the exhibit bearingthe same number filed with the Registrant’sQuarterly Report on Form 10-Q for the quarterended June 30, 2003.
10.42 Lease agreement dated September 19, 1998between Dynamic Telecommunications, Inc. andWisteria Office Park, 12810, Wisteria Drive,Germantown, MD 20874
Incorporated by reference to the exhibit bearingthe same number filed with the Registrant’sAnnual Report on Form 10-K for the fiscal yearended December 31, 2003.
10.44 Purchase and Sale Agreement dated November 1,2004, between PCTEL, Inc. and EvergreenBrighton, L.L.C.
Incorporated by reference to the exhibit bearingthe same number filed with the Registrant’sQuarterly Report on Form 10-Q for the quarterended September 30, 2004.
10.48 Purchase Agreement dated April 14, 2005between PCTEL Antenna Products Group, awholly owned subsidiary of PCTEL, Inc. andQuintessence Publishing Company, Inc.
Incorporated by reference to the exhibit bearingthe same number filed with the Registrant’sQuarterly Report on Form 10-Q for the quarterended March 31, 2005.
10.49+ Letter Agreement dated April 18, 2005 betweenPCTEL, Inc. and Biju Nair
Incorporated by reference to the exhibit bearingthe same number filed with the Registrant’sCurrent Report on Form 8-K filed on August 23,2005.
10.50+ Letter Agreement dated September 16, 2005between PCTEL Maryland, Inc. and FirstCampus Limited Partnership
Incorporated by reference to the exhibit bearingthe same number filed with the Registrant’sCurrent Report on Form 8-K filed onSeptember 22, 2005.
10.52 Amended and Restated Employment Agreement,dated as of January 6, 2006, by and betweenPCTEL, Inc. and Martin H. Singer
Incorporate by reference to the exhibit bearing thesame number filed with the Registrant’s CurrentReport on Form 8-K filed on January 10, 2006.
10.53 Amended and Restated Retention Agreement,dated as of January 6, 2006, by and betweenPCTEL, Inc. and Martin H. Singer
Incorporate by reference to the exhibit bearing thesame number filed with the Registrant’s CurrentReport on Form 8-K filed on January 10, 2006.
10.54 1997 Stock Plan (as amended and restatedMarch 16, 2006)
Incorporated by reference to the exhibit bearingthe same number filed with the Registrant’sCurrent Report on Form 8-K filed on June 9, 2006.
10.54-1 Forms of agreement under 1997 Stock Plan Incorporated by reference to the exhibit bearingthe same number filed with the Registrant’sQuarterly Report Form 10-Q for the quarterended June 30, 2006.
10.55 Letter agreement dated August 22, 2006 amendingthe Employment Agreement, by and betweenPCTEL, Inc. and Biju Nair
Incorporated by reference to the exhibit bearingthe same number filed with the Registrant’sQuarterly Report on Form 10-Q for the quarterended September 30, 2006.
75

10.56 Letter, agreement dated August 22, 2006amending the Employment Agreement, by andbetween PCTEL, Inc. and Steve Deppe
Incorporated by reference to the exhibit bearingthe same number filed with the Registrant’sQuarterly Report on Form 10-Q for the quarterended September 30, 2006.
10.57 Amendment to lease agreement between PCTEL,Inc. and O’Hare Plaze I LLC dated October 1,2006
Filed herewith
16.1 Letter from Pricewaterhouse Coopers LLP to theSecurities and Exchange Commission datedMay 18. 2006
Incorporated by reference to the exhibit bearingthe same number filed with the Registrant’sCurrent Report on Form 8-K filed on May 18,2006.
21.1 List of significant subsidiaries Filed herewith
23.1 Consent of PricewaterhouseCoopers LLP Filed herewith
23.2 Consent of Grant Thornton LLP Filed herewith
31.1 Certification of Principal Executive Officerpursuant to Section 302 of Sarbanes-Oxley Actof 2002
Filed herewith
31.2 Certification of Principal Financial Officerpursuant to Section 302 of Sarbanes-Oxley Actof 2002
Filed herewith
32.1 Certification of Principal Executive Officer andPrincipal Financial Officer pursuant to 18 U.S.C.Section 1350 as adopted pursuant to Section 906of Sarbanes-Oxley Act of 2002
Filed herewith
+ Management contract or compensatory plan or arrangement required to be filed as exhibit pursuant to Item 15(b)of Form 10-K.
76

SIGNATURES
Pursuant to the requirements of Section 13 or 15(d) of the Securities Exchange Act of 1934, as amended, theRegistrant has duly caused this report to be signed on its behalf by the undersigned, thereunto duly authorized:
PCTEL, Inc.A Delaware Corporation(Registrant)
/s/ MARTIN H. SINGER
Martin H. SingerChairman of the Board and
Chief Executive OfficerDated: March 16, 2007
KNOWALL PERSONS BY THESE PRESENTS, that each person whose signature appears below constitutesand appoints Martin H. Singer and John Schoen, and each of them, his true and lawful attorneys-in-fact and agents,each with full power of substitution and re-substitution, to sign any and all amendments (including post-effectiveamendments) to this Annual Report on Form 10-K and to file the same, with all exhibits thereto and otherdocuments in connection therewith, with the Securities and Exchange Commission, granting unto said attorneys-in-fact and agents, and each of them, full power and authority to do and perform each and every act and thing requisiteand necessary to be done in connection therewith, as fully to all intents and purposes as he or she might or could doin person, hereby ratifying and confirming all that said attorneys-in-fact and agents, or their substitute or substitutes,or any of them, shall do or cause to be done by virtue hereof.
Pursuant to the requirements of the Securities Exchange Act of 1934, this report has been signed below by thefollowing persons on behalf of the Registrant and in the capacities and on the dates indicated.
Signature Title Date
/s/ MARTIN H. SINGER
(Martin H. Singer)
Chairman of the Board,Chief Executive Officer
(Principal Executive Officer)and Director
March 16, 2007
/s/ JOHN SCHOEN
(John Schoen)
Chief Financial Officer(Principal Financial and
Accounting Officer)
March 16, 2007
/s/ RICHARD C. ALBERDING
(Richard C. Alberding)
Director March 16, 2007
/s/ BRIAN J. JACKMAN
(Brian J. Jackman)
Director March 16, 2007
/s/ STEVEN D. LEVY
(Steven D. Levy)
Director March 16, 2007
/s/ GIACOMO MARINI
(Giacomo Marini)
Director March 16, 2007
77

Signature Title Date
/s/ JOHN SHEEHAN
(John Sheehan)
Director March 16, 2007
/s/ CARL A. THOMSEN
(Carl A. Thomsen)
Director March 16, 2007
78

Exhibit IndexItem Number Description
3.1 Amended and Restated Certificate of Incorporation of the Registrant, as currently in effect
3.3 Amended and Restated Bylaws of the Registrant
4.1 Specimen common stock certificate
10.1 Form of Indemnification Agreement between PCTEL and each of directors and officers
10.5 1998 Employee Stock Purchase Plan and form of agreements thereunder
10.18 Form of Management Retention Agreement for Officers
10.23 2001 Nonstatutory Stock Option Plan and form of agreements hereunder
10.25 Employment Agreement between Jeffrey A. Miller and the Registrant, dated November 7, 2001
10.25.1 Letter agreement dated August 22, 2006 amending the Employment Agreement, by and betweenPCTEL, Inc. and Jeff Miller
10.26 Employment Agreement between John Schoen and the Registrant, dated November 12, 2001
10.26.1 Letter agreement dated August 22, 2006 amending the Employment Agreement, by, and betweenPCTEL, Inc. and John Schoen
10.32 Stock Option Agreement of Jeffrey A. Miller, dated November 15, 2001
10.35 Lease agreement dated July 30, 2002 between PCTEL, Inc. and ASP Wheelie, LLC for an officebuilding located at O’Hare Plaza, 8725 West Higgins Road, Chicago, IL
10.35.1 First Amendment to lease dated October 1, 2006 between PCTEL, Inc. and O’Hare Plaza I, LLC
10.37 Executive Deferred Compensation Plan
10.38 Executive Deferred Stock Plan
10.39 Board of Directors Deferred Compensation Plan
10.40 Board of Directors Deferred Stock Plan
10.42 Lease agreement dated September 19, 1998 between Dynamic Telecommunications, Inc. andWisteria Office Park, 12810, Wisteria Drive, Germantown, MD 20874
10.44 Purchase and Sale Agreement dated November 1, 2004, between PCTEL, Inc. and EvergreenBrighton, L.L.C.
10.48 Purchase Agreement dated April 14, 2005 between PCTEL Antenna Products Group, a whollyowned subsidiary of PCTEL, Inc. and Quintessence Publishing Company, Inc.
10.49 Letter Agreement dated April 18, 2005 between PCTEL, Inc. and Biju Nair
10.50 Letter Agreement dated September 16, 2005 between PCTEL Maryland, Inc. and First CampusLimited Partnership
10.52 Amdended and Restated Employment Agreement, dated as of January 6, 2006, by and betweenPCTEL, Inc. and Martin H. Singer
10.53 Amended and Restated Retention Agreement, dated as of January 6, 2006, by and between PCTEL,Inc. and Martin H. Singer
10.54 1997 Stock Plan (as amended and restated March 16, 2006)
10.54-1 Forms of agreement under 1997 Stock Plan10.55 Letter agreement dated August 22, 2006 amending the Employment Agreement, by and between
PCTEL, Inc. and Biju Nair10.56 Letter, agreement dated August 22, 2006 amending the Employment Agreement, by and between
PCTEL, Inc. and Steve Deppe10.57 Amendment to lease agreement between PCTEL, Inc. and O’Hare Plaze I LLC dated October 1, 2006
16.1 Letter from Pricewaterhouse Coopers LLP to the Securities and Exchange Commission datedMay 18. 2006
21.1 List of signifcant subsidiaries
23.1 Consent of PricewaterhouseCoopers LLP
23.2 Consent of Grant Thornton LLP
31.1 Certification of Principal Executive Officer pursuant to Section 302 of Sarbanes-Oxley Act of 2002

Item Number Description
31.2 Certification of Principal Financial Officer pursuant to Section 302 of Sarbanes-Oxley Act of 2002
32.1 Certification of Principal Executive Officer and Principal Financial Officer pursuant to 18 U.S.C.Setion 1350 as adopted pursuant to Section 906 of Sarbanes-Oxley Act of 2002

(This page intentionally left blank)

(This page intentionally left blank)

BOARD OF DIRECTORSRichard C. AlberdingRetired Hewlett-Packard Executive
Brian J. JackmanLead DirectorRetired Tellabs, Inc. Executive
Steven LevyRetired Lehman Brothers Executive
Giacomo MariniFounder and Managing DirectorNoventi
John SheehanSenior ConsultantLondon Perret Roche Group
Martin H. SingerChief Executive Officer and Chairman of the Board
Carl A. ThomsenSenior Vice President,Retired Chief Financial Officer, and Secretary Stratex Networks, Inc.
ELECTED OFFICERSMartin H. SingerChief Executive Officer and Chairman of the Board
Steve DeppeExecutive Vice President,Strategy and Business Development
Jeffery A. MillerVice President and General ManagerBroadband Technology Group
Biju NairVice President, General Manager Mobility Solutions Group
John SchoenChief Financial Officer
APPOINTED OFFICERSVarda GoldmanVice President and General Counsel
Luis RugelesVice President, General ManagerRF Solutions
Les SgnilekVice President, Finance
CORPORATE INFORMATION
TRANSFER AGENTWells Fargo BankShareowner Services161 North Concord Exchange South St. Paul, MN 55075-1139Tel: 1-800-468-9716Fax: 1-651-450-4078
INDEPENDENT PUBLIC ACCOUNTANTS Grant Thornton, LLP Chicago, IL
LEGAL COUNSELWilson Sonsini Goodrich & Rosati Palo Alto, CA
ANNUAL MEETINGThe Annual Meeting for Shareholders will be held at 10:00 a.m. on Tuesday June 5, 2007 at the corporate offices of PCTEL located at:8725 West Higgins Road., Suite 400 Chicago, IL 60631 U.S.A.
INVESTOR RELATIONSFor further information on the Company, additional copies of the report,Form 10-K filed with the Securities and Exchange Commission or other financial information, please contact:
PCTEL, Inc.8725 West Higgins Rd., Suite 400 Chicago, IL 60631 U.S.A.Tel: 1-773-243-3000Fax: 1-773-243-3050
You may also contact us by sending an e-mail to:[email protected] by visiting our web site at www.pctel.com
GLOBAL HEADQUARTERS PCTEL Inc.8725 West Higgins Rd., Suite 400 Chicago, IL 60631 U.S.A.Tel: 1-773-243-3000Fax: 1-773-243-3050www.pctel.com
OTHER OFFICES Broadband Technology Group
471 Brighton Drive Bloomingdale, IL 60108 U.S.A.Tel: 630-372-6800 Fax: 630-372-8077
20410 Observation Drive, Suite 200 Germantown, MD 20876 U.S.A. Tel: 1-301-515-0036Fax: 1-301-515-0037
Maxrad (Tianjin) Electronics Co., Ltd. Pengan Road 3#Pengan Industrial ParkBeichen District, Tianjin CityPR ChinaTel: +86-22-2666-6741Fax: +86-22-2666-7439


![SeeGull IBflex Scanning Receiver - PCTEL · The SeeGull IBflex supports LTE FDD, TD-LTE, NB-IoT, UMTS [WCDMA/HSPA(+)], GSM, ... Ec/Io, Aggregate Ec/Io, SIR, Rake Finger Count, Time](https://img.pdfslide.net/doc/110x75/5b5d47677f8b9a68368e7f96/seegull-ibflex-scanning-receiver-the-seegull-ibflex-supports-lte-fdd-td-lte.jpg)