Embed Size (px)
Citation preview
S1
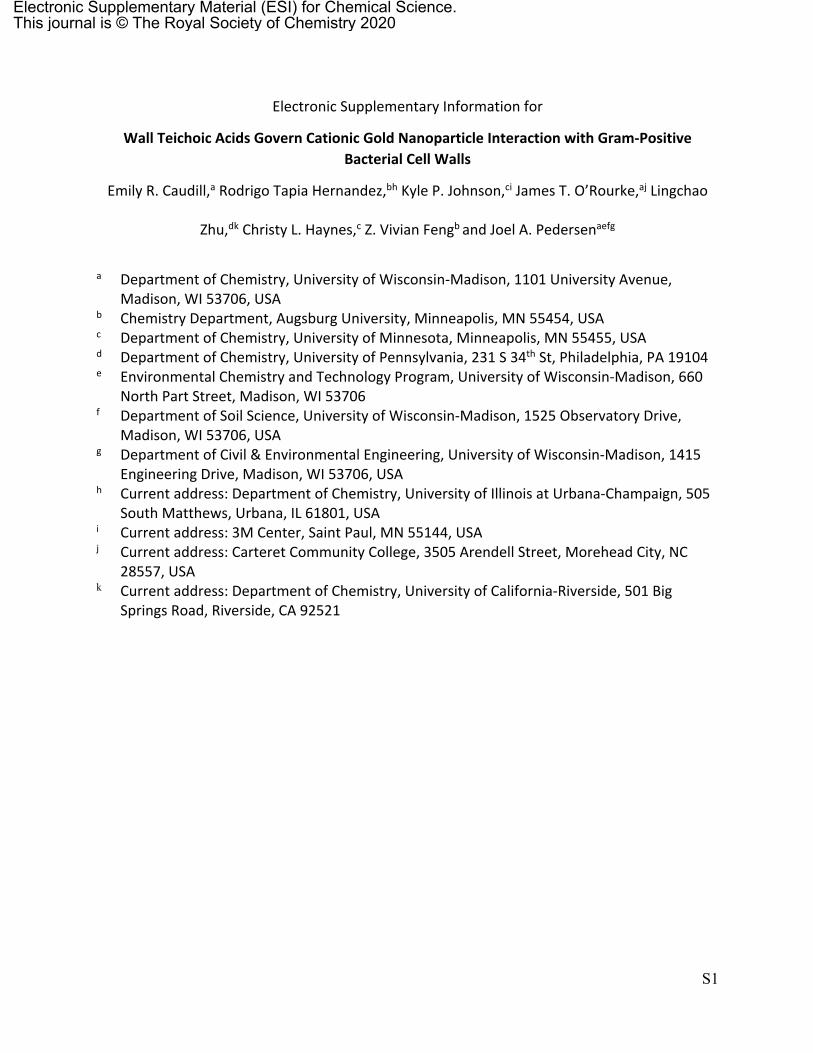
Electronic Supplementary Information for
Wall Teichoic Acids Govern Cationic Gold Nanoparticle Interaction with Gram-Positive Bacterial Cell Walls
Emily R. Caudill,a Rodrigo Tapia Hernandez,bh Kyle P. Johnson,ci James T. O’Rourke,aj Lingchao
Zhu,dk Christy L. Haynes,c Z. Vivian Fengb and Joel A. Pedersenaefg
a Department of Chemistry, University of Wisconsin-Madison, 1101 University Avenue,
Madison, WI 53706, USA b Chemistry Department, Augsburg University, Minneapolis, MN 55454, USA c Department of Chemistry, University of Minnesota, Minneapolis, MN 55455, USA d Department of Chemistry, University of Pennsylvania, 231 S 34th St, Philadelphia, PA 19104 e Environmental Chemistry and Technology Program, University of Wisconsin-Madison, 660
North Part Street, Madison, WI 53706 f Department of Soil Science, University of Wisconsin-Madison, 1525 Observatory Drive,
Madison, WI 53706, USA g Department of Civil & Environmental Engineering, University of Wisconsin-Madison, 1415
Engineering Drive, Madison, WI 53706, USA h Current address: Department of Chemistry, University of Illinois at Urbana-Champaign, 505
South Matthews, Urbana, IL 61801, USA i Current address: 3M Center, Saint Paul, MN 55144, USA j Current address: Carteret Community College, 3505 Arendell Street, Morehead City, NC
28557, USA k Current address: Department of Chemistry, University of California-Riverside, 501 Big
Springs Road, Riverside, CA 92521
Electronic Supplementary Material (ESI) for Chemical Science.This journal is © The Royal Society of Chemistry 2020
S2
Contents
Results and Discussion ................................................................................................................... 3
Materials. ....................................................................................................................................... 3
Free bPEI polymer analysis. ........................................................................................................... 3
Bacterial viability analysis. ............................................................................................................. 3
Isolation of bacterial sacculi. .......................................................................................................... 4
Characterization of D-alanine in WTA. ........................................................................................... 5
Table S1 .......................................................................................................................................... 6
Table S2 .......................................................................................................................................... 7
Table S3 .......................................................................................................................................... 8
Table S4 ........................................................................................................................................ 10
Table S5 ........................................................................................................................................ 11
Table S6 ........................................................................................................................................ 13
Table S7 ........................................................................................................................................ 15
Table S8 ........................................................................................................................................ 17
Table S9 ........................................................................................................................................ 18
Fig. S1 ........................................................................................................................................... 19
Fig. S2 ........................................................................................................................................... 20
Fig. S3 ........................................................................................................................................... 21
Fig. S4 ........................................................................................................................................... 22
Fig. S5 ........................................................................................................................................... 23
Fig. S6 ........................................................................................................................................... 25
Fig. S7 ........................................................................................................................................... 26
Fig. S8 ........................................................................................................................................... 27
Fig. S9 ........................................................................................................................................... 28
Fig. S10 ......................................................................................................................................... 30
Fig. S11 ......................................................................................................................................... 31
Fig. S12 ......................................................................................................................................... 32
References ................................................................................................................................... 34
S3
Results and Discussion
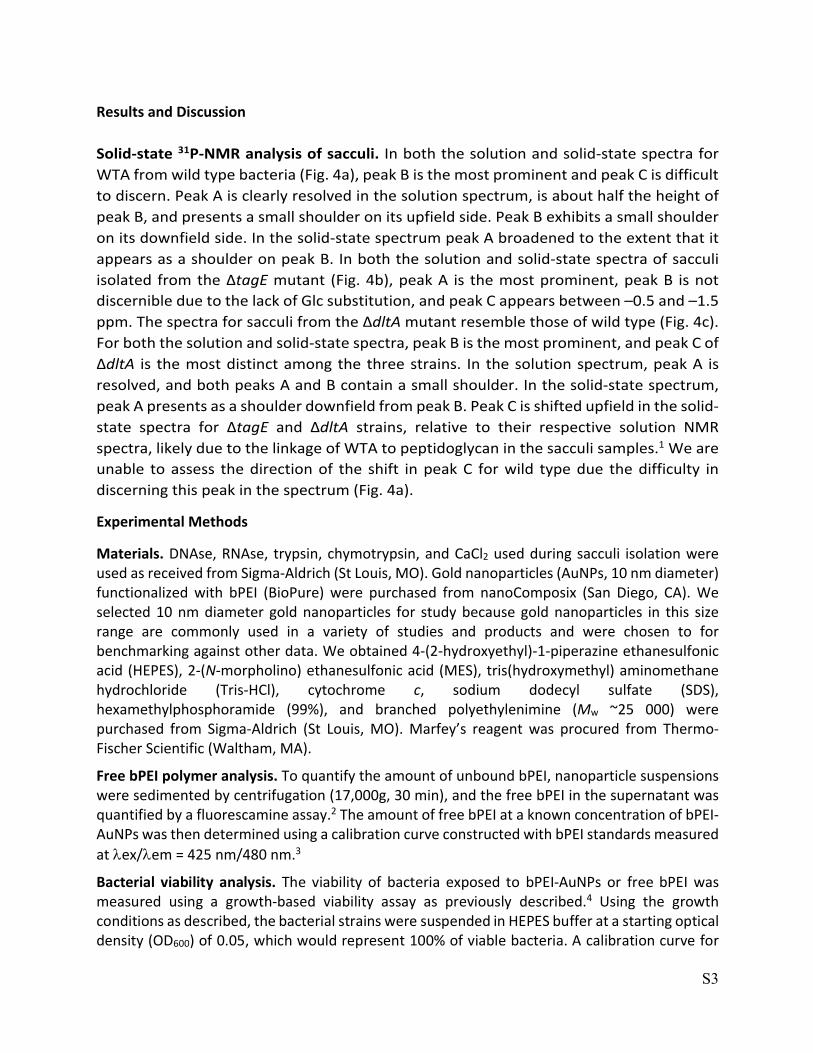
Solid-state 31P-NMR analysis of sacculi. In both the solution and solid-state spectra for
WTA from wild type bacteria (Fig. 4a), peak B is the most prominent and peak C is difficult
to discern. Peak A is clearly resolved in the solution spectrum, is about half the height of
peak B, and presents a small shoulder on its upfield side. Peak B exhibits a small shoulder
on its downfield side. In the solid-state spectrum peak A broadened to the extent that it
appears as a shoulder on peak B. In both the solution and solid-state spectra of sacculi
isolated from the ΔtagE mutant (Fig. 4b), peak A is the most prominent, peak B is not
discernible due to the lack of Glc substitution, and peak C appears between –0.5 and –1.5
ppm. The spectra for sacculi from the ΔdltA mutant resemble those of wild type (Fig. 4c).
For both the solution and solid-state spectra, peak B is the most prominent, and peak C of
ΔdltA is the most distinct among the three strains. In the solution spectrum, peak A is
resolved, and both peaks A and B contain a small shoulder. In the solid-state spectrum,
peak A presents as a shoulder downfield from peak B. Peak C is shifted upfield in the solid-
state spectra for ΔtagE and ΔdltA strains, relative to their respective solution NMR
spectra, likely due to the linkage of WTA to peptidoglycan in the sacculi samples.1 We are
unable to assess the direction of the shift in peak C for wild type due the difficulty in
discerning this peak in the spectrum (Fig. 4a).
Experimental Methods
Materials. DNAse, RNAse, trypsin, chymotrypsin, and CaCl2 used during sacculi isolation were
used as received from Sigma-Aldrich (St Louis, MO). Gold nanoparticles (AuNPs, 10 nm diameter)
functionalized with bPEI (BioPure) were purchased from nanoComposix (San Diego, CA). We
selected 10 nm diameter gold nanoparticles for study because gold nanoparticles in this size
range are commonly used in a variety of studies and products and were chosen to for
benchmarking against other data. We obtained 4-(2-hydroxyethyl)-1-piperazine ethanesulfonic
acid (HEPES), 2-(N-morpholino) ethanesulfonic acid (MES), tris(hydroxymethyl) aminomethane
hydrochloride (Tris-HCl), cytochrome c, sodium dodecyl sulfate (SDS),
hexamethylphosphoramide (99%), and branched polyethylenimine (Mw ~25 000) were
purchased from Sigma-Aldrich (St Louis, MO). Marfey’s reagent was procured from Thermo-
Fischer Scientific (Waltham, MA).
Free bPEI polymer analysis. To quantify the amount of unbound bPEI, nanoparticle suspensions
were sedimented by centrifugation (17,000g, 30 min), and the free bPEI in the supernatant was
quantified by a fluorescamine assay.2 The amount of free bPEI at a known concentration of bPEI-
AuNPs was then determined using a calibration curve constructed with bPEI standards measured
at lex/lem = 425 nm/480 nm.3
Bacterial viability analysis. The viability of bacteria exposed to bPEI-AuNPs or free bPEI was
measured using a growth-based viability assay as previously described.4 Using the growth
conditions as described, the bacterial strains were suspended in HEPES buffer at a starting optical
density (OD600) of 0.05, which would represent 100% of viable bacteria. A calibration curve for
S4
viable bacteria was obtained by serial diluting the initial culture with lower population of viable
cells resulting in longer time to reach its exponential growth point. To assess toxicity of bPEI-
AuNPs or free bPEI polymer, bacterial cells were incubated with nanoparticles for 15 min in HEPES
buffer, and were introduced to fresh LB medium for growth. The toxicity induced by the particles
decreased the initial viable cell population, and resulted in delays for the cultures to reach the
exponential growth point. The percent of viable and actively metabolizing bacterial cells was then
interpolated from the calibration curve.
Isolation of bacterial sacculi. Upon attainment of stationary phase, 1 mL of the suspension of
cells grown on LB (1 mL) was transferred into 15 mL of fresh LB media in triplicate. This series of
liquid inoculation was repeated once again for three times total. Two 15 mL aliquots were then
combined to 500 mL of fresh LB broth. From this volume, the cultures were added to a 1 L baffled
Erlenmeyer flask. Once the 1 L total of culture reached an OD600 of 0.6 (approximately 6 h), this
solution became the initial starting solution for cell wall isolation for samples collected from LB
media.
Once 1 L of culture was obtained for each strain in both LB and M9L media, flasks containing the
cells were submerged in a 50:50 water:ethanol ice bath to rapidly cool the cell culture. Cells were
harvested by centrifugation (7000g, 4 °C, 20 min). Sedimented cells were quantitatively
transferred to a single 250 mL polypropylene centrifuge bottle (Thermo Scientific) containing 30
mL of ice cold 50 mM Tris-HCl, pH 7.4. To this was added 120 mL of hot 5% SDS to achieve a final
concentration of 4% SDS, and the solution was placed in a boiling water bath for 30 min with the
lid partially threaded on to allow pressure to escape as necessary. This solution then sat overnight
at room temperature.5,6
Whole cells were recovered from the SDS solution through multiple ultracentrifugation steps.7,8
Unless otherwise noted, all ultracentrifugation steps were performed at 46,000g for 30 min at
25 °C using an Optima L-90K Beckman Coulter, Inc. instrument. Cell suspensions (150 mL) were
sedimented in 13.2 mL × 6 polypropylene ultracentrifuge tubes (14 × 89 mm capacity, Beckman
Coulter). Pellets were washed twice with 1 M NaCl. To ensure pellet resuspension between
washes, pellets were agitated with sterile, disposable inoculating loops and thorough mix
pipetting. Each washing step required a 30 min ultracentrifugation spin step to sediment the
pellets. The resulting six pellets were combined into three via quantitative transfer. Pellets went
through four cycles of washing with ultrapure water to remove SDS, agitation, and
sedimentation, using the method described by Hayashi.9 After these washing steps, 1 mL of
ultrapure water was added to the pellets, and they were allowed to sit overnight.
The following day, the cells were agitated and re-suspended using sterile inoculating loops. The
solution was divided into two parts and each 500 µL aliquot was transferred to a vial containing
350 µL of 100 µm acid washed glass beads (2.0 mL capacity, Benchmark Scientific). The cells were
mechanically lysed using a FastPrep-24 instrument for 15 rounds using a setting of 6.5 m·s-1 for
20 s with 1 min rest intervals between the pulses. To separate the beads from the lysed cells,
bead beating vials were washed with ~30 mL of ultrapure water to ensure complete sample
S5
removal into a 50 mL Falcon polypropylene centrifuge tube and centrifuged (3000g, 2 min) using
a Rotanta 460 RS centrifuge (Hettich Zentrifugen). Glass beads were sedimented, leaving the
bacterial suspension in the supernatant. This method was reliable yet unsatisfactory as it left the
margin for glass bead contamination in the sample. This technique was used for cell wall isolation
from LB broth, yet a second method was developed for separating the cells from the beads for
the cell walls isolated from M9L media. Rather than centrifuging at 3000g, a vacuum filter system
with a rough fritted glass filter (pore size of 45-60 µm) was used. Because lysed bacterial cells are
significantly smaller than this pore size, only glass beads were retained in the filter. A drawback
to both methods is that they yielded large volumes of supernatant or filtrate such that multiple
steps were required to condense lysed cells into a single ultracentrifuge tube.
Cell remnants were suspended in 10 mL of enzyme buffer (100 mM Tris-HCl, 20 mM MgSO4, pH
7.5). Nucleic acid digestion was performed using 10 µg·mL-1 DNAse and 50 µg·mL-1 RNAse at 37
°C for 2 h. Proteins were digested by adding 10 mM CaCl2, trypsin and chymotrypsin (both at 100
µg·mL-1). Proteolysis was allowed to proceed for 18 h in a shaker at 37 °C and 150 rpm. Digestion
was halted by addition of 1% SDS and incubation for 15 min at 80 °C in a water bath (Dubnoff
Metabolic Shaking Incubator, Precision Thermo Electron Corporation). Crude cell wall was
recovered by ultracentrifugation, re-suspended in 8 M LiCl, and incubated for 15 min at 37 °C.
The pellet was washed in the following sequence: twice with ultrapure water, once with acetone,
and four times with ultrapure water. Samples were stored at –80 °C until lyophilization (24 h, –
50 °C, 60 mTorr).10 This yielded a white to light yellow semi-crystalline powder. Total sacculi
yields varied with bacterial strain and growth medium (roughly 100 mg of lyophilized sacculi per
strain and growth medium). Solution 31P-NMR was also used to quantify the amount of
phosphorus in WTA isolates (vide infra).
Characterization of D-alanine in WTA. To verify that the WTA produced by the ΔdltA mutant
lacked D-alanine, we quantified the amount of alanine in isolated wall teichoic acid using reverse-
phase HPLC with UV detection. Bacterial cells were sedimented by centrifugation (1,000g, 10
min) and deactivated by heating (100 °C, 30 min). The sample pellets were frozen (–80 °C, 24 h)
and lyophilized (Labconco FreeZone 1 Liter Benchtop Freeze Dry System, Kansas City, MO). An
aliquot of lyophilized sample (5 mg) was resuspended in 150 µL of 0.1 M NaOH and incubated for
37 °C for 1 h, followed by neutralization with 150 µL of 0.1 M HCl. Samples were centrifuged
(750g, 10 min), and the supernatant containing hydrolyzed alanine was removed, frozen (–80 °C,
24 h), and lyophilized. Lyophilized WTA was suspended in 100 µL of ultrapure water, reacted with
200 µL of 1% Marfey’s reagent in acetone and 40 µL of 1 M sodium bicarbonate at 40 °C for 1 h
on a heating block. Once the reaction was complete, samples were neutralized with 40 µL of 1 M
HCl, degassed, separated via HPLC using a C–18 column (Agilent Eclipse-XDB, 4.6x150 mm), and
quantified based on absorbance at 340 nm. Gradient elution of mobile phase was carried out
from 0-50% acetonitrile in sodium acetate buffer over 10 min, followed by isocratic elution at
50% of acetonitrile for 3 min.11
S6
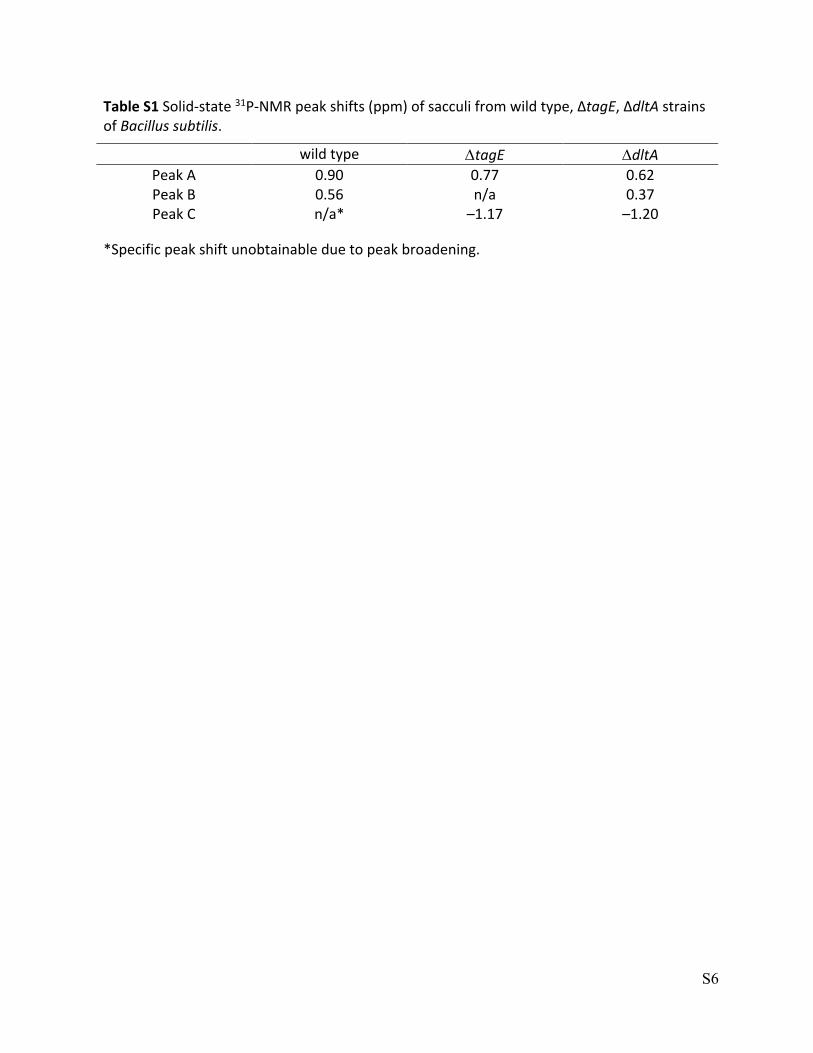
Table S1 Solid-state 31P-NMR peak shifts (ppm) of sacculi from wild type, ΔtagE, ΔdltA strains
of Bacillus subtilis.
wild type DtagE DdltA
Peak A 0.90 0.77 0.62
Peak B 0.56 n/a 0.37
Peak C n/a* –1.17 –1.20
*Specific peak shift unobtainable due to peak broadening.
S7
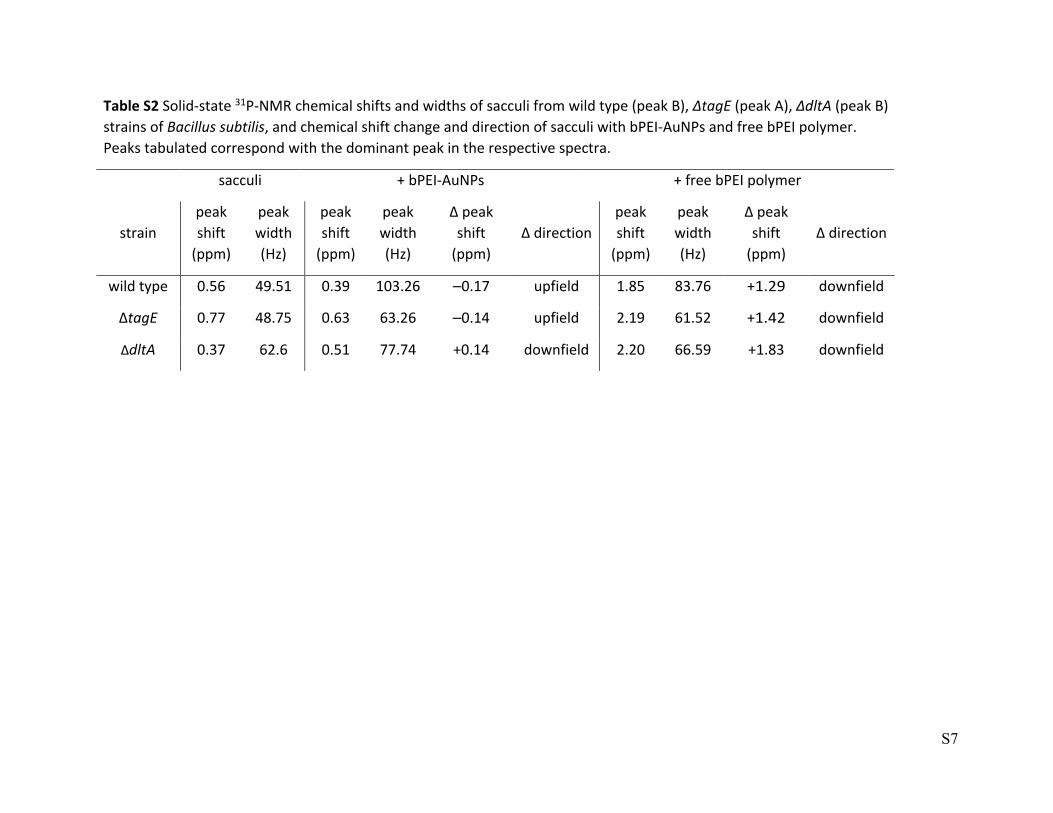
Table S2 Solid-state 31P-NMR chemical shifts and widths of sacculi from wild type (peak B), ΔtagE (peak A), ΔdltA (peak B) strains of Bacillus subtilis, and chemical shift change and direction of sacculi with bPEI-AuNPs and free bPEI polymer. Peaks tabulated correspond with the dominant peak in the respective spectra.
sacculi + bPEI-AuNPs + free bPEI polymer
strain peak shift
(ppm)
peak width (Hz)
peak shift
(ppm)
peak width (Hz)
Δ peak shift
(ppm) Δ direction
peak shift
(ppm)
peak width (Hz)
Δ peak shift
(ppm) Δ direction
wild type 0.56 49.51 0.39 103.26 –0.17 upfield 1.85 83.76 +1.29 downfield
ΔtagE 0.77 48.75 0.63 63.26 –0.14 upfield 2.19 61.52 +1.42 downfield
ΔdltA 0.37 62.6 0.51 77.74 +0.14 downfield 2.20 66.59 +1.83 downfield
S8
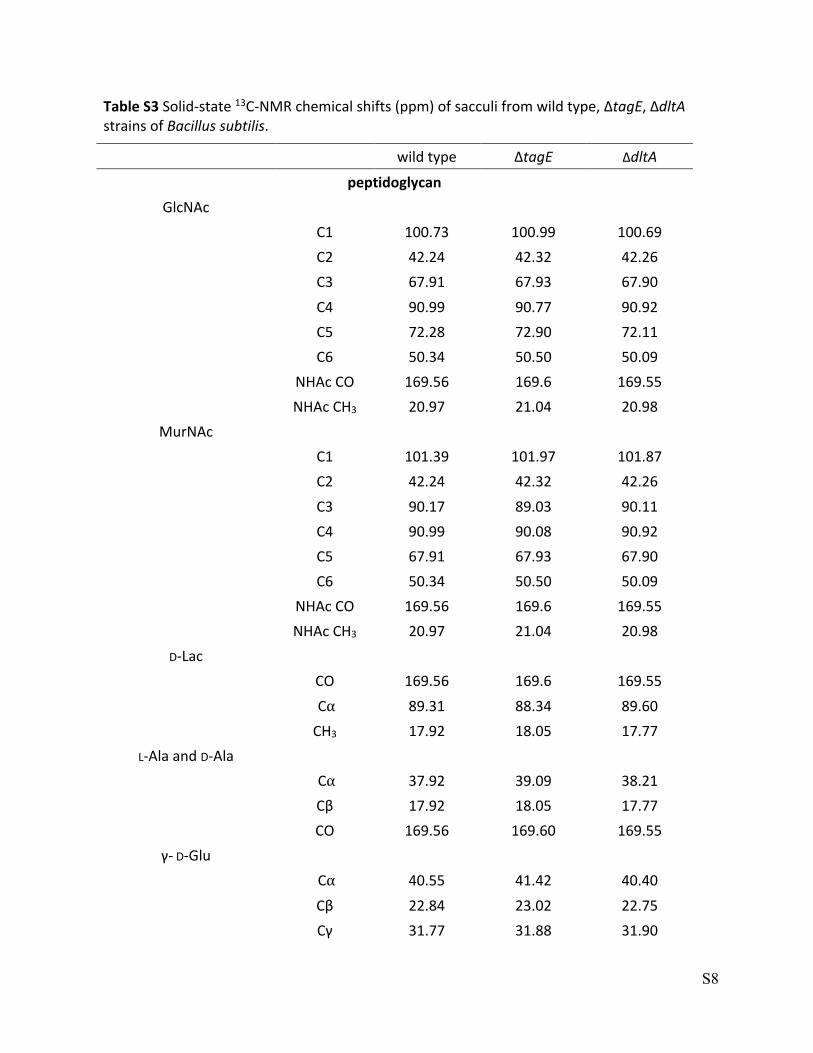
Table S3 Solid-state 13C-NMR chemical shifts (ppm) of sacculi from wild type, ΔtagE, ΔdltA strains of Bacillus subtilis. wild type ΔtagE ΔdltA
peptidoglycan
GlcNAc
C1 100.73 100.99 100.69 C2 42.24 42.32 42.26 C3 67.91 67.93 67.90 C4 90.99 90.77 90.92 C5 72.28 72.90 72.11 C6 50.34 50.50 50.09 NHAc CO 169.56 169.6 169.55 NHAc CH3 20.97 21.04 20.98
MurNAc
C1 101.39 101.97 101.87 C2 42.24 42.32 42.26 C3 90.17 89.03 90.11 C4 90.99 90.08 90.92 C5 67.91 67.93 67.90 C6 50.34 50.50 50.09 NHAc CO 169.56 169.6 169.55 NHAc CH3 20.97 21.04 20.98
D-Lac
CO 169.56 169.6 169.55 C⍺ 89.31 88.34 89.60 CH3 17.92 18.05 17.77
L-Ala and D-Ala
C⍺ 37.92 39.09 38.21 Cβ 17.92 18.05 17.77 CO 169.56 169.60 169.55
γ- D-Glu
C⍺ 40.55 41.42 40.40 Cβ 22.84 23.02 22.75 Cγ 31.77 31.88 31.90
S9
CO2– 169.56 169.6 169.55 CONH 169.56 169.6 169.55
meso-A2pm
C⍺ 39.38 40.55 39.53 Cβ 28.83 29.02 28.72 Cγ 19.67 19.67 19.52 Cδ 19.67 19.67 19.52 Cϵ 19.67 19.67 19.52 CO 169.56 169.6 169.55
wall teichoic acids
glycerolphosphate C1 55.06 55.31 55.14 C2 75.77 75.44 75.51 C3 55.06 55.31 55.14
GlcNAc and ManNAc
C1 100.14 99.49 99.97 C2 42.24 42.32 42.26 C3 79.49 79.63 79.2 C4 60.80 60.95 60.84 C5 65.95 67.12 65.81 C6 50.34 50.50 50.09 NHAc CO 169.56 169.6 169.55 NHAc CH3 20.97 21.04 20.98
Glc
C1 99.28† n/a 98.00† C2 74.13† n/a 74.33† C3 74.13† n/a 74.33† C4 70.13† n/a 70.04† C5 74.13† n/a 74.33† C6 61.85† n/a 62.20†
† Signal-to-noise low, peak assignment tentative. Abbreviations: GlcNAc, N-acetylglucosamine; ManNAc, N-acetylmannosamine; MurNAc, N-acetylmuramic acid; D-Ala, D-alanine; L-Ala, L-alanyl; meso-A2pm, meso-diaminopimelyl; Glc, glucose; D-γ-Glu, D-γ-glutamyl; D-Lac, D-lactyl
S10
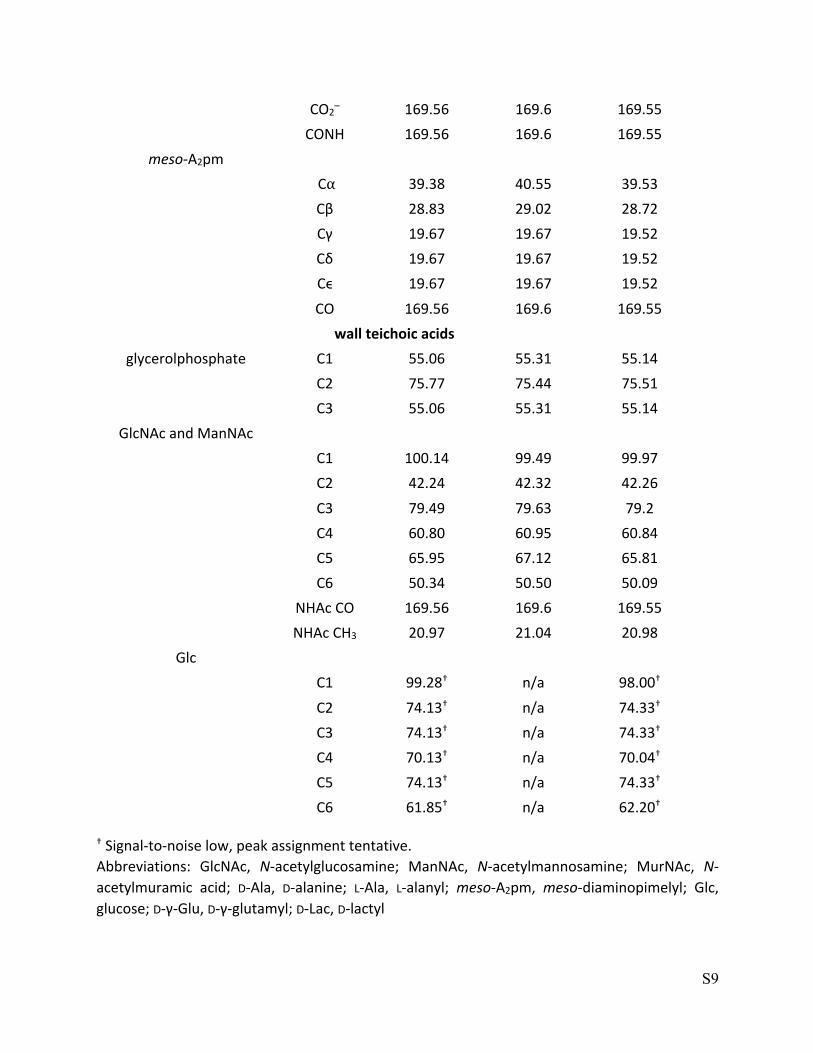
Table S4 Linear fit equations of temperature-dependent T1 relaxation times for specified 13C resonances of sacculi from wild type, ΔtagE, ΔdltA strains of Bacillus subtilis. In peptidoglycan residues, C3 refers to GlcNAc, and C5 is of MurNAc.
wild type ΔtagE ΔdltA peptidoglycan
C3, C5 T1 = -0.041 (± 0.0091)T + 3.6 (± 0.15)†
T1 = -0.025 (± 0.0037)T + 3.3 (± 0.063)†
T1 = -0.030 (± 0.0028)T + 3.9 (± 0.048)†
C4 T1 = -0.070 (± 0.015)T + 3.2 (± 0.26)†
T1 = -0.076 (± 0.016)T + 4.0 (± 0.28)†
T1 = -0.050 (± 0.0096)T + 3.5 (± 0.16)†
Glu Cγ T1 = -0.0079 (± 0.0021)T + 0.76 (± 0.037)†
T1 = -0.0037 (± 0.0012)T + 0.63 (± 0.020)
T1 = -0.0051 (± 0.00086)T + 0.72 (± 0.015)†
meso-A2pm Cβ T1 = -0.016 (± 0.0040)T + 0.89 (± 0.069)†
T1 = -0.011 (± 0.0016)T + 0.67 (± 0.028)†
T1 = -0.0063 (± 0.00034)T + 0.68 (± 0.0058)†
wall teichoic acids
C1, C3 T1 = -0.010 (± 0.0017)T + 0.67 (± 0.029)†
T1 = -0.0089 (± 0.0026)T + 0.51 (± 0.045)†
T1 = -0.0092(± 0.0028)T + 0.64 (± 0.048)†
C2 T1 = -0.011 (± 0.00087)T + 0.74 (± 0.015)†
T1 = -0.014 (± 0.00084)T + 0.83 (± 0.014)†
T1 = -0.023 (± 0.0031)T + 1.1 (± 0.054)†
† Significant non-zero linear fit. Abbreviations: T1, longitudinal relaxation time; T, temperature.
S11
Table S5 Solid-state 13C-NMR chemical shifts (ppm) of sacculi from wild type strain of Bacillus subtilis, with
bPEI-AuNPs and free bPEI polymer. wild type
sacculi + bPEI AuNPs + free bPEI polymer
peptidoglycan
GlcNAc
C1 100.73 100.83 100.96
C2 42.24 42.58 42.57
C3 67.91 68.22 68.18
C4 90.99 ‒ ‒
C5 72.28 ‒ ‒
C6 50.34 50.47§ ‒
NHAc CO 169.56 169.78 169.81
NHAc CH3 20.97 21.27 21.24
MurNAc
C1 101.39 101.26§ ‒
C2 42.24 42.58 42.57
C3 90.17 90.30 90.32
C4 90.99 ‒ ‒
C5 67.91 68.22 68.18
C6 50.34 50.47§ ‒
NHAc CO 169.56 169.78 169.81
NHAc CH3 20.97 21.27 21.24
D-Lac
CO 169.56 169.78 169.81
C⍺ 89.31 ‒ ‒
CH3 17.92 18.20§ ‒
L-Ala and D-Ala
C⍺ 37.92 38.20 38.13
Cβ 17.92 18.20§ ‒
CO 169.56 169.78 169.81
γ- D-Glu
C⍺ 40.55 40.98 40.91
Cβ 22.84 23.02 22.80§
S12
Cγ 31.77 32.58 32.76§
CO2– 169.56 169.78 169.81
CONH 169.56 169.78 169.81
meso-A2pm
C⍺ 39.38 39.66 39.59
Cβ 28.83 29.07 29.28§
Cγ 19.67 19.95 19.74
Cδ 19.67 19.95 19.74
Cϵ 19.67 19.95 19.74
CO 169.56 169.78 169.81
wall teichoic acids
glycerolphosphate C1 55.06 55.73 ‒
C2 75.77 ‒ ‒
C3 55.06 55.73 ‒
GlcNAc and ManNAc
C1 100.14 ‒ 100.14§
C2 42.24 42.58 42.57
C3 79.49 ‒ ‒
C4 60.80 60.66 ‒
C5 65.95 ‒ ‒
C6 50.34 51.04 ‒
NHAc CO 169.56 169.78 169.81
NHAc CH3 20.97 21.27 21.24
Glc
C1 99.28† ‒ ‒
C2 74.13† ‒ ‒
C3 74.13† ‒ ‒
C4 70.13† ‒ ‒
C5 74.13† ‒ ‒
C6 61.85† 61.77† ‒
Notation: ‒, no detectable peak; †, peak assignment tentative; §, low signal-to-noise ratio.
Abbreviations: GlcNAc, N-acetylglucosamine; ManNAc, N-acetylmannosamine; MurNAc, N-
acetylmuramic acid; D-Ala, D-alanine; L-Ala, L-alanyl; meso-A2pm, meso-diaminopimelyl; Glc,
glucose; D-γ-Glu, D-γ-glutamyl; D-Lac, D-lactyl.
S13
Table S6 Solid-state 13C-NMR chemical shifts (ppm) of sacculi from ΔtagE strain of Bacillus subtilis, with bPEI-AuNPs and free bPEI polymer.
ΔtagE
sacculi + bPEI AuNPs + free bPEI polymer
peptidoglycan
GlcNAc
C1 100.99 101.34 101.24
C2 42.32 42.92 42.63
C3 67.93 68.58 68.22
C4 90.77 91.35 91.57
C5 72.90 73.70 72.97
C6 50.50 51.02 49.84
NHAc CO 169.60 170.28 169.85
NHAc CH3 21.04 21.65 21.25
MurNAc
C1 101.97 ‒ ‒
C2 42.32 42.92 42.63
C3 89.03 90.03 ‒
C4 90.08 90.71 90.23
C5 67.93 68.58 68.22
C6 50.50 51.02 49.84
NHAc CO 169.60 170.28 169.85
NHAc CH3 21.04 21.65 21.25
D-Lac
CO 169.60 170.28 169.85
C⍺ 88.34 89.20 88.36
CH3 18.05 18.64 18.11
L-Ala and D-Ala
C⍺ 39.09 39.22 39.13
Cβ 18.05 18.64 18.11
CO 169.60 170.28 169.85
γ- D-Glu
C⍺ 41.42 41.56 ‒
Cβ 23.02 23.44 23.10
S14
Cγ 31.88 32.86 31.49
CO2– 169.60 170.28 169.85
CONH 169.60 170.28 169.85
meso-A2pm
C⍺ 40.55 40.54 40.30
Cβ 29.02 29.91 29.09
Cγ 19.67 20.53 20.01
Cδ 19.67 20.53 20.01
Cϵ 19.67 20.53 20.01
CO 169.60 170.28 169.85
wall teichoic acids
glycerolphosphate C1 55.31 56.11 55.40
C2 75.44 76.02 75.37
C3 55.31 56.11 55.40
GlcNAc and ManNAc
C1 99.49 100.54§ ‒
C2 42.32 42.92 42.63
C3 79.63 ‒ 80.08§
C4 60.95 61.48 61.12
C5 67.12 66.82 ‒
C6 50.50 51.02 49.84
NHAc CO 169.60 170.28 169.85
NHAc CH3 21.04 21.65 21.25
Glc
C1 ‒ C6 n/a
Notation: ‒, no detectable peak; §, low signal-to-noise ratio.
Abbreviations: GlcNAc, N-acetylglucosamine; ManNAc, N-acetylmannosamine; MurNAc, N-
acetylmuramic acid; D-Ala, D-alanine; L-Ala, L-alanyl; meso-A2pm, meso-diaminopimelyl; Glc,
glucose; D-γ-Glu, D-γ-glutamyl; D-Lac, D-lactyl.
S15
Table S7 Solid-state 13C-NMR chemical shifts (ppm) of sacculi from ΔdltA strain of Bacillus subtilis,
with bPEI-AuNPs and free bPEI polymer.
ΔdltA
sacculi + bPEI AuNPs + free bPEI polymer
peptidoglycan
GlcNAc
C1 100.69 100.82 101.04
C2 42.26 42.40 42.56
C3 67.90 68.08 68.17
C4 90.92 90.91 91.22
C5 72.11 72.74 72.37
C6 50.09 50.46 50.65
NHAc CO 169.55 169.67 169.80
NHAc CH3 20.98 21.14 21.23
MurNAc
C1 101.87 102.15 102.02
C2 42.26 42.40 42.56
C3 90.11 90.27 90.24
C4 90.92 90.91 91.22
C5 67.90 68.08 68.17
C6 50.09 50.46 50.65
NHAc CO 169.55 169.67 169.80
NHAc CH3 20.98 21.14 21.23
D-Lac
CO 169.55 169.67 169.80
C⍺ 89.60 89.59 89.35
CH3 17.77 18.12 18.39
L-Ala and D-Ala
C⍺ 38.21 39.81 39.34
Cβ 17.77 18.12 18.39
CO 169.55 169.67 169.80
γ- D-Glu
C⍺ 40.40 41.56 40.73
Cβ 22.75 22.96 23.22
S16
Cγ 31.90 31.21 31.36
CO2– 169.55 169.67 169.80
CONH 169.55 169.67 169.80
meso-A2pm
C⍺ 39.53 40.68 40.14
Cβ 28.72 29.04 29.32
Cγ 19.52 19.80 20.00
Cδ 19.52 19.80 20.00
Cϵ 19.52 19.80 20.00
CO 169.55 169.67 169.80
wall teichoic acids
glycerolphosphate C1 55.14 55.43 55.47
C2 75.51 75.71 75.55
C3 55.14 55.43 55.47
GlcNAc and ManNAc
C1 99.97 98.35 99.91
C2 42.26 42.40 42.56
C3 79.20 78.82 78.60
C4 60.84 60.96 60.94
C5 65.81 66.52 66.86
C6 50.09 50.46 50.65
NHAc CO 169.55 169.67 169.80
NHAc CH3 20.98 21.14 21.23
Glc
C1 98.00† 97.44† 98.39†
C2 74.33† ‒ 74.56†
C3 74.33† ‒ 74.56†
C4 70.04† 70.03† ‒
C5 74.33† ‒ 74.56†
C6 62.20† 62.39† 62.32†
Notation: ‒, no detectable peak; †, signal-to-noise low, peak assignment tentative.
Abbreviations: GlcNAc, N-acetylglucosamine; ManNAc, N-acetylmannosamine; MurNAc, N-
acetylmuramic acid; D-Ala, D-alanine; L-Ala, L-alanyl; meso-A2pm, meso-diaminopimelyl; Glc,
glucose; D-γ-Glu, D-γ-glutamyl; D-Lac, D-lactyl.
S17
Table S8 Minimal growth medium formula.12
base solution component concentration [mM]
Na2HPO4•7H2O 37.3
KH2PO4 22
NaCl 8.5
15NH4Cl 18.6
supplements component concentration [mM]
13C-glucose (all C labeled) 22
MgSO4 1
CaCl2 0.1
MnCl2 0.1
ZnSO4 0.05
vitamins component concentration [µM]
pyridoxin 295
biotin 205
panthothenate, hemi calcium 228
folic acid 113
choline chloride 358
niacin amide 409
riboflavin 133
thiamine 741
S18
Table S9 Composition of Luria-Bertani (LB) medium.
component concentration (g/L)
tryptone 10
yeast extract 5
NaCl 10
S19
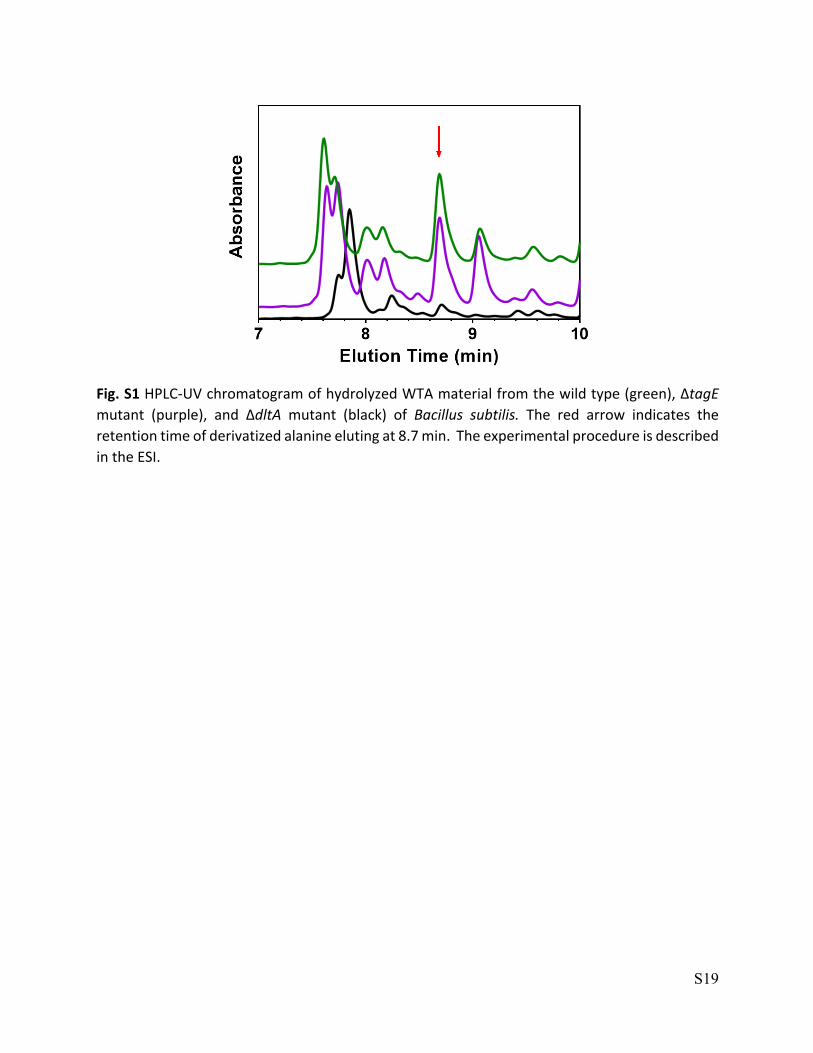
Fig. S1 HPLC-UV chromatogram of hydrolyzed WTA material from the wild type (green), ΔtagE mutant (purple), and ΔdltA mutant (black) of Bacillus subtilis. The red arrow indicates the
retention time of derivatized alanine eluting at 8.7 min. The experimental procedure is described
in the ESI.
S20
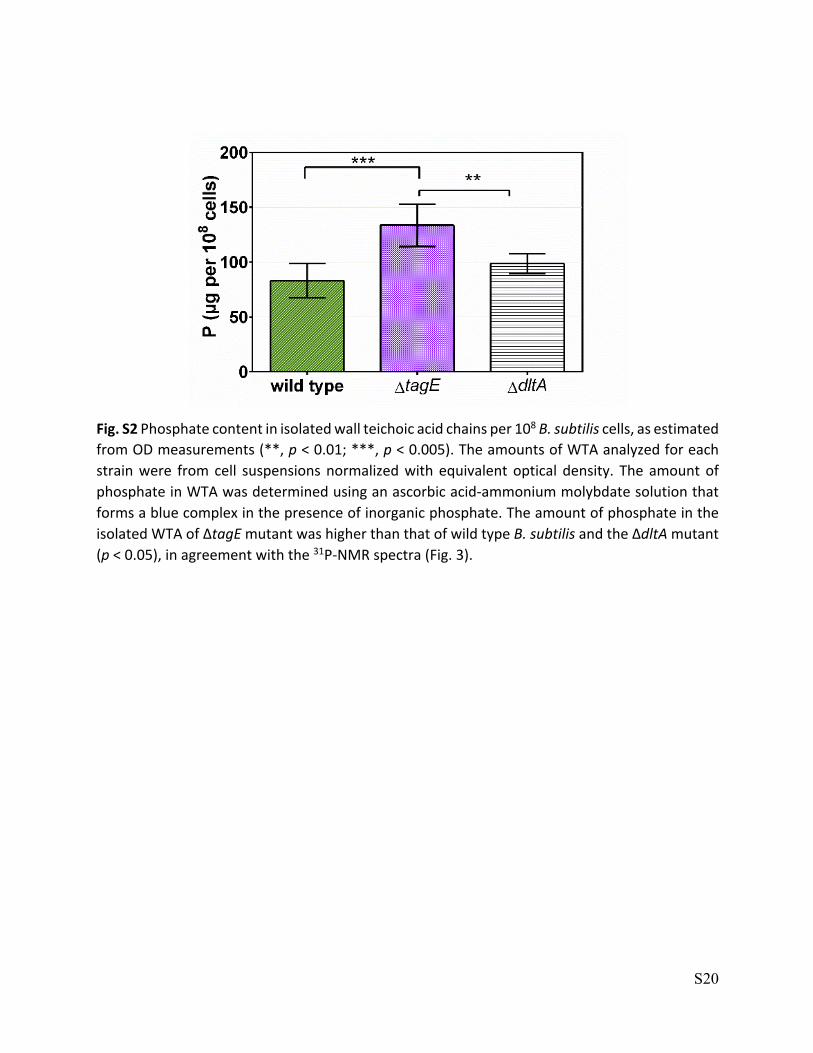
Fig. S2 Phosphate content in isolated wall teichoic acid chains per 108 B. subtilis cells, as estimated
from OD measurements (**, p < 0.01; ***, p < 0.005). The amounts of WTA analyzed for each
strain were from cell suspensions normalized with equivalent optical density. The amount of
phosphate in WTA was determined using an ascorbic acid-ammonium molybdate solution that
forms a blue complex in the presence of inorganic phosphate. The amount of phosphate in the
isolated WTA of ΔtagE mutant was higher than that of wild type B. subtilis and the ΔdltA mutant
(p < 0.05), in agreement with the 31P-NMR spectra (Fig. 3).
S21
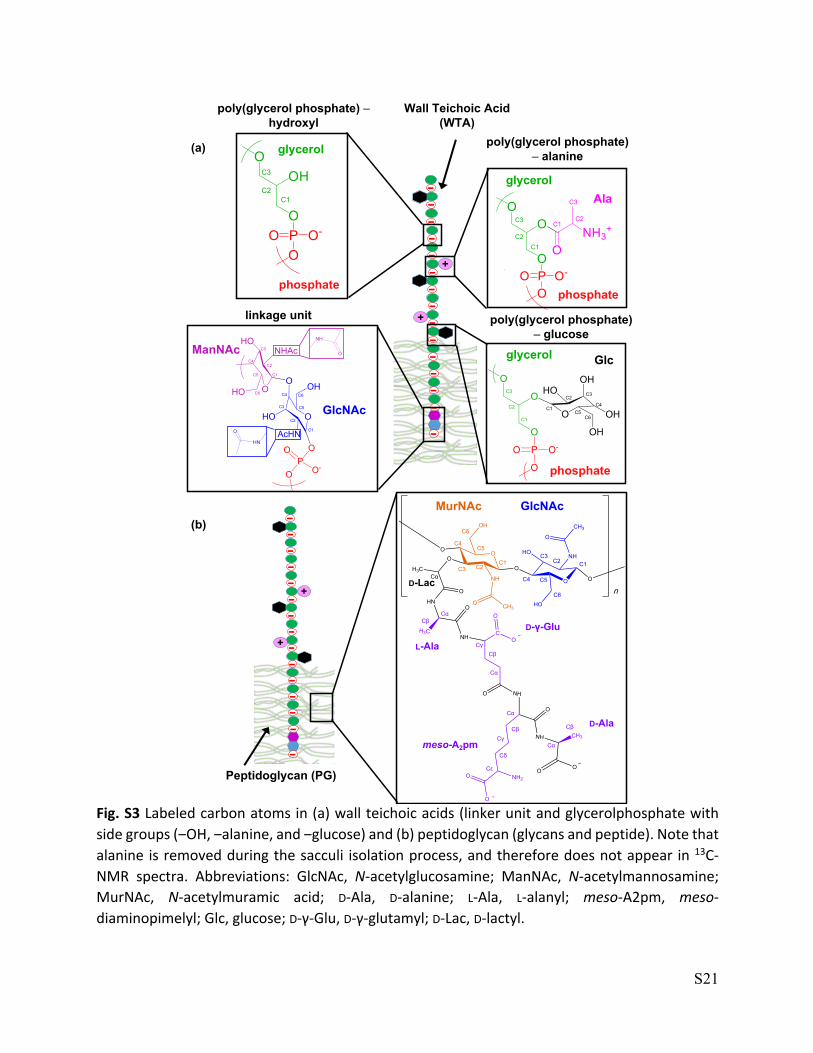
Fig. S3 Labeled carbon atoms in (a) wall teichoic acids (linker unit and glycerolphosphate with
side groups (‒OH, ‒alanine, and ‒glucose) and (b) peptidoglycan (glycans and peptide). Note that
alanine is removed during the sacculi isolation process, and therefore does not appear in 13C-
NMR spectra. Abbreviations: GlcNAc, N-acetylglucosamine; ManNAc, N-acetylmannosamine;
MurNAc, N-acetylmuramic acid; D-Ala, D-alanine; L-Ala, L-alanyl; meso-A2pm, meso-
diaminopimelyl; Glc, glucose; D-γ-Glu, D-γ-glutamyl; D-Lac, D-lactyl.
O
O
O
P O-O
O
O
HOOH
OH
OH
C2
C3
C1
C1
C2C3
C4C5
C6
O
OH
OO
H3C
O
NH
O CH3
O
O
HONH
O
CH3
O
HO
nHN
H3C
O
NH
NHO
NH2
O
O
O
NH CH3
OO
C
O
O
C6
C5C4
C3C2 C1
C6
C5C4
C3 C2C1
Cα
CγCβ
Cα
Cα
CγCβ
Cα
Cα
Cβ
Cβ
Cδ
Cε
-
-
-
-
-
-
-
-
-
-
-
-
-
-
-
+
+
(a)
Ala
Wall Teichoic Acid (WTA)
linkage unit
poly(glycerol phosphate) ‒ alanine
phosphate
glycerol
glycerol
phosphate
Glc
poly(glycerol phosphate) ‒ glucose
phosphate
C2
C3
C1
glycerol
poly(glycerol phosphate) ‒hydroxyl
C2
C3
C1
C3
C2C1
O
AcHN
HO
OH
PO
O
O
O
O-
NHAc
OHO
HO
C6
C5
C4
C3
C2
C1
C6
C4
C5
C3
C2
C1
ManNAc
GlcNAc
-
-
-
-
-
-
-
-
-
-
-
-
-
-
-
+
+
Peptidoglycan (PG)
(b)
D-γ-Glu
D-Ala
L-Ala
meso-A2pm
D-Lac
GlcNAcMurNAc
S22
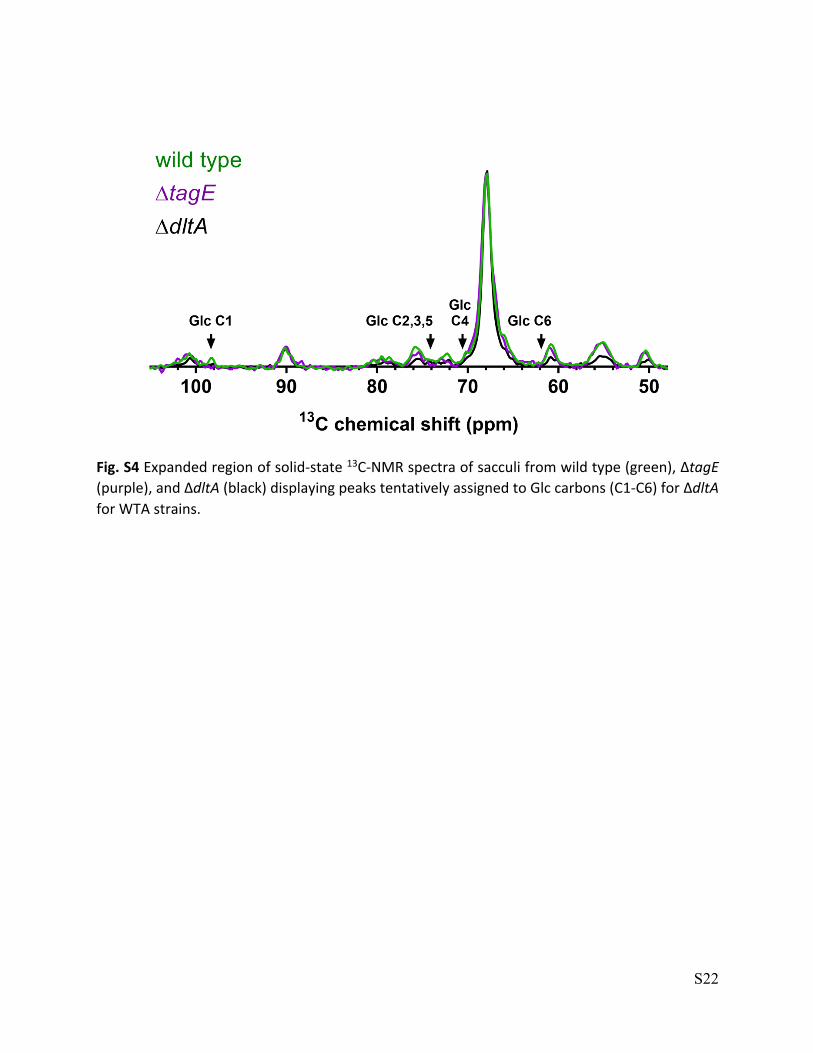
Fig. S4 Expanded region of solid-state 13C-NMR spectra of sacculi from wild type (green), ΔtagE
(purple), and ΔdltA (black) displaying peaks tentatively assigned to Glc carbons (C1-C6) for ΔdltA
for WTA strains.
S23
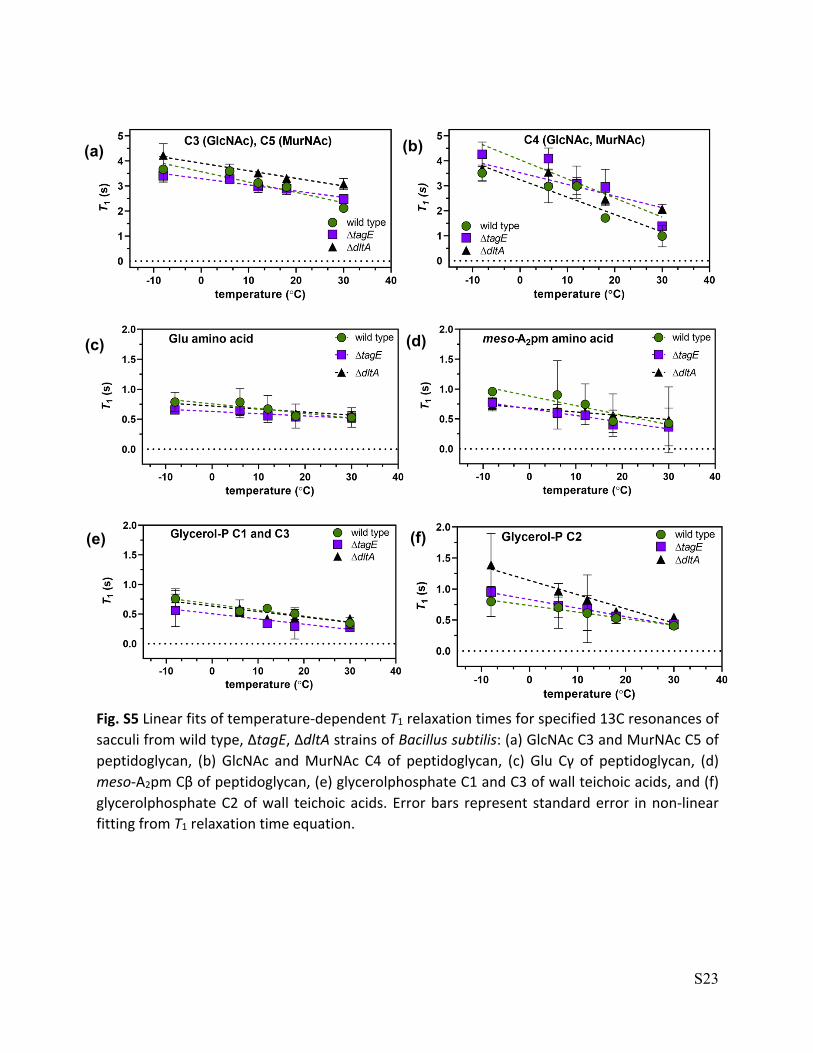
Fig. S5 Linear fits of temperature-dependent T1 relaxation times for specified 13C resonances of
sacculi from wild type, ΔtagE, ΔdltA strains of Bacillus subtilis: (a) GlcNAc C3 and MurNAc C5 of
peptidoglycan, (b) GlcNAc and MurNAc C4 of peptidoglycan, (c) Glu Cγ of peptidoglycan, (d)
meso-A2pm Cβ of peptidoglycan, (e) glycerolphosphate C1 and C3 of wall teichoic acids, and (f)
glycerolphosphate C2 of wall teichoic acids. Error bars represent standard error in non-linear
fitting from T1 relaxation time equation.
(a) (b)
(e) (f)
(d) (c)
S24
(a)
(b)
(c)
S25
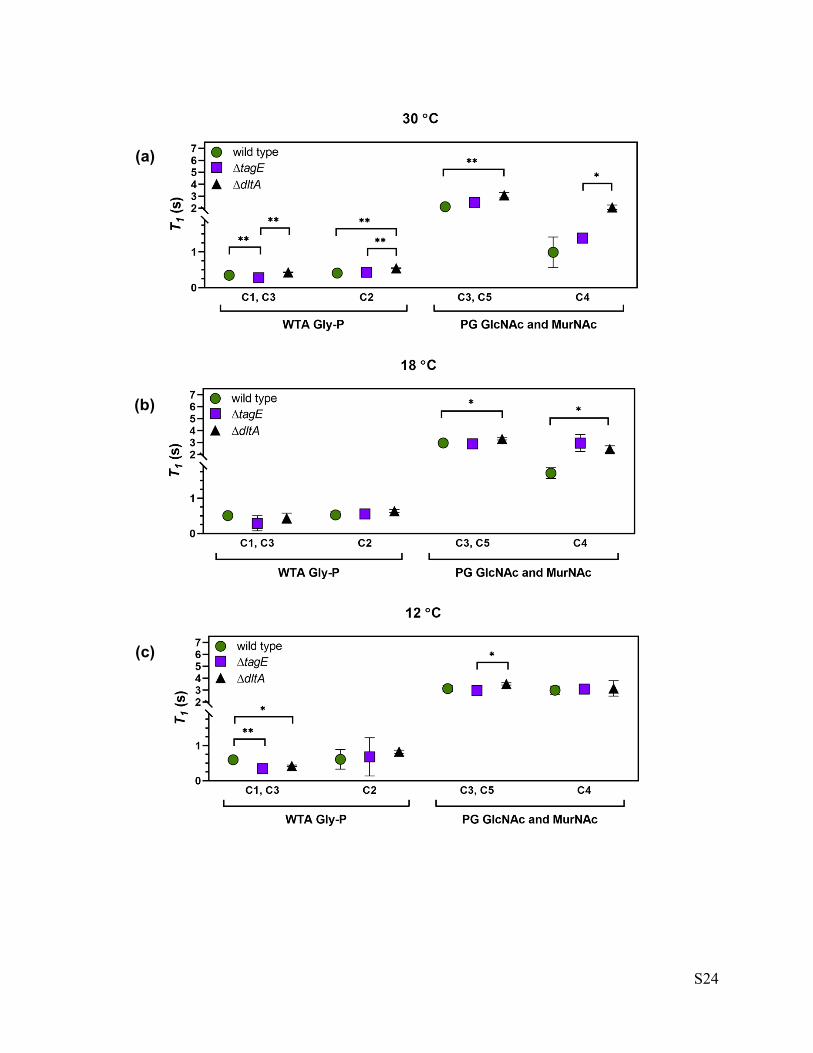
Fig. S6 T1 relaxation times at indicated temperature (a) 30 °C, (b) 18 °C, (c) 12 °C, (d) 6 °C, (e) –8
°C for specified 13C resonances of sacculi from wild type, ΔtagE, ΔdltA strains of Bacillus subtilis:
GlcNAc C3 and MurNAc C5 of peptidoglycan, GlcNAc and MurNAc C4 of peptidoglycan,
glycerolphosphate C1 and C3 of wall teichoic acids, and glycerolphosphate C2 of wall teichoic
acids. T1 relaxation times of Glu Cγ and meso-A2pm Cβ amino acids of peptidoglycan showed no
statistically significant differences among the three strains at any of the five temperatures (data
not shown). Non-linear fit statistical significance: *, p < 0.05; **, p < 0.01. Error bars represent
standard error in non-linear fitting from T1 relaxation time equation. Abbreviations: GlcNAc, N-
acetylglucosamine; MurNAc, N-acetylmuramic acid.
(d)
(e)
S26
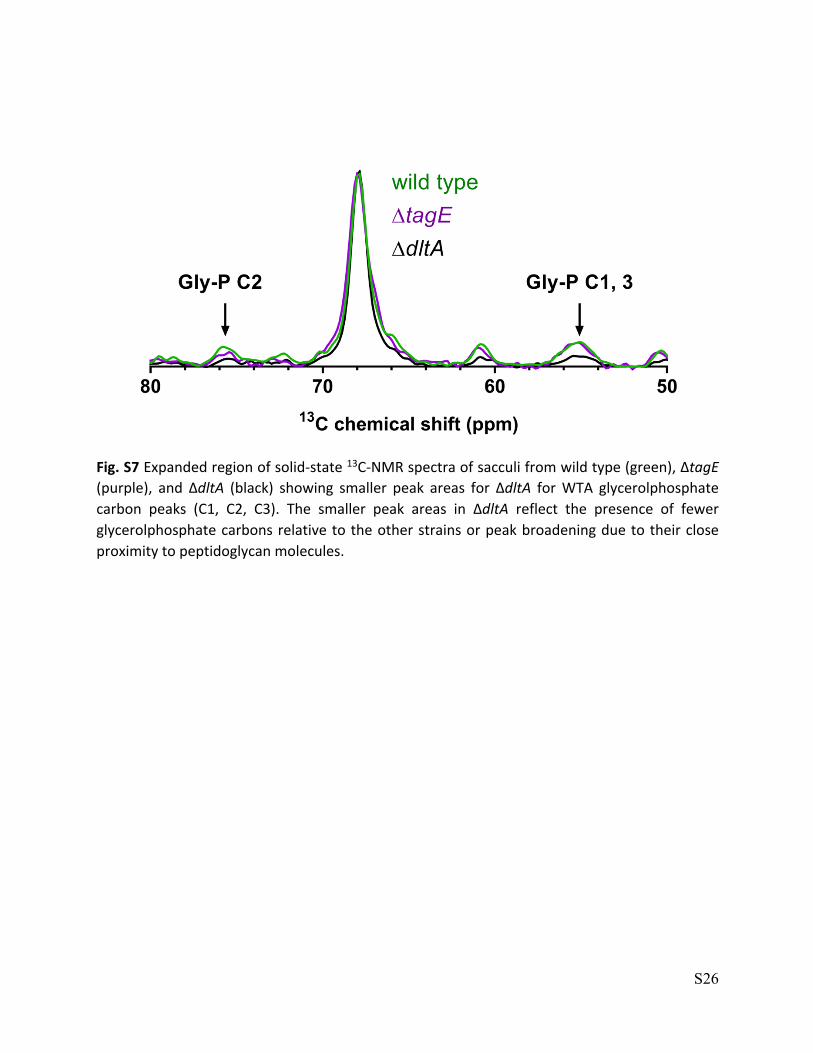
Fig. S7 Expanded region of solid-state 13C-NMR spectra of sacculi from wild type (green), ΔtagE
(purple), and ΔdltA (black) showing smaller peak areas for ΔdltA for WTA glycerolphosphate
carbon peaks (C1, C2, C3). The smaller peak areas in ΔdltA reflect the presence of fewer
glycerolphosphate carbons relative to the other strains or peak broadening due to their close
proximity to peptidoglycan molecules.
S27
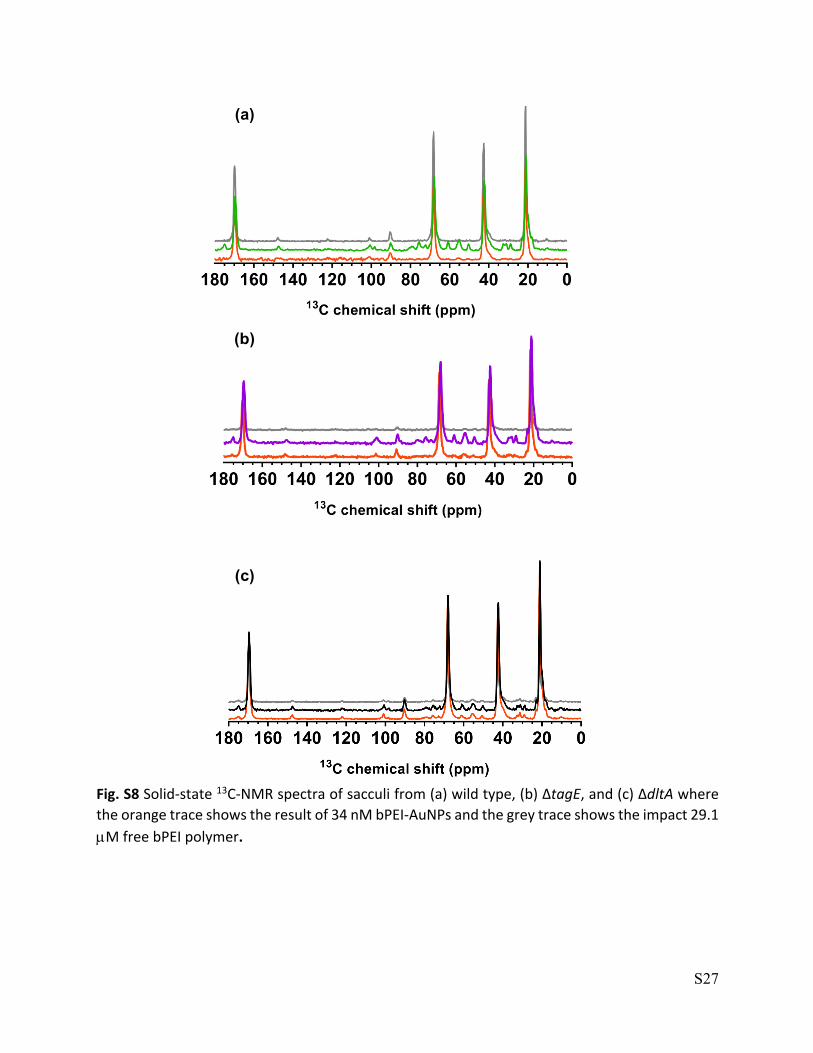
Fig. S8 Solid-state 13C-NMR spectra of sacculi from (a) wild type, (b) ΔtagE, and (c) ΔdltA where
the orange trace shows the result of 34 nM bPEI-AuNPs and the grey trace shows the impact 29.1
µM free bPEI polymer.
(a)
(b)
(c)
S28
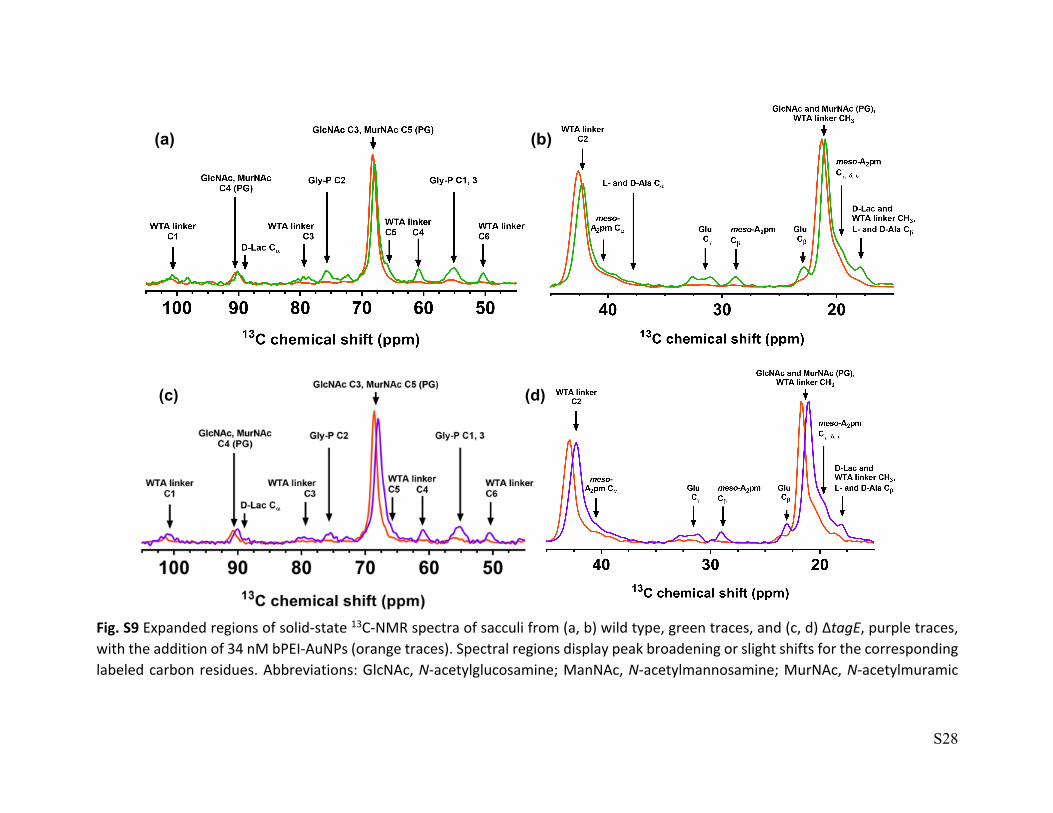
Fig. S9 Expanded regions of solid-state 13C-NMR spectra of sacculi from (a, b) wild type, green traces, and (c, d) ΔtagE, purple traces, with the addition of 34 nM bPEI-AuNPs (orange traces). Spectral regions display peak broadening or slight shifts for the corresponding labeled carbon residues. Abbreviations: GlcNAc, N-acetylglucosamine; ManNAc, N-acetylmannosamine; MurNAc, N-acetylmuramic
(a) (b)
(c) (d)
S29
acid; D-Ala, D-alanine; L-Ala, L-alanyl; meso-A2pm, meso-diaminopimelyl; Glc, glucose; D-γ-Glu, D-γ-glutamyl; D-Lac, D-lactyl. WTA linker unit is composed of GlcNAc and ManNAc amino sugars.
S30
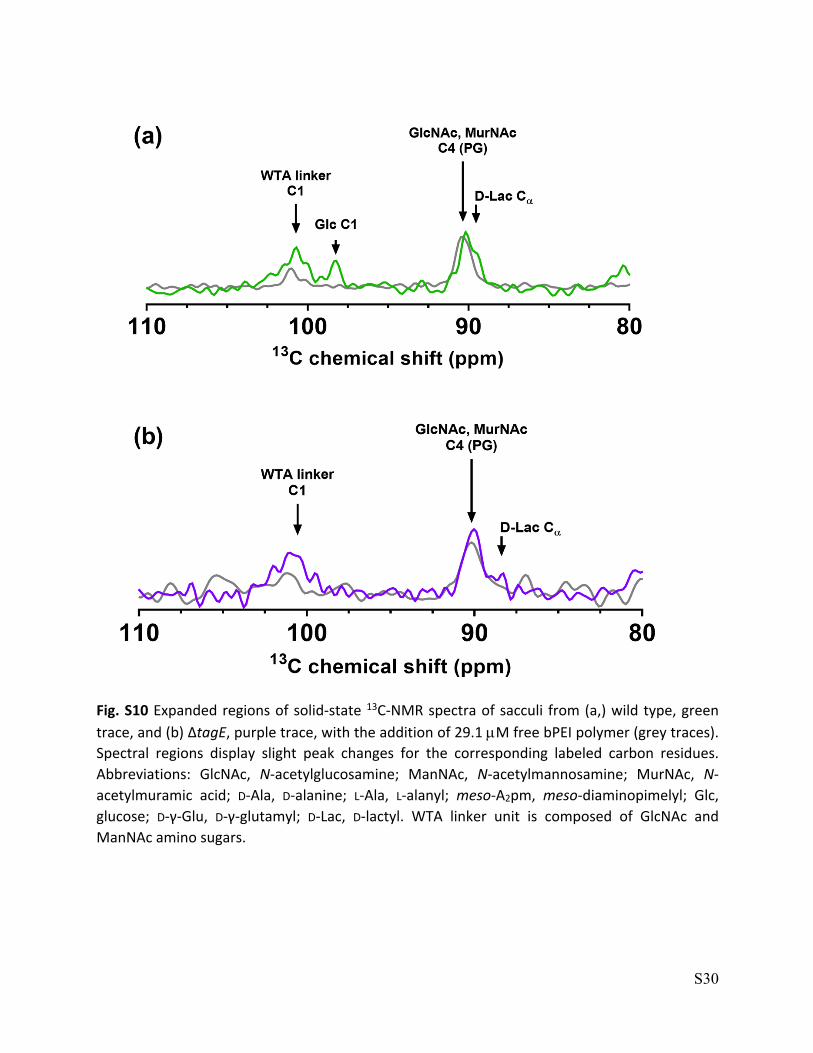
Fig. S10 Expanded regions of solid-state 13C-NMR spectra of sacculi from (a,) wild type, green trace, and (b) ΔtagE, purple trace, with the addition of 29.1 µM free bPEI polymer (grey traces). Spectral regions display slight peak changes for the corresponding labeled carbon residues. Abbreviations: GlcNAc, N-acetylglucosamine; ManNAc, N-acetylmannosamine; MurNAc, N-acetylmuramic acid; D-Ala, D-alanine; L-Ala, L-alanyl; meso-A2pm, meso-diaminopimelyl; Glc, glucose; D-γ-Glu, D-γ-glutamyl; D-Lac, D-lactyl. WTA linker unit is composed of GlcNAc and ManNAc amino sugars.
S31
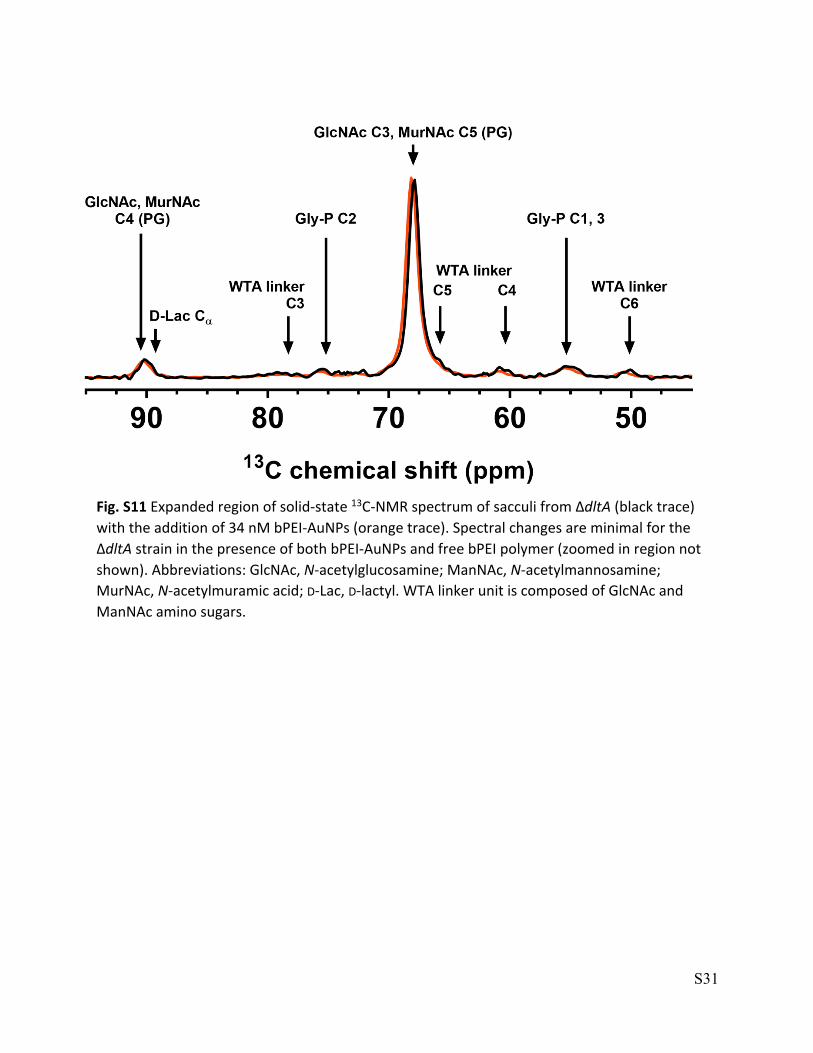
Fig. S11 Expanded region of solid-state 13C-NMR spectrum of sacculi from ΔdltA (black trace) with the addition of 34 nM bPEI-AuNPs (orange trace). Spectral changes are minimal for the ΔdltA strain in the presence of both bPEI-AuNPs and free bPEI polymer (zoomed in region not shown). Abbreviations: GlcNAc, N-acetylglucosamine; ManNAc, N-acetylmannosamine; MurNAc, N-acetylmuramic acid; D-Lac, D-lactyl. WTA linker unit is composed of GlcNAc and ManNAc amino sugars.
S32
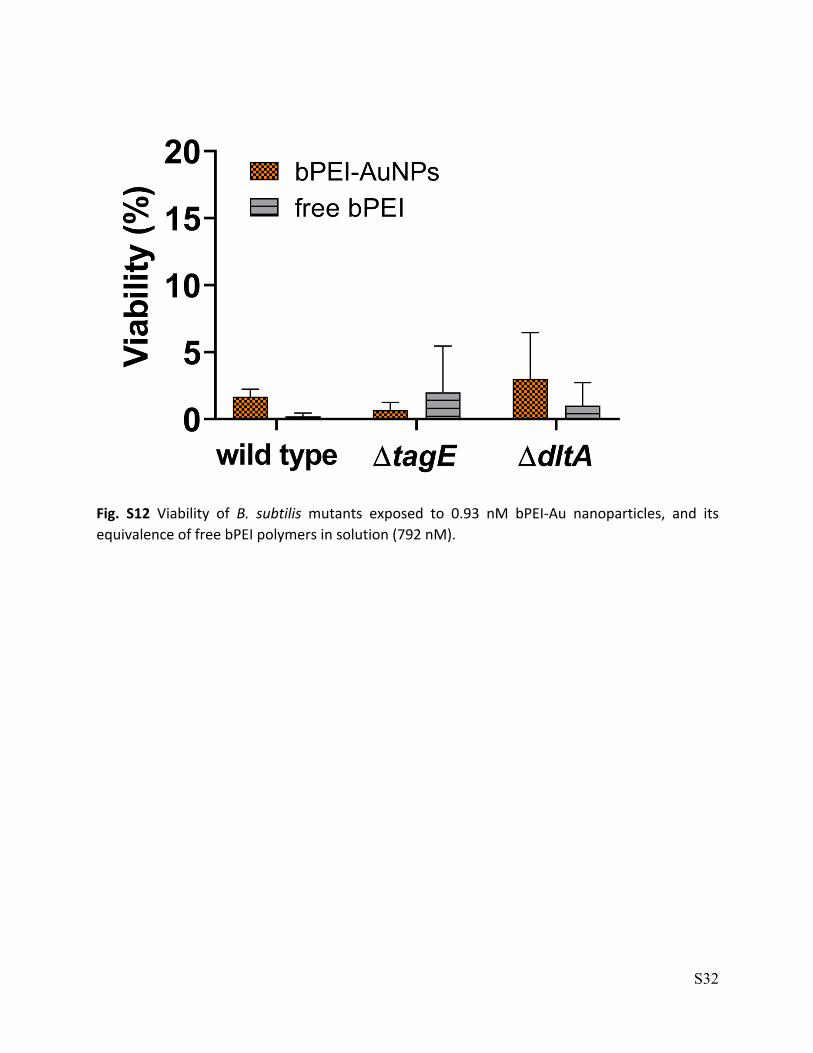
Fig. S12 Viability of B. subtilis mutants exposed to 0.93 nM bPEI-Au nanoparticles, and its equivalence of free bPEI polymers in solution (792 nM).
S33
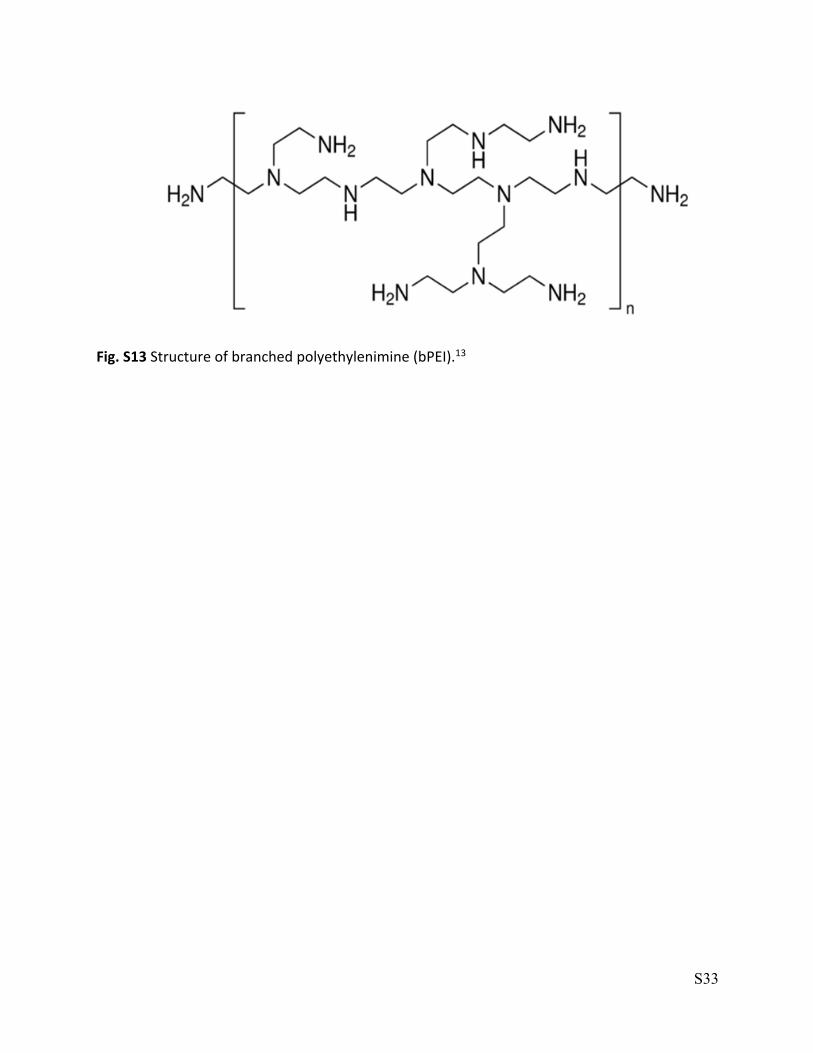
Fig. S13 Structure of branched polyethylenimine (bPEI).13
S34
References
1 N. K. Bui, A. Eberhardt, D. Vollmer, T. Kern, C. Bougault, A. Tomasz, J. P. Simorre and W. Vollmer, Anal. Biochem., 2012, 421, 657–666.
2 T. A. Qiu, M. D. Torelli, A. M. Vartanian, N. B. Rackstraw, J. T. Buchman, L. M. Jacob, C. J. Murphy, R. J. Hamers and C. L. Haynes, Anal. Chem., 2017, 89, 1823–1830.
3 J. E. Noble, A. E. Knight, A. J. Reason, A. Di Matola and M. J. A. Bailey, Mol. Biotechnol., 2007, 37, 99–111.
4 T. A. Qiu, T. H. T. Nguyen, N. V Hudson-Smith, P. L. Clement, D.-C. Forester, H. Frew, M. N. Hang, C. J. Murphy, R. J. Hamers, Z. V. Feng and C. L. Haynes, Anal. Chem., 2017, 89, 2057–2064.
5 A. Severin and A. Tomasz, J. Bacteriol., 1996, 178, 168–174. 6 S. E. Girardin, I. G. Boneca, L. a M. Carneiro, A. Antignac, M. Jéhanno, J. Viala, K. Tedin,
M.-K. Taha, A. Labigne, U. Zähringer, A. J. Coyle, P. S. DiStefano, J. Bertin, P. J. Sansonetti and D. J. Philpott, Science, 2003, 300, 1584–1587.
7 D. C. C. Birdsell, R. J. J. Doyle and M. Morgenstern, J. Bacteriol., 1975, 121, 726–734. 8 V. R. F. Matias and T. J. Beveridge, Mol. Microbiol., 2005, 56, 240–251. 9 K. Hayashi, Anal. Biochem., 1975, 67, 503–506. 10 T. Kern, M. Giffard, S. Hediger, A. Amoroso, C. Giustini, N. K. Bui, B. Joris, C. Bougault, W.
Vollmer and J.-P. Simorre, J. Am. Chem. Soc., 2010, 132, 10911–10919. 11 M. Kovács, A. Halfmann, I. Fedtke, M. Heintz, A. Peschel, W. Vollmer, R. Hakenbeck and
R. Brückner, J. Bacteriol., 2006, 188, 5797–5805. 12 T. Kern, Université Joseph- Fourier - Grenoble I, 2009. 13 Millipore Sigma, Polyethylenimine, branched,
https://www.sigmaaldrich.com/catalog/product/aldrich/408727?lang=en®ion=US, (accessed 15 January 2018).