Embed Size (px)
Citation preview
SCA2004-55 1/6
VALIDATING LABORATORY MEASURED ARCHIE SATURATION EXPONENTS USING NON-RESISTIVITY
BASED METHODS
D. Boyd and K. Al Nayadi, ZADCO A. Al Hendi, O. Farisi and M. I. Al-Marzouqi, ADMA-OPCO
O.B. Wilson, ResLab, and G. Sinclair, El ResLab M. Fleury, IFP
This paper was prepared for presentation at the International Symposium of the
Society of Core Analysts held in Abu Dhabi, UAE, 5-9 October 2004 ABSTRACT Archie’s second law has considerable impact on calculated water saturation, especially in the low to intermediate water saturation range. Despite this fact, Resistivity Index (RI) measurements for our limestone reservoirs were sparse and performed at non-reservoir representative conditions. Our lack of knowledge of the proper saturation exponent to apply forced us to use the industry standard value of two. To rectify the situation, reservoir condition RI experiments were carried out using different techniques on separate reservoir units. The first experiment employed the traditional porous plate with continuous scanning, live crude and hot toluene cleaned core plugs. The second experiment used fresh state core, dead crude oil, and the Fast Resistivity Index Measurement (FRIM) technique. The third technique employed “as received” single point RI measurements on plugs drilled from an oil base core. All three methods were performed at reservoir temperature and simulated overburden pressure. To give us confidence in the “correctness” of the saturation exponents measured, we compared water saturation obtained with non-resistivity based methods to water saturation calculated with our new Archie parameters. Introduction Water saturations calculated from open hole resistivity measurements is a primary input to oil-in-place calculations for Abu Dhabi reservoirs. Additionally the water saturation profiles in cored wells are compared to Hg capillary pressure derived water saturations to validate rock typing approaches in our 3D geological models. The assumption is, the resistivity derived water saturations are correct. Whether this is true or not, partially depends on the accuracy of the Archie cementation and saturation exponents. Cementation exponent measurements are inexpensive, take minimal time, and the laboratory techniques well established. Conversely, saturation exponent measurements are very expensive, time consuming, and vulnerable to many factors. Porous plate desaturation is the traditional technique for saturation exponent measurement. It normally requires several months to complete. To shorten the time involved, the core analysis industry has developed alternative techniques such as
SCA2004-55 2/6
Continuous Injection (CI)[1], centrifuge[2], Fast Resistivity Index Measurement (FRIM)[3], steady state injection[4], evaporation[5], and “as received” (native state) single point[6]. In the technical literature these experiments are conducted under a variety of conditions:
• Native or Restored State Core • Air - Brine, Oil – Brine • Lab Oil or Reservoir Crude • Dead Crude or Live Crude • Ambient or Elevated Temperature • Ambient or Overburden Condition • Uniform or Non-uniform Saturation Distribution • Reservoir versus Minimal Pore Pressure
Ideally the technique selected is the one with the least cost which delivers the correct answer. Reservoir condition live-oil displacing brine porous plate is the accepted standard other techniques are compared to, since it mimics closely the conditions under which the hydrocarbon was originally emplaced. A major issue is whether to use “native state” or “restored state” plugs. “Native state” assumes the reservoir wettability of the core can be retained during coring, at surface through proper preservation techniques, and after soft cleaning using mild solvents. “Restored state” attempts to return the sample to a water wet condition assumed to exist before oil accumulated in the reservoir by using aggressive solvents. The sample is then returned to the reservoir wetting state by saturating and ageing with formation brine and then reservoir crude. To compare techniques and the effect of conditions, ideally tests are run on sister samples or even the same sample twice. In practice, this evaluation process or pre-study is not normally performed due to the expense and time involved. Even when full reservoir condition porous plate tests are carried out, there is a lingering doubt whether a “reservoir correct” saturation exponent was obtained. Recognizing our sparse saturation exponent data sets (4 and 10 values respectively for two reservoirs) conducted at non-reservoir representative conditions (air-brine @ ambient) were a major uncertainty in our open hole log calculated water saturations, a program of data gathering was initiated two years ago. RI measurement techniques were: (1) traditional porous plate with live crude, (2) FRIM using dead crude, and (3) “as received” plugs from an oil base core. All measurements took place under simulated overburden stress and at reservoir temperature. To verify the “reservoir correctness” of the answers delivered, we compared open hole log saturations calculated with the new Archie parameters saturation measurements to saturations obtained independent of resistivity measurements. Reservoir Number One This reservoir is a clean limestone (packstone/grainstone) with high porosity and permeability. Pore systems are intergranular between the grains, with small vugs, and a significant microporosity component within the grains. Plugs were drilled from a core
SCA2004-55 3/6
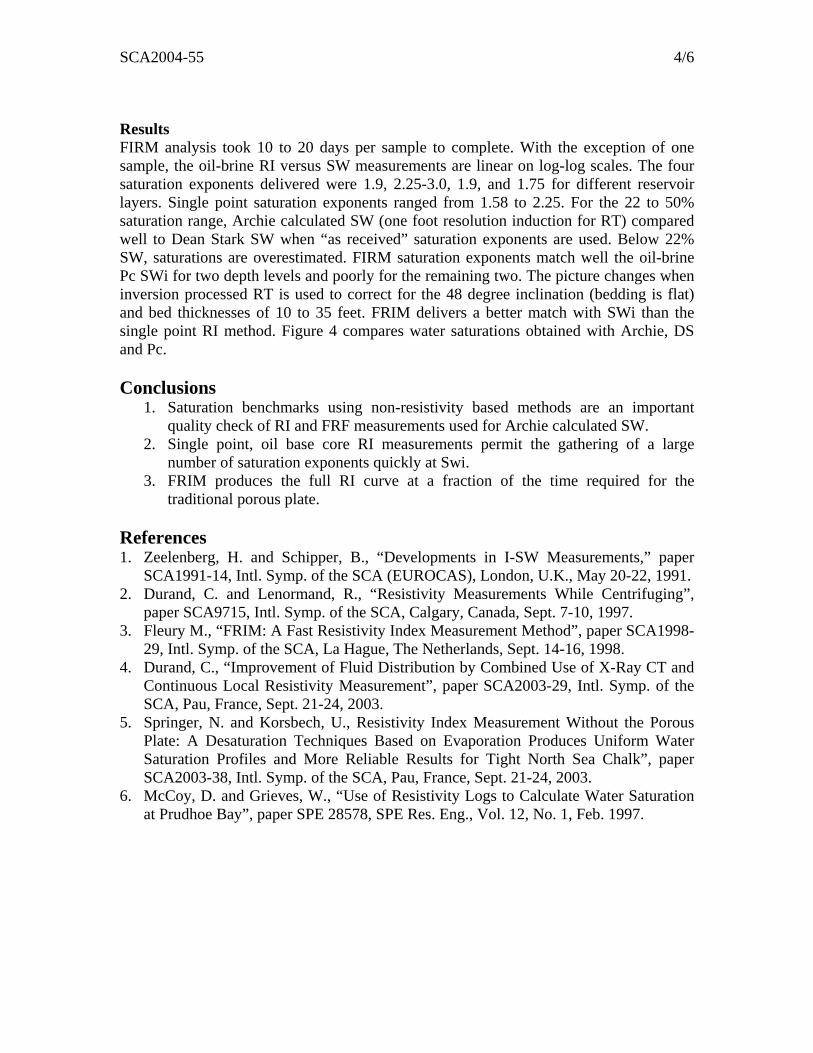
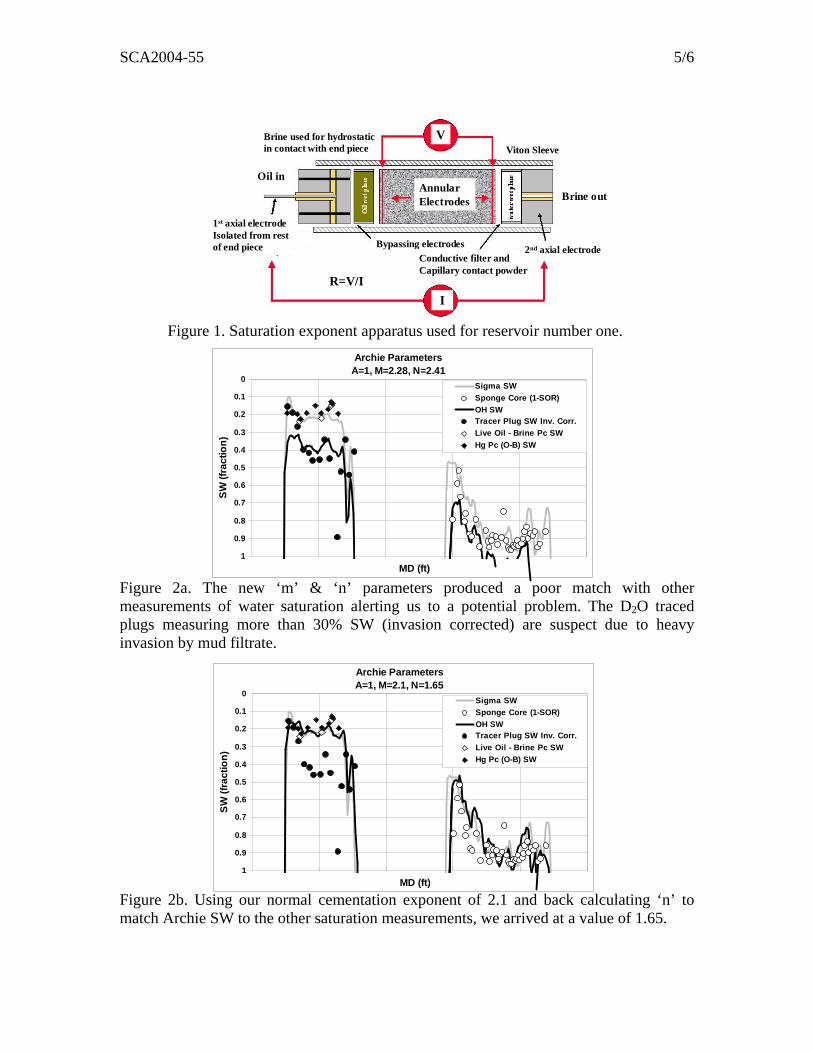
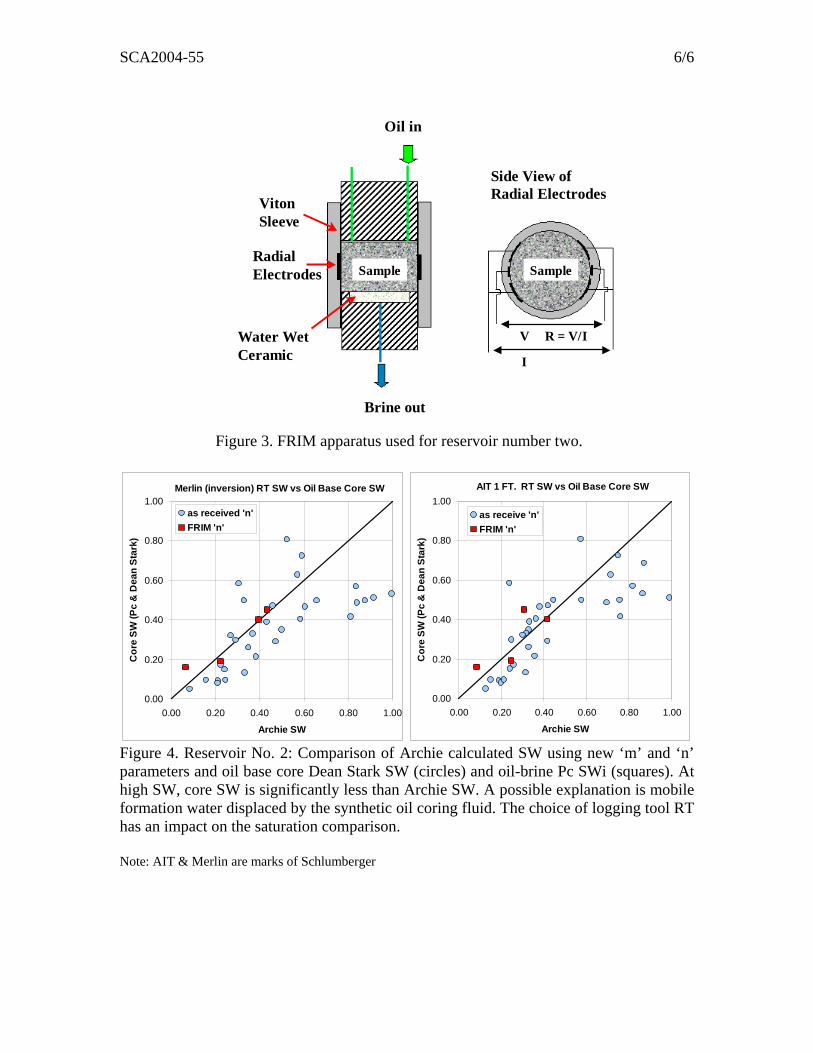
obtained with a bland water base mud and following exposure to the atmosphere for six months. Hot toluene and methanol Soxhlet cleaning were expected to return the rock to a water wet condition. After cleaning, the wettability of the three samples was not checked. The full reservoir condition (live crude), porous plate, restored state, oil displacing brine followed by brine displacing oil experiment (3 samples concurrently) took fifteen months to complete. Gamma scanning delivered the saturation at regular intervals and allowed us to check for uniform saturation. The electrode configuration is displayed in Figure 1. Multiple methods of saturation were used for comparison to the resistivity calculated one: (1) Coring with a deuterium traced mud system followed by Dean Stark analysis, (2) Thermal decay log interpretation with rock, oil and formation water capture cross section determined through elemental analysis, (3) Oil-brine capillary pressure, and (4) Hg-Air capillary pressure converted to an oil-brine system. Results Our three plugs delivered linear oil-brine resistivity index saturation exponents from 2.39 to 2.42. The brine-oil displacement saturation exponents are nearly identical. The composite (8 plugs) cementation exponent measured at overburden and temperature was 2.28. Archie water saturations calculated using the new ‘m’ and ‘n’ parameters were significantly higher than those delivered by the other methods (Figure 2a). Back calculating the saturation exponent using the other saturation measurements as the target, delivered a value of 1.65 using our average ‘m’ of 2.1 obtained in previous studies (Figure 2b), and 1.45 with our new ‘m’ of 2.28. Alerting the laboratory to the water saturation discrepancies prompted a review of the electrical measurements. Quality checks by the lab uncovered calibration and calculation errors resulting in elevated cementation and saturation exponents. Revised cementation and saturation exponents are 2.05-2.13 and 1.71-1.83 respectively. Reservoir Number Two This reservoir is a clean limestone with high porosity and low to moderate permeability. Pore systems are residual intergranular with small vugs and a significant microporosity component within the grains. Plugs were drilled from a core obtained with a synthetic oil mud designed to contain no water and advertised by the manufacturer to not alter wettability. Core plugs drilled with mineral oil at the rig were preserved with wax. Upon reception at the lab two days later, thirty-six plugs resistivity were measured (two electrode configuration) at reservoir temperature and overburden pressure prior to Dean Stark (DS) for “as received” RI. Whole core preserved in wax were sent to a second, out-of-country laboratory for FRIM analysis. After CT scanning the whole core, four plugs were drilled and cleaned with mild solvents (ethyl alcohol followed by isopropyl alcohol). Assumption is the oil base mud and soft cleaning did not alter wettability, though we have no proof of this. After saturating with simulated formation brine, each sample was desaturated with dead crude oil at reservoir temperature and overburden pressure using the FRIM technique (Figure 3).
SCA2004-55 4/6
Results FIRM analysis took 10 to 20 days per sample to complete. With the exception of one sample, the oil-brine RI versus SW measurements are linear on log-log scales. The four saturation exponents delivered were 1.9, 2.25-3.0, 1.9, and 1.75 for different reservoir layers. Single point saturation exponents ranged from 1.58 to 2.25. For the 22 to 50% saturation range, Archie calculated SW (one foot resolution induction for RT) compared well to Dean Stark SW when “as received” saturation exponents are used. Below 22% SW, saturations are overestimated. FIRM saturation exponents match well the oil-brine Pc SWi for two depth levels and poorly for the remaining two. The picture changes when inversion processed RT is used to correct for the 48 degree inclination (bedding is flat) and bed thicknesses of 10 to 35 feet. FRIM delivers a better match with SWi than the single point RI method. Figure 4 compares water saturations obtained with Archie, DS and Pc. Conclusions
1. Saturation benchmarks using non-resistivity based methods are an important quality check of RI and FRF measurements used for Archie calculated SW.
2. Single point, oil base core RI measurements permit the gathering of a large number of saturation exponents quickly at Swi.
3. FRIM produces the full RI curve at a fraction of the time required for the traditional porous plate.
References 1. Zeelenberg, H. and Schipper, B., “Developments in I-SW Measurements,” paper
SCA1991-14, Intl. Symp. of the SCA (EUROCAS), London, U.K., May 20-22, 1991. 2. Durand, C. and Lenormand, R., “Resistivity Measurements While Centrifuging”,
paper SCA9715, Intl. Symp. of the SCA, Calgary, Canada, Sept. 7-10, 1997. 3. Fleury M., “FRIM: A Fast Resistivity Index Measurement Method”, paper SCA1998-
29, Intl. Symp. of the SCA, La Hague, The Netherlands, Sept. 14-16, 1998. 4. Durand, C., “Improvement of Fluid Distribution by Combined Use of X-Ray CT and
Continuous Local Resistivity Measurement”, paper SCA2003-29, Intl. Symp. of the SCA, Pau, France, Sept. 21-24, 2003.
5. Springer, N. and Korsbech, U., Resistivity Index Measurement Without the Porous Plate: A Desaturation Techniques Based on Evaporation Produces Uniform Water Saturation Profiles and More Reliable Results for Tight North Sea Chalk”, paper SCA2003-38, Intl. Symp. of the SCA, Pau, France, Sept. 21-24, 2003.
6. McCoy, D. and Grieves, W., “Use of Resistivity Logs to Calculate Water Saturation at Prudhoe Bay”, paper SPE 28578, SPE Res. Eng., Vol. 12, No. 1, Feb. 1997.
SCA2004-55 5/6
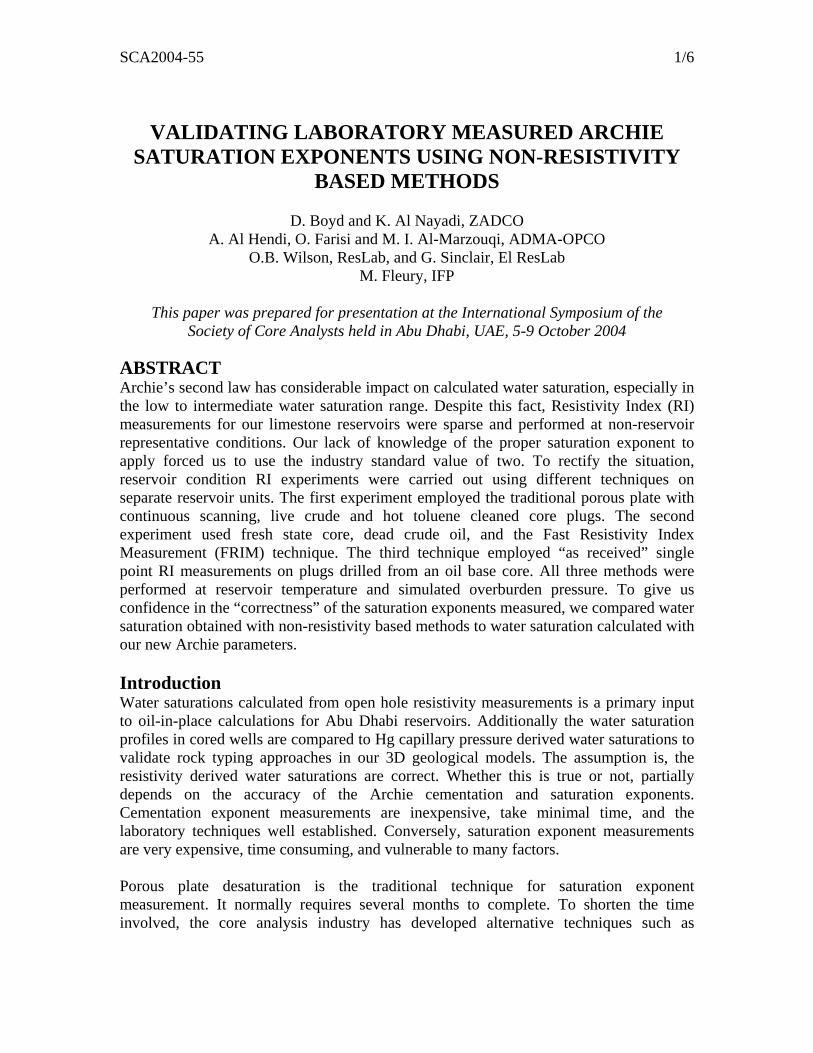
Figure 1. Saturation exponent apparatus used for reservoir number one.
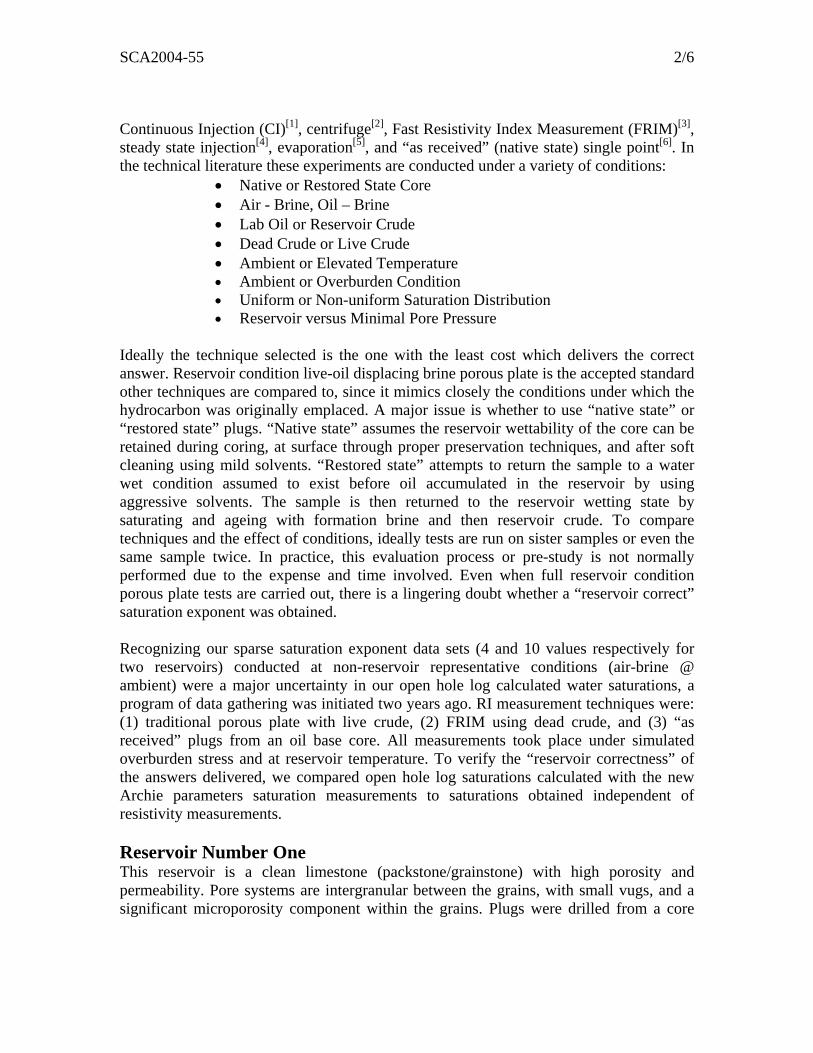
Figure 2a. The new ‘m’ & ‘n’ parameters produced a poor match with other measurements of water saturation alerting us to a potential problem. The D2O traced plugs measuring more than 30% SW (invasion corrected) are suspect due to heavy invasion by mud filtrate. Figure 2b. Using our normal cementation exponent of 2.1 and back calculating ‘n’ to match Archie SW to the other saturation measurements, we arrived at a value of 1.65.
AnnularElectrodes Brine out
Oil in
V
I R=V/I
Viton Sleeve
Bypassing electrodesConductive filter andCapillary contact powder
2nd axial electrode
1st axial electrodeIsolated from restof end piece
Brine used for hydrostaticin contact with end piece
Archie ParametersA=1, M=2.1, N=1.65
0
0.1
0.2
0.3
0.4
0.5
0.6
0.7
0.8
0.9
1MD (ft)
SW (f
ract
ion)
Sigma SWSponge Core (1-SOR)OH SWTracer Plug SW Inv. Corr.Live Oil - Brine Pc SWHg Pc (O-B) SW
Archie ParametersA=1, M=2.28, N=2.41
0
0.1
0.2
0.3
0.4
0.5
0.6
0.7
0.8
0.9
1MD (ft)
SW (f
ract
ion)
Sigma SWSponge Core (1-SOR)OH SWTracer Plug SW Inv. Corr.Live Oil - Brine Pc SWHg Pc (O-B) SW
SCA2004-55 6/6
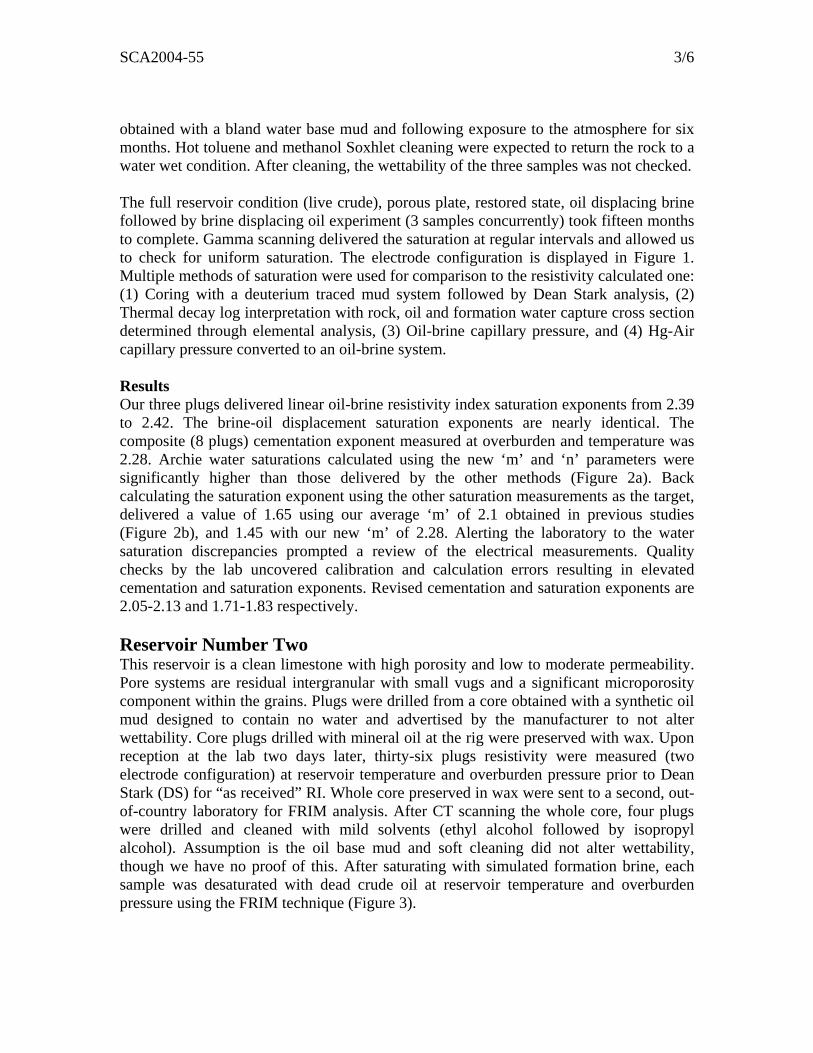
Figure 3. FRIM apparatus used for reservoir number two.
Figure 4. Reservoir No. 2: Comparison of Archie calculated SW using new ‘m’ and ‘n’ parameters and oil base core Dean Stark SW (circles) and oil-brine Pc SWi (squares). At high SW, core SW is significantly less than Archie SW. A possible explanation is mobile formation water displaced by the synthetic oil coring fluid. The choice of logging tool RT has an impact on the saturation comparison. Note: AIT & Merlin are marks of Schlumberger
Merlin (inversion) RT SW vs Oil Base Core SW
0.00
0.20
0.40
0.60
0.80
1.00
0.00 0.20 0.40 0.60 0.80 1.00
Archie SW
Cor
e SW
(Pc
& D
ean
Star
k)
as received 'n'FRIM 'n'
AIT 1 FT. RT SW vs Oil Base Core SW
0.00
0.20
0.40
0.60
0.80
1.00
0.00 0.20 0.40 0.60 0.80 1.00
Archie SW
Cor
e SW
(Pc
& D
ean
Star
k)
as receive 'n'FRIM 'n'
Side View ofRadial Electrodes
Oil in
V
I
R = V/I
Brine out
Water WetCeramic
VitonSleeve
RadialElectrodes Sample Sample