Embed Size (px)
Citation preview

1
SCALE: A tool for Simple ConnectivityAssessment in Lossy Environments
Alberto Cerpa, Naim Busek and Deborah EstrinCENS Technical Report # 21
Center for Embedded Networked Sensing, University of California, Los Angeles (UCLA)Los Angeles, CA 90095, USA
September 5, 2003
Abstract— Wireless sensor networks will allow fine-grained monitoring in a wide range of environment (indoorand outdoor). Many of these environments, present veryharsh conditions for wireless communication using low-power radios, including multipath/fading effects, reflectionsfrom obstacles, and attenuation from foliage. In this pa-per, we introduce SCALE, a network wireless measurementtool that uses packet delivery as the basic application-levelmetric. SCALE facilitates the gathering of packet deliverystatistics using the same hardware platform and in the sameenvironment targeted for deployment. Using up to 55 nodes,we were able to measure and study the connectivity condi-tions of two hardware platforms, Mica 1 and 2 motes, inthree different environments: an outdoor habitat reserve,an urban outdoor environment in a university campus, andan office building, under systematically varied conditions.Among other things, we found that there is no clear cor-relation between packet delivery and distance in an area ofmore than 50% of the communication range, temporal vari-ations of packet delivery are correlated with mean receptionrate of each link, and the percentage of asymmetric linksvaries from 5% to 30%. Data collected using SCALE haveinteresting implications in the design, evaluation, and pa-rameter tuning of sensor network protocols and algorithms.
I. INTRODUCTION
The advent of wireless sensor networks will allow de-tailed spatial and temporal environmental monitoring ina wide range of environments, from urban to wilderness;indoor and outdoor. Wireless radio communication is anessential component of these systems and enables sen-sor nodes to perform significant local coordination, dis-tributed signal processing, and network self-configurationto achieve scalable, robust and long-lived networks [1],[10], [11]. The quality of the wireless channel dependson multiple factors, such as the environment, the ra-dio frequency, the modulation scheme, and even the RF
Correspondence author: [email protected]. This paper is based onwork funded by the National Science Foundation
transceiver hardware in use.
These networks will be deployed in harsh environ-ments from the communication perspective, with signif-icant multi-path effects. In addition, the low power radiostypically used in sensor networks do not have sufficientfrequency diversity to be resilient to multi-path commu-nication. Under these conditions, wireless communica-tion is known to be unpredictable and has been shown tovary drastically with small spatial changes and on differ-ent time scales. Even though most sensor network algo-rithms are designed to be adaptive to the variations in thecommunication channel [16], [4], there are several param-eters that need to be adjusted to the operating conditionsin order to improve performance. Furthermore, the realcommunication channels are very difficult to model forthe wide range of target environments and the differenttype of radios, frequencies, and modulation schemes inuse [6], [27], [12]. Thus, it is difficult to extensively testthe algorithms under development in simulations under re-alistic conditions. Given the variability of the communi-cation channel, and the difficulty to model it accurately, itis essential to get quantitative data that may allow us tobetter understand the channel characteristics in the targetdeployment area.
In this paper, we present SCALE, a measurement tool tostudy wireless communication channels with low powerradios in new environments. It facilitates the characteriza-tion of the most basic communication metric from the ap-plication point of view: packet delivery. The tool enablesthe collection of packet delivery statistics using the samespecific hardware platform and in the same environmentintended for deployment. The data gathered by SCALEmay allow protocol developers and engineers to better es-timate the appropriate density, system parameter tuningconstants, and expected performance of protocols and al-gorithms (data capacity, convergence time, latency). TableI shows some examples of how the connectivity statistics

2
TABLE IEXAMPLES OF THE USEFULNESS OF CONNECTIVITY STATISTICS IN PROTOCOL DEVELOPMENT AND PARAMETER TUNING
Design Parameter Data Collected Utility
Physical densityDelivery rate vs. distance Expected mean topological density
Delivery rate vs.environment type
and distance
Expected standard deviation in topological density
Algorithmicselection
Expected performance of in-network processing, e.g.opportunistic (geographical) data aggregation
Protocol selection
Expected performance of spatial correlation, e.g. geograpicaland topological routing
Link asymmetry vs.distance
Expected performance of routing mechanisms that assumebidirectional links
Protocol parameters(time constants)
Delivery rate vs.time
Find reasonable routing and application soft state refresh time;find neighbor discovery probe period as a function of the stddev.
Link asymmetry vs. delivery rate Find neighbor discovery period as a function of mean and stddev.
Packet size selection Delivery rate vs. packet size Find optimal packet size to maximize efficiencya
a Metric defined in section V-D.
collected from a specific target environment can be usefulin this regard.
SCALE is fully configurable. Several parameters areconfigurable, such as, the packet probe size, the inter-packet period time, the transmission power gain, amongothers. This flexibility permits performing experimentsunder multiple different varied conditions. More impor-tantly, it allows to repeat the measurements while con-straining all parameters other than the one being varied,allowing us to systematically probe the effects of that par-ticular parameter. The tool can be run transparently in acentralized way with all the software running in a centralPC and connected to the nodes via serial cables, or in afully distributed way with the software running in differ-ent distributed nodes. SCALE also provides a visualiza-tion screen to help viewing the connectivity data in real-time and after each experiment completes. Using up to 55nodes, we were able to measure and study the connectiv-ity conditions of two hardware platforms, Mica 1 and 2motes [14], [7], in three different environments: an out-door habitat reserve, an urban outdoor environment on auniversity campus, and an office building.
In our experiments, we distributed the nodes in an ad-hoc manner in each of the different environments. Onceall the nodes were deployed, the system made each nodea transmitter, going through all the nodes in a round-robinfashion, one node at a time. When a node was transmittingpacket probes, the rest of nodes in the experiment werein receiver-only mode collecting packet delivery statisticsfrom the sender. The results were centrally logged. Inall our experiments, we studied the effect of the environ-ment under different conditions in the absence of interfer-
ing transmissions.
The results of our measurements using SCALE revealedsome interesting findings. By analyzing data from a richset of links with different distances, directions, antennaeelevations from the ground, with or without line of sight—conditions that we expect to find in sensor network de-ployments [3]—, we found that there is no clear corre-lation between packet delivery and distance in an area ofmore than 50% of the total communication range. In addi-tion, we found that temporal variations of packet deliveryare not correlated with distance from the transmitter ortransmission power level, but to the mean reception rateof each particular link. We also found that the percentageof link asymmetries varies from 5% up to 30% in somecases, and there was no obvious correlation between linkasymmetries and distance and/or transmission power lev-els. By using this tool, we provide significant quantitativeevidence that supports the commonly held belief that linkasymmetries are due to hardware calibration differences.
Before we proceed, we would like to highlight the pri-mary contributions of our paper. These are:
• The development of a measurement and visualizationtool based on an application level metric (e.g. packetdelivery), which facilitates qualitative and quantita-tive characterizations of the wireless channel in a par-ticular target environment and using the same hard-ware platform intended for the actual deployment.
• The report of an initial set of qualitative and quan-titative results using SCALE that investigates previ-ous measurements, supplies data to support previoushypotheses in the literature, and provides new datafrom experiments performed in three different type
3
of environments, and with two different type of ra-dios, under systematically varied conditions.
The rest of the paper is structured as follows. In the nextsection we review the related work in the area. Section IIIprovides a complete description of the measurement tool,including the hardware and software components. Themethodology used for the data collection experiments isdiscussed in Section IV. In Section V, we present someinitial experimental results using the measurement tool.Finally, we conclude in Section VI.
II. RELATED WORK
There is currently a dearth of wireless communicationmeasurment data for low power devices. Most of the pre-vious related work has focused on experimental measure-ments with ad-hoc programs specialized to fit a particularplatform.
In Ganesan et al. [12] a testbed of 150 nodes (Mica1 motes) was used to measure the effects of link, MAC,and application layers in data communication. The ex-periments were carried out in a single outdoor environ-ment, with no obstacles in the vicinity and with all thenodes near the ground. This work provided some empiri-cal data to prove that radio connectivity was not isotropic(exhibit directionality) and also provided some measure-ments of number of asymmetric links as a function of dis-tance. This work also speculated that links asymmetriesmay be caused by small differences in the hardware (ra-dios) and slight differences in the nodes energy levels. Inour work we provide substantial evidence that the causeof link asymmetries is in fact due to differences in hard-ware calibration and provide a more in depth analysis ofthe different factors affecting wireless communications inmore than one environment and with more than one radio.
Woo et al. [29] examined packet loss between pair ofmotes and constructed packet loss models used to evaluatelink quality estimators. Building on that work, in a morerecent study by Woo et al. [30] and using up to 100 nodesin an open tennis court, they constructed packet loss mod-els based on the mean and standard deviation receptionrate values. Using these models in simulation and with anetwork of 50 nodes in a building lobby, they provide anilluminating evaluation of link quality estimators, neigh-borhood management policy, and routing strategies undervaried conditions. Our study is complementary to thiswork; while we do not conduct any algorithmic evalua-tions, we do study the characteristics of packet delivery inthe abscence of concurrent transmissions, and using morethan one radio in multiple environments.
A recent study by Zhao et al. [31] using up to 60 nodes(Mica 1 motes) showed some of the effects of link and
MAC layers in wireless communication. Using a sim-ple linear topology, with a single sender, the work studiedthe packet delivery performance in three different envi-ronments, power levels, and coding schemes. This studyprovided experimental data showing heavy variability ofpacket reception in almost one third of the communicationrange for some scenarios. Our work is complementary tothis. In our study, we gathered connectivity data usingmore than one sender and non-linear topologies, and ourresults show even further variability of packet delivery inmore than half of the communication range. Our workdoes not consider the impact of multiple coding schemes,but study how the packet delivery is affected by packetsize and using different hardware platforms.
Near ground effects in the 800-1000 MHz band is stud-ied by Sohrabi et al. [28]. This work uses a particularmodel for power loss, and finds the constants in the modelfor different type of environments. The study providedexperimental validation of the power drop off with higherexponents at smaller distances than the same channelswith higher antennae. Our work considers near groundeffects as one of the multiple effects affecting radio prop-agation. Our measurements also include data gatheredfrom the 400 MHz band and use an application level met-ric, mean packet loss, instead of path loss.
There has been several studies for the characterizationof cellular networks [19]. In our study, we use different(low-power) radios, and different coding schemes (lesscomplex due to resource constraints); thus, we cannot relycompletely on previous results from cellular networks.
Our previous work with ASCENT [4] motivated us tobuild this measurement tool to help us gain a quantitativeunderstanding of some of the radio channel features. InASCENT, we showed that due to the spatial and tempo-ral variability of the wireless channel, the use of adap-tive algorithms that constantly adapt to the local connec-tivity conditions was a sine qua non prerequisite to buildany real sensor network system. Nevertheless, when facedwith the challenge of defining some of the algorithm con-stants (e.g. heartbeat period), we were forced to use ad-hoc values and intuition for the parameter tuning. We be-lieve SCALE fills this gap. Our work has also been in-spired by the large number of measurement tools [20],[23] developed to understand protocol performance issuesin the Internet. These tools have had a significant rolein the development of Internet protocols like TCP [24],multicast routing protocols [8], [2], and many more. Thedata collected by these tools allowed Internet researchersto detect flaws in the design, adjust the parameter tuning,and improve the general performance of these protocols.Similarly, we hope SCALE could become a useful tool for
4
(a) Mica 1 mote (b) Portable Array (c) Mica 2 mote
Fig. 1. SCALE hardware. The portable array is composed of a laptop PC attached to a serial multiplexor. Several UTP cables run from themultiplexor to the deployment locations where a mote is attached at the end.
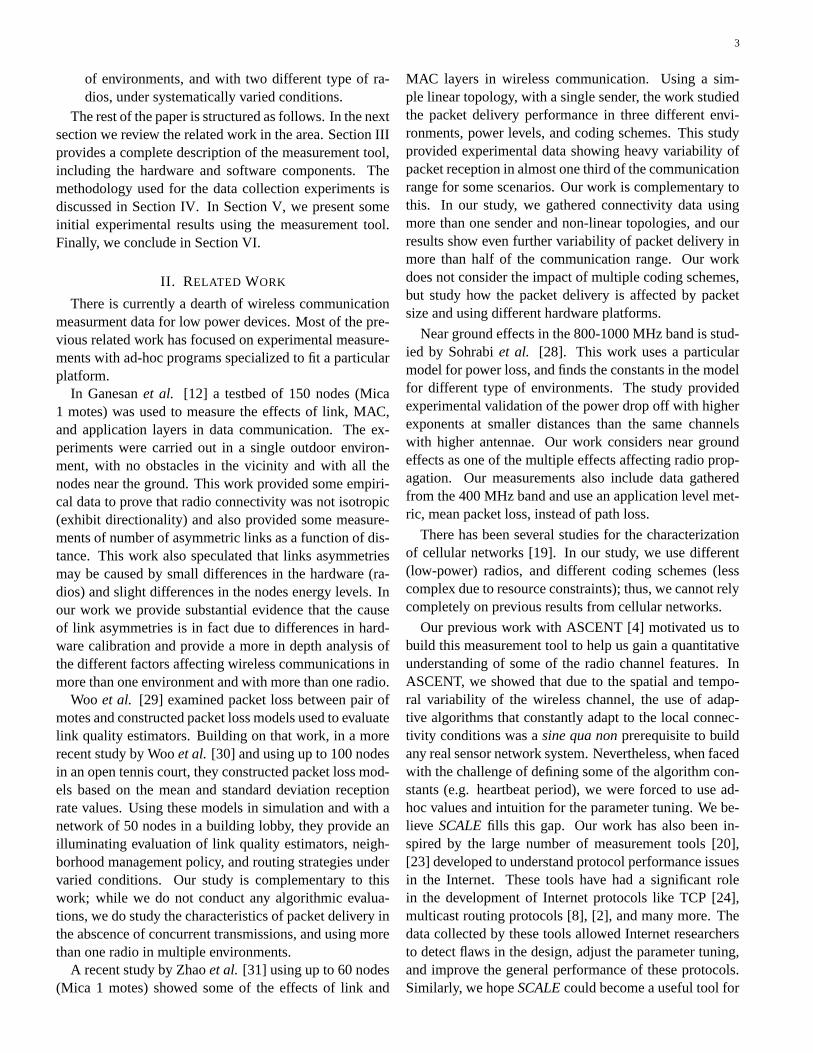
TABLE IINODES CHARACTERISTICS
Mica 1 Mica 2
CPU Processor Amtel 128 Amtel 128
Prog. Memory (KB) 128 128
Data Memory (KB) 4 4
Serial RS232 needs adapter needs adapter
Clock Speed (MHZ) 4 7.38
RF Manufacturer RFM [21] Chipcon [5]
RF Transciever TR1000 CC1000
Radio frequency (MHz) 916 433
Modulation ASK FSK
Throughput (kbps) 13.3 19.2
TX power [0dBm] (mW) < 1 < 1
Hardware Encoding none Manchester
Antenna Omni whip Omni whip
researchers working with sensor networks in often harshand lossy environments for wireless communication.
III. SYSTEM DESCRIPTION
A. Overview
The system is built using the EmStar programmingmodel [9]. It consists of a number of sensor nodes (motes)attached using long serial cables to one or more serial mul-tiplexors that are connected to a standard laptop PC. ThisPC centrally runs the different processes that perform thedata collection as if they were run by individual nodes.A visualization tool is integrated to help visualize in realtime the progress of the experiment and to analyze anddisplay the final results.
B. Hardware and Firmware
In our experiments we use two versions of nodes basedon Mica motes (Mica 1 and 2)[14], [7]. Test Figure 1(a)shows the Mica 1. Figures 1(a)(c) show the mote plat-forms. Table II shows the main features of the hardwareplatforms used.
The ceiling and portable arrays [9] used in the experi-ments are composed of one or more serial port multiplex-ors attached to a laptop PC. Figures 1(b) show an imageof the portable array with one serial multiplexor. The onlydifference between the arrays is that the ceiling array ispermanently deployed in the ceiling of our lab, and theportable array is a completely mobile system that can bedeployed anywhere. We use UTP Cat 5 cables of differentlengths (up to 30 meters) and attach on end of the cableto the multiplexor and the other end to a node. The nodesare wall powered in the ceiling array and battery poweredin the portable array. The portable/ceiling array is used asa logging/control channel through which we interface tothe software.
The Mica motes firmware comes with an event-drivenoperating system called TinyOS [15]. When using Mica1, it provides a DC-balanced single-error correction anddouble bit error detection (SECDED) scheme to encodeeach byte transmitted by the RF transceiver (RFM). Whenusing Mica 2, it relies on the hardware encoding. The sys-tem supports variable packet sizes, and uses a 16-bit CRCthat is computed over the entire packet for error detections(for both Mica 1 and 2). A simple driver (Transceiver)was used to run on the motes in TinyOS. It function isto send/receive packets to/from the radio and pass themfrom/to the PC using the host-mote protocol over the se-rial connection.

5
Fig. 2. SCALE software architecture. Multiple independent mod-ules that export devices for IPC run in their own address spaces, allcontrolled by emrun. A user can interact with each module by sim-ply using cat or echo Unix commands, or let the system proxy all theinformation to a central place. Connview, the visualization tool, al-lows checking the state of the experiments in real-time and performingpost-processing analysis.
C. Software
SCALE has been designed to make full use of the Em-Star programming model and software framework. Due tolack of space, we refer to [9] for further details on EmStar.Figure 2 shows a diagram of the software architecture.SCALE is completely modularized and all the moduleshave been written in C. Each node participating in the ex-periment runs a software stack, which consists of a seriesof modules interconnected in a certain way. Each moduleis represented by a process with its own address space.There are three modules for each node software stack:Conntest, in charge of sending and receiving probe pack-ets, doing the control coordination among nodes (whento start/stop sending packet probes); LinkStats, responsi-ble for maintaining the packet delivery statistics from allneighbors; and the low level channel driver, in charge ofperforming the communication with the radio. There aretwo channel drivers implemented: MoteNic, which imple-ments the host-mote protocol to communicate to the radioover the serial port, and Udpd, which uses the UDP net-work interface as a communication driver. The collectionof processes is managed by emrun, which starts each ofthe above modules in the correct dependency order basedon the configuration file we provide (e.g. Conntest de-pends on LinkStats, and should only start once LinkStatsis active). If a module terminates unexpectedly, emrunautomatically restarts it and the other modules can recon-nect to it without loosing state. When using the systemwith the ceiling and portable arrays, all the processes arerun in emulation mode in a central PC. Multiple copies ofemrun are started —one for each node in the system—,
each of which forks a copy of the software stack. SCALEalso provides a visualization tool, Connview, and its pur-pose is two-fold. First, it allows checking the status ofthe experiment in real time. Second, it permits the anal-ysis and display of the final experimental results. Amongsome of its features, it includes the on/off display of anynode or link, the coloring of links based on different per-centages of packet delivery, display of asymmetric links,screen capture and file saving in graphical formats (jpegand png), and many more.
We note that the SCALE could be used in a completelydistributed fashion. For example, nodes could be con-nected to handheld-type battery power devices, like Com-paq iPAQs [22] or Intel XScales [17], each of them beingable to run a copy of the software stack. The coordina-tion and data transfer for visualization could be done byan out-of-band channel, like an 802.11 network (in orderto avoid interference with the radio channel we are mea-suring). One of the advantages of using the EmStar en-vironment is that no software changes are required to runin a centralized or fully distributed way; the transition be-tween the two modes is completely transparent. The ad-vantage of the fully distributed mode is the eliminationof the serial cables and the multiplexor to connect to thecentral PC. The main disadvantage is the increased totalcost of the system and the limited battery lifetime of thehandheld-devices. In our study, we opted for the central-ized solution.
The basic data collection experiments work as follows.Each node transmits a certain number of packet probes ina round robin fashion (one transmitter at a time). Eachprobe packet contains the sender’s node id and a sequencenumber. The rest of the nodes record the packets receivedfrom each neighbor and keep updated connectivity statis-tics, using the sequence numbers to detect packet losses.There are multiple variables that can be configured foreach experiment. The number of round robin passes, thetotal number of packet probes to be sent (and the numberof probes in each round), the packet probe size, the inter-packet period time, and the transmission output power areall fully configurable. If a user wants to evaluate the per-formance of an algorithm (e.g. routing algorithm) underdifferent traffic workload and allowing multiple transmit-ters at a time, it simply deactivates the Conntest modulein the configuration file. The measured packet delivery re-sults will be the aggregate effect of the environment andthe traffic workload in use (which may include collisionsdepending of the MAC layer used).
SCALE is also script-ready, and it is easy to configurean entire set of experiments varying one or more parame-ters at a time, leaving the system running with no human

6
(a) Outdoor Habitat, Will Rogers StatePark
(b) Outdoor Urban, UCLA Boelter HallCourt Yard
(c) Indoor Office, UCLA CENS lab ceil-ing array
Fig. 3. Different environments used in our experiments using SCALE.
intervention. At the end of each experiment, all the data isautomatically stored in log files with date and time of theexperiment, the location, and the values of all the param-eters used.
IV. METHODOLOGY
In this section we discuss the methodology used for ourexperiments.
The most important aspect of wireless communicationfor us is packet delivery performance, which is a metricthat directly affects the performance perceived by the ap-plication. More precisely, our primary measure of perfor-mance is packet loss (the percentage of packets transmit-ted but not received), and its complement, reception rate.
The topology used for our experiments consisted of 16nodes (portable array) distributed in an ad-hoc manner indifferent environments. We also used up to 55 nodes forour indoor experiments distributed in the ceiling of our lab(ceiling array). When using the portable array, nodes wereplaced in a variety of different positions, such as near theground or elevated from the ground, with or without lineof sight (LOS) between them, and with different levels ofobstructions (furniture, walls, trees, etc.). The placementof the nodes also took into account the distance betweenthem, in order to create a rich set of links at distances vary-ing from 2 to 50 meters and in multiple different directionsfrom any particular sender. In most of our experiments,each node sends up to 200 packets per round, transmitting2 packets per second (unless otherwise noted). We ver-ified that the transmission rate was low enough to guar-antee no packet losses as a result of system issues (e.g.internal queue overflow).
Using this setup, we varied four factors in our exper-iments: the choice of environments, the radio type (and
frequency), the output transmit power settings, and thepacket size settings.
The first factor we varied was the environment type. Weselected three environments for our experimentation:
• Indoor Office. We chose our lab to perform someindoor connectivity experiments. It consists of a typ-ical office type environment with an area of approx-imately 20m by 20m. It has partition panels, desks,chairs, cabinets, computers, monitors, etc. This envi-ronment is harsh for wireless communication due tomulti-path reflections from walls and the possibilityof interference from electronic devices. The choiceof this environment is motivated by sensing applica-tions in indoor environments [25].
• Outdoor Urban. We picked the UCLA Engineer-ing courtyard as another environment for our exper-iments. It is an area of 70m by 35m surroundedby buildings and with some vegetation, trees, andan open area around the center. The vegetation andthe walls from the buildings are expected to producesome signal attenuation and multi-path reflections aswell. This environment is an intermediate measur-ing point between indoor places and outdoor naturalhabitats.
• Outdoor Habitat. We use a 200m by 150m section ofthe Will Rogers State Park, Pacific Palisades, Califor-nia. The area consists of a small valley, surroundedby a 35 degree slope hill with very dense vegeta-tion, including different type of plants, bushes andtrees. Multi-path effects and signal attenuation dueto the dense vegetation contribute to a harsh environ-ment for wireless communication. There has beenseveral efforts to monitor habitats in sensor networks[3], which motivate this environment.
The second factor we varied was the radio type. We

7
used two different type of radios with different transmis-sion frequency and different modulation schemes. TheMica 1 transmits in the 916MHz band, and uses an ampli-tude shift keying (ASK) modulation scheme. The Mica 2transmits in the 433MHz band, and uses a frequency shiftkeying (FSK) modulation scheme. The FSK modulationis more resilient to voltage supply variations since eachsymbol detection includes multiple zero-crossings. Thisis one of the reasons why the Mica 1 board needs an ad-ditional voltage regulator in place in order for the radio tobe effective.
The third factor we varied was the output transmissionpower. The motes hardware allows discrete control ofthe output transmission power of the RF transceiver. Thiscapability permits sensor network applications to controlthe power gain of the transceiver, allowing them to trade-off energy usage versus transmission range. The Mica 1motes have a potentiometer circuit that allows controllingthe amount of current delivered to the RFM radio [21].The dynamic range of the output power selection withMica 1 ranges from -10dBm to 0dBm. The Mica 2 Chip-con radio chip (CC1000) [5] has programmable outputpower from -20dBm to 10dBm controlled directly withthe microcontroller. In our experiments we explored the-15dBm to +5dBm range of transmit power for the Mica 2platform. Due to the differences in the dynamic ranges be-tween the two platforms, we decided to qualify the powerlevels with respect to the dynamic range of each platform.For example, when using Mica 2 the -1dBm power levelis considered medium power level (with respect to its owndynamic range), but when using Mica 1 the -1dBm powerlevel is considered high power. In all our graphs we in-cluded the power level used in dBm units in order to facil-itate the comparison. For the Mica 1 and outdoor exper-iments, we only explored the high-power settings (near 0dBm) that were the only power values delivering enoughsignal strength to get meaningful connectivity results.
Finally, we varied the packet probe sizes in our ex-periments using two qualitatively different power settings(high and low power). The set of different packet sizesused was 25, 50, 100, 150 and 200 bytes. The payload ofthe packets was filled with random data up to the maxi-mum size in use.
Nodes were localized manually. For each experiment,we built a local coordinate system and find the local co-ordinates of all the nodes in three dimensions. For the in-doors experiments we localized the nodes using a measur-ing tape. The measuring error of the instrument is ± 0.1cm. For the outdoors experiments we use a sonic rangerdevice (Zircon DM S50)[32]. The measuring error of theinstrument is ± 1 cm. A conservative estimate of the lo-
calization error would be one order of magnitude largerthan the instrument measuring error, so we estimate thelocalization error of each node to be ± 1 cm for indoorsand ± 10 cm for outdoors. We note that the manual local-ization of the nodes is the only part of the entire procedurethat requires human intervention.
Summary: We collected packet delivery data frommore than 300,000 packet probes in experiments per-formed in 3 different environments, with 2 different typeof radios, with 6 different power settings, and 5 differentpacket sizes. We used up to 16 nodes in our outdoor ex-periments and up to 55 nodes in our indoor experimentsdistributed in an ad-hoc manner, each node transmitting200 packets. In each experiment, we measured the packetdelivery performance of 240 links for the outdoor experi-ments and 2970 links for the indoors experiments.
V. EXPERIMENTAL RESULTS
In this section we present the results of using SCALE indifferent environments, and describe the different aspectsof packet delivery performance. In all the results fromour experiments shown in this section, we use confidenceintervals with 95% degree of confidence based on largesample size (n > 30).
After some initial experimentation we have character-ized the primary features discussed in the literature [12],[31] of our radio channels:
• Asymmetrical links: the connectivity of node A tonode B (A → B) might be significantly different thanfrom node B to node A (B → A).
• Non-isotropic connectivity: the connectivity is notnecessarily the same in all the directions (same dis-tance) from the source.
• Non-monotonic distance decay: nodes that are ge-ographically far away from the source may get bet-ter connectivity than nodes that are geographicallycloser.
In the following sections we will take a closer look atthe different aspects of packet delivery under systemati-cally varied conditions using SCALE.
A. Spatial Characteristics
In this section we examine the qualitative and quantita-tive spatial characteristics of packet delivery in our exper-iments. We are interested in understanding how the recep-tion rate varies with distance from the transmitter underdifferent conditions and environments.
Figure 4 plots the raw packet delivery data in three ex-ample scenarios as a function of distance. The goal ofthese graphs is to show qualitatively the drastic variation
8
0
20
40
60
80
100
0 5 10 15 20 25 30 35 40 45 50
Rec
eptio
n R
ate
(%)
Distance (meters)
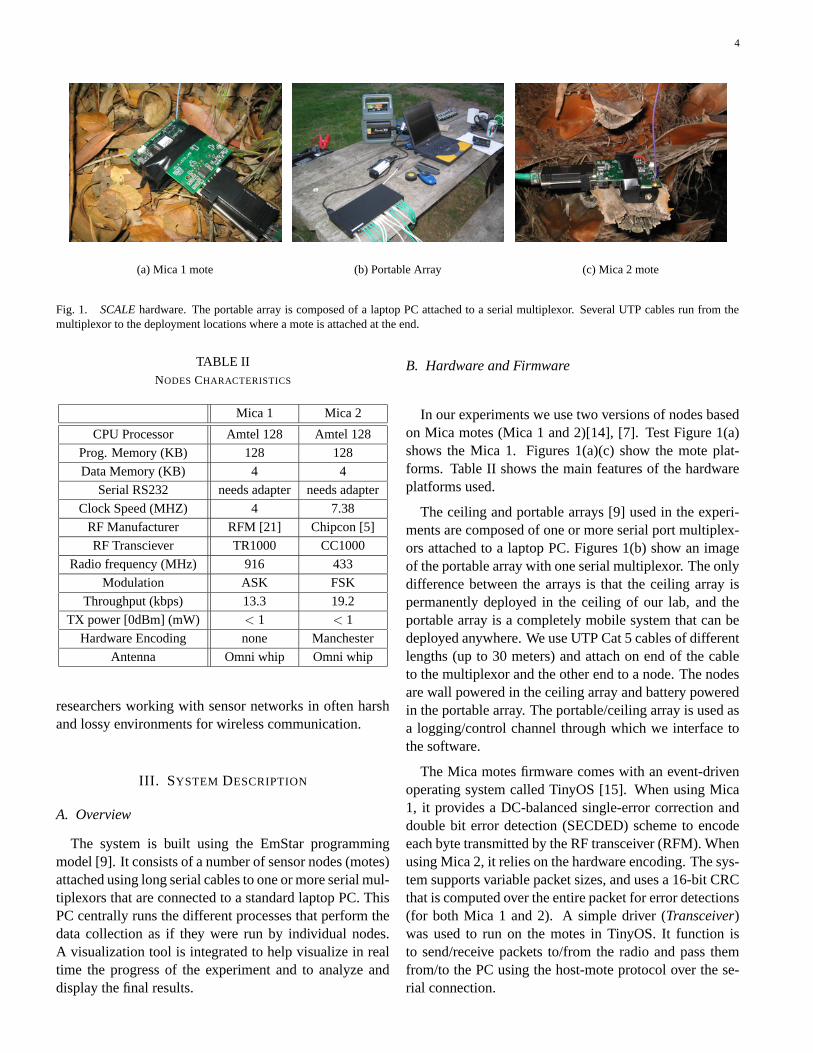
(a) Outdoor Habitat, Mica 2, low outputpower (-10dBm)
0
20
40
60
80
100
0 5 10 15 20 25 30 35 40 45 50
Rec
eptio
n R
ate
(%)
Distance (meters)
(b) Outdoor Habitat, Mica 2, medium-high output power (+1dBm)
0
20
40
60
80
100
0 2 4 6 8 10 12
Rec
eptio
n R
ate
(%)
Distance (meters)
(c) Indoor Office, Mica 1, medium out-put power (-6dBm)
Fig. 4. Packet delivery percentage as a function of distance for different environments using different radios and power settings. In all cases,there is a region in which the reception rate varies dramatically, with delivery rates varying from near 100% to 0%. The width of the regionwhere this phenomenon occurs is a significant portion (more than 50%, and up to 80% in some cases) of the communication range.
0
20
40
60
80
100
0 5 10 15 20 25 30 35 40 45 50
Rec
eptio
n R
ate
(%)
Distance (meters)
Low Power (-10dBm)Medium Power (-3dBm)High Power (+5dBm)
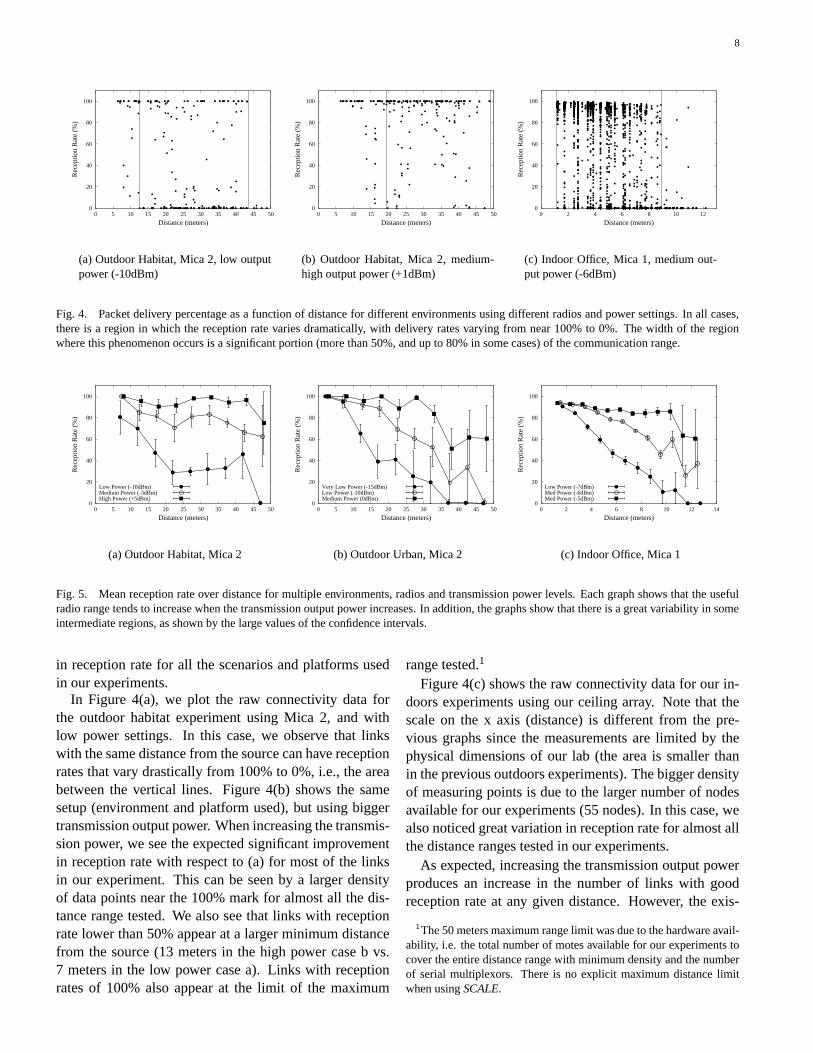
(a) Outdoor Habitat, Mica 2
0
20
40
60
80
100
0 5 10 15 20 25 30 35 40 45 50
Rec
eptio
n R
ate
(%)
Distance (meters)
Very Low Power (-15dBm)Low Power (-10dBm)Medium Power (0dBm)
(b) Outdoor Urban, Mica 2
0
20
40
60
80
100
0 2 4 6 8 10 12 14
Rec
eptio
n R
ate
(%)
Distance (meters)
Low Power (-7dBm)Med Power (-6dBm)Med Power (-5dBm)
(c) Indoor Office, Mica 1
Fig. 5. Mean reception rate over distance for multiple environments, radios and transmission power levels. Each graph shows that the usefulradio range tends to increase when the transmission output power increases. In addition, the graphs show that there is a great variability in someintermediate regions, as shown by the large values of the confidence intervals.
in reception rate for all the scenarios and platforms usedin our experiments.
In Figure 4(a), we plot the raw connectivity data forthe outdoor habitat experiment using Mica 2, and withlow power settings. In this case, we observe that linkswith the same distance from the source can have receptionrates that vary drastically from 100% to 0%, i.e., the areabetween the vertical lines. Figure 4(b) shows the samesetup (environment and platform used), but using biggertransmission output power. When increasing the transmis-sion power, we see the expected significant improvementin reception rate with respect to (a) for most of the linksin our experiment. This can be seen by a larger densityof data points near the 100% mark for almost all the dis-tance range tested. We also see that links with receptionrate lower than 50% appear at a larger minimum distancefrom the source (13 meters in the high power case b vs.7 meters in the low power case a). Links with receptionrates of 100% also appear at the limit of the maximum
range tested.1
Figure 4(c) shows the raw connectivity data for our in-doors experiments using our ceiling array. Note that thescale on the x axis (distance) is different from the pre-vious graphs since the measurements are limited by thephysical dimensions of our lab (the area is smaller thanin the previous outdoors experiments). The bigger densityof measuring points is due to the larger number of nodesavailable for our experiments (55 nodes). In this case, wealso noticed great variation in reception rate for almost allthe distance ranges tested in our experiments.
As expected, increasing the transmission output powerproduces an increase in the number of links with goodreception rate at any given distance. However, the exis-
1The 50 meters maximum range limit was due to the hardware avail-ability, i.e. the total number of motes available for our experiments tocover the entire distance range with minimum density and the numberof serial multiplexors. There is no explicit maximum distance limitwhen using SCALE.
9
tence of bad links (links with small reception rate) is notcompletely eliminated when increasing the transmissionoutput power and bad links tend to appear at almost anypower setting used (although fewer when large power set-ting is used). We have verified this behavior even withmaximum power settings using both Mica 1 and 2, andin the 2 outdoors environments we tested (Mica 1 and 2at maximum power get high reception rates in our space-limited indoor lab). The graphs are omitted for brevity.
Next we analyze the mean behavior of the receptionrate. In Figure 5, we plot the mean reception rate as afunction of distance for different transmission power lev-els, environments, and radios. In these graphs, links weresorted based on distance from the source, and aggregatedin 5 meter bins. Each measuring point represents the meanof all the links included in each 5 meter bin. There aremore than 30 links in each bin.2
The large confidence intervals at some points show thehigh variability that could be visually observed in Figure4. In all the cases shown in Figure 5 there is a generaldecrease in the reception rate as we increase the distancefrom the source. This is expected due to attenuation of thesignal over distance for any transmission power level.
Discussion. The significant spatial variation in packetdelivery using low power devices was first noted in previ-ous work [4], which showed that nodes that are geograph-ically further away from the source could, in practice, ob-tain better reception rate than nodes that are closer.
In [31], using nodes placed in a line, the area wherethe variability in packet reception was significant had awidth of 20% to 30% of the communication range, andit was always located near the maximum radio range. Inour experience, when using network topologies that ex-tend in multiple directions from the source (not neces-sarily in a line) with different probability of obstructiondepending on the node placement (as one would expectin real sensor network deployments [3]), we observed thewidth of the highly variable reception rate area to be inmost cases larger than 50%, and up to 80% of radio rangein some cases. In our experiments, this area starts wellbefore the limit of the radio range. This result indicatesthat assumptions of packet delivery based exclusively ondistance from the source can be erroneous in practice.
Multipath and fading effects can explain the level vari-ability in packet delivery seen in our experiments. Whenthe direct signal is strong and the reflected componentsare attenuated, the reception rates are high. When the di-
2The rightmost bin (largest distance) for the outdoor experimentshas less than 30 links, so its confidence interval has less statisticalsignificance (cannot assume a population normal distribution). Thesample mean is still the best estimator of the population mean though.
0
5
10
15
20
25
30
35
-15 -10 -5 0 5
Asy
mm
etri
c L
inks
(%
of
tota
l lin
ks)
Output Power (dBm)
Outdoor Habitat mica2Outdoor Habitat mica1Outdoor Urban mica2Indoor Office mica1
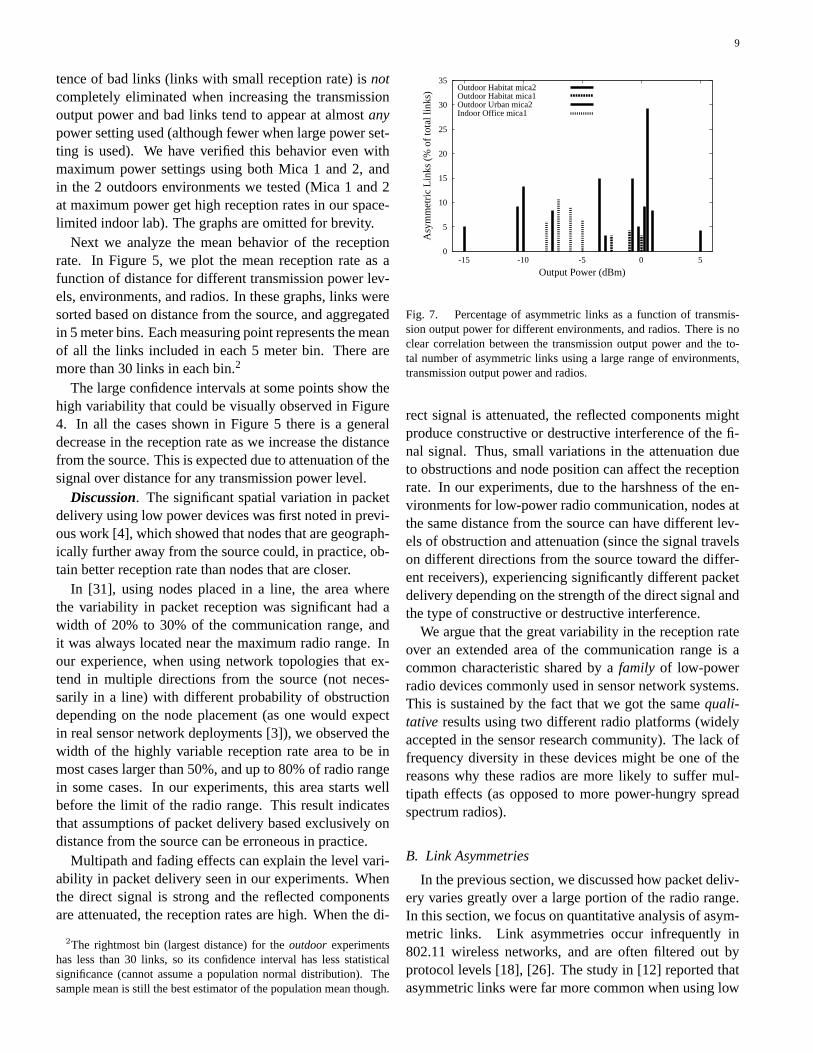
Fig. 7. Percentage of asymmetric links as a function of transmis-sion output power for different environments, and radios. There is noclear correlation between the transmission output power and the to-tal number of asymmetric links using a large range of environments,transmission output power and radios.
rect signal is attenuated, the reflected components mightproduce constructive or destructive interference of the fi-nal signal. Thus, small variations in the attenuation dueto obstructions and node position can affect the receptionrate. In our experiments, due to the harshness of the en-vironments for low-power radio communication, nodes atthe same distance from the source can have different lev-els of obstruction and attenuation (since the signal travelson different directions from the source toward the differ-ent receivers), experiencing significantly different packetdelivery depending on the strength of the direct signal andthe type of constructive or destructive interference.
We argue that the great variability in the reception rateover an extended area of the communication range is acommon characteristic shared by a family of low-powerradio devices commonly used in sensor network systems.This is sustained by the fact that we got the same quali-tative results using two different radio platforms (widelyaccepted in the sensor research community). The lack offrequency diversity in these devices might be one of thereasons why these radios are more likely to suffer mul-tipath effects (as opposed to more power-hungry spreadspectrum radios).
B. Link Asymmetries
In the previous section, we discussed how packet deliv-ery varies greatly over a large portion of the radio range.In this section, we focus on quantitative analysis of asym-metric links. Link asymmetries occur infrequently in802.11 wireless networks, and are often filtered out byprotocol levels [18], [26]. The study in [12] reported thatasymmetric links were far more common when using low

10
0
20
40
60
80
100
0 20 40 60 80 100
Cum
ulat
ive
Dis
trib
utio
n Fu
nctio
n
Link Asymmetry Difference (%)
Low Power (-10dBm)Medium Power (-3dBm)Medium Power (0dBm)Medium/High Power (1dBm)High Power (2dBm)High Power (5dBm)
(a) Outdoor Habitat, Mica 2
0
20
40
60
80
100
0 20 40 60 80 100
Cum
ulat
ive
Dis
trib
utio
n Fu
nctio
n
Link Asymmetry Difference (%)
Very Low Power (-15dBm)Low Power (-10dBm)Low Power (-7dBm)Medium Power (-3dBm)Medium Power (0dBm)Medium/High Power (1dBm)
(b) Outdoor Urban, Mica 2
0
20
40
60
80
100
0 20 40 60 80 100
Cum
ulat
ive
Dis
trib
utio
n Fu
nctio
n
Link Asymmetry Difference (%)
Medium/High Power (-3dBm)High Power (-1dBm)High Power (0dBm)
(c) Outdoor Habitat, Mica 1
0
20
40
60
80
100
0 20 40 60 80 100
Cum
ulat
ive
Dis
trib
utio
n Fu
nctio
n
Link Asymmetry Difference (%)
Low Power (-8dBm)Low/Medium Power (-7dBm)Medium Power (-6dBm)Medium Power (-5dBm)
(d) Indoor Office, Mica 1
Fig. 6. Link asymmetry distribution for Mica 1 and 2 in three different environments. In all cases there is at least 5% of link pairs with adifference in reception rate larger than 40%, and in some cases the percentage of asymmetric links is as big as 30%
power radios, even when all the nodes were set to use thesame transmission power level.
In this study, an asymmetric link is defined as onewhere the difference in the reception rate between the linkin one direction and the other direction is larger than acertain threshold. We have chosen 40% as our threshold.We used two qualitatively different packet sizes (25 bytesand 200 bytes) in the experiments performed in these sec-tion, and we did not observe important variations basedon packet size.
Figure 6 presents the cumulative probability distribu-tion of link pair asymmetry for several environments andtransmission power levels using both Mica 1 and 2. Thevertical line on the 40% shows the threshold for asym-metric links used in this study. This graph shows how thepercentage of asymmetric links would change if we hadpicked a different threshold value. More than 5% of the
link pairs have reception rate differences larger than 40%,and sometimes up to 30% of the link pairs have asymmet-ric properties. These asymmetric links are known for theirimpact on higher level protocols, such as routing [26].
Figure 7 shows the total percentage of asymmetriclinks –with respect to the total number of links in eachexperiment– as a function of the transmission outputpower for three different environments using both Mica1 and 2. Each bar represents an entire set of experimentsperformed at a particular transmission power level. Notethat we did not systematically cover the entire dynamicrange of transmission output power, but rather pickedsample measuring points. In other words, the absence ofa bar in certain power region is due to the absence of ameasuring point, not the result of zero asymmetric linksin that power level. For each radio platform, we coveredalmost the entire power range in different environments.

11
0
1
2
3
4
5
6
7
8
0 5 10 15 20 25 30 35 40 45 50
Asy
mm
etri
c L
inks
(%
tota
l num
ber
of li
nks)
Distance (meters)
Low Power (-10dBm)Medium Power (0dBm)High Power (5dBm)
(a) Outdoor Habitat, Mica 2
0
1
2
3
4
5
6
7
8
0 5 10 15 20 25 30 35 40 45 50
Asy
mm
etri
c L
inks
(%
tota
l num
ber
of li
nks)
Distance (meters)
Very Low Power (-15dBm)Low Power (-10dBm)Low/Medium Power (-3dBm)Medium Power (0dBm)
(b) Outdoor Urban, Mica 2
0
1
2
3
4
5
6
7
8
0 5 10 15 20 25 30 35 40 45 50
Asy
mm
etri
c L
inks
(%
tota
l num
ber
of li
nks)
Distance (meters)
Medium Power (-3dBm)Medium/High Power (-1dBm)High Power (0dBm)
(c) Outdoor Habitat, Mica 1
0
1
2
3
4
5
6
7
8
0 2 4 6 8 10 12
Asy
mm
etri
c L
inks
(%
tota
l num
ber
of li
nks)
Distance (meters)
Low Power (-7dBm)Low Power (-6dBm)Low/Medium Power (-5dBm)
(d) Indoor Office, Mica 1
Fig. 8. Percentage of asymmetric links (with respect to the total number of links) as a function of distance for different environments, radios,and power levels. It is clear from the graphs that there is no obvious correlation between the asymmetric links and distance
Mica 1 was explored from -8 dBm to 0 dBm and Mica 2was explored from -15 dBm to +5 dBm (in both cases nearthe entire dynamic range allowed by each RF transceiverhardware). Some of the bars have been offset in the x axisvalue (power) to improve readability, mainly around thecluttered 0 dBm region.
From the graph we can see that for each platform ineach environment, there is no clear correlation betweentransmission power level and the percentage of asymmet-ric links. Furthermore, the percentage of asymmetric linksseems to oscillate between 5% to 15% of the total num-ber of links depending on the hardware platform and theenvironment, and in some cases being up to 30% of thetotal.
Figure 8 plots the percentage of asymmetric links asa function of distance for three different environmentsand two platforms for different transmission power levels.
Note that in this case we systematically explored the en-tire distance space for each environment, and the absenceof a bar at a particular distance indicates the absence ofasymmetric links at that distance from the source.
Figure 8(a) and (b) show the results of using Mica 2in two different environments with different transmissionspower levels. There is no clear correlation between thenumber of asymmetric links and the distance from thesource. Asymmetric links tend to appear in a wide rangeof distances from the source, increasing and decreasingalternatively as we move further. In Figure 8(c) and (d)we show the results of using Mica 1 in two different en-vironments with several different transmission power lev-els. Note that the scale for the x axis (distance) in Fig-ure 8(d) is different from the outdoors experiments, sincethe indoors experiments were performed in a smaller area.When using Mica 1 we notice the same phenomena than
12
TABLE IIIASYMMETRIC LINK-PAIRS NODE SWAPPING RESULTS
NodeType
LocationType
Asymmetric Invertedlink-pairs link-pairs
before afterswapping swapping
Mica 2 Outdoor Urban 11 10Mica 2 Indoor Office 10 9Mica 1 Indoor Office 24 22
when using Mica 2; i.e. asymmetric links seem not to becorrelated with distance from the source, and they appearin all the distance ranges tried in our experiments.3
Discussion. In [12] the spatial distribution of the asym-metric links was concentrated around the limit of the com-munication range for two different power settings tried.Our results show that there was no spatial correlation ofasymmetric links; asymmetries were equally likely to hap-pen well before the limit of the radio range. In that studythey argued that at the limit of the communication range,small differences between nodes’ transmit power and re-ception sensitivity may become significant and resultedin asymmetries. In other words, the link in one directionmay have a direct signal that is strong enough (above acertain threshold) to get good reception rate while in theother direction the signal may be below the threshold andreflected signal components may affect the reception rate,causing link asymmetries. One interesting observation isthat the experiments performed in [12] were done in a flat,open parking structure with no obstacles in the immediatevicinity. The difference between the environments wherethe experiments were conducted might explain the differ-ences between results of the two studies. In [12], in theabsence of obstacles, sufficient attenuation to produce linkasymmetries was only existent in the limit of the radiorange, while in our experiments with cluttered environ-ments we experienced different level of attenuation at thesame distance from the source, potentially producing thesame effect at distances other than near the radio range.
One question that still remained unanswered waswhether the cause of link asymmetries was primarily dueto differences in hardware calibration. In both, IndoorsOffice and Outdoor Urban, we run experiments using dif-ferent transmission power levels. Using the SCALE visu-alization tool (Connview), we quickly identified the pair ofnodes that experienced asymmetric links. We emphasizethat the online nature and ease of use of SCALE made this
3Mica 1s got systematically smaller percentages of asymmetric linksthan Mica 2s. We do not have an explanation for this behavior otherthan hardware differences between the two radios.
0
20
40
60
80
100
0 1000 2000 3000 4000 5000 6000 7000
Rec
eptio
n R
ate
(%)
Time (sec)
High Average Reception RateMedium Average Reception RateLow Average Reception Rate
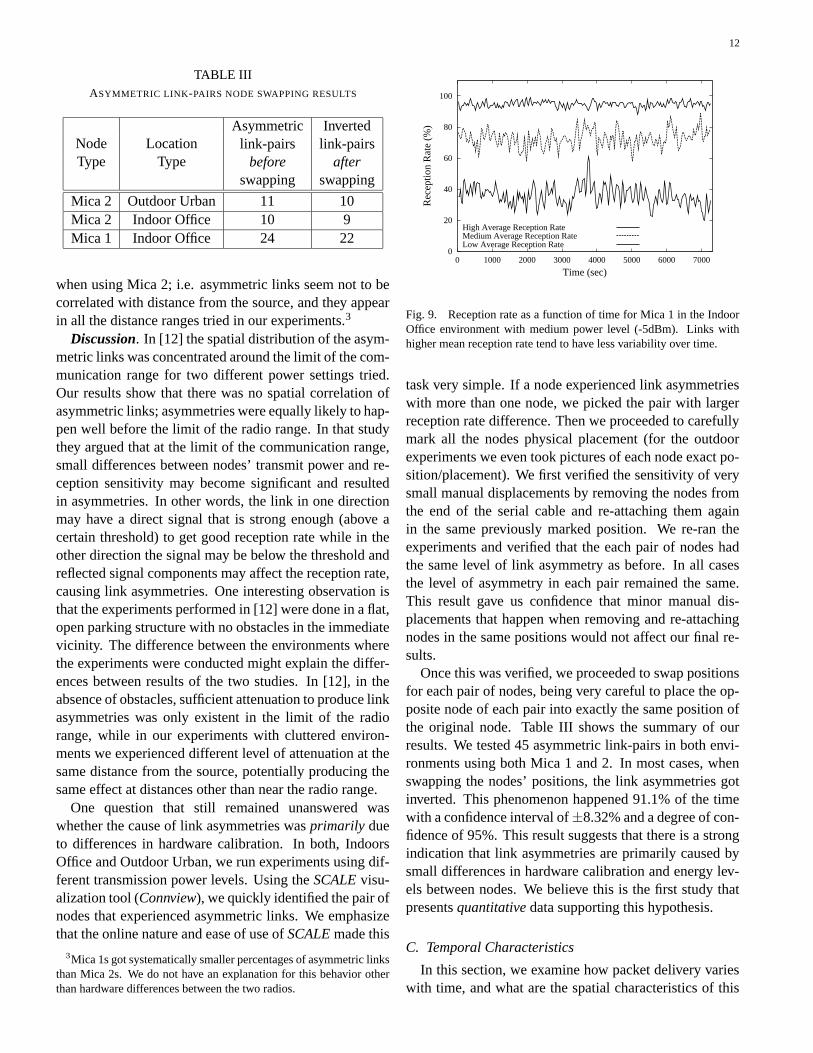
Fig. 9. Reception rate as a function of time for Mica 1 in the IndoorOffice environment with medium power level (-5dBm). Links withhigher mean reception rate tend to have less variability over time.
task very simple. If a node experienced link asymmetrieswith more than one node, we picked the pair with largerreception rate difference. Then we proceeded to carefullymark all the nodes physical placement (for the outdoorexperiments we even took pictures of each node exact po-sition/placement). We first verified the sensitivity of verysmall manual displacements by removing the nodes fromthe end of the serial cable and re-attaching them againin the same previously marked position. We re-ran theexperiments and verified that the each pair of nodes hadthe same level of link asymmetry as before. In all casesthe level of asymmetry in each pair remained the same.This result gave us confidence that minor manual dis-placements that happen when removing and re-attachingnodes in the same positions would not affect our final re-sults.
Once this was verified, we proceeded to swap positionsfor each pair of nodes, being very careful to place the op-posite node of each pair into exactly the same position ofthe original node. Table III shows the summary of ourresults. We tested 45 asymmetric link-pairs in both envi-ronments using both Mica 1 and 2. In most cases, whenswapping the nodes’ positions, the link asymmetries gotinverted. This phenomenon happened 91.1% of the timewith a confidence interval of±8.32% and a degree of con-fidence of 95%. This result suggests that there is a strongindication that link asymmetries are primarily caused bysmall differences in hardware calibration and energy lev-els between nodes. We believe this is the first study thatpresents quantitative data supporting this hypothesis.
C. Temporal Characteristics
In this section, we examine how packet delivery varieswith time, and what are the spatial characteristics of this

13
0
10
20
30
40
50
60
0 2 4 6 8 10 12 14
Stan
dard
Dev
iatio
n (%
)
Distance (meters)
Low Power (-7 dBm)Medium Power (-5 dBm)
(a) Inddor Office, Mica 1, reception rate standard deviationas a function of distance
0
10
20
30
40
50
60
0 20 40 60 80 100
Stan
dard
Dev
iatio
n (%
)
Reception Rate (%)
Low Power (-7 dBm)Medium Power (-5 dBm)
(b) Inddor Office, Mica 1, reception rate standard deviationas a function of the mean reception rate
Fig. 10. Figure 10(a) shows that there is no clear correlation between the variability of the recpetion rate (σ, standard deviation) and the distancefrom the transmitter. Figure 10(b) shows an interesing correlation. Links with very high reception rate over time (> 90%) tend to be more stable(small σ), followed by links with very low reception rates (near 0%). The links with intermediate reception rate tend to be highly unstable, withvery large variability over time (up to values of 50% for σ).
variation.
For this experiment we configured SCALE to run withjust one sender (no round-robin) at a data rate of 2 pack-ets/sec, with data packet size of 200 bytes. We configuredSCALE to try multiple power levels, and let it run for morethan 2 hours for each power level selected in the IndoorOffice environment. The mean reception rate was com-puted every 30 seconds, and the window size for the re-ception rate calculation was set to 60 seconds (each packetsent affects two mean reception rate calculations). Wepresent the results only using Mica 1, since Mica 2 tracespresent the same qualitative characteristics (not shown forbrevity).
Figure 9 shows the mean reception rate variability overtime for three different links with different mean recep-tion rate over the entire time of the experiment. The fig-ure illustrates that the variability for the link with a highmean reception rate (95%, the top curve) is quite small,and varies between 92% to 98%. On the other hand, thelink with low mean reception rate (∼40%, the bottomcurve) has high variability reception rate, and varies be-tween 20% to 60% over the entire time of the experiment.
Figure 10(a) shows the relation between the standarddeviation of the reception rate and the distance from thetransmitter. Each point in the graph represents the sam-ple variance, which is the best estimator of the populationvariance. The errorbars show the confidence interval ofthe standard deviation estimation with a degree of con-fidence of 95%. The confidence intervals for each point
were obtained using the Chi-Square distribution4. Thegraph shows that, using two different power levels, there isno clear correlation between the variability of the recep-tion rate in time (standard deviation σ) and the distancefrom the transmitter. High values of standard deviationappear in a wide range of distances from the source.
In Figure 10(b) we plot the relationship between thestandard deviation and the mean reception rate. On theright side of the graph, we can see that links with highmean reception rate (> 90%) show very little variationover time and tend to remain stable with good connec-tivity. Similarly, links with very low mean reception rate(near 0%) are also stable over time and tend to remainbad links over the time period tested. On the contrary,links with mean reception rates that range from 20% to80% show great variability over time, and in some casespresent standard deviation values in the order of 50%! Itis not uncommon for some of these links to go from 100%reception rate to 0% in the course of a two hour window.
The results presented in Section V-A showed that linkswith poor/medium reception rate were present in a widerange of distances from the transmitter. In addition,the correlation between high variability over time andpoor/medium reception rates shown in Figure 10(b) canhelp explain the results we obtained in Figure 10(a); linkswith poor/medium reception rate appear across a wide
4The points with very large standard deviation have confidence in-tervals with less statistical robustness. In some of these points, we donot always have a normally distributed population necessary by theChi-Square method to make robust statistical inferences.

14
0
20
40
60
80
100
0 5 10 15 20 25 30 35 40 45 50
Rec
eptio
n R
ate
(%)
Distance (meters)
Payload Size 25 bytesPayload Size 150 bytes
(a) Outdoor Urban, Mica 2, with LowPower (-10dBm)
0
20
40
60
80
100
0 5 10 15 20 25 30 35 40 45 50
Rec
eptio
n R
ate
(%)
Distance (meters)
Payload Size 25 bytesPayload Size 150 bytes
(b) Outdoor Urban, Mica 2, with HighPower (+5dBm)
0
20
40
60
80
100
0 5 10 15 20 25 30 35 40 45 50
Rec
eptio
n R
ate
(%)
Distance (meters)
Payload Size 25 bytesPayload Size 150 bytes
(c) Outdoor Urban, Mica 1, with HighPower (-1dBm)
Fig. 11. Mean reception rate over distance for Mica 1 and 2 using multiple transmission power levels, and packet sizes in the OutdoorUrban environment. There is no significant difference in packet delivery between large and small packet sizes, with only a small decrease inperformance for larger packet sizes.
range of distances from the transmitter, and these are pre-cisely the links with higher standard deviation values.
D. Transmission Efficiency
In this section we take a look at the packet delivery effi-ciency. For any given payload size, there is an associatedefficiency overhead given by the size of the radio packetheader and the packet preamble. In addition, one wouldexpect that as we increase the packet size, the probabilityof successfully receiving an error-free packet would de-crease since there is a larger probability of any part of thepacket being corrupted (for any given channel BER).
In our experiments, we used different coding schemesdepending on the RF transceiver used (software-basedSECDED for Mica 1, and hardware-based Manchesterfor Mica 2). In this study, we did not consider the effi-ciency differences between the different coding schemes.The packet overhead is related to the packet header addedto each transmitted packet (it contains addressing andCRC error-checking information), and the preamble/start-symbol overhead that is used by each radio to detect anew packet over the air and lock into the incoming signalto achieve bit-level synchronization. The packet headeroverhead is the same in both Mica 1 and 2 and con-sists of 7 bytes/packet (addressing + CRC). The pream-ble/start symbol overhead is different for each radio. TheRFM transceiver (Mica 1) uses 12 bytes/packet, while theCC1000 transceiver (Mica 2) uses 20 bytes/packet.
In Figure 11 we show the reception rate as a functionof distance for both Mica 1 and 2 at different power levelsin the Outdoor Urban environment. We show only small(25 bytes) and big (150 bytes) payload sizes. We gathereddata for several other payload sizes (25, 50, 100, 150 and200 bytes), but we did not include them in the graphs to
improve readability, since all the curves were very similar.In general, for all three graphs and using different trans-mission power levels for Mica 2, we notice only a slightdecrease in the reception rate as we increase the payloadsize.
Based on the results shown in Figure 11, we investi-gated whether the small decrease in reception rate as weincrease payload size could be compensated by the de-crease in the packet overhead. We defined a new metricto measure this relationship. For any given link, we wantto measure the relation between the useful information re-ceived versus the information sent over a link using a met-ric called efficiency5, which is defined as:
UsefulBitRX
TotalBitTX=
PayloadSizei
TotalPacketSizei
× Pi(s) (1)
where TotalPacketSizei is the total size of the packettype i (preamble + header + payload); PayloadSizei
is the payload size of packet type i; and Pi(s) is theprobability of successfully receiving a packet of type i.The fraction PayloadSizei/PacketSizei determines theideal efficiency under optimal reception rates. The differ-ent packet types i are given by the different payload sizeswe used in our experiments.
Figure 12 plots the efficiency metric defined in (1) as afunction of distance from the source. Each horizontal linedetermines the theoretical efficiency value under ideal re-ception rate (100%) for the different payload sizes. Wecan see from the graphs that larger efficiency is achievedby using larger payload sizes. For Mica 2, the maximumefficiency is achieved with the larger payload size triedin most of the radio range. For Mica 1, it seems that the
5A related metric was defined in [31] in the context of MAC layerretransmissions

15
0
20
40
60
80
100
0 5 10 15 20 25 30 35 40 45 50
Eff
icie
ncy
(%)
Distance (meters)
Payload Size 25 bytesPayload Size 50 bytesPayload Size 100 bytesPayload Size 150 bytes
(a) Outdoor Urban, Mica 2, with LowPower (-10dBm)
0
20
40
60
80
100
0 5 10 15 20 25 30 35 40 45 50
Eff
icie
ncy
(%)
Distance (meters)
Payload Size 25 bytesPayload Size 50 bytesPayload Size 100 bytesPayload Size 150 bytesPayload Size 200 bytes
(b) Outdoor Urban, Mica 2, with HighPower (+5dBm)
0
20
40
60
80
100
0 5 10 15 20 25 30 35 40 45 50
Eff
icie
ncy
(%)
Distance (meters)
Payload Size 25 bytesPayload Size 50 bytesPayload Size 100 bytesPayload Size 150 bytesPayload Size 200 bytes
(c) Outdoor Urban, Mica 1, with HighPower (-1dBm)
Fig. 12. Efficiency rate as a function of distance for Mica 1 and 2 in the Outdoor Urban environment for multiple payload sizes. The verticallines show the ideal efficiency for each packet payload size. Larger efficiency is achieved by using larger payload sizes than the default valuesset up in the mote software.
optimal packet size to maximize efficiency is around 150bytes. Using values larger than that do not improve per-formance.
The default value established in the mote software [15]for the payload size is 29 bytes, and could probably beincreased with a noticeable improvement in terms of effi-ciency. Nevertheless, larger packets may produce fairnessproblems for channel utilization when there are multiplesenders in a region, and even increase the probability ofcollisions depending of the MAC scheme used in the sys-tem. The final choice of packet size should also considerthe particular MAC layer scheme used and the expectedtraffic pattern and workload introduced by the application.
VI. CONCLUSIONS AND FUTURE WORK
In this paper, we have presented SCALE, a networkwireless measuring and visualization tool that enables thequalitatively and quantitative characterization of the wire-less channel in a particular target environment and usingthe same hardware platform intended for deployment. Us-ing SCALE with two different radio transcievers in threedifferent environments, we found that there is no clear cor-relation between packet delivery and distance in an areaof more than 50% of the communication range, temporalvariations of packet delivery are not correlated with dis-tance from the source but with the mean reception rateof each link, the percentage of asymmetric links variesfrom 5% to 30% and strong indications suggesting that thecause of links asymmetries is primarily due to hardwarecalibration differences. The data collected using SCALEprovide some useful insights for protocol developers andengineers working in sensor networks.
In the near future, we plan to integrate SCALE withsome self-localization systems under development [13] to
eliminate the extent of human intervention needed andmake the system more autonomous. In addition, we planto extend the low-level radio interface to collect some ofthe signal-to-noise information available in some of theRF transcievers used in sensor networks.
Acknowledgments
SCALE was made possible through the support of theUSC/NSF SCOWR project (USC subcontract #059565),the GALORE project (USAF/Wright-Patterson Air ForceBase contract #F33615-01-C-1906) and the National Sci-ence Foundation Cooperative Agreement #CCR-0120778supporting the Center of Embedded Networked Sensing.
We would like to thank to all members of the UCLALECS lab that made contributions to EmStar softwaredeveloping environment. Many individuals made valu-able comments that helped improve previous versions ofthis paper, including Pierpaolo Bergamo, Henri Dubois-Ferriere, Deepak Ganesan, Ramesh Govindan, John Hei-demann, Joe Polastre, Mohammed Rahimi, HanbiaoWang, Alec Woo, and Jerry Zhao.
REFERENCES
[1] B.R. Badrinath, M. Srivastava, K. Mills, J. Scholtz, andK. Sollins. Special issue on smart spaces and environments. Oc-tober 2000.
[2] Tony Ballardie, Paul Francis, and Jon Crowcroft. Core basedtrees (cbt). In Deepinder P. Sidhu, editor, SIGCOMM Symposiumon Communications Architectures and Protocols, pages 85–95,San Francisco, California, USA, September 1993.
[3] Alberto Cerpa, Jeremy Elson, Deborah Estrin, Lewis Girod,Michael Hamilton, and Jerry Zhao. Habitat monitoring: Applica-tion driver for wireless communications technology. In Proceed-ings of the SIGCOMM Workshop on Communications in LatinAmerica and the Carribean, San Jose, Costa Rica, April 3–52001. ACM.

16
[4] Alberto Cerpa and Deborah Estrin. ASCENT: Adaptive self-configuring sensor networks topologies. In Proceedings of theTwenty First Annual Joint Conference of the IEEE Computer andCommunications Societies (INFOCOM 2002), New York, NY,USA, June 23–27 2002. IEEE.
[5] Chipcon. Cc1000 low power radio tranciever,http://www.chipcon.com/files/cc1000 data sheet 2 1.pdf.
[6] D. C. Cox, R. R. Murray, and A. W. Norris. Measurements of800 mhz radio transmission into buildings with metallic walls.The Bell System Technical Journal, 9(62):2695–2717, November1983.
[7] Crossbow. Mica2 wireless measurement system datasheet,http://www.xbow.com/products/product pdf files/datasheets/wireless/6020-0042-03 a mica2.pdf.
[8] Stephen Deering, Deborah L. Estrin, Dino Farinacci, Van Jacob-son, Ching-Gung Liu, and Liming Wei. The PIM architecture forwide-area multicast routing. IEEE/ACM Transactions on Net-working, 4(2):153–162, 1996.
[9] Jeremy Elson, Solomon Bien, Naim Busek, Vladimir By-chkovskiy, Alberto Cerpa, Deepak Ganesan, Lewis Girod, BenGreenstein, Tom Schoellhammer, Thanos Stathopoulos, andDeborah Estrin. EmStar: An environment for developing wire-less embedded systems software. Technical Report CENS Tech-nical Report 0009, Center for Embedded Networked Sensing,University of California, Los Angeles, March 2003.
[10] D. Estrin, R. Govindan, and J. Heidemann. Special issue on em-bedding the internet. 43(5), May 2000.
[11] D. Estrin, R. Govindan, J. Heidemann, and S. Kumar. Next cen-tury challenges: Scalable coordination in sensor networks. InProceedings of the Fifth Annual ACM/IEEE International Con-ference on Mobile Computing and Networking (Mobicom 1999).ACM, August 1999.
[12] D. Ganesan, B. Krishnamachari, A. Woo, D. Culler, D. Estrin,and S. Wicker. Complex behavior at scale: An experimentalstudy of low-power wireless sensor networks. Technical Re-port UCLA CSD-TR 02-0013, Center for Embedded NetworkedSensing, University of California, Los Angeles and Intel Re-search Lab, University of California, Berkeley, February 2002.
[13] Lewis Girod, Vladimir Bychkovskiy, Jeremy Elson, and Deb-orah Estrin. Locating tiny sensors in time and space: a casestudy. In Proceedings of the International Conference on Com-puter Design (ICCD), Freiburg, Germany, September 2002.http://lecs.cs.ucla.edu/Publications.
[14] Jason Hill and David Culler. Mica: A wireless platform fordeeply embedded networks. 22(6):12–24, Nov/Dec 2002.
[15] Jason Hill, Robert Szewczyk, Alec Woo, Seth Hollar, DavidCuller, and Kristofer Pister. System architecture directionsfor networked sensors. In Proceedings of the Ninth Interna-tional Conference on Architectural Support for ProgrammingLanguages and Operating Systems (ASPLOS-IX), pages 93–104,Cambridge, MA, USA, November 2000. ACM.
[16] Chalermek Intanagonwiwat, Ramesh Govindan, and DeborahEstrin. Directed diffusion: A scalable and robust communicationparadigm for sensor networks. In Proceedings of the Sixth An-nual ACM/IEEE International Conference on Mobile Computingand Networking (MobiCom 2000), N.Y., August 2000. ACM.
[17] Intel. Intel xscale technology,http://www.intel.com/design/intelxscale.
[18] D. Kim, C. K. Toh, and Y. Choi. On supporting link asymmetry inmobile ad hoc networks. In Proceedings of IEEE GLOBECOM,pages 2798–2803, San Antonio, Texas, USA, November 25–292001. IEEE.
[19] K. K. Leung, M.V. Clark, B. McNair, and Z. Kostic. Outdoor ieee
802.11 cellular networks: Radio link performance. In Proceed-ings of IEEE ICC 2002, New York, April 2002. http://www.bell-labs.com/user/kin/papers/802.11.radio.pdf.
[20] S. McCanne. The bsd packet filter: A new architecture for user-level packet capture. In Proc. of the Winter 1993 USENIX Con-ference, pages 259–270, San Diego, California, USA, 1993.
[21] RFM Monolithics. Tr1000 low power radio system,http://www.rfm.com/products/data/tr1000.pdf.
[22] Hewllet Packard. ipaq h1910,http://www.shopping.hp.com/shopping/pdf/311324.pdf.
[23] Vern Paxson. Automated packet trace analysis of TCP imple-mentations. In SIGCOMM, pages 167–179, Cannes, France,September 14–18 1997.
[24] J. Postel. RFC 793: Transmission Control Protocol, September1981.
[25] J. Rabaey, E. Arens, C. Federspiel, A. Gadgil, D. Messerschmitt,W. Nazaroff, K. Pister, and P. Varaiya S. Oren. Smart energydistribution and consumption: Information technology as an en-abling force. Technical report, Center for Information Technol-ogy Research in the Interest of Society (CITRIS), 2001.
[26] Venugopalan Ramasubramanian, Ranveer Chandra, and DanielMosse. Providing a bidirectional abstraction for unidirectionaladhoc networks. In Proceedings of the Twenty First Annual JointConference of the IEEE Computer and Communications Soci-eties (INFOCOM 2002), New York, NY, USA, June 23–27 2002.IEEE.
[27] S. Y. Seidel and T. S. Rappaport. 914 mhz path loss predic-tion models for indoor wireless communications in multiflooredbuildings. IEEE Transactions on Antennas and Propagation,2(40):207–217, February 1992.
[28] K. Sohrabi, B. Manriquez, and G. Pottie. Near ground widebandchannel measurement in 800-1000 mhz. IEEE 49th VehicularTechnology Conference, 1:571–574, March 1999.
[29] Alec Woo and David E. Culler. Evaluation of efficient link re-liability estimators for low-power wireless networks. TechnicalReport UCB/CSD-03-1270, University of California, Berkeley,April 2003.
[30] Alec Woo, Terence Tong, and David Culler. Taming the under-lying challenges of reliable multihop routing in sensor netowrks.In Proceedings of ACM Sensys 2003 (to appear), Los Angeles,CA, USA, November 5–7 2003. ACM.
[31] Yonggang Jerry Zhao and Ramesh Govindan. Understandingpacket delivery performance in dense wireless sensor networks.In Proceedings of ACM Sensys 2003 (to appear), Los Angeles,CA, USA, November 5–7 2003. ACM.
[32] Zircon. Dms50 sonic ranger datasheet,http://www.zircon.com/sellpages/measuring/dms50/dms50instructions/dms50 inst.pdf.