Embed Size (px)
Citation preview
1421
Ecology, 83(5), 2002, pp. 1421–1432q 2002 by the Ecological Society of America
SCALE-DEPENDENT EFFECTS OF LANDSCAPE CONTEXTON THREE POLLINATOR GUILDS
INGOLF STEFFAN-DEWENTER,1 UTE MUNZENBERG, CHRISTOF BURGER, CARSTEN THIES, AND
TEJA TSCHARNTKE
Department of Agroecology, University of Gottingen, Waldweg 26 D-37073 Gottingen, Germany
Abstract. Most ecological processes and interactions depend on scales much largerthan a single habitat, and therefore it is important to link spatial patterns and ecologicalprocesses at a landscape scale. Here, we analyzed the effects of landscape context on thedistribution of bees (Hymenoptera: Apoidea) at multiple spatial scales with respect to thefollowing hypotheses: (1) Local abundance and diversity of bees increase with increasingproportion of the surrounding seminatural habitats. (2) Solitary wild bees, bumble bees,and honey bees respond to landscape context at different spatial scales. We selected 15landscape sectors and determined the percentage of seminatural habitats and the diversityof habitat types at eight spatial scales (radius 250–3000 m) by field inspections and analysesof vegetation maps using two Geographic Information Systems. The percentage of semi-natural habitats varied between 1.4% and 28%. In the center of each landscape sector apatch of potted flowering plants (four perennial and two annual species) was placed in thesame habitat type, a grassy field margin adjacent to cereal fields. In all, 865 wild beeindividuals and 467 honey bees were observed and an additional 475 individuals werecaught for species identification. Species richness and abundance of solitary wild beesshowed a close positive correlation with the percentage of seminatural habitats at smallscales up to 750 m, whereas bumble bees and honey bees did not respond to landscapecontext at these scales. In contrast, honey bees were correlated with landscape context atlarge scales. The densities of flower-visiting honey bees even increased with decreasingproportion of seminatural habitats at a radius of 3000 m. We are not aware of any empiricalstudies showing contrasting foraging patterns related to landscape context at different spatialscales. We conclude (1) that local landscape destruction affects solitary wild bees morethan social bees, possibly changing mutualistic plant–pollinator and competitive wild bees–honey bees interactions and (2) that only analyses of multiple spatial scales may detect theimportance of the landscape context for local pollinator communities.
Key words: bees; biotic interactions; community structure; connectivity; habitat fragmentation;landscape ecology; pollination; spatial scales; species diversity.
INTRODUCTION
Habitat fragmentation and destruction have been rec-ognized as major threats to biodiversity (e.g., Saunderset al. 1991, Harrison and Bruna 1999). Decreasing sizeand increasing isolation of habitat patches lead to adecline in species richness and abundance as well asto changes in community structure (Holt et al. 1999,Connor et al. 2000, Debinski and Holt 2000, Steffan-Dewenter and Tscharntke 2000a). This process of hab-itat fragmentation and destruction may greatly changethe landscape structure and local ecosystem functions(Kareiva and Wennergren 1995). Most ecological pro-cesses and interactions depend on spatial scales muchlarger than a single habitat patch, and therefore, ecol-ogists have become increasingly aware of the impor-tance of linking spatial patterns and ecological pro-cesses at a landscape scale (Turner and Gardner 1991,Kareiva and Wennergren 1995, Gustafson 1998, Wie-
Manuscript received 29 January 2001; revised 15 August2001; accepted 21 August 2001.
1 E-mail: [email protected]
gand et al. 1999). Changes in landscape structure canbe characterized by the proportion of suitable habitat(Andren 1994), the diversity of habitats, and the sizeand spatial arrangement of habitats in a landscape (Gus-tafson 1998).
The analysis of ecological processes on large spatialscales is the subject of three more or less separateddisciplines, metapopulation ecology, theoretical ecol-ogy, and landscape ecology (Hanski 1998). Metapo-pulation ecology provides a good framework to un-derstand population dynamics as a consequence of mi-gration, colonization, and extinction in spatially struc-tured habitats. Theoretical ecologists have developedneutral landscape models and individual-based spa-tially explicit landscape models that emphasize the im-portance of analyzing different spatial scales (e.g.,Keitt et al. 1997, Wiegand et al. 1999). Landscape ecol-ogists are concerned with the description and analysesof real landscapes, using a variety of methods and pa-rameters to quantify landscape structure (e.g., Turnerand Gardner 1991, Cain et al. 1997, Gustafson 1998).Although there is an overlap between these disciplines,
1422 INGOLF STEFFAN-DEWENTER ET AL. Ecology, Vol. 83, No. 5
the needed synthesis has yet to emerge (Turner et al.2001). Furthermore, community studies are mostly fo-cused on habitat fragments and more or less ignore theimportance of the surrounding matrix (Ricketts 2001,Tscharntke et al. 2002). Few empirical data provide aninsight into how landscape structure determines the di-versity and interactions of local communities andwhich spatial scale matters. Forest fragmentation af-fects four parasitoids of the forest tent caterpillar atdifferent spatial scales depending on body size (Rolandand Taylor 1997). Landscape structure affects biolog-ical control of oilseed rape pollen beetles (Thies andTscharntke 1999) but not parasitism of the armyworm(Menalled et al. 1999). Bird diversity is determined byhabitat diversity at intermediate spatial scales, while atlarge biogeographical scales abiotic factors are moreimportant (Bohning-Gaese 1997). Functional groups oftrees are related to landscape structure at different spa-tial scales (Metzger 2000). These studies indicate thatparticular patterns and processes occur at particularspatial scales and that the spatial scale at which or-ganisms interact may depend on both the landscapetype and the species’ traits.
An important element of landscape structure is thedegree to which a landscape facilitates or impedesmovement of organisms among resource patches, i.e.,connectivity (Tischendorf and Fahrig 2000). Structuralconnectivity by corridors maintains species richnessand increases local population abundance in the frag-mented landscapes of a microecosystem (Gilbert et al.1998, Gonzales et al. 1998). Functional connectivity isa scale-dependent feature that depends on the spatialscale at which individuals perceive and interact withlandscape structure by dispersal (Keitt et al. 1997, Withet al. 1999). This scale is difficult to assess a prioriand has to be identified by testing for a correlationbetween the population-dynamic features of interestand landscape characteristics at different spatial scales(Kareiva 1990, Wiegand et al. 1999).
In this study we analyzed the effects of landscapecontext on the diversity and abundance of bees (Hy-menoptera: Apoidea) at different spatial scales. Beesare an important functional group due to their mutu-alistic interactions with plants (Allen-Wardell et al.1998). The possible negative effects of habitat frag-mentation and isolation on plant–pollinator interactionshave attracted much attention in the last years (e.g.,Rathcke and Jules 1993, Kearns et al. 1998), and someevidence exists that small or isolated plant populationsreceive fewer flower visits and may suffer from pol-linator limitation (Jennersten 1988, Aizen and Feinsin-ger 1994, Steffan-Dewenter and Tscharntke 1999, Cun-ningham 2000). Almost nothing is known about therelation between landscape composition and pollinatordiversity.
Bees can be subdivided into three pollinator guilds:solitary wild bees, social wild bumble bees, and man-aged honey bees. These groups greatly differ with re-
spect to foraging distances and life history traits (Eick-wort and Ginsberg 1980, Dramstad 1996, Osborne etal. 1999). The landscape in central Europe has beengreatly changed by humans for several thousand yearsand almost no natural, primary bee habitats such asmoors, inland dunes, or floodplains of rivers exist(Klemm 1996, Kuster 1999). Today, native bees mainlydepend on man-made seminatural habitats such as cal-careous grasslands, meadows, and fallows, which de-veloped by extensive land use (Osborne et al. 1991).Many bee species have specific requirements with re-spect to flowers providing pollen and nectar, nest sites,and building material, and these resources may occurspatially separated in different habitats within their for-aging range (Westrich 1996). Therefore, not only theproportion of suitable habitat but also the diversity ofhabitat types may be important for the occurrence ofa bee species in a landscape sector.
To standardize recording of pollinators, an experi-mental approach was used that is analogous to the ‘‘hy-brid patch-landscape scale’’ approach suggested re-cently by theoretical ecologists (Tischendorf and Fah-rig 2000). They recommend the use of nonoverlappinglandscapes as study units and the sampling of a singlepatch in the center of each landscape. Each single datapoint is obtained from a separate landscape and there-fore replicated at the landscape scale thus maintainingindependence (Tischendorf and Fahrig 2000). Here, weselected 15 landscape sectors using a gradient fromstructurally simple to structurally rich landscapes. Inthe center of each landscape a patch of flowering plantswas placed in the same local habitat (grassy field mar-gins adjacent to cereal fields) to measure the diversityand abundance of bees associated with landscape con-text at multiple spatial scales. We expected (1) thatabundance and diversity of bees increase with increas-ing percentage of seminatural habitats in a landscapeand (2) that solitary bees, bumble bees, and honey beesrespond to landscape context to a different extent andat different spatial scales.
MATERIAL AND METHODS
Study region and study sites
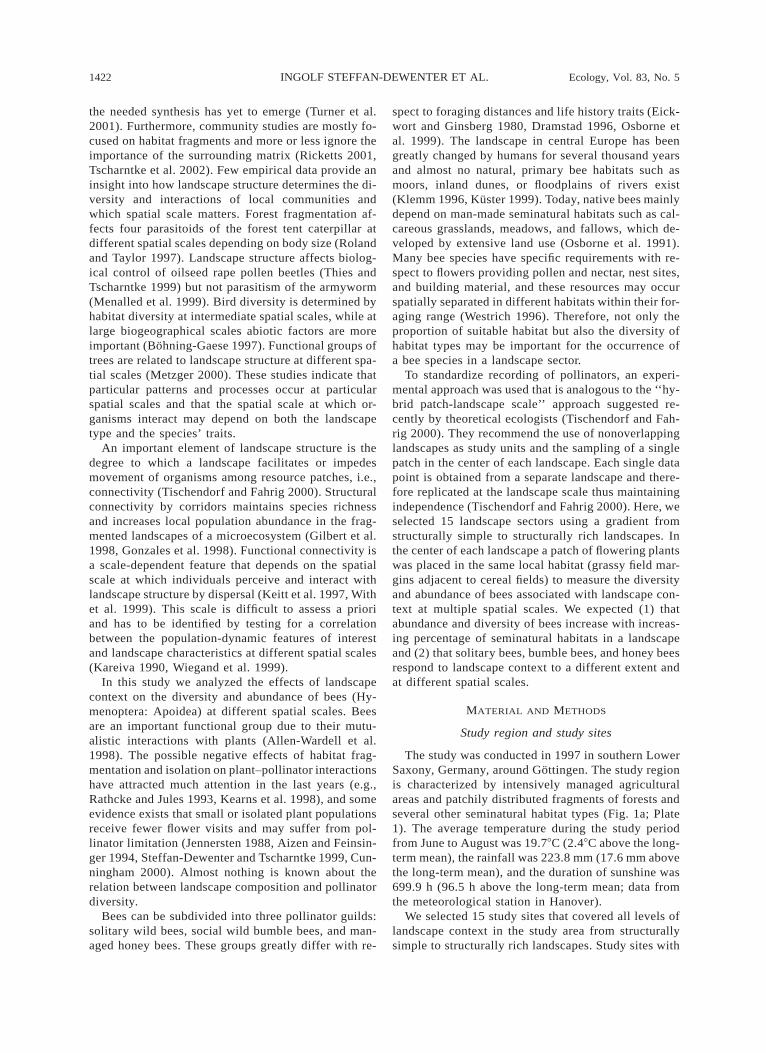
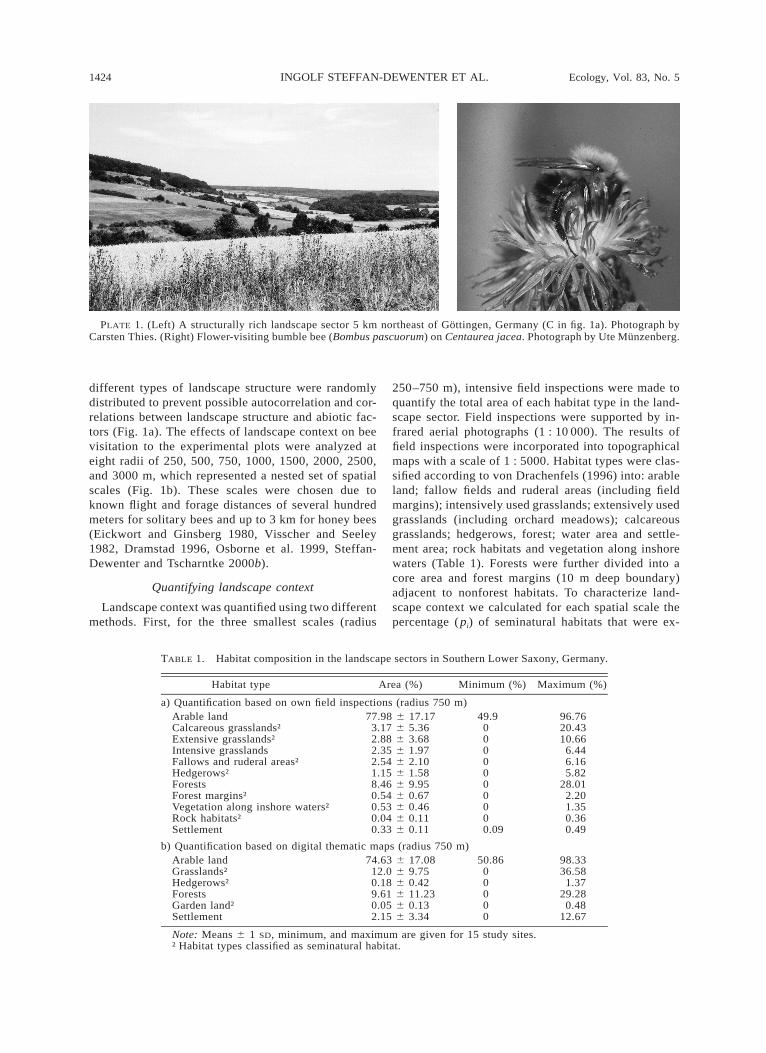
The study was conducted in 1997 in southern LowerSaxony, Germany, around Gottingen. The study regionis characterized by intensively managed agriculturalareas and patchily distributed fragments of forests andseveral other seminatural habitat types (Fig. 1a; Plate1). The average temperature during the study periodfrom June to August was 19.78C (2.48C above the long-term mean), the rainfall was 223.8 mm (17.6 mm abovethe long-term mean), and the duration of sunshine was699.9 h (96.5 h above the long-term mean; data fromthe meteorological station in Hanover).
We selected 15 study sites that covered all levels oflandscape context in the study area from structurallysimple to structurally rich landscapes. Study sites with
May 2002 1423LANDSCAPE CONTEXT AND POLLINATORS
FIG. 1. Study region and study sites in southern Lower Saxony, Germany. (a) Location of the 15 landscape sectors andthe distribution of the main habitat types. (b) Four study sites (marked A, B, C, and D in Fig. 1a) with the eight nestedspatial scales used in the analyses.
1424 INGOLF STEFFAN-DEWENTER ET AL. Ecology, Vol. 83, No. 5
PLATE 1. (Left) A structurally rich landscape sector 5 km northeast of Gottingen, Germany (C in fig. 1a). Photograph byCarsten Thies. (Right) Flower-visiting bumble bee (Bombus pascuorum) on Centaurea jacea. Photograph by Ute Munzenberg.
TABLE 1. Habitat composition in the landscape sectors in Southern Lower Saxony, Germany.
Habitat type Area (%) Minimum (%) Maximum (%)
a) Quantification based on own field inspections (radius 750 m)Arable landCalcareous grasslands†Extensive grasslands†Intensive grasslandsFallows and ruderal areas†
77.98 6 17.173.17 6 5.362.88 6 3.682.35 6 1.972.54 6 2.10
49.90000
96.7620.4310.66
6.446.16
Hedgerows†ForestsForest margins†Vegetation along inshore waters†Rock habitats†Settlement
1.15 6 1.588.46 6 9.950.54 6 0.670.53 6 0.460.04 6 0.110.33 6 0.11
000000.09
5.8228.01
2.201.350.360.49
b) Quantification based on digital thematic maps (radius 750 m)Arable landGrasslands†Hedgerows†ForestsGarden land†Settlement
74.63 6 17.0812.0 6 9.750.18 6 0.429.61 6 11.230.05 6 0.132.15 6 3.34
50.8600000
98.3336.58
1.3729.28
0.4812.67
Note: Means 6 1 SD, minimum, and maximum are given for 15 study sites.† Habitat types classified as seminatural habitat.
different types of landscape structure were randomlydistributed to prevent possible autocorrelation and cor-relations between landscape structure and abiotic fac-tors (Fig. 1a). The effects of landscape context on beevisitation to the experimental plots were analyzed ateight radii of 250, 500, 750, 1000, 1500, 2000, 2500,and 3000 m, which represented a nested set of spatialscales (Fig. 1b). These scales were chosen due toknown flight and forage distances of several hundredmeters for solitary bees and up to 3 km for honey bees(Eickwort and Ginsberg 1980, Visscher and Seeley1982, Dramstad 1996, Osborne et al. 1999, Steffan-Dewenter and Tscharntke 2000b).
Quantifying landscape context
Landscape context was quantified using two differentmethods. First, for the three smallest scales (radius
250–750 m), intensive field inspections were made toquantify the total area of each habitat type in the land-scape sector. Field inspections were supported by in-frared aerial photographs (1 : 10 000). The results offield inspections were incorporated into topographicalmaps with a scale of 1 : 5000. Habitat types were clas-sified according to von Drachenfels (1996) into: arableland; fallow fields and ruderal areas (including fieldmargins); intensively used grasslands; extensively usedgrasslands (including orchard meadows); calcareousgrasslands; hedgerows, forest; water area and settle-ment area; rock habitats and vegetation along inshorewaters (Table 1). Forests were further divided into acore area and forest margins (10 m deep boundary)adjacent to nonforest habitats. To characterize land-scape context we calculated for each spatial scale thepercentage (pi) of seminatural habitats that were ex-
May 2002 1425LANDSCAPE CONTEXT AND POLLINATORS
pected to represent potential bee habitats (see Table 1)and total habitat diversity using the Shannon-Wienerindex (H9s 5 2Spi 3 log(pi); Krebs 1989).
Second, for all spatial scales (radius 250–3000 m),a less-detailed method was used to quantify landscapestructure using existing commercially available, digitalmaps (ATKIS-DLM 25/1, 1991–1996; Landesvermes-sungsamt 1 Geobasisinformationen Niedersachsen,Hannover, Germany) covering the habitat types arableland, grassland, hedgerows, garden land, forest, andsettlement area (Table 1). For each of the eight nestedspatial scales the total area of each habitat type wasquantified separately using the Geographic InformationSystems ARC/View 3.1 (ESRI Geoinformatik, Han-nover, Germany) and TopoL 4.506 (Gesellschaft furdigitale Erdbeobachtung und Geoinformationen, Got-tingen, Germany). Again, the proportion of seminaturalhabitats (grasslands including intensively and exten-sively used grasslands, calcareous grasslands and or-chard meadows, hedgerows, and garden land; see Table1) and total habitat diversity (Shannon-Wiener index)were calculated for each of the eight spatial scales sep-arately.
Field experiments
To measure the effect of landscape context on pol-linator diversity and abundance independently fromsoil conditions and habitat quality, we establishedpatches of potted flowering plants in the center of eachof the 15 landscape sections (Fig. 1b). To cover a broadspectrum of flower morphology and flowering time weused four perennial plant species, Anthyllis vulneraria(Fabaceae), Campanula rotundifolia, Campanula ra-punculoides (Campanulaceae), and Centaurea jacea(Asteraceae), and two annual plant species, Raphanussativus (Brassicaceae) and Borago officinalis (Bora-ginaceae). Seeds from wild plant populations were ob-tained from a commercial seed grower (Conrad Appel,Abteilung Wildpflanzensamen, Darmstadt, Germany).The perennial species were sown in November 1996in a glasshouse, pricked out in mid-December (An-thyllis vulneraria) and mid-January (Campanula ro-tundifolia, C. rapunculoides, and Centaurea jacea), re-spectively, and planted in upper compartments (pots of3.5 L, 24 cm diameter) with standardized garden soil(Einheitserde Typ T; Archut/Hawita, Vechta, Germany)of larger pots (8.5 L, 24 cm diameter) in March. Thelower part of the pot was used as a water supply (5 L)and was connected with wicks to the upper part, whichcontained the garden soil. Annuals were sown in mid-March 1997 (R. sativus) and mid-May (B. officinalis).Two of the experimental plant species were placed intoeach pot using the following combinations: A. vulner-aria with Campanula rotundifolia, R. sativus with Cen-taurea jacea, and Campanula rapunculoides with B.officinalis. Four pots of each of the three plant speciescombinations were placed on grassy field margins ad-jacent to cereal fields in each of the 15 landscapes
between 13 and 16 May 1997 to establish experimentalpatches of flowering plants, i.e., 12 pots per study siteand 180 pots altogether. Distance between each con-specific pot was 1 m. To prevent damage by rabbits ordeer, the plants were fenced with wire (6 m 3 1.20 m,1 m height). Depending on weather conditions, plantswere watered every 5–10 d.
Flower-visitor observations
Flower visitation was observed between 0900 and1700 during June–August 1997 in typical weather con-ditions, i.e., at least 188C, 70% sunshine, and low windvelocity. The four individuals of each plant specieswere observed simultaneously, recording all flower-visiting insects for 15 min (Plate 1). Bees were iden-tified to genus level in the field. After each observationperiod, flower-visiting bees were captured during a fur-ther 15-min period for identification in the laboratory.To obtain unbiased data, on each field day, observationswere made in different landscape types, and time ofday was varied at a given study site for successiveobservations. The number of observation periods perplant species depended on the flowering period andweather conditions and varied between two and fiveobservations per study site. Altogether 314 flower-vis-itor record periods (15-min observation and 15-mincapture) were made. A. vulneraria flowered between18 June and 25 July, Campanula rotundifolia between25 June and 8 August, Campanula rapunculoides be-tween 29 June and 4 August, Centaurea jacea between29 July and 25 August, and B. officinalis between 6and 25 August 1997. R. sativus plants could not beobserved, because they did not grow well and devel-oped only few flowers.
Statistical analyses
The statistical analyses of the data were performedusing Statgraphics plus for Windows 2.1 (Statgraphics1995). All data were tested for normality and trans-formed where necessary. Arcsine transformation(arcsin where p is a proportion) was used to achieveÏpnormal distribution for percentages (Sokal and Rohlf1995).
Pollinator abundance per study site was the meannumber of observed flower-visiting bee individuals per15 min over all five plant species. Species richness perlandscape represents the total number of bee speciescaptured in the second part of each observation period.The effect of landscape context on pollinators was as-sessed using simple linear regressions. We analyzedeach of the eight nested landscape sectors (radius from250 to 3000 m) separately and tested for each radiushow the species richness and abundance of all wildbees, solitary wild bees, bumble bees, and honey beesresponded to the proportion of seminatural habitats.Mean individual body size of solitary wild bees wascalculated using a database of German bee species(Steffan-Dewenter and Tscharntke 1999). Scatterplots
1426 INGOLF STEFFAN-DEWENTER ET AL. Ecology, Vol. 83, No. 5
TABLE 2. Correlations between percentage of seminatural habitats (rows) and the diversity of habitat types (H9, columns)at different spatial scales.
Percentage ofseminatural
habitatsat scale
Scale for H9
250 m 500 m 750 m 1000 m 1500 m 2000 m 2500 m 3000 m
250 m500 m750 m
1000 m
0.870***0.758**0.726**0.783**
0.783**0.753**0.677**0.718**
0.727**0.743**0.723**0.741**
0.535*0.565*0.569*0.595*
0.4740.4790.527*0.558*
0.3480.4090.4070.419
0.3100.3960.4490.526*
0.3250.4790.4480.451
1500 m2000 m2500 m3000 m
0.745*0.653**0.578*0.548*
0.630*0.528*0.4360.378
0.644**0.520*0.4450.398
0.4940.3890.3520.329
0.4380.3850.4100.364
0.3460.440.4710.415
0.559*0.636*0.608*0.550*
0.4770.556*0.539*0.510
* P , 0.05; ** P , 0.01; *** P , 0.001.
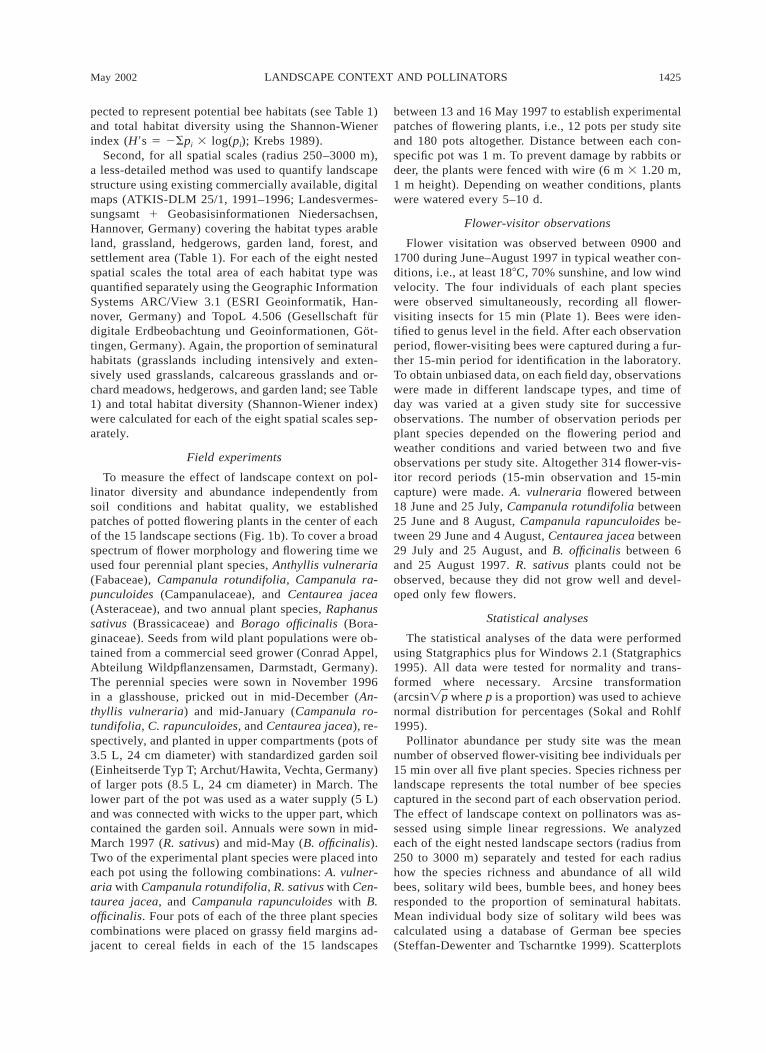
FIG. 2. Correlation coefficients between theproportion of seminatural habitats at differentspatial scales. Proportions of seminatural hab-itats are extracted from digital thematic maps(see Material and methods).
were used to illustrate scale-dependent changes of r2
values for the correlation between landscape contextand pollinators. Arithmetic means 6 1 SD are given inthe text.
RESULTS
Characteristics of landscape context
Landscape context was characterized by the propor-tion of each habitat type and by the diversity of habitattypes at eight spatial scales. Field inspections allowedus to distinguish 11 different habitat types, whereas thedigital thematic maps only differentiated between 6habitat types (Table 1). Dominant habitat types werearable land, forest, and grasslands. The proportions ofthese habitat types were similar in the field inspectionsand the maps (Table 1a and b). For example, the meanpercentage of seminatural habitats in a radius of 750m was 10.5 6 9.3% for field data and 12.8 6 9.7% fordata from digital maps and varied between 1.4–28.0%and 0.1–36.6%, respectively.
The proportion of seminatural habitats and the di-versity of habitat types were significantly correlated atmost spatial scales (Table 2). Due to this close inter-correlation, we focused our analyses on the proportionof seminatural habitats. Furthermore, the proportion ofseminatural habitats of landscape sectors of different
size were only closely correlated when radii of land-scape sectors were similar (Fig. 2).
Flower-visiting insects
A total of 865 wild bee individuals was observed inthe field, and 475 individuals were caught for speciesidentification. Altogether, we found 36 bee speciesfrom nine genera. The most species-rich genera wereLasioglossum (10 species), and Bombus (8 species) fol-lowed by Halictus (4), Megachile (4), Hylaeus (3),Chelostoma (2), Andrena (2), Psithyrus (2), and Melitta(1). Additionally, 467 honey bees (Apis mellifera) wereobserved. The mean number of observed wild bee spe-cies was 11 6 3.9 per landscape sector, and the meannumber of observed individuals per 15 min was 2.696 2.01 for all wild bees (Table 3). Solitary wild beeswere more abundant than honey bees and bumble bees.These three pollinator guilds varied considerably inspecies richness and/or abundance between the 15study sites (Table 3). Species richness and abundanceof flower-visiting wild bees were closely correlated (r2
5 0.733, n 5 15, P , 0.001).
Scale-dependent effects of landscape context
The focus of this study was on the effects of land-scape context on pollinators at different spatial scales.
May 2002 1427LANDSCAPE CONTEXT AND POLLINATORS
TABLE 3. Species richness and species abundance for all wild bees, solitary wild bees, bumblebees, and honey bees.
Factor Species group Mean 61 SDMini-mum
Maxi-mum
Species richness all wild beessolidary wild beesbumble bees
11 6 3.857.73 6 3.833.27 6 1.5
631
1715
6Abundance (no. individuals
per 15 min)all wild beessolitary wild beesbumble beeshoney bees
2.69 6 2.011.84 6 2.030.85 6 0.531.24 6 0.89
0.810.20.230.1
7.596.472.143.37
Note: Means 61 SD, minimum, and maximum are given for 15 study sites.
TABLE 4. Relationship between species richness and abundance of pollinator groups and theproportion of seminatural habitats at three spatial scales.
Species group
Scale
250 m
Corr. Coef. P
500 m
Corr. Coef. P
750 m
Corr. Coef. P
Species richness (no.)All wild beesSolitary wild beesBumble bees
0.7100.804
20.286
0.003,0.001
NS
0.7700.870
20.286
,0.001,0.001
NS
0.8200.856
20.071
,0.001,0.001
NS
Abundance (no. individuals per 15 min)All wild beesSolitary wild beesBumble beesHoney bees
0.7460.787
20.22420.017
0.001,0.001
NS
NS
0.8240.822
20.09420.037
,0.001,0.001
NS
NS
0.8590.8420.0400.086
,0.001,0.001
NS
NS
Notes: Correlation coefficients (Corr. Coef.) and significance levels are given for simplelinear regressions. Landscape structure was quantified by field inspections (see Material andmethods).
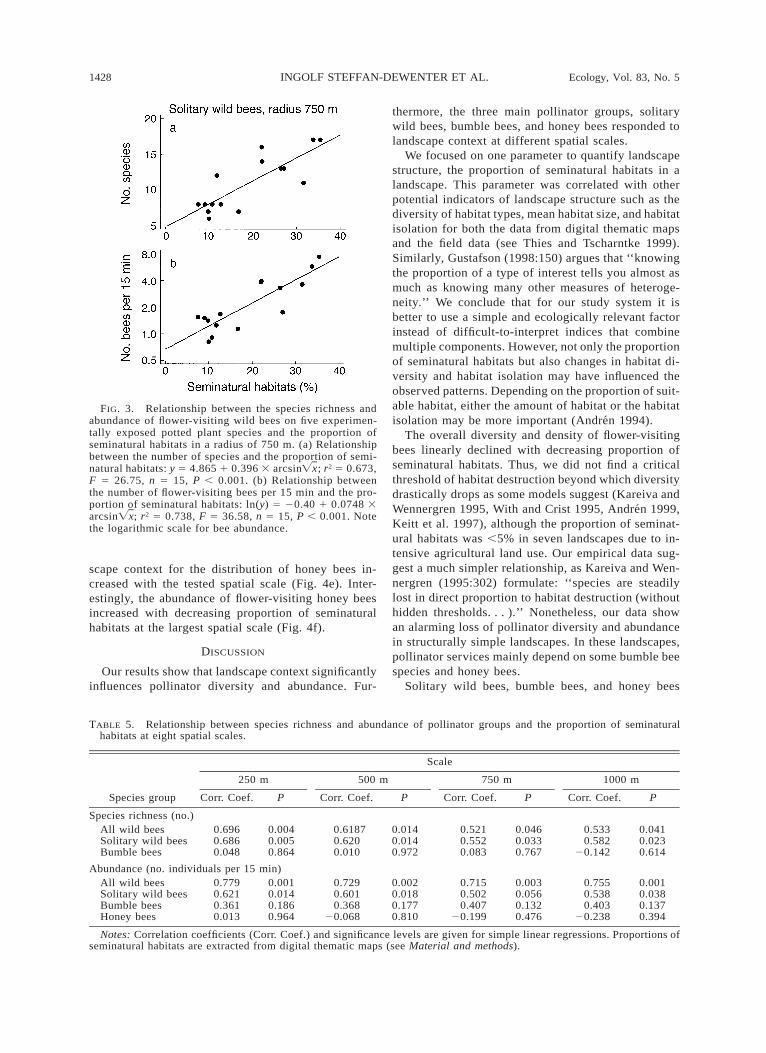
For small scales up to 750 m we could rely on our ownfield data. Both species richness and abundance of wildbees significantly increased with the proportion ofseminatural habitats at all three scales (Table 4). Thestrongest correlation between species richness andabundance of all wild bees and the proportion of semi-natural habitats was found for the 750 m radius (Fig.3a and b). Similarly, the number of species and theabundance of solitary wild bees were closely correlatedwith the proportion of seminatural habitats, whereasbumble bees and honey bees did not show a relationshipwith landscape context at scales up to 750 m (Table4). Total pollinator abundance (including all wild beesand honey bees) declined with decreasing proportionof seminatural habitats (y 5 0.47 1 0.22 arcsin ; r2Ïx5 0.722, F 5 33.83, n 5 15, P , 0.001), i.e., thegeneral pattern was determined by the distribution ofsolitary wild bees. The mean body size of solitary flow-er-visiting bees showed a tendency to increase in land-scapes with lower proportions of seminatural habitats(r2 5 0.238, n 5 15, P 5 0.065).
In the next step, we analyzed the effects of landscapestructure at multiple spatial scales on pollinator distri-bution using data from digital thematic maps. For eachof eight landscape sectors between 250 and 3000 mradius, we tested how species richness and abundance
of all wild bees, solitary wild bees, bumble bees, andhoney bees was related to landscape structure. Forscales between 250 and 750 m, the results were similarto those from the field inspections, indicating that theless detailed data from digital maps were similarly use-ful in predicting the distribution of bees (Table 5).Again, species richness and abundance of solitary wildbees were a positive function of the proportion of semi-natural habitats, whereas the bumble bees and honeybees did not show a significant correlation. However,the best correlations for the distribution of species rich-ness or abundance of all wild bees or solitary wild beeswas found in a radius of 250 m and explained ;25%less of the variation than the detailed data from ourfield inspections (see Tables 4 and 5).
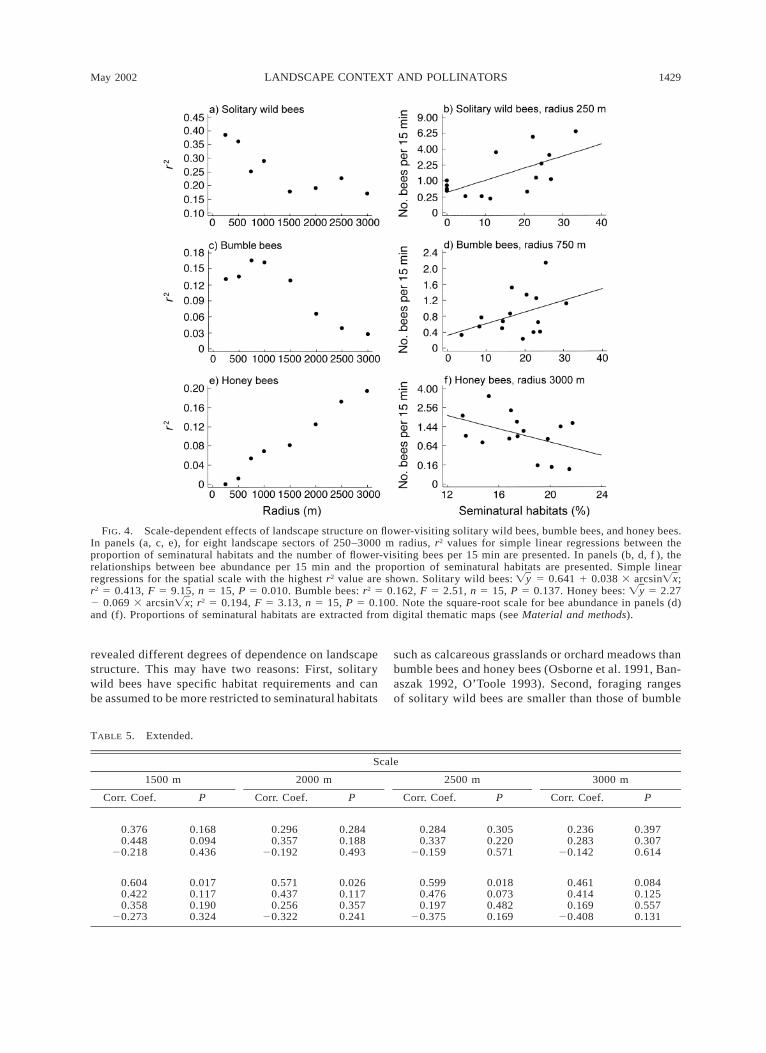
A scatterplot of r2 values for solitary wild bees, bum-ble bees, and honey bees with the proportion of semi-natural habitats over all landscape sectors indicated thateach pollinator group depended on landscape structureat different spatial scales. The amount of variation insolitary wild bee abundance explained by the propor-tion of seminatural habitats in the surrounding land-scape decreased with increasing spatial scale (Fig. 4aand b). The dependence of bumble bees on landscapecontext was weak and not significant at any scale (Fig.4c and d). In clear contrast, the significance of land-
1428 INGOLF STEFFAN-DEWENTER ET AL. Ecology, Vol. 83, No. 5
FIG. 3. Relationship between the species richness andabundance of flower-visiting wild bees on five experimen-tally exposed potted plant species and the proportion ofseminatural habitats in a radius of 750 m. (a) Relationshipbetween the number of species and the proportion of semi-natural habitats: y 5 4.865 1 0.396 3 arcsin ; r2 5 0.673,ÏxF 5 26.75, n 5 15, P , 0.001. (b) Relationship betweenthe number of flower-visiting bees per 15 min and the pro-portion of seminatural habitats: ln(y) 5 20.40 1 0.0748 3arcsin ; r2 5 0.738, F 5 36.58, n 5 15, P , 0.001. NoteÏxthe logarithmic scale for bee abundance.
TABLE 5. Relationship between species richness and abundance of pollinator groups and the proportion of seminaturalhabitats at eight spatial scales.
Species group
Scale
250 m
Corr. Coef. P
500 m
Corr. Coef. P
750 m
Corr. Coef. P
1000 m
Corr. Coef. P
Species richness (no.)All wild beesSolitary wild beesBumble bees
0.6960.6860.048
0.0040.0050.864
0.61870.6200.010
0.0140.0140.972
0.5210.5520.083
0.0460.0330.767
0.5330.582
20.142
0.0410.0230.614
Abundance (no. individuals per 15 min)All wild beesSolitary wild beesBumble beesHoney bees
0.7790.6210.3610.013
0.0010.0140.1860.964
0.7290.6010.368
20.068
0.0020.0180.1770.810
0.7150.5020.407
20.199
0.0030.0560.1320.476
0.7550.5380.403
20.238
0.0010.0380.1370.394
Notes: Correlation coefficients (Corr. Coef.) and significance levels are given for simple linear regressions. Proportions ofseminatural habitats are extracted from digital thematic maps (see Material and methods).
scape context for the distribution of honey bees in-creased with the tested spatial scale (Fig. 4e). Inter-estingly, the abundance of flower-visiting honey beesincreased with decreasing proportion of seminaturalhabitats at the largest spatial scale (Fig. 4f).
DISCUSSION
Our results show that landscape context significantlyinfluences pollinator diversity and abundance. Fur-
thermore, the three main pollinator groups, solitarywild bees, bumble bees, and honey bees responded tolandscape context at different spatial scales.
We focused on one parameter to quantify landscapestructure, the proportion of seminatural habitats in alandscape. This parameter was correlated with otherpotential indicators of landscape structure such as thediversity of habitat types, mean habitat size, and habitatisolation for both the data from digital thematic mapsand the field data (see Thies and Tscharntke 1999).Similarly, Gustafson (1998:150) argues that ‘‘knowingthe proportion of a type of interest tells you almost asmuch as knowing many other measures of heteroge-neity.’’ We conclude that for our study system it isbetter to use a simple and ecologically relevant factorinstead of difficult-to-interpret indices that combinemultiple components. However, not only the proportionof seminatural habitats but also changes in habitat di-versity and habitat isolation may have influenced theobserved patterns. Depending on the proportion of suit-able habitat, either the amount of habitat or the habitatisolation may be more important (Andren 1994).
The overall diversity and density of flower-visitingbees linearly declined with decreasing proportion ofseminatural habitats. Thus, we did not find a criticalthreshold of habitat destruction beyond which diversitydrastically drops as some models suggest (Kareiva andWennergren 1995, With and Crist 1995, Andren 1999,Keitt et al. 1997), although the proportion of seminat-ural habitats was ,5% in seven landscapes due to in-tensive agricultural land use. Our empirical data sug-gest a much simpler relationship, as Kareiva and Wen-nergren (1995:302) formulate: ‘‘species are steadilylost in direct proportion to habitat destruction (withouthidden thresholds. . . ).’’ Nonetheless, our data showan alarming loss of pollinator diversity and abundancein structurally simple landscapes. In these landscapes,pollinator services mainly depend on some bumble beespecies and honey bees.
Solitary wild bees, bumble bees, and honey bees
May 2002 1429LANDSCAPE CONTEXT AND POLLINATORS
FIG. 4. Scale-dependent effects of landscape structure on flower-visiting solitary wild bees, bumble bees, and honey bees.In panels (a, c, e), for eight landscape sectors of 250–3000 m radius, r2 values for simple linear regressions between theproportion of seminatural habitats and the number of flower-visiting bees per 15 min are presented. In panels (b, d, f ), therelationships between bee abundance per 15 min and the proportion of seminatural habitats are presented. Simple linearregressions for the spatial scale with the highest r2 value are shown. Solitary wild bees: 5 0.641 1 0.038 3 arcsin ;Ïy Ïxr2 5 0.413, F 5 9.15, n 5 15, P 5 0.010. Bumble bees: r2 5 0.162, F 5 2.51, n 5 15, P 5 0.137. Honey bees: 5 2.27Ïy2 0.069 3 arcsin ; r2 5 0.194, F 5 3.13, n 5 15, P 5 0.100. Note the square-root scale for bee abundance in panels (d)Ïxand (f). Proportions of seminatural habitats are extracted from digital thematic maps (see Material and methods).
TABLE 5. Extended.
Scale
1500 m
Corr. Coef. P
2000 m
Corr. Coef. P
2500 m
Corr. Coef. P
3000 m
Corr. Coef. P
0.3760.448
20.218
0.1680.0940.436
0.2960.357
20.192
0.2840.1880.493
0.2840.337
20.159
0.3050.2200.571
0.2360.283
20.142
0.3970.3070.614
0.6040.4220.358
20.273
0.0170.1170.1900.324
0.5710.4370.256
20.322
0.0260.1170.3570.241
0.5990.4760.197
20.375
0.0180.0730.4820.169
0.4610.4140.169
20.408
0.0840.1250.5570.131
revealed different degrees of dependence on landscapestructure. This may have two reasons: First, solitarywild bees have specific habitat requirements and canbe assumed to be more restricted to seminatural habitats
such as calcareous grasslands or orchard meadows thanbumble bees and honey bees (Osborne et al. 1991, Ban-aszak 1992, O’Toole 1993). Second, foraging rangesof solitary wild bees are smaller than those of bumble
1430 INGOLF STEFFAN-DEWENTER ET AL. Ecology, Vol. 83, No. 5
bees and honey bees, although concrete data are stilllacking in many cases (Eickwort and Ginsberg 1980,Visscher and Seeley 1982, Wesserling and Tscharntke1995, Dramstad 1996, Osborne et al. 1999). The im-portance of foraging ranges is supported by the ob-served increase in mean body size of solitary wild beesin landscapes with lower proportion of suitable habitatand higher patch isolation, because larger species areassumed to have better flight capabilities and largerforaging distances (see Gathmann et al. 1994, vanNieuwstadt and Iraheta 1996, Steffan-Dewenter andTscharntke 1999). Solitary wild bees and honey beesshowed contrasting responses when we analyzed dif-ferent spatial scales. The distribution of solitary wildbees could be best explained by the percentage of semi-natural habitat at small spatial scales whereas honeybees responded to landscape structure only at largescales. This supports the view that species perceive thelandscape structure at different spatial scales dependingon their dispersal abilities or foraging ranges (Keitt etal. 1997, With et al. 1999). Interestingly, the densitiesof honey bees visiting the experimental patches of flow-ering plants increased when the proportion of semi-natural habitats decreased. The predictive power of thelarger scales in our study fit well with the foragingrange of honey bees of 2.5–3 km and indicates that acolony selects the most profitable flower patches in thisrange (Visscher and Seeley 1982, Steffan-Dewenterand Tscharntke 2000b). In landscapes dominated bycrop fields, alternative food sources were presumablyrare, and therefore, honey bees visited the experimentalpatches more intensively than in landscape sectors witha higher proportion of seminatural habitats. The localdistribution and density of foraging honey bees clearlydepends also on the location of apiaries. We have notyet a complete database of apiaries in all studied land-scapes, but beekeepers often use seminatural habitatsto place their colonies, possibly resulting in a positivecorrelation between the proportion of seminatural hab-itats and the density of honey bee colonies (Steffan-Dewenter and Tscharntke 2000b). Therefore, from thedistribution of honey bee colonies we would expect theopposite pattern to the one we found, i.e., higher den-sities of flower-visiting honey bees in structurally richlandscapes. To summarize, the spatial pattern of beeforaging may be affected by: the spatial arrangementof additional flower patches, which are predicted to bemore abundant in structurally rich than poor land-scapes; the spatial scale at which the flower visitorperceives variation in flower abundance depending onspecies-specific foraging ranges; and by the distribu-tion of nesting sites, which should be more importantfor solitary wild bees than for social bees.
Our results may have implications for both compet-itive interactions between bees and mutualistic inter-actions between plants and pollinators. The higher for-aging density of honey bees in landscapes with lowerproportions of seminatural habitat suggest a higher for-
aging pressure by honey bees on isolated habitat frag-ments in such landscapes. Thus, the potential of mosaiclandscapes to lower competitive pressure (Hanski1995) may be lost in very simple landscapes with fewalternative food resources. Although landscape struc-ture has been suggested to influence competition be-tween honey bees and wild bees under certain condi-tions (e.g., Steffan-Dewenter and Tscharntke 2000b),we are not aware of any empirical studies to date show-ing contrasting foraging patterns related to landscapecontext at different spatial scales.
Our data suggest that small plant patches are wellconnected in structurally rich landscapes, whereas con-nectivity in landscapes with low proportions of semi-natural habitats is maintained only by a few social spe-cies (bumble bees and honey bees) with large foragingranges. The decline of these remaining species wouldhave severe effects on allogamous plant species (Cor-bet 1997). Furthermore, the loss of pollinator diversityand the dominance of bumble bees and honey bees inlandscapes with low proportions of seminatural habi-tats may favor plant species that require only generalistpollinators with the possible long-term loss of morespecialized plant species relying on more specialist sol-itary bees (Rathcke and Jules 1993, Kearns et al. 1998).However, lower proportions of seeds damaged by seedpredators in landscapes with few seminatural habitatsmay counterbalance the negative effects of pollinatorlimitation on the number of remaining seeds (Steffan-Dewenter et al. 2001).
Most published studies on the effects of landscapecontext, dealing almost always with vertebrates not in-sects, analyzed species occurrence in native habitatfragments and asked for additional matrix effects (e.g.,Aberg et al. 1995, Stouffer and Bierregaard 1995, Gas-con et al. 1999, Norton et al. 2000). In these studies,community changes depend on fragment size or qualityand matrix composition. In contrast, our experimentalpatches were placed in the nonhabitat matrix and there-by allow for an assessment of landscape effects inde-pendent from local habitat effects. By exposing pottedplants of identical origin, growing in one soil type withthe same nutrient and water availability, we were ableto minimize possible confounding factors. For exam-ple, landscape structure correlated with nutrient rich-ness of soils, but not with insecticide application (I.Roschewitz, unpublished data). Diversity of butterfliesin a Swedish agricultural landscape depended on land-scape heterogeneity but no differences between organicand conventional farms were found (Weibull et al.2000). In a recent study on the biodiversity of mothsin a fragmented agricultural landscape in Costa Rica,Ricketts et al. (2001) mapped moths in agriculturalhabitats and quantified, at different radii in the sur-rounding landscape, the cover of the forest habitat. Cor-relations between species richness of moths and forestcover were low for small neighborhood scales, but dra-matically increased when neighborhood scales of 1.0
May 2002 1431LANDSCAPE CONTEXT AND POLLINATORS
and 1.4 km were used, indicating that landscape contextat larger spatial scales was more important than atsmaller scales.
We conclude (1) that landscape destruction affectssolitary wild bees more than social bees, which pos-sibly leads to changes in mutualistic and competitiveinteractions and (2) that only analyses of multiple spa-tial scales may detect the importance of landscape con-text for pollinator communities.
ACKNOWLEDGMENTS
We greatly thank Eric Gustafson, Simon Potts, Thomas J.Stohlgren, Catrin Westphal, and an anonymous reviewer forhelpful comments on the manuscript.
LITERATURE CITED
Aberg, J., G. Jansson, J. E. Swenson, and P. Angelstam. 1995.The effect of matrix on the occurrence of hazel grouse(Bonasa bonasia) in isolated habitat fragments. Oecologia103:265–269.
Aizen, M. A., and P. Feinsinger. 1994. Forest fragmentation,pollination, and plant reproduction in a chaco dry forest,Argentina. Ecology 75:330–351.
Allen-Wardell, G., et al. 1998. The potential consequencesof pollinator declines on the conservation of biodiversityand stability of food crop fields. Conservation Biology 12:1–11.
Andren, H. 1994. Effects of habitat fragmentation on birdsand mammals in landscapes with different proportions ofsuitable habitat. Oikos 71:355–366.
Andren, H. 1999. Habitat fragmentation, the random samplehypothesis and critical thresholds. Oikos 84:306–308.
Banaszak, J. 1992. Strategy for conservation of wild bees inan agricultural landscape. Agriculture, Ecosystems and En-vironment 40:179–192.
Bohning-Gaese, K. 1997. Determinants of avian species rich-ness at different spatial scales. Journal of Biogeography24:49–60.
Cain, D. H., K. Riiters, and K. Orvis. 1997. A multi-scaleanalysis of landscape statistics. Landscape Ecology 12:199–212.
Connor, E. F., A. C. Courtney, and J. M. Yoder. 2000. In-dividuals–area relationships: the relationship between an-imal population density and area. Ecology 81:734–748.
Corbet, S. 1997. Role of pollinators in species preservation,conservation, ecosystem stability and genetic diversity.Acta Horticulturae 437:219–230.
Cunningham, S. A. 2000. Depressed pollination in habitatfragments causes low fruit set. Proceedings of the RoyalSociety of London Series B 267:1149–1152.
Debinski, D. M., and R. D. Holt. 2000. A survey and over-view of habitat fragmentation experiments. ConservationBiology 14:342–355.
Dramstad, W. E. 1996. Do bumblebees (Hymenoptera: Ap-idae) really forage close to their nests? Journal of InsectBehavior 9:163–182.
Eickwort, G. C., and H. S. Ginsberg. 1980. Foraging andmating behavior in Apoidea. Annual Review of Entomol-ogy 25:421–446.
Gascon, C., T. E. Lovejoy, R. O. Bierregaard, J. R. Malcom,P. C. Stouffer, H. L. Vasconcelos, W. F. Laurance, B. Zim-mermann, M. Tocher, and S. Borges. 1999. Matrix habitatand species richness in tropical forest remnants. BiologicalConservation 91:223–229.
Gathmann, A., H.-J. Greiler, and T. Tscharntke. 1994. Trap-nesting bees and wasps colonizing set-aside fields: suc-cession and body size, management by cutting and sowing.Oecologia 98:8–14.
Gilbert, F., A. Gonzales, and I. Evans-Freke. 1998. Corridors
maintain species richness in the fragmented landscapes ofa microecosystem. Proceedings of the Royal Society ofLondon B 265:577–582.
Gonzales, A., J. H. Lawton, F. S. Gilbert, T. M. Blackburn,and I. Evans-Freke. 1998. Metapopulation dynamics, abun-dance, and distribution in a microecosystem. Science 281:2045–2047.
Gustafson, E. J. 1998. Quantifying landscape spatial pattern:what is the state of the art? Ecosystems 1:143–156.
Hanski, I. 1995. Effects of landscape pattern on competitiveinteractions. Pages 203–224 in L. Hansson, L. Fahrig, andG. Merriam, editors. Mosaic landscapes and ecological pro-cesses. Chapman and Hall, London, UK.
Hanski, I. 1998. Metapopulation dynamics. Nature 396:41–49.
Harrison, S., and E. Bruna. 1999. Habitat fragmentation andlarge-scale conservation: what do we know for sure? Ecog-raphy 22:225–232.
Holt, R. D., J. H. Lawton, G. A. Polis, and N. D. Martinez.1999. Trophic rank and the species–area relationship. Ecol-ogy 80:1495–1504.
Jennersten, O. 1988. Pollination in Dianthus deltoides (Car-yophyllaceae): effects of habitat fragmentation on visita-tion and seed set. Conservation Biology 2:359–366.
Kareiva, P. 1990. Population dynamics in spatially complexenvironments: theory and data. Philosophical Transactionsof the Royal Society of London Series B, Biological Sci-ences 330:175–190.
Kareiva, P., and U. Wennergren. 1995. Connecting landscapepatterns to ecosystem and population processes. Nature373:299–302.
Kearns, C. A., D. W. Inouye, and N. M. Waser. 1998. En-dangered mutualisms: the conservation of plant–pollinatorinteractions. Annual Review of Ecology and Systematics29:83–112.
Keitt, T. H., D. L. Urban, and B. T. Milne. 1997. Detectingcritical scales in fragmented landscapes. ConservationEcology 1:1–17.[Online, URL: ^http://www.consecol.org/vol1/iss1/art4&.]
Klemm, M. 1996. Man-made bee habitats in the anthropo-genous landscape of central Europe—substitutes for threat-ened or destroyed riverine habitats? Pages 17–34 in A.Matheson, S. L. Buchmann, C. O’Toole, P. Westrich, andI. H. Williams, editors. The conservation of bees. AcademicPress, London, UK.
Krebs, C. J. 1989. Ecological methodology. Harper Collins,New York, New York, USA.
Kuster, H. 1999. Geschichte der Landschaft in Mitteleuropa.Beck, Munchen, Germany.
Menalled, F. D., P. C. Marino, S. H. Gage, and D. A. Landis.1999. Does agricultural landscape structure affect parasit-ism and parasitoid diversity? Ecological Applications 9:634–641.
Metzger, J. P. 2000. Tree functional group richness and land-scape structure in a Brazilian tropical fragmented land-scape. Ecological Applications 10:1147–1161.
Norton, M. R., S. J. Hannon, and F. K. A. Schmiegelow. 2000.Fragments are not islands: patch vs landscape perspectiveson songbird presence and abundance in a harvested borealforest. Ecography 23:209–223.
Osborne, J. L., S. J. Clark, R. J. Morris, I. H. Williams, J.R. Riley, A. D. Smith, D. R. Reynolds, and A. S. Edwards.1999. A landscape-scale study of bumble bee foragingrange and constancy, using harmonic radar. Journal of Ap-plied Ecology 36:519–533.
Osborne, J. L., I. H. Williams, and S. A. Corbet. 1991. Bees,pollination and habitat change in the European Community.Bee World 72:99–116.
O’Toole, C. 1993. Diversity of native bees and agroecosys-tems. Pages 169–196 in J. LaSalle and I. D. Gauld, editors.
1432 INGOLF STEFFAN-DEWENTER ET AL. Ecology, Vol. 83, No. 5
Hymenoptera and biodiversity. CAB International, Wal-lingford, UK.
Rathcke, B. J., and E. S. Jules. 1993. Habitat fragmentationand plant–pollinator interactions. Current Science 65:273–277.
Ricketts, T. H. 2001. The matrix matters: effective isolationin fragmented landscapes. American Naturalist 158:87–99.
Ricketts, T. H., G. C. Daily, P. R. Ehrlich, and J. P. Fay. 2001.Countryside biogeography of moths in a fragmented land-scape: biodiversity in native and agricultural habitats. Con-servation Biology 15:378–388.
Roland, J., and P. D. Taylor. 1997. Insect parasitoid speciesrespond to forest structure at different spatial scales. Nature386:710–713.
Saunders, D. A., R. J. Hobbs, and C. R. Margules. 1991.Biological consequences of ecosystem fragmentation: a re-view. Conservation Biology 5:18–32.
Sokal, R. R., and F. Rohlf. 1995. Biometry. Freeman, NewYork, New York, USA.
Statgraphics. 1995. Statgraphics plus for Windows, version2.1. Manugistics, Rockville, Maryland, USA.
Steffan-Dewenter, I., U. Munzenberg, and T. Tscharntke.2001. Pollination, seed set and seed predation on a land-scape scale. Proceedings of the Royal Society of LondonSeries B 268:1685–1690.
Steffan-Dewenter, I., and T. Tscharntke. 1999. Effects of hab-itat isolation on pollinator communities and seed set. Oec-ologia 121:432–440.
Steffan-Dewenter, I., and T. Tscharntke. 2000a. Butterflycommunity structure in fragmented habitats. Ecology Let-ters 3:449–456.
Steffan-Dewenter, I., and T. Tscharntke. 2000b. Resourceoverlap and possible competition between honey bees andwild bees in central Europe. Oecologia 122:288–296.
Stouffer, P. C., and R. O. Bierregaard. 1995. Effects of forestfragmentation on understory hummingbirds in AmazonianBrazil. Conservation Biology 9:1085–1094.
Thies, C., and T. Tscharntke. 1999. Landscape structure andbiological control in agroecosystems. Science 285:893–895.
Tischendorf, L., and L. Fahrig. 2000. On the usage and mea-surement of landscape connectivity. Oikos 90:7–19.
Tscharntke, T., I. Steffan-Dewenter, A. Kruess, and C. Thies.
2002. Contribution of small habitat fragments to conser-vation of insect communities of grassland–cropland land-scapes. Ecological Applications 12:354–363.
Turner, M. G., and R. H. Gardner. 1991. Quantitative methodsin landscape ecology. Springer, New York, New York,USA.
Turner, M. G., R. H. Gardner, and R. V. O’Neill. 2001. Land-scape ecology in theory and practice. Springer, New York,New York, USA.
van Nieuwstadt, M. G. L., and C. E. R. Iraheta. 1996. Re-lation between size and foraging range in stingless bees(Apidae, Meliponinae). Apidologie 27:219–228.
Visscher, K. P., and T. D. Seeley. 1982. Foraging strategy ofhoneybee colonies in a temperate deciduous forest. Ecology63:1790–1801.
von Drachenfels, O. 1996. Rote Liste der gefahrdeten Bio-toptypen in Niedersachsen—Bestandsentwicklung und Ge-fahrdungsursachen der Biotop- und Okosystemtypen sowieihrer Komplexe. Naturschutz und Landschaftspflege inNiedersachsen 34. Niedersachsisches Landesamt fur Oko-logie, Hannover, Germany.
Weibull, A.-C., J. Bengtsson, and E. Nohlgren. 2000. Di-versity of butterflies in the agricultural landscape: the roleof farming system and landscape heterogeneity. Ecography23:743–750.
Wesserling, J., and T. Tscharntke. 1995. Homing distancesof bees and wasps and the fragmentation of habitats. Mit-teilungen der Deutschen Gesellschaft fur Allgemeine undAngewandte Entomologie 10:323–326.
Westrich, P. 1996. Habitat requirements of central Europeanbees and the problems of partial habitats. Pages 1–16 in A.Matheson, S. L. Buchmann, C. O’Toole, P. Westrich, andI. H. Williams, editors. The conservation of bees. AcademicPress, London, UK.
Wiegand, T., K. A. Moloney, J. Naves, and F. Knauer. 1999.Finding the missing link between landscape structure andpopulation dynamics: a spatially explicit perspective.American Naturalist 154:605–627.
With, K. A., S. J. Cadaret, and C. Davis. 1999. Movementresponses to patch structure in experimental fractal land-scapes. Ecology 80:1340–1353.
With, K. A., and T. O. Crist. 1995. Critical thresholds inspecies’ responses to landscape structure. Ecology 76:2446–2459.