Embed Size (px)
Citation preview

i
SCALE-LEVEL FACTOR ANALYSES OF THE MACI AND MMPI-A WITH A COURT-
ORDERED ADOLESCENT SAMPLE
A DISSERTATION
SUBMITTED TO THE GRADUATE SCHOOL
IN PARTIAL FULFILLMENT OF THE REQUIREMENTS
FOR THE DEGREE OF
DOCTOR OF PHILOSOPHY
BY
BRITTNEY M. MOORE
BALL STATE UNIVERSITY
MUNCIE, INDIANA
DECEMBER 2018

ii
ABSTRACT
DISSERTATION: Scale-Level Factor Analyses of the MACI and MMPI-A with a Court-
Ordered Adolescent Sample
STUDENT: Brittney Moore M.A.
DEGREE: Doctorate of Philosophy
COLLEGE: Teachers College
DATE: December 2018
PAGES: 128
The current study examined the scale-level factor structure and canonical relationship of
two widely used measures of personality and psychopathology, the Minnesota Multiphasic
Personality Inventory – Adolescent (MMPI-A) and the Millon Adolescent Clinical Inventory
(MACI), with a mixed gender court-referred adolescent sample. Previous research has suggested
factors derived from scale-level factor analytic studies of the MMPI-A and MACI are useful as
they provide information about the structure and organization of the tools and the derived factors
can be used as an alternative interpretive approach. Previous factor analytic studies of the MACI
have found largely disparate results; therefore, the current study used confirmatory factor
analysis (CFA) in an attempt to replicate the most recent empirical factor-structure of the MACI
(Newman et al., 2015). Although the CFA of the current sample did not exactly fit the factor
structure identified by Newman et al. (2015), follow up exploratory factor analysis yielded a two
factor solution which was close to the Newman et al. (2015) findings. The current study lends
support to the idea the Personality Pattern and Clinical Syndrome scales of the MACI can be
collapsed into broad Externalizing and Internalizing factors for interpretation for a general court-
referred sample. Previous factor analytic studies of the MMPI-A found fairly consistent results

iii
and the current study expanded upon this research by replicating the factor structure previously
identified in the MMPI-A Structural Summary using confirmatory factor analysis with a mixed
gender sample from an array of court-referred placements while previous research has largely
focused on males from community, psychiatric, and secure detention settings. The current study
supports the use of the MMPI-A Structural Summary with a court-referred sample containing
both males and females. Results of canonical correlation analyses suggested a high degree of
shared variance between the MACI and MMPI-A for a court-referred sample; therefore, these
measures may be somewhat redundant measures for this population.

iv
ACKNOWLEDGMENTS
There are several individuals without whom the completion of this dissertation would not
have been possible. First and foremost, I must thank my advisor, Dr. Andrew Davis, for always
encouraging me to achieve to the highest of my abilities and creating opportunities for me to
grow as a professional. You have been an exceptional mentor and provided me with a
professional model to strive towards in my career. I will forever be grateful for the support,
encouragement, and inspiration you have provided me not only during my doctoral degree, but
also before I was officially one of your students.
I am also incredibly grateful for the other members of my dissertation committee Dr.
Janay Sander, Dr. W. Holmes Finch, Dr. Kristin Perrone-McGovern, and Dr. Thomas
Holtgraves. I am thankful for the opportunity to have worked with each of you and I greatly
appreciate the support and feedback you all have provided throughout my journey in this
doctoral program. Dr. Sander, thank you for allowing me the opportunity to join you in your
work at the Youth Opportunity Center and always advocating for your students’ needs. Dr. Finch
I greatly appreciate your teaching, assistance, and patience as I sent you an obscene number of e-
mails and struggled to complete the analyses for this dissertation. Without you this dissertation
would have never been possible.
To my fellow Ball State University students who have become some of my closest
friends, Kelly Hoover, Valerie Rice, and Kim Dell, without the three of you I would have never
survived these past five years. Kelly Hoover thank you for your companionship throughout this
graduate school journey and for always forcing me to make neuropsychology flashcards with
you. To my fellow Fraser interns, thank you for finishing your dissertations so quickly and

v
lighting the fire in me to finish this process. To my Fraser supervisors, especially Dr. Kim Klein,
thank you for your personal and professional support throughout this internship year.
To my family, both the one I was born to and the one I married into, thank you for your
love, support, encouragement, and patience. To my wonderful parents, Dennis and Julie Klauser,
thank you for always believing in me even when I did not believe in myself, encouraging me to
always work hard, and supporting me in pursuing my aspirations. I am fortunate to be part of
both the Klauser and Moore families as they have both been an integral part of my success.
Lastly, but possibly most importantly, thank you to my amazing husband Christopher
Moore for your support, patience, and the sacrifices you have made while I pursued this degree.
Thank you for always providing me with large amounts of coffee and Mountain Dew when I was
too tired to persist and large amounts of Thai food when I was hangry after a long day. Also, I
greatly appreciate that you only checked up on the status of this dissertation once every couple of
months and saved us both the awkward conversation about my progress.

vi
TABLE OF CONTENTS
ABSTRACT . . . . . . . . . . . . . . . . . . . . . . . . . . . . . . . . . . . . . . . . . . . . . . . . . . . . . . . . . . . . . . . . . ii
ACKNOWLEDGMENTS . . . . . . . . . . . . . . . . . . . . . . . . . . . . . . . . . . . . . . . . . . . . . . . . . . . . . . iv
LIST OF TABLES . . . . . . . . . . . . . . . . . . . . . . . . . . . . . . . . . . . . . . . . . . . . . . . . . . . . . . . . . . . viii
CHAPTER I. INTRODUCTION . . . . . . . . . . . . . . . . . . . . . . . . . . . . . . . . . . . . . . . . . . . . . . . . . . 1
Overview . . . . . . . . . . . . . . . . . . . . . . . . . . . . . . . . . . . . . . . . . . . . . . . . . . . . . . . . . . . . . . 1
Rationale and Significance of the Study . . . . . . . . . . . . . . . . . . . . . . . . . . . . . . . . . . . . . . 6
Research Questions . . . . . . . . . . . . . . . . . . . . . . . . . . . . . . . . . . . . . . . . . . . . . . . . . . . . . 10
CHAPTER II. REVIEW OF THE LITERATURE . . . . . . . . . . . . . . . . . . . . . . . . . . . . . . . . . . . 13
Overview of Personality Assessment . . . . . . . . . . . . . . . . . . . . . . . . . . . . . . . . . . . . . . . . 13
Millon Adolescent Clinical Inventory. . . . . . . . . . . . . . . . . . . . . . . . . . . . . . . . . . . . . . . 16
Minnesota Multiphasic Personality Inventory – Adolescent. . . . . . . . . . . . . . . . . . . . . . 30
Characteristics of Juvenile Justice Youth . . . . . . . . . . . . . . . . . . . . . . . . . . . . . . . . . . . . 37
Conclusions . . . . . . . . . . . . . . . . . . . . . . . . . . . . . . . . . . . . . . . . . . . . . . . . . . . . . . . . . . . 40
CHAPTER III. METHODOLOGY . . . . . . . . . . . . . . . . . . . . . . . . . . . . . . . . . . . . . . . . . . . . . . 42
Participants . . . . . . . . . . . . . . . . . . . . . . . . . . . . . . . . . . . . . . . . . . . . . . . . . . . . . . . . . . . 42
Procedures . . . . . . . . . . . . . . . . . . . . . . . . . . . . . . . . . . . . . . . . . . . . . . . . . . . . . . . . . . . 42
Instrumentation . . . . . . . . . . . . . . . . . . . . . . . . . . . . . . . . . . . . . . . . . . . . . . . . . . . . . . . . 44
Statistical Procedures and Data Analysis . . . . . . . . . . . . . . . . . . . . . . . . . . . . . . . . . . . . 58

vii
CHAPTER IV. RESULTS . . . . . . . . . . . . . . . . . . . . . . . . . . . . . . . . . . . . . . . . . . . . . . . . . . . . . 60
Descriptive Statistics . . . . . . . . . . . . . . . . . . . . . . . . . . . . . . . . . . . . . . . . . . . . . . . . . . . . 60
MACI Factor Analysis . . . . . . . . . . . . . . . . . . . . . . . . . . . . . . . . . . . . . . . . . . . . . . . . . . .67
MMPI-A Factor Analysis . . . . . . . . . . . . . . . . . . . . . . . . . . . . . . . . . . . . . . . . . . . . . . . . 72
Canonical Correlation . . . . . . . . . . . . . . . . . . . . . . . . . . . . . . . . . . . . . . . . . . . . . . . . . . . 77
CHAPTER V. DISCUSSION . . . . . . . . . . . . . . . . . . . . . . . . . . . . . . . . . . . . . . . . . . . . . . . . . . . .80
Summary of the Study . . . . . . . . . . . . . . . . . . . . . . . . . . . . . . . . . . . . . . . . . . . . . . . . . . 80
Discussion and Implications . . . . . . . . . . . . . . . . . . . . . . . . . . . . . . . . . . . . . . . . . . . . . . 84
Strengths and Limitations . . . . . . . . . . . . . . . . . . . . . . . . . . . . . . . . . . . . . . . . . . . . . . . 102
Directions for Future Research . . . . . . . . . . . . . . . . . . . . . . . . . . . . . . . . . . . . . . . . . . . 105
REFERENCES . . . . . . . . . . . . . . . . . . . . . . . . . . . . . . . . . . . . . . . . . . . . . . . . . . . . . . . . . . . . . 107

viii
LIST OF TABLES
Table 1 . . . . . . . . . . . . . . . . . . . . . . . . . . . . . . . . . . . . . . . . . . . . . . . . . . . . . . . . . . . . . . . . . . . . 62
Descriptive Statistics for the Sample
Table 2. . . . . . . . . . . . . . . . . . . . . . . . . . . . . . . . . . . . . . . . . . . . . . . . . . . . . . . . . . . . . . . . . . . . 62
DSM-IV-TR Primary Diagnosiss for the Sample
Table 3 . . . . . . . . . . . . . . . . . . . . . . . . . . . . . . . . . . . . . . . . . . . . . . . . . . . . . . . . . . . . . . . . . . . . 63
DSM-IV-TR Diagnoses for the Sample
Table 4 . . . . . . . . . . . . . . . . . . . . . . . . . . . . . . . . . . . . . . . . . . . . . . . . . . . . . . . . . . . . . . . . . . . . 65
Mean and Standard Deviation Statistics for the MACI
Table 5 . . . . . . . . . . . . . . . . . . . . . . . . . . . . . . . . . . . . . . . . . . . . . . . . . . . . . . . . . . . . . . . . . . . . 66
Mean and Standard Deviation Statistics for the MMPI-A
Table 6 . . . . . . . . . . . . . . . . . . . . . . . . . . . . . . . . . . . . . . . . . . . . . . . . . . . . . . . . . . . . . . . . . . . . 68
CFA Fit Statistics for the MACI
Table 7 . . . . . . . . . . . . . . . . . . . . . . . . . . . . . . . . . . . . . . . . . . . . . . . . . . . . . . . . . . . . . . . . . . . . 70
MACI Velicer’s MAP Test Factor Extraction
Table 8 . . . . . . . . . . . . . . . . . . . . . . . . . . . . . . . . . . . . . . . . . . . . . . . . . . . . . . . . . . . . . . . . . . . . 71
MACI Parallel Analysis
Table 9 . . . . . . . . . . . . . . . . . . . . . . . . . . . . . . . . . . . . . . . . . . . . . . . . . . . . . . . . . . . . . . . . . . . . 72
MACI EFA Structure Matrix & Communalities
Table 10 . . . . . . . . . . . . . . . . . . . . . . . . . . . . . . . . . . . . . . . . . . . . . . . . . . . . . . . . . . . . . . . . . . . 74
CFA Fit Statistics for the MMPI-A
Table 11 . . . . . . . . . . . . . . . . . . . . . . . . . . . . . . . . . . . . . . . . . . . . . . . . . . . . . . . . . . . . . . . . . . . 75
MMPI-A Factor Structure Correlation Coefficient for Valid Profiles

ix
Table 12 . . . . . . . . . . . . . . . . . . . . . . . . . . . . . . . . . . . . . . . . . . . . . . . . . . . . . . . . . . . . . . . . . . . 77
Canonical Correlations for Significant Dimensions
Table 13 . . . . . . . . . . . . . . . . . . . . . . . . . . . . . . . . . . . . . . . . . . . . . . . . . . . . . . . . . . . . . . . . . . . 78
Correlations Between Observed Variables and Their Canonical Variates

SCALE-LEVEL FACTOR ANALYSES 1
CHAPTER I
INTRODUCTION
Overview
Objective personality assessment tools are designed to measure personality
characteristics and psychopathology within an individual; however, the term objective can be
somewhat misleading given that the interpretation of the assessment is based on clinical
judgment (Lezak, Howieson, Bigler, & Tranel, 2012). The Millon Adolescent Clinical Inventory
(MACI; Millon, Millon, Davis, & Grossman, 1993) and the Minnesota Multiphasic Personality
Inventory – Adolescent (MMPI-A; Butcher et al., 1992) are objective measures designed to
assess personality characteristics and levels of psychopathology within adolescent samples and
they are two of the most frequently utilized self-report tools for assessing adolescents (Archer &
Newsome, 2000). Specifically, the MACI and the MMPI-A have gained significant attention
within forensic settings as the MMPI-A is the most often used self-report measure when
conducting evaluations in juvenile justice settings and the MACI is the second most widely
utilized for forensic evaluations (Archer, Buffinton-Vollum, Stredny, & Handel, 2006; Baum,
Archer, Forbey, & Handel, 2009). There is documented use of the MMPI-A in legal cases
addressing a number of issues including: competency to stand trial, transfer to adult status,
sentencing mitigation factors, and child-custody (O’Connor Pennuto & Arhcer, 2008).
For results from an assessment measure to be admissible within a court system the
assessment tool must reach specific standards, referred to as the Daubert Standards. Daubert v.
Merrell Dow Pharmaceuticals (1993) was a Supreme Court case that defined the standards that
must be met before an expert is allowed to present evidence in court based on a specific method
or technique. Two criteria generally must be met. First, the technique must be generally accepted

SCALE-LEVEL FACTOR ANALYSES 2
within the specialty area of the expert. Second, the technique or method must have a body of
published peer-reviewed research establishing its reliability and validity. As research has
indicated the MACI and MMPI-A are frequently used within forensic evaluations and within
adolescent populations in general, the first criteria can be considered met. The question that
arises is whether or not the extant literature on the MACI and MMPI-A is sufficient to meet the
second criteria.
There has been a large body of research published on the MMPI-A. Within the first 10
years after its publication 112 books, chapters, monographs, and articles referenced the MMPI-A
with an additional 57 publications emerging between 2003 and 2007 (Baum et al., 2009; Forbey,
2003). There has been substantially less research generated for the MACI than the MMPI-A;
however, there is a slowly growing body of literature on the MACI (Baum et al., 2009).
Woodland and colleagues (2014) argued the research to date on the validity and reliability of the
MACI has not yet reached the standards for educational and psychological assessment required
by the American Psychological Association (APA) and American Educational Research
Association (AERA; American Educational Research Association, American Psychological
Association, & National Council on Measurement in Education, 2014). Additionally, research on
both the MACI and MMPI-A is generally lacking for specific juvenile justice populations such
as females and pre-adjudication or civil forensic cases (Baum et al., 2009). According to Grisso
(2005) when making determinations about the clinical utility of an assessment for a juvenile
justice population, constructs, administration, norms, internal integrity, reliability, and validity
must be considered. Archer, Belevich, and Elkins (1994) emphasized that scale-level factor
analysis studies provide information about the structure and organization of an assessment,
which is of interest when there is substantial overlap in scale constructs, such as with the MACI

SCALE-LEVEL FACTOR ANALYSES 3
and MMPI-A. The MACI and the MMPI-A are both organized via groupings of scales with
individual scales within the group designed to measure specific constructs related to personality
and/or psychopathology. Some clusters of scales (such as the Personality Pattern scales from the
MACI and the Content scales from the MMPI-A) then have subscales designed to further tease
apart the larger construct. Despite the large body of research on the MMPI-A and the growing
research into the MACI, few factor analytic studies have been conducted to date. This is
problematic because clinicians interpret these measures based on the scale organization, yet little
research has examined the validity of this structure and organization.
The MACI has three Modifying Indices to measure the test-taking attitude of the
examinee, which is taken into consideration when evaluating the validity of the overall
assessment profile. Interpretation is then based on individual scale elevations for the Personality
Pattern, Expressed Concerns, and Clinical Syndromes scales. When a Personality Pattern scale is
elevated, the corresponding Grossman Facet scales can then be used to further delineate the trait
leading to elevated scores on the parent Personality Pattern scale. Results from factor analytic
studies on the MACI thus far have led to disparate results and raised a number of methodological
issues. The first independent factor analytic study of the MACI utilized a residential treatment
sample and was an exploratory factor analysis (EFA) at the scale-level. This study included all of
the scales of the MACI in one analysis (Romm, Bockian, & Harvey, 1999). A five-factor
solution accounting for 77.4% of the total variance emerged; however, orthogonal rotations were
used. Oblique rotations may be a better choice than orthogonal rotations for measures like the
MACI because orthogonal rotations have an underlying assumption of independence, an
assumption that is not met with the MACI due to the significant inter-scale correlations. Salekin
(2002) also completed an EFA of the MACI, but this study differed from Romm et al.’s (1999)

SCALE-LEVEL FACTOR ANALYSES 4
in that they used a sample of juvenile offenders and Salekin completed separate factor analyses
for the Clinical Syndrome, Personality Pattern, and Expressed Concerns scale groupings. As
Salekin (2002) also used orthogonal rotations, the same methodological critique can be applied
as with Romm et al.’s (1999) study. Adkisson, Burdsal, Dorr, and Morgan (2012) again
completed an EFA of the MACI; however, their study differed substantially from the previous
two studies in that it only used the Personality Pattern and Clinical Syndrome Scales, the sample
consisted of adolescents receiving psychiatric inpatient treatment, and they used oblique
rotations. For the combined EFA of the Personality Pattern and Clinical Syndrome scales a three-
factor solution emerged accounting for 82% of the total variance (Adkisson et al., 2012).
Newman, Larsen, Cunningham, & Burkhart (2015) emphasized the need for confirmatory
factor analysis (CFA) studies to validate the previously identified factor structures of the MACI
in order to make the factor structures more meaningful. As such, they utilized a sample of male
detainees to complete CFAs consistent with the methodologies employed in the three studies
discussed thus far (i.e. Adkisson et al., 2012; Romm et al., 1999; Salekin, 2002). Newman et al.’s
analyses revealed nonconvergence problems when following the Romm et al. (1999) and
Adkisson et al. (2012) methodologies and poor model fit when following the Salekin (2002)
methodology. Newman and colleagues (2015) followed up their analyses by completing an EFA
with the Personality Pattern and Clinical Syndrome scales. A two-factor solution had the best fit
with identified factors of Externalizing and Internalizing. Research completed with the MACI
thus far has not been able to validate a consistent organization and structure across samples due
to a number of reasons; however, many of these researchers have argued that a scale-level factor
structure would be useful in overall profile interpretation. If the two-factor structure derived by
Newman et al. (2015) is validated with additional research it could be argued that clinicians’

SCALE-LEVEL FACTOR ANALYSES 5
current method of interpretation is flawed as interpretation is currently based on examining
elevations on a large number of scales measuring specific characteristics.
Unlike the MACI, the MMPI-A manual does report a latent factor structure. The factor
analysis reported in the manual was a scale-level factor analysis which included 13 of the
MMPI-A scales (i.e. Validity and Clinical Scales) for the normative sample with analyses being
completed separately for males and females. Based on these analyses a four-factor solution (i.e.
General Maladjustment, Overcontrol, Si scale factor, and Mf scale factor) was found to fit best
for both males and females (Butcher et al., 1992). Archer, Belevich, and Elkins (1994)
completed a follow-up scale-level EFA with the normative sample combining both males and
females because gender differences were not previously found. Archer et al.’s (1994) analyses
differed from that published in the MMPI-A manual in that they included 69 scales and subscales
(i.e. seven validity scales, 10 Clinical Scales, 15 Content Scales, six Supplementary Scales, 28
Harris-Lingoes Subscales, & three Si subscales) in their analysis. An eight-factor solution (i.e.
General Maladjustment, Immaturity, Disinhibition/Excitatory Potential, Social Comfort, Health
Concerns, Naiveté, Familial Alienation, & Psychoticism) emerged accounting for 93.5% of the
total variance. Archer et al. (1994) concluded their scale-level analysis is useful in summarizing
clinical information from all of the scales as many of the scales are related and have overlapping
constructs. Based on this analysis the MMPI-A Structural Summary was created to aid clinicians
in interrupting overall MMPI-A profiles (Archer and Krishnamurthy, 1994). The Structural
Summary is a worksheet which can be completed to gain general descriptions and characteristics
for an individual based on elevations for each factor as scales cluster on a given factor, rather
than on individual scale elevations.
SCALE-LEVEL FACTOR ANALYSES 6
Archer and Krishnamurthy (1997) completed an EFA study of the MMPI-A with a
sample of adolescents receiving psychiatric treatment with the goal of determining if the factor
structure found by Archer et al. (1994) was supported within a clinical sample when following
the same methodology. Archer and Krishnamurthy (1997) found a nine-factor solution had the
best fit for their sample accounting for 75.6% of the variance. They concluded that seven of their
nine factors were very similar to seven of the factors from the Archer et al. (1994) study. Archer,
Bolinskey, Morton, and Farris (2002) completed the most recent scale-level factor analytic study
of the MMPI-A using a large sample of male detainees in an attempt to validate the factor
structure found by Archer et al. (1994) and Archer and Krishnamurthy (1997). As such, the exact
same methodology was followed as in the previous two studies and a seven-factor solution was
derived accounting for 79.1% of the total variance. This factor solution was very similar to that
found in the prior research (Archer et al., 2002). Research conducted thus far has generally
supported a consistent underlying factor structure of the MMPI-A which can be used to organize
the scales and subscales into a more concise structure of the overall measure. Given the fact that
so many of the MMPI-A scales are measuring similar constructs or contain overlapping items
these factors may be useful for clinicians in interpreting the overall profile and determining
which characteristics best describe their client; however, further research supporting this notion
is still needed.
Rationale and Significance of the Study
Review of the literature highlights the need for additional factor analytic studies of the
MACI as the majority of studies thus far have used substantially different methodology leading
to inconclusive findings. Even when the same methods were employed across studies, disparate
factor structures emerged. One of the primary goals of this study was to validate the factor

SCALE-LEVEL FACTOR ANALYSES 7
structure of the MACI found by Newman et al. (2015) within a court-referred, mixed gender
juvenile justice sample. The current sample differed from Newman et al.’s sample in that it
included those in detention in addition to adolescents in residential treatment and youth court-
ordered to have an outpatient evaluation. As such, those in the present sample in general will
likely have a lower level of criminal involvement. The sample also differed from Newman et
al.’s in demographic makeup. If the factor structure cannot be confirmed within the current
sample, a secondary goal was to determine what factor structure does fit for the given sample.
Although a more consistent factor structure has emerged for the MMPI-A, additional
confirmatory factor analysis studies are needed in order to validate the factors with up-to-date
and unique samples. Thus, a second primary goal of the current study was to replicate the factor
structure of the MMPI-A found in previous research. Specifically, a court-ordered juvenile
justice sample has unique characteristics and needs in comparison to the MMPI-A normative
sample. As such the validity of the factors used for interpretation in the Structural Summary need
to be examined for use with court-referred adolescents. Additionally, although the normative
sample was representative of the United States population at the time (1992), it is not necessarily
representative of today’s adolescents as the normative sample is more than 20 years old. Not
only has the United States demographic make-up shifted over the last 20 years, but the culture of
adolescents and their attitudes have also likely changed. Items on the MMPI-A considered
relevant to adolescents in the normative sample at the time it was created may be less relevant to
attitudes and problems of today’s youth. Some items have been rendered irrelevant due to
wording no longer commonly understood by youth, while others may be outdated due to
advances in technology. Similarly, the sample used by Archer and Krishnamurthy (1997) may
not be representative of today’s youth and their sample was not involved in the juvenile court

SCALE-LEVEL FACTOR ANALYSES 8
system. Additionally, the sample of the current study will differ from the most recent study
completed by Archer et al. (2002) in that the court-referred sample is not solely those who are in
secure detention, females will be included in the sample, and the ethnic make-up of the sample is
substantially different.
The last goal of the current study was to examine the degree to which the MMPI-A and
the MACI overlap in the constructs they are measuring. Although the measures posit to have
been developed for similar purposes, they differ in the underlying theory from which they were
derived and the methods used to develop the measures. It has been argued that further research is
still needed in order to determine if the MACI should be used as a complement to the MMPI-A
or as an alternative assessment to the MMPI-A when evaluating adolescents’ level of
symptomology as it remains unclear to what extent the two measures are evaluating the same or
different constructs (Baum et al., 2009). Adolescents in the present study were administered both
the MMPI-A and MACI which allows for analysis to determine if each measure is accounting for
unique variance in measuring adolescent personality characteristics and psychopathology or
whether the two measures are assessing virtually the same constructs.
Based on a review of the extant literature, there are two major methodological issues
which must be considered within the current study. The first issue highlighted is whether factor
analytic studies of the MMPI-A and MACI should be completed with item-level responses or
scale-level scores. Archer, Belevich, and Elkins (1994) highlight that item-level factor analytic
studies provide information about the psychometric properties of an inventory and is useful for
the development of new scales while scale-level factor analytic studies provide information
about the structure and organization of the inventory’s scales which is of interest when there is
substantial overlap in the constructs the scales are measuring. It is important to note that neither
SCALE-LEVEL FACTOR ANALYSES 9
the MMPI-A nor the MACI scales were developed using a factor analytic approach and instead
items were assigned to scales based on their theoretical relevance to the scale’s designated
construct. Previous research on both the MACI and the MMPI-A has suggested scale-level factor
analytic studies have clinical utility as they provide summary data of the information from the
scales which is useful due to the significant overlap of the constructs measured across scales.
Both the MMPI-A and the MACI have been criticized for the level of item overlap across scales.
Researchers whom have completed scale-level factor analyses argue that the derived factors have
clinical utility in interpreting the subject’s overall personality and level of psychopathology.
Archer and Krishnamurthy (1994) developed the MMPI-A Structural Summary based on a scale-
level factor analysis which was designed to help clinicians interpret the results of the overall
MMPI-A profile. Romm and colleagues (1999) developed what they called personality
prototypes which resulted from a scale-level factor analysis and they believed the prototypes
provided information that allowed for a better understanding of the “interplay” among the scales
and allowed users of the MACI to make predictions about “behaviors, attitudes, and problems
associated” with a given profile (p. 142). Similarly, Salekin (2002) concluded MACI scales can
be combined to create composite indices for interpretation of the overall profile based on scale-
level factor analyses. As such, these studies were not simply validation studies of the underlying
factor structure of the measures, but they were also focused on improving the manner in which
psychologists use the assessment tools clinically. Furthermore, item-level factor analyses of the
MACI have led to uninterpretable results due to the substantial item overlap and the
unconventional scoring protocol (Newman et al., 2015). As such, the present study employed
scale-level factor analyses as opposed to item-level analyses.

SCALE-LEVEL FACTOR ANALYSES 10
The second issue of note based on previous research is scale selection. The previous
literature has been widely disparate in the scales chosen to include in the factor analyses. As
such, factor analytic studies with the MMPI-A and MACI tend to result in different identified
factor structures. For the MACI, there has been a recent attempt to validate the previously
defined factor structures by following the methodology of prior studies; however, results were
not consistent with the previous research (Newman et al., 2015). The current study used the same
scales from the MACI (i.e. Personality Pattern and Clinical Syndrome scales) as Adkisson et al.
(2012) and Newman et al. (2015) in order to be consistent with the previous line of research and
to allow for comparisons across samples. For the MMPI-A, three previous scale-level factor
analytic studies found a similar factor structure (i.e., Archer et al., 1994; Archer et al., 2002;
Archer & Krishnamurthy, 1997). The current study will use 69 scales and subscales (i.e. seven
validity scales, 10 Clinical Scales, 15 Content Scales, six Supplementary Scales, 28 Harris-
Lingoes Subscales, and three Si subscales) as outlined in those previous studies in an attempt to
validate the identified seven-factor solution with a modern court-referred sample.
Research Questions
1. Does the two-factor model of the MACI Personality Pattern (i.e. Introversive, Inhibited,
Doleful, Submissive, Dramatizing, Egotistic, Unruly, Forceful, Conforming,
Oppositional, Self-Demeaning, & Borderline Tendency) and Clinical Syndrome scales
(i.e. Eating Dysfunctions, Substance-Abuse Proneness, Delinquent Predisposition,
Impulsive Propensity, Anxious Feelings, Depressive Affect, and Suicidal Tendency)
identified in previous research (Newman et al., 2015) fit for a court-referred juvenile
justice sample when using a confirmatory factor analysis?
SCALE-LEVEL FACTOR ANALYSES 11
a. If the two-factor internalizing and externalizing model identified by Newman et
al. (2015) does not fit the current study’s court-referred juvenile justice sample,
what model has the best fit based on an exploratory factor analysis of the
Personality Pattern and Clinical Syndrome scales with the current sample?
2. Does the eight-factor solution of the 69 MMPI-A scales and subscales (i.e. seven validity
scales, 10 Clinical Scales, 15 Content Scales, six Supplementary Scales, 28 Harris-
Lingoes Subscales, and three Si subscales) identified in previous research (i.e., Archer et
al., 1994; Archer et al., 2002; Archer & Krishnamurthy, 1997) fit for a court-referred
juvenile justice sample when using a confirmatory factor analysis?
a. If the eight-factor solution identified in previous research does not fit the current
study’s court-referred juvenile justice sample, what model has the best fit based
on an exploratory factor analysis of the 69 scales and subscales with the current
sample?
3. Based on canonical correlations between the MMPI-A Clinical (10 scales; i.e. Scale 1 –
Hypochondriasis, Scale 2 – Depression, Scale 3 - Hysteria, Scale 4 – Psychopathic
Deviate, Scale 5 – Masculinity-Femininity, Scale 6 - Paranoia, Scale 7 - Psychasthenia,
Scale 8 - Schizophrenia, Scale 9 - Hypomania, and Scale 0 – Social Introversion) and
Content scales (15 Scales; Anxiety, Obsessiveness, Depression, Health, Alienation,
Bizarre Mentation, Anger, Cynicism, Conduct Problems, Low Self-Esteem, Low
Aspirations, Social Discomfort, Family Problems, School Problems, and Negative
Treatment Indicators) and the MACI Personality Pattern (12 scales; i.e. Introversive,
Inhibited, Doleful, Submissive, Dramatizing, Egotistic, Unruly, Forceful, Conforming,
Oppositional, Self-Demeaning, & Borderline Tendency) and Clinical Syndrome scales (8

SCALE-LEVEL FACTOR ANALYSES 12
scales; i.e. Eating Dysfunctions, Substance-Abuse Proneness, Delinquent Predisposition,
Impulsive Propensity, Anxious Feelings, Depressive Affect, and Suicidal Tendency) what
is the degree of shared variance between these two measures?

SCALE-LEVEL FACTOR ANALYSES 13
CHAPTER II
REIVEW OF THE LITERATURE
Overview of Personality Assessment
Personality assessment tools are designed to provide information about “one’s
characteristic way of thinking, feeling, and behaving” (Segal & Coolidge, 2004; p. 3). Some
personality measures solely examine enduring personality traits while other tools, often also
referred to as personality assessments, measure both personality and psychopathology. There are
two broad categories of personality tests: projective and objective. Projective personality
assessments allow for open-ended responses to fairly ambiguous stimuli (Lezak et al., 2012).
Examples of projective personality assessment tools include the Thematic Apperception Test
(TAT; Murray & Bellak, 1973) and the Rorschach Inkblot Test (Rorschach, 1945). The
assumption behind projective personality assessments is that the client will project his or her
thoughts, feelings, or experiences onto the ambiguous stimuli of the test (Lezak et al., 2012).
Objective personality tests are generally self-report measures administered in a paper and pencil
format; although many are now also available via computer administration (Sattler & Hoge,
2006). Examples of objective personality tools for use with adolescents include the Millon
Adolescent Clinical Inventory (MACI; Millon et al., 1993) and the Minnesota Multiphasic
Personality Inventory- Adolescent (MMPI-A; Butcher et al., 1992) among many others. Most
objective personality measures present the examinee with statements to which they respond with
a fixed answer, such as true or false (Sattler & Hoge, 2006). Lezak and colleagues (2012) caution
that the term “objective” can be misleading as although the format of the test is objective and
fixed responses are used, the interpretation of the results is still based on clinician judgment.

SCALE-LEVEL FACTOR ANALYSES 14
The use of objective personality assessments dates back to World War I when the
Woodworth Personal Data Sheet was developed as a paper and pencil measure of emotional
fitness (Woodworth, 1920). Since then a wide range of objective personality assessment tools
have been developed. One distinction between tests is the degree to which the test is designed to
measure typical personality traits versus assessing pathological characteristics (Sattler & Hoge,
2006). A second major distinction between tests is whether the tool is designed to measure only a
single psychological trait (such as the Beck Depression Inventory [Beck & Steer, 1987] which
assesses only depressive symptoms) or a wide range of psychological constructs (such as the
MMPI-A; Segal & Coolidge, 2004). Lastly, the basis by which the test was constructed can vary
as objective personality measures are usually created using a specific theoretical basis, an
empirical method (i.e. a specific statistical method such as factor analysis), or they are
diagnostically based in order to determine if a specific mental health condition is present (Segal
& Coolidge, 2004).
Assessment of personality, personal adjustment, and emotional functioning is an essential
component of an overall psychological or neuropsychological evaluation. In both psychological
and neuropsychological assessment the referral question is often to provide a differential
diagnosis, to determine if some type of cognitive impairment is present, and/or to determine how
the cognitive impairment affects a patient’s functioning for the purpose of developing
interventions. In order to determine whether or not cognitive impairment is present the clinician
must first determine the client’s level of emotional functioning and personality characteristics in
order to ascertain how these factors may be affecting his or her cognitive functioning (Lezak et
al., 2012). Lezak and colleagues (2012) emphasize that this is especially important in
neuropsychological assessment as “almost every neurological and neuropsychological symptom
SCALE-LEVEL FACTOR ANALYSES 15
imaginable can be a manifestation of personality or emotional dysfunction just as well as a bona
fide symptom of central nervous system disease” (p. 804). Additionally, as many personality
inventories are designed to illicit psychological symptomology and personality characteristics
that align with mental health criteria essential for diagnosis, these assessments can provide a
wide range of information useful in the diagnosis and differentiation of conditions. Assessment
of personality is also useful within a therapeutic setting as it can provide the therapist with a
wealth of information about the client’s psychological adjustment, enduring personality
characteristics, and presenting symptoms as they will need to be addressed in sessions and how
they may affect treatment outcomes. Personality assessment can be especially helpful when
working with resistant clients, clients who have difficulty putting their psychological state into
words, or those who are slow to disclose information.
Several factors can affect the validity of an objective personality assessment. First, the
validity of the results is dependent on the degree to which the individual understood the
statements and interpreted their meaning as was intended; therefore, the validity of an objective
self-report personality measure is reliant on the readability of the measure (Sattler & Hoge,
2006). This is especially important when evaluating children and adolescents as the clinician
administering the assessment needs to first assure the youth has an adequate reading level for the
measure as personality assessments vary in the reading level at which they were wrote. A second
factor affecting the validity of the results is the examinee’s response style (Sattler & Hoge,
2006). Respondents may intentionally present themselves in an overly positive or negative light
due to some secondary incentive. Additionally, examinees may have a general inclination to
respond with agreement or disagreement to items regardless of the item content (Sattler & Hoge,
2006). The threats to test validity based on response style are generally addressed within self-

SCALE-LEVEL FACTOR ANALYSES 16
report personality measures by validity scales or indices which assess the examinees response
bias. Lezak and colleagues (2012) stress that many patients, especially those with true
neurological dysfunction, may lack the insight to acknowledge their own symptoms or short-
comings on a self-report measure leading to an under reporting of symptoms.
Millon Adolescent Clinical Inventory
The MACI (Millon et al., 1993) is an assessment tool designed to be used by mental
health professionals to assist in “identifying, predicting, and understanding a wide range of
psychological attributes characteristic of adolescents” (Millon & Davis, 1993; p. 571). It is
specifically designed as a clinical assessment tool to be used in mental health settings as opposed
to with a non-clinical population (Millon & Davis, 1993). The MACI is frequently used in
juvenile justice settings (Baum et al., 2009) and for forensic evaluations as it has been found to
be the second most widely used self-report measure after the MMPI-A when conducting forensic
evaluations with adolescents (Archer, Buffinton-Vollum, Stredny, & Handel, 2006).
Furthermore, one-third of all publications referencing the MACI before 2009 revolved around
the use of the MACI within a forensic setting (Baum et al., 2009). There has been substantially
more published research on the MMPI-A than the MACI; however, there appears to be an
increasing amount of research conducted with the MACI (Baum et al., 2009).
Millon’s Theory of Personality and Psychopathology.
The MACI is based on a theory of personality and psychopathology developed by
Theodore Millon (Davis, 1999). Millon believed the field of psychology needed a unified theory
of personality to guide our classification system of mental disorders and he thought that this set
of diagnostic guidelines would then allow for the development of scientifically based assessment
tools which could in turn be used to test the developed unified personality theory (Davis, 1999).

SCALE-LEVEL FACTOR ANALYSES 17
Millon emphasized the need for empirically based assessment tools aligned with the nosology of
the field of psychology to derive targeted intervention and treatment (Davis, 1999).
Originally, Millon proposed a Biosocial Model (Millon, 1969) in which he indicated an
individual’s “biophysical constitution” (e.g. the individual’s temperament, intelligence, sensory
activity, etc.) and past experiences (e.g. experiences that aid a person in discovering what they
find rewarding and how to achieve rewarding feelings) were the determinants of personality style
(Davis, 1999; p. 332). The Biosocial Model framed the understanding of personality and
psychopathology as questions of 1) what an individual finds reinforcing, 2) where they attempt
to find the rewarding feelings, and 3) what an individual will do to obtain reinforcement (Davis,
1999).
In 1990 Millon re-evaluated his theory to include the principles of evolution (Davis,
1999). Within Millon’s Evolutionary Model of personality (Millon, 1990) it is suggested a
person has a limited number of genes and trait potentials that can be expressed by those genes
(Davis, 1999). As the individual goes throughout their life they learn from their experiences
which interactional styles are best suited for their environment and this in turn shapes the
person’s way of “perceiving, feeling, thinking, and acting” (Davis, 1999; p. 334). The interaction
between biological forces and social experiences causes a person to adapt in specific ways which
lead to the different Personality Styles outline by Millon (Davis, 1999). As such, personality
disorders are then seen as maladaptive ways of navigating and relating to the environment
(Davis, 1999).
Millon proposed that personality development as it relates to his Evolutionary Model
depends on the individual’s tendencies on three dimensions or polarities (Tringone & Bockian,
2015). The first polarity, aim of existence, is a dichotomy between seeking pleasurable

SCALE-LEVEL FACTOR ANALYSES 18
experiences or experiences that enhance life and avoiding pain or events that terminate life
(Davis, 1999; Tringone & Bockian, 2015). The second polarity, modes of adaption, focuses on
the polarity between trying to passively fit in (e.g. ecological accommodation) and wanting to
change pieces of the larger environmental context to better fit the individual (e.g. ecological
modification; Davis, 1999; Tringoone & Bockian, 2015). The third polarity is the pull between
focusing on self-actualization and encouraging of others, and it can be viewed as the source a
person uses to obtain reinforcement (Davis, 1999; Tringone & Bockian, 2015). A fourth polarity
of thinking and feeling was also outlined; however, Millon emphasized this polarity more in his
cognitive-neuroscience models than when discussing his personality theories (Davis, 1999).
Millon “asserted that deficiencies, imbalances, conflicts, and structural defects that arise among
these polarities can serve as the foundation for understanding what he terms “personality
prototypes” which closely correspond to the Diagnostic and Statistical Manual of Mental
Disorders, Fourth Edition (DSM-IV; American Psychiatric Association [APA], 1994)
personality disorders; however, Millon viewed his personality prototypes as more of heuristic
constructs than a diagnostic entity itself (Davis, 1999; p. 336). Millon viewed personality traits
as falling along a continuum and within each person the trait can be normal, intermediate, or
pathological (Stefurak, Calhoun, & Glaser, 2004).
Based on his Biosocial Model and his subsequent Evolutionary Model of personality,
Millon described a series of developmental stages, adapting aspects from Freud’s psychosexual
stages and Erikson’s psychosocial tasks (Davis, 1999). Millon proposed that development is
bidirectional as genetic factors and psychosocial factors influence one another. He emphasized
the idea that sensitive periods are present in which a given stimuli will have a different effect on
SCALE-LEVEL FACTOR ANALYSES 19
personality at different periods of a person’s life (Davis, 1999). Millon’s four polarities as
outlined above correspond to his four developmental stages.
History and Development of the Millon Inventories.
Millon “altered the adolescent personality assessment landscape with the introduction of
the Millon Adolescent Personality Inventory” in 1982 (MAPI; Millon, Green, & Meagher, 1982;
Tringone & Bockian, 2015, p. 566). The MAPI contained 150 items for an adolescent between
the ages of 13 and 18 years old to respond to in a true/false manner. The MAPI was different
from other adolescent personality measures of the time as it was specifically developed and the
items written for the use with adolescents versus being a downward extension of an adult
measure (Tringone & Bockian, 2015). Another critical feature of the MAPI was that it had two
normative samples (nonclinical and clinical), so that the examiner could compare their subject to
a representative sample based on the setting in which they were administering the assessment
(Tringone & Bockian, 2015). Furthermore, Millon indicated the constructs measured on the
MAPI were not normally distributed; therefore, instead of using statistical cutoffs Millon tied
scores to base rates of disorders within the given population (i.e. community or clinical;
Tringone & Bockian, 2015). As Millon revised his personality theory to align with the
publication of the Diagnostic and Statistical Manual of Mental Disorders, Third Edition Revised
(DSM-III-R; APA, 1987) and clinician critiques which asked for clinical diagnostic scales (e.g.
anxiety, depression, etc.) Millon undertook a significant revision of the MAPI which resulted in
the creation of the MACI (Millon et al., 1993; Tringone & Bockian, 2015). The changes from
the MAPI to the MACI included significant item revision as only 50 of the original items
remained, a new solely clinical normative sample as opposed to the community and clinical
samples available for the MAPI, the addition of four new Personality Patterns scales, five new
SCALE-LEVEL FACTOR ANALYSES 20
Clinical Syndrome scales (i.e. anxiety, depression, disordered eating, substance use, and
suicidality), and three Modifying Indexes which adjust the score profile interpretation based on
the examinees approach to responding to the items (Tringone & Bockian, 2015). The MACI can
be thought of as being divided into two sets of clinically meaningful scales; one set assesses
more transient mental health conditions which correspond to DSM-IV-TR (APA, 2000) Axis I
conditions while the second set assesses more enduring personality characteristics which
correspond to Axis II symptomology (McCann, 1997).
The MACI has been deemed to be a very useful assessment measure and it is commonly
used in the assessment of adolescents in forensic settings to aid in psychological assessment and
treatment planning for complex, troubled youth (McCann, 1997; Salekin, 2002). Millon (1993)
argued that for an assessment tool, such as the MACI, to give an adequate clinical picture it
needed to take into account developmental issues, comorbidity of disorders, the relationship
between Axis I mental health conditions and the emergence of personality styles during the teen
years, and issues which are particularly relevant to adolescents (Millon, 1993). Salekin (2002)
stressed that when providing information to judges in juvenile forensic cases it may be more
useful and meaningful to provide the judge with a summary of clinical personality functioning
based on measures such as the MACI which can help provide information relevant to treatment
issues and treatment recommendations as opposed to formal diagnoses that judges may not fully
understand.
Development of the MACI was “informed by several post-MMPI psychometric
developments” and validation of the MACI occurred in three sequential stages: theoretical-
substantive, internal-structural, and external-criterion (Millon & Davis, 1993; p. 570). The MACI
and its scales were not developed based on factor analytic techniques. According to Millon and

SCALE-LEVEL FACTOR ANALYSES 21
Davis (1993), the three stage approach to validation allows the test developers to address the
issue of validity from the beginning of development to insure the assessment tool’s validity as
opposed to waiting until the measure is constructed and then testing its validity. During the
theoretical-substantive stage of development a pool of items was created based on Millon’s
theories of personality and items were then sorted into theoretically based categories by eight
psychology professionals (Millon & Davis, 1993). The items not sorted to the proper scale by at
least six of the eight professionals were then eliminated. Items with less than a .30 correlation
with their theoretically based scale were also eliminated from the item pool (Millon & Davis,
1993). Items were again sorted by psychology professionals, and any items not sorted by at least
75% of the professionals were eliminated from the item pool (Millon & Davis, 1993). Actuarial
base rate normative data were then created based on a sample of 700 adolescents from outpatient,
residential, or other mental health centers (Millon & Davis, 1993). These base-rate comparisons
are made by both age and sex in order to maximize sensitivity of the measure for the individual
being assessed (Millon & Davis, 1993).
Factor Analytic Studies of the MACI.
The MACI manual provides little information about the latent factor structure of the
assessment and since the publication of the MACI over 20 years ago very few factor analytic
studies have been published on the measure. It has been suggested the sparsity of factor analytic
studies may partially be due to the substantial item overlap of the scales, the unusual approach to
scoring in which items are weighted and contribute to scales to varying degrees, and the
uncommon assessment development techniques employed (Newman et al., 2015). As the MACI
was designed for use with a clinical population the factor analysis studies have focused on
juvenile offenders, adolescents in residential treatment, and those in acute psychiatric

SCALE-LEVEL FACTOR ANALYSES 22
hospitalization. The emerging factor structures varied from study to study due partly to
differences in the MACI scales included in the analysis and the statistical techniques employed.
Tringone & Bockian (2015) suggested varying factor structures may also be due to the unique
mental health characteristics of youth in residential treatment in comparison to juvenile offenders
who have been detained.
Romm and colleagues (1999) completed the first independent exploratory factor analysis
study of the MACI and the first study examining its utility with a residential treatment sample (n
= 251). Participants were between the ages of 13 and 19 years old, and 63.7% were male. In
regards to ethnicity, 23.9% were Anglo European, 49% were African American, 26.3% were
Hispanic American, and .8% were Asian American. Romm et al. used all (31) of the MACI
scales to perform a principal components factor analysis. Orthogonal rotation with Kaiser
Normalization was completed in order to arrive at a five-factor solution accounting for 77.4% of
the total variance. The five factors that emerged were labeled Defiant Externalizers,
Intrapunitive Ambivalents, Inadequate Avoidants, Self-Deprecating Depressives, and Reactive
Abused. The researchers viewed these factor groupings as personality prototypes and concluded
that the prototypes were consistent with their past clinical experiences and representative of the
problems commonly occurring in adolescents in residential treatment (Romm et al., 1999).
Romm and colleagues (1999) believed the prototypes which resulted from the factor analysis
provided information that allowed for a better understanding of the “interplay” among the scales
and allowed users of the MACI to make predictions about “behaviors, attitudes, and problems
associated” with a given profile (p. 142).
Salekin (2002) completed the first published study examining the factor structure of the
MACI using EFA within a juvenile offender sample (n = 250). The average participant age was
SCALE-LEVEL FACTOR ANALYSES 23
14.95 years (SD = 1.43 years) and 68.4% of participants were male (Salekin, 2002). In regards to
ethnicity, 40% were Hispanic American, 34.8% were African American, 10.8% were Anglo
American, 8.4% were Haitian American, and 6% were biracial. Salekin’s factor analytic study
differed from Romm and colleagues (1999) in that instead of completing one factor analysis with
all of the scales combined, Salekin (2002) did three separate factor analyses for the Clinical
Syndrome, Personality Pattern, and Expressed Concern scales separately in order to be consistent
with the theoretical underpinnings of the MACI as viewing these three areas as separate
dimensions; however, both studies were similar in that they utilized principal axis factoring with
orthogonal rotations. A two-factor solution emerged for the Clinical Syndrome scales accounting
for 66.2% of the variance (Salekin, 2002). The first factor was labeled Depressed Mood with the
scales Depressive Affect, Suicidal Tendency, and Eating Dysfunctions loading on it and the
second factor was labeled Psychopathic Precursors with the scales Delinquent Predisposition,
low levels of Anxious Feelings, and Impulsive Propensity loading on it. Substance-Abuse
Proneness loaded on both factors. A two-factor solution also emerged for the Personality Patterns
scales accounting for 67.8% of the variance. Six of the 12 scales loaded on the first factor which
represented characteristics of inhibition, abasement, downheartedness, and introversion. Three of
the other 12 scales comprised the second factor and represented the characteristics of
forcefulness, unruly, and dominance. The Expressed Concerns scales also had a two-factor
solution, labeled Identity Confusion and Social Sensitivity, accounting for 54.4% of the total
variance. Salekin (2002) postulated that the derived factor structure from scale-level analysis
provided clinicians a way to summarize overall profile results, which would provide a clearer
understanding of adolescents’ symptoms as they cluster together. Specifically, Salekin concluded
that in juvenile justice settings the MACI Clinical Syndrome scales could be combined into two

SCALE-LEVEL FACTOR ANALYSES 24
composites reflected by the two factors derived (i.e. Depressed Mood and Psychotic Precursors;
Salekin, 2002). The Personality Patterns and Expressed Concerns scales also resulted in two
composites each. Salekin (2002) argued these composites provided important status information
about adolescents at intake to a juvenile justice program which could be used to make treatment
determinations and identify “management concerns (risk for institutional infractions and suicidal
ideation)” (p. 27).
Adkisson and colleagues (2012) completed an exploratory factor analytic study of the
MACI Personality Pattern scales and Clinical Syndrome scales with a psychiatric inpatient
sample of 331 adolescents (age: M = 14.9 years, SD = 1.43 years). 43.2% of the sample was male
and ethnic identification was 79% Caucasian, 6.3% African American, 4.8% Hispanic, .9%
Asian, and .6% other (Adkisson et al., 2012). Adkisson et al.’s factor analysis of the MACI
differed from previous factor analysis studies of the time (e.g. Romm et al. 1999; Salkin, 2002)
in that it utilized oblique rotations instead of orthogonal rotations. Rotations are utilized in factor
analysis after factor extraction procedures in order to “maximize high correlations between
factors and variables and minimize low ones” (Tabachnick & Fidell, 2013; p. 625). Orthogonal
rotations have an underlying assumption of independence. In other words, it assumes the factors
are not related. Conversely, oblique rotations should be used when factors are correlated
(Tabachnick & Fidell, 2013). According at Adkisson et al. (2012) because Millon created the
MACI scales to have inter-scale correlations in accordance with the theoretical degree of overlap
between the characteristics being measured, oblique rotations should be used instead of
orthogonal rotations because the assumption of independence between the factors cannot be
made. In order to determine the appropriate number of factors, three different statistical analyses
were used: minimum average partials, parallel analysis, and Cattell’s scree test (Adkisson et al.,

SCALE-LEVEL FACTOR ANALYSES 25
2012). Unlike Salekin (2002), Adkisson and colleagues (2012) combined the Personality Patterns
and Clinical Syndrome scales for analysis. A three-factor solution (i.e., Demoralization, Acting
Out, and Detached) was created based on the Principal Analysis method and accounted for 82%
of the total variance (Adkisson et al., 2012). Regression analysis was used to calculate overall
factor scores on the MACI and the factor scores were then correlated with the Clinical Scales of
the MMPI-A (Butcher et al., 1992). Analysis revealed seven of the 10 Clinical Scales of the
MMPI-A had large correlations with the Demoralization factor of the MACI, the Acting Out
factor significantly correlated with the Psychopathic Deviate (.33) and Mania (.44) scales, and
the Detached factor had the most overlap with the Depression, Psychasthenia, and Social
Introversion sales of the MMPI-A (Adkisson et al., 2012).
All of the MACI factor analytic studies discussed thus far were exploratory factor
analyses (EFA) and they examined the factor structure from scale-level instead of item-level
analysis. According to Newman et al. (2015) the factor analysis studies by Romm et al. (1999),
Salekin (2002), and Adkisson et al. (2012) highlight several methodological decisions or issues
that must be addressed when attempting to complete a factor analysis on the MACI. First, as
each of the studies discussed chose different sets of scales to include in their analysis and
diverged on whether to use separate factor analysis for each set of scales or to run the analysis
with the scales all together, Newman and colleagues (2015) emphasized the need to have more
research examining scale selection. A second issue identified is that all studies prior to Newman
et al. (2015) were EFA and they differed on the statistical methods they used making it difficult
to make cross study comparisons. Newman and colleagues (2015) emphasized the need for
confirmatory factor analysis (CFA) studies to validate the previously identified factor structures
and make them more meaningful. Furthermore, as mentioned above, the three factor analytic

SCALE-LEVEL FACTOR ANALYSES 26
studies discussed thus far included scale-level analyses; however, because of the substantial item
overlap in scales and the unconventional scoring protocol it is unclear how this will affect a
factor analysis of item-level responses (Newman et al., 2015).
One of the only item-level factor analyses completed to date was a dissertation by
Carrillo (2004). The sample consisted of 450 severely emotionally disturbed adolescents.
Participants were European American (74%), African American (11%), Hispanic American
(6%), and biracial or other (9%). Carrillo (2004) attempted to validate Millon’s overall scale
structure by performing an item-level CFA; however, the model was not supported with
Carrillo’s sample calling into question the structural validity of the MACI. A scale-level EFA
was also completed with all of the scales combined which revealed a five-factor solution
commensurate with that reported by Romm et al. (1999; Carrillo, 2004). When analyzing the
clusters of scales separately (i.e. PP, CS, and EC) a two-factor solution similar to Salekin (2002)
was found for each domain (Carrillo, 2004).
Woodland et al. (2014) used CFA in an attempt to validate the 27 scale factor structure of
the MACI with a solely African American male sample of adolescents court-referred for
evaluation due to juvenile offense charges (n = 496). Item-level CFAs were completed for all 27
scales using raw scores. None of the 27 scale CFAs produced a good model fit (Woodland et al.,
2014). The results found by Woodland and colleagues (2014) were found to be consistent with
the dissertation completed by Carrillo (2004).
Newman and colleagues (2015) attempted to address the methodological issues identified
above in order to provide clarity in examining the factor structure of the MACI. The participants
included 1,015 adolescent males detained in a secure facility (age: M = 16.2 years; SD = 1.5
years; Newman et al., 2015). The sample’s ethnicity was self-reported as White (49.7%), African

SCALE-LEVEL FACTOR ANALYSES 27
American (47.6%), Biracial (1.4%), Hispanic (.9%), and other (.5%). The sample was randomly
split into two groups (Group 1: n = 505; Group 2: n = 510) with Group 1 being used for EFA to
validate prior EFA studies and Group 2 being used to cross-validate the results from Group 1
EFA using a CFA (Newman et al., 2015). Newman and colleagues (2015) first attempted to
complete a CFA with item-level responses instead of scale-level analysis; however, the results
were uninterpretable due to lack of convergence in the model. Next, Newman et al. (2015) used
Group1 to run CFAs consistent with the methodologies employed in previous studies (i.e.
Adkisson et al., 2012; Romm et al., 1999; Salekin, 2002) in an attempt to validate previous
results. Results from the CFAs consistent with the Adkisson et al.’s (2012) and Romm et al.’s
(1999) methodologies had nonconvergence problems; therefore, information about the model fit
could not be determined. In regards to Salekin et al.’s (2002) methodology, poor model fit was
noted for Newman et al.’s (2015) sample indicating that none of the prior factor structures
identified fit for the Group 1 sample. As such, an EFA with Group 1 was then completed using
the Personality Patterns and Clinical Syndrome scales using an oblique rotation (consistent with
Adkisson et al.’s 2012 EFA methodology with differences in retention criteria). The EFA
revealed a two-factor model, Internalizing and Externalizing factors, had the best fit (Newman et
al., 2015). CFA was then used with Group 2 to cross-validate the two-factor solution; however,
the CFA suggested misspecification and subsequent revisions to the model allowing for
theoretically related scales to covary were made to increase the model fit (Newman et al., 2015).
The two-factor structure of the model of Internalizing and Externalizing factors remained after
revision and the two factors were found to be inversely related as they were “slightly” negatively
correlated and review of the scale coefficients suggested an inverse relationship with the two
factors representing poles of the same construct (Newman et al., 2015). Newman and colleagues

SCALE-LEVEL FACTOR ANALYSES 28
(2015) suggested this finding is due to “less than ideal structural validity of the MACI” (p. 1030)
with their sample of male detainees and concluded that the internal structure of the MACI “does
not translate to numerous diagnostic categories as posited by Millon’s theory” (p. 1033).
Cluster Analysis Studies of the MACI.
In addition to the factor analytic studies discussed above, cluster analysis studies have
been completed primarily focusing on juvenile offenders (Stefurak & Calhoun, 2007; Stefurak et
al., 2004; Taylor, Kemper, Loney, & Kistner, 2006). Cluster analysis studies are exploratory
studies which attempt to group cases or individuals together based on the degree to which they
are similar to each other and distinct from other others based on multivariate data patterns
(Overall, Gibson, & Novy, 1993). Stefurak and colleagues (2004) sought to explore the use of
the MACI in identifying personality typologies within a sample of male juvenile offenders.
Stefurak et al. (2004) used hierarchical cluster analysis to develop personality typologies based
on the MACI Personality Pattern scales. The sample consisted of 103 male juvenile offenders in
detention (age: M = 15.43 years, SD = 1.05). Participants were African American (60.2%), White
(35%), and other ethnicity (2.9%). A four-cluster solution was chosen (Stefurak et al., 2004). The
first cluster represented youth whose personality pattern showed a “disregard for the rights of
others, superficial emotionality, and oppositional behavior” and represented a highly
externalizing group (Stefurak et al., 2004; p. 107). The second cluster group had similar
characteristics to the first cluster group, but they tended to have less severe problems (Stefurak et
al., 2004). The third cluster was characterized by those individuals with no clinically significant
concerns, who tended to follow the rules, and wished to blend in with others (Stefurak et al.,
2004). The fourth cluster of youth tended to internalize more and presented as “depressive,
emotionally ambivalent, and insecure” (Stefurak et al., 2004; p. 107). Interestingly, Stefurak and

SCALE-LEVEL FACTOR ANALYSES 29
colleagues (2004) found that 70% of their sample fell within the third or fourth cluster
suggesting the majority of the sample had more internalizing than externalizing symptomology.
The researchers suggested two main points from their results. First, youth presenting for similar
problematic behaviors respond fairly differently on the MACI suggesting a wide range of factors
may lead to the same problematic behaviors (Stefurak et al., 2004). Second, as the cluster groups
derived were unique in their characteristic elevations despite the youth presenting with similar
behavior problems and Behavioral Assessment System for Children – Self Report of Personality
(BASC-SRP; Reynolds & Kamphaus, 1992) elevations, the usefulness of the MACI as a
theoretically based measure for the development of recommendations and treatment planning
was highlighted (Stefurak et al., 2004).
Taylor et al. (2006) conducted a cluster analysis study with a sample similar to Stefurak
et al.’s (2004); however they used the Personality Patterns scales and the Clinical Syndromes
scales whereas Stefurak and colleagues used only the Personality Patterns scales. Taylor et al.
(2006) also indicated their sample committed more severe offenses than Taylor et al.’s (2006)
sample. Taylor and colleagues (2006) sample consisted of 654 males in residential treatment due
to juvenile justice placement (age: M = 16.03 years, SD = 1.31). Analyses revealed five-clusters
(i.e. Impulsive/Reactive, Anxious/Inhibited, Psychopathy, Conforming, & Unremarkable).
Findings were similar to Stefurak et al.’s (2004) in that clusters were characterized by
psychopathic, impulsive, and anxious/depressed traits (Taylor et al., 2006). There was also a
group which was largely characterized by lack of scale elevations on both the Personality
Patterns and Clinical Syndromes scales (Taylor et al., 2006). Taylor et al. (2006) interpreted their
results in line with Stefurak et al.’s conclusion that the MACI has clinical utility in classifying
personality and clinical symptom characteristics in a way which can aid treatment planning.
SCALE-LEVEL FACTOR ANALYSES 30
Stefurak and Calhoun (2006) deployed similar techniques as Stefurak et al. (2004) to
examine the usefulness of the MACI in providing cluster groupings for female juvenile
offenders. The sample consisted of 101 female adolescent offenders (age: M = 14.82, SD = 1.13).
The sample was African American (69%) and White (31%) in ethnicity. In comparison to the
previous study with male offenders, Stefurak and Calhoun (2006) found a three-cluster solution
to fit best for female offenders. The first group, labeled Externalizing Problems, displayed the
most antisocial tendencies (Stefurak & Calhoun, 2006). The second group,
Depressed/Interpersonally Ambivalent, was representative of females who had been victimized
in the past and those who had significant family discord (Stefurak & Calhoun, 2006). The last
cluster, Anxious Prosocials, was characterized by females who engaged in delinquent behavior
due to “normative adolescent psychological processes, i.e. anxiety, peer concerns and sexual
insecurity” (Stefurak & Calhoun; 2006; p. 106). The researchers suggested this emphasized the
need to highlight differential processes that result in problematic behavior for males and females
when engaging in clinical work (Stefurak & Calhoun, 2006).
Minnesota Multiphasic Personality Inventory – Adolescent
The MMPI-A is the most commonly used self-report assessment tool with adolescents
(Archer & Newsome, 2000) and it is frequently used by psychologists in the forensic assessment
of adolescents (Archer et al., 2006). There is documented use of the MMPI-A in legal cases
addressing competency to stand trial, transfer to adult status in evaluation, sentencing mitigation
factors, and child-custody (O’Connor Pennuto & Archer, 2008). The MMPI-A has also
generated significant research as in the first 10 years after it was published 112 books, chapters,
monographs, and articles referenced the MMPI-A with the majority of those publications
addressing methodological concerns (Forbey, 2003). Between Forbey’s review of the literature
SCALE-LEVEL FACTOR ANALYSES 31
in 2003 and Baum and colleagues (2009) review of the literature through 2007, 57 additional
publications were found suggesting the body of literature on the MMPI-A is continuing to grow.
History and Development of the MMPI-A.
The first edition of the Minnesota Multiphasic Personality Inventory (MMPI; Hathaway
& McKinley, 1943) was released in 1943 after Hathaway and McKinley identified the need for
an objective survey method which would allow clinicians to gather a large amount of
information about clients within a group format, in a short period of time (Cox, Weed, &
Butcher, 2009). Another goal of the MMPI was to use the assessment tool to determine a
definitive diagnosis that was reliable due to the objective format (Cox et al., 2009). Development
of the inventory began by creating a pool of around 1,000 items based on case studies, textbooks,
and other symptom inventories of the time (Cox et al., 2009). These items were then narrowed
down to 504 items that were then given to about 1,500 adults who were visitors of psychiatric
inpatients and 221 adults receiving psychiatric inpatient treatment (Cox et al., 2009). Scales for
the MMPI were developed using an “empirical keying method” in which responses for each item
were compared between the nonclinical and the clinical sample that consisted of individuals
from eight different diagnostic categories (Cox et al., 2009; p. 251). Those items that
distinguished between the different groups were then allocated to a scale which lead to the
development of the eight original Clinical Scales that were named based on the clinical diagnosis
elevations on the given scale identified (Cox et al., 2009). Shortly after the publication of the
MMPI, the Social Introversion scale was created and 13 years after the release of the MMPI the
Masculinity-Femininity scale was developed leading to the finalization of the 10 Clinical Scales
(Cox et al., 2009). Additional scales of the MMPI, including Content Scales and Supplementary
Scales, were developed over the years using the existing inventory items (Cox et al., 2009).

SCALE-LEVEL FACTOR ANALYSES 32
Although the MMPI was normed for the exclusive use with adults, research focused on
using the MMPI with an adolescent population began before the MMPI was formally released
(Capwell, 1945). As the MMPI continued to be used in adolescent personality research and
emerging research showed adolescents responded differently than adults on the MMPI items,
Marks and Briggs developed adolescent norms for the MMPI (Cumella & Lafferty O’Connor,
2009; Marks, Seeman, & Haller, 1974). Marks and Briggs normative sample consisted of 1,800
adolescents between the ages of 12 and 18 years, and separate norms were provided for males
and females (Cumella & Lafferty O’Connor, 2009). Code types for adolescents based on Marks
and Briggs norms were created and later research continued to focus on the development of
additional adolescent norms (e.g. Colligan & Offord, 1989; Gottesman, Hanson, Kroeker, &
Briggs, 1987). A survey completed in 1991 showed that a significant number of clinicians who
regularly assessed adolescents were using the MMPI as an objective assessment tool with
adolescents despite the lack of standard adolescent norms (Archer, Maruish, Imhof, &
Piotrowski, 1991). This was a significant concern as the following issues had been identified in
using the MMPI with adolescents: 1) a need for item revision to make the items more appropriate
for adolescents, 2) the development of a set of standard norms that was nationally and ethnically
representative of the contemporary adolescent population, 3) a need for scales which assess
issues related to being an adolescent, and 4) development of guidelines on how to interpret score
profiles for adolescents (Archer, 2005). When the MMPI was revised and the MMPI-2 (Butcher,
Dahlstrom, Graham, Tellegen, & Kaemmer, 1989) was developed the MMPI-2 Standardization
Committee debated whether to develop adolescent norms for the MMPI-2 or develop a separate
adolescent measure and eventually they decided to create the MMPI-A (Buam et al., 2009).
SCALE-LEVEL FACTOR ANALYSES 33
During the process of developing the MMPI-A (Butcher et al., 1992) 154 new items were
written specifically for the use with adolescents (Cumella & Lafferty O’Connor, 2009) and an
additional 70 items were rewritten to eliminate obsolete and sexist language. Those 70 items
which were reworded were found to be psychometrically stable as they did not lead to
adolescents responding in a significantly different manner in comparison to the previous items
(Archer & Gordon, 1994). These new items along with the original MMPI items were
administered to about 2,500 adolescents; however, about one-third of the respondents had to be
removed from the sample due to their age or due to having an invalid profile (Cumella &
Lafferty O’Connor, 2009). This left a normative sample of 1,620 adolescents, which was
ethnically similar to the U.S. population at the time but over representative of adolescents from
college educated families (Butcher et al., 1992). The resulting inventory contained 478 items
designed to assess psychopathology in 14 to 18 year olds across a number of settings including
outpatient treatment, residential treatment, inpatient mental health facilities, academic settings,
and forensic settings (Cumella & Lafferty O’Connor, 2009). The MMPI-A items were written at
a seventh grade reading level.
Factor Analytic Studies of the MMPI-A.
The factor structure as reported in the MMPI-A manual was based on a principal
components analysis of 13 scales (not an item-level analysis) completed with the normative
sample for males and females separately (Butcher et al., 1992). The analysis revealed a four-
factor structure fit best for both males and females with the factors being labeled: General
Maladjustment, Overcontrol, and two factors with specific loadings for only the Social
Introversion and Masculinity-Femininity scales (Butcher et al., 1992).

SCALE-LEVEL FACTOR ANALYSES 34
Archer, Belevich, and Elkins (1994) used the normative sample to complete both an item-
level factor analysis and a scale-level factor analysis. Due the fact that the factor structure
reported in the MMPI-A manual (Butcher et al., 1992) did not show gender differences, Archer
et al. (1994) decided to complete their analysis with the genders combined into one group. For
the item-level analysis, principal components analysis was employed and both oblique and
orthogonal rotations were used and compared with a final decision being made to use the oblique
rotation (Archer et al., 1994). A 14-factor solution (i.e. General Maladjustment, Developmental
Symptomology, Adolescent Vigor, Sociability, Stereotypic Femininity, Cynicism, Somatization,
Delinquency, Psychotic Dyscontrol, Depression, Familial Discord, Academic Interests,
Paresthesia, & Hostility) was chosen as having the best fit as it included 81% of the inventory’s
items and accounted for 44% of the variance in responses (Archer et al., 1994). The same
procedures were then followed for an analysis of the 69 scales and subscales (i.e. seven validity
scales, 10 Clinical Scales, 15 Content Scales, six Supplementary Scales, 28 Harris-Lingoes
Subscales, & three Si subscales) of the MMPI-A. The scale-level analysis revealed an eight-
factor solution (i.e. General Maladjustment, Immaturity, Disinhibition/Excitatory Potential,
Social Comfort, Health Concerns, Naiveté, Familial Alienation, & Psychoticism) accounting for
93.5% of the variance in raw scores on the scales and subscales. Archer and colleagues (1994)
argue their scale-level factor analysis cannot be directly compared to prior scale-level studies
because they used all 69 scales and subscales whereas previous studies have focused on the
validity and Clinical Scales. It was concluded that the scale-level analysis is helpful in
summarizing the clinical information from all of the scales as many of the scales are highly
related and have overlap in the constructs they are measuring (Archer et al., 1994). Based on the
factor structure derived from this study, Archer and Krishnamurthy (1994) developed the MMPI-

SCALE-LEVEL FACTOR ANALYSES 35
A Structural Summary which is designed to help clinicians interpret the results of the overall
profile in a way that consolidates the redundant information captured across scales by examining
the Clinical, Content, and Supplementary scales together. The approach of the Structural
Summary is empirically driven as it is based solely on the factor analysis completed by Archer et
al. (1994). The Structural Summary is a copyrighted worksheet published by Psychological
Assessment Resources, Inc. The first part of the Structural Summary form summarizes response
validity information. The next section has each of the eight factors listed with the scales and
subscales that correspond to that factor and these scales are presented in descending order based
on their correlation with the given factor (Archer & Krishnamurthy, 1994). General descriptions
and characteristics for individuals based on elevations on each factor are then used to aid in
interpretation once the Structural Summary worksheet is completed.
Archer and Krishnamurthy (1997) completed an exploratory factor analysis with a
sample of 358 adolescents receiving psychiatric treatment in a variety of settings including
inpatient, outpatient, residential, and day treatment (age: M = 15.06 years, SD = 1.46 years). The
goal of the study was to determine if the factor structure identified by Archer et al. (1994) using
the normative sample would be supported within a clinical sample when using the same scale-
level analysis method (Archer & Krishnamurthy, 1997). For Archer and Krishnamurthy’s
clinical sample, a nine-factor solution emerged accounting for 75.6% of the variance in scale and
subscale raw score differences. The researchers concluded seven of the factors were very similar
to Archer et al.’s (1994) scale-level factors (Archer & Krishnamurthy, 1997).
Archer and colleagues (2002) attempted to replicate the factor structure derived by
Archer et al. (1994) and Archer and Krishnamurthy (1997) with a sample of 1,587 male juvenile
delinquents (age: M = 14.88 years; SD = 1.3 years). The sample’s ethnic composition was Black

SCALE-LEVEL FACTOR ANALYSES 36
(51%), White (47.7%), Hispanic (0.9%), Native American (0.1%), Asian (0.3%), and other
(0.1%). The same factor-analytic methodology was followed as outlined in the above studies (i.e.
Archer et al., 1994; Archer & Krishnamurthy, 1997). A seven-factor solution was derived from
the sample accounting for 79.1% of the total variance in scale raw scores (Archer et al., 2002).
This factor solution was very similar to those previously found with the normative sample.
McCarthy and Archer (1998) conducted a factor analytic study using the normative
sample; however, their study differed from those discussed thus far in that they focused solely on
the MMPI-A Content Scales and they performed their analysis separately for males and females
to evaluate for gender differences. Four separate factor analyses were conducted as males and
females were examined separately for the normative sample and as a combined group and the
clinical sample was evaluated using combined genders. The results of the scale-level factor
analysis revealed a two-factor solution (i.e. General Maladjustment and Externalizing
Tendencies) for the male normative group and the combined clinical sample while a one-factor
solution fit best for the female only normative group and the combined normative sample. The
one-factor solution that emerged was inconsistent with previous studies conducted on the MMPI-
2 Content Scales and the authors concluded the one-factor solution was found due to a
statistically weak second factor (McCarthy & Archer, 1998). The second goal of McCarthy and
Archer’s study (1998) was to complete item-level factor analyses of each individual Content
Scale due to the development of the Content Component Scales being derived to provide
additional information for interpretation of the issues causing an elevation on a parent Content
Scale. It was found that most of the Content Scales when analyzed at the item-level had a one-
factor solution which opposes the idea of having Content Component Scales which break the
Content Scales into two to four factors for interpretation purposes.

SCALE-LEVEL FACTOR ANALYSES 37
Characteristics of Juvenile Justice Youth
The sample of the present study was comprised of juveniles who have been court-ordered
to have a psychological evaluation. All of the youth receiving court-ordered evaluations were
involved in the juvenile justice system; however, the youth varied on the setting through which
they received the evaluation as those from outpatient services, residential treatment, and juvenile
detention were included. The juvenile justice population is a unique group of youth which differs
from the general population by demographic makeup, mental health needs, family risk factors,
and cognitive and academic abilities.
Statistics published by the Federal Bureau of Investigation shows that juveniles under the
age of 18 are responsible for 14% of all arrests within the United States (Federal Bureau of
Investigation, 2009). It is estimated that everyday over 70,000 juvenile offenders are living in a
placement outside their normal home such as a detention center, correctional facility, or other
residential facility (Office of Juvenile Justice and Delinquency Prevention [OJJSP], 2011);
however, the number of youth in out of home placement has declined by about 50% since 1997
(OJJDP, 2016). Two-thirds of juveniles detained in such facilities are held for non-violent
offenses including: property offenses, drug offenses, public order offenses, probation violations,
and status offenses (offenses which if committed by an adult would not be considered violating a
law, such as truancy or running away; Sickmund, Sladky, Kang, & Puzzanchera, 2011).
Significant gender differences have been found between males and females in the
juvenile justice system. Females account for slightly more than 25% of all delinquency cases
within the court system (OJJDP, 2015). However, females account for only 14% of juvenile
justice youth who are in an out of home placement (OJJDP, 2016). Males are not only over
represented in residential placements, but they also tend to be kept in an out of home placement

SCALE-LEVEL FACTOR ANALYSES 38
for a longer period of time than females (OJJDP, 2016). The National Council on Crime and
Delinquency (2007) report ethnic minority youth are over-represented in the juvenile justice
system. During 2013, 62% of delinquency cases were accounted for by white youth, 35% were
African American, 2% were American Indian, and 1% was Asian American (OJJDP, 2015). The
general ethnic makeup of juveniles in the United States for the same year was 76% white, 16%
African American, 2% American Indian, and 6% Asian American (OJJDP, 2015). Ethnic
minority youth make up 68% of juveniles placed outside the home and African American males
are especially over-represented (OJJDP, 2016).
Lyons, Baerger, Quigley, and Griffin (2001) suggest that two-thirds of juvenile justice
youth in out of home placement and half of all youth on probation meet criteria for a serious
mental health disorder. Contradictory to the high rates of mental health conditions within the
juvenile justice population as a whole, identification of mental health needs and treatment within
juvenile justice youth has yet to become standard practice (New Freedom Commission of Mental
Health, 2003). Within detention centers high rates of conduct disorder, substance abuse,
depression, anxiety, attention-deficit/hyperactivity disorder, psychotic disorders, and sleep
disorders are found (Pyle, Flower, Fall, & Williams, 2016). Rates of conditions vary across
placement setting; youth placed in the community on probation tend to display significantly less
substance use problems and fewer mental health needs than youth detained or placed in
residential treatment (Lyons et al., 2001). Research has found gender differences in the types of
mental health conditions found within juvenile offending samples, with females demonstrating
more internalizing problems than males (Travis, 1999). Further research has indicated that
although females have more internalizing concerns, males and females have the same level of
externalizing issues (Cauffman, Piquero, Broidy, Espelage, & Mazerrolle, 2004). Consistent with

SCALE-LEVEL FACTOR ANALYSES 39
these findings, at the time of admittance into a residential treatment facility females were shown
to have significantly more mental health concerns than males and meet criteria for more
diagnoses than males (Handwerk et al., 2006; Pyle et al., 2016). Specifically, females were more
often diagnosed with anxiety and depression than males; however, there were no gender
differences found in the diagnosis of substance use disorders or disruptive behavior disorders
(Handwerk et al., 2006). Although females were found to have more mental health diagnoses and
needs at admittance to the residential facility, both males and females showed significant
reductions in internalizing (i.e. anxiety and depression) and externalizing symptoms (i.e.
substance use and disruptive behavior) within a year of starting the program. At the time of
discharge clinicians were asked to rate each juvenile’s success in completing treatment and in
general females were rated as being more successful in their treatment than males (Handwerk et
al., 2006).
Many youth who come into contact with the court system have significant family
dysfunction and conflict as part of their daily lives. Connor, Doerfler, Toscano, Volungis, and
Steingard (2004) found high rates of family dysfunction including parental substance use,
violence, and physical and sexual abuse within their sample of youth in residential treatment.
Gavazzi (2006) discovered females in particular who come into contact with the court system
report more disruptive family processes than their male counterparts. This is of importance
because prior research has found negative family factors is a risk-factor for the development of
mental health concerns whereas warm and intimate family relationships can serve as a protective
factor against internalizing and externalizing issues (Dekovic, Buist, & Reitz, 2004; Gavazzi,
2006). Lyons et al. (2001) found that most juvenile justice youth had their biological mother in
the home; however, less than one-fourth of those youth had their biological father in the home.

SCALE-LEVEL FACTOR ANALYSES 40
Furthermore, fewer youth within correctional facilities and court-ordered residential treatment
were in the guardianship of a parent at the time of entry into the system as compared to those
referred for probation (Lyons et al., 2001). Juveniles in residential treatment facilities were found
to have the highest rate of previous physical and/or sexual abuse (Lyons et al., 2001).
Youth from detention centers typically have intelligence quotients between standard
scores of 70 to 100 (Pyle et al., 2016) with detained males having lower IQ scores than detained
females (Pardini, Lochman, & Frick, 2003). Youth in detention also have weaker language
abilities than the general population (Pyle et al., 2016). Consistent with these findings, detained
youth’s academic achievement is generally below grade level. These youth often perform one
standard deviation below average on standardized achievement tests and are more likely to
receive special education services than their non-detained peers (Pyle et al., 2016).
Conclusions
Objective assessments of personality and psychopathology have a long history of use in
identifying how a person thinks, feels, and generally interacts with the world (Segal & Coolidge,
2004). Personality measures have clinical utility in quantifying symptoms and in assisting
clinicians with differential diagnosis. Personality assessment tools are also useful for therapists
who are interested in gaining a better understanding of their clients’ personality, level of personal
adjustment, and social-emotional functioning. As youth who are involved in the court system
have complex mental health needs, personality assessment tools can assist clinicians in
identifying this unique population’s requirements for treatment. However, because court-referred
youth differ from the general population by demographic makeup, mental health needs, family
risk factors, and cognitive and academic abilities personality assessment measures used with a
juvenile justice population require validity and reliability research with this specific sample. The

SCALE-LEVEL FACTOR ANALYSES 41
MACI and the MMPI-A both have unique strengths and weaknesses as measures of personality
and psychopathology in their use with a court-referred juvenile justice population. The MMPI-A
has been much more widely researched than the MACI and the MMPI-A still outranks the MACI
in clinical use (Archer & Newsome, 2000). However, both measures would benefit from
additional research especially given the fact that the normative samples for both measures are
now over 20 years old and few factor analytic studies have been conducted since the measures’
publication. Additionally, research specifically focused on the utility of the MACI and MMPI-A
with juvenile justice youth is warranted given the unique demographics and family backgrounds
of court-referred youth and their unique mental health and educational needs. One of the biggest
strengths of the MMPI-A as opposed to the MACI are the well validated scales used to evaluate
the validity of the examinee’s responses (Baum et al., 2009). This is especially important when
working with a court-referred group who may often be guarded and not necessarily willing to
engage in the assessment process in the same way a community sample would seek assessment.
On the other hand, one of the most significant strengths of the MACI is the assessment item
brevity while at the same time maintaining an ability to predict “selected outcome criteria with
moderate to large effect sizes in a manner similar to the results achieved for the MMPI-A”
(Baum et al., 2009; p. 397). Further research is still needed in order to determine if the MACI
should be used as a complement to the MMPI-A or as an alternative assessment to the MMPI-A
when evaluating adolescents’ level of symptomology as it remains unclear to what extent the two
measures are evaluating the same or different constructs (Baum et al., 2009). This issue will be
addressed by the third research question.

SCALE-LEVEL FACTOR ANALYSES 42
CHAPTER III
METHODOLOGY
This chapter is organized into five sections: 1) Participants; 2) Procedures; 3)
Instrumentation; 4) Statistical Procedures and Data Analysis; and 5) Description of the Sample.
The purpose of this chapter is to describe the participant recruitment and selection process, the
procedures used for data collection, and the instruments that were used to collect the data. This
study evaluatde data collected as part of a larger study investigating cognitive functioning and
academic performance of a court-referred juvenile justice sample.
Participants
All data for the current study were collected through an archival records review. The
participants were 370 adolescents who had been court-ordered for a psychological assessment for
the purpose of informing placement decisions by the court. All assessments were conducted at a
Midwestern residential treatment facility between 2007 and 2013. Participants ranged in age
from 13 to 17 years old. Adolescents with incomplete Minnesota Multiphasic Personality
Inventory – Adolescent (MMPI-A; Butcher et al., 1992) and Millon Adolescent Clinical
Inventory (MACI; Millon et al., 1993) profiles were excluded from the study. The University
Internal Review Board’s permission was sought and received to complete this study.
Procedures
The University Internal Review Board (IRB) granted permission to conduct the original
study of which the current study is an extension. Approval was also sought and received from the
management team, including an institutional compliance officer and the psychological services
supervisor, of the residential treatment facility. All data were collected through an archival
records review overseen by the primary investigator (Dr. Janay Sander). Mrs. Brittney Moore
SCALE-LEVEL FACTOR ANALYSES 43
was listed as a student assistant on this original study and assisted in the records review and data
entry process. A list of individuals who had received a psychological evaluation at the residential
treatment facility between 2007 and 2013 was generated by the facility. Research assistants
retrieved records for each individual on the list to obtain demographic information, Diagnostic
and Statistical Manual of Mental Disorders, Fourth Edition, Text Revision (DSM-IV-TR;
American Psychiatric Association, 2000) diagnoses, and assessment results. Assessment batteries
administered varied across participants; however, most files contained cognitive (e.g. Wechsler
Intelligence Scales for Children, Fourth Edition [WISC-IV; Wechsler, 2003], Kaufman
Assessment Battery for Children, Second Edition [KABC-II; Kaufman & Kaufman, 2004a],
Stanford-Binet Intelligence Scales, Fifth Edition [SB-V; Roid, 2003] or Woodcock-Johnson Tests
of Cognitive Abilities, Third Edition [WJ-COG-III; Woodcock, McGrew & Mather, 2001a]),
achievement (e.g. Wechsler Individual Achievement Test, Third Edition [WIAT-III; The
Psychological Corporation, 2009], Kaufman Test of Educational Achievement, Second Edition
[KTEA-II; Kaufman & Kaufman, 2004b], or Woodcock-Johnson Tests of Achievement, Third
Edition [WJ-COG-III; Woodcock, McGrew & Mather 2001b]), and personality/psychopathology
data (e.g. Behavior Assessment System for Children, Second Edition [BASC-2; Reynolds &
Kamphaus, 2003], Minnesota Multiphasic Personality Inventory, Adolescent [MMPI-A; Butcher
et al., 1992], Millon Adolescent Clinical Inventory [MACI; Millon et al., 1993], and/or
Personality Assessment Inventory [PAI; Morey, 1991]). The order and number of testing sessions
in which assessments were administered is unknown. All assessments were administered by
individuals with the appropriate training to conduct psychological assessments, including
graduate students in psychology training programs placed at the agency for practicum, doctoral
level interns, post-doctoral psychology staff, or licensed psychologists. All evaluations

SCALE-LEVEL FACTOR ANALYSES 44
completed by non-licensed students or staff were conducted under the supervision of licensed
psychologists at the agency. Information retrieved from files was transferred onto de-identified
data sheets which were transported to the University for data entry and storage. All data were
then entered into a SPSS database (IBM Corp, 2015) and were double checked by a second
research assistant to ensure the accuracy and integrity of the data in the database.
Instrumentation
Millon Adolescent Clinical Inventory.
Description. The MACI is a paper and pencil self-report measure of psychopathology
that adolescents complete independently in a one-on-one setting with an examiner. The
residential treatment facility used the Q-Global scoring software to generate interpretive reports
for each individual. Unlike other assessment measures for adolescents which were developed as
a downward extension from a measure created for use with adults, the MACI was designed to
use with individuals 13 to 19 years of age for the purpose of identifying problematic areas of
functioning unique to adolescents and assist in clarifying diagnostic symptoms to aid treatment
planning. The MACI consists of 160 items which are written at a sixth grade reading level
(Millon et al., 1993). The MACI contains a total of 31 scales divided into four broad categories:
Personality Patterns (12 scales), Expressed Concerns (8 scales), Clinical Syndromes (7 scales),
and Modifying Indices (4 scales). Each scale contains between 16 and 48 items. Due to the large
number of scales and limited number of items on the MACI, there is substantial overlap in the
items used on each scale; however, items contribute to scales to varying degrees by having items
weighted differently per scale depending on their relevance to the scale construct and its degree
of correlation with the overall scale score (McCann, 2006). In other words, each item has a scale

SCALE-LEVEL FACTOR ANALYSES 45
to which it primarily contributes and then it may have secondary and tertiary contributions on
other scales to a lesser degree.
The Personality Patterns scales (PP; i.e. Introversive, Inhibited, Doleful, Submissive,
Dramatizing, Egotistic, Unruly, Forceful, Conforming, Oppositional, Self-Demeaning, &
Borderline Tendency) are the scales that align with the personality prototypes identified in
Millon’s (1993) theory of personality and they are designed to identify an individual’s enduring
characteristics. Stefurak and colleagues (2004) noted it is important to remember that because
stable personality characteristics are still developing during the adolescent years the scales
should be used cautiously in making interpretations about enduring personality characteristics,
but they acknowledge that the PP scales provide clinically useful information especially due to
the fact that personality characteristics are examined separately from diagnostic symptomology
and common adolescent issues. The Expressed Concerns (EC) scales provide information about
the examinee’s level of concern regarding common issues that many adolescents face and the
scales include Identify Confusion, Self-Devaluation, Body Disapproval, Sexual Discomfort, Peer
Insecurity, Social Insensitivity, Family Discord, and Childhood Abuse. The Clinical Syndromes
(CS) scales provide information about symptomology related to specific mental health conditions
which include the following scales: Eating Dysfunctions, Substance-Abuse Proneness,
Delinquent Predisposition, Impulsive Propensity, Anxious Feelings, Depressive Affect, and
Suicidal Tendency. The Modifying Indices (MI; i.e. Disclosure, Desirability, & Debasement) are
scales designed to identify the examinee’s test-taking approach to modify the scale
interpretations and make them more clinically meaningful based on how the examinee generally
responded to the test items. The MI scales can be thought of as the validity indices of the MACI.

SCALE-LEVEL FACTOR ANALYSES 46
The Grossman Facet Scales are more recently available to further delineate problematic areas of
functioning identified on the PP scales (McCann, 1997).
Normative Sample. The MACI normative data were based on 1,017 adolescents between
the ages of 13 and 19 years of age. Although the test is designed to be used with adolescents 13
to 19 years of age, using the assessment with 18 and 19 year olds has been deemed problematic
as these adolescents only comprise 3.2% and .03% of the normative sample, respectively (Stuart,
1995). The original sample included 579 adolescents; however, two cross-validation samples of
139 and 194 adolescents were added to form the total normative sample. The subjects for the
normative data were recruited from outpatient, inpatient, and residential treatment programs in
28 United States and Canada; however, the sample is not “projectable or population
proportionate” as 78.8% of the sample was white (Stuart, 1995; p. 622). Unlike other measures
of personality and psychopathology, the MACI is intended for use with “disturbed adolescents
that have come to the attention of clinical professionals” and not to be used “for the assessment
of normal personality” (Retzlaff, 1995; p. 621).
Reliability. Cronbach alpha reliabilities for the MACI are “excellent” as they range from
.73 to .91 with most of the internal consistency estimates falling in the .80s; (Retzlaff, 1995; p.
621). The internal consistency was also “good” for a psychiatric inpatient sample as the scales
alpha coefficients ranged from .71 for Sexual Discomfort to .93 for Self-Demeaning (Pinto &
Grilo, 2004; p. 1515). Blumentritt and Vanvoorhis (2004) examined the internal consistency of
the MACI with a sample of Mexican American adolescents from residential treatment, juvenile
detention, and an alternative education setting. The internal consistency estimate with this
sample on the PP and CS scales were found to be “adequate” as they ranged from .66 to .89 and
were similar to those reported in the MACI manual (Millon et al., 1993) suggesting the MACI is

SCALE-LEVEL FACTOR ANALYSES 47
reliable for research and clinical use with Mexican American adolescents (Blumentritt &
Vanvoorhis, 2004; p. 72). Test-retest reliability calculations were based on the test being re-
administered after a three to seven day delay and ranged from .57 to .92 (Stuart, 1995).
Validity. According to Retzlaff (1995), “from a psychometric perspective, the interscale,
intercorrelation matrix has far too many scales correlating with each other in the .70s” indicating
the scales have a “lack of specificity above and beyond what should be clinically expected” (p.
621). This problem arises because each of the 160 items is on average contained on six scales
with most scales containing at least 30 items (Retzlaff, 1995). In Stuart’s review of the MACI
(1995) he stressed that the overlap in items across scales increases the possibility of skewing
multiple scales by only answering a few items haphazardly. Although this is frequently
acknowledged as a limitation of the MACI, these correlations can be expected due to the MACI
having been designed using a theoretical approach which reflects the nosology of the psychology
field. The use of items on multiple scales reflects the overlapping symptoms present in many
mental health conditions.
Concurrent Validity. In regards to concurrent validity, correlations between the scales
and clinical judgments made by professionals ranged from .10 to the .20s (Retzlaff, 1995). Hiatt
and Cornell (1999) used a sample of 88 depressed adolescents receiving inpatient treatment to
examine the concurrent validity of the MACI. The researchers found the Doleful Personality and
Depressive Affect scales were strongly associated with scores on the Children’s Depression
Inventory (Kovacs, 1992) and these scales were moderately predictive of a depression diagnosis
(Hiatt & Cornell, 1999). They also found a weak association between the Suicidal Tendencies
scales of the MACI and the adolescents’ placement on suicide precautions (Hiatt & Cornell,
1999).

SCALE-LEVEL FACTOR ANALYSES 48
Salekin, Larrea, and Ziegler (2002) investigated the relationship between the MACI and
the BASC self-report and parent-report (Reynolds & Kamphaus, 1992) within a sample of
adolescents referred for a juvenile court evaluation (n = 92). The average age of the participants
was 14.95 years (SD = 1.32 years) and 68.4% of the sample was male (Salekin et al., 2002). The
ethnic identity of the sample was Hispanic American (40.2%), African American (34.8%), Anglo
American (10.9%), Haitian American (8.6%), and other/biracial (5.5%; Salekin et al., 2002).
Bivariate correlations of the validity scales on the MACI and BASC were found to demonstrate
“good convergent and discriminant validity” (Salekin et al., 2002; p. 47). Additionally, there was
a “high degree of concordance” in the diagnostic impressions based on the MACI and BASC and
the frequency of diagnoses made based on the measures indicated “modest levels of congruence
between the scores” (Salekin et al., 2002; p. 47). The biggest difference in the diagnostic picture
was found between the BASC parent-report and the self-report measures (i.e. BASC and MACI)
as parents tended to report more problems related to externalizing behaviors than was found in
the self-report measures (Salekin et al., 2002).
Pinto and Grilo (2004) examined the concurrent validity between the MACI and a
number of other diagnostic rating scales with a sample of 241 adolescents receiving inpatient
psychiatric treatment (age: M = 15.8, SD = 1.5). The sample was 42.3% male with ethnicities of
Caucasian (79.7%), African-American (10.8%), Hispanic-American (8.7%), Asian-American
(0.4%; Pinto & Grilo, 2004). The correlation between the MACI Depressive Affect scale and the
Beck Depression Inventory (Beck & Steer, 1987) found by Pinto and Grilo (2004) was .63 which
is commensurate with the correlation of .59 which was reported in the manual (Millon et al.,
1993). A moderate positive correlation (r = 0.51) as also found between the MACI Depressive
Affect scale and the Hopelessness Scale for Children (Kazdin, Rodgers & Colbus, 1986; Pinto &

SCALE-LEVEL FACTOR ANALYSES 49
Grilo, 2004). Moderate positive correlations were found between the Substance Abuse Proneness
scale and the Adolescent Alcohol Involvement Survey (Mayer & Filstead, 1979) and the Drug
Abuse Screening Test for Adolescents (.58 and .61 respectively; Martino, Grilo, & Fehon, 2000;
Pinto & Grilo, 2004). Moderate positive correlations were also found between the MACI
Suicidal Tendency scale and the Suicide Risk Scale (r = 0.66; Plutchik, van Praag, & Conte,
1989), the MACI Impulsive Propensity scale and the Impulsivity Scale (r = 0.46; Plutchik & van
Praag, 1989), and the MACI Delinquent Predisposition scale and the Past Feelings and Acts of
Violence Scale (r = 0.35; Pinto & Grilo, 2004; Plutchik & van Praag, 1990). A moderate
negative correlation was found between the MACI Self-Devaluation scale and the Rosenberg
Self-Esteem Scale (r = -0.68; Rosenberg, 1979). The Rosenberg Self-Esteem Scale had a weak
negative correlation with the MACI Peer Insecurity scale (r = -0.27; Pinto & Grilo, 2004). The
researchers concluded there results suggest “the MACI is an accurate but not redundant addition
to the literature of self-report instruments and is best used in concert with rather than as a
replacement for other instruments considered” (Pinto & Grilo, 2004; p. 1516).
Merydith and Phelps (2009) examined the convergence between the MMPI-A Clinical
Scale 2 (Depression) and the MMPI-A Depression content scale with the MACI Doleful PP scale
and the MACI Depressive Affect scale for 252 adolescents receiving psychiatric inpatient
treatment (age: M = 15.3 years, SD = 1.1 years). Their results showed there were no significant
differences in mean scores across the four scales and there was moderate evidence of convergent
validity for the four scales as the correlations ranged from .56 to .78 (Merydith & Phelps, 2009).
Criterion Validity and Diagnostic Efficacy. Correlations between the MACI and a
number of other scales have been completed with “many scales of the MACI correlated above
the moderate level of .25 with responses to other measures”, but due to the lack of information

SCALE-LEVEL FACTOR ANALYSES 50
about the sample sizes for these correlation studies it is impossible to know the importance of
these correlations (Stuart, 1995; pp. 623). In a validity study using a sample of adolescents
receiving psychiatric inpatient treatment, the MACI was found to have “variable diagnostic
efficiencies with adequate performance for predicting classes of diagnoses but less so for
predicting specific diagnoses” (Pinto & Grilo, 2004; p. 1515). According to Pinto and Grilo
(2004) the disorders with low base rates in their sample had the lowest positive predictive power
and the highest negative predictive power while on the other hand the mood disorders with the
highest base rate showed the highest positive predictive power and lowest negative predictive
power. Based on calculations of the sensitivity, specificity, positive predictive power, and
negative predictive power it was concluded that the MACI is useful in helping determine the
larger diagnostic category (e.g. mood disorder), but it was much less effective in identifying the
specific diagnosis (e.g. Major Depressive Disorder; Pinto & Grilo, 2004). Furthermore, Pinto
and Grilo (2004) argued the base rates of specific disorders within the given sample the MACI is
being used with need to be taken into account when considering the MACI’s diagnostic efficacy
as these base rates vary significantly from one patient population to another. In regards to
criterion validity, Pinto and Grilo (2004) found that the MACI had better criterion validity for
depressive affect, substance use disorders, and delinquent predisposition and the measure had
lower criterion validity for impulsive propensity and anxious feelings.
Minnesota Multiphasic Personality Inventory – Adolescent.
Description. The MMPI-A is a paper and pencil self-report measure of psychopathology
that adolescents complete independently in a one-on-one setting with the administrator. The
residential treatment facility used the Q-Global scoring software to generate interpretive reports
for each individual. The assessment is designed for use with individuals 14 to 18 years of age

SCALE-LEVEL FACTOR ANALYSES 51
with the purpose of identifying problematic areas of functioning and assist in clarifying
diagnoses to aid treatment planning. The questionnaire contains 478 statements to which the
adolescent responds true or false.
One of the biggest strengths of the MMPI-A (Butcher et al., 1992) is the validity scales
which are designed to pick up on a number of different response styles and tells the examiner
whether or not the examinee responded in a cooperative, consistent, and accurate manner
(Archer, 2005). The Cannot Say scale evaluates the number of items the respondent did not
answer. The Frequency (F) scale consists of 66 items that less than 20% of adolescents in the
normative sample endorsed which are designed to pick up on the endorsement of atypical
thoughts, feelings, attitudes, and experiences (Cumella & Lafferty O’Connor, 2009). The F1
scale has 33 items from the first 350 items of the MMPI-A and the F2 scale has 33 items from
the remaining 242 items (Butcher et al., 1992). F1 allows for the evaluation of unusual
responding even when only the abbreviated version of the MMPI-A is administered (Cumella &
Lafferty O’Connor, 2009). The Lie (L) scale was designed to identify individuals who present
themselves in an overly positive light and deny even normal human faults (Cumella & Lafferty
O’Connor, 2009). Individuals who have elevations on the L scale are likely to deny symptoms
and therefore, have falsely low elevations on the Clinical and Content scales (Archer, 2005). The
Defensiveness (K) scale was created in order to detect individuals who are experiencing
significant levels of psychological symptomology, but respond in a way which make their profile
appear normal due to being unwilling to admit their psychological issues (Cumella & Lafferty
O’Connor, 2009). The final two validity scales are Variable Response Inconsistency (VRIN)
and True Response Inconsistency (TRIN). VRIN consists of pairs of items that the person should
either respond to in the same way or in the inverse way due to the item content in order to

SCALE-LEVEL FACTOR ANALYSES 52
determine if the person is responding consistently throughout the inventory (Cumella & Lafferty
O’Connor, 2009). Similarly, TRIN contains pairs of items that the individual should always
respond to in opposite ways (i.e. if one is true the other item should be false) in order to
determine if the person tends to respond mostly true or false to items (Cumella & Lafferty
O’Connor, 2009).
The Clinical Scales of the MMPI-A are designed to give the examiner an objective rating
of the examinee’s level of psychological functioning within specific domains (Cumella &
Lafferty O’Connor, 2009). There are 10 Clinical Scales which include: Scale 1 –
Hypochondriasis, Scale 2 – Depression, Scale 3 - Hysteria, Scale 4 – Psychopathic Deviate,
Scale 5 – Masculinity-Femininity, Scale 6 - Paranoia, Scale 7 - Psychasthenia, Scale 8 -
Schizophrenia, Scale 9 - Hypomania, and Scale 0 – Social Introversion (Butcher et al., 1992). In
addition to the Clinical Scales, the MMPI-A contains 28 Harris-Lingoes Clinical Subscales, three
Social Introversion (SI) Subscales, 15 Content Scales, Content Component Scales, six
Supplementary Scales, and five Personality Dimension Scales (Butcher et al., 1992). The
Content Scales contain face-valid items designed to measure a number of themes common to
adolescent life and they can be utilized to determine which descriptors from the Clinical Scale
elevations to emphasize (Cumella & Lafferty O’Connor, 2009. The Content Scales include:
Anxiety (A-anx), Obsessiveness (A-obs), Depression (A-Dep), Health (A-hea), Alienation (A-
aln), Bizarre Mentation (A-biz), Anger (A-ang), Cynicism (A-cyn), Conduct Problems (A-con),
Low Self-Esteem (A-lse), Low Aspirations (A-las), Social Discomfort (A-sod), Family Problems
(A-fam), School Problems (A-sch), and Negative Treatment Indicators (A-trt; Butcher et al.,
1992). The Content Component Scales were designed to further delineate specific problems
identified on the Content Scales and they should only be interpreted if there is an elevation above
SCALE-LEVEL FACTOR ANALYSES 53
60 on the corresponding Content Scale (Cumella & Lafferty O’Connor, 2009). The
Supplementary Scales contain three scales from the original MMPI and three developed
specifically for the MMPI-A. These scales include: MacAndrew Alcoholism Scale – Revised
(MAC-R), Alcohol and Drug Problem Proneness (PRO), Alcohol/Drug Problem
Acknowledgment Scale (ACK), Immaturity Scale (IMM), Welsh’s Anxiety (A) and Repression
(R) Scales. The Personality Psychopathology Five Scales (PSY-5) are different than the other
scales discussed thus far as they emphasize personality traits as opposed to psychopathology
(Cumella & Lafferty O’Connor, 2009). The PSY-5 scales include: Aggressiveness,
Psychoticism, Disconstraint, Negative Emotionality/Neuroticism, and Introversion/Low Positive
Emotionality Scales (Butcher et al., 1992). Similar to the Content Component Scales, the Harris-
Lingoes subscales were created to tease apart the specific issue causing an elevation on an
associated Clinical Scale (Cumella & Lafferty O’Connor, 2009). There are Harris-Lingoes
subscales for six of the ten Clinical Scales. The Social Introversion (Si) subscales delineate
elevations on Clinical Scale 0 (Cumella & Lafferty O’Connor, 2009).
Normative Sample. The MMPI-A normative data were based on 1,620 adolescents (805
males and 815 females) between the ages of 14 and 18 years of age (Butcher et al., 1992). The
subjects for the normative data were chosen from eight communities in the United States
(Butcher et al., 1992). Claiborn (1995) stated the normative sample was “admirably diverse” and
“probably representative of the adolescent population of the United States” (p. 626) at the time of
development; however, it should be noted that although it was representative of the population at
the time of norming the instrument it may not be representative of today’s youth as the normative
sample is over 20 years old.
SCALE-LEVEL FACTOR ANALYSES 54
Reliability. Internal consistency varies significantly across the Clinical Scales and was
calculated separately for males (range from .43 to .88) and females (range from .40 to .89) in the
normative sample. In Claiborn’s review of the MMPI-A (1995) he indicated the internal
consistency varies because the scales are designed to assess “multifaceted psychopathological
constructs” and due to the fact the scales content were derived from using an empirical criterion
method (p. 627). Correlations between the Clinical Scales are also calculated separately for
males and females and vary widely (.00 to .85; Butcher et al., 1992). Overall, Clinical Scale 5
has the biggest reliability problem as it does not measure psychopathology or personality and
instead measures stereotypical gender based interests (Claiborn, 1995). Test-retest reliability
calculations were based on the test being re-administered after a week delay and ranged from .65
to .84 for the validity and Clinical Scales (Butcher et al., 1992). Stein, McClinton, and Graham
(1998) examined the stability of the MMPI-A scales after a one year delay for a group of 61
adolescents in a school setting. Based on their results, they suggested the long-term stability of
the scales is less than the short-term reliability reported in the MMPI-A manual, but similar to
the long-term reliability found previously with the adult version of the MMPI (Stein et al., 1998).
Validity. Although the MMPI-A manual discussed the development of the measure and
changes made from the previous iterations, it does not explicitly discuss the validity data
supporting the MMPI-A Clinical Scales. In his review of the MMPI-A, Lanyon (1995) indicated
that although “procedures used in the original development of the MMPI … are simplistic by
today’s standards” (p. 629) the vast amount of research conducted with the MMPI supports it
being a valid measure. Therefore, because the MMPI-A “retains the essence of the MMPI, the
basic clinical scales come complete with demonstrated validity” (p. 629; Lanyon, 1995).

SCALE-LEVEL FACTOR ANALYSES 55
Concurrent Validity. Forbey and Ben-Porath (2003) investigated the incremental validity
the Content Scales add to the MMPI-A over the Clinical Scales. For their adolescent residential
treatment sample, regression analysis showed the Content Scales accounted for additional
variance beyond that accounted for by the Clinical Scales in predicting clinician rated
symptomology and vice versa suggesting the Content and Clinical Scales are complementary in
providing information and not redundant (Forbey & Ben-Porath, 2003). Rinaldo and Baer
(2003) completed a similar study examining the incremental validity of the Clinical scales and
the Content Scales in predicting whether an individual belonged to a clinical or non-clinical
sample. They found that the Clinical and Content scales each make independent contributions to
predicting group membership.
Arita and Baer (1998) examined the relationship between seven of the MMPI-A Content
Scales (i.e. Anxiety, Depression, health Concerns, Alienation, Anger, Conduct Problems, and
Social Discomfort) and a number of other self-report measures including the Reynolds
Adolescent Depression Inventory (Reynolds, 1987), The Multiscore Depression Inventory –
Short Form (MDI; Berndt, 1986), The Revised Children’s Manifest Anxiety Scales (RCMAS;
Reynolds & Richmond, 1985), The State-Trait Anger Expression Inventory (STAXI;
Spieldberger, 1988), and the Youth Self-Report (YRS; Achenbach, 1991). Results showed the
Anxiety scale significantly correlated with the other measures of both anxiety and depression and
correlations were not significantly different between the measures of anxiety and depression
(Arita & Baer, 1998). Similarly, the Depression scales significantly correlated with measures of
depression, anxiety, withdrawal, somatic complaints, and social problems; and correlations
between the Depression scale and measures of depression and anxiety were similar (Arita &
Baer, 1998). This suggests the Anxiety and Depression Content scales of the MMPI-A may not

SCALE-LEVEL FACTOR ANALYSES 56
be able to accurately distinguish between anxiety and depression. The Health Concerns scales of
the MMPI-A significantly correlated with scores on the Somatic Complaints and Internalizing
scales of the YSR and the Total Score and Physiological Anxiety Scales of the RCMAS (Arita &
Baer, 1998). The Alienation Scales significantly correlated with the YRS Depression, Anxiety,
and Withdrawn and Social Problems scales. The Anger scale from the MMPI-A was
significantly related to the Irritability scale from the MDI, the Trait Anger scale of the STAXI,
the Aggressive Behavior, Delinquent Behavior, and Externalizing scales of the YRS, and the
Physiological Anxiety scale of the RCMAS. The Conduct Problems scales was positively
correlated with the Trait Anger scale of the STAXI, the Physiological Anxiety scale from the
RCMAS, and the Externalizing, Delinquent Behavior, and Aggressive behavior scales from the
YSR Lastly, the Social Discomfort Scales was found to be significant related with the Social
Introversion scales of the MDI and the YSR Withdrawn and Social Problems scales (Arita &
Baer, 1998). Overall, these correlations between the selected MMPI-A Content Scales and
corresponding self-report measures generally support the validity of the selected MMPI-A scales.
Concurrent validity between the MMPI-A and the Rorschach has also been examined.
Krishnamurthy, Archer, and House (1996) utilized a clinical sample of 142 adolescents to test a
series of a priori hypotheses between conceptually related variables on the MMPI-A scales and
the Rorschach. Results indicated constructs on the MMPI-A and Rorschach were generally not
related, even when response style and diagnoses were taken into consideration (Krishnamurthy et
al., 1996). A more recent study examining the convergent validity between the MMPI-A and the
Rorschach had results which were discrepant from Krishnamurthy et al.’s (1996) study. Stokes,
Pogge, and Zaccario (2013) found the relationship between the two measures was dependent on
the response style exhibited by the examinee across both measures. Specifically, they found that

SCALE-LEVEL FACTOR ANALYSES 57
when the response style was similar across the two measures there was a moderate to strong
relationship between the measures; however, when the response style was dissimilar on the two
measures then there was not a relationship or there was a negatively correlated relationship
between the measures (Stokes et al., 2013).
Criterion Validity and Diagnostic Efficacy. Research has shown that the MMPI-A has
utility in being able to distinguish between male adolescents in a juvenile detention center and
those receiving psychiatric inpatient treatment. Archer, Bolinskey, Morton, and Farris (2003)
found that there were differences in mean T-score elevations between these groups and that six
specific scales (i.e. the F2, ACK, IMM, R, Hy3, and Si2 scales) can be used to effectively
distinguish between these groups.
One critique of the MMPI-A has been that even among adolescents in settings
characterized by a high level of psychological distress it is common for adolescents to produce
profiles without clinically significant elevations (Archer, 2005). In order to further explore this
issues Archer, Handel, and Lynch (2001) examined item endorsement frequency within the
MMPI-A normative sample and two adolescent clinical samples with MMPI-2 results from an
adult normative and clinical sample. Results indicated the MMPI-A has many items that do not
have a difference in item endorsement frequency when comparing normative and clinical
samples. When comparing differences in responses between the adult and adolescent samples, it
was found that the MMPI-A Basic and Content Scales have a lower percentage of items which
are effective in differentiating these groups than the corresponding scales on the adult version of
the MMPI.

SCALE-LEVEL FACTOR ANALYSES 58
Statistical Procedures and Data Analysis
Confirmatory factor analysis (CFA) is a statistical analysis which can be used to evaluate
the construct validity of an existing measure by determining if the derived factor structure
remains the same for another data set or sample (Tabachnick & Fidell, 2013). As opposed to
exploratory factor analysis (EFA), CFA is used when there is a hypothesized relationship
between the variables which is to be tested (Tabachnick & Fidell, 2013). To answer the first
research question (i.e. Does the two-factor model of the MACI Personality Pattern [i.e.
Introversive, Inhibited, Doleful, Submissive, Dramatizing, Egotistic, Unruly, Forceful,
Conforming, Oppositional, Self-Demeaning, & Borderline Tendency] and Clinical Syndrome
scales [i.e. Eating Dysfunctions, Substance-Abuse Proneness, Delinquent Predisposition,
Impulsive Propensity, Anxious Feelings, Depressive Affect, and Suicidal Tendency] identified in
previous research [Newman et al., 2015] fit for a court-referred juvenile justice sample when
using a confirmatory factor analysis?) a scale level CFA was conducted with the MACI PP and
CS scales. Specifically, the CFA used the same statistical methodology as Newman and
colleagues (2015) used in their EFA in order to determine if their derived factor structure fits a
mixed gender, court-referred juvenile justice sample. As the CFA results did not fit the factor
structure derived by Newman et al. (2015), an EFA with the PP and CS scales using the same
methodology as Newman et al. (2015) was conducted in order to determine a factor structure that
best fits the given sample.
To answer the second research question (i.e. Does the eight-factor solution of the 69
MMPI-A scales and subscales [i.e. seven validity scales, 10 Clinical Scales, 15 Content Scales,
six Supplementary Scales, 28 Harris-Lingoes Subscales, and three Si subscales] identified in
previous research [i.e., Archer et al., 1994; Archer et al., 2002; Archer & Krishnamurthy, 1997]

SCALE-LEVEL FACTOR ANALYSES 59
fit for a court-referred juvenile justice sample when using a confirmatory factor analysis?) a scale
level CFA was conducted with the 69 MMPI-A scales and subscales. Specifically, the CFA used
the same statistical methodology as Archer et al. (1994) used in their CFA to determine if the
derived eight-factor solution fits a mixed gender, court-referred juvenile justice sample.
The third question (i.e. Based on canonical correlations between the MMPI-A Clinical
[10 scales; i.e. Scale 1 – Hypochondriasis, Scale 2 – Depression, Scale 3 - Hysteria, Scale 4 –
Psychopathic Deviate, Scale 5 – Masculinity-Femininity, Scale 6 - Paranoia, Scale 7 -
Psychasthenia, Scale 8 - Schizophrenia, Scale 9 - Hypomania, and Scale 0 – Social Introversion]
and Content scales [15 Scales; Anxiety, Obsessiveness, Depression, Health, Alienation, Bizarre
Mentation, Anger, Cynicism, Conduct Problems, Low Self-Esteem, Low Aspirations, Social
Discomfort, Family Problems, School Problems, and Negative Treatment Indicators] and the
MACI Personality Pattern [12 scales; i.e. Introversive, Inhibited, Doleful, Submissive,
Dramatizing, Egotistic, Unruly, Forceful, Conforming, Oppositional, Self-Demeaning, &
Borderline Tendency] and Clinical Syndrome scales [8 scales; i.e. Eating Dysfunctions,
Substance-Abuse Proneness, Delinquent Predisposition, Impulsive Propensity, Anxious Feelings,
Depressive Affect, and Suicidal Tendency] what is the degree of shared variance between these
two measures?) was answered by conducting canonical correlations between the MMPI-A
Clinical and Content Scales and the MACI PP and CS scales. In clinical settings, the MMPI-A
and the MACI are sometimes administered in conjunction with one another and at other times
only one of the two measures are used. As such, it is important to determine the level of
construct overlap between the two measures in order to determine if they are truly
complimentary and each providing separate clinically important information or if both measures
are largely providing the same information.
SCALE-LEVEL FACTOR ANALYSES 60
CHAPTER IV
RESULTS
The results provide information regarding the factor structure of the Minnesota
Multiphasic Personality Inventory – Adolescent (MMPI-A; Butcher et al., 1992) and Millon
Adolescent Clinical Inventory (MACI; Millon, Davis, & Grossman, 1993) for a court-referred
adolescent sample, and the relationship between the two measures. In this chapter, the results of
implemented statistical analyses are presented. This chapter is composed of two sections: results
and analyses and summary of statistical analysis.
Results and Analyses
Descriptive Statistics
Participants were 370 adolescents who received a psychological assessment through a
Midwestern residential treatment facility between 2007 and 2013. Adolescents with incomplete
MMPI-A and MACI profiles were excluded from the study narrowing the subject pool to 266
adolescents (93 females, 173 males). Participants ranged in age from 13 to 18 years old (M age =
15.02, SD = 1.18). Although the MMPI-A is normed for individuals age 14 to 18 years old, 28 13
year olds who produced complete profiles were included in the sample as the publishing
company indicates based on clinician judgment the MMPI-A may be appropriate for 13 year olds
who have the necessary reading skills and are mature enough to answer the questions (per
Pearson Clinical Website). Self-identified ethnicity was 68.8% white non-Hispanic, 14.6%
African American, 1.9% Latino/a, 0.8% Native American, 10.5% biracial, 1.5% multiracial, and
1.1% unknown (see Table 1). Participants had between one and ten DSM-IV-TR (APA, 2000)
diagnoses with a mean of 4.7 diagnoses per participant. The most common primary diagnoses
were Conduct Disorder (51.1%), Posttraumatic Stress Disorder (11.3%), Depressive Disorder
SCALE-LEVEL FACTOR ANALYSES 61
(7.5%), and substance related disorder (6.4%). For a complete list of primary diagnoses see
Table 2. The most common diagnoses present in the the sample as a whole (listed anywhere in
the participants’ list of diagnoses) were Conduct Disorder (69.9%), Attention-
Deficit/Hyperactivity Disorder (50.8%), Depressive Disorder (30.5%), Posttraumatic Stress
Disorder (28.6%), Oppositional Defiant Disorder (21.1%), and Anxiety (12.4%). A considerable
portion, 44%, of the sample had an identified trauma history and 29.3% of participants received a
v-code for relational problems. A significant portion of the sample also had one or more
substance abuse disorders (see Table 3). Additionally, 15.8% of the sample had a Math Disorder,
6.8% had a Reading Disorder, and 6.4% had a Disorder of Written Expression. These learning
disorders were based on the psychological evaluation, and are not necessarily reflective of
special education records. For more information regarding the diagnoses represented in the
current sample see Table 3. Placement recommendations based on the psychological evaluation
completed were residential treatment (72.9%), outpatient services (19.5%), secure psychiatric
residential treatment (5.6%), other (1.1%), acute hospitalization (.4%), and outpatient services
with therapeutic foster care (.4%).

SCALE-LEVEL FACTOR ANALYSES 62
Table 1: Descriptive Statistics for the Sample
Variable N (%)
Gender
Male 173 65.0
Female 93 35.0
Ethnicity
White non-Hispanic 183 68.8
African American 39 14.6
Latino/a 5 1.9
Native American 2 0.8
Biracial 28 10.5
Multiracial 4 1.5
Unknown 3 1.1
N = 266
Table 2: DSM-IV-TR Primary Diagnosiss for the Sample
Diagnosis N (%)
Conduct Disorder 136 51.1
Posttraumatic Stress Disorder 30 11.3
Depressive Disorder 20 7.5
Substance Related 17 6.4
Autism Specrum Disorder 13 4.9
Relational Problems 12 4.5
Bipolar 11 4.1
Abuse History 10 3.8
Thought Disorder 6 2.3
Anxiety Disorder 4 1.5
Other 4 1.5
ADHD 3 1.1
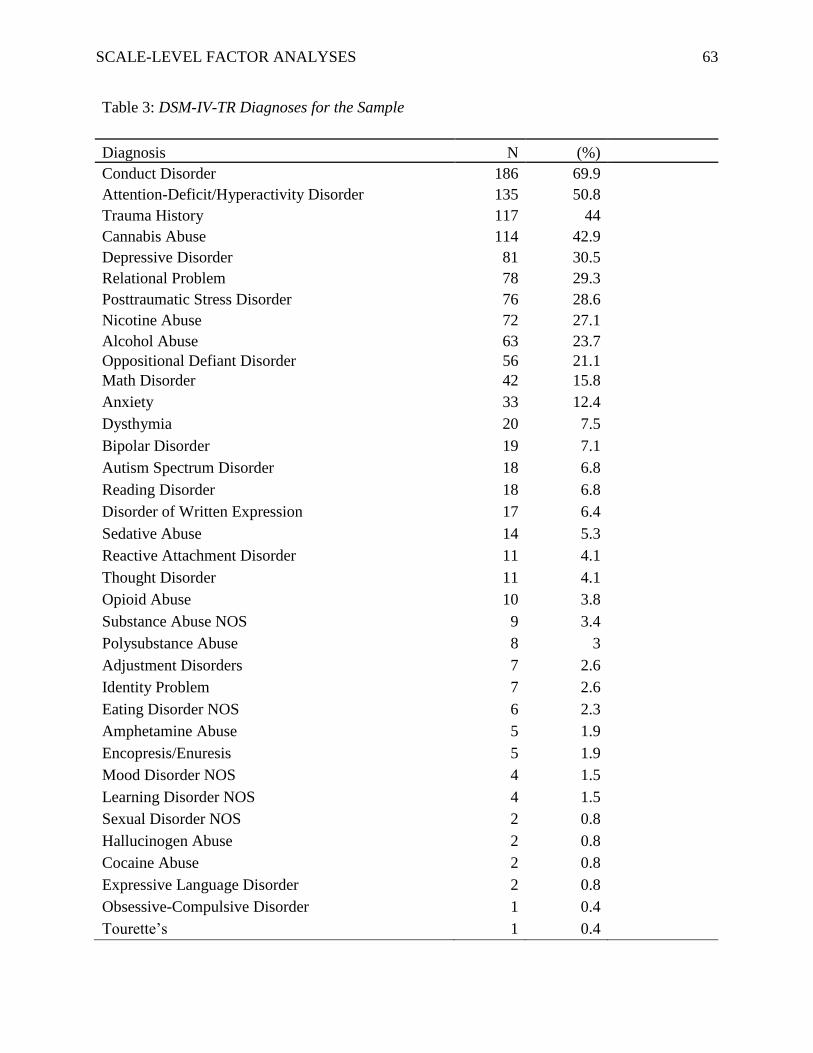
SCALE-LEVEL FACTOR ANALYSES 63
Table 3: DSM-IV-TR Diagnoses for the Sample
Diagnosis N (%)
Conduct Disorder 186 69.9
Attention-Deficit/Hyperactivity Disorder 135 50.8
Trauma History 117 44
Cannabis Abuse 114 42.9
Depressive Disorder 81 30.5
Relational Problem 78 29.3
Posttraumatic Stress Disorder 76 28.6
Nicotine Abuse 72 27.1
Alcohol Abuse 63 23.7
Oppositional Defiant Disorder 56 21.1
Math Disorder 42 15.8
Anxiety 33 12.4
Dysthymia 20 7.5
Bipolar Disorder 19 7.1
Autism Spectrum Disorder 18 6.8
Reading Disorder 18 6.8
Disorder of Written Expression 17 6.4
Sedative Abuse 14 5.3
Reactive Attachment Disorder 11 4.1
Thought Disorder 11 4.1
Opioid Abuse 10 3.8
Substance Abuse NOS 9 3.4
Polysubstance Abuse 8 3
Adjustment Disorders 7 2.6
Identity Problem 7 2.6
Eating Disorder NOS 6 2.3
Amphetamine Abuse 5 1.9
Encopresis/Enuresis 5 1.9
Mood Disorder NOS 4 1.5
Learning Disorder NOS 4 1.5
Sexual Disorder NOS 2 0.8
Hallucinogen Abuse 2 0.8
Cocaine Abuse 2 0.8
Expressive Language Disorder 2 0.8
Obsessive-Compulsive Disorder 1 0.4
Tourette’s 1 0.4
SCALE-LEVEL FACTOR ANALYSES 64
Descriptive statistics for the participants include means and standard deviations for the
MACI scales reported as Base Rate (BR) scores (see Table 4) and MMPI-A scales reported as t-
scores (see Table 5). For both measures high scores on an individual scale are reflective of
concern in the specified area; however, consideration of a score as being clinically significant
varies by scale.

SCALE-LEVEL FACTOR ANALYSES 65
Table 4: Mean (BR Score)and Standard Deviation Statistics for the
MACI
Variable Mean SD
Modifying Indices
Disclosure 50.14 24.44
Desirability 61.10 17.46
Debasement 52.38 21.17
Personality Patterns
Introversion 51.89 18.42
Inhibited 49.87 21.25
Doleful 46.19 24.33
Submissive 58.02 15.56
Dramatizing 60.39 19.63
Egotistic 54.14 36.88
Unruly 66.93 20.45
Forceful 41.54 23.85
Conforming 52.97 18.65
Oppositional 57.75 18.78
Self-demeaning 43.25 23.62
Borderline Tendency 41.02 21.24
Expressed Concerns
Identity Diffusion 44.96 21.61
Self-Devaluation 45.64 28.76
Body Disapproval 28.83 26.63
Sexual Discomfort 54.24 16.78
Peer Insecurity 50.42 24.54
Social Insensitivity 63.54 18.60
Family Discord 66.53 19.87
Childhood Abuse 36.86 26.20
Clinical Syndromes
Eating Dysfunctions 22.45 21.62
Substance Abuse Proneness 48.96 28.12
Delinquent Predisposition 69.21 20.25
Impulsive Propensity 59.44 25.70
Anxious Feelings 57.55 17.39
Depressive Affect 53.47 30.73
Suicidal Tendency 29.98 23.09
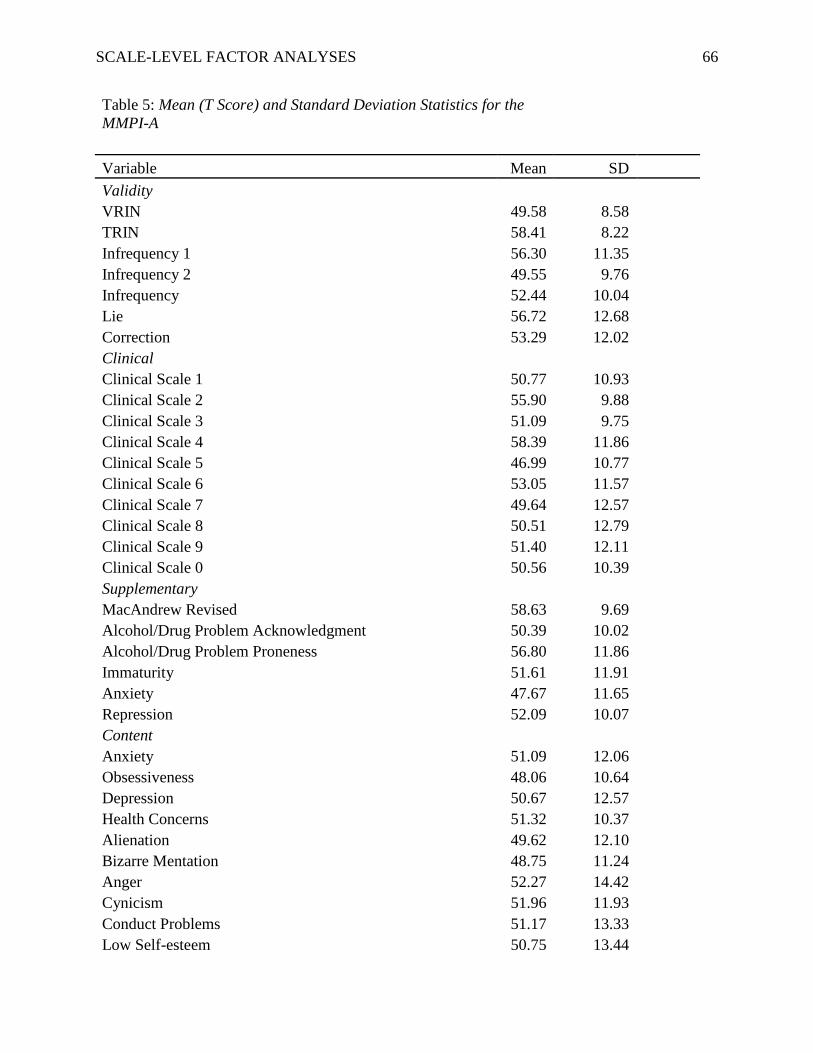
SCALE-LEVEL FACTOR ANALYSES 66
Table 5: Mean (T Score) and Standard Deviation Statistics for the
MMPI-A
Variable Mean SD
Validity
VRIN 49.58 8.58
TRIN 58.41 8.22
Infrequency 1 56.30 11.35
Infrequency 2 49.55 9.76
Infrequency 52.44 10.04
Lie 56.72 12.68
Correction 53.29 12.02
Clinical
Clinical Scale 1 50.77 10.93
Clinical Scale 2 55.90 9.88
Clinical Scale 3 51.09 9.75
Clinical Scale 4 58.39 11.86
Clinical Scale 5 46.99 10.77
Clinical Scale 6 53.05 11.57
Clinical Scale 7 49.64 12.57
Clinical Scale 8 50.51 12.79
Clinical Scale 9 51.40 12.11
Clinical Scale 0 50.56 10.39
Supplementary
MacAndrew Revised 58.63 9.69
Alcohol/Drug Problem Acknowledgment 50.39 10.02
Alcohol/Drug Problem Proneness 56.80 11.86
Immaturity 51.61 11.91
Anxiety 47.67 11.65
Repression 52.09 10.07
Content
Anxiety 51.09 12.06
Obsessiveness 48.06 10.64
Depression 50.67 12.57
Health Concerns 51.32 10.37
Alienation 49.62 12.10
Bizarre Mentation 48.75 11.24
Anger 52.27 14.42
Cynicism 51.96 11.93
Conduct Problems 51.17 13.33
Low Self-esteem 50.75 13.44

SCALE-LEVEL FACTOR ANALYSES 67
Low Aspiration 51.74 11.43
Social Discomfort 50.82 11.33
Family Problems 51.69 13.08
School Problems 59.22 14.41
Negative Treatment Indicators 48.96 13.94
MACI Factor Analysis
Statistical Assumptions. Data were assessed to ensure the assumptions of the analyses
were met. Mardia’s Tests of Multivariate Skew and Kurtosis (Mardia, 1970) indicated the MACI
scales did not approximate a normal distribution; thus the assumption of multivariate normality
was not met. As such, the Robust Weighted Least Squares (RWLS) estimator was used instead
of Maximum Likelihood estimator.
Confirmatory Factor Analysis. Confirmatory factor analysis (CFA) was used to validate
the factor structure identified by Newman et al. (2015) with the current sample. Specifically, the
CFA was utilized to answer the following research question:
R1 Does the two-factor model of the MACI Personality Pattern and Clinical Syndrome
scales identified in previous research (Newman et al., 2015) fit for a court-referred
juvenile justice sample when using a confirmatory factor analysis?
CFA was conducted using RWLS estimator in R (R Core Team, 2013). The analysis was first
conducted using the entire sample outlined in Table 1. Although the comparative fit index was
above the recommended .9 cut-off, the Tucker-Lewis index is below the .9 cut-off indicating
questionable model fit (Kline, 2016). Additionally the root mean square error of approximation
(RMSEA) of .158 and the standardized root mean square residual of .158 were suggestive of
poor model fit as the recommended cut-off for adequate fit is less than .08. Overall, all fit
statistics suggest the factor model proposed by Newman et al. (2015) does not fit the current
sample. Due to the poor model fit, a CFA was then conducted using only the males from the

SCALE-LEVEL FACTOR ANALYSES 68
sample to determine if model fit would improve as Newman et al.’s (2015) sample did not
contain female subjects. Overall, model fit did not improve after eliminating female participants
from the analysis (see Table 6).
Table 6: CFA Fit Statistics for the MACI
n χ2 Df CFI TLI RMSEA 90% CI SRMR
Entire Sample 266 1127.383* 148 0.910 0.896 0.158 [0.149,
0.167] 0.158
Males Only 173 824.615* 148 0.901 0.885 0.163 [0.152,
0.174] 0.165
*p -value < 0.001
Note. Df = degrees of freedom; CFI = comparative fit index; TLI = Tucker-Lewis index;
RMSEA = root mean square error of approximation; CI = confident interval; SRMR =
standardized root mean square residual
As the Newman et al.’s (2015) model could not be replicated using the current sample, an
exploratory factor analysis was conducted to answer the follow question:
R1a If the two-factor internalizing and externalizing model identified by Newman et al.
(2015) does not fit the current study’s court-referred juvenile justice sample, what model
has the best fit based on an exploratory factor analysis of the Personality Pattern and
Clinical Syndrome scales with the current sample?
Newman et al. (2015) conducted their EFA using Maximum Likelihood Estimation with
an oblique rotation. To determine the number of specified factors, Newman et al. (2015) used the
eigenvalues-greater-than-one rule, visual scree-test, and parallel analysis. Statisticians have
raised concern with the eigenvalues-greater-than-one rule as it tends to either overestimate or
underestimate the optimal number of components, and the components are not always reliable
(Cliff, 1988; Zwick & Velicer, 1986). Parallel analysis and Velicer’s minimum average partial
(MAP) test have been established as superior methods for determining the number of factors to
be extracted (O’Connor, 2000). As such, the current study used Velicer’s MAP test and Parallel

SCALE-LEVEL FACTOR ANALYSES 69
analysis to determine the number of factors to extract. In addition, model fit statistics and
theoretical expectations were taken into account. Factor loadings greater than .30 or.40 are
typically considered the threshold of significance (Floyd & Widamen, 1995). To be consistent
with Newman et al. (2015) factor loadings greater than .40 were interpreted as significant.
Velicer’s MAP test suggested a two-factor model had the best fit for the current dataset (see
Table 7). The two-factor solution was supported by parallel analysis as the projected eigenvalues
were larger than the actual eigenvalues when more than two factors were extracted (see Table 8).
Lastly, when using Maximum Likelihood Estimation with an oblique rotation and the
eigenvalue-great-than-one rule a two-factor solution emerged as the least reduction in
Eigenvalues occurred between the one- and two-factor models with substantial decline after
extracting more than two factors. Additionally, when more than two factors were extracted the
factors were significantly correlated with each other. The structure coefficients and communality
estimates for the oblique rotated, two-factor solution are presented in Table 9.

SCALE-LEVEL FACTOR ANALYSES 70
Table 7: MACI Velicer’s MAP Test Factor Extraction
Eigenvalues
Rotation Sum of Squared
Loadings
Factor Total
% of
Variance
Cumulative
% Total
% of
Variance
Cumulative
%
1 8.412 44.273 44.273 7.030 37.000 37.000
2 5.261 27.688 71.961 6.643 34.961 71.961
3 .800 4.211 76.172
4 .713 3.755 79.927
5 .540 2.841 82.768
6 .493 2.592 85.361
7 .458 2.412 87.773
8 .410 2.160 89.933
9 .302 1.590 91.523
10 .281 1.479 93.002
11 .245 1.289 94.290
12 .222 1.166 95.457
13 .205 1.080 96.537
14 .163 .857 97.394
15 .132 .694 98.087
16 .124 .652 98.739
17 .102 .539 99.278
18 .078 .409 99.687
19 .059 .313 100.000

SCALE-LEVEL FACTOR ANALYSES 71
Table 8: MACI Parallel Analysis
Root
Mean random data
eigenvalues
Percentile random data
eigenvalues
1 1.503 1.596
2 1.404 1.472
3 1.332 1.385
4 1.271 1.320
5 1.212 1.259
6 1.161 1.202
7 1.111 1.152
8 1.065 1.104
9 1.022 1.060
10 0.980 1.017
11 0.938 0.975
12 0.897 0.931
13 0.857 0.893
14 0.815 0.852
15 0.775 0.812
16 0.734 0.771
17 0.691 0.734
18 0.644 0.687
19 0.587 0.634

SCALE-LEVEL FACTOR ANALYSES 72
Table 9: MACI EFA Structure Matrix & Communalities
Factor
Scale 1 2 Communalities
Introversion .710 .035 .711
Inhibited .653 -.270 .790
Doleful .852 .336 .765
Submissive -.225 -.864 .838
Dramatizing -.810 -.108 .830
Egotistic -.543 -.075 .319
Unruly -.008 .897 .874
Forceful .254 .826 .763
Conforming -.694 -.789 .911
Oppositional .669 .698 .753
Self-demeaning .858 .308 .794
Borderline tendency .703 .600 .756
Eating dysfunction .664 .081 .557
Substance-abuse proneness .371 .843 .755
Delinquent predisposition -.205 .670 .634
Impulsive propensity .332 .900 .855
Anxious feelings .026 -.814 .782
Depressive affect .924 .179 .841
Suicidal tendency .820 .325 .735
MMPI-A Factor Analysis
Statistical Assumptions. Data were assessed to ensure the assumptions of the analyses
were met. Mardia’s Tests of Multivariate Skew and Kurtosis indicated the MMPI-A scales did
not approximate a normal distribution; thus the assumption of multivariate normality was not
met. As such, Robust Weighted Least Squares (RWLS) estimator was used instead of Maximum
Likelihood estimator.
Confirmatory Factor Analysis. Confirmatory factor analysis was used to validate the
factor structure identified in previous research and used for interpretation in the MMPI-A
Structural Summary with the current sample. Specifically, CFA was utilized to answer the
following research question:

SCALE-LEVEL FACTOR ANALYSES 73
R2 Does the eight-factor solution of the 69 MMPI-A scales and subscales (i.e. seven
validity scales, 10 Clinical Scales, 15 Content Scales, six Supplementary Scales, 28
Harris-Lingoes Subscales, and three Si subscales) identified in previous research (i.e.,
Archer et al., 1994; Archer et al., 2002; Archer & Krishnamurthy, 1997) fit for a court-
referred juvenile justice sample when using a confirmatory factor analysis?
CFA was conducted using RWLS estimator in R. The three previous scale-level factor analyses
on the MMPI-A have yielded fairly similar results with the number of factors ranging from seven
to nine. The Structural Summary (Psychological Assessment Resources, 1994) model which has
eight factors was selected for validation as it is the only published factor model for which an
interpretation worksheet is available by a testing company for clinical interpretation at this time.
The CFA was first conducted on the entire sample including both valid and invalid MMPI-A
profiles as two (Archer et al., 1994; Archer et al., 2002) of the three previous factor analytic
studies did not eliminate invalid profiles from their samples. The specified model for the whole
sample converged normally. Table 10 presents the fit statistics. The comparative fit index and
Tucker Lewis index suggested adequate model fit as they were both above the .9 cut-off (.988 &
.987, respectively). The RMSEA of .054 was indicative of good model fit for the entire sample.
Additionally, a standardized root mean square residual (SRMR) below .08 is supportive of
adequate fit which was achieved in this model. Overall, the factor structure outlined in the
Structural Summary appears to fit the current sample well when both the valid and invalid
MMPI-A profiles were analyzed.
The same analysis was then conducted with only those MMPI-A profiles which yielded a
valid profile to determine if model fit would increase when only profiles which are clinically
meaningful were included. Those with a Cannot Say raw score of less than or equal to 30, a

SCALE-LEVEL FACTOR ANALYSES 74
Frequency Scale T score less than or equal to 100, and Correction T score less than or equal to 65
were considered invalid. Again the specified model converged normally. The comparative fit
index and Tucker-Lewis index were supportive of adequate model fit (.982 & .981, respectively).
The RMSEA of .058 indicates the model is on the cusp of adequate to good model fit. The
SRMR was less supportive of good model fit than when the whole sample was analyzed;
however, this could partly be due to a reduction in power due to the smaller sample size. The
factor structure correlation coefficients for the sample of valid profiles are presented in Table 11.
In concordance with the previous research the factors were labeled as follows: Factor 1 - General
Maladjustment, Factor 2- Immaturity, Factor 3 – Disinhibition, Factor 4 – Social Discomfort,
Factor 5 – Health Concerns, Factor 6 – Naiveté, Factor 7 – Familial Alienation, and Factor 8 –
Psychoticism.
Table 10: CFA Fit Statistics for the MMPI-A
n χ2 Df CFI TLI RMSEA 90% CI SRMR
Whole sample 266 2858.305* 1606 0.988 0.987 0.054 [0.051,
0.057] 0.078
Valid only 187 2617.753* 1606 0.982 0.981 0.058 [0.054,
0.052] 0.088
*p -value < 0.001
Note. Df = degrees of freedom; CFI = comparative fit index; TLI = Tucker-Lewis index;
RMSEA = root mean square error of approximation; CI = confident interval; SRMR =
standardized root mean square residual

SCALE-LEVEL FACTOR ANALYSES 75
Table 11: MMPI-A Factor Structure Correlation Coefficient for Valid Profiles
Factors
Scale 1 2 3 4 5 6 7 8
Basic scales
TRIN - - - - - - - -
VRIN - - - - - - - -
F1 - - - - - - - -
F2 - - - - - - - -
F - 0.796 - - - - - -
L - - -0.534 - - - - -
K - - -0.298 - - -0.792 - -
Hs - - - - 0.959 - - -
D 0.611 - - - - - - -
Hy - - - - 0.673 - - -
Pd 0.257 - - - - - 0.633 -
Mf - - - - - - - -
Pa - 0.340 - - - - - 0.930
Pt 0.882 - - 0.116 - - - -
Sc 0.508 .444 - - - - - -
Ma - - 0.533 - - - - -
Si - - - 1.065 - - - -
Content scales
A-anx 0.820 - - - - - - -
A-obs 0.768 - - - - - - -
A-dep 0.913 - - - - - - -
A-hea - - - - 0.944 - - -
A-aln 0.740 0.120 - - - - - -
A-biz - 0.559 - - - - - 0.396
A-ang - - 0.770 - - - - -
A-cyn - - 0.298 - - 0.526 - -
A-con - -0.218 0.944 - - - - -
A-lse 0.769 - - 0.132 - - - -
A-las - - - - - - - -
A-sod - - - 0.753 - - - -
A-fam - 0.282 - - - - 0.595 -
A-sch - 0.602 - - - - - -
A-trt 0.369 0.449 - - - - - -
Supplementary
scales
A 0.929 - - - - - - -

SCALE-LEVEL FACTOR ANALYSES 76
R - - -0.228 - - - - -
MAC-R - -0.677 1.218 - - - - -
ACK - 0.634 - - - - - -
PRO - - - - - - 0.707 -
IMM - 0.843 - - - - - -
Harris-Lingoes
subscales
D1 0.303 - - - - - - -
D2 - - 0.168 - - - - -
D3 - - - - 0.106 - - -
D4 0.803 - - - - - - -
D5 0.828 - - - - - - -
Hy1 - - - -0.816 - - - -
Hy2 - - - - - -0.697 - -
Hy3 0.482 - - - 0.422 - - -
Hy4 - - - - 0.940 - - -
Hy5 - - - - - - - -
Pd1 - - - - - - 0.776 -
Pd2 - - - - - - - -
Pd3 - - - -0.785 - - - -
Pd4 0.746 - - - - - - -
Pd5 0.771 - - - - - - -
Pa1 - 0.673 - - - - - 0.257
Pa2 0.733 - - - - - - -
Pa3 - - - - - -0.510 - -
Sc1 0.866 - - - - - - -
Sc2 0.723 0.015 - - - - - -
Sc3 0.786 - - - - - - -
Sc4 0.808 - - - - - - -
Sc5 - - 0.822 - - - - -
Sc6 - 0.689 - - - - - 0.235
Ma1 - - - - - - - -
Ma2 - - 0.592 - - - - -
Ma3 - - - -0.702 - - - -
Ma4 - - 0.435 - - - - -
Si Subscales
Si1 - - - 0.720 - - - -
Si2 - - - - - - - -
Si3 0.558 - - - - 0.323 - -
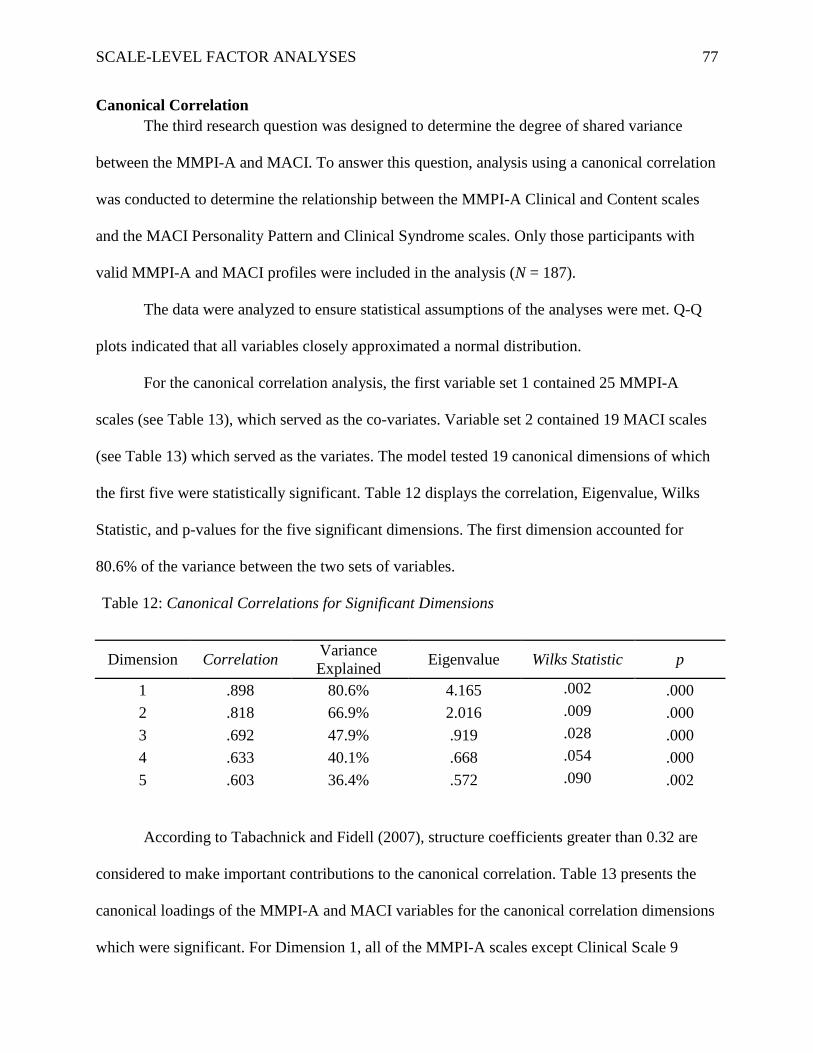
SCALE-LEVEL FACTOR ANALYSES 77
Canonical Correlation
The third research question was designed to determine the degree of shared variance
between the MMPI-A and MACI. To answer this question, analysis using a canonical correlation
was conducted to determine the relationship between the MMPI-A Clinical and Content scales
and the MACI Personality Pattern and Clinical Syndrome scales. Only those participants with
valid MMPI-A and MACI profiles were included in the analysis (N = 187).
The data were analyzed to ensure statistical assumptions of the analyses were met. Q-Q
plots indicated that all variables closely approximated a normal distribution.
For the canonical correlation analysis, the first variable set 1 contained 25 MMPI-A
scales (see Table 13), which served as the co-variates. Variable set 2 contained 19 MACI scales
(see Table 13) which served as the variates. The model tested 19 canonical dimensions of which
the first five were statistically significant. Table 12 displays the correlation, Eigenvalue, Wilks
Statistic, and p-values for the five significant dimensions. The first dimension accounted for
80.6% of the variance between the two sets of variables.
Table 12: Canonical Correlations for Significant Dimensions
Dimension Correlation Variance
Explained Eigenvalue Wilks Statistic p
1 .898 80.6% 4.165 .002 .000
2 .818 66.9% 2.016 .009 .000
3 .692 47.9% .919 .028 .000
4 .633 40.1% .668 .054 .000
5 .603 36.4% .572 .090 .002
According to Tabachnick and Fidell (2007), structure coefficients greater than 0.32 are
considered to make important contributions to the canonical correlation. Table 13 presents the
canonical loadings of the MMPI-A and MACI variables for the canonical correlation dimensions
which were significant. For Dimension 1, all of the MMPI-A scales except Clinical Scale 9

SCALE-LEVEL FACTOR ANALYSES 78
significantly contributed to the canonical relationship. All but four of the MACI scales
(Submissive, Unruly, Delinquent Predisposition, and Anxious Feelings) significantly contributed
to the Dimension 1 canonical relationship. MMPI-A Clinical Scale 7 had the highest loading on
Dimension 1. For Dimension 2, six MMPI-A scales and 14 MACI scales had significant loadings
with the highest loading being accounted for by the MACI scale Unruly. The only scale which
contributed to Dimension 3 was the MMPI-A Clinical Scale 4. In regards to Dimension 4, three
MMPI-A scales and one MACI scales had significant loadings. The only scale which
significantly contributed to Dimension 5 was the Self-Demeaning scale on the MACI.
Table 13: Correlations Between Observed Variables and Their Canonical Variates
Variable Dimension 1 Dimension 2 Dimension 3 Dimension 4 Dimension 5
MMPI-A
Hs -.590 -.015 .215 .227 -.156
D -.697 -.266 -.179 -.001 .105
Hy -.438 .004 -.061 .007 -.083
Pd -.652 .249 -.470 -.086 .025
Mf -.354 -.097 -.088 .337 -.282
Pa -.737 .059 -.144 .152 -.293
Pt -.893 -.036 .103 .138 -.102
Sc -.867 .137 .139 .212 -.032
Ma -.278 .628 .274 .106 .063
Si -.741 -.414 .229 -.179 -.042
A-anx -.730 -.012 .015 .217 -.096
A-obs -.688 .024 .039 .375 -.036
A-dep -.849 .090 -.245 .074 .054
A-hea -.564 .067 .243 .278 -.245
A-aln -.865 .083 .043 -.070 .107
A-biz -.703 .124 .244 .364 .027
A-ang -.551 .440 .225 -.254 -.099
A-cyn -.360 .200 .182 .190 .309
A-con -.461 .620 .105 .063 -.085
A-lse -.867 -.029 -.156 -.024 -.044
A-las -.483 .137 -.069 -.223 .125

SCALE-LEVEL FACTOR ANALYSES 79
A-sod -.602 -.481 .196 -.135 .136
A-fam -.594 .188 -.070 -.098 .103
A-sch -.493 .414 .084 .015 .076
A-trt -.777 .218 -.042 .118 .275
MACI
Introversion -.804 -.326 .059 -.165 .265
Inhibited -.638 -.581 -.059 -.183 -.218
Doleful -.781 .106 -.196 .003 .002
Submissive .256 -.748 .010 .035 -.148
Dramatizing .807 .391 .078 .147 -.197
Egotistic .815 .337 .245 .120 .036
Unruly -.101 .828 .114 -.131 -.055
Forceful -.356 .684 .166 -.215 -.169
Conforming .758 -.439 .008 -.009 -.097
Oppositional -.633 .360 -.006 .074 -.004
Self-demeaning -.751 -.017 -.223 .091 -.344
Borderline
tendency -.696 .362 -.220 -.182 -.074
Eating
dysfunction -.572 -.202 -.113 .232 -.281
Substance-
abuse proneness -.381 .723 -.286 .087 -.114
Delinquent
predisposition .076 .797 .288 -.056 .107
Impulsive
propensity -.390 .744 .218 -.182 -.113
Anxious
feelings .004 -.783 .171 .255 -.165
Depressive
affect -.814 -.135 -.295 .097 -.086
Suicidal
tendency -.793 .106 -.239 .346 .123

SCALE-LEVEL FACTOR ANALYSES 80
CHAPTER V
DISCUSSION
This chapter is divided into four sections: (1) summary of the present investigation; (2)
discussion and implications; (3) strengths and limitations; and (4) directions for future research.
Summary of the Study
The purpose of the present study was to investigate the scale-level factor structure of two
widely used measures of personality and psychopathology, the Minnesota Multiphasic
Personality Inventory – Adolescent (MMPI-A; Butcher et al., 1992) and the Millon Adolescent
Clinical Inventory (MACI; Millon, Davis, & Grossman, 1993), for a court-referred adolescent
sample to aid in the interpretation of these measures for this population. Additionally, this study
sought to examine the degree of construct overlap between the MMPI-A and the MACI because
understanding the relationship between the measures has theoretical and practical implications.
The data for this study were collected through an archival records review of 266 individuals (M
age = 15.02 years) who had received a court-ordered psychological evaluation at a residential
treatment facility between 2007 and 2013. All participants were administered a comprehensive
psychological battery; however, only those individuals who had complete MMPI-A and MACI
profiles were included in the current study.
Means and standard deviations were calculated for the sample for each scale of the
MMPI-A and MACI. For the sample as a whole, clinically significant elevations were seen on
the MACI scales of Unruly, Family Discord, and Delinquent Predisposition. Of note, the
standard deviations of MACI scales varied from 15 to 36 Base Rate (BR) points (MACI scoring
software standardized scores which are derived from the base rate of a condition associated with
a given scale within a clinical population) depending on the scale, indicating a large degree of
SCALE-LEVEL FACTOR ANALYSES 81
variability in the profiles of the sample. For the sample as a whole, no clinically significant
elevations were present based on the mean MMPI-A scale scores; however, the T-score standard
deviations varied from 8 to 14 points across the scales suggesting variability within the profiles
of the participants.
Results of the confirmatory factor analysis (CFA) of the MACI suggested the two-factor
model proposed by Newman et al. (2015) did not statistically fit the current sample. The
characteristics of Newman et al.’s sample were different from the current sample as the current
sample included both males and females, whereas Newman et al.’s sample only included males.
Additionally, Newman et al.’s sample only included individuals in secure detention while the
current sample included those in detention, residential treatment, and outpatient services. As
such, a second CFA was conducted using only the males in the current sample to determine if the
difference in model fit between the current sample and Newman et al.’s sample was due to
gender differences. The CFA using only male participants again showed the two-factor model
proposed by Newman et al. (2015) did not fit the current sample statistically. The current sample
did not contain enough individuals from secure detention to conduct a CFA using only those
individuals; therefore, the possibility of the difference in results being attributed to setting was
not determined.
Given the two-factor model identified by Newman et al. (2015) did not fit the current
sample, an exploratory factor analysis (EFA) was conducted of the MACI data using Velicer’s
minimum average partial (MAP; Zwick & Velicer, 1986) and parallel analysis with the 266
participants who had complete MACI profiles. Parallel analysis, MAP, and the Eigenvalues-
greater-than-one rule all supported a two-factor solution for the scale-level analysis of the MACI.
Twelve of the 19 scales (i.e. Introversion, Inhibited, Doleful, Dramatizing, Egotistic,

SCALE-LEVEL FACTOR ANALYSES 82
Conforming, Oppositional, Self-demeaning, Borderline Tendency, Eating Dysfunction,
Depressive Affect, and Suicidal Tendency) loaded on the first factor, which was labeled
Internalizing. Ten of the 19 scales (i.e. Submissive, Unruly, Forceful, Conforming,
Oppositional, Borderline Tendency, Substance-abuse Proneness, Delinquent Predisposition,
Impulsive Propensity, and Anxious feelings) loaded on the second factor, which was labeled
Externalizing. Three of the scales (i.e. Conforming, Oppositional, and Borderline Tendency)
cross loaded on both factors. This pattern of cross loading is consistent with the cross loadings in
Newman et al.’s (2015) factor structure. Examination of the structure matrix and the direction of
the factor loadings for the current study suggest a similar pattern to Newman et al.’s (2015)
factor structure where factor 1 consisted of scales primarily associated with internalizing features
and factor 2 consisted of scales primarily associated with externalizing features. The only place
where the current factor structure diverged from Newman et al.’s (2015) factor structure is the
loading of the Delinquent Predisposition scale. For the current study the Delinquent
Predisposition scale loaded positively on the externalizing factor; however, in Newman et al.’s
(2015) study it loaded negatively on the internalizing factor.
Results of the CFA of the MMPI-A using the entire sample (n = 266), including invalid
profiles (n = 79), indicated data from the current sample fit the factor structure outlined in the
Structural Summary (Psychological Assessment Resources, 1994). Given that invalid profiles are
not typically interpreted for clinically meaningful information and that one of the three previous
factor analytic studies of the MMPI-A (Archer & Krishnamurthy, 1997) excluded invalid
profiles, a second CFA was conducted including only those participants whom had valid MMPI-
A profiles. All profiles with a Cannot Say raw score of less than or equal to 30, a Frequency
Scale T score less than or equal to 100, and a Correction T score less than or equal to 65 were

SCALE-LEVEL FACTOR ANALYSES 83
excluded, as this was the exclusion criteria used by Archer and Krishnamurthy (1997), from
analysis leading to a subsample of valid only profiles of 187 participants. Results of the CFA
using only valid profiles was less supportive of good model fit than when the whole sample was
analyzed; however, this could partly be due to the reduction in power associated with reducing
the sample size by 79 participants. Overall, the eight-factor solution for scale-level factor
analysis proposed by Archer et al. (1994) and published as an interpretive tool, the Structural
Summary (Psychological Assessment Resources, 1994), adequately fit the current sample when
both valid and invalid profiles were included.
Canonical correlations were used to determine the degree of construct overlap between
the MACI and MMPI-A. Results of the canonical correlation between the MMPI-A Clinical and
Content scales and the MACI Personality Pattern and Clinical Syndrome scales revealed five
statistically significant canonical dimensions. Dimension 1 accounted for 80.6% of the variance
between the two measures suggesting the majority of the redundancy between the two measures
is explained by the scales from the MMPI-A and MACI which were significantly correlated with
Dimension 1. All of the MMPI-A Clinical and Content scales, with the exception of Clinical
Scale 9, were significantly correlated with Dimension 1. All but four of the MACI Personality
Pattern and Clinical Syndrome Scales (e.g., Submissive, Unruly, Delinquent Predisposition, and
Anxious Feelings) were significantly correlated with Dimension 1. This suggests there is a high
degree of construct overlap between the MMPI-A and MACI. Examination of Dimension 2
showed Clinical Scales 9 and 0, Anger, Conduct Problems, Social Discomfort, and School
Problems from the MMPI-A are measuring the a similar construct as Introversion, Inhibited,
Submissive, Dramatizing, Egotistic, Unruly, Forceful, Conforming, Oppositional, Borderline
Tendency, Substance-Abuse Proneness, Delinquent Predisposition, Impulsive Propensity, and

SCALE-LEVEL FACTOR ANALYSES 84
Anxious Feelings from the MACI. Results suggest Clinical Scale 4 from the MMPI-A uniquely
accounts for Dimension 3 as it was the only scale which significantly correlated with the
dimension. Clinical Scale 5, Obsessiveness, and Bizarre Mentation from the MMPI-A and
Suicidal Tendency from the MACI significantly correlated with Dimension 4. Lastly, the only
scale which was significantly correlated with Dimension 5 was Self-Demeaning from the MACI.
Overall, the results of the canonical correlations showed the MMPI-A and MACI are largely
measuring similar constructs for this sample.
Discussion and Implications
The current study examined scale level factor models of the MACI and MMPI-A with the
aim of determining the consistency of the factor structure from previous research with a court-
referred sample. The current study also aimed to explore the relationship between the MMPI-A
and MACI as no previous study has utilized canonical correlation to examine the degree of
construct overlap between the two measures. The results of this study have theoretical and
clinical implications for the use of the MMPI-A and MACI.
For the sample as a whole, clinically significant elevations were seen on the MACI scales
of Unruly, Family Discord, and Delinquent Predisposition. A high score on the Unruly scale
suggests the respondent tends to act out in antisocial ways, resisting socially acceptable standards
of behavior (Millon et al., 1993). Similarly, a high score on the Delinquent Predisposition scale
is present when an individual’s behavior is likely to lead to situations that violate the rights of
others and of societal rules (Millon et al., 1993). The elevations on the Unruly and Delinquent
Predisposition scales are not surprising given all individuals within the sample were court-
referred for evaluation which means they have had court involvement due to some sort of legal
charge. A high score on the Family Discord scale is evident when there is a high degree of

SCALE-LEVEL FACTOR ANALYSES 85
conflict and tension within the adolescent’s family, and a general sense of estrangement from
their family (Millon et al., 1993). The elevation on the Family Discord scale is also to be
expected given many youth in contact with the court system have significant family dysfunction
and conflict. Connor et al. (2004) found high rates of family dysfunction including parental
substance use, violence, and physical and sexual abuse within their sample of youth in residential
treatment; these difficulties were expected in the current sample given a portion of the present
sample was obtained from court-referred residential treatment. Lyons et al. (2001) found that
most juvenile justice youth had their biological mother in the home; however, less than one-
fourth of those youth had their biological father in the home. Furthermore, fewer youth within
correctional facilities and court-ordered residential treatment were in the guardianship of a parent
at the time of entry into the system as compared to those referred for probation (Lyons et al.,
2001). Overall, research suggests there is a high degree of family estrangement within various
juvenile justice populations, including those in detention and residential treatment which are
represented in the current sample. The current sample’s elevation on the Family Discord scale of
the MACI is consistent with the previous research showing high levels of family dysfunction in
juvenile justice samples.
For the sample as a whole, there were not clinically significant elevations on any of the
MMPI-A scales; however, the standard deviations suggest there is a high degree of variability in
scale elevations for the individuals within the sample. Examination of the means and standard
deviations of the scales of the MMPI-A and MACI reveal the current sample is fairly diverse in
terms of clinical elevations other than the family estrangement and predisposition toward
behavioral conduct problems described above. Research has shown that within juvenile justice
youth in out of home placement, including detention centers, and those on probation there are

SCALE-LEVEL FACTOR ANALYSES 86
high rates of numerous mental health conditions (Lyons et al., 2001; Pyle et al., 2016); however,
rates of individual conditions vary across placement setting. As the current sample included a
wide array of court-referred youth (i.e. those from detention, residential treatment, and outpatient
services) one would expect to encounter a wide array of mental health conditions. Individuals in
the present sample had between one and ten mental health diagnoses with an average of 4.7
mental health diagnoses at the time of their admittance to the facility. Despite the fact there are
not sample mean elevations on the MMPI-A, and few elevations on the MACI, the diagnostic
variability found in previous research is reflected in the large standard deviations within the
current sample for the MMPI-A and MACI scales.
Research has shown the rates of mental health conditions vary by gender for court-
referred youth, with females demonstrating more internalizing problems than males (Travis,
1999). Further research has indicated that although females have more internalizing concerns,
males and females have the same level of externalizing issues (Cauffman et al., 2004).
Consistent with these findings, at the time of admittance into a residential treatment facility
females were shown to have significantly more mental health concerns than males and meet
criteria for more diagnoses than males (Handwerk et al., 2006; Pyle et al., 2016). As the current
sample contains both males and females, the current sample would not be expected to be
homogeneous in terms of diagnoses and clinical elevations on the MMPI-A and MACI.
MACI Factor Analysis Implications
There have been four previous scale-level factor analytic studies of the MACI (Adkisson
et al., 2012; Newman et al., 2015; Romm et al., 1999; Salekin et al., 2002), all of which
produced disparate results. The three studies prior to Newman et al. (2015) differed in the
statistical procedures employed during analysis. As such, one of the goals of Newman et al.’s

SCALE-LEVEL FACTOR ANALYSES 87
(2015) study was to outline the statistical procedures which are most appropriate for scale-level
factor analytic studies of the MACI. Newman et al. was unable to replicate the factor structure
outlined by Romm et al. (1999), Salekin et al. (2002), and Adkisson et al. (2012) using CFA, and
thus they conducted an EFA using a sample of male detainees which resulted in a two-factor
solution (i.e., Internalizing and Externalizing factors). The present study sought to answer the
question does the two-factor model of the MACI Personality Pattern and Clinical Syndrome
scales identified in previous research (Newman et al., 2015) fit for a court-referred juvenile
justice sample when using a confirmatory factor analysis? However, the solution proposed by
Newman et al was not supported with the current sample. Therefore the following research
question was then addressed: if the two-factor internalizing and externalizing model identified by
Newman et al. (2015) does not fit the current study’s court-referred juvenile justice sample, what
model has the best fit based on an exploratory factor analysis of the Personality Pattern and
Clinical Syndrome scales with the current sample?
For the current study, both the Internalizing and Externalizing factors had scales which
loaded positively on the factor, suggesting a trait is present, and scales which loaded negatively
on the scale, suggesting an inverse relationship between a trait and the overall factor. For the
current study, MACI scales which loaded positively on the Internalizing Factor, listed in order of
magnitude, were Depressive Affect, Self-Demeaning, Doleful, Suicidal Tendency, Introversion,
Borderline Tendency, Oppositional, Eating Dysfunction, and Inhibited. A high score on
Depressive Affect suggests feelings of ineffectiveness, guilt, fatigue, social withdrawal, and loss
of adequacy (Millon et al., 1993). A high scorer on Suicidal Tendency is experiencing suicidal
ideation and plans (Millon et al., 1993). Individuals with a high score of Self-Demeaning act in a
self-defeating manner and are content with suffering (Millon et al., 1993). The Doleful scale

SCALE-LEVEL FACTOR ANALYSES 88
assesses for a dejected and gloomy mood, and a pessimistic outlook on life (Millon et al., 1993).
High scores on Introversion are evident in individuals who tend to keep to themselves and are
apathetic (Millon et al., 1993). A high score on Borderline Tendency suggests severe personality
dysfunction, affective instability, erratic interpersonal relations, fear of abandonment, and self-
destructive actions (Millon et al., 1993). Individuals with a high score on Oppositional appear
discontented, sullen, passive-aggressive, and often behave unpredictably (Millon et al., 1993).
The Eating Dysfunctions scale measures a person’s propensity towards anorexia nervosa or
bulimia nervosa (Millon et al., 1993). A high score on Inhibited is present in individuals who are
shy, feel lonely, and avoid close interpersonal contact (Millon et al., 1993). Overall, for the
current study individuals who have high scores on the Internalizing factor are most noteworthy
for high levels of depression symptomology, suicidal ideation, feelings of worthlessness and
purposelessness, being self-defeating, socially withdrawn, having dysfunctional eating habits,
and having difficulty controlling their mood and behavior. The scales which loaded negatively
on the Internalizing factor, listed by order of magnitude, included Dramatizing, Conforming, and
Egotistic. Dramatizing measures the degree to which an individual is talkative, charming, and
emotionally expressive. High scores on Conforming suggest an individual is serious-minded,
respectful, rule-conscious, and keeps their emotions controlled (Millon et al., 1993). Individuals
who score high on Egotistic are overly confident, self-centered, and narcissistic (Millon et al.,
1993). These negative loadings suggest individuals who score high on the Internalizing factor
have difficulty controlling their mood, lack self-confidence, have a negative self-image, and tend
to keep to themselves. For the current study, individuals high on the Internalizing factor are more
likely to turn their emotional distress inward and act negatively towards themselves.
SCALE-LEVEL FACTOR ANALYSES 89
For the current study, the scales which loaded positively on the Externalizing factor,
listed by order of magnitude, included Impulsive Propensity, Unruly, Substance-abuse
Proneness, Forceful, Oppositional, Delinquent Predisposition, and Borderline Tendency.
Impulsive Propensity measures the degree to which a person is inclined to act out their feelings
with limited provocation and have control over their sexual and aggressive impulses (Millon et
al., 1993). A high score on Unruly is suggestive of acting in an antisocial manner and violating
social norms (Millon et al., 1993). Individuals with high scores on Substance-abuse proneness
have maladaptive patterns of alcohol and/or drug use (Millon et al., 1993). A high score on
Forceful suggests an individual is strong-willed and tends to dominate other people (Millon et
al., 1993). A high score on the Delinquent Predisposition scale is present when an individual’s
behavior is likely to lead to situations that violate the rights of others and result in the violation
of societal rules (Millon et al., 1993). For the current study, individuals who have high scores on
the Externalizing factor are most noteworthy for high levels of acting out their feelings without
self-control, engaging in maladaptive patterns of substance use, resisting adhering to social
norms and rules, being rebellious, strong willed, and tending to dominate others and violate their
rights. The scales which loaded negatively on the Externalizing factor, listed by order of
magnitude, included Submissive, Anxious Feelings, and Conforming. Submissive measures the
degree to which an individual is sentimental and kind in their relationships with others. A high
score on Anxious Feelings suggests an apprehensive, fretful, and nervous manner. These
negative loadings suggest individual’s high on the Externalizing factor are not likely to conform
to societal norms, have prosocial behaviors towards others, or be nervous. Overall, for the
present study individuals high on the Externalizing factor are more likely to turn their
psychological distress outward and inflict it on others through their negative behaviors.

SCALE-LEVEL FACTOR ANALYSES 90
Scales which cross-loaded on the Internalizing and Externalizing factors for the current
court-referred sample included the Conforming, Oppositional, and Borderline Tendency scales.
The Conforming scale was negatively associated with both factors suggesting individuals in the
current sample with high levels of externalizing and/or internalizing traits tend to lack respect,
not be rule-conscious, and not keep their emotions under control. Low levels of Conforming is
likely present across both factors as individuals in the present sample as a whole have violated
societal norms in some way which has led to their involvement in the juvenile justice system.
Additionally, individuals in the current sample have a high degree of mental health needs which
likely makes it difficult for them to control their emotions. Research suggests poor emotional
regulation may relate to vulnerability towards anxiety and mood disorders or features of anxiety
and mood disorders may be construed as problematic ways of regulating emotions (Campbell-
Sills & Barlow, 2007). Additionally, conditions such as Attention-Deficit/Hyperactivity Disorder
and Autism Spectrum Disorder are characterized by disordered self-regulation, including
emotion dysregulation (Bachevalier & Loveland, 2006; Barkley, 1997). Individuals with anxiety
disorders (12.4%), depressive disorder (30.5%), ADHD (50.8%), and ASD (6.8%) were all
present within the current sample. The Oppositional and Borderline Tendency scales loaded
positively on both the Internalizing and Externalizing factors suggesting individuals high on
either factor have severe personality dysfunction and behave unpredictably. Adolescents in the
current sample may have behaved in unpredictable ways which violated societal norms and led
to their involvement in the juvenile justice system. Additionally, high levels of personality
dysfunction are not unexpected within the present sample as the adolescents’ psychological
distress and interpersonal interaction style has led to their need for a psychological evaluation
through the juvenile justice system.

SCALE-LEVEL FACTOR ANALYSES 91
The current study’s factor structure had the same cross loadings as Newman et al.’s
(2015). The only place where the current factor structure diverged from Newman et al.’s (2015)
factor structure is the loading of the Delinquent Predisposition scale. High scores on the
Delinquent Predisposition scale reflect behavior that has or may lead to situations where
individuals’ rights are violated or which break societal norms and rules (Millon, 1993). For the
current study, the Delinquent Predisposition scale loaded positively on the externalizing factor;
however, in Newman et al.’s (2015) study it loaded negatively on the internalizing factor.
Theoretically, one would predict a predisposition to engage in delinquent acts, violate others’
rights, and break societal norms would be negatively associated with internalizing
characteristics, as adolescents who internalize their psychological distress take their feelings out
of themselves, and positively associated with externalizing characteristics, as adolescents who
externalize their distress take it out on others through their behavior (Zahn-Waxler, Klimes-
Dougan, & Slattery, 2000). Theoretically, individuals with internalizing conditions, such as
anxiety and depression, should have lower scores on the Delinquent Predisposition scale as their
conditions are characterized by internal struggles which they then inflict on themselves through
negative cognitions (Grabber & Sontag, 2009; Zahn-Waxler, Klimes-Dougan, & Slattery, 2000).
Conditions which would be positively associated with elevations on the Delinquent
Predisposition scale include Oppositional Defiant Disorder (ODD) and Conduct Disorder (CD).
Both ODD and CD are characterized by the individual engaging in behaviors which violate
societal norms and rules (Farrington, 2000). CD is a more extreme form of externalizing internal
conflict than ODD as it rises to the level of violating individuals’ rights; therefore, individuals
with CD would be expected to have a higher elevation on the Delinquent Predisposition scale
than those with ODD. Millon (1993) posited adolescents who have internal turmoil may become

SCALE-LEVEL FACTOR ANALYSES 92
problematic for society when they gain attention from others by inflicting their distress on others.
The pattern of higher levels of delinquency being associated with externalizing problems and
lower levels of delinquency being associated with internalizing problems emerged across both
the current study and Newman et al.’s study; however, statistically the scale loaded differently.
The difference in loading of the Delinquent Predisposition scale between the present study and
Newman et al.’s (2015) is perhaps due the aforementioned differences in the sample and/or to
psychometric issues within the MACI (Retzlaff, 1995; Stuart, 1995). Specifically, the degree of
item overlap across scales leads to poor structural validity (i.e. the scale does not reflect the
dimensionality of the construct it posits to measure) of the MACI which may lead to the
instability with the scale-level factors (Newman et al., 2015; Retzlaff, 1995; Stuart, 1995).
The similarity between the factor structure of the MACI found in the current study and
Newman et al.’s is notable as none of the previous studies (i.e., Adkisson et al., 2012; Newman
et al., 2015; Romm et al., 1999; Salekin et al., 2002) have supported the same number of factors
or a similar loading of scales on factors. Interpretation of the MACI scales was not designed to
lead to a specific diagnosis, but instead to lead the clinician in a direction for further assessment
to determine the presence of a specific condition. The Internalizing and Externalizing factors in
the present study define the way an individual tends to interact with the world (e.g.., do they
direct their psychological distress internally toward themselves or externally toward others) and
clinical syndromes within the Diagnostic and Statistical Manual of Mental Disorders, Fifth
Edition (DSM-5; APA, 2015) are generally organized around these interactional styles.
Comorbidity is higher between conditions which fall under the broad umbrella of internalizing
(e.g. anxiety and depression) or externalizing (e.g. ADHD and ODD) than across the two
dimensions. Newman et al. (2015) posited that in populations with a high degree of comorbidity,
SCALE-LEVEL FACTOR ANALYSES 93
such as adolescents including those in the current sample, it may be more useful to identify broad
traits of internalizing or externalizing psychological distress than identifying a specific
diagnostic impression. Newman et al. (2015) concluded the results of their study was
noteworthy given that the MACI was not developed using factor analytic methods and the factor
structure supported theories of diagnostic comorbidity in adolescence. The current study further
lends support along these lines by providing additional evidence the Personality Pattern and
Clinical Syndrome scales of the MACI can be collapsed into broad Externalizing and
Internalizing factors for a general court-referred sample.
The MACI was designed to be used as a diagnostic tool in line with Millon’s theory of
personality and psychopathology (Davis, 1999). Millon’s idea was that results of the MACI
would lead a clinician toward a “personality prototype” which closely corresponded to the
Diagnostic and Statistical Manual of Mental Disorders, Fourth Edition (DSM-IV; American
Psychiatric Association [APA], 1994) personality disorders (Davis, 1999; p. 336). However,
results of the current study support the conclusion drawn by Newman et al. (2015) that the two-
factor model derived from the MACI scales does not support the complex taxonomy outlined in
Millon’s theory of personality as only two unique factors emerge. There is a high degree of item
overlap amongst the scales of the MACI. Although many mental health conditions share
common features or symptoms and/or present as comorbid conditions, the item overlap across
scales leads to psychometric issues within the MACI and undermines the scales ability to
dimensionally measure the constructs the purport to measure(Newman et al., 2015; Retzlaff,
1995; Stuart, 1995). The item overlap makes it likely endorsement of items, which are present on
multiple scales, will lead to clinical elevations on numerous scales. This undermines the clinical
utility of the MACI as it is designed to be interpreted in a manner of identifying specific

SCALE-LEVEL FACTOR ANALYSES 94
diagnostic impressions from the individual scales. The current study lends further support to the
idea that the MACI is a useful tool in exploring internalizing and externalizing constructs within
not only detained adolescents (Newman et al., 2015), but also a more general court-referred
population if interpreted using scale-level factors which emphasize a perspective of
understanding adolescent comorbidity.
For results from an assessment measure to be admissible within a court system the
assessment tool must meet the Daubert Standard. Daubert v. Merrell Dow Pharmaceuticals
(1993) was a Supreme Court case that defined the standards that must be met before an expert is
allowed to present evidence in court based on a specific method or technique. The Daubert
Standard posits the technique must be generally accepted within the specialty area of the expert
and the technique must have a body of published peer-reviewed research establishing its
reliability and validity (Daubert v. Merrell Dow Pharmaceuticals, 1993). As research has
indicated the MACI is the second most widely utilized objective personality assessment for
forensic evaluations (Archer et al., 2006; Baum et al., 2009), the first criteria can be considered
met. The question that remains is whether or not the extant literature on the MACI is sufficient to
meet the second criteria. Woodland and colleagues (2014) argued the research to date on the
validity and reliability of the MACI has not yet reached the standards for educational and
psychological assessment required by the American Psychological Association and American
Educational Research Association (American Educational Research Association, American
Psychological Association, & National Council on Measurement in Education, 2014). The
current study lends further support to the fact that the MACI is a clinically useful tool for
exploring internalizing and externalizing traits within court-referred populations. More
specifically, the current study supports an interpretation approach to the MACI which collapses

SCALE-LEVEL FACTOR ANALYSES 95
the scales into broader Internalizing and Externalizing factors. The current study expands the
previous research by generalizing this interpretive protocol to a less homogenous court-referred
sample than previous research (e.g. Newman et al., 2015) as the factor structure was largely
replicated. Additionally, the current study provided additional support for the notion that the
MACI may be most useful to clinicians completing forensic evaluations if they use it to assess
for an individual’s approach to dealing with psychological distress as opposed to using it to
arrive at a specific diagnostic picture.
MMPI-A Factor Analysis Implications
There have been three previous scale-level factor analytic studies of the MMPI-A (i.e.,
Archer et al., 1994; Archer & Krishnamurthy, 1997; Archer et al., 2002) which have led to a
fairly consistent scale-level factor structure of the MMPI-A. The MMPI-A Structural Summary
was then developed as a method of interpretation which organized the large number of scales of
the MMPI-A around the eight factor dimensions (Archer and Krishnamurthy, 1994). Archer et
al. (2002) argued the ability for clinicians to usefully utilize the Structural Summary in a range of
settings was dependent on research showing “the eight primary factors are relatively invariant
and robust for adolescents across a variety of settings and problem areas,” (p. 323). As such, one
of the goals of the current study was to answer the question: Does the eight-factor solution of the
69 MMPI-A scales and subscales (i.e. seven validity scales, 10 Clinical Scales, 15 Content
Scales, six Supplementary Scales, 28 Harris-Lingoes Subscales, and three Si subscales)
identified in previous research (i.e., Archer et al., 1994; Archer et al., 2002; Archer &
Krishnamurthy, 1997) fit for a court-referred juvenile justice sample when using a confirmatory
factor analysis? The current sample differs from Archer et al.’s (2002) sample as it includes
court-referred youth other than those from secure detention and the current sample includes

SCALE-LEVEL FACTOR ANALYSES 96
females whereas Archer et al.’s sample only included males. There has also been a demographic
shift in the make-up of the United States since the three previous factor analytic studies were
conducted and the current sample is more consistent with the current United States demographics
than the previous studies. Additionally, attitudes and problems faced by youth today are different
than those of youth 20-30 years ago. Despite the differences in sample characteristics of the
current sample, the eight-factor structure of the Structural Summary was supported using an up-
to-date court-referred sample.
The current study found the same factor loadings as the Structural Summary (Archer and
Krishnamurthy, 1994). The factors are labeled as: General Maladjustment, Immaturity,
Disinhibition/Excitatory Potential, Social Discomfort, Health Concerns, Naiveté, Familial
Alienation, and Psychoticism (Archer and Krishnamurthy, 1994). Archer and Krishnamurthy
(1994) provide in-depth descriptions of each factor. The following factor descriptions apply to
the factor structure from the Structural Summary and the current study as the present study
confirmed Archer and Krishnamurthy’s (1994) results. The General Maladjustment factor
includes loadings from 23 scales/subscales and high scores suggest substantial emotional distress
and poor adjustment to home and school. The Immaturity factor includes 15 scales/subscales and
high scores are associated with egocentric thinking, limited self-awareness, poor judgement and
impulse control, and interpersonal difficulties. The Disinhibition/Excitatory potential factor
contains 12 scales/subscales and high scores are reflective of impulsivity, discipline problems,
and interpersonal conflict with peers and parents. The Social Discomfort factor contains 8 scales/
subscales and high scores on this factor suggest high levels of internalizing behaviors,
withdrawal, self-consciousness, and uncertainty in social scenarios. The Health Concerns factor
contains six scales/subscales and high scores are seen in individuals who tire quickly, have poor

SCALE-LEVEL FACTOR ANALYSES 97
endurance, have a history of weight loss and sleep difficulties, and are viewed by others as
dependent, isolated, shy, and unhappy. The Naiveté factor contains 5scales/subscales and high
scores are present in individuals who deny hostile/negative impulses and who present themselves
as trusting, optimistic, and socially conforming. The Familial Alienation factor contains 4
scales/subscales and high scores are evident in individuals who are seen as hostile, delinquent,
and aggressive by their parents. The Psychoticism factor contains 4 scales//subscales and high
scores are reflective of high levels of obsessiveness, social disengagement, feelings others are
out to get them, and sudden mood changes.
Similar to the MACI, there are construct and item overlap between the MMPI-A scales.
The Structural Summary assists clinicians in the interpretation of MMPI-A profiles in that it
condenses the large number of scales and information associated with those scales into eight
broad dimensions for interpretation. Empirical behavioral correlates have been previously
derived for the Structural Summary factors for interpretive purposes. Research thus far, including
the present study, supports the use of the Structural Summary for community, clinical, detained,
and court-referred adolescents as a fairly consistent factor structure has emerged across these
samples (Archer et al., 1994; Archer & Krishnamurthy, 1997; Archer et al., 2002).
As stated previously, the Daubert Standard posits a technique must be generally accepted
within a specialty area and the technique must have a body of published literature establishing its
reliability and validity in order for the results to be admissible in court (Daubert v. Merrell Dow
Pharmaceuticals, 1993). The MMPI-A is one of the most frequently used self-reports tools for
assessing adolescents and it is the most often used self-report measure when conducting
evaluations in juvenile justice settings (Archer et al., 2006; Archer & Newsome, 2000; Baum et
al., 2009). There is also documented use of the MMPI-A in legal cases addressing a number of
SCALE-LEVEL FACTOR ANALYSES 98
issues including: competency to stand trial, transfer to adult status, sentencing mitigation factors,
and child-custody (O’Connor Pennuto & Arhcer, 2008). As such, the first criteria of the Daubert
Standard can be considered met. Similar to with the MACI, the question that remains regarding
the Daubert Standard is whether or not the extant literature on the MMPI-A is sufficient to meet
the second criteria. There has been a large body of research published on the MMPI-A with 112
books, chapters, monographs, and articles referencing the MMPI-A published within the first 10
years after publication of the MMPI-A with an additional 57 publications emerging between
2003 and 2007 (Baum et al., 2009; Forbey, 2003). More specifically, the question is whether
there is enough research on the use of the Structural Summary with different samples to support
its use within forensic psychology. The current study adds to the extant literature and provides
further support to meet the second criteria of the Daubert Standard as it supports the use of the
MMPI-A Structural Summary with a modern court-referred sample containing both males and
females.
Canonical Correlation Implications
The MMPI-A and MACI are both objective personality assessment tools designed to
measure personality characteristics and psychopathology within adolescents. They are also two
of the most frequently utilized self-report tools for assessing adolescents (Archer & Newsome,
2000) and they have gained significant attention within forensic settings as the MMPI-A is the
most often used self-report measure when conducting evaluations in juvenile justice settings and
the MACI is the second most widely utilized for forensic evaluations (Archer et al., 2006; Baum
et al., 2009). Although the measures posit to have been developed for similar purposes, they
differ in the underlying theory from which they were derived and the methods used to develop
the measures. It has been argued that further research is still needed in order to determine if the

SCALE-LEVEL FACTOR ANALYSES 99
MACI should be used as a complimentary assessment or an alternative assessment to the MMPI-
A when evaluating adolescents’ level of symptomology as it remains unclear to what extent the
two measures are evaluating the same or different constructs (Baum et al., 2009). The final goal
of the current study was to determine the degree of construct overlap between the MACI and
MMPI-A by answering the question: based on canonical correlations between the MMPI-A
Clinical and Content scales and the MACI Personality Pattern and Clinical Syndrome scales
what is the degree of shared variance between these two measures?
Within the current study five canonical dimensions emerged as significant with the
majority of the MACI and MMPI-A scales being significantly correlated with Dimension 1.
Dimension 1 accounted for 80.6% of the variability in scores between the MACI and MMPI-A.
The scale which contributed most to the relationship between the two measures was MMPI-A
Clinical Scale 7 which assesses an individual’s level of psychological turmoil and discomfort
with higher scores suggesting a greater level of psychological distress (Butcher & Williams,
2000). Clinical Scale 7 was negatively associated with Dimension 1. Other scales which had the
highest negative correlations (above -0.80) with Dimension 1 included MMPI-A scales of
Clinical Scale 8, Depression, Alienation, Low Self-Esteem, and MACI scales of Introversion and
Depressive Affect. Characteristics commonly associated with these scales include unusual
sensory experiences, symptoms of depression/mood concerns, feelings others are unkind to them,
preferring to keep to themselves, poor self-concept, and feelings of failure (Butcher & Williams,
2000). Three MACI scales, Dramatizing, Egotistic, and Conforming, contributed highly to the
relationship between the two measures and had a positive association with Dimension 1. High
scores on these scales are characteristic of individuals who are charming, talkative, self-centered,
confident, respectful, and rule-conscious (Millon et al., 1993). Overall, Dimension 1, which

SCALE-LEVEL FACTOR ANALYSES 100
accounts for the majority of the relationship between the MACI and MMPI-A, suggests most of
the variability in scores on the MACI and MMPI-A is due to general psychological distress and
mood concerns.
The scale which had the strongest positive association with Dimension 2 was the MACI
scale of Unruly which assess the degree to which a person acts out in an antisocial manner and
resists adhering to social norms (Millon et al., 1993). Other scales which had the strongest
positive correlations with Dimension 2 included MACI scales of Substance-abuse Proneness,
Delinquent Predisposition, and Impulsive Propensity. High scores on these scales are
characteristic of alcohol and/or drug abuse, violating the rights of others, and poor self-control of
sexual and aggressive impulses (Millon et al., 1993). Scales which had strong negative
relationships with Dimension 2 were MACI scales of Anxious Feelings and Submissive.
Individuals high on Anxious Feelings tend to be fretful and nervous and those high on
Submissive are sentimental and kind to others (Millon et al., 1993). Overall, Dimension 2 is
positively associated with externalizing behaviors which violate social norms and the rights of
others, and negatively associated with passiveness and prosocial behaviors. Although there were
six scales from the MACI which were significantly correlated with Dimension 2, the MACI not
only had more scales which contributed to Dimension 2, but the relationship between the MACI
and Dimension 2 was also stronger.
Dimension 3 only had one scale, MMPI-A Clinical Scale 4, which was significantly
correlated with it. Clinical Scale 4 was negatively associated with Dimension 3. Individuals who
have high scores on Clinical Scale 4 are often described as having difficulty incorporating the
values of society, engaging in antisocial acts, and rebellious (Butcher & Williams, 2000).
Interestingly, many of the descriptors associated with Clinical Scale 4 are similar to those used to

SCALE-LEVEL FACTOR ANALYSES 101
describe the MACI scales strongly associated with Dimension 2; however, the scales were
associated with different canonical dimensions. This suggests that although they purport to be
measuring similar constructs they contain unique variance.
Three MMPI-A scales (i.e. Clinical Scale 5, Obsessiveness, and Bizarre Mentation) and
one MACI scale (i.e. Suicidal Tendency) were positively correlated with Dimension 4; however,
the correlations were only moderate (.337 to .375). Characteristics associated with scales which
are positively correlated with Dimension 4 include: difficulty making decisions, rigidity, worry
over trivial factors, being angry/hostile, rejecting of stereotypical gender-based interests, and
suicidal ideation (Butcher & Williams, 2000; Millon et al., 1993). Dimension 5 only had one
scale, Self-demeaning from the MACI, which was correlated with it. Self-demeaning was
negatively associated with Dimension 5 and the correlation was moderate (-.344). Individuals
who score high on Self-demeaning tend to act in self-defeating ways and are content to suffer
(Millon et al., 1993).
In sum, results of the canonical correlations between the MACI and MMPI-A support the
fact that the two instruments are largely measuring the same constructs and, therefore, they are
redundant measures for court-referred adolescents. Given the redundant nature of the measures,
the MACI and MMPI-A should be considered alternative assessments tools for court-referred
youth as opposed to complimentary. Therefore, clinicians should consider basic psychometric
properties, their competency with interpreting the tool, and whether their client fits with the
normative sample when determining which measure to administer to court-ordered youth such as
those in the current sample.

SCALE-LEVEL FACTOR ANALYSES 102
Strengths and Limitations
Strengths
Previous research on the MACI and MMPI-A within forensic populations has largely
sampled individuals in secure detention. Within detention centers high rates of conduct disorder,
substance abuse, depression, anxiety, attention-deficit/hyperactivity disorder, psychotic
disorders, and sleep disorders are found (Pyle et al., 2016); however, rates of conditions vary
across placement setting. Youth placed in the community on probation tend to display
significantly less substance use problems and fewer mental health needs than youth detained or
placed in residential treatment (Lyons et al., 2001). As the current study used court-referred
youth from a wide range of placement settings, the results are generalizable to a wider array of
adolescents receiving forensic evaluations than those in previous studies which only included
individuals from detention.
Additionally, much of the previous research on the MACI and MMPI-A within forensic
settings has neglected to include females which makes the results of those studies less clinically
useful with females in forensic settings as previous research has shown there are significant
differences in mental health needs, cognitive ability, academic achievement, and family stressors
between males and females within forensic samples. A strength of the current study is that data
were drawn from both males and females within a court-referred sample.
The statistical procedures employed for the exploratory factor analysis is also a strength
of the current study. Statisticians have raised concern with the eigenvalues-greater-than-one rule
as it tends to either overestimate or underestimate the optimal number of components, and the
components are not always reliable (Cliff, 1988; Zwick & Velicer, 1986). Parallel analysis and
Velicer’s MAP test, which were used in the present study, have been established as superior

SCALE-LEVEL FACTOR ANALYSES 103
methods for determining the number of factors to be extracted (O’Connor, 2000). Additionally,
canonical correlation is a statistical procedure which has not been used within the previous
literature to examine the relationship between the MACI and MMPI-A. The use of canonical
correlations allows for a more in-depth examination of the relationship between measures as it
not only gives you information about the overall relationship, but additionally provides
information about which variables were the most important contributors to the overall
relationship.
Limitations
The primary limitation of the current study was the sample size. Recommendations on the
minimum number of participants needed for factor analysis varies widely. Some researchers
suggest a proportion of participants to variables; however, even these proportions vary. Typical
recommendations range from 3 to 10 participants per variable (MacCallum et al., 1999).
Although the minimum of three participants per variable was met when the CFA was conducted
containing both valid and invalid protocols, this minimum was not met when invalid profiles
were removed from the sample. As such, it is possible the CFA containing only valid profiles
may not have had enough statistical power to obtain significant results due to not having enough
participants per variable.
The present study excluded 104 participants from the original data set due to the
participants either not having complete MMPI-A or MACI profiles due to one of the measures
not being administered to the participants or not all applicable scores of one of the meausres
being available. Individuals who did not complete either the MACI or MMPI-A were excluded
from the sample as they would not have been able to be included in the canonical correlation
analysis as the analysis required a comparision between the two measures for each participant.
SCALE-LEVEL FACTOR ANALYSES 104
Additionally, individuals who had some scale scores missing were excluded due to all scales
being used in part of the present analysis. Additionally, analysis was not completed to determine
if there were characteristic differences (i.e. IQ, reading ability, or diagnoses) between those who
were excluded and those included. The dataset for the present study also did not include
information regarding the participants socialeconomic status which would be informative in
describing the overall sample.
Although the current sample is more diverse than Newman et al.’s (2015) in terms of
clinical setting, the nature of the court-referred sample limits generalizability of the results to
other clinical and community samples. As discussed previously, research has shown that
individuals from different clinical and forensic settings are characteristically distinct from one
another. As such, it is possible the factor structure of the MMPI-A and MACI may vary from
setting to setting or that the tools may be measuring different constructs within different
populations. For example, an outpatient clinic specializing in Autism Spectrum Disorder may
have clients who get elevations on scales assessing socialization and adherence to social norms
in a pattern similar to those present in court-ordered samples; however, the reason for the
elevations are clinically different. Although these samples may have similar clinical elevations, it
is plausible the assessment tools are actually picking up on different characteristics within the
different samples.
An additional limitation of the current study is the ethnic make-up of sample as it was
different than that generally found within the juvenile justice system and the general United
States population. The National Council on Crime and Delinquency (2007) reported ethnic
minority youth are over-represented in the juvenile justice system. During 2013, 62% of
delinquency cases were accounted for by white youth, 35% were African American, 2% were

SCALE-LEVEL FACTOR ANALYSES 105
American Indian, and 1% was Asian American (OJJDP, 2015). The general ethnic makeup of
juveniles in the United States for the same year was 76% white, 16% African American, 2%
American Indian, and 6% Asian American (OJJDP, 2015). Self-identified ethnicity within the
current sample was 68.8% white non-Hispanic, 14.6% African American, 1.9% Latino/a, 0.8%
Native American, 10.5% biracial, 1.5% multiracial, and 1.1% unknown.
Directions for Future Research
Future research should aim to replicate the results of the current study with larger
samples which meet statistical recommendations for sample size. Larger sample sizes would
allow for increased statistical power and more robust results to confirm the presence of the
identified scale-level factor structures of the MMPI-A and MACI. Based on general sample size
recommendations of participants needed per variable, future studies of the MMPI-A should aim
to have at least 350 participants and studies of the MACI should have at least 100 participants.
Additionally, future studies should aim to obtain samples from different settings such as those
from non-court-referred outpatient clinics and hospitals. Research on the use of a scale-level
factor approach to interpretation of the MMPI-A and MACI is still emerging and additional
validation is needed for wide spread generalizability of this approach. Although a strength of the
current study was the inclusion of females within a court-referred sample, the distribution of
males and females was far from even as 65% of the sample was male. This is largely due to the
higher rate of males within the adolescent forensic population. Females account for slightly more
than 25% of all delinquency cases within the court system (OJJDP, 2015). Future studies should
aim to obtain a larger sample which contains even numbers of males and females in order for
analysis to be completed for samples as a whole, in addition to separate analyses for males and
females. This would allow for researchers to determine if there are gender differences in the

SCALE-LEVEL FACTOR ANALYSES 106
factor structure of the MMPI-A and MACI for males and females. At this point, possible gender
differences in factor structure have been largely unexplored as most of the previous literature
only contains males and the literature that did contain females did not test for possible gender
differences. Future research should also endeavor to determine if a different factor structure
emerges for valid and invalid MMPI-A profiles. The current study’s results were more robust
when both clinically invalid and valid profiles were included. Although it is likely this was due
to the increased sample size and associated increase in statistical power from having a larger
sample, it cannot be ruled out that the factor structure may differ for those individuals who
respond in an invalid manner.

SCALE-LEVEL FACTOR ANALYSES 107
REFERENCES
Achenbach, T. M. (1991). Manual for the youth self-report and 1991 profile. Burlington, VT:
University of Vermont Department of Psychiatry.
Adkisson, R., Burdsal, C., Dorr, D., & Morgan, C. D. (2012). Factor structure of the Millon
Adolescent Clinical Inventory scales in psychiatric inpatients. Personality and Individual
Differences, 53, 501-506. doi:10.1016/j.paid.2012.04.007
American Educational Research Association, American Psychological Association, & National
Council on Measurement in Education. (2014). Standards for educational and
psychological test. Washington, DC: Author.
American Psychiatric Association. (1987). Diagnostic and statistical manual of mental disorders
(3rd
ed. Revised). Arlington, VA: American Psychiatric Association.
American Psychiatric Association. (1994). Diagnostic and statistical manual of mental disorders
(4th
ed.). Arlington, VA: American Psychiatric Association.
American Psychiatric Association. (2000). Diagnostic and statistical manual of mental disorders
(4th
ed. Text Revision). Arlington, VA: American Psychiatric Association.
American Psychiatric Association. (2013). Diagnostic and statistical manual of mental disorders
(5th
ed.). Arlington, VA: American Psychiatric Association.
Archer, R, & Krishnamurthy, R. (1997). MMPI-A scale-level factor structure: Replication in a
clinical sample. Assessment, 4, 337-349. doi:10.1177/107319119700400404
Archer, R. P. (2005). MMPI-A: Assessing adolescent psychopathology. Mahwah, NJ: Lawrence
Erlbaum.
Archer, R. P., & Gordon, R. (1994). Psychometric stability of MMPI-A item modifications.
Journal of Personality Assessment, 62, 416-426. doi:10.1207/s15327752jpa6203_3

SCALE-LEVEL FACTOR ANALYSES 108
Archer, R. P., & Krishnamurthy, R. (1994). A structural summary approach for the MMPI-A:
Development and empirical correlates. Journal of Personality Assessment, 63, 554-573.
doi:10.1207/s15327752jpa6303_11
Archer, R. P., & Newsom, C. R. (2000). Psychological test usage with adolescent clients: Survey
update. Assessment, 7, 227-235. doi:10.1177/107319110000700303
Archer, R. P., Belevich, J. K., & Elkins, D. E. (1994). Item-level and scale-level factor structures
of the MMPI-A. Journal of Personality Assessment, 62, 332.
doi:10.1207/s15327752jpa6202_13
Archer, R. P., Bolinskey, P. K., Morton, T. L., & Farris, K. L. (2002). A factor structure for the
MMPI-A: Replication with male delinquents. Assessment, 9, 319-326.
doi:10.1177/1073191102238150
Archer, R. P., Bolinskey, P. K., Morton, T. L., & Farris, K. L. (2003). MMPI-A characteristics of
male adolescents in juvenile justice and clinical treatment settings. Assessment, 10, 400-
410. doi:10.1177/1073191103256128
Archer, R. P., Buffington-Vollum, J. K., Stredny, R. V., & Handel, R. W. (2006). A survey of
psychological test use patterns among forensic psychologists. Journal of Personality
Assessment, 87, 85-94. doi:10.1207/s15327752jpa8701_07
Archer, R. P., Handel, R. W., & Lynch, K. D. (2001). The effectiveness of MMPI-A items in
discriminating between normative and clinical samples. Journal of Personality
Assessment, 77, 420-435. doi:10.1207/S15327752JPA7703_04
Archer, R. P., Maruish, M., Imhof, E. A., & Piotrowski, C. (1991). Psychological test usage with
adolescent clients: 1990 survey findings. Professional Psychology, 22, 247-252.
doi:10.1037/0735-7028.22.3.247

SCALE-LEVEL FACTOR ANALYSES 109
Arita, A. A., & Baer, R. A. (1998). Validity of selected MMPI–A content scales. Psychological
Assessment, 10, 59-63. doi:10.1037/1040-3590.10.1.59
Bachevalier, J., & Loveland, K. A. (2006). The orbitofrontal-amygdala circuit and self-regulation
of social-emotional behavior in autism. Neuroscience & Biobehavioral Reviews, 30, 97-
117. https://doi.org/10.1016/j.neubiorev.2005.07.002
Barkley, R. A. (1997). Attention-deficit/hyperactivity disorder, self-regulation, and time: Toward
a more comprehensive theory. Journal of Developmental and Behavioral Pediatrics, 18,
271-279. http://dx.doi.org/10.1097/00004703-199708000-00009
Baum, L. J., Archer, R. P., Forbey, J. D., & Handel, R. W. (2009). A review of the Minnesota
Multiphasic Personality Inventory-Adolescent (MMPI-A) and the Millon Adolescent
Clinical Inventory (MACI) with an emphasis on juvenile justice samples. Assessment, 16,
384-400. doi:10.1177/1073191109338264
Beck, A. T., & Steer, R. A. (1987). Beck Depression Inventory manual. San Antonio, TX: The
Psychological Corporation.
Berndt, D. J. (1986). Multiscore depression inventory (MDI) manual. Los Angeles, CA: Western
Psychological Services.
Blumentritt, T. L., & VanVoorhis, C. W. (2004). The Millon Adolescent Clinical Inventory: Is it
valid and reliable for Mexican American youth? Journal of Personality Assessment, 83,
64-74. doi:10.1207/s15327752jpa8301_06
Butcher, J. N., Dahlstrom, W. G., Graham, J. R., Tellegen, A. M., & Kaemmer, B. (1989).
Minnesota Multiphasic Personality Inventory-2 (MMPI-2): Manual for administration
and scoring. Minneapolis, MN: University of Minnesota Press.

SCALE-LEVEL FACTOR ANALYSES 110
Butcher, J. N. & Williams, C. L. (2000). Essential of MMPI-2 and MMPI-A interpretation.
Minneapolis, MN: University of Minnesota Press.
Butcher, J. N., Williams, C. L., Graham, J. R., Archer, R. P., Tellegen, A., … & Kaemmer, B.
(1992). Minnesota Multiphasic Personality Inventory – Adolescent. Minneapolis, MN:
University of Minnesota Press.
Campbell-Sills, L., & Barlow, D. H. (2007). Incorporating emotion regulation into
conceptualizations and treatments of anxiety and mood disorders. In J. J. Gross
(Ed.), Handbook of emotion regulation (pp. 542-559). New York, NY, US: Guilford
Press.
Capwell, D. F. (1945). Personality patterns of adolescent girls: II. Delinquents and
nondelinquents. Journal of Applied Psychology, 29, 284-297. doi: 10.1037/h0054701
Carrillo, P. B. (2004). Factor analysis of the Millon Adolescent Clinical Inventory: Testing the
goodness of fit of Millon’s measure of adolescent psychopathology. (Unpublished
doctoral dissertation, Washington State University, Pullman, Washington).
Cauffman, E., Piquero, A. R., Broidy, L., Espelage, D. L., & Mazerrolle, P. (2004).
Heterogeneity in the association between social-emotional adjustment profiles and
deviant behavior among male and female serious juvenile offenders. International
Journal of Offender Therapy and Comparative Criminology, 48, 235-252.
doi:10.1177/0306624X03261255
Claiborn, C. D. (1995). Test review of Minnesota Multiphasic Personality Inventory -
Adolescent. In J. C. Conoley & J. C. Impara (Eds.), The twelfth mental measurements
yearbook (pp. 626-628). Lincoln, NE: Buros Center for Testing.
SCALE-LEVEL FACTOR ANALYSES 111
Cliff, N. (1988). The eigenvalues-greater-than-one rule and the reliability of components.
Psychological Bulletin, 103, 276-279.
Colligan, R. C., & Offord, K. P. (1989). The aging MMPI: Contemporary norms for
contemporary teenagers. Mayo Clinic Proceedings, 64, 3-27. doi:10.1016/S0025-
6196(12)65299-9
Connor, D. F., Doerfler, L. A., Toscano, P. F., Volungis, A. M., & Steingard, R. J. (2004).
Characteristics of children and adolescents admitted to a residential treatment center.
Journal of Child and Family Studies, 13, 497-510.
doi:10.1023/B:JCFS.0000044730.66750.57
Cox, A. C., Weed, N. C., & Butcher, J. N. (2009). The MMPI-2: History, Interpretation, and
Clinical issues. In J. N. Butcher (Ed.) Oxford handbook of personality assessment (pp.
250-276). New York, NY: Oxford University Press.
Cumella, E. J., & Lafferty O’Connor, J. (2009). Assessing adolescents with the MMPI-A. In J.
N. Butcher (Ed.) Oxford handbook of personality assessment (pp. 485-498). New York,
NY: Oxford University Press.
Daubert v. Merrell Dow Pharmaceuticals, inc., 590 U.S. 579 (1993).
Davis, R. D. (1999). Millon: Essentials of his science, theory, classification, assessment, and
theory. Journal of Personality Assessment, 72, 330-352.
doi:10.1207/S15327752JP720302
Dekovic, M., Buist, K. L., & Reitz, E. (2004). Stability and changes in problem behavior during
adolescent latent growth analysis. Journal of Youth and Adolescence, 33, 1-12.
doi:10.1023/A:1027305312204
SCALE-LEVEL FACTOR ANALYSES 112
Farrington, D. P. (2000). Conduct disorder, aggression, and delinquency. In R. M. Lerner & L.
Steinberg (Eds.), Handbook of adolescent psychology: Individual bases of adolescent
development (pp. 683-722). Hoboken, NJ, US: John Wiley & Sons Inc.
Federal Bureau of Investigation. (2009). Crime in the United States 2009. Washington, D.C.
Retrieved from http://www.fbi.gov/ucr/cius2009/data/table_32.html.
Floyd, F. J., & Widaman, K. F. (1995). Factor analysis in the development and refinement of
clinical assessment instruments. Psychological Assessment, 7, 286–299.
http://dx.doi.org/10.1037/1040-3590.7.3.286
Forbey, J. D. (2003, June). A review of the MMPI-A literature. Paper presented at the 38th
annual
symposium on recent developments in the use of the MMPI-2 & MMPI-A, Minneapolis,
MN.
Forbey, J. D., & Ben-Porath, Y. S. (2003). Incremental validity of the MMPI-A content scales in
a residential treatment facility. .Assessment, 10, 191-202.
doi:10.1177/1073191103010002010
Gavazzi, S. M. (2006). Gender, ethnicity, and the family environment: Contribution to
assessment efforts within the realm of juvenile justice. Family Relations, 55, 190-199.
doi:10.1111/j.1741-3729.2006.00369.x
Gottesman, I. I., Hanson, D. R., Kroeker, T. A., & Briggs, P. F. (1987). New MMPI normative
data and power-transformed T-score tables for the Hathaway-Monachesi Minnesota
cohort of 14,019 fifteen-year-olds and 3,674 eighteen-year olds. In R. P. Archer (Ed.),
Using the MMPI with adolescents (pp. 241-297). Hillsdale, NJ: Lawrence Erlbaum.
SCALE-LEVEL FACTOR ANALYSES 113
Graber, J. A., & Sontag, L. M. (2009). Internalizing problems during adolescence. In R. M.
Lerner & L. Steinberg (Eds.), Handbook of adolescent psychology: Individual bases of
adolescent development (pp. 642-682). Hoboken, NJ, US: John Wiley & Sons Inc.
Grisso, T. (2005). Evaluating the properties of instruments for screening and assessment, In T.
Grisso, G. Vincent, & D. Seagrave (Eds.), Mental health screening and assessment in
juvenile justice (pp. 71-93). New York, NY: Guildford Press.
Handwerk, M. L., Clopton, K., Huefner, J. C., Smith, G. L., Hoff, K. E., & Lucas, C. P. (2006).
Gender differences in adolescents in residential treatment. American Journal of
Orthopsychiatry, 76, 312-324. doi:10.1037/0002-9432.76.3.312
Hathaway, S. R., & McKinley, J. C. (1943). The Minnesota Multiphasic Personality Inventory
(Rev. ed.). Minneapolis MN: University of Minnesota Press.
Hiatt, M. D., & Cornell, D. G. (1999). Concurrent validity of the Millon Adolescent Clinical
Inventory as a measure of depression in hospitalized adolescents. Journal of Personality
Assessment, 73, 64-79. doi:10.1207/S15327752JPA730105
IBM Corp. Released 2015. IBM SPSS Statistics for Windows, Version 24.0. Armonk, NY: IBM
Corp.
Kaufman, A. S., & Kaufman, N. L. (2004a). Kaufman Assessment Battery for Children - Second
Edition. San Antonio, TX: Pearson Clinical.
Kaufman, A. S., & Kaufman, N. L. (2004b). Kaufman Test of Educational Achievement – Second
Edition. San Antonio, TX: Pearson Clinical.
Kazdin, A. E., Rodgers, A., & Colbus, D. (1986). The Hopelessness Scale for Children:
Psychometric characteristics and concurrent validity. Journal of Consulting & Clinical
Psychology, 54, 241-245. doi:10.1037/0022-006X.54.2.241
SCALE-LEVEL FACTOR ANALYSES 114
Kline, R. B. (2016). Principles and practice of structural equation modeling (4th
ed.). New York:
NY. Guilford Press.
Kovacs, M. (1992). Children’s Depression Inventory manual. New York, NY: Multi-Health
Systems.
Krishnamurthy, R., Archer, R. P., & House, J. J. (1996). The MMPI-A and Rorschach: A failure
to establish convergent validity. Assessment, 3, 179-191. doi:10.1080/0969594960030205
Lanyon, R. I. (1995). Test review of Minnesota Multiphasic Personality Inventory - Adolescent.
In J. C. Conoley & J. C. Impara (Eds.), The twelfth mental measurements yearbook (pp.
628-629). Lincoln, NE: Buros Center for Testing.
Lezak, M. D., Howieson, D. B., Bigler, E. D., & Tranel D. (2012). Neuropsychological
assessment (5th
ed.). New York, NY: Oxford University Press.
Lyons, J. S., Baerger, D. R., Quigley, J. E., & Griffin, E. (2001). Mental health service needs of
juvenile offenders: A comparison of detention, incarceration, and treatment settings.
Children’s Services: Social Policy, Research, and Practice, 4, 69-85.
doi:10.1207/S15326918CS0402_2
MacCallum, R. C., Widaman, K. F., Zhang, S., & Hong, S. (1999). Sample size in factor
analysis. Psychological Methods, 4, 84-99. Doi: 10.1037/1082-989x.4.1.84
Madia, K. V. (1970). Measure of multivariate skewness and kurtosis with applications.
Biometrika, 57, 519-530. doi: 10.2307/2334770
Marks, P. A., Seeman, W., & Haller, D. L. (1974). The actuarial use of the MMPI with
adolescents and adults. Baltimore, MD: Williams & Wilkins.

SCALE-LEVEL FACTOR ANALYSES 115
Martino, S., Grilo, C., & Fehon, D. (2000). The development of the Drug Abuse Screening Test
for Adolescents (DAST-A). Addictive Behaviors, 25, 57-70. doi:10.1016/S0306-
4603(99)00030-1
Mayer, J., & Filstead, W. J. (1979). The Adolescent Alcohol Involvement Scale: An instrument
for measuring adolescents’ use and misuse of alcohol. Journal of Studies of Alcohol, 40,
291-300. doi:10.15288/jsa.1979.40.291
McCann, J. T. (1997). The MACI: Composition and clinical applications. In T. Millon (Ed.), The
Millon inventories (pp. 363-388). New York, NY: Guilford.
McCann, J. T. (2006). Measuring adolescent personality and psychopathology with the Millon
Adolescent Clinical Inventory (MACI). In S. N. Sparta & G. P. Koocher (Eds.), Forensic
mental health assessment of children and adolescents (pp. 424–439). New York, NY:
Oxford University Press.
McCarthy, L., & Archer, R. P. (1998). Factor structure of the MMP-A content scales: Item-level
and scale-level findings. Journal of Personality Assessment, 71, 84-97.
doi:10.1207/s15327752jpa7101_6
Merydith, E. K., & Phelps, L. (2009). Convergent validity of the MMPI-A and MACI scales of
depression. Psychological Reports, 105, 605-609. doi:10.2466/pr0.105.2.605-609
Millon, T., & Davis, R. D. (1993). The Millon Adolescent Personality Inventory and the Millon
Adolescent Clinical Inventory. Journal of Counseling & Development, 71, 570-574.
doi:10.1002/j.1556-6676.1993.tb02244.x
Millon, T., Green, C., & Meagher, R. B. (1982). Millon Adolescent Personality Inventory
manual. Minneapolis, MN: National Computer Systems.

SCALE-LEVEL FACTOR ANALYSES 116
Millon, T., Millon, C., Davis, R., & Grossman, S. (1993). Millon Adolescent Clinical Inventory.
San Antonio, TX: Pearson Clinical.
Morey, L. C. (1991). Personality Assessment Inventory. Lutz, FL: Psychological Assessment
Resources, Inc.
Murray, H. A., & Bellak, L. (1973). Thematic Apperception Test. San Antonio, TX: Pearson
Clinical.
National Council on Crime and Delinquency. (2007). And justice for some: Differential
treatment of youth of color in the justice system. Author.
New Freedom Commission of Mental Health. (2003). Achieving the promise: Transforming
mental health care in America. Retrieved from
http://www.mentalhealthcommission.gov/reports/reports.htm
Newman, J. E., Larsen, J. L., Cunningham, K. B., & Burkhart, B. R. (2015). An examination of
the factor structure of the Millon Adolescent Clinical Inventory in a sample of detained
adolescent boys. Psychological Assessment, 27, 1022-1036. doi:10.1037/a0038779
O’Connor, B. P. (2000). SPSS and SAS programs for determining the number of components
using parallel analysis and Velicer’s MAP test. Behavior Research Methods, Instruments,
& Computers, 32, 396-402.
O’Connor Pennuto, T., & Archer, R. P. (2008). MMPI-A forensic case studies; Uses in
documented court decisions. Journal of Personality Assessment, 90, 215-226.
doi:10.1080/00223890701884897
Office of Juvenile Justice and Delinquency Prevention. (2011). Statistical briefing book: Online.
Retrieved from http://www.ojjdp.gov/ojstatbb/corrections/qa08201.asp?qaDate=2010

SCALE-LEVEL FACTOR ANALYSES 117
Office of Juvenile Justice and Delinquency Prevention. (2015). Delinquency cases in juvenile
court, 2013. Juvenile Justice Statistics National Report Series. Retrieved from
http://www.ojjdp.gov/pubs/248899.pdf
Office of Juvenile Justice and Delinquency Prevention. (2016). Juveniles in residential
placement, 2013. Juvenile Justice Statistics National Report Series. Retrieved from
http://www.ojjdp.gov/pubs/249507.pdf
Overall, J. E., Gibson, J. M., & Novy, D. M. (1993). Population recovery capabilities of 35
cluster analysis methods. Journal of Clinical Psychology, 49, 459-470. doi:10.1002/1097-
4679(199307)49:4<459::AID-JCLP2270490402>3.0.CO;2-P
Pardini, D. A., Lochman, J. E., & Frick, P. J. (2003). Callous/unemotional traits and social-
cognitive processes in adjudicated youths. Journal of the American Academy of Child &
Adolescent Psychiatry, 42, 364-371. doi:10.1097/00004583-200303000-00018
Pinto, M., & Grilo, C. M. (2004). Reliability, diagnostic efficiency, and validity of the Millon
Adolescent Clinical Inventory: Examination of selected scales in psychiatrically
hospitalized adolescents. Behavior Research and Therapy, 42, 1505-1519.
doi:10.1016/j.brat.2003.10.006
Plutchik, R., & van Praag, H. M. (1989). The measurement of suicidality, agressivity, and
impulsivity. Clinical Neuropharmacology, 13, 523-534. doi:10.1016/0278-
5846(89)90107-3
Plutchik, R., & van Praag, H. M. (1990). A self-report measure of violence risk. II.
Comprehensive Psychiatry, 31, 450-456. doi:10.1016/0010-440X(90)90031-M

SCALE-LEVEL FACTOR ANALYSES 118
Plutchik, R., van Praag, H. M., & Conte, H. R. (1989). Correlates of suicide and violence risk I:
The suicide risk measure. Comprehensive Psychiatry, 30, 296-302. doi:10.1016/0010-
440X(89)90053-9
Psychological Assessment Resources. (1994). MMPI-A structural summary. Lutz, FL: Author.
Pyle, N., Flower, A., Fall, A. M., & Williams, J. (2016). Individual-level risk factors of
incarcerated youth. Remedial and Special Education, 37, 172-186.
doi:10.1177/0741932515593383
R Core Team. (2013). R.
Retzlaff, P. (1995). Test review of Millon Adolescent Clinical Inventory. In J. C. Conoley & J.
C. Impara (Eds.), The twelfth mental measurements yearbook (pp. 620-622). Lincoln,
NE: Buros Center for Testing.
Reynolds, C. R., & Kamphaus, R. W. (2003). Behavior Assessment System for Children - Second
Edition. San Antonio, TX: Pearson Clinical.
Reynolds, C. R., & Kamphaus, R. W. (1992). Behavior Assessment System for Children manual.
Circle Pines, MN: American Guidance Services.
Reynolds, C. R., & Richmond, B. O. (1985). Revised Children’s Manifest Anxiety Scale
(RCMAS) manual. Los Angeles, CA: Western Psychological Services.
Reynolds, W. M. (1987). Reynolds Adolescent Depression Scales: Professional manual. Odessa,
FL: Psychological Assessment Resources.
Rinaldo, J. B., & Baer, R. A. (2003). Incremental validity of the MMPI-A content scales in the
prediction of self-reported symptoms. Journal of Personality Assessment, 80, 309-318.
doi:10.1207/S15327752JPA8003_08
SCALE-LEVEL FACTOR ANALYSES 119
Roid, G. H. (2003). Stanford-Binet Intelligence Scales – Fifth Edition. Orlando, FL: Houghton
Mifflin Harcourt.
Romm, S., Bockian, N., & Harvey, M. (1999). Factor-based prototypes of the Millon Adolescent
Clinical Inventory in adolescents referred for residential treatment. Journal of Personality
Assessment, 72, 125-143. doi:10.1207/s15327752jpa7201_8
Rorschach, H. (1945). Rorschach Technique. San Antonio, TX: Pearson Clinical.
Rosenberg, M. (1979). Conceiving of the self. New York, NY: Basic Books.
Salekin, R. T. (2002). Factor-analysis of the Millon Adolescent Clinical Inventory in a juvenile
offender population: Implications for treatment. Journal of Offender Rehabilitation, 34,
15-29. doi:10.1300/J076v34n03_02
Salekin, R. T., Larrea, M. A., & Ziegler, T. (2002). Relationships between the MACI and the
BASC in the assessment of child and adolescent offenders. Journal of Forensic
Psychology Practice, 2, 35-50. doi:10.1300/J158v02n04_02
Sattler, J. M., & Hoge, R. D. (2006). Assessment of children: Behavioral, social, and clinical
foundations (5th
ed.). San Diego, CA: Jerome M. Sattler, Publisher, Inc.
Segal, D. L., & Coolidge, F. L. (2004). Objective assessment of personality and
psychopathology: An overview. In M. J. Hilsenroth, D. L. Segal, & M. Hersen (Eds.),
Comprehensive handbook of psychological assessment, volume 2: Personality assessment
(pp. 3-14). Hoboken, NJ: John Wiley & Sons, Inc.
Sickmund, M., Sladky, T. J., Kang, W., & Puzzanchera, C. (2011). Easy access to the census of
juveniles in residential placement. Retrieved from http://ojjdp.ncjrs.gov/ojstatbb/ezacjrp/
Spieldberger, C. D. (1988). Manual for the state - trait anger expression inventory (revised
research edition). Odessa, FL: Psychological Assessment Resources.
SCALE-LEVEL FACTOR ANALYSES 120
Stefurak, T., & Calhoun, G. B. (2007). Subtypes of female juvenile offenders: A cluster analysis
of the Millon Adolescent Clinical Inventory. International Journal of Law and
Psychiatry, 30, 95-111. doi:10.1016/j.ijlp.2006.04.003
Stefurak, T., Calhoun, G. B., & Glaser, B. A. (2004). Personality typologies of male juvenile
offenders using a cluster analysis of the Millon Adolescent Clinical Inventory
introduction. International Journal of Offender Therapy and Comparative Criminology,
48, 96-110. doi:10.1177/0306624X03258478
Stein, L. R., McClinton, B. K., & Graham, J. R. (1998). Long-term stability of MMPI-A scales.
Journal of Personality Assessment, 70, 103-108. doi:10.1207/s15327752jpa7001_7
Stokes, J. M., Pogge, D. L., & Zaccario, M. (2013). Response character styles in adolescents: A
replication of convergent validity between the MMPI–A and the Rorschach. Journal of
Personality Assessment, 95, 159-173. doi:10.1080/00223891.2012.730084
Stuart, R. B. (1995). Test review of Millon Adolescent Clinical Inventory. In J. C. Conoley & J.
C. Impara (Eds.), The twelfth mental measurements yearbook (pp. 622-623). Lincoln,
NE: Buros Center for Testing.
Tabachnick, B. G., & Fidell, L. S. (2013). Using multivariate statistics (6th
ed.). Upper Saddle
River, NJ: Pearson.
Taylor, J., Kemper, T. S., Loney, B. R., & Kistner, J. A. (2006). Classification of severe male
juvenile offenders using the MACI clinical and personality Scales. Journal of Clinical
Child and Adolescent Psychology, 35, 90-102. doi:10.1207/s15374424jccp3501_8
The Psychological Corporation. (2009). Wechsler Individual Achievement Test – Third Edition.
San Antonio, TX: Pearson Clinical.
SCALE-LEVEL FACTOR ANALYSES 121
Travis, J. (1999). Adolescent girls: The role of depression in the development of delinquency.
Washington, DC: U.S. Department of Justice.
Tringone, R., & Bockian, N. (2015). Millon's contributions to preadolescent and adolescent
personality assessment: Searching onward and upward. Journal of Personality
Assessment, 97, 563-571. doi:10.1080/00223891.2015.1064438
Wechsler, D. (2003). Wechsler Intelligence Scale for Children – Fourth Edition. San Antonio,
TX: Pearson Clinical.
Woodcock, R. W., McGrew, K. S., & Mather, N. (2001a). Woodcock-Johnson Tests of Cognitive
Abilities - Third Edition. Itasca, IL: Riverside Publishing.
Woodcock, R. W., McGrew, K. S., & Mather, N. (2001b). Woodcock-Johnson Tests of
Achievement - Third Edition. Itasca, IL: Riverside Publishing.
Woodland, M. H., Andretta, J. R., Moore, J. A., Bennett, M. T., Worrell, F. C., & Barnes, M. E.
(2014). MACI scores of African American males in a forensic setting: Are we measuring
what we think we are measuring? Journal of Forensic Psychology Practice, 14, 418-437.
doi:10.1080/15228932.2014.973773
Woodworth, R. S. (1920). Personal Data Sheet. Chicago, IL: Stoel.
Zahn-Waxler, C., Klimes-Dougan, B., & Slattery, M. J. (2000). Internalizing problems in
childhood and adolescence: Prospects, pitfalls, and progress in understanding the
development of anxiety and depression. Development and Psychopathology, 12, 443-466.
Zwick, W. R., & Velicer, W. F. (1986). Comparison of five rules for determining the number of
components to retain. Psychological Bulletin, 99, 432-442.