Embed Size (px)
Citation preview
2012 International Conference on Indoor Positioning and Indoor Navigation, 13–15th November 2012
Scale-Preserving Long-Term Visual Odometryfor Indoor Navigation
Sebastian Hilsenbeck, Andreas Moller, Robert Huitl, Georg Schroth, Matthias Kranz 1, and Eckehard SteinbachInstitute for Media Technology
Technische Universitat MunchenMunich, Germany
Email: [email protected], [email protected], [email protected],[email protected], [email protected], [email protected]
Abstract—We present a visual odometry system for indoornavigation with a focus on long-term robustness and consistency.As our work is targeting mobile phones, we employ monocularSLAM to jointly estimate a local map and the device’s trajectory.We specifically address the problem of estimating the scale factorof both, the map and the trajectory. State-of-the-art solutionsapproach this problem with an Extended Kalman Filter (EKF),which estimates the scale by fusing inertial and visual data, butstrongly relies on good initialization and takes time to converge.Each visual tracking failure introduces a new arbitrary scalefactor, forcing the filter to re-converge. We propose a fast androbust method for scale initialization that exploits basic geometricproperties of the learned local map. Using random projections, weefficiently compute geometric properties from the feature pointcloud produced by the visual SLAM system. From these prop-erties (e.g., corridor width or height) we estimate scale changescaused by tracking failures and update the EKF accordingly.As a result, previously achieved convergence is preserved despitere-initializations of the map. To minimize the time required tocontinue tracking after failure, we perform recovery and re-initialization in parallel. This increases the time available forrecovery and hence the likelihood for success, thus allowingalmost seamless tracking. Moreover, fewer re-initializations arenecessary. We evaluate our approach using extensive and diverseindoor datasets. Results demonstrate that errors and convergencetimes for scale estimation are considerably reduced, thus ensuringconsistent and accurate scale estimation. This enables long-termodometry despite of tracking failures which are inevitable inrealistic scenarios.
I. INTRODUCTION
The ability to retrieve a user’s location represents a funda-mental enabling technology for a wide range of applications,above all, navigation. In contrast to outdoor scenarios, whereGPS is established as the universal solution, indoors, no suchstandard exists as of today.
Indoor positioning methods comprise a wide variety oftechnologies [1], [2]. An overview on vision-based approachescan be found in comprehensive surveys of recent [3] and oldersystems [4]. Active systems rely on a priori knowledge aboutthe environment, such as a building model, reference imagesor fiducial markers [5], [6]. Passive systems, in contrast, are
1now with Department of Computer Science, Electrical and SpaceEngineering; Lulea University of Technology; Lulea, Sweden
localized using pre-installed hardware, e.g., by multiple fixedcameras [7].
Since passive localization does not scale well for largeenvironments, active systems need to be employed. In order toimprove localization accuracy, the relative movement betweenreference points (i.e. where absolute location estimation ispossible) can be estimated using odometry. To this end, dif-ferent solutions have been provided, ranging from pedometers[8] and inertial sensors [9] to tracking using monocular orstereo cameras [10], or a combination of multiple techniques[11]. Camera-based (visual) odometry can be understood asa special case of visual SLAM (Simultaneous Localizationand Mapping). SLAM refers to the problem of estimating thepose of a robot in an initially unknown environment, whileat the same time building a map of the environment. Visualodometry does not aim at creating a globally consistent mapof the environment, but uses local maps instead.
A. Related Work
In this paper, we concentrate on the special case of monoc-ular SLAM, where images from a single camera are usedfor localization and mapping. In order to compute depthinformation, salient image points are tracked over time whilethe camera is in motion. Due to the projective nature of acamera, the depth can be determined only up to scale, i.e.,the unit is unknown and has to be estimated by other means.Further, if no reference data is available to fix the scale, aproblem called scale drift arises, where the scale is not onlyunknown, but deviates over time. Recent work like Strasdat etal. [12] models the scale in the state vector of a Kalman Filterand corrects the scale drift when loop closures are detected.The same formulation allows for the propagation of the metricscale over the map as soon as the scale factor is known.
Various approaches to resolve the scale ambiguity and toestablish a metric coordinate system have been proposed. Forexample, Davison et al. [13] add a calibration object withknown size to the scene, or Munguia et al. [14] require manualselection of three scene points with known distance. Likewise,if objects with known size can be identified, they can be usedto determine the metric scale. In this paper, we follow thelatter approach and propose to estimate the (non-metric) size
978-1-4673-1954-6/12/$31.00 c© 2012 IEEE
2012 International Conference on Indoor Positioning and Indoor Navigation, 13–15th November 2012
of corridors from point clouds and relate it to the (metric) sizedetermined from a building model, where available.
When no information about the physical dimensions of thescene is available (e.g., through a building model along with acoarse position estimate), the metric scale is obtained by fusinginertial measurements from accelerometers and gyroscopeswith visual data. There is a huge body of previous work onvisual-inertial data fusion (an introduction is given by Corkeet al. [15]). Most researchers focus on improving the accuracyof pose estimates, e.g., by disambiguating translational androtational motion which is difficult using visual informationonly, or by stabilizing inertial measurements which are proneto drift by adding visual information. Furthermore, the rela-tive pose between camera and inertial sensors can be auto-calibrated, and a more robust estimate of the gravity vectorcan be obtained [16].
More recent work exploits inertial data to perform metricreconstruction, i.e., the unknown visual scale is determinedby incorporating inertial measurements [17], [18]. Kneip etal. describe an approach of this nature in [19]. They analyzedelta-velocities obtained from both visual pose estimates andinertial measurements to solve for the unknown scale factor.
B. Contributions
While this technique allows estimation of scale, it stronglyrelies on a good initialization of the filter and takes timeto converge. Until convergence of the filter, the odometryestimates are of limited use. Inaccurate initialization prolongsthis phase or may even result in divergence. In realisticindoor scenarios, visual tracking is likely to fail frequentlyas buildings often exhibit sparse or ambiguous texture. As aresult, re-initialization of the map becomes necessary, whichintroduces an unknown new scale.
We perform recovery and re-initialization in parallel. Thisincreases the time available for recovery and hence the likeli-hood for success. At the same time, tracking interruptions areminimized and fewer re-initializations are required.
Further, we propose a fast and robust method for scaleinitialization that exploits basic geometric properties of thelearned local map. Using random projections, we efficientlycompute geometric properties from the feature point cloudproduced by the visual SLAM system. Since these properties,e.g., hallway width or height, remain locally constant, the scaleratio between consecutive maps can be determined to recoverthe scale estimate before re-initialization. Thus, the correctscale is preserved given that the filter has converged once(possibly over several re-initializations).
The remainder of this paper is structured as follows: InSection II, we introduce the parallel tracking and mappingalgorithm our approach is based on, while Section III explainsthe parallelization of recovery from a tracking failure and re-initialization of a new map. In Section IV, we discuss the ro-bust estimation of relative scale changes between consecutivemaps based on geometric building properties, and augmenta Kalman Filter by directly feeding these estimates into its
state update in case of a map re-initialization. In Section V,we describe the proposed efficient extraction of a room’sdimensions from the point cloud produced by the visual SLAMsystem, and Section VI presents an evaluation of the proposedmethods. The experiments demonstrate that our approach canreduce the number of re-initializations and tracking failurescompared to traditional parallel tracking and mapping, and thatour system aids in estimating the scale between local maps.
II. MONOCULAR VISUAL ODOMETRY
We use Parallel Tracking and Mapping (PTAM) by Kleinand Murray [20] as the basis of our monocular visual odometrysystem. In contrast to conventional SLAM algorithms, PTAMseparates the tracking of image features for pose updatesfrom the mapping part, where trackable features are collectedto build a three-dimensional map of the local environment.This allows for an update of the camera pose at frame-rate, while expensive optimization techniques for the mappingcan be executed at a lower rate and when computationalresources are available. As a result, PTAM is eligible formobile applications, whereas conventional SLAM approachesare prohibitively expensive due to their (at least) quadraticcomplexity in the number of observations.
A. Parallel Tracking and Mapping
PTAM detects feature points in the camera image using theFAST [21] keypoint detector. Observations in the current frameare associated with those in the previous frame by the trackingroutine which performs an epipolar search and patch-basedcross-correlation. The successful feature associations are usedto compute the new 6D pose for the current frame. An m-estimator with outlier rejection further increases robustness.
The mapping part of PTAM operates keyframe-based, i.e.,whenever a frame contains a large number of new observationsthat have been tracked, it is inserted into the map. Hence, everyfeature is stored within a keyframe and the map comprises asparse set of keyframes. This allows for the use of bundleadjustment to jointly optimize the three-dimensional positionsof observations and the six-dimensional poses of keyframes.The optimized 3D positions of the features are, in turn, usedduring tracking for subsequent pose updates.
The initialization of the map is performed using the 5-pointalgorithm [22] on a pair of images at the beginning of thesequence. A set of features from the first image is trackedover several frames in order to generate the required baseline.As this step assumes a non-zero camera velocity, it may haveto be repeated until a map is successfully instantiated.
B. Discussion of PTAM
PTAM provides a robust basis for a monocular visualodometry system running on mobile devices. The structureof the algorithm leads to comparatively low computationalcomplexity while generating accurate position and orientationestimates with fairly small errors due to drift. However, aninherent disadvantage of monocular sensor systems is the
2012 International Conference on Indoor Positioning and Indoor Navigation, 13–15th November 2012
inability to observe the true scale of position data relative toa metric coordinate system.
To enable anytime localization and navigation in indoorenvironments, it is therefore necessary to include additionalinformation in order to scale the visual odometry to metriccoordinates. We propose to use basic geometric properties ofthe surrounding building structure to retrieve the unknownscale factor, exploiting the fact that PTAM already estimatesthe 3D structure of the local environment.
Further challenges are rapid movements of either the cameraor objects in the scene that cause motion blur and thusdecimate the number of visible features to a degree that thesystem loses tracking. PTAM incorporates a basic recoverymechanism, i.e., it stops adding new keyframes to the mapwhen tracking quality is considered poor and tries to matchthe scene with previous keyframes instead. However, recoverytakes time and might only make sense in some cases, forinstance, when large objects occlude the camera only tem-porarily (e.g., opening doors, people walking by). By contrast,if also the camera has moved in the meantime, it is unlikelythat recovery succeeds. Here, it would be beneficial to create anew map immediately in order not to lose time with recoveryand reduce the non-tracking time.
III. INSTANTANEOUS RECOVERY FROMTRACKING FAILURES
A. Autonomous Operation
In large-scale, real-world environments, it can occur that theavailable features are not sufficient for tracking. In this case,PTAM’s recovery implementation fails with high probability.If the user moves away from the existing map, PTAM getslocked in an infinite loop as it is not able to find the currentvideo frame’s features in the map. Since we are interestedin odometry, it is not a conceptual problem that tracking isonly possible in local maps. However, the creation of a newmap requires an initialization based on a stereo pair, usingthe 5-point algorithm [23]. For this, a candidate stereo pairis chosen autonomously and, if insufficient feature correspon-dences were found and no map can be created, the procedureis repeated until the initialization is successful.
B. Parallel Recovery and Re-Initialization
In Sec. II, we discussed the problems of PTAM with relationto rapid movement caused, for instance, by persons in thescene or quick camera motion, which is likely to occur witha handheld device. In order to make the system more robustwith respect to occlusions and moving objects, we propose acombined approach of recovery and re-initialization, using thefollowing basic principle:
• As soon as the system is no longer able to detect enoughfeatures for tracking (e.g., because of an obstacle), itenters recovery mode. At the same time, initialization ofa new map is started in the background.
• If the system cannot recover quickly, it switches to thenewly initialized map, so that it can immediately continuewith tracking.
• If recovery is successful (e.g., when the obstacle disap-pears and the previous features become visible again), thenewly initialized map is discarded and tracking continueswith the old map.
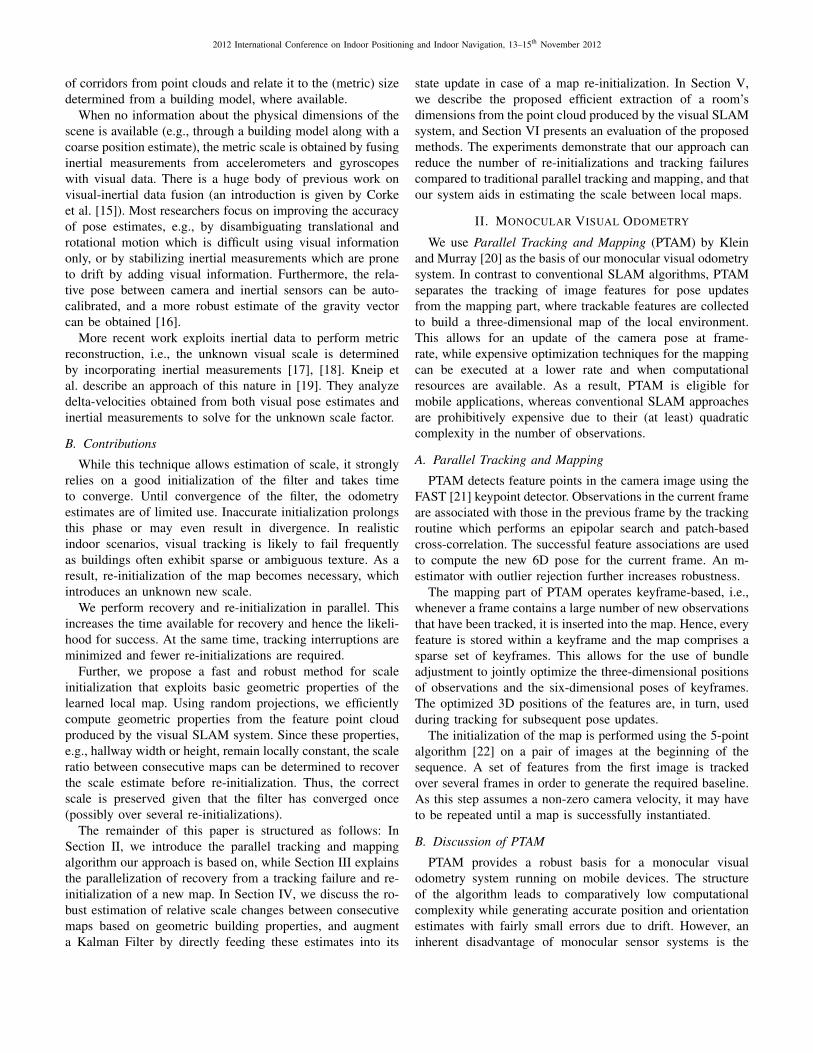
To realize this functionality, two tracker threads are used,which will in the following be referred to as T1 and T2 (seeFig. 1). In the normal state, only T1 is active while T2 sleeps,which is symbolized by a continuous and a dotted line inFig. 1(a). As soon as tracking is interrupted (the tracker entersthe Lost state), T1 sends a wake signal to T2 (Fig. 1(b)). T2now starts a new stereo initialization and attempts to createa new map. At the same time, T1 enters recovery mode andtries to estimate the camera pose in all existing keyframes(Fig. 1(c)). Depending on the success of the recovery step,the system can proceed in two different ways. If T2 created anew map before recovery in T1 succeeded (case 1, Fig. 1(d)),T2 sends a sleep signal to T1 and tracking continues with thenewly created map. The original map is discarded, but sincewe are interested in relative positioning, we do not require thatwe can resume tracking in the old map if we ever come back tothat location. If the recovery in T1 succeeded before T2 createdthe new map (Fig. 1(e)), tracking continues with T1, and thecreation of the new map is interrupted. This corresponds tothe ‘original’ single-tracker behavior, since the second map isnot used.
When comparing these two alternatives presented inFig. 1(d) and Fig. 1(e), the latter one is preferential, since wewant to use one single map as long as possible to avoid re-initializations (and thereby scale loss). Therefore, the originaltracker (here T1) is prioritized over the second initialization.At the time when T2 has built its new map and continuestracking, it sends the sleep signal to T1 with a grace periodparameter (set to four seconds). During this grace period,T1 has time to pursue recovery, as shown in Fig. 1(e). If itsucceeds, the system switches back to T1 and discards thenewly created map of T2 (including the features and keyframesthat already might have been added to it). If T1 was not ableto recover within the grace period, it is finally suspended andits map is deleted.
In case of a tracking failure, this solution is able to followup tracking quickly, since re-initialization starts immediatelyafter entering the lost state. This is particularly important forlonger periods of motion where recovery is likely to fail. Whenthe obstacle disappears within the grace period, the system isable to recover almost instantly, since only a switch to theprevious tracker thread is required.
IV. SCALE ESTIMATION BASED ON BUILDING GEOMETRY
For most buildings, geometric properties such as height,width, and length of a room or corridor remain locally constantuntil interrupted or ended by another part of the building.Especially in public buildings (e.g., hospitals, universities,
2012 International Conference on Indoor Positioning and Indoor Navigation, 13–15th November 2012
(a) When Thread 1 (T1) is tracking, Thread 2(T2) sleeps.
(b) In case of lost tracking, T1 sends a wakesignal to T2.
(c) While T1 tries to recover, T2 initializes a newmap.
(d) Case 1: When the new map is ready, trackingcontinues with T2. The original thread T1 sleeps.
(e) Case 2: If recovery succeeds before T2 com-pletes the re-initialization, T1 continues and thenew map is discarded.
(f) In an extended version, a grace period isadded for T1 to recover. Even if T2 is alreadytracking with the new map, T1 still has time torecover.
Fig. 1. Schematic overview of the parallel tracker implementation for increased robustness to moving objects.
administration buildings), this assumption is mostly valid. Weobserve that these properties are usually defined as the distancebetween opposite dominant planes within the interior buildingstructure. We demonstrate in the following how properties ofthis kind can be estimated efficiently and used to aid in scaleestimation for monocular visual odometry.
In general, there are two scenarios to distinguish: One wherethere is no prior knowledge available, and one where the truebuilding dimensions are known a priori (e.g., from a floorplan or an initial survey). In both cases, geometric propertiesprovide valuable information to improve scale estimation.
A. Case 1: Unknown Building Dimensions
In the general case, information on the dimensions of roomsand corridors is not available and the standard approach toscale estimation is the incorporation of inertial measurementsusing a Kalman Filter [11]. The filter takes metric accelerationand angular velocity readings as input and propagates akinematic model to infer metric position and orientation ofthe device for each time step. These predictions are correlatedwith scaled position data as provided by the monocular visualodometry algorithm. This way, the scale factor is estimated inreal-time as part of the filter’s state vector and even occasionalscale drift can be accommodated for.
The estimation process takes time to converge, though, andits duration depends to a great degree on the accuracy ofthe initialization of the filter state. As long as convergenceis incomplete, the visual odometry data are not reliable.Therefore, it is important that this phase takes as little time aspossible and occurs only once at the beginning of operation. Inreal indoor environments, however, frequent challenges occurfor a vision-based system such as dynamic objects and sparselytextured regions as explained in the introduction. PTAM is noexception in this context and relies strongly on the presenceof a sufficient number of features to track in order to deliver
contiguous pose updates. If this is not the case and recoverymethods as described in Sec. III fail, a new map has to beinitialized from a new pair of images. Again, due to thearbitrary baseline, the scale of the map is unknown and mostlikely different from the one before the tracking failure. Thisentails that the Kalman Filter has to start over and so farachieved convergence is lost. In the worst case, this happensrepeatedly with the result that convergence of the filter andthus scale estimation become impossible.
We exploit the observation that local building geometry canbe assumed constant to alleviate the effect of frequent failuresof the visual odometry system. We estimate properties such ascorridor height while the Kalman filter converges. In case anew map needs to be initialized, a simple comparison of thoseproperties to the estimates from before the re-initializationallows us to directly compute the scale factor between thecurrent and the previous map. This factor is multiplied to theKalman Filter’s scale variable which, therefore, remains unaf-fected by the re-initialization of the local map and previouslycompleted convergence is not lost.
B. Case 2: A Priori Known Building Dimensions
For certain buildings, it is possible to extract informationon basic dimensions of rooms and corridors in advance, forinstance, from floor plans or by conducting an initial survey.Once the true width of, e.g., a corridor is known, a directcomparison with the estimated width in the vision coordinatesystem reveals the scale factor between the visual odometryand metric coordinates. Thus, the odometry data become atonce useful for navigation and other location-based services.
In this scenario, the mobile device requires a very coarseestimate of its absolute position within the building to identifythe current room or corridor. Existing mobile localizationapproaches based on Wi-Fi using fingerprinting have beendemonstrated to achieve room-accurate positioning while sub-

2012 International Conference on Indoor Positioning and Indoor Navigation, 13–15th November 2012
Fig. 2. Top: A frame with feature points that are tracked by PTAM. Thecolor of a point indicates the size of the feature in the image. Bottom: Thecorresponding three-dimensional point cloud as it appears in the reconstructedmap. The 3D positions of the points are very noisy. The estimated groundplane is indicated by the grid lines.
meter accuracy still remains out of reach [24]. Likewise,systems that employ content-based image retrieval have beenshown to yield accuracies at meter-level but are unable to pro-duce contiguous pose information for the mobile device [25].Both approaches complement each other and enable directscale computation using known geometric building properties.This way, the sub-meter accurate visual odometry readingsbecome available and no convergence behavior needs to betaken into consideration.
V. ESTIMATION OF GEOMETRIC BUILDING PROPERTIES
As the user navigates through the building, PTAM con-tinuously tracks feature points and inserts their 3D positionsinto the map. Hence, the map is represented by a point cloudalong the trajectory of the mobile device. In order to reliablyextract geometric properties that relate to the building struc-ture, we develop a statistical technique that applies a cascadeof projections to the point cloud. The most basic geometricproperties of buildings typically refer to distances betweenopposite (parallel) dominant planes in the building structure.As these features remain visible despite being sampled into apoint cloud, we specifically address the problem of retrievingthis type of properties from a sparse and local point cloud.
A. Relating Point Cloud Features to Building Properties
In contrast to state-of-the-art approaches that use plane fit-ting in combination with RANSAC [26] or full map matching(i.e., point cloud matching using ICP [27]), we employ acombination of steered and random projections to achieveefficiency while retaining robustness. Steered projections arebased on additional information (e.g., gravity) and allow us toexploit this knowledge for reducing computational complexityas early as possible during the estimation process. Randomprojections, in contrast, ensure robustness as the data aretypically subject to considerable noise.
Using the inertial measurement unit (IMU) of the mobiledevice, the direction of gravity is retrieved in order to identifythe orientation of the building ground plane relative to thePTAM point cloud. In general, this orientation is arbitraryand depends on the device orientation at the time whenthe map was first initialized. The objective ultimately is toidentify the orientation of an orthogonal coordinate systemthat maximizes the correspondence of the point cloud withup to three orthogonal pairs of parallel planes that define thedimensions of the current room or corridor (usually four walls,the ceiling, and the floor). To identify the walls, we projectthe point cloud onto the ground plane. Within the resultingtwo-dimensional point cloud, the model we search for is apair of dominant parallel lines as explained in Sec. V-B. Theuncertainty for every hypothesis is measured by the spread ofthe point cloud around the model. In general, this approachleads us to find the current corridor’s longer (i.e., dominant)pair of walls.
For the floor and the ceiling, we project the three-dimensional point cloud onto the gravity vector, yielding aone-dimensional distribution. We search for the two dominantclusters as described in Sec. V-B. The cluster centers corre-spond to the intersections of the projection line with the floorplane and the ceiling plane, respectively, and thus reveal theirposition within the point cloud.
Both the projection onto the ground plane as well as theprojection onto the gravity vector have the purpose of identi-fying perpendicular structures. Hence, in a two-step process,we use the position estimates of the dominant planes thatresult from the first iteration to re-sort the point cloud. Forthe second iteration, the points that agree well with the modelfor the floor and the ceiling are removed from the projectiononto the ground plane and, vice versa, points that fit to theestimated model for the walls are ignored when projectingonto the gravity vector. This approach sorts the point cloudinto parts that correspond to the floor or the ceiling and partsthat belong to the walls. As a result, the two complementaryprojection techniques tend to focus on perpendicular structuresonly, and thus converge more precisely.
B. Extracting Point Cloud Features
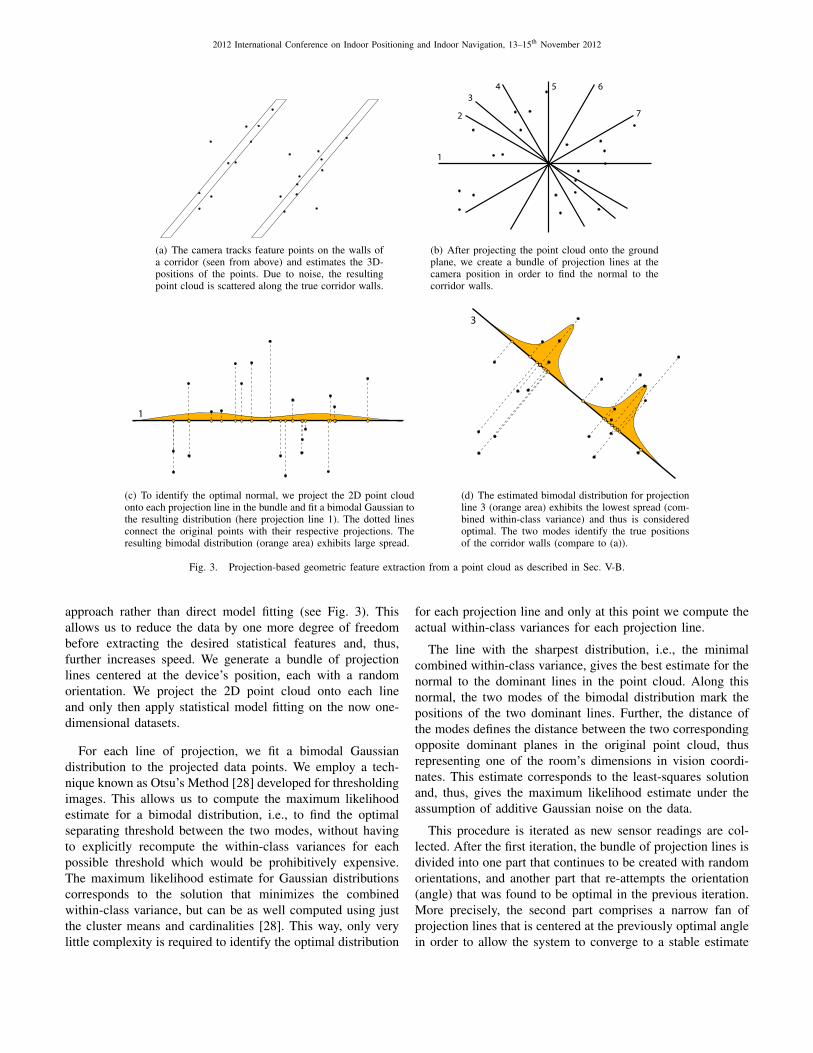
The central problem is to identify the pair of dominantparallel lines (planes before the projection) within a two-dimensional point cloud. We propose to use a statistical
2012 International Conference on Indoor Positioning and Indoor Navigation, 13–15th November 2012
(a) The camera tracks feature points on the walls ofa corridor (seen from above) and estimates the 3D-positions of the points. Due to noise, the resultingpoint cloud is scattered along the true corridor walls.
1
7
6 5 4
2
3
(b) After projecting the point cloud onto the groundplane, we create a bundle of projection lines at thecamera position in order to find the normal to thecorridor walls.
1
(c) To identify the optimal normal, we project the 2D point cloudonto each projection line in the bundle and fit a bimodal Gaussian tothe resulting distribution (here projection line 1). The dotted linesconnect the original points with their respective projections. Theresulting bimodal distribution (orange area) exhibits large spread.
3
(d) The estimated bimodal distribution for projectionline 3 (orange area) exhibits the lowest spread (com-bined within-class variance) and thus is consideredoptimal. The two modes identify the true positionsof the corridor walls (compare to (a)).
Fig. 3. Projection-based geometric feature extraction from a point cloud as described in Sec. V-B.
approach rather than direct model fitting (see Fig. 3). Thisallows us to reduce the data by one more degree of freedombefore extracting the desired statistical features and, thus,further increases speed. We generate a bundle of projectionlines centered at the device’s position, each with a randomorientation. We project the 2D point cloud onto each lineand only then apply statistical model fitting on the now one-dimensional datasets.
For each line of projection, we fit a bimodal Gaussiandistribution to the projected data points. We employ a tech-nique known as Otsu’s Method [28] developed for thresholdingimages. This allows us to compute the maximum likelihoodestimate for a bimodal distribution, i.e., to find the optimalseparating threshold between the two modes, without havingto explicitly recompute the within-class variances for eachpossible threshold which would be prohibitively expensive.The maximum likelihood estimate for Gaussian distributionscorresponds to the solution that minimizes the combinedwithin-class variance, but can be as well computed using justthe cluster means and cardinalities [28]. This way, only verylittle complexity is required to identify the optimal distribution
for each projection line and only at this point we compute theactual within-class variances for each projection line.
The line with the sharpest distribution, i.e., the minimalcombined within-class variance, gives the best estimate for thenormal to the dominant lines in the point cloud. Along thisnormal, the two modes of the bimodal distribution mark thepositions of the two dominant lines. Further, the distance ofthe modes defines the distance between the two correspondingopposite dominant planes in the original point cloud, thusrepresenting one of the room’s dimensions in vision coordi-nates. This estimate corresponds to the least-squares solutionand, thus, gives the maximum likelihood estimate under theassumption of additive Gaussian noise on the data.
This procedure is iterated as new sensor readings are col-lected. After the first iteration, the bundle of projection lines isdivided into one part that continues to be created with randomorientations, and another part that re-attempts the orientation(angle) that was found to be optimal in the previous iteration.More precisely, the second part comprises a narrow fan ofprojection lines that is centered at the previously optimal anglein order to allow the system to converge to a stable estimate
2012 International Conference on Indoor Positioning and Indoor Navigation, 13–15th November 2012
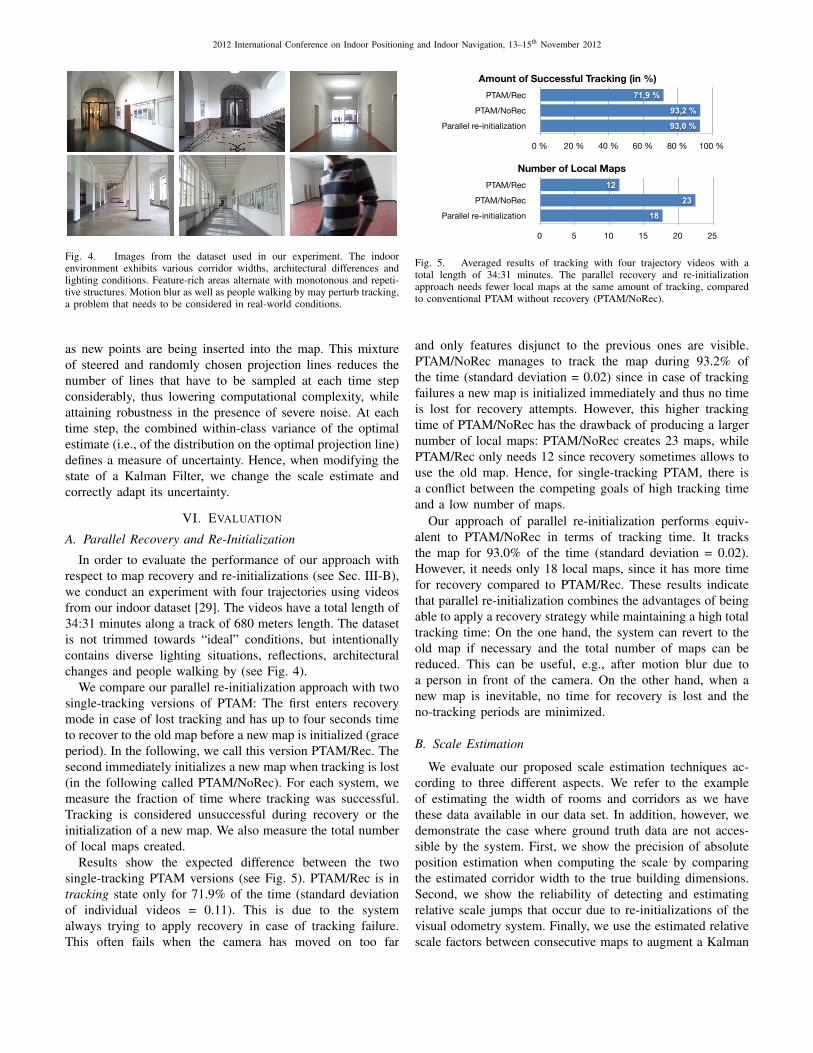
Fig. 4. Images from the dataset used in our experiment. The indoorenvironment exhibits various corridor widths, architectural differences andlighting conditions. Feature-rich areas alternate with monotonous and repeti-tive structures. Motion blur as well as people walking by may perturb tracking,a problem that needs to be considered in real-world conditions.
as new points are being inserted into the map. This mixtureof steered and randomly chosen projection lines reduces thenumber of lines that have to be sampled at each time stepconsiderably, thus lowering computational complexity, whileattaining robustness in the presence of severe noise. At eachtime step, the combined within-class variance of the optimalestimate (i.e., of the distribution on the optimal projection line)defines a measure of uncertainty. Hence, when modifying thestate of a Kalman Filter, we change the scale estimate andcorrectly adapt its uncertainty.
VI. EVALUATION
A. Parallel Recovery and Re-Initialization
In order to evaluate the performance of our approach withrespect to map recovery and re-initializations (see Sec. III-B),we conduct an experiment with four trajectories using videosfrom our indoor dataset [29]. The videos have a total length of34:31 minutes along a track of 680 meters length. The datasetis not trimmed towards “ideal” conditions, but intentionallycontains diverse lighting situations, reflections, architecturalchanges and people walking by (see Fig. 4).
We compare our parallel re-initialization approach with twosingle-tracking versions of PTAM: The first enters recoverymode in case of lost tracking and has up to four seconds timeto recover to the old map before a new map is initialized (graceperiod). In the following, we call this version PTAM/Rec. Thesecond immediately initializes a new map when tracking is lost(in the following called PTAM/NoRec). For each system, wemeasure the fraction of time where tracking was successful.Tracking is considered unsuccessful during recovery or theinitialization of a new map. We also measure the total numberof local maps created.
Results show the expected difference between the twosingle-tracking PTAM versions (see Fig. 5). PTAM/Rec is intracking state only for 71.9% of the time (standard deviationof individual videos = 0.11). This is due to the systemalways trying to apply recovery in case of tracking failure.This often fails when the camera has moved on too far
PTAM/Rec
PTAM/NoRec
Parallel re-initialization
0 % 20 % 40 % 60 % 80 % 100 %
93,0 %
93,2 %
71,9 %
PTAM/Rec
PTAM/NoRec
Parallel re-initialization
0 5 10 15 20 25
18
23
12
Amount of Successful Tracking (in %)
Number of Local Maps
Fig. 5. Averaged results of tracking with four trajectory videos with atotal length of 34:31 minutes. The parallel recovery and re-initializationapproach needs fewer local maps at the same amount of tracking, comparedto conventional PTAM without recovery (PTAM/NoRec).
and only features disjunct to the previous ones are visible.PTAM/NoRec manages to track the map during 93.2% ofthe time (standard deviation = 0.02) since in case of trackingfailures a new map is initialized immediately and thus no timeis lost for recovery attempts. However, this higher trackingtime of PTAM/NoRec has the drawback of producing a largernumber of local maps: PTAM/NoRec creates 23 maps, whilePTAM/Rec only needs 12 since recovery sometimes allows touse the old map. Hence, for single-tracking PTAM, there isa conflict between the competing goals of high tracking timeand a low number of maps.
Our approach of parallel re-initialization performs equiv-alent to PTAM/NoRec in terms of tracking time. It tracksthe map for 93.0% of the time (standard deviation = 0.02).However, it needs only 18 local maps, since it has more timefor recovery compared to PTAM/Rec. These results indicatethat parallel re-initialization combines the advantages of beingable to apply a recovery strategy while maintaining a high totaltracking time: On the one hand, the system can revert to theold map if necessary and the total number of maps can bereduced. This can be useful, e.g., after motion blur due toa person in front of the camera. On the other hand, when anew map is inevitable, no time for recovery is lost and theno-tracking periods are minimized.
B. Scale Estimation
We evaluate our proposed scale estimation techniques ac-cording to three different aspects. We refer to the exampleof estimating the width of rooms and corridors as we havethese data available in our data set. In addition, however, wedemonstrate the case where ground truth data are not acces-sible by the system. First, we show the precision of absoluteposition estimation when computing the scale by comparingthe estimated corridor width to the true building dimensions.Second, we show the reliability of detecting and estimatingrelative scale jumps that occur due to re-initializations of thevisual odometry system. Finally, we use the estimated relativescale factors between consecutive maps to augment a Kalman
2012 International Conference on Indoor Positioning and Indoor Navigation, 13–15th November 2012
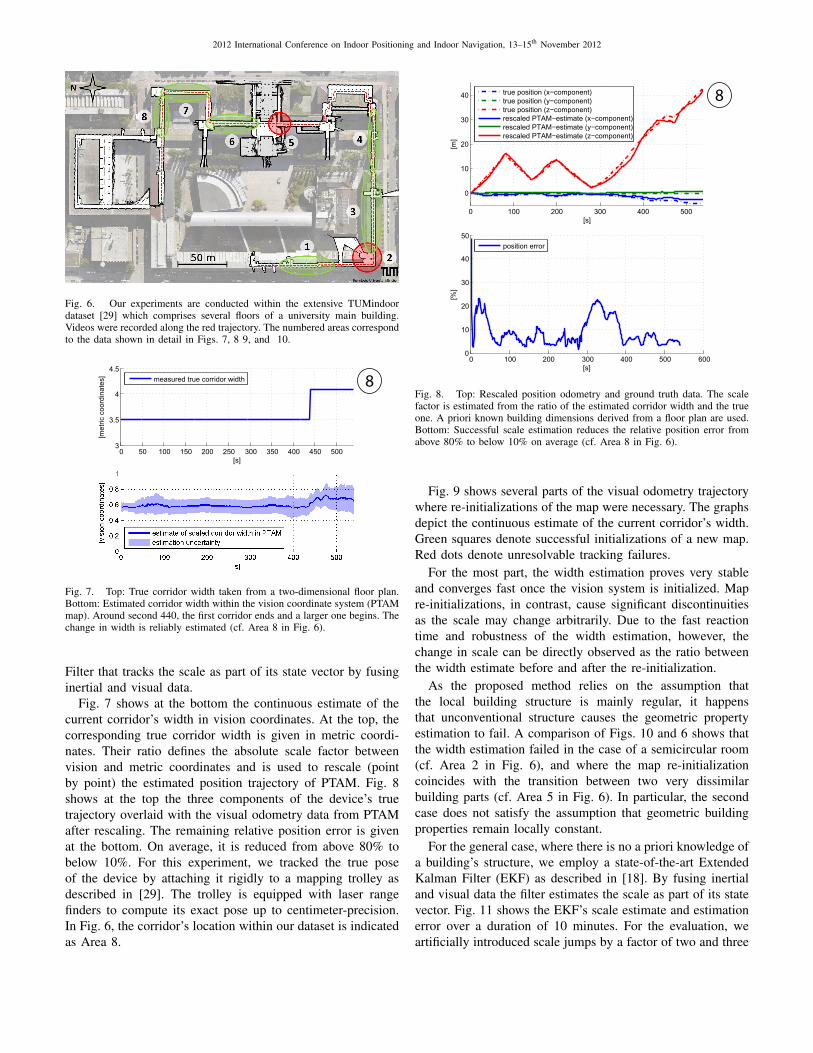
Fig. 6. Our experiments are conducted within the extensive TUMindoordataset [29] which comprises several floors of a university main building.Videos were recorded along the red trajectory. The numbered areas correspondto the data shown in detail in Figs. 7, 8 9, and 10.
0 50 100 150 200 250 300 350 400 450 5003
3.5
4
4.5
[s]
[met
ric c
oord
inat
es] measured true corridor width 8
Fig. 7. Top: True corridor width taken from a two-dimensional floor plan.Bottom: Estimated corridor width within the vision coordinate system (PTAMmap). Around second 440, the first corridor ends and a larger one begins. Thechange in width is reliably estimated (cf. Area 8 in Fig. 6).
Filter that tracks the scale as part of its state vector by fusinginertial and visual data.
Fig. 7 shows at the bottom the continuous estimate of thecurrent corridor’s width in vision coordinates. At the top, thecorresponding true corridor width is given in metric coordi-nates. Their ratio defines the absolute scale factor betweenvision and metric coordinates and is used to rescale (pointby point) the estimated position trajectory of PTAM. Fig. 8shows at the top the three components of the device’s truetrajectory overlaid with the visual odometry data from PTAMafter rescaling. The remaining relative position error is givenat the bottom. On average, it is reduced from above 80% tobelow 10%. For this experiment, we tracked the true poseof the device by attaching it rigidly to a mapping trolley asdescribed in [29]. The trolley is equipped with laser rangefinders to compute its exact pose up to centimeter-precision.In Fig. 6, the corridor’s location within our dataset is indicatedas Area 8.
0 100 200 300 400 500
0
10
20
30
40
[s]
[m]
true position (x−component)true position (y−component)true position (z−component)rescaled PTAM−estimate (x−component)rescaled PTAM−estimate (y−component)rescaled PTAM−estimate (z−component)
8
0 100 200 300 400 500 6000
10
20
30
40
50
[s]
[%]
position error
Fig. 8. Top: Rescaled position odometry and ground truth data. The scalefactor is estimated from the ratio of the estimated corridor width and the trueone. A priori known building dimensions derived from a floor plan are used.Bottom: Successful scale estimation reduces the relative position error fromabove 80% to below 10% on average (cf. Area 8 in Fig. 6).
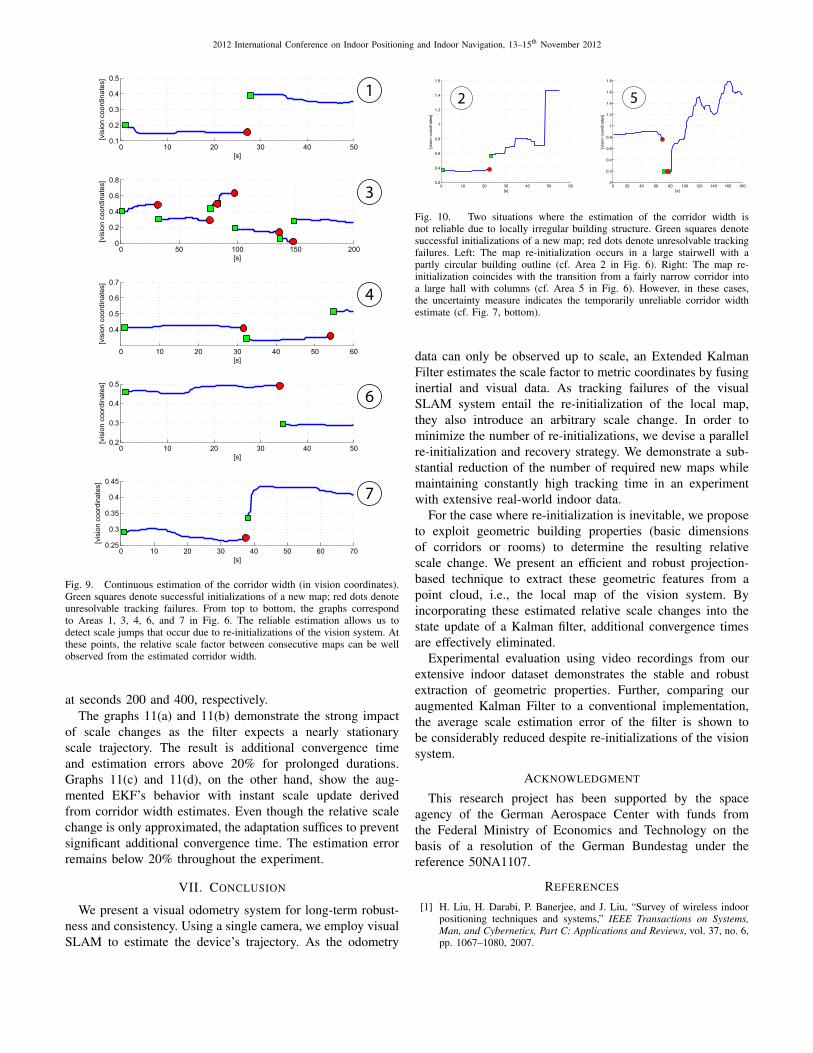
Fig. 9 shows several parts of the visual odometry trajectorywhere re-initializations of the map were necessary. The graphsdepict the continuous estimate of the current corridor’s width.Green squares denote successful initializations of a new map.Red dots denote unresolvable tracking failures.
For the most part, the width estimation proves very stableand converges fast once the vision system is initialized. Mapre-initializations, in contrast, cause significant discontinuitiesas the scale may change arbitrarily. Due to the fast reactiontime and robustness of the width estimation, however, thechange in scale can be directly observed as the ratio betweenthe width estimate before and after the re-initialization.
As the proposed method relies on the assumption thatthe local building structure is mainly regular, it happensthat unconventional structure causes the geometric propertyestimation to fail. A comparison of Figs. 10 and 6 shows thatthe width estimation failed in the case of a semicircular room(cf. Area 2 in Fig. 6), and where the map re-initializationcoincides with the transition between two very dissimilarbuilding parts (cf. Area 5 in Fig. 6). In particular, the secondcase does not satisfy the assumption that geometric buildingproperties remain locally constant.
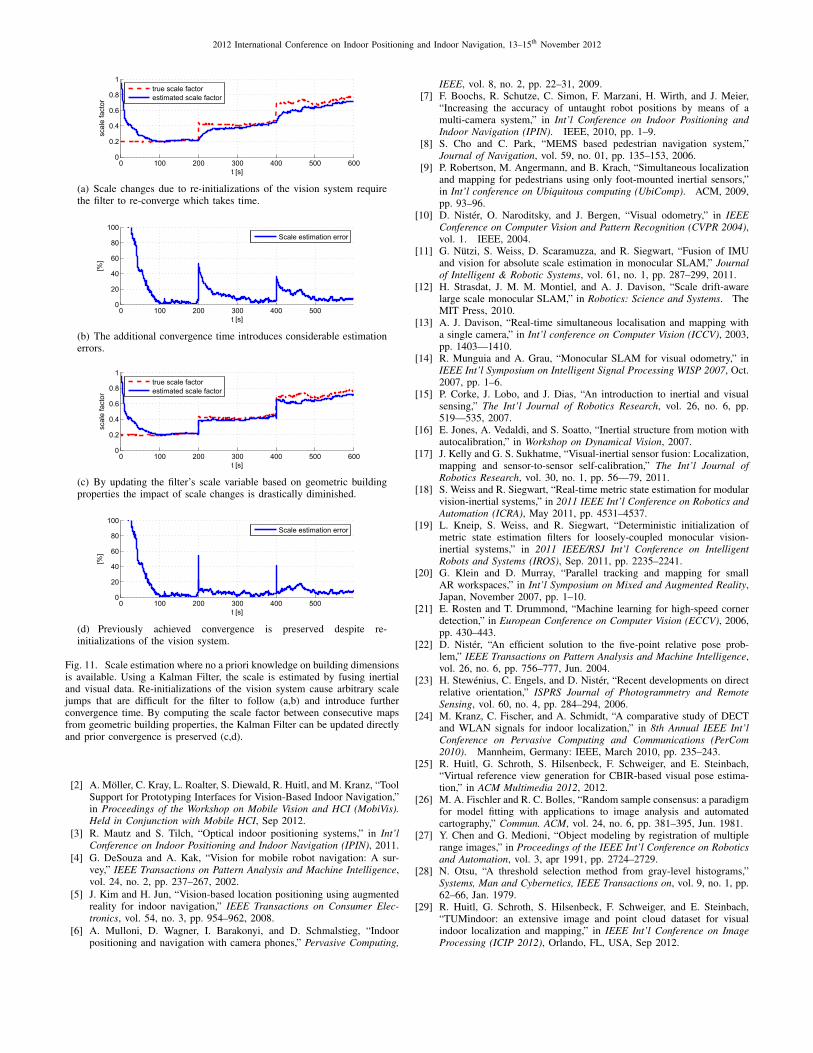
For the general case, where there is no a priori knowledge ofa building’s structure, we employ a state-of-the-art ExtendedKalman Filter (EKF) as described in [18]. By fusing inertialand visual data the filter estimates the scale as part of its statevector. Fig. 11 shows the EKF’s scale estimate and estimationerror over a duration of 10 minutes. For the evaluation, weartificially introduced scale jumps by a factor of two and three
2012 International Conference on Indoor Positioning and Indoor Navigation, 13–15th November 2012
0 10 20 30 40 500.1
0.2
0.3
0.4
0.5
[s]
[vis
ion
coor
dina
tes]
1
0 50 100 150 2000
0.2
0.4
0.6
0.8
[s]
[vis
ion
coor
dina
tes]
3
0 10 20 30 40 50 60
0.4
0.5
0.6
0.7
[s]
[vis
ion
coor
dina
tes]
4
0 10 20 30 40 500.2
0.3
0.4
0.5
[s]
[vis
ion
coor
dina
tes]
6
0 10 20 30 40 50 60 700.25
0.3
0.35
0.4
0.45
[s]
[vis
ion
coor
dina
tes]
7
Fig. 9. Continuous estimation of the corridor width (in vision coordinates).Green squares denote successful initializations of a new map; red dots denoteunresolvable tracking failures. From top to bottom, the graphs correspondto Areas 1, 3, 4, 6, and 7 in Fig. 6. The reliable estimation allows us todetect scale jumps that occur due to re-initializations of the vision system. Atthese points, the relative scale factor between consecutive maps can be wellobserved from the estimated corridor width.
at seconds 200 and 400, respectively.The graphs 11(a) and 11(b) demonstrate the strong impact
of scale changes as the filter expects a nearly stationaryscale trajectory. The result is additional convergence timeand estimation errors above 20% for prolonged durations.Graphs 11(c) and 11(d), on the other hand, show the aug-mented EKF’s behavior with instant scale update derivedfrom corridor width estimates. Even though the relative scalechange is only approximated, the adaptation suffices to preventsignificant additional convergence time. The estimation errorremains below 20% throughout the experiment.
VII. CONCLUSION
We present a visual odometry system for long-term robust-ness and consistency. Using a single camera, we employ visualSLAM to estimate the device’s trajectory. As the odometry
0 10 20 30 40 50 600.2
0.4
0.6
0.8
1
1.2
1.4
1.6
[s]
[vis
ion
coor
dina
tes]
2
0 20 40 60 80 100 120 140 160 1800
0.2
0.4
0.6
0.8
1
1.2
1.4
1.6
1.8
[s]
[vis
ion
coor
dina
tes]
5
Fig. 10. Two situations where the estimation of the corridor width isnot reliable due to locally irregular building structure. Green squares denotesuccessful initializations of a new map; red dots denote unresolvable trackingfailures. Left: The map re-initialization occurs in a large stairwell with apartly circular building outline (cf. Area 2 in Fig. 6). Right: The map re-initialization coincides with the transition from a fairly narrow corridor intoa large hall with columns (cf. Area 5 in Fig. 6). However, in these cases,the uncertainty measure indicates the temporarily unreliable corridor widthestimate (cf. Fig. 7, bottom).
data can only be observed up to scale, an Extended KalmanFilter estimates the scale factor to metric coordinates by fusinginertial and visual data. As tracking failures of the visualSLAM system entail the re-initialization of the local map,they also introduce an arbitrary scale change. In order tominimize the number of re-initializations, we devise a parallelre-initialization and recovery strategy. We demonstrate a sub-stantial reduction of the number of required new maps whilemaintaining constantly high tracking time in an experimentwith extensive real-world indoor data.
For the case where re-initialization is inevitable, we proposeto exploit geometric building properties (basic dimensionsof corridors or rooms) to determine the resulting relativescale change. We present an efficient and robust projection-based technique to extract these geometric features from apoint cloud, i.e., the local map of the vision system. Byincorporating these estimated relative scale changes into thestate update of a Kalman filter, additional convergence timesare effectively eliminated.
Experimental evaluation using video recordings from ourextensive indoor dataset demonstrates the stable and robustextraction of geometric properties. Further, comparing ouraugmented Kalman Filter to a conventional implementation,the average scale estimation error of the filter is shown tobe considerably reduced despite re-initializations of the visionsystem.
ACKNOWLEDGMENT
This research project has been supported by the spaceagency of the German Aerospace Center with funds fromthe Federal Ministry of Economics and Technology on thebasis of a resolution of the German Bundestag under thereference 50NA1107.
REFERENCES
[1] H. Liu, H. Darabi, P. Banerjee, and J. Liu, “Survey of wireless indoorpositioning techniques and systems,” IEEE Transactions on Systems,Man, and Cybernetics, Part C: Applications and Reviews, vol. 37, no. 6,pp. 1067–1080, 2007.
2012 International Conference on Indoor Positioning and Indoor Navigation, 13–15th November 2012
0 100 200 300 400 500 6000
0.2
0.4
0.6
0.8
1
t [s]
scal
e fa
ctor
true scale factorestimated scale factor
(a) Scale changes due to re-initializations of the vision system requirethe filter to re-converge which takes time.
0 100 200 300 400 5000
20
40
60
80
100
t [s]
[%]
Scale estimation error
(b) The additional convergence time introduces considerable estimationerrors.
0 100 200 300 400 500 6000
0.2
0.4
0.6
0.8
1
t [s]
scal
e fa
ctor
true scale factorestimated scale factor
(c) By updating the filter’s scale variable based on geometric buildingproperties the impact of scale changes is drastically diminished.
0 100 200 300 400 5000
20
40
60
80
100
t [s]
[%]
Scale estimation error
(d) Previously achieved convergence is preserved despite re-initializations of the vision system.
Fig. 11. Scale estimation where no a priori knowledge on building dimensionsis available. Using a Kalman Filter, the scale is estimated by fusing inertialand visual data. Re-initializations of the vision system cause arbitrary scalejumps that are difficult for the filter to follow (a,b) and introduce furtherconvergence time. By computing the scale factor between consecutive mapsfrom geometric building properties, the Kalman Filter can be updated directlyand prior convergence is preserved (c,d).
[2] A. Moller, C. Kray, L. Roalter, S. Diewald, R. Huitl, and M. Kranz, “ToolSupport for Prototyping Interfaces for Vision-Based Indoor Navigation,”in Proceedings of the Workshop on Mobile Vision and HCI (MobiVis).Held in Conjunction with Mobile HCI, Sep 2012.
[3] R. Mautz and S. Tilch, “Optical indoor positioning systems,” in Int’lConference on Indoor Positioning and Indoor Navigation (IPIN), 2011.
[4] G. DeSouza and A. Kak, “Vision for mobile robot navigation: A sur-vey,” IEEE Transactions on Pattern Analysis and Machine Intelligence,vol. 24, no. 2, pp. 237–267, 2002.
[5] J. Kim and H. Jun, “Vision-based location positioning using augmentedreality for indoor navigation,” IEEE Transactions on Consumer Elec-tronics, vol. 54, no. 3, pp. 954–962, 2008.
[6] A. Mulloni, D. Wagner, I. Barakonyi, and D. Schmalstieg, “Indoorpositioning and navigation with camera phones,” Pervasive Computing,
IEEE, vol. 8, no. 2, pp. 22–31, 2009.[7] F. Boochs, R. Schutze, C. Simon, F. Marzani, H. Wirth, and J. Meier,
“Increasing the accuracy of untaught robot positions by means of amulti-camera system,” in Int’l Conference on Indoor Positioning andIndoor Navigation (IPIN). IEEE, 2010, pp. 1–9.
[8] S. Cho and C. Park, “MEMS based pedestrian navigation system,”Journal of Navigation, vol. 59, no. 01, pp. 135–153, 2006.
[9] P. Robertson, M. Angermann, and B. Krach, “Simultaneous localizationand mapping for pedestrians using only foot-mounted inertial sensors,”in Int’l conference on Ubiquitous computing (UbiComp). ACM, 2009,pp. 93–96.
[10] D. Nister, O. Naroditsky, and J. Bergen, “Visual odometry,” in IEEEConference on Computer Vision and Pattern Recognition (CVPR 2004),vol. 1. IEEE, 2004.
[11] G. Nutzi, S. Weiss, D. Scaramuzza, and R. Siegwart, “Fusion of IMUand vision for absolute scale estimation in monocular SLAM,” Journalof Intelligent & Robotic Systems, vol. 61, no. 1, pp. 287–299, 2011.
[12] H. Strasdat, J. M. M. Montiel, and A. J. Davison, “Scale drift-awarelarge scale monocular SLAM,” in Robotics: Science and Systems. TheMIT Press, 2010.
[13] A. J. Davison, “Real-time simultaneous localisation and mapping witha single camera,” in Int’l conference on Computer Vision (ICCV), 2003,pp. 1403—1410.
[14] R. Munguia and A. Grau, “Monocular SLAM for visual odometry,” inIEEE Int’l Symposium on Intelligent Signal Processing WISP 2007, Oct.2007, pp. 1–6.
[15] P. Corke, J. Lobo, and J. Dias, “An introduction to inertial and visualsensing,” The Int’l Journal of Robotics Research, vol. 26, no. 6, pp.519—535, 2007.
[16] E. Jones, A. Vedaldi, and S. Soatto, “Inertial structure from motion withautocalibration,” in Workshop on Dynamical Vision, 2007.
[17] J. Kelly and G. S. Sukhatme, “Visual-inertial sensor fusion: Localization,mapping and sensor-to-sensor self-calibration,” The Int’l Journal ofRobotics Research, vol. 30, no. 1, pp. 56—79, 2011.
[18] S. Weiss and R. Siegwart, “Real-time metric state estimation for modularvision-inertial systems,” in 2011 IEEE Int’l Conference on Robotics andAutomation (ICRA), May 2011, pp. 4531–4537.
[19] L. Kneip, S. Weiss, and R. Siegwart, “Deterministic initialization ofmetric state estimation filters for loosely-coupled monocular vision-inertial systems,” in 2011 IEEE/RSJ Int’l Conference on IntelligentRobots and Systems (IROS), Sep. 2011, pp. 2235–2241.
[20] G. Klein and D. Murray, “Parallel tracking and mapping for smallAR workspaces,” in Int’l Symposium on Mixed and Augmented Reality,Japan, November 2007, pp. 1–10.
[21] E. Rosten and T. Drummond, “Machine learning for high-speed cornerdetection,” in European Conference on Computer Vision (ECCV), 2006,pp. 430–443.
[22] D. Nister, “An efficient solution to the five-point relative pose prob-lem,” IEEE Transactions on Pattern Analysis and Machine Intelligence,vol. 26, no. 6, pp. 756–777, Jun. 2004.
[23] H. Stewenius, C. Engels, and D. Nister, “Recent developments on directrelative orientation,” ISPRS Journal of Photogrammetry and RemoteSensing, vol. 60, no. 4, pp. 284–294, 2006.
[24] M. Kranz, C. Fischer, and A. Schmidt, “A comparative study of DECTand WLAN signals for indoor localization,” in 8th Annual IEEE Int’lConference on Pervasive Computing and Communications (PerCom2010). Mannheim, Germany: IEEE, March 2010, pp. 235–243.
[25] R. Huitl, G. Schroth, S. Hilsenbeck, F. Schweiger, and E. Steinbach,“Virtual reference view generation for CBIR-based visual pose estima-tion,” in ACM Multimedia 2012, 2012.
[26] M. A. Fischler and R. C. Bolles, “Random sample consensus: a paradigmfor model fitting with applications to image analysis and automatedcartography,” Commun. ACM, vol. 24, no. 6, pp. 381–395, Jun. 1981.
[27] Y. Chen and G. Medioni, “Object modeling by registration of multiplerange images,” in Proceedings of the IEEE Int’l Conference on Roboticsand Automation, vol. 3, apr 1991, pp. 2724–2729.
[28] N. Otsu, “A threshold selection method from gray-level histograms,”Systems, Man and Cybernetics, IEEE Transactions on, vol. 9, no. 1, pp.62–66, Jan. 1979.
[29] R. Huitl, G. Schroth, S. Hilsenbeck, F. Schweiger, and E. Steinbach,“TUMindoor: an extensive image and point cloud dataset for visualindoor localization and mapping,” in IEEE Int’l Conference on ImageProcessing (ICIP 2012), Orlando, FL, USA, Sep 2012.