Embed Size (px)
Citation preview
Research Methods for Business
Ahmad Othman @2006 1
Data Analysis (Burns, 2000; Schloss & Smith, 1999)
PARAMETRIC versus NON-PARAMETRIC TESTS
Parametric tests make probability judgment with hypothetical sampling distribution.
Non-parametric tests make probability judgments without hypothetical distribution.
Main Menu
Advantage & Disadvantage
Research Methods for Business
Ahmad Othman @2006 2
Data Analysis (Burns, 2000; Schloss & Smith, 1999)
SCALES OF MEASUREMENT
The data may be
nominal,
ordinal,
interval or
ratio.
[Test]
Main Menu
Research Methods for Business
Ahmad Othman @2006 3
Data Analysis (Burns, 2000; Schloss & Smith, 1999)
PARAMETRIC STATISTICS
Parametric statistics make certain assumptions about population parameters.
What are the assumptions?
Research Methods for Business
Ahmad Othman @2006 4
Data Analysis (Burns, 2000; Schloss & Smith, 1999)
Assumption #1
The scores in the population are normally distributed about the mean.

Research Methods for Business
Ahmad Othman @2006 5
Data Analysis (Burns, 2000; Schloss & Smith, 1999)
Assumption #2
The population variances of the comparison groups in one’s study are approximately equal.

Research Methods for Business
Ahmad Othman @2006 6
Data Analysis (Burns, 2000; Schloss & Smith, 1999)
Assumption #3
The scores being analyzed are derived from a measure that has equal intervals.

Research Methods for Business
Ahmad Othman @2006 7
Statistical Tools (Borg & Gall, 1989)
To analyze research results effectively, four kinds of information about statistical tools are needed.
1. What statistical tools are available?
2. Under what conditions each tools is used?
3. What the statistical results mean?
4. How the statistical calculations are made?

Research Methods for Business
Ahmad Othman @2006 8
Data Analysis (Burns, 2000; Schloss & Smith, 1999)
Relationshiphypothesis
Difference or relationship
hypothesis
Differencehypothesis
Between subjects-or matched within-
subjects
Non-parametricSpearman rank order correlation
ParametricPearson product-moment correlation
Between
Start here
Within ormatched
Parametric
Independentt test
Non-Parametric
Mann-Whitney
Parametric
Relatedt test
Non-Parametric
Wilcoxon
Research Methods for Business
9
Chapter 16
Qualitative Data Analysis
© 2012 John Wiley & Sons Ltd. www.wiley.com/college/sekaran
Research Methods for Business
Qualitative Data
• Qualitative data: data in the form of words.
• Examples: interview notes, transcripts of focus groups, answers to open-ended questions, transcription of video recordings, accounts of experiences with a product on the internet, news articles, and the like.
© 2012 John Wiley & Sons Ltd. www.wiley.com/college/sekaran

Research Methods for Business
Analysis of Qualitative Data
• The analysis of qualitative data is aimed at making valid inferences from the often overwhelming amount of collected data.
• Steps:
– data reduction
– data display
– drawing and verifying conclusions
© 2012 John Wiley & Sons Ltd. www.wiley.com/college/sekaran
Research Methods for Business
Data Reduction
• Coding: the analytic process through which the qualitative data that you have gathered are reduced, rearranged, and integrated to form theory.
• Categorization: is the process of organizing, arranging, and classifying coding units.
© 2012 John Wiley & Sons Ltd. www.wiley.com/college/sekaran

Research Methods for Business
Data Display
• Data display: taking your reduced data and displaying them in an organized, condensed manner.
• Examples: charts, matrices, diagrams, graphs, frequently mentioned phrases, and/or drawings.
© 2012 John Wiley & Sons Ltd. www.wiley.com/college/sekaran

Research Methods for Business
Drawing Conclusions
• At this point where you answer your research questions by determining what identified themes stand for, by thinking about explanations for observed patterns and relationships, or by making contrasts and comparisons.
© 2012 John Wiley & Sons Ltd. www.wiley.com/college/sekaran

Research Methods for Business
Reliability in Qualitative Research
• Category reliability “depends on the analyst’s ability to formulate categories and present to competent judges definitions of the categories so they will agree on which items of a certain population belong in a category and which do not.” (Kassarjian, 1977, p. 14).
• Interjudge reliability can be defined degree of consistency between coders processing the same data (Kassarjian 1977).
© 2012 John Wiley & Sons Ltd. www.wiley.com/college/sekaran

Research Methods for Business
Validity in Qualitative Research
• Validity refers to the extent to which the qualitative research results:
– accurately represent the collected data (internal validity)
– can be generalized or transferred to other contexts or settings (external validity).
© 2012 John Wiley & Sons Ltd. www.wiley.com/college/sekaran

Research Methods for Business
Getting the Data Ready for Analysis
• Data coding: assigning a number to the participants’ responses so they can be entered into a database.
• Data Entry: after responses have been coded, they can be entered into a database. Raw data can be entered through any software program (e.g., SPSS)
© 2012 John Wiley & Sons Ltd. www.wiley.com/college/sekaran
Research Methods for Business
Editing Data
• An example of an illogical response is an outlier response. An outlier is an observation that is substantially different from the other observations.
• Inconsistent responses are responses that are not in harmony with other information.
• Illegal codes are values that are not specified in the coding instructions.
© 2012 John Wiley & Sons Ltd. www.wiley.com/college/sekaran
Research Methods for Business
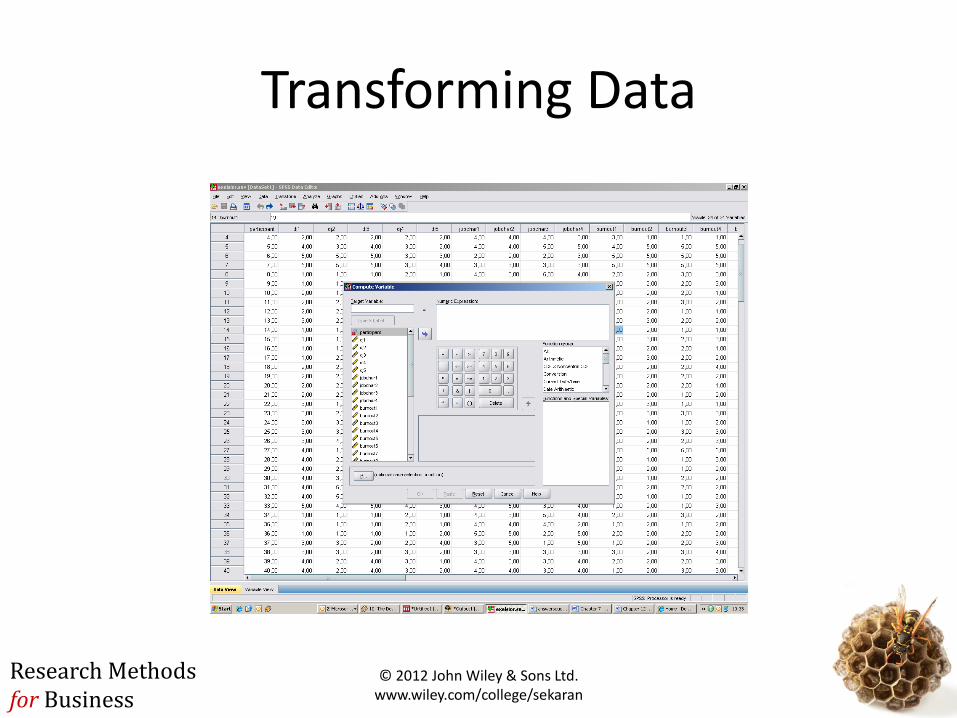
Transforming Data
© 2012 John Wiley & Sons Ltd. www.wiley.com/college/sekaran
Research Methods for Business
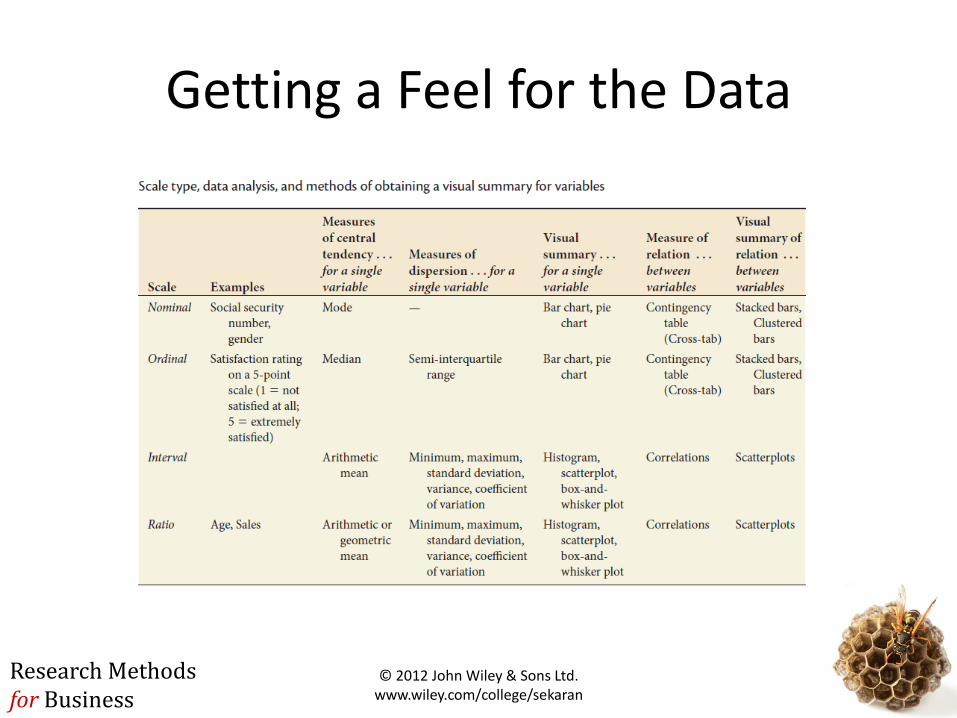
Getting a Feel for the Data
© 2012 John Wiley & Sons Ltd. www.wiley.com/college/sekaran

Research Methods for Business
Frequencies
© 2012 John Wiley & Sons Ltd. www.wiley.com/college/sekaran
Research Methods for Business
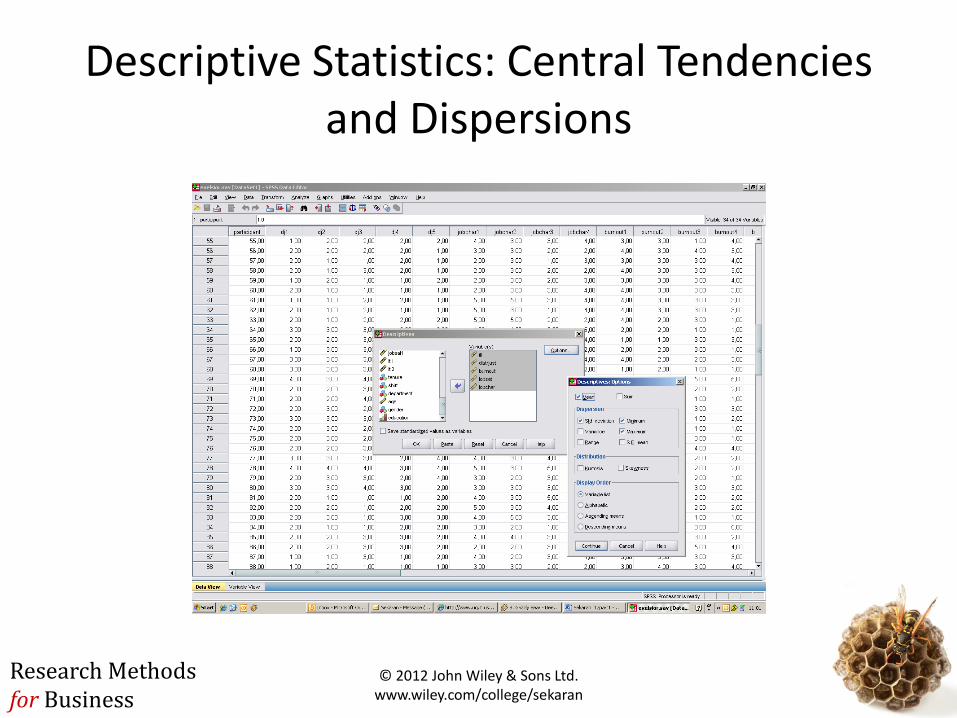
Descriptive Statistics: Central Tendencies and Dispersions
© 2012 John Wiley & Sons Ltd. www.wiley.com/college/sekaran
Research Methods for Business
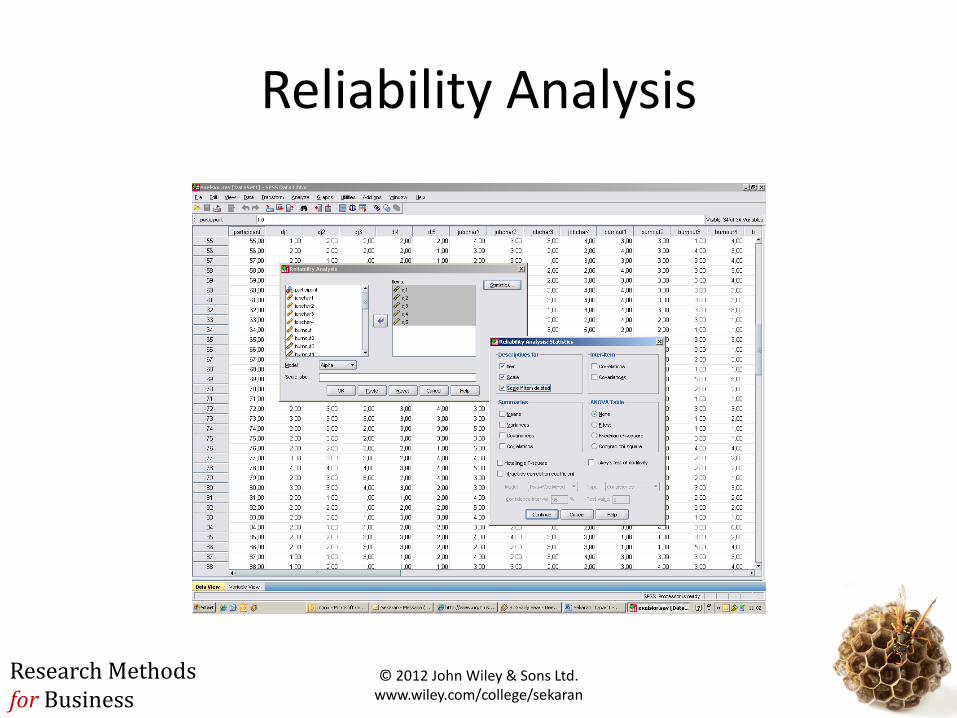
Reliability Analysis
© 2012 John Wiley & Sons Ltd. www.wiley.com/college/sekaran
Research Methods for Business
24
Chapter 15
Quantitative Data Analysis: Hypothesis Testing
© 2012 John Wiley & Sons Ltd. www.wiley.com/college/sekaran
Research Methods for Business
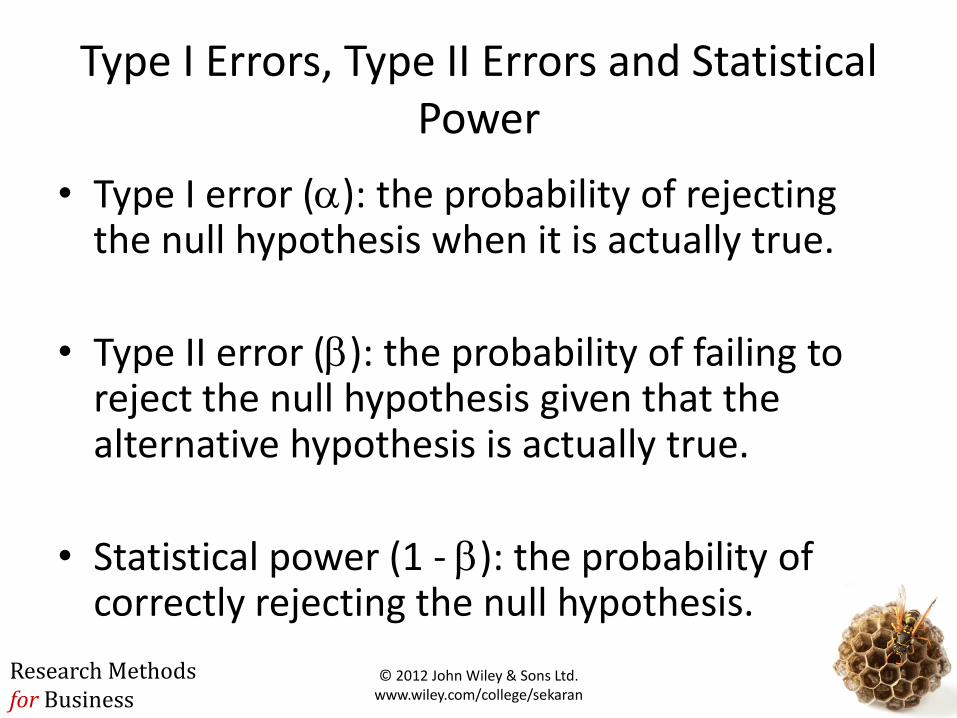
Type I Errors, Type II Errors and Statistical Power
• Type I error (): the probability of rejecting the null hypothesis when it is actually true.
• Type II error (): the probability of failing to reject the null hypothesis given that the alternative hypothesis is actually true.
• Statistical power (1 - ): the probability of correctly rejecting the null hypothesis.
© 2012 John Wiley & Sons Ltd. www.wiley.com/college/sekaran
Research Methods for Business
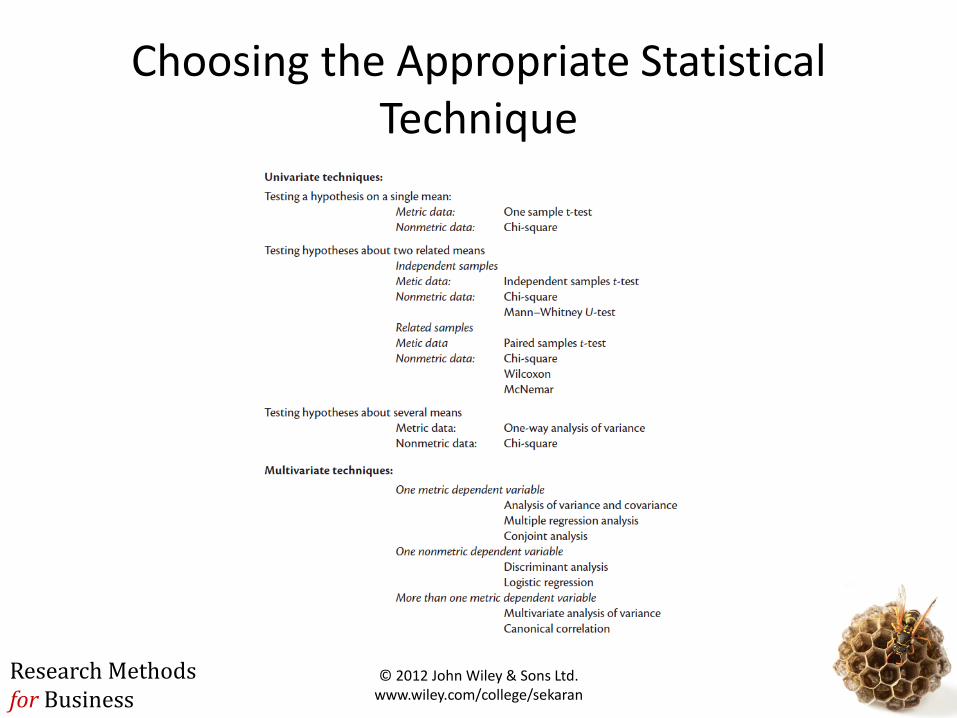
Choosing the Appropriate Statistical Technique
© 2012 John Wiley & Sons Ltd. www.wiley.com/college/sekaran

Research Methods for Business
Testing Hypotheses on a Single Mean
• One sample t-test: statistical technique that is used to test the hypothesis that the mean of the population from which a sample is drawn is equal to a comparison standard.
© 2012 John Wiley & Sons Ltd. www.wiley.com/college/sekaran
Research Methods for Business
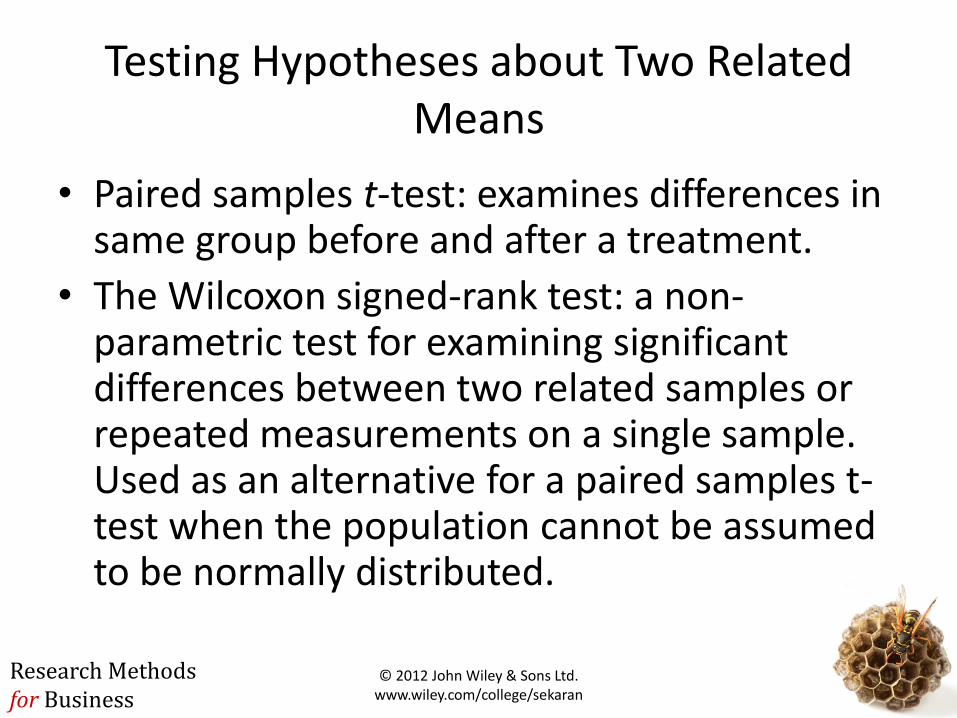
Testing Hypotheses about Two Related Means
• Paired samples t-test: examines differences in same group before and after a treatment.
• The Wilcoxon signed-rank test: a non-parametric test for examining significant differences between two related samples or repeated measurements on a single sample. Used as an alternative for a paired samples t-test when the population cannot be assumed to be normally distributed.
© 2012 John Wiley & Sons Ltd. www.wiley.com/college/sekaran

Research Methods for Business
Testing Hypotheses about Two Related Means - 2
• McNemar's test: non-parametric method used on nominal data. It assesses the significance of the difference between two dependent samples when the variable of interest is dichotomous. It is used primarily in before-after studies to test for an experimental effect.
© 2012 John Wiley & Sons Ltd. www.wiley.com/college/sekaran
Research Methods for Business
Testing Hypotheses about Two Unrelated Means
• Independent samples t-test: is done to see if there are any significant differences in the means for two groups in the variable of interest.
© 2012 John Wiley & Sons Ltd. www.wiley.com/college/sekaran
Research Methods for Business
Testing Hypotheses about Several Means
• ANalysis Of VAriance (ANOVA) helps to examine the significant mean differences among more than two groups on an interval or ratio-scaled dependent variable.
© 2012 John Wiley & Sons Ltd. www.wiley.com/college/sekaran
Research Methods for Business
Regression Analysis
• Simple regression analysis is used in a situation where one metric independent variable is hypothesized to affect one metric dependent variable.
© 2012 John Wiley & Sons Ltd. www.wiley.com/college/sekaran

Research Methods for Business
Scatter plot
30 40 50 60 70 80 90
PHYS_ATTR
20
40
60
80
100
LK
LH
D_
DA
TE
© 2012 John Wiley & Sons Ltd. www.wiley.com/college/sekaran
Research Methods for Business
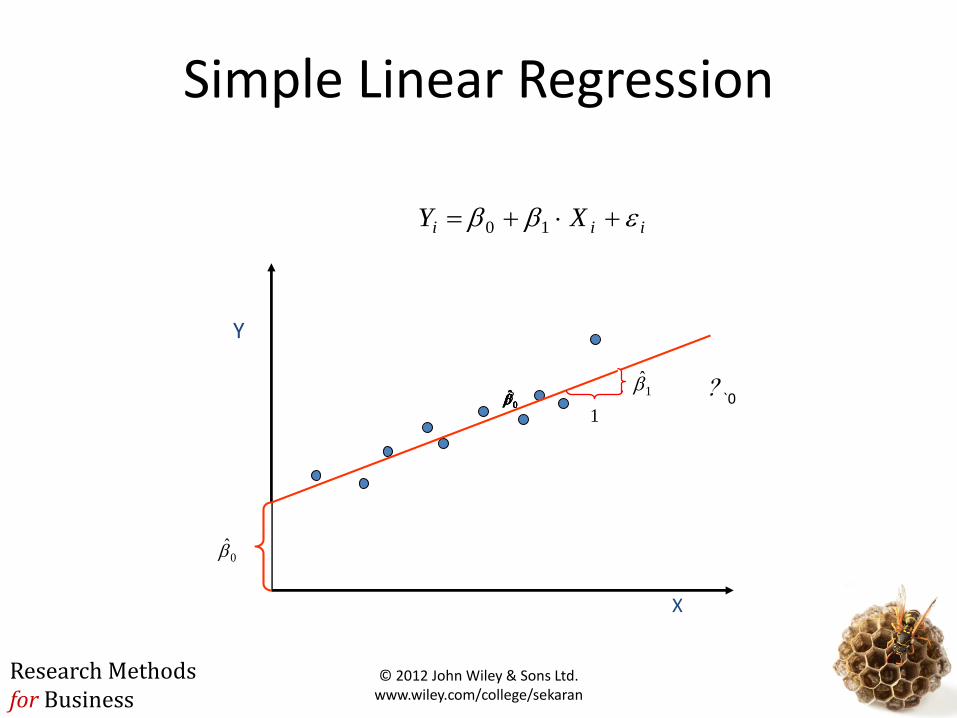
Simple Linear Regression
Y
X
0̂0̂0̂ 0̂ 0̂ 0̂ `0?
0̂
iii XY 10
1̂
1
© 2012 John Wiley & Sons Ltd. www.wiley.com/college/sekaran

Research Methods for Business
Ordinary Least Squares Estimation
Yi
Xi
Yiei
n
1i
2i Minimize e
ˆ
© 2012 John Wiley & Sons Ltd. www.wiley.com/college/sekaran

Research Methods for Business
SPSS
Analyze Regression Linear
Model Summary
.841 .707 .704 5.919
Model
1
R R Square
Adjusted
R Square
Std. Error of
the Estimate
ANOVA
8195.319 1 8195.319 233.901 .000
3398.640 97 35.038
11593.960 98
Regression
Residual
Total
Model
1
Sum of
Squares df Mean Square F Sig.
© 2012 John Wiley & Sons Ltd. www.wiley.com/college/sekaran
Research Methods for Business
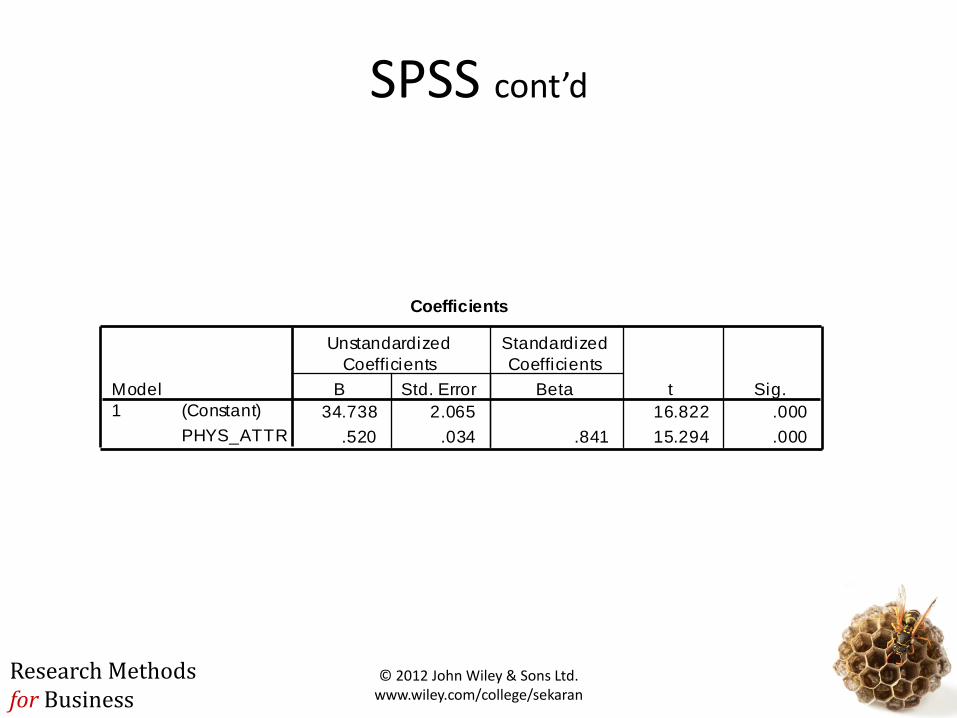
SPSS cont’d
Coefficients
34.738 2.065 16.822 .000
.520 .034 .841 15.294 .000
(Constant)
PHYS_ATTR
Model
1
B Std. Error
Unstandardized
Coefficients
Beta
Standardized
Coefficients
t Sig.
© 2012 John Wiley & Sons Ltd. www.wiley.com/college/sekaran
Research Methods for Business
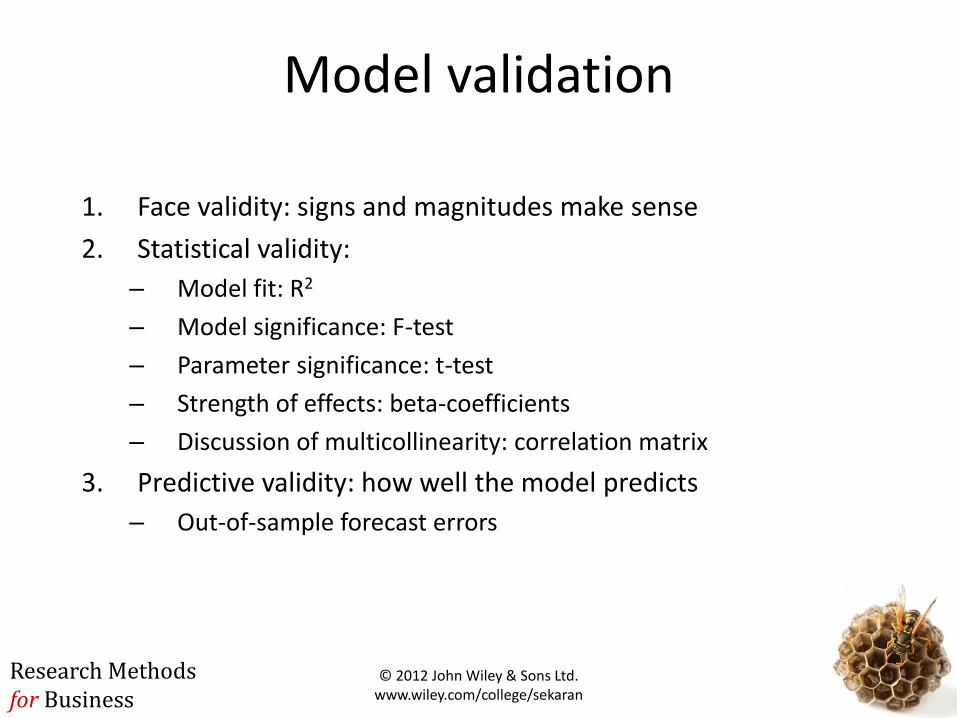
Model validation
1. Face validity: signs and magnitudes make sense
2. Statistical validity:
– Model fit: R2
– Model significance: F-test
– Parameter significance: t-test
– Strength of effects: beta-coefficients
– Discussion of multicollinearity: correlation matrix
3. Predictive validity: how well the model predicts
– Out-of-sample forecast errors
© 2012 John Wiley & Sons Ltd. www.wiley.com/college/sekaran
Research Methods for Business
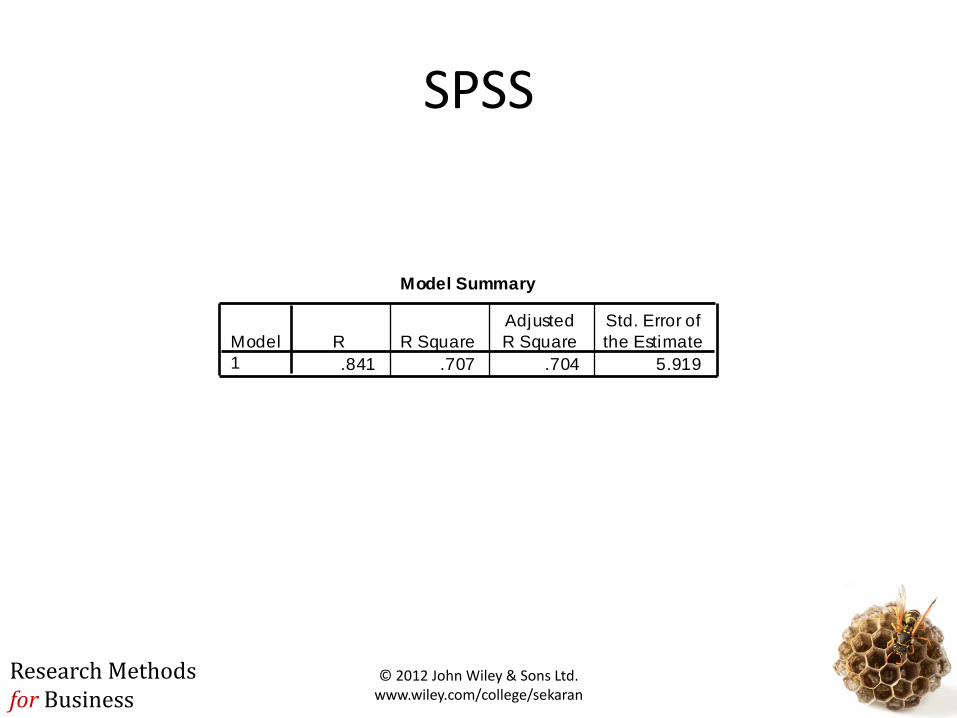
SPSS
Model Summary
.841 .707 .704 5.919
Model
1
R R Square
Adjusted
R Square
Std. Error of
the Estimate
© 2012 John Wiley & Sons Ltd. www.wiley.com/college/sekaran

Research Methods for Business
Measure of Overall Fit: R2
• R2 measures the proportion of the variation in y that is explained by the variation in x.
• R2 = total variation – unexplained variation
total variation
• R2 takes on any value between zero and one:– R2 = 1: Perfect match between the line and the data points.
– R2 = 0: There is no linear relationship between x and y.
© 2012 John Wiley & Sons Ltd. www.wiley.com/college/sekaran

Research Methods for Business
SPSS
Model Summary
.841 .707 .704 5.919
Model
1
R R Square
Adjusted
R Square
Std. Error of
the Estimate
= r(Likelihood to Date, Physical Attractiveness)
© 2012 John Wiley & Sons Ltd. www.wiley.com/college/sekaran

Research Methods for Business
Model Significance
• H0: 0 = 1 = ... = m = 0 (all parameters are zero)
H1: Not H0
© 2012 John Wiley & Sons Ltd. www.wiley.com/college/sekaran

Research Methods for Business
Model Significance
• H0: 0 = 1 = ... = m = 0 (all parameters are zero)
H1: Not H0
• Test statistic (k = # of variables excl. intercept)
F = (SSReg/k) ~ Fk, n-1-k
(SSe/(n – 1 – k)
SSReg = explained variation by regression
SSe = unexplained variation by regression
© 2012 John Wiley & Sons Ltd. www.wiley.com/college/sekaran

Research Methods for Business
SPSS
ANOVA
8195.319 1 8195.319 233.901 .000
3398.640 97 35.038
11593.960 98
Regression
Residual
Total
Model
1
Sum of
Squares df Mean Square F Sig.
© 2012 John Wiley & Sons Ltd. www.wiley.com/college/sekaran
Research Methods for Business
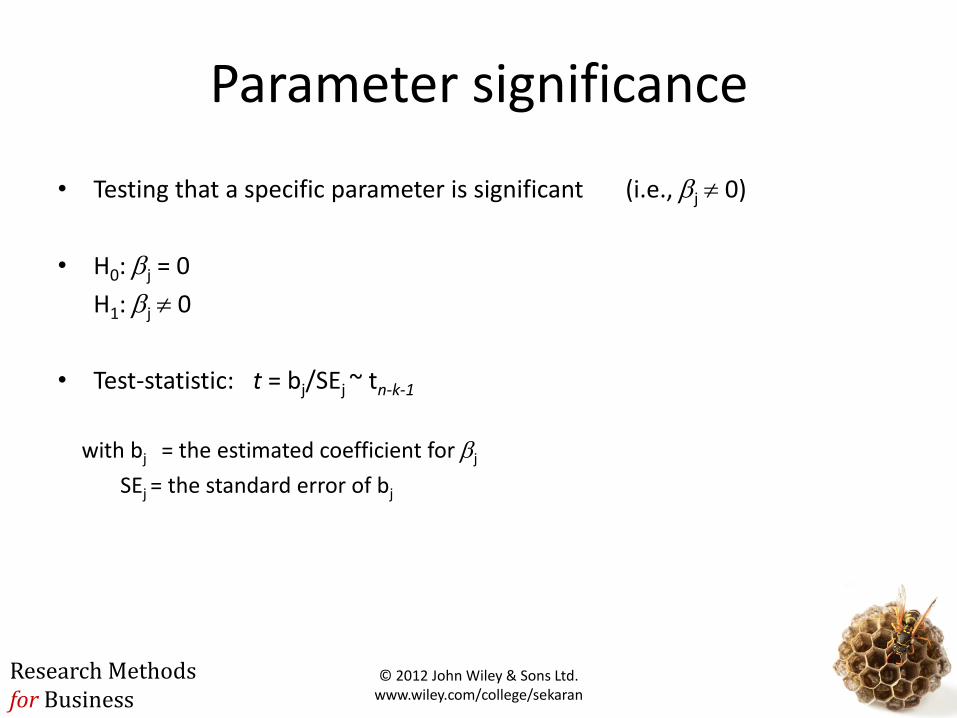
Parameter significance
• Testing that a specific parameter is significant (i.e., j 0)
• H0: j = 0
H1: j 0
• Test-statistic: t = bj/SEj ~ tn-k-1
with bj = the estimated coefficient for j
SEj = the standard error of bj
© 2012 John Wiley & Sons Ltd. www.wiley.com/college/sekaran

Research Methods for Business
SPSS cont’d
Coefficients
34.738 2.065 16.822 .000
.520 .034 .841 15.294 .000
(Constant)
PHYS_ATTR
Model
1
B Std. Error
Unstandardized
Coefficients
Beta
Standardized
Coefficients
t Sig.
© 2012 John Wiley & Sons Ltd. www.wiley.com/college/sekaran
Research Methods for Business
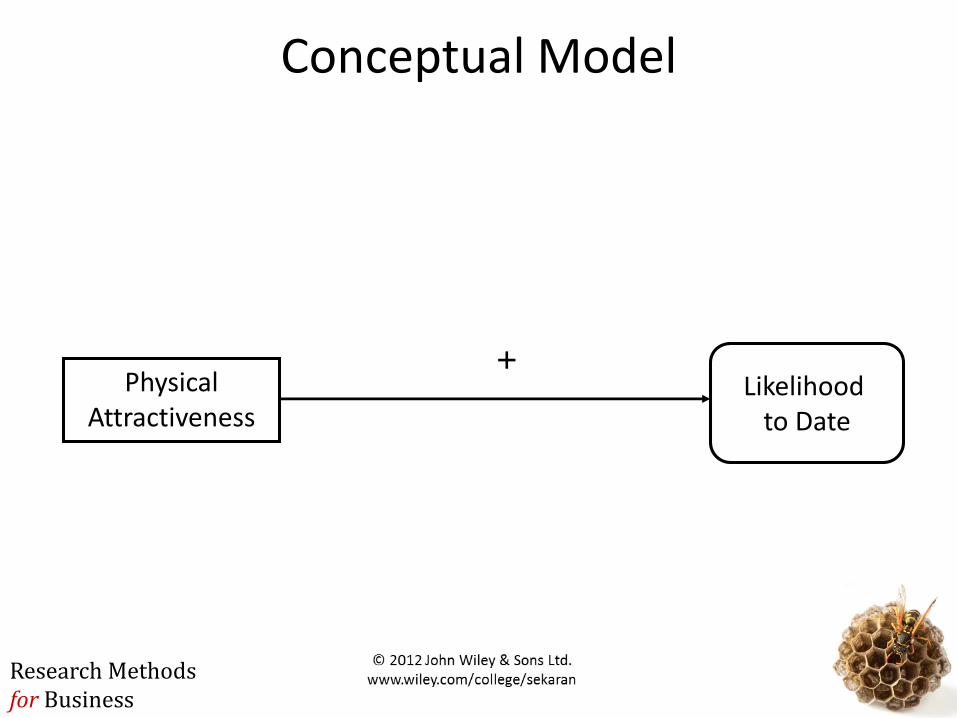
Conceptual Model
Physical Attractiveness
Likelihood to Date
+

Research Methods for Business
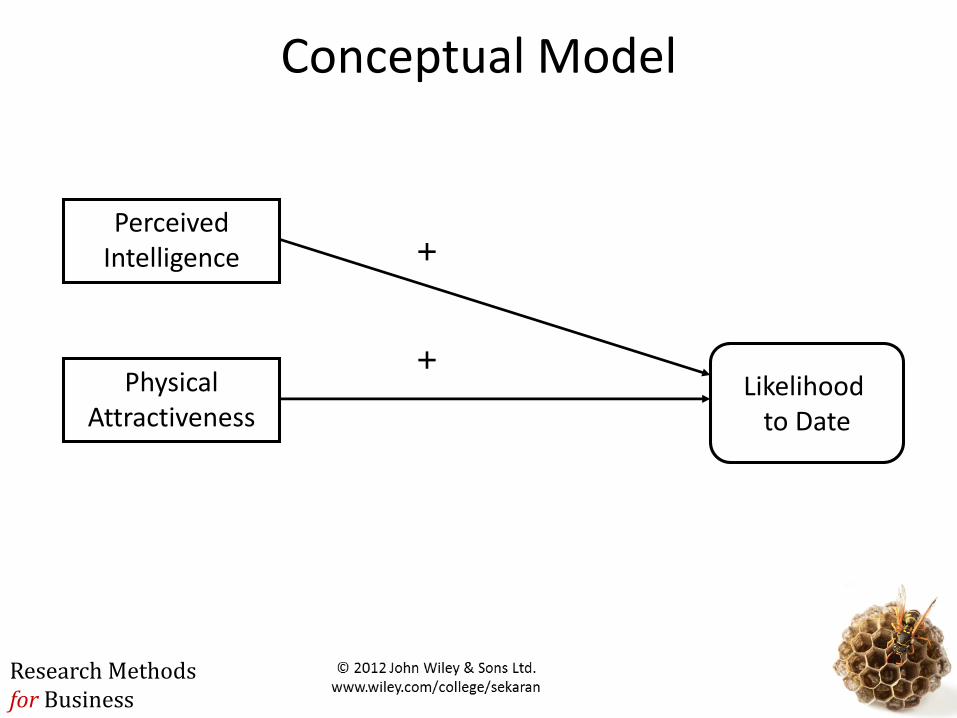
Multiple Regression Analysis
• We use more than one (metric or non-metric) independent variable to explain variance in a (metric) dependent variable.
Research Methods for Business
Conceptual Model
Perceived Intelligence
Physical Attractiveness
+
+Likelihood
to Date
Research Methods for Business
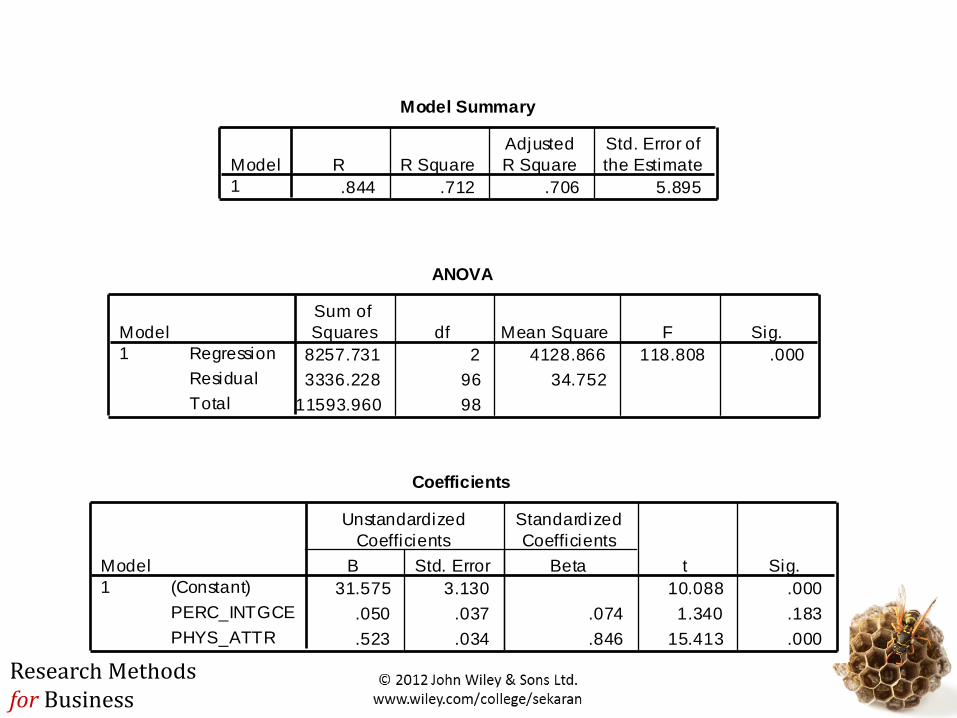
Model Summary
.844 .712 .706 5.895
Model
1
R R Square
Adjusted
R Square
Std. Error of
the Estimate
ANOVA
8257.731 2 4128.866 118.808 .000
3336.228 96 34.752
11593.960 98
Regression
Residual
Total
Model
1
Sum of
Squares df Mean Square F Sig.
Coefficients
31.575 3.130 10.088 .000
.050 .037 .074 1.340 .183
.523 .034 .846 15.413 .000
(Constant)
PERC_INTGCE
PHYS_ATTR
Model
1
B Std. Error
Unstandardized
Coefficients
Beta
Standardized
Coefficients
t Sig.

Research Methods for Business
Conceptual Model
Perceived Intelligence
Physical Attractiveness
Likelihood to Date
Gender
+ +
+

Research Methods for Business
Moderators• Moderator is qualitative (e.g., gender, race, class) or quantitative
(e.g., level of reward) that affects the direction and/or strength of the relation between dependent and independent variable
• Analytical representation
Y = ß0 + ß1X1 + ß2X2 + ß3X1X2
with Y = DVX1 = IVX2 = Moderator

Research Methods for Business
Model Summary
.910 .828 .821 4.601
Model
1
R R Square
Adjusted
R Square
Std. Error of
the Estimate
ANOVA
9603.938 4 2400.984 113.412 .000
1990.022 94 21.170
11593.960 98
Regression
Residual
Total
Model
1
Sum of
Squares df Mean Square F Sig.

Research Methods for Business
Coefficients
32.603 3.163 10.306 .000
.000 .043 .000 .004 .997
.496 .027 .802 18.540 .000
-.420 3.624 -.019 -.116 .908
.127 .058 .369 2.177 .032
(Constant)
PERC_INTGCE
PHYS_ATTR
GENDER
PI_GENDER
Model
1
B Std. Error
Unstandardized
Coefficients
Beta
Standardized
Coefficients
t Sig.
interaction significant effect on dep. var.
Research Methods for Business
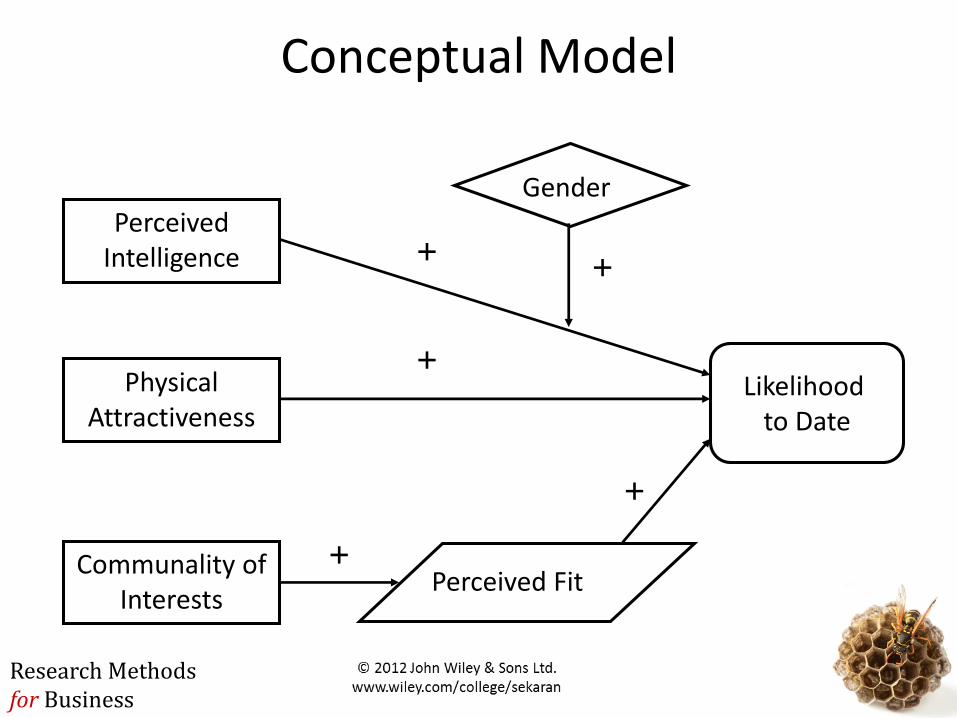
Conceptual Model
Perceived Intelligence
Physical Attractiveness
Communality of Interests
Likelihood to Date
Gender
Perceived Fit
+ +
+
+
+

Research Methods for Business
Mediating/intervening variable• Accounts for the relation between the independent and
dependent variable
• Analytical representation
1. Y = ß0 + ß1X=> ß1 is significant
2. M = ß2 + ß3X=> ß3 is significant
3. Y = ß4 + ß5X + ß6M=> ß5 is not significant=> ß6 is significant
With Y = DV
X = IV
M = mediator

Research Methods for Business
Step 1
Model Summary
.963 .927 .923 3.020
Model
1
R R Square
Adjusted
R Square
Std. Error of
the Estimate
ANOVA
10745.603 5 2149.121 235.595 .000
848.357 93 9.122
11593.960 98
Regression
Residual
Total
Model
1
Sum of
Squares df Mean Square F Sig.
Research Methods for Business
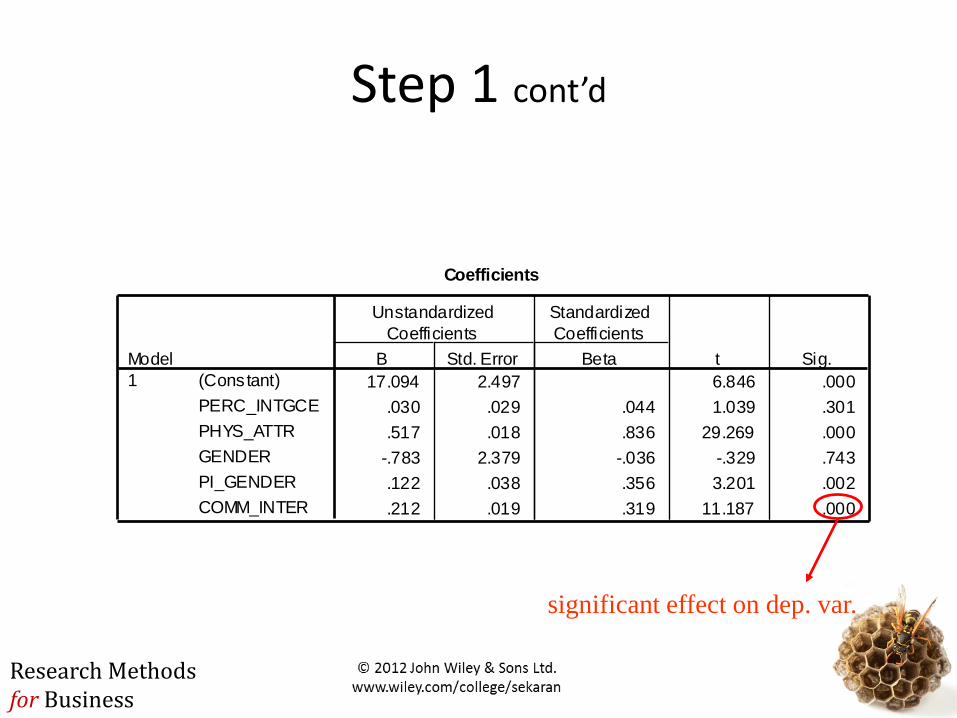
Step 1 cont’d
Coefficients
17.094 2.497 6.846 .000
.030 .029 .044 1.039 .301
.517 .018 .836 29.269 .000
-.783 2.379 -.036 -.329 .743
.122 .038 .356 3.201 .002
.212 .019 .319 11.187 .000
(Constant)
PERC_INTGCE
PHYS_ATTR
GENDER
PI_GENDER
COMM_INTER
Model
1
B Std. Error
Unstandardized
Coefficients
Beta
Standardized
Coefficients
t Sig.
significant effect on dep. var.
Research Methods for Business
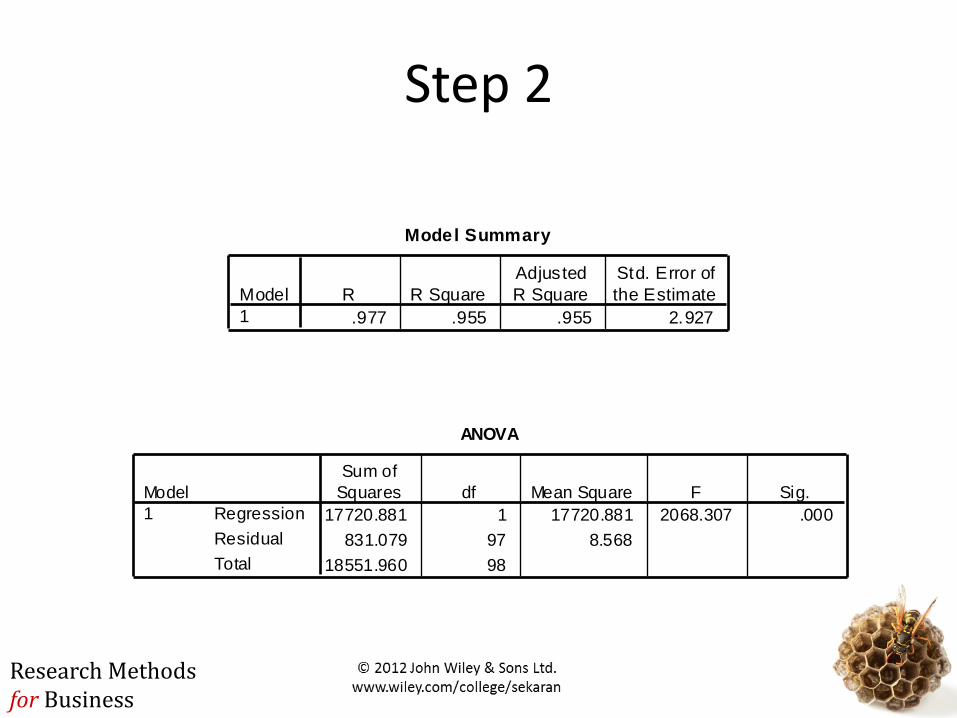
Step 2
Model Summary
.977 .955 .955 2.927
Model
1
R R Square
Adjusted
R Square
Std. Error of
the Estimate
ANOVA
17720.881 1 17720.881 2068.307 .000
831.079 97 8.568
18551.960 98
Regression
Residual
Total
Model
1
Sum of
Squares df Mean Square F Sig.
Research Methods for Business
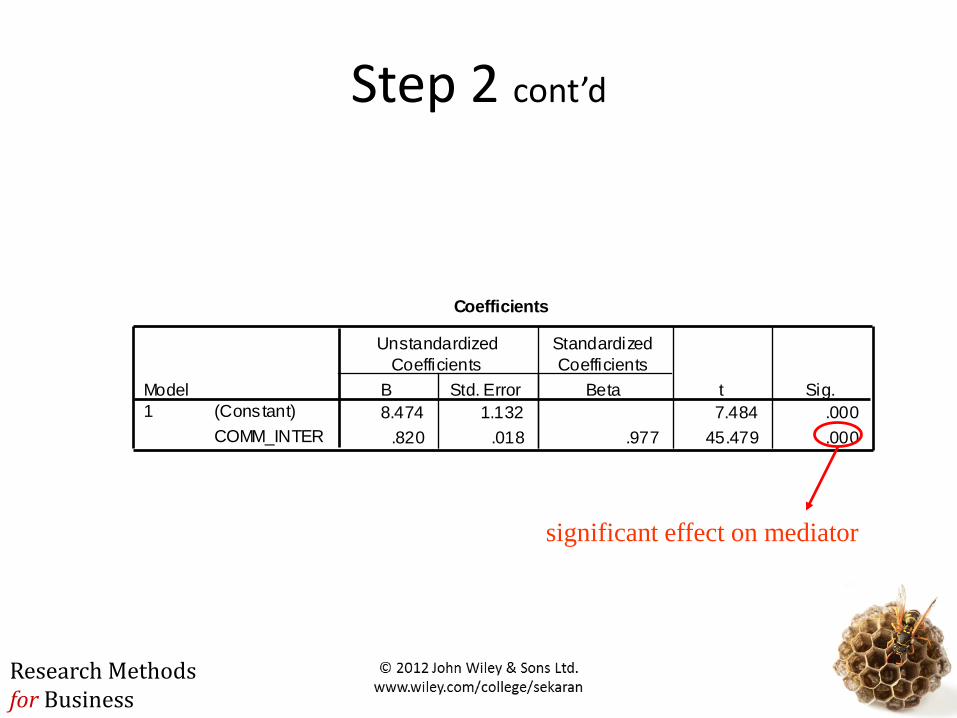
Step 2 cont’d
Coefficients
8.474 1.132 7.484 .000
.820 .018 .977 45.479 .000
(Constant)
COMM_INTER
Model
1
B Std. Error
Unstandardized
Coefficients
Beta
Standardized
Coefficients
t Sig.
significant effect on mediator

Research Methods for Business
Step 3
Model Summary
.966 .934 .930 2.885
Model
1
R R Square
Adjusted
R Square
Std. Error of
the Estimate
ANOVA
10828.336 6 1804.723 216.862 .000
765.624 92 8.322
11593.960 98
Regression
Residual
Total
Model
1
Sum of
Squares df Mean Square F Sig.
Research Methods for Business
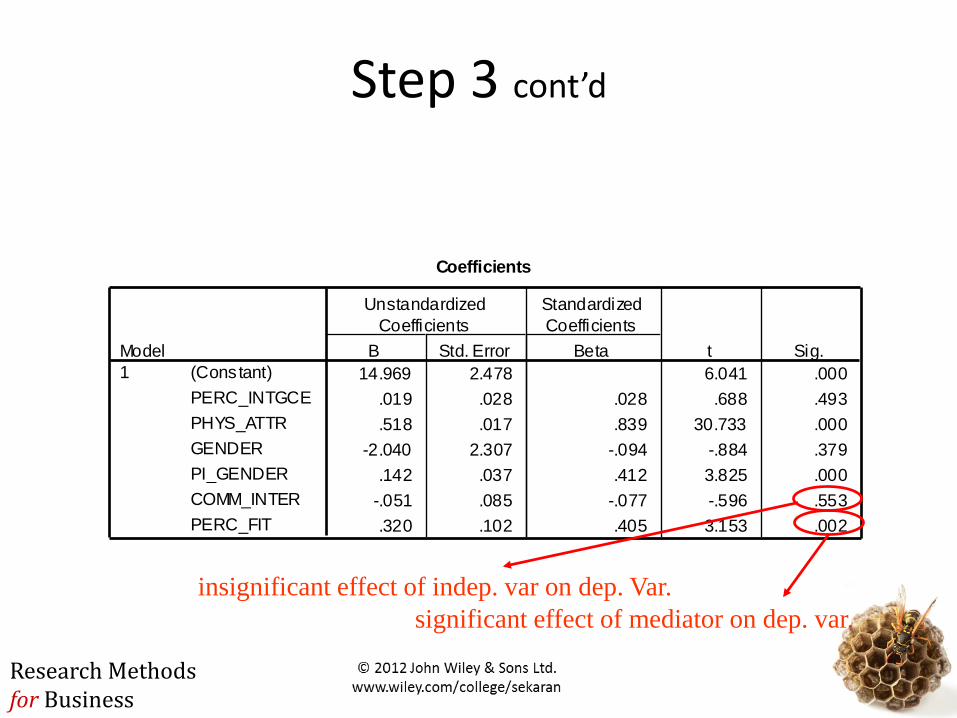
Step 3 cont’d
Coefficients
14.969 2.478 6.041 .000
.019 .028 .028 .688 .493
.518 .017 .839 30.733 .000
-2.040 2.307 -.094 -.884 .379
.142 .037 .412 3.825 .000
-.051 .085 -.077 -.596 .553
.320 .102 .405 3.153 .002
(Constant)
PERC_INTGCE
PHYS_ATTR
GENDER
PI_GENDER
COMM_INTER
PERC_FIT
Model
1
B Std. Error
Unstandardized
Coefficients
Beta
Standardized
Coefficients
t Sig.
significant effect of mediator on dep. var.
insignificant effect of indep. var on dep. Var.