Embed Size (px)
Citation preview

Scaling of Small-Scale to data to Full-Scale Modelling
Professor Roger LewisDr Adam Beagles

Outline• ICRI Wear Mapping Activity• Why do Tests?• Choice of Test?• Issues with small-scale tests and how to deal
with them…• Application of small-scale data – case studies• Summary

ICRI Wear Mapping Scope• To develop “universal” wear maps
representative of full-scale operation that take account of the full range of operating environmental conditions prevalent for the wheel/rail contact.
• These would be used as stand alone tools as well as providing input data for MBD simulation based tools for predicting wheel and rail wear.

Existing Wear Maps
• T wear relationships• KTH Archard wear
coefficient map extensively used
0.0 0.1 0.2 0.3 0.4 0.5 0.6 0.7 0.8 0.9700
800
900
1000
1100
1200
1300
1400SEVEREMILD
SEVE
RE
- CAT
ASTR
OP
HIC
TR
AN
SITI
ON CATASTROPHIC
Sliding Velocity (m/s)
Con
tact
Pre
ssur
e (M
Pa)
30.63 -- 35.00 26.25 -- 30.63 21.88 -- 26.25 17.50 -- 21.88 13.13 -- 17.50 8.750 -- 13.13 4.375 -- 8.750 0 -- 4.375
Wear coefficient, k (dry) [104]
0.0
0.5
1.0
1.5
2.0
2.5
3.0
0 0.2 0.4 0.6 0.8 1Slip velocity [m/s]
Pre
ssur
e [G
Pa]
k3 = 30 - 40k 2
= 1
- 10
k 4 =
1 -
10
k1 = 300 - 400
Seizure
Mild wear (oxide)
Severe wear (metallic)
Mild wear(high oxidation
rate)
0
500
1000
1500
2000
2500
3000
0 20 40 60 80 100 120
Wea
r Rat
e (
g/m
/mm
2 )
T /A (N/mm2)
MildSevere
Catastrophic

Strategy
Gather wear data
Identify key scenarios
Find gaps
Lab vs full-scale
Generate contact information
Plan test programme
Produce wear mechanism/rate maps
Wear debris analysis

Outcome – Wear Map(s)
P
V
Wear Rate Contours
Different Wear MechanismsIdentified

Outcome – Related to Actual Contact Conditions
P
V
Rail Head/Tread
Flange/Gauge Corner

Outcome – “Sub-maps” for Third Body Scenarios
P
V
P
VTOR FM
Curve Lubricant

What we need…
• More contact data• More wear data• Input on scenarios – where are the issues?• In obtaining more wear data a better defined
methodology is needed…
• Approach to scaling…..?

Why do we do tests?• To understand mechanisms• To develop models/performance maps• To determine model inputs• To validate models• To assess material performance• To assess applied product performance
• For all of these to provide relevant results we need tests to be as representative as possible of field conditions…

How do we choose what type of test to use?...
Tribometer Scaled Component Full-scale/Field
Increasing Complexity, Time Cost…
Increasing Control and Ease of Measurement

Issues with Small Scale Tests• Specimens – geometry (and therefore contact size and
shape); surface conditions and properties
• Contact conditions
• Acceleration…
• Test length
• Temperature
• Environmental conditions
• Constant contact position
• Constant recycling

Specimens
• Good to have specimens made from actual wheel and rail
• Need to take parallel to running bands
• Preparation – clean?• Geometry – particularly
important for 3B material application

Specimens• Surface roughness key – worn wheel/rail
1m Ra?• Models assume smooth – is this okay?• Work by BRR looking at roughness
effects concluded that for full-scale roughness not critical (i.e., smooth assumption okay), however, it appeared more critical for small-scale tests…
• Needs more work…
Con
tact
Pre
ssur
e (M
Pa)
20 kN 40 kN
60 kN 80 kN Marshall et al., ASME Journal of Tribology, 128 (2006), 493-504
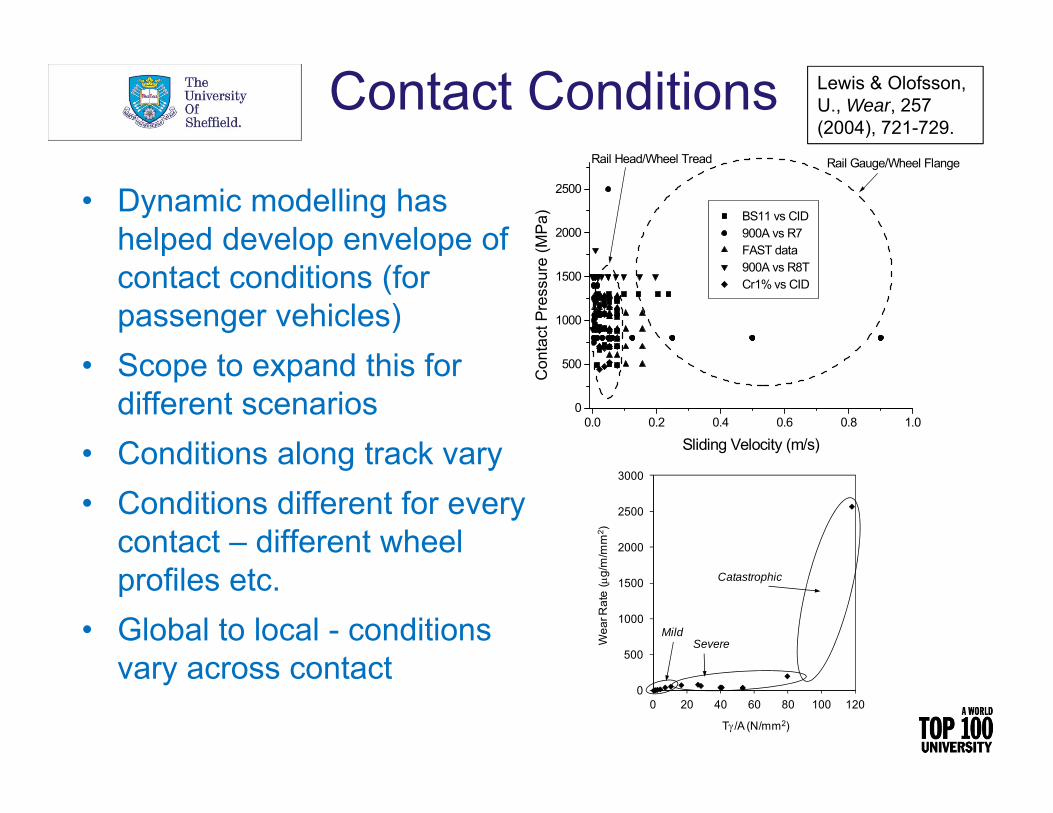
Contact Conditions
• Dynamic modelling has helped develop envelope of contact conditions (for passenger vehicles)
• Scope to expand this for different scenarios
• Conditions along track vary• Conditions different for every
contact – different wheel profiles etc.
• Global to local - conditions vary across contact
0.0 0.2 0.4 0.6 0.8 1.00
500
1000
1500
2000
2500
Rail Head/Wheel Tread Rail Gauge/Wheel Flange
BS11 vs CID 900A vs R7 FAST data 900A vs R8T Cr1% vs CID
Con
tact
Pre
ssur
e (M
Pa)
Sliding Velocity (m/s)
0
500
1000
1500
2000
2500
3000
0 20 40 60 80 100 120
Wea
r Rat
e (
g/m
/mm
2 )
T /A (N/mm2)
MildSevere
Catastrophic
Lewis & Olofsson, U., Wear, 257 (2004), 721-729.

Contact ConditionsSlipStick
Mats Berg: Wear depths predicted over contact patch (highly non-linear)
https://www.ave.kth.se/avd/rail/research/sword-1.48488
Full-scale contact patch idealised to ellipse:• Areas of stick and slip• Variations of normal contact
stress (e.g., Hertzian)• Variations of creep and shear
stress (non-linear)

Small-scale Conditions
Wheel-rail contact
SlipStick
Twin-disc test: contact corresponds to one line through the wheel-rail contact
Pin-on-disc tests: conditions correspond to one point of the wheel-rail contact

ScalingTwin-disc tests:• Carry out tests for different lines through the contact
patch?• Assume average conditions will produce representative
results?
SlipStick
Pin-on-disc tests:• Multiple tests required to represent all parts of contact
patch• One test at average conditions unlikely to be
representativeNeed to consider relevant (i.e., for vehicles and wheels passing over rail) contact geometries and produce averages of appropriate small-scale results to predict wear and RCF of rail.

Sub-Surface
• Shear stress – important in dictating damage mechanisms
• Depth and magnitude important
• Friction and load effects
Twin disc test with lubricant –shear stress has caused band of deformation below surface

Sub-Surface
• Depth of peak shear stress –important in dictating damage mechanisms
• Big difference between small and full-scale…
00.10.20.30.40.50.60.70.80.9
1
0 5 10 15 20 25Slip (%)
Dep
th o
f Pla
stic
Def
orm
atio
n (m
m)
Wheel Tread
Wheel Flange
Wheel Twin Disc Lewis et al., Journal of Rail and Rapid Transit, Proc. of the IMechE Part F., 224 (2010), 125-137.
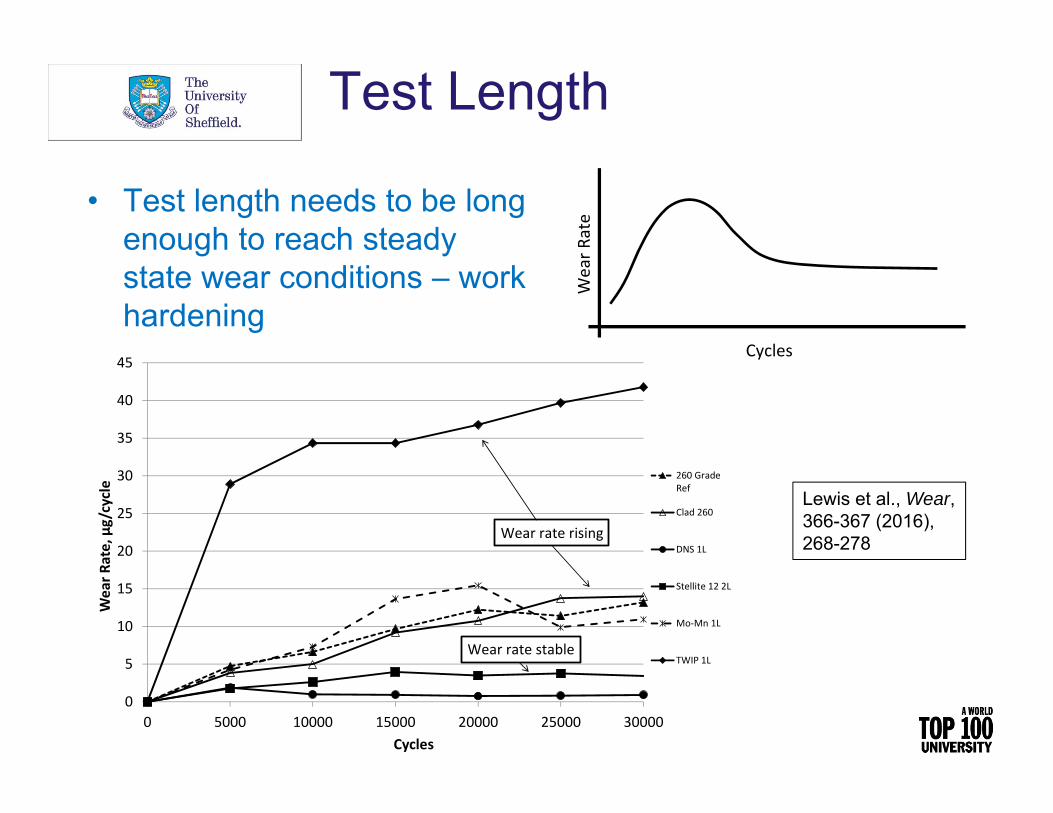
Test Length
0
5
10
15
20
25
30
35
40
45
0 5000 10000 15000 20000 25000 30000
Wear R
ate, μg/cycle
Cycles
260 GradeRef
Clad 260
DNS 1L
Stellite 12 2L
Mo‐Mn 1L
TWIP 1L
Wear rate rising
Wear rate stable
• Test length needs to be long enough to reach steady state wear conditions – work hardening
Wear R
ate
Cycles
Lewis et al., Wear, 366-367 (2016), 268-278

Temperature
• Temperature in small scale specimen high due to repeated cycles
• Third-body layer thicker as a result
• Options for dealing with this: air cooling; oxide removal ENVIRONMENT
CHAMBER
WHEEL DISC (DRIVING DISC)
RAIL DISC (BRAKING DISC)
FILTER TO TRAPWEAR DEBRIS
AIRCOOLING
AIRCOOLING
SUCTION FORREMOVAL OFWEAR DEBRIS
Twin disc 3BL Actual rail 3BL
Gallardo-Hernandez et al., Tribology International, 39 (2006), 1653-1663.

Environmental Conditions
• Tests generally run “dry”• In the real world humidity and temperature vary,
precipitation occurs…• Some data for vary environmental temperatures, but rigs
capable of such control are rare
Zhu et al., Proceedings of Railways 2014.

Applying Output from Small-Scale Tests: Wear Modelling
• Global wheel/rail conditions from MBD simulations
• Local contact analysis• Two approaches: Archard and T – wear
coefficients for a range of conditions• Validated – comparison with full-scale data (dry)• Third-body layers – more wear coefficients
needed…Vehicle Data
VehicleMission Profile
Rail Profile
Wheel Profile
MULTI-BODYMODEL OFRAILWAYVEHICLE
Contact PatchGeometry
Position ofContacts
Global ContactForces
Global Slip
LOCALCONTACTANALYSIS
WHEELPROFILE
EVOLUTIONCALCULATION
Wear Coefficients fromSpecimen Bench Twin Disc
Testing
Contact PatchGeometry
Distribution ofSlip andTraction
See e.g., Braghin et al., Wear, 261 (2008), 1253-1264.

Comparing Full and Small Scale Tests
• Twin disc and full-scale tests (on VoestAlpine rig) in dry conditions and with water based Friction Modifier
Buckley-Johnstone et al., Proceedings of Railways 2016

Third-Body Materials –Incorporation into Models
0
10
20
30
40
50
60
0 2 4 6 8 10 12
Wea
r rat
e (
g/m
/mm
2 )
T /A (N/mm2)
Wet Wear Data
Dry Wear Data
Arrow 1
Arrow 2
0
0.1
0.2
0.3
0.4
0.5
0.6
0.7
0 1 2 3 4 5 6 7Slip (%)
Dry
Wet
Oil
Dry LeavesWet Leaves
Rovira et al., Wear, 274-275 (2012), 109-126.
• Typically third body materials incorporated by changing
• Friction results from contact conditions!
• This can mean errors in force predictions
• Problems with wear predictions
• More creep force data needed for 3BLs
Gallardo-Hernandez et al., Wear, 265 (2008)1309-1316.

Third-Body Materials –Application
• Correct application critical for representative tests
• Can be difficult – scaled contact – scaled application?
• Constant cycling also makes it problematic
Bolt to Adjust Spring Force
HPF Stick
Wheel Disc
Rail Disc

• Physically based, ratcheting model, which can be applied to general three-dimensional problems.
• Provides plastic shear strain data, which aid in predicting rolling contact fatigue crack initiation.
• Takes advantage of creep information from elastic contact calculations in determining the ratcheting strains in longitudinal and lateral directions of the rail
• The model has been applied to results of multi-body system simulations
Trummer et al., Wear, 314 (2014), 28–35
Applying Output from Small-Scale Tests: Crack Initiation
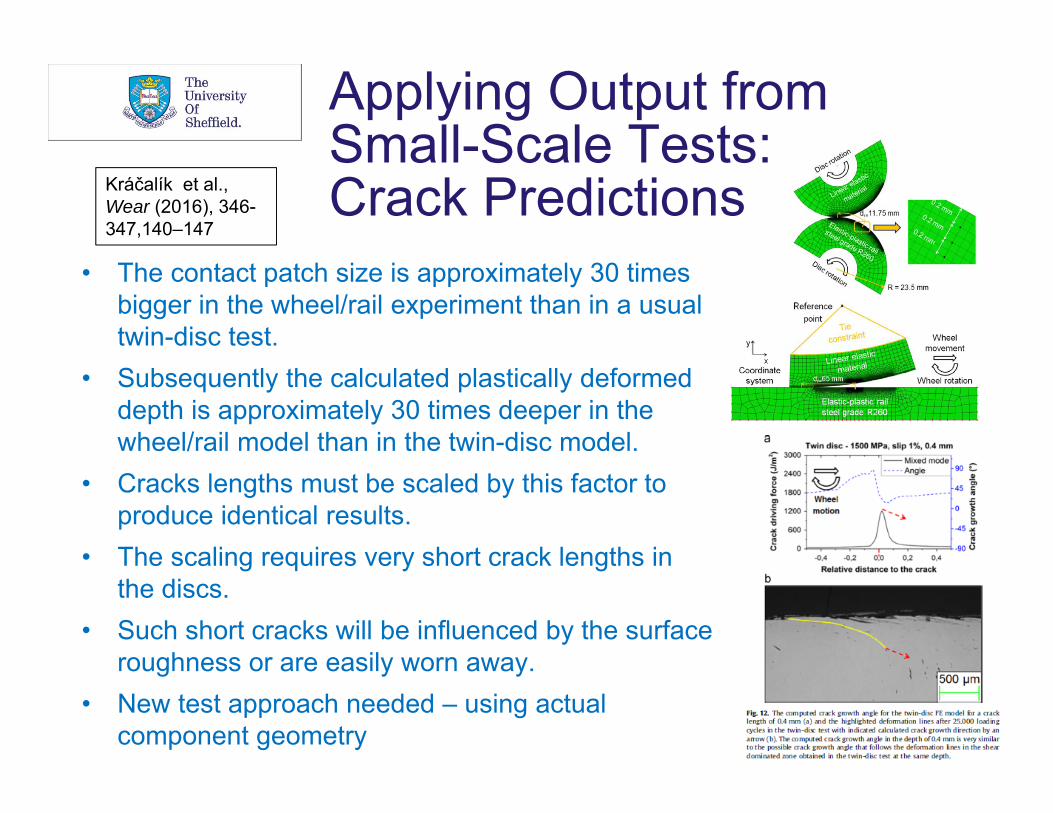
Applying Output from Small-Scale Tests: Crack Predictions
• The contact patch size is approximately 30 times bigger in the wheel/rail experiment than in a usual twin-disc test.
• Subsequently the calculated plastically deformed depth is approximately 30 times deeper in the wheel/rail model than in the twin-disc model.
• Cracks lengths must be scaled by this factor to produce identical results.
• The scaling requires very short crack lengths in the discs.
• Such short cracks will be influenced by the surface roughness or are easily worn away.
• New test approach needed – using actual component geometry
Kráčalík et al., Wear (2016), 346-347,140–147

Summary and Future Directions
• Improved test methods can increase relevance of small-scale tests
• Many approaches to testing and modelling – more consistency needed…
• Consideration of context of use important• Maps of data covering wide range of conditions to cover entire
contact patch and account for all causes of variation are needed
• Wear relatively advanced – need for more data on 3BLs• Crack initiation more complicated, but useful results can be
achieved – more data needed for different contact conditions and rail materials (and weld materials!; and clad layers…)
• Crack growth even more tricky – not possible to scale from twin disc tests, a test using actual component geometry is required – such tests exist – need to have more widespread use