Embed Size (px)
Citation preview
Scaling Up CashApplying the Cash Decision Questions to:• Scale Up Cash• Profitability• The Wealth Building
Capacity of your business
Presented by:Greg Crabtree, CPA, Author of “Simple Numbers, Straight Talk, Big Profits” and contributor to Scaling Up (Chapter 13)
Cash Decision Questions
1. The business is structured and operated as if it were being sold tomorrow to maximize market value.
2. Profitability is running at 3x industry average. 3. Cash flow is a high priority i.e. we’re focused
on continually improving the business model to generate more cash as the business scales.
Cash Decision Questions
4. We receive timely and accurate reporting of key data for our daily, weekly, monthly, and quarterly meeting rhythms.
5. We know profitability, gross margin, and revenue by customer, project, location, line of business, team and/or employee where applicable
Cash Decision Questions
6. Individual line items on the P&L and Balance Sheet have people specifically accountable for each.
7. We have a rolling forecast looking forward 12 to 18 months updated at least monthly.
8. We have 3x to 10x the cash reserves compared to our competitors.
CASH DECISION #1
THE BUSINESS IS STRUCTURED AND OPERATED AS IF IT WERE BEING SOLD TOMORROW TO MAXIMIZE MARKET VALUE.
Running a “Ready to Sell” Business
• Effective Business Structure (legal and tax) to either keep or sell
• Operational excellence with documented processes that being followed
• Knowing and monitoring what drives market value for your business
• Regularly scrub internal financials for “deal adjustments”
3 Essential Business Value Data Points
• Economic Value – What is the business worth to you on a cash flow/ROE basis without selling
• Current Market Value similar businesses in size and industry are selling for
• Replacement Return needed if you sold at Market Value
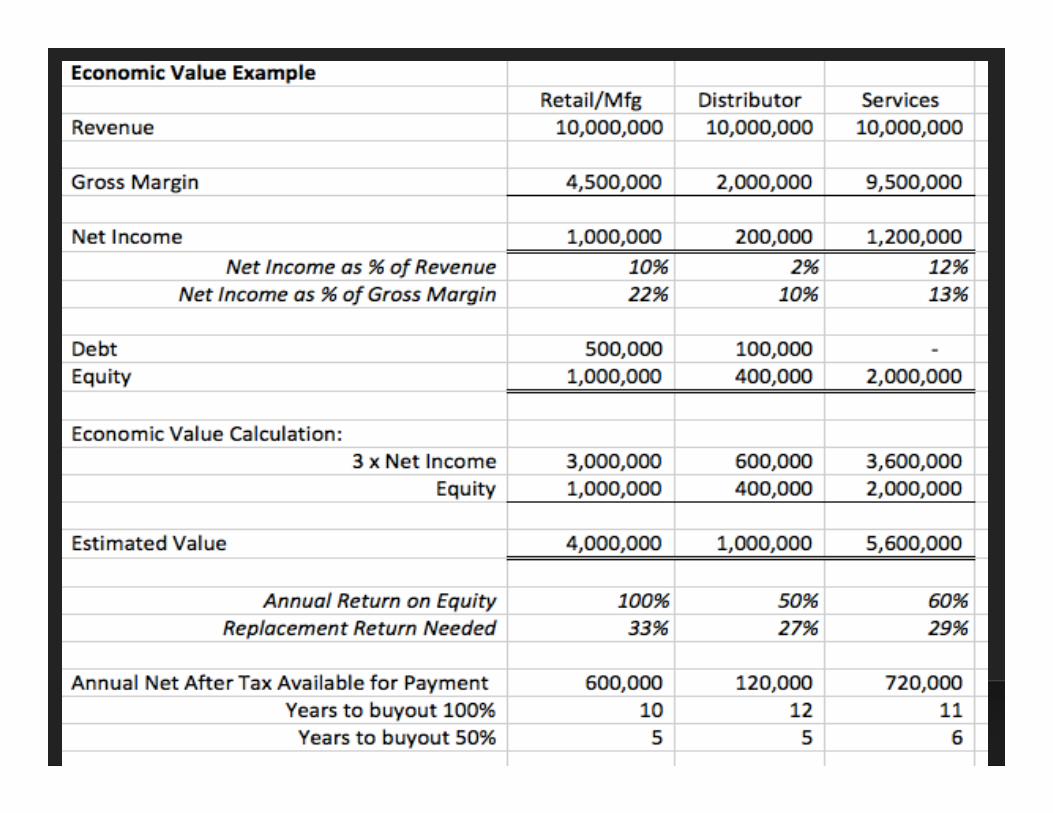
Economic Value
• See Chapter 9 of “Simple Numbers, Straight Talk, Big Profits” by Greg Crabtree
• Developed to manage shareholder or management buyout concepts based on after tax cash flow and a reasonable time frame for purchase
• 5 years to buyout a 50% owner, 10 to 14 years depending on interest rate for a 100% sale
• Formula – 3 times Net Income Plus Equity
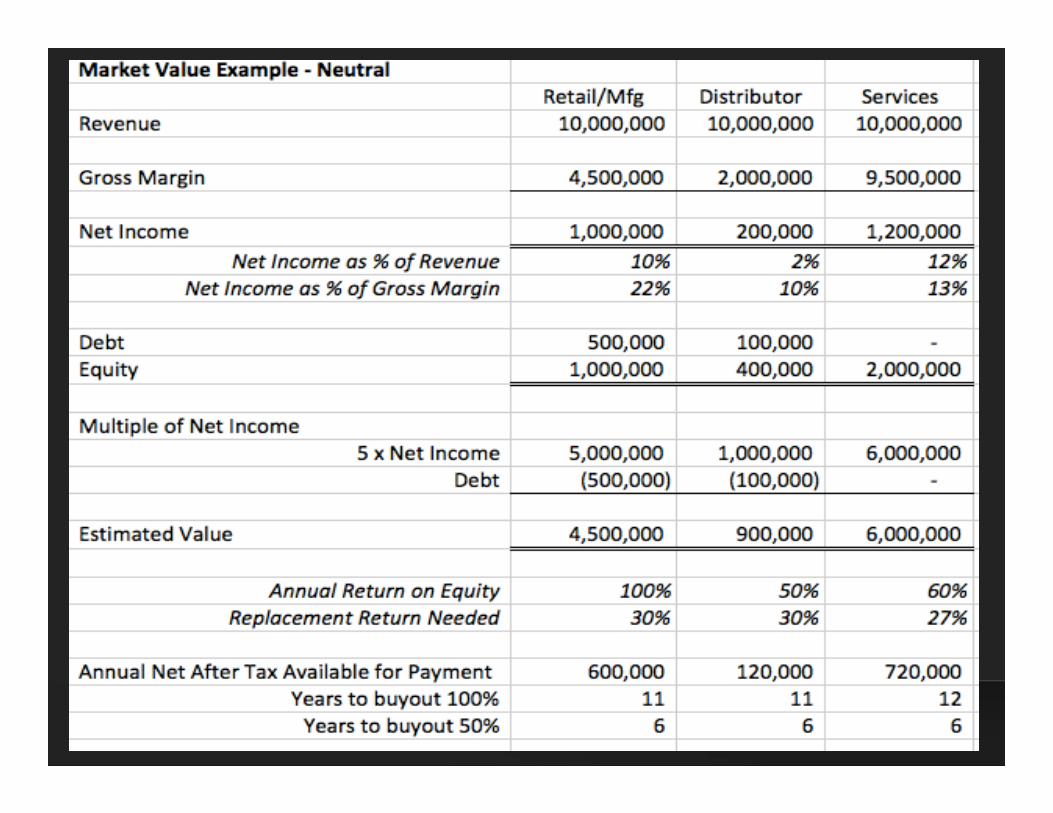
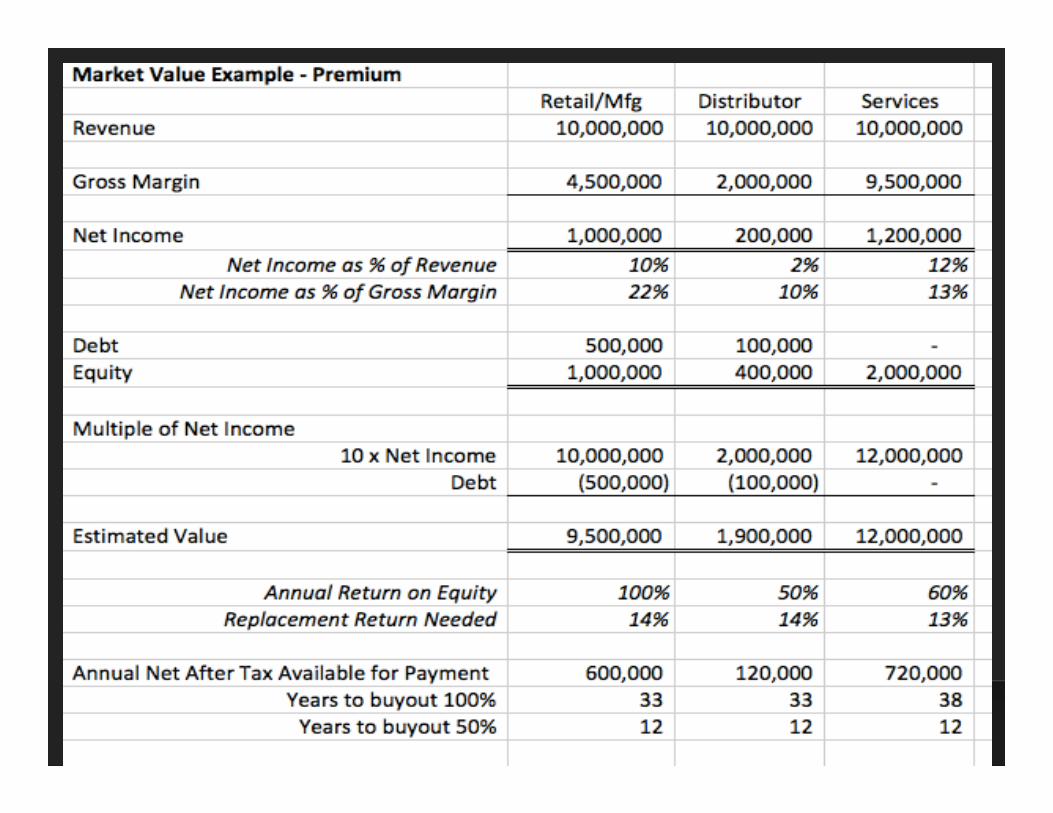
Current Market Value
• Can be a multiple of EBITDA (after deal adjustments) (5 is generally considered neutral)
• Can be a multiplier of Revenue, Gross Margin or Value per qualified customer
• If you are carrying debt, you generally have to payoff debt from proceeds or adjust price if they keep the debt
Replacement Return Needed
• Calculate “Net After Tax Proceeds” (use an average 25% tax rate for illustration)
• Divide Net Income (after deal adjustments) by the Net After Tax proceeds
• If replacement return needed is above 15%, reconsider whether selling is the best decision or are you at a point in life where you will not need to consume more than the annual earnings of the replacement investment
CASH DECISION #2
PROFITABILITY IS RUNNING AT 3X INDUSTRY AVERAGE.
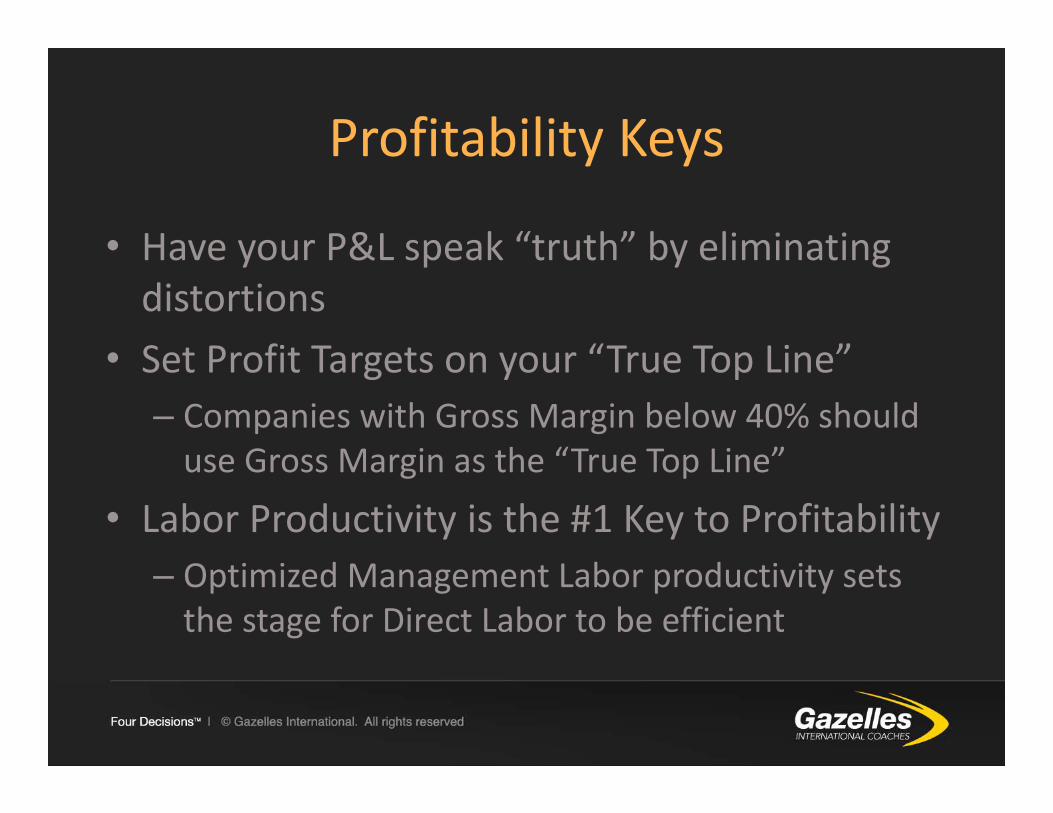
Profitability Keys
• Have your P&L speak “truth” by eliminating distortions
• Set Profit Targets on your “True Top Line”– Companies with Gross Margin below 40% should use Gross Margin as the “True Top Line”
• Labor Productivity is the #1 Key to Profitability– Optimized Management Labor productivity sets the stage for Direct Labor to be efficient
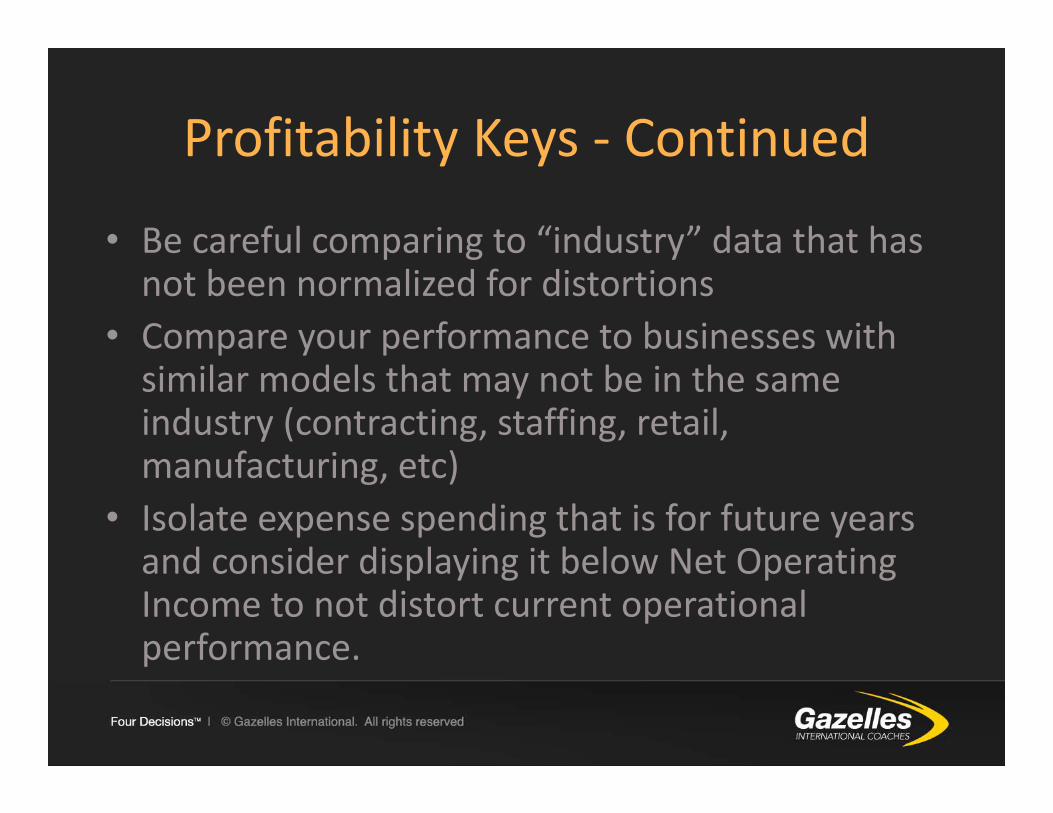
Profitability Keys ‐ Continued
• Be careful comparing to “industry” data that has not been normalized for distortions
• Compare your performance to businesses with similar models that may not be in the same industry (contracting, staffing, retail, manufacturing, etc)
• Isolate expense spending that is for future years and consider displaying it below Net Operating Income to not distort current operational performance.
CASH DECISION #3
CASH FLOW IS A HIGH PRIORITY I.E. WE’RE FOCUSED ON CONTINUALLY IMPROVING THE BUSINESS MODEL TO GENERATE MORE CASH AS THE BUSINESS SCALES.
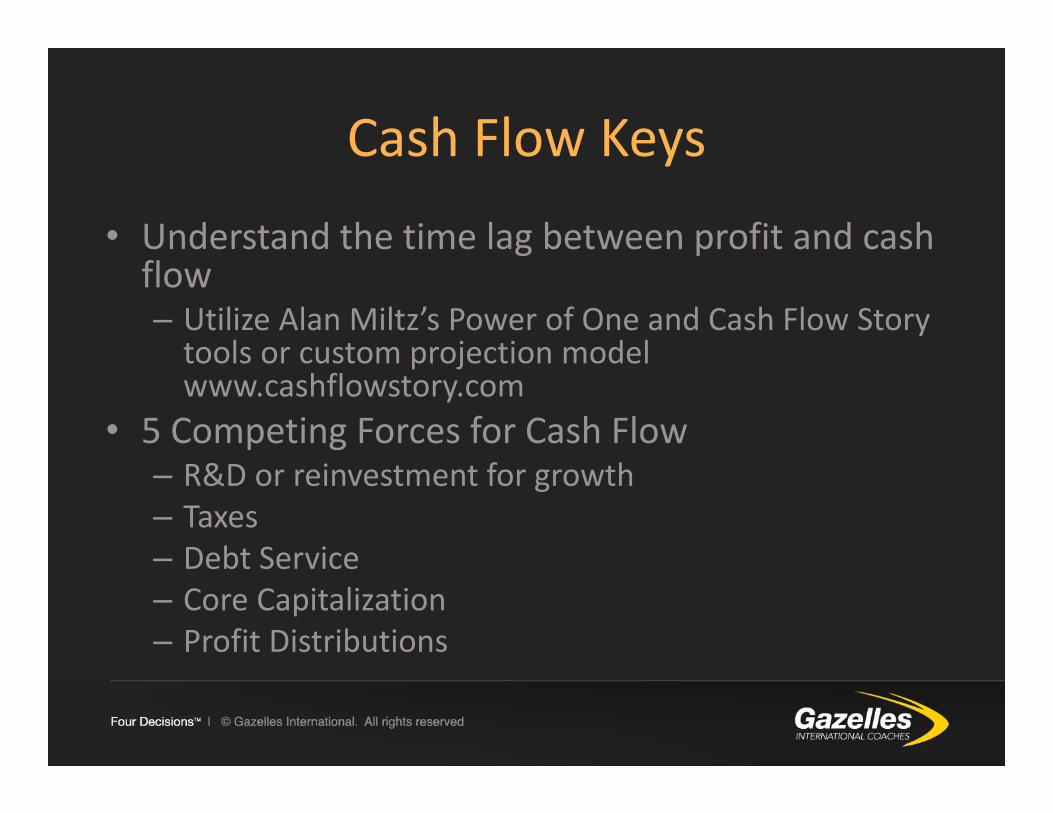
Cash Flow Keys
• Understand the time lag between profit and cash flow– Utilize Alan Miltz’s Power of One and Cash Flow Story tools or custom projection model www.cashflowstory.com
• 5 Competing Forces for Cash Flow– R&D or reinvestment for growth– Taxes– Debt Service– Core Capitalization– Profit Distributions
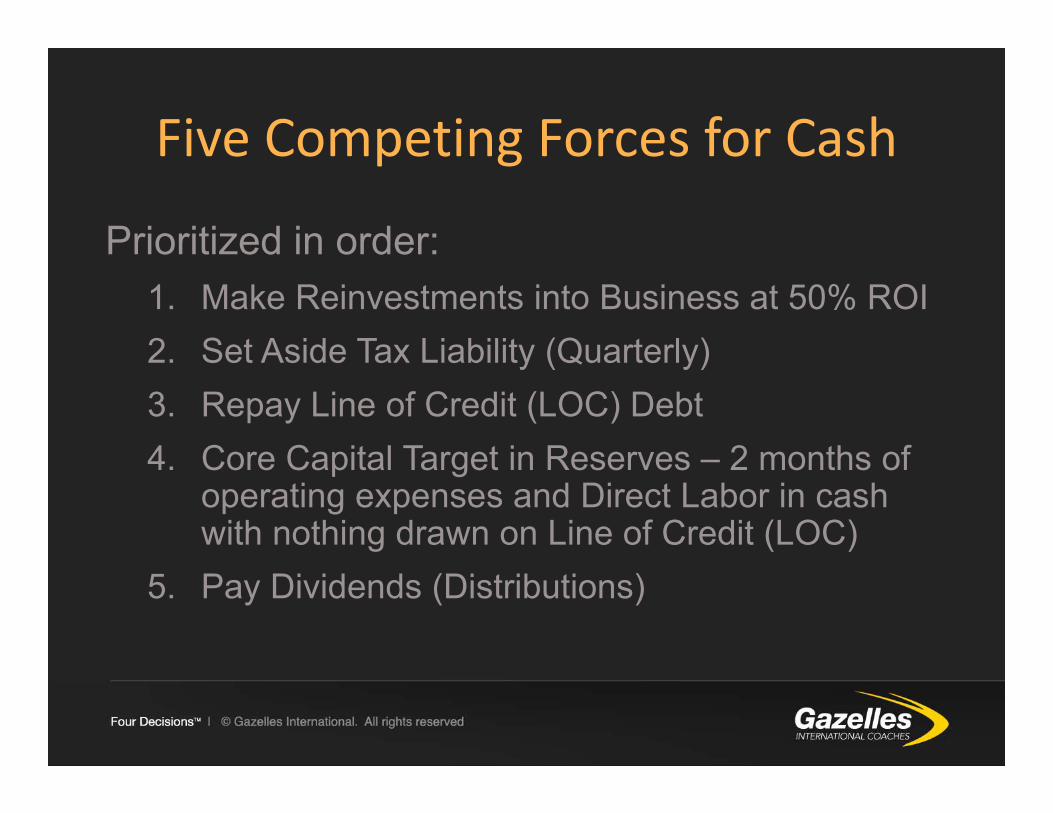
Five Competing Forces for Cash
Prioritized in order:1. Make Reinvestments into Business at 50% ROI2. Set Aside Tax Liability (Quarterly)3. Repay Line of Credit (LOC) Debt4. Core Capital Target in Reserves – 2 months of
operating expenses and Direct Labor in cash with nothing drawn on Line of Credit (LOC)
5. Pay Dividends (Distributions)
CASH DECISION #4
WE RECEIVE TIMELY AND ACCURATE REPORTING OF KEY DATA FOR OUR DAILY, WEEKLY, MONTHLY, AND QUARTERLY MEETING RHYTHMS.
Reporting Rhythms
• Break free from the Calendar!– Embrace the weekly accounting rhythm– Adopt Rolling 12 data as the performance measurement Gold Standard
– Good data fast is better than perfect data late– “Accounting” does not have to be done by “Accountants”, imbed accounting into operational processes where the greatest knowledge of the transaction is closest to the transaction
Recommended Reports
• Daily– Cash and Line of Credit Balances
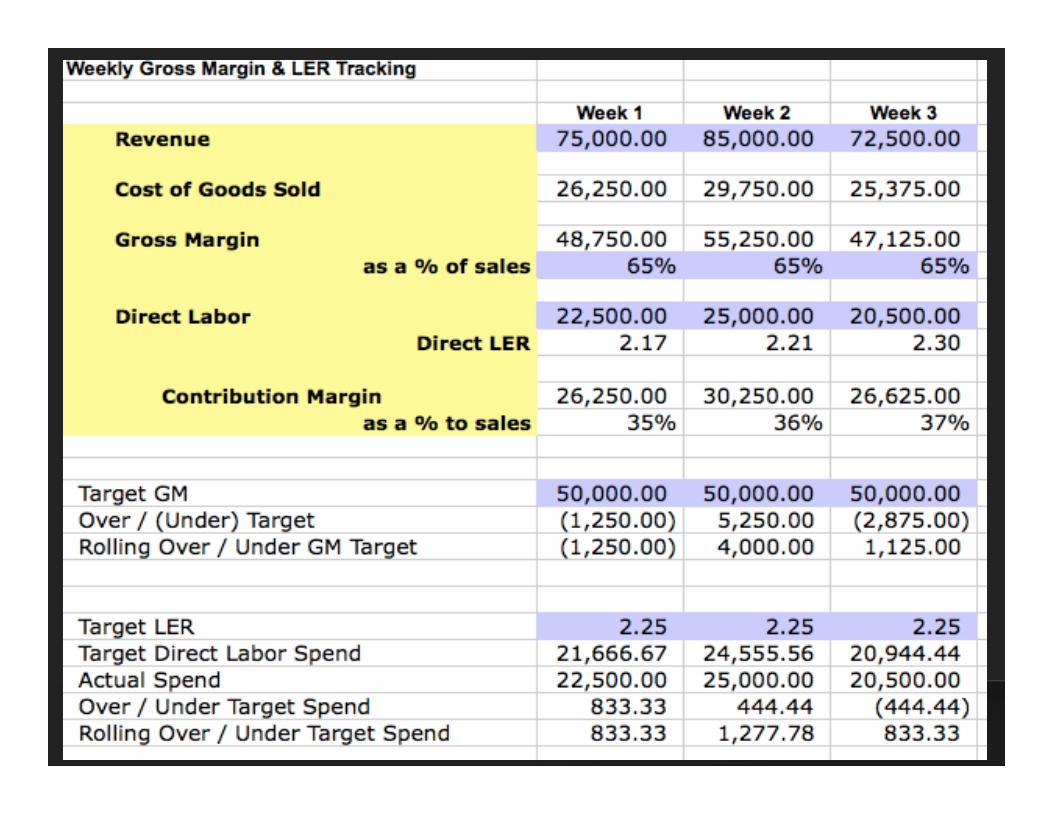
• Weekly– 2 Week Cash Flow Forecast– Revenue, Gross Margin, Direct Labor & Contribution Margin (Report shows, week, trailing 4 week, trailing 13 week and trailing 52 week data) along with any other key activity metrics
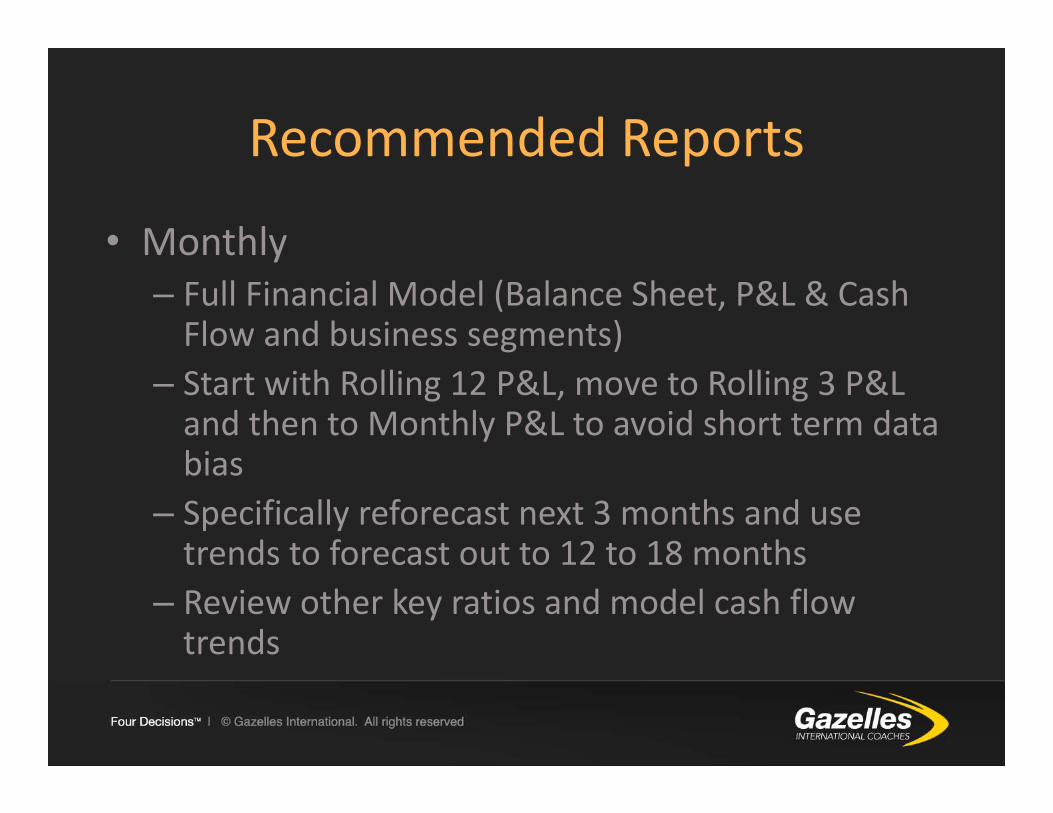
Recommended Reports
• Monthly– Full Financial Model (Balance Sheet, P&L & Cash Flow and business segments)
– Start with Rolling 12 P&L, move to Rolling 3 P&L and then to Monthly P&L to avoid short term data bias
– Specifically reforecast next 3 months and use trends to forecast out to 12 to 18 months
– Review other key ratios and model cash flow trends
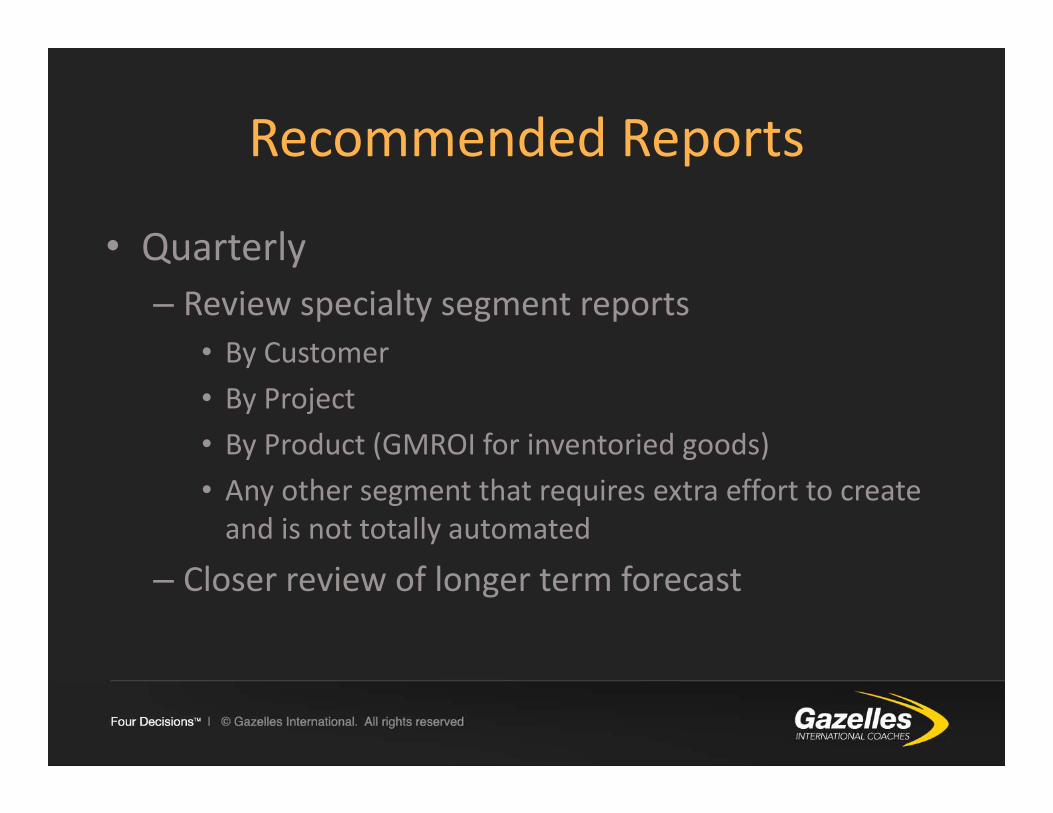
Recommended Reports
• Quarterly– Review specialty segment reports
• By Customer• By Project• By Product (GMROI for inventoried goods)• Any other segment that requires extra effort to create and is not totally automated
– Closer review of longer term forecast
CASH DECISION #5
WE KNOW PROFITABILITY, GROSS MARGIN, AND REVENUE BY CUSTOMER, PROJECT, LOCATION, LINE OF BUSINESS, TEAM AND/OR EMPLOYEE WHERE APPLICABLE
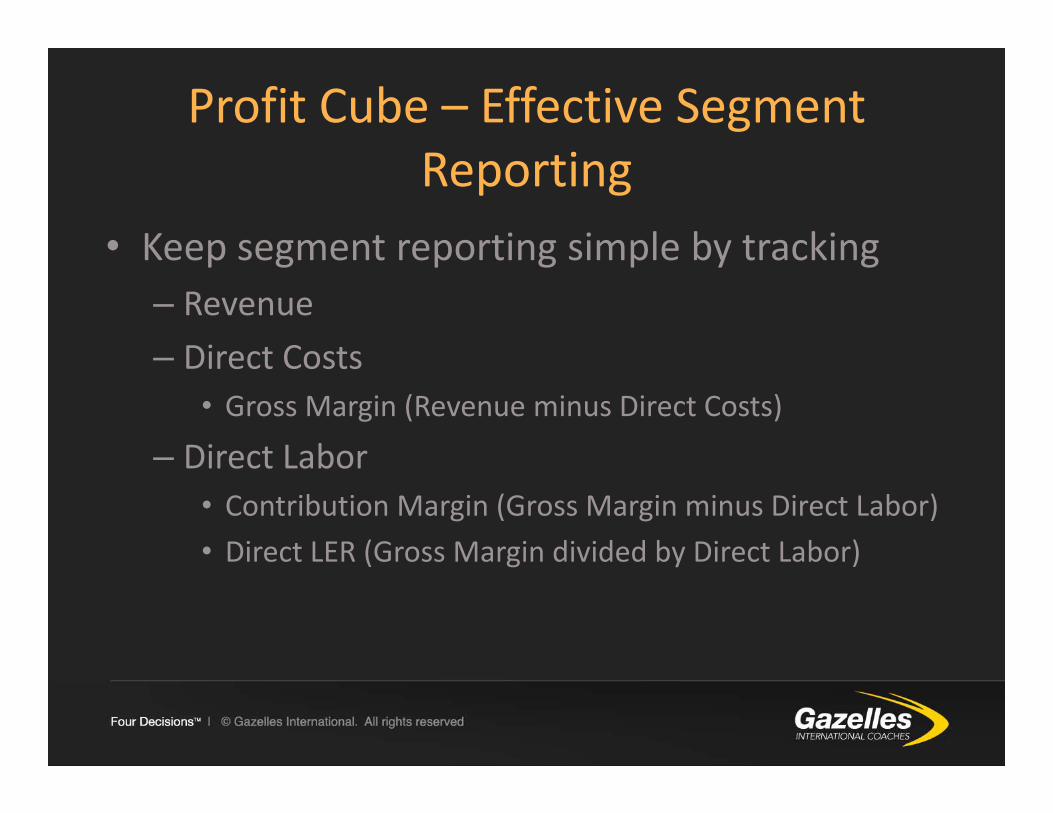
Profit Cube – Effective Segment Reporting
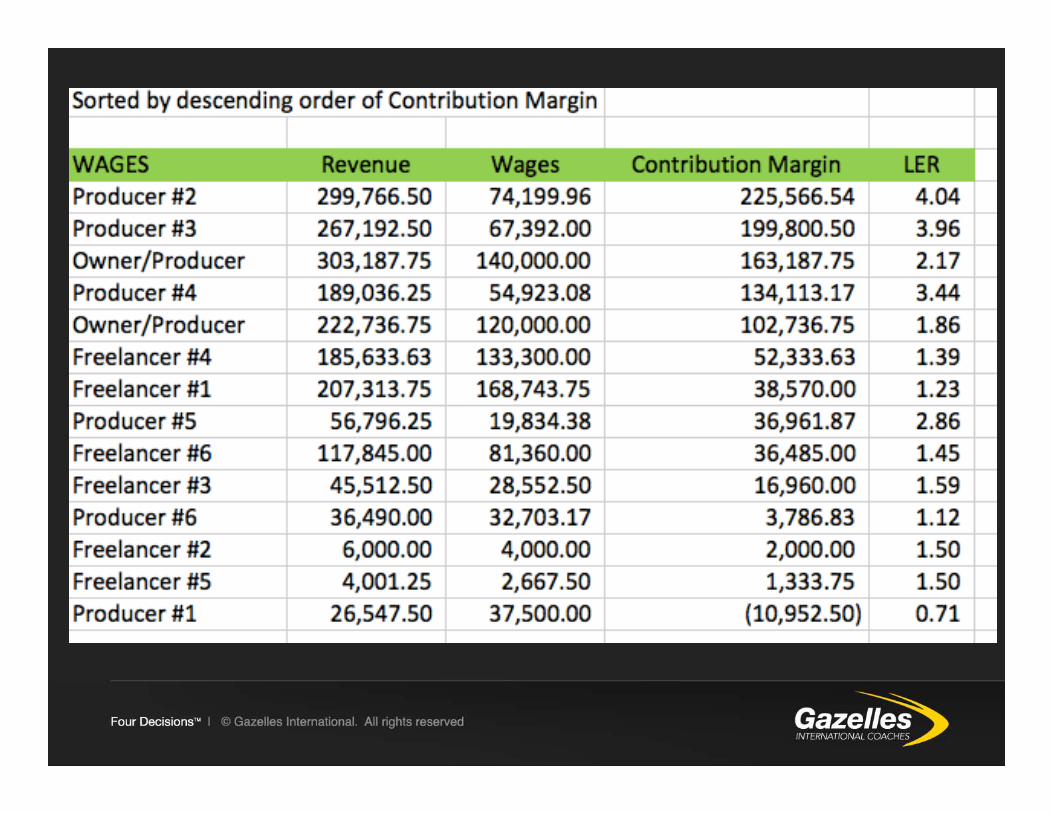
• Keep segment reporting simple by tracking– Revenue– Direct Costs
• Gross Margin (Revenue minus Direct Costs)
– Direct Labor• Contribution Margin (Gross Margin minus Direct Labor)• Direct LER (Gross Margin divided by Direct Labor)
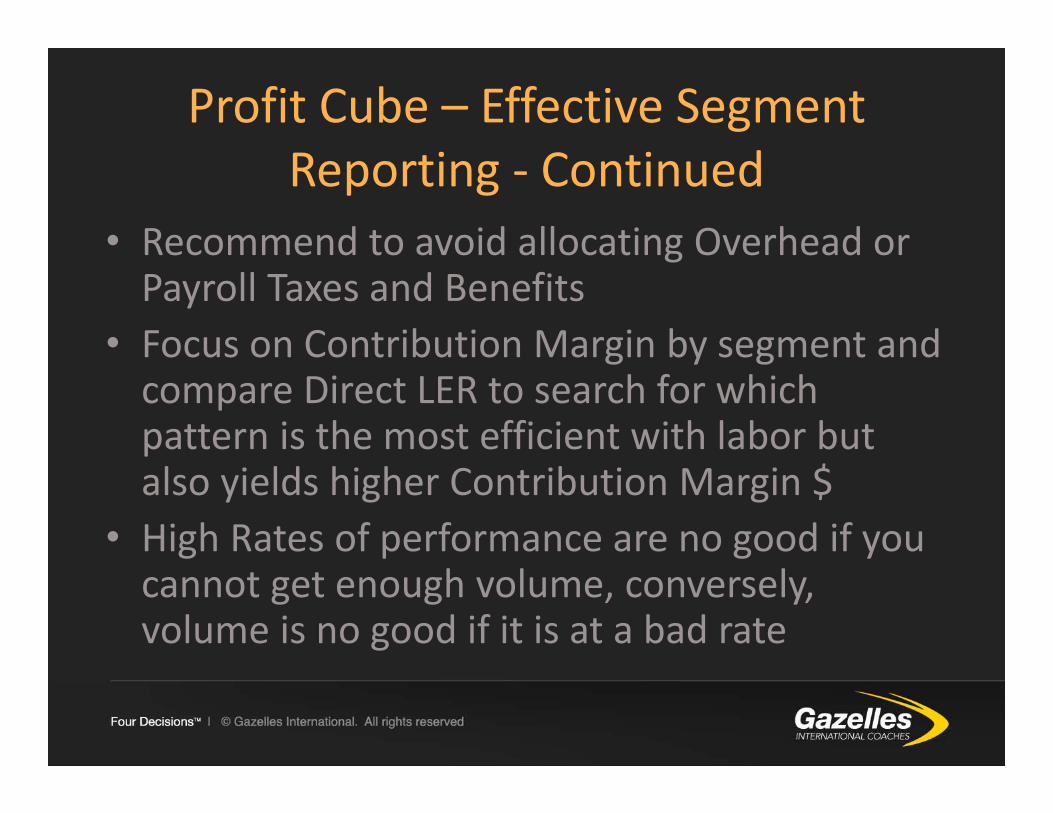
Profit Cube – Effective Segment Reporting ‐ Continued
• Recommend to avoid allocating Overhead or Payroll Taxes and Benefits
• Focus on Contribution Margin by segment and compare Direct LER to search for which pattern is the most efficient with labor but also yields higher Contribution Margin $
• High Rates of performance are no good if you cannot get enough volume, conversely, volume is no good if it is at a bad rate
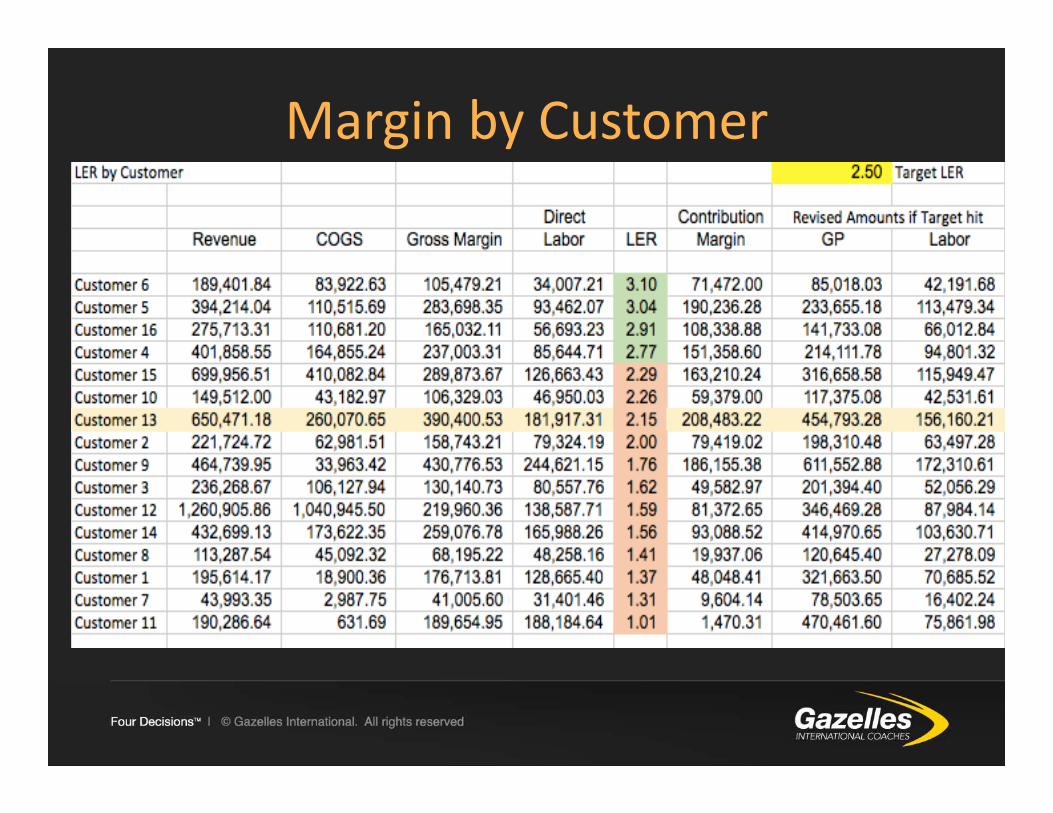
Margin by Customer
CASH DECISION #6
INDIVIDUAL LINE ITEMS ON THE P&L AND BALANCE SHEET HAVE PEOPLE SPECIFICALLY ACCOUNTABLE FOR EACH.
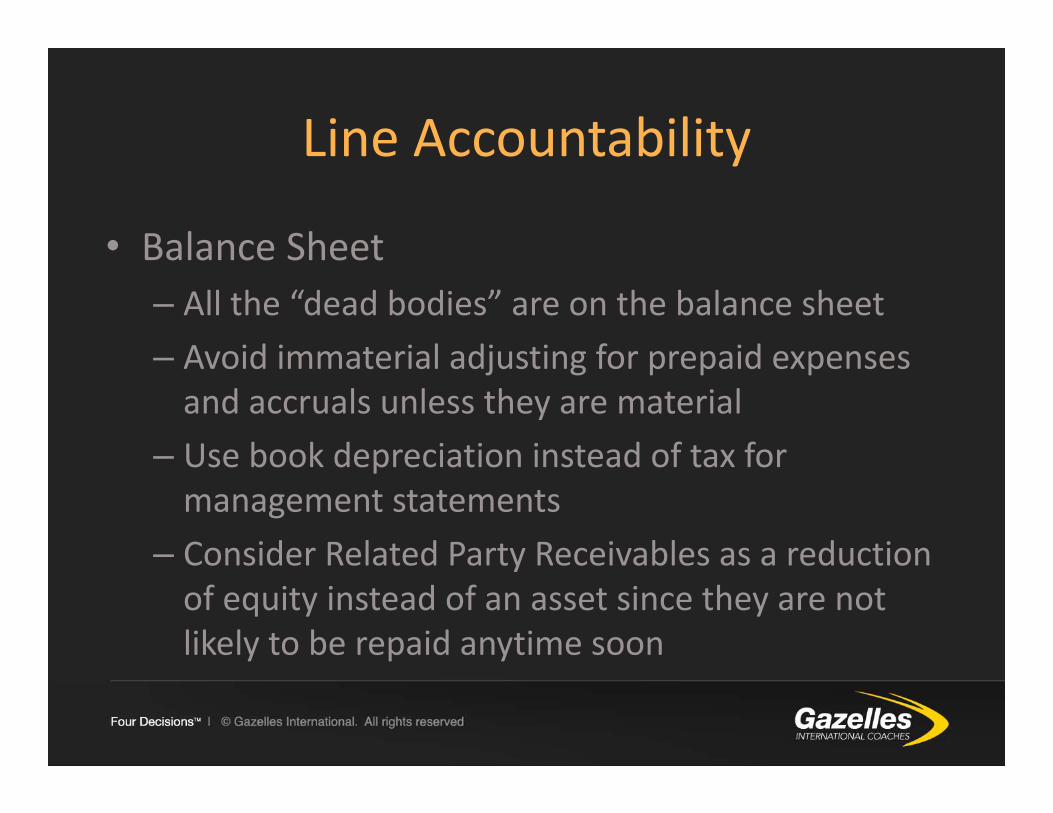
Line Accountability
• Balance Sheet– All the “dead bodies” are on the balance sheet– Avoid immaterial adjusting for prepaid expenses and accruals unless they are material
– Use book depreciation instead of tax for management statements
– Consider Related Party Receivables as a reduction of equity instead of an asset since they are not likely to be repaid anytime soon
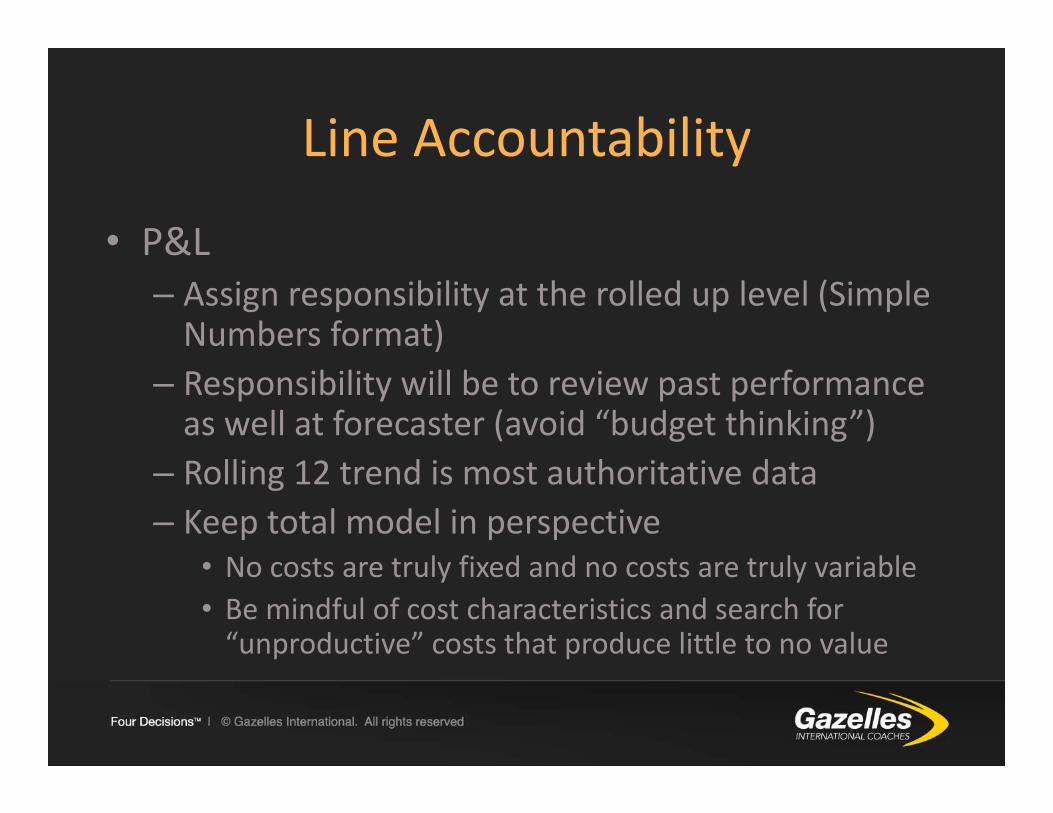
Line Accountability
• P&L– Assign responsibility at the rolled up level (Simple Numbers format)
– Responsibility will be to review past performance as well at forecaster (avoid “budget thinking”)
– Rolling 12 trend is most authoritative data– Keep total model in perspective
• No costs are truly fixed and no costs are truly variable• Be mindful of cost characteristics and search for “unproductive” costs that produce little to no value
CASH DECISION #7
WE HAVE A ROLLING FORECAST LOOKING FORWARD 12 TO 18 MONTHS UPDATED AT LEAST MONTHLY.
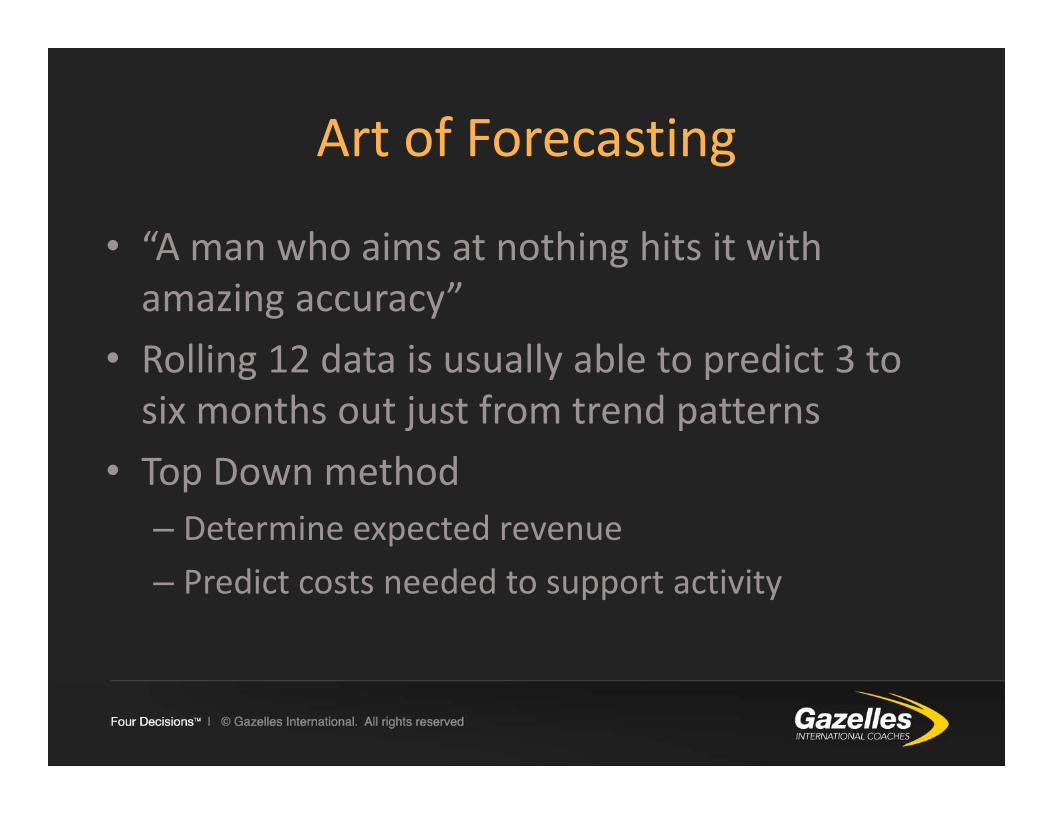
Art of Forecasting
• “A man who aims at nothing hits it with amazing accuracy”
• Rolling 12 data is usually able to predict 3 to six months out just from trend patterns
• Top Down method– Determine expected revenue– Predict costs needed to support activity
Art of Forecasting
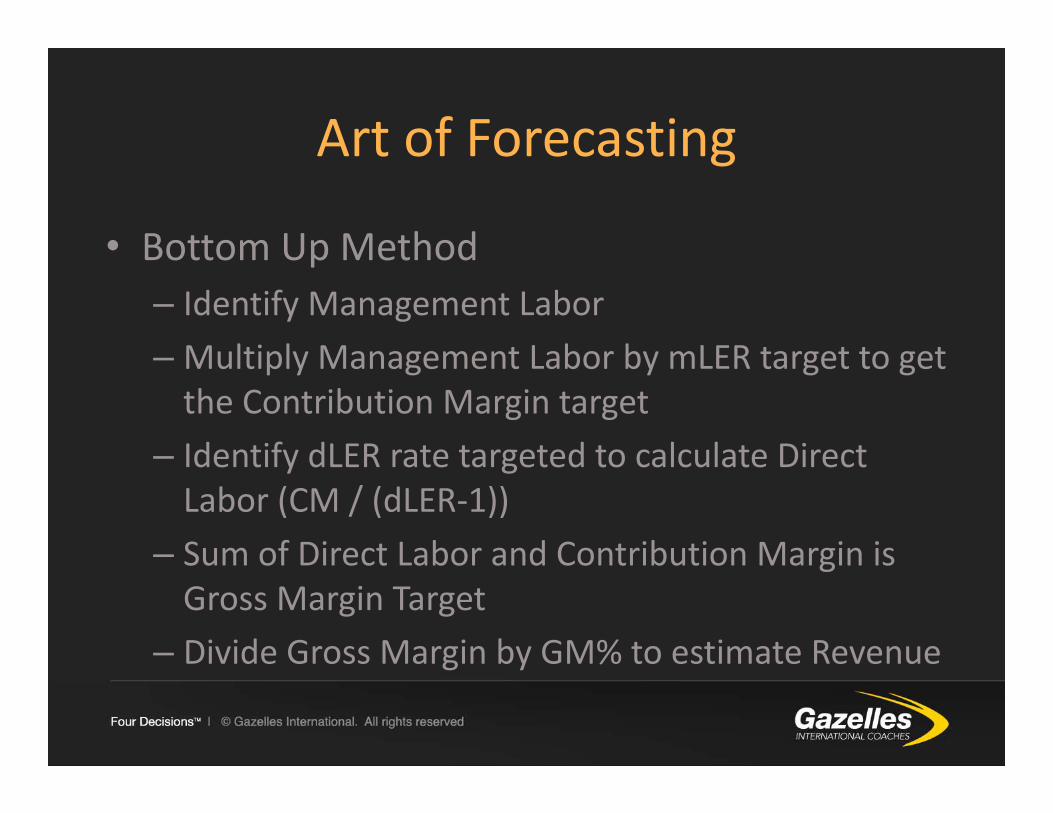
• Bottom Up Method– Identify Management Labor– Multiply Management Labor by mLER target to get the Contribution Margin target
– Identify dLER rate targeted to calculate Direct Labor (CM / (dLER‐1))
– Sum of Direct Labor and Contribution Margin is Gross Margin Target
– Divide Gross Margin by GM% to estimate Revenue
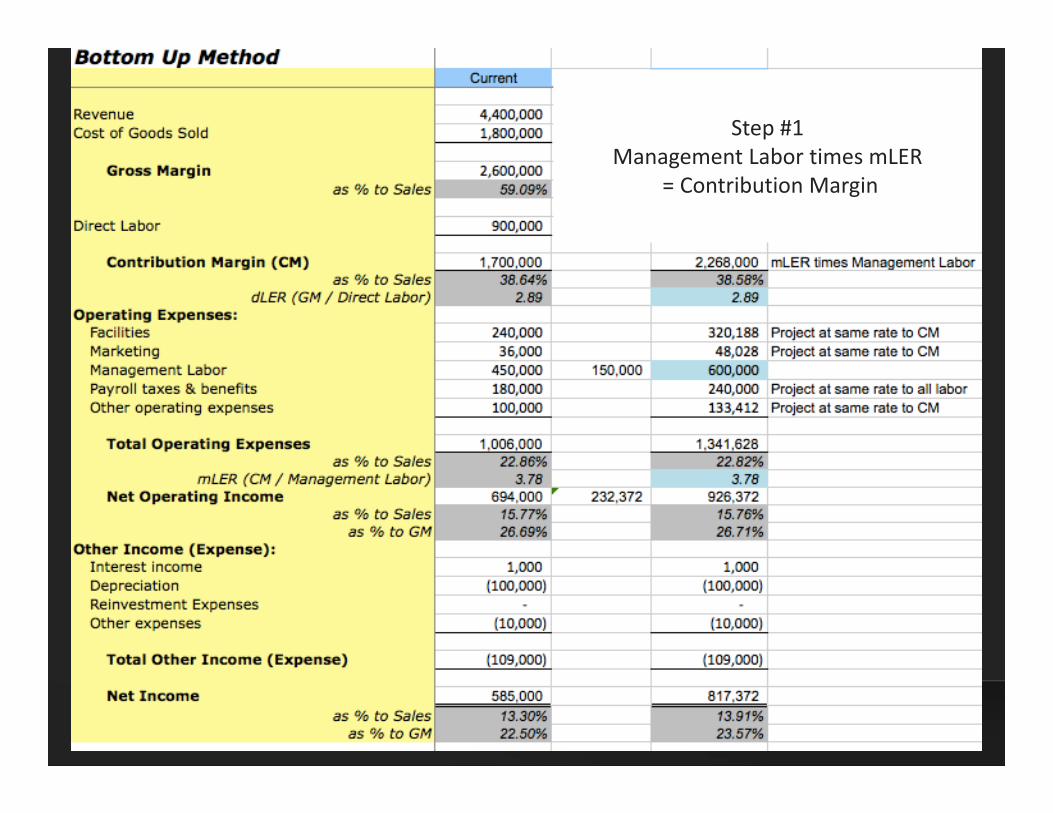
Step #1Management Labor times mLER
= Contribution Margin
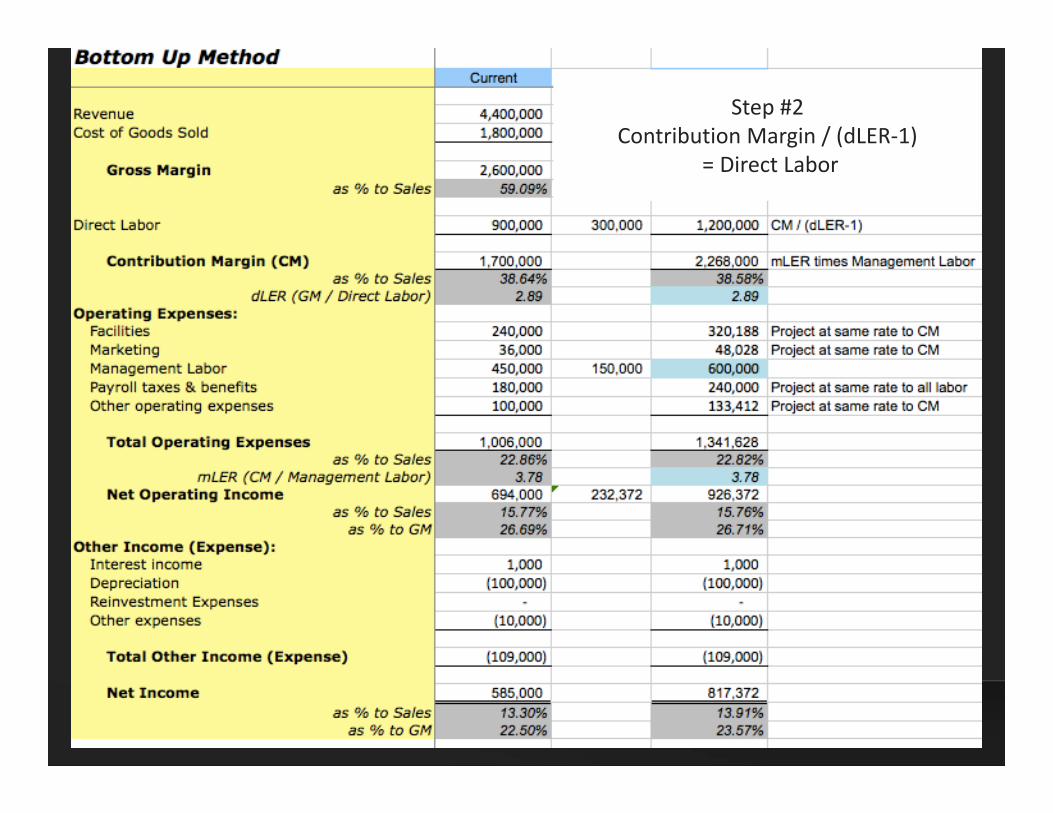
Step #2Contribution Margin / (dLER‐1)
= Direct Labor
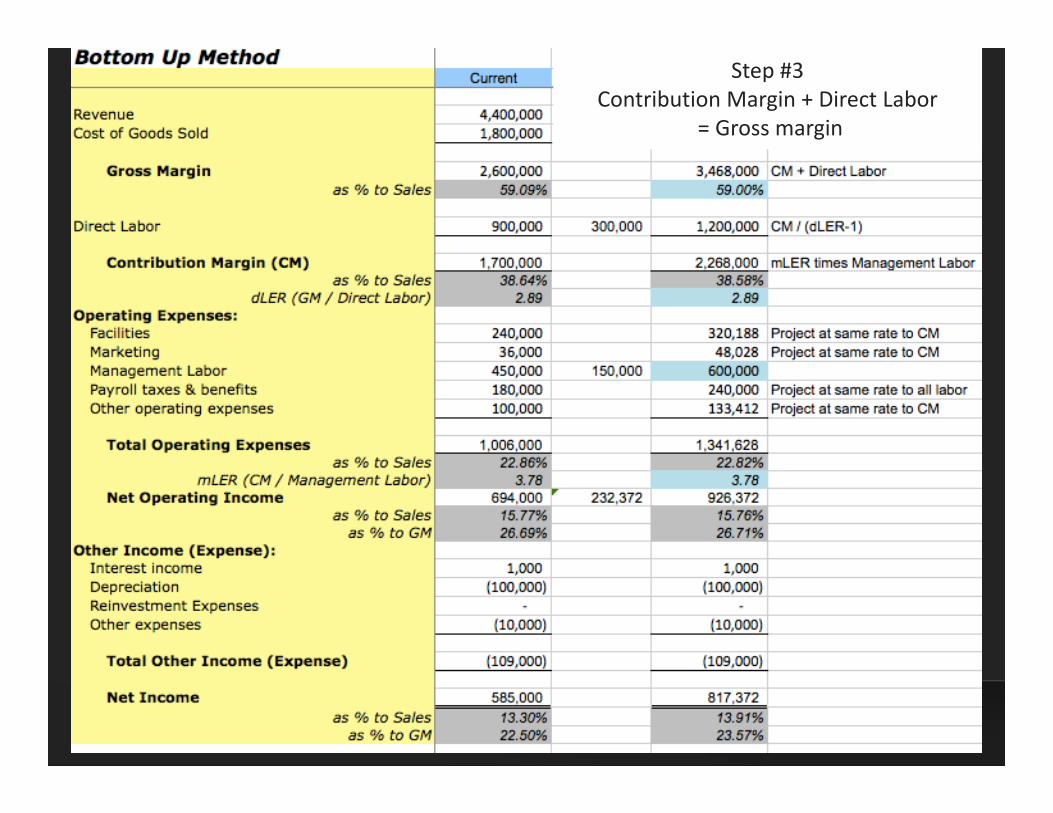
Step #3Contribution Margin + Direct Labor
= Gross margin
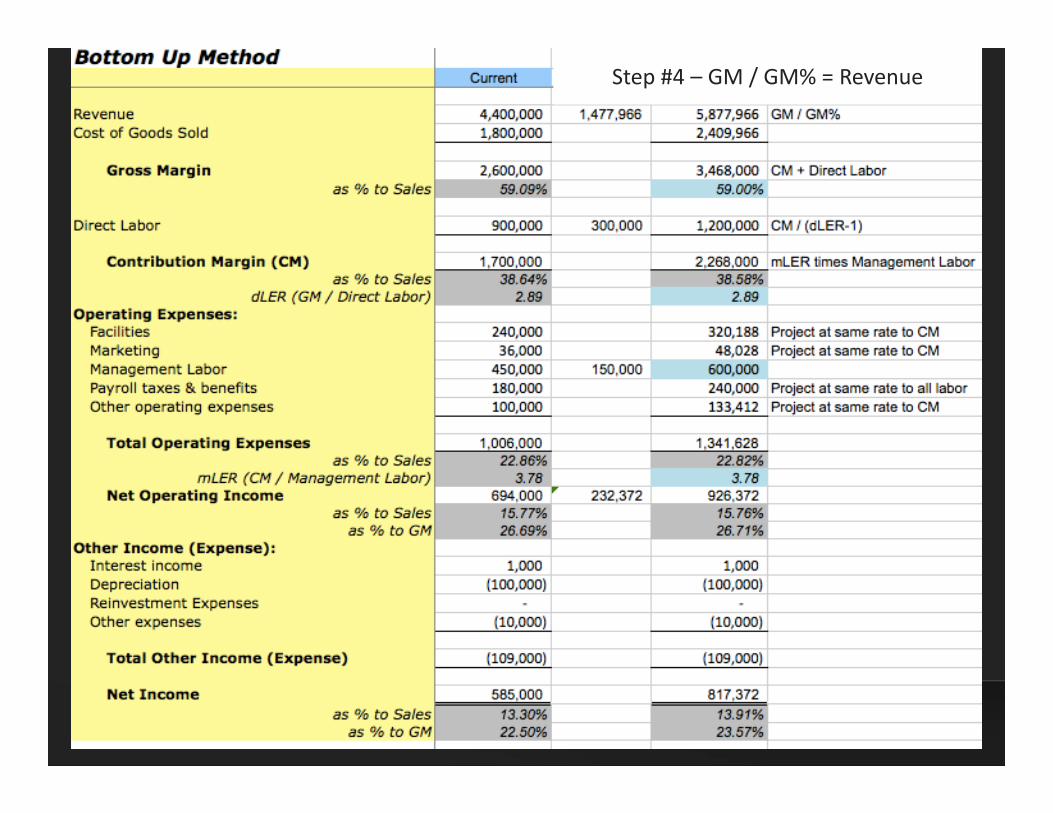
Step #4 – GM / GM% = Revenue
CASH DECISION #8
WE HAVE 3X TO 10X THE CASH RESERVES COMPARED TO OUR COMPETITORS.
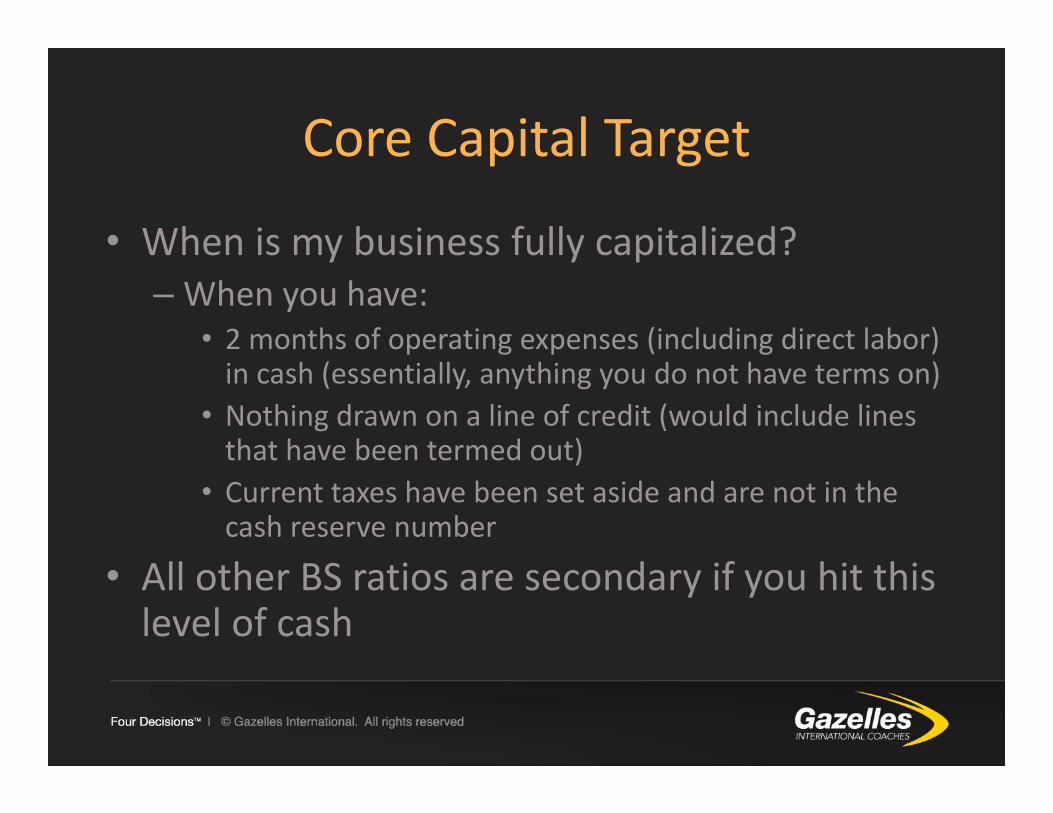
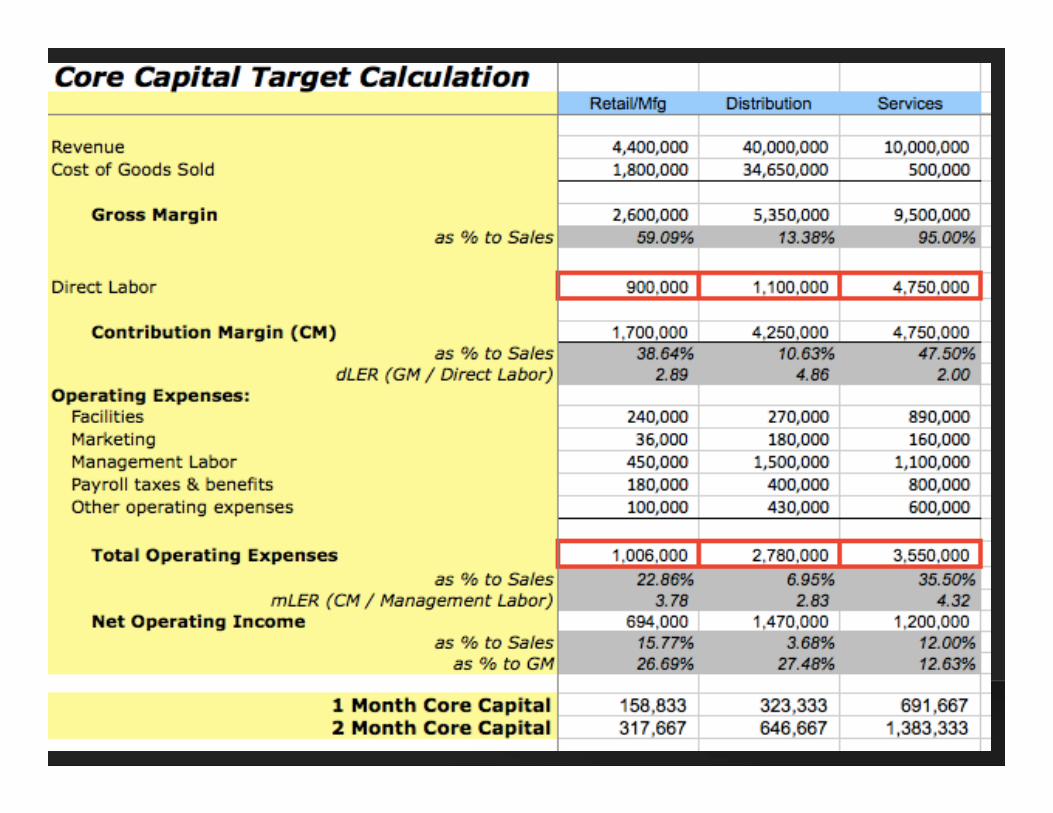
Core Capital Target
• When is my business fully capitalized?– When you have:
• 2 months of operating expenses (including direct labor) in cash (essentially, anything you do not have terms on)
• Nothing drawn on a line of credit (would include lines that have been termed out)
• Current taxes have been set aside and are not in the cash reserve number
• All other BS ratios are secondary if you hit this level of cash
Core Capital Target & ROE
• If you achieve the 2 months cash and have 10% net profit
• You should have a minimum of a 50% Return on equity year over year without selling the business. Most businesses have 75% to 100% that do not require heavy capitalization
• You can achieve a higher ROE with debt, but you are taking added risk to do it