Embed Size (px)
Citation preview

Scaling Up Handwashing and Rural Sanitation: Findings from a Baseline Survey in Tanzania
Bertha Briceño and Ahmad Yusuf
September 2012
The Water and Sanitation Program is a multi-donor partnership administered by the World Bank to support poor people in obtaining affordable, safe, and sustainable access to water and sanitation services.
Global Scaling Up Rural Sanitation
WaTer and SaniTaTion Program: TecHnical PaPeR

WSP is a multi-donor partnership created in 1978 and administered by the World Bank to support poor people in obtaining affordable, safe, and sustainable access to water and sanitation services. WSP’s donors include Australia, Austria, Canada, Denmark, Finland, France, the Bill & Melinda Gates Foundation, Ireland, Luxembourg, Netherlands, Norway, Sweden, Switzerland, United Kingdom, United States, and the World Bank.
WSP reports are published to communicate the results of WSP’s work to the development community. Some sources cited might be informal documents that are not readily available.
The findings, interpretations, and conclusions expressed herein are entirely those of the author and should not be attributed to the World Bank or its affiliated organizations, or to members of the Board of Executive Directors of the World Bank or the governments they represent. The World Bank does not guarantee the accuracy of the data included in this work. The map was produced by the Map Design Unit of the World Bank. The boundaries, colors, denominations, and other information shown on any map in this work do not imply any judgment on the part of the World Bank Group concerning the legal status of any territory or the endorsement or acceptance of such boundaries.
© 2012 Water and Sanitation Program
Bertha Briceño and Ahmad Yusuf, Water and Sanitation Program
Today, 2.5 billion people live without access to improved sanitation. Of these,
75 percent live in rural communities. To address this challenge, WSP is working
with governments and local private sectors to build capacity and strengthen
performance monitoring, policy, financing, and other components needed to
develop and institutionalize large scale, sustainable rural sanitation programs.
With a focus on building a rigorous evidence base to support replication, WSP
combines Community-Led Total Sanitation, behavior change communication, and
sanitation marketing to generate sanitation demand and strengthen the supply of
sanitation products and services, leading to improved health for people in rural
areas. For more information, please visit www.wsp.org/scalingupsanitation.
This technical paper is one in a series of knowledge products designed to showcase
project findings, assessments, and lessons learned through WSP’s Scaling Up Rural
Sanitation initiatives. This paper is conceived as a work in progress to encourage the
exchange of ideas about development issues. For more information please email
Bertha Briceño and Ahmad Yusuf at [email protected] or visit www.wsp.org.

Scaling Up Handwashing and Rural Sanitation: Findings from a Baseline Survey in Tanzania
Bertha Briceño and Ahmad Yusuf
September 2012
Global Scaling Up Rural Sanitation
8591-FM.pdf i8591-FM.pdf i 9/7/12 4:15 PM9/7/12 4:15 PM

ii Scaling Up Rural Sanitation
The Tanzania Impact Evaluation Team oversees the in-country design and field activities; investigators include Sebastian Martinez, Bertha Briceño, Aidan Co-ville, and (in its early stages) Alicia Salvatore. The survey analyzed in this report was intended to serve as a baseline to the impact evaluation of the program but unanticipated problems with reliability of data resulted in the cancelation of field work in five out of the 10 districts originally planned and the impossibility of using the data to validate the randomized design, as it was originally intended.
The project’s global impact evaluation task team is led by Bertha Briceño (in its early stages, it was led by Jack Molyneaux), together with Alexandra Orsola-Vidal and Claire Chase. Professor Paul Gertler has provided guidance and advice through-out the study. Advisors also include Sebastian Galiani, John M. Colford, Benjamin Arnold, and Pavani Ram.
The authors are grateful to Jason A. Cardosi, Patrick Mwakilama, Kaposo Mwambuli, and Yolande Coombes, the country task team for project imple-mentation in Tanzania; to Wambui Gichuri, former Regional Team Leader for the WSP-Africa region; and to Eduardo Perez, overall task team leader. Generous financial support was provided by the Bill and Melinda Gates Foundation.
Acknowledgments
8591-FM.pdf ii8591-FM.pdf ii 9/7/12 4:15 PM9/7/12 4:15 PM

www.wsp.org iii
average self-reported monthly income by the household head was 114,769 TZS (approximately US$73.00).2 Al-though self-reported income is not always a reliable mea-sure and must be interpreted with caution, the income of the household head can serve as a proxy for total household income.
Water SourcesWater is typically collected by women (94.2% of house-holds in our study). On average, only about half of house-holds (49.7%) had access to an improved water source, which generally was not in their dwellings or on their plots. Drinking water typically came from three main sources: piped water from public tap (24.2%), an unprotected dug well (27.1%), and surface water (19.2%). On average, 31.5% of these water sources were located in the house-hold’s own yard or plot, 13.4% within the dwelling, and the rest (55.1%) were located elsewhere, suggesting that most households are investing time in collecting water.
The majority of households stored drinking water at home, but only 24.4% reportedly treated the water before drink-ing. Of these, less than half (43%) mentioned boiling water before drinking as a treatment. This suggests that improv-ing water safety practices in these districts could help pre-vent waterborne diseases.
Handwashing Behavior and SanitationHandwashing behavior is known to be difficult to assess. In this study, we relied on two sources: self-reported hand-washing at critical times and, as a proxy measure, spot-check observations of whether the household had a designated place for handwashing with both soap and water. An ad-ditional measure assessed the cleanliness of the caretaker’s hands through direct observation—again to serve as a proxy indicator of handwashing with soap behavior.
Although most caregivers (more than 78%) reported hav-ing used soap to wash hands at least once in the previous 24 hours, when asked about the circumstances, only 33.7%
1 For more information on Global Scaling Up Rural Sanitation and Handwashing, visit www.wsp.org/scalingupsanitation.
Executive Summary
Since 2007, the Water and Sanitation Program (WSP) has provided technical assistance to local and national govern-ments implementing large rural sanitation and handwash-ing promotion programs in various countries.1 In Tanzania, handwashing with soap and sanitation programs were phased into 10 rural districts in the second half of 2009.
This report presents summary descriptive statistics for key demographic, socioeconomic, hygiene, health, and child development variables based on a survey of approximately 1,500 households in the Masasi, Musoma rural, Rufiji, Iringa rural, and Mpwapwa districts. It offers a glimpse at the general status of sanitation and hygiene practices in some of the program’s target areas before the beginning of implementation activities.
The household survey, conducted by Muhimbili University of Health and Allied Sciences (MUHAS), was carried at the end of 2008 and early in 2009. The original goal of the baseline survey was to validate the design of the impact evaluation of the program. However, unexpected problems with data reliability and the enumerators’ training resulted in data collection being cancelled in five of the 10 districts that were part of the evaluation.
The statistics presented have been positively validated against existing household surveys, including the 2010 Tan-zania Demographic and Health Survey (DHS).
Summary of FindingsCharacteristics of Targeted HouseholdsIn the targeted areas in rural Tanzania, the typical house-hold is headed by a male and comprises five members. Most houses are single detached dwellings with mud or brick walls and clay floors. Households typically use kerosene for lighting and wood for cooking, and about half of house-holds own a few animals and a bicycle.
The mean age of household members studied was 18.2, and 80% of household members had some schooling. The
2 Approximate conversion rate as of June 2012 was 1,500 Tanzanian shillings (TZS) to 1 US dollar (USD).
8591-FM.pdf iii8591-FM.pdf iii 9/7/12 4:15 PM9/7/12 4:15 PM

iv Scaling Up Rural Sanitation
Scaling Up Handwashing and Rural Sanitation: Findings from a Baseline Survey in Tanzania Executive Summary
mentioned handwashing at one or more critical juncture and only 21.2% mentioned handwashing after using the toilet.
In terms of sanitation, rural Tanzania mostly relies on basic latrines that do not separate humans from excreta and are described as “fixed-point open defecation.” The most com-mon type of toilet facility reported was a pit latrine, present in almost 89% of the studied households. Only 12.7% of households reported having a pit latrine with slab. Open defecation was reported in 9.2% of the households.
Child Care and Nutrition Because caregiver characteristics and child care quality can dramatically affect the health, nutritional status, and development of young children, the study collected in-formation on feeding practices, caregiving behavior, and caregiver well-being.
In the studied households, most children under the age of two played with household objects (85.9%) and, in more than half of the cases, an adult sang songs with the child. However, in the three days prior to the survey, less than 15% of caregivers reported reading (13.7%) or telling sto-ries (14.5%) to the child.
In terms of diet, almost 90% of children had been given plain water since the previous day and breast milk con-sumption, as expected, was very high (89%) for children
under two. Most children (72.1%) consumed homemade gruel and one-fifth of the children were given beverages such as tea or coffee (20.3%). With respect to the previ-ous day’s food, 70.3% of the children had received solid or semi-solid food an average of 2.41 times.
ConclusionThe survey revealed that there was limited baseline knowl-edge of the critical handwashing times among the target households prior to the program, indicating room to im-prove handwashing behavior. Likewise, the survey indi-cated limited access to improved water sources, a scarcity of pit latrines with slabs, and a non-negligible percent-age of open defecation practice in the studied households. Underlying challenges also included unsafe facilities for small children and poor practices related to disposal of child feces.
The data presented in this technical report provides a snap-shot of the conditions of the target population prior to the start of the sanitation and handwashing programs. An im-pact evaluation of the programs, which will rely exclusively on post-intervention data, will be carried out during 2012; a full report will be published in 2013. The study hopes to enable a close examination of the links between poor sanitation, handwashing behavior, and health, and provide evidence for future projects in rural Tanzania.
8591-FM.pdf iv8591-FM.pdf iv 9/7/12 4:15 PM9/7/12 4:15 PM

www.wsp.org v
Contents Executive Summary .................................................................. iii
Acronyms ................................................................................. vii
I. Introduction ............................................................................... 1
II. Characteristics of Targeted Households .................................. 3
III. Water Sources ........................................................................... 7
IV. Handwashing Behavior ............................................................. 9
V. Sanitation ................................................................................. 11
VI. Child Care Environment .......................................................... 15
VII. Child Health and Anthropometric Measures .......................... 18
VIII. Conclusion ............................................................................... 20
Figures 1: Map of Tanzania Showing 10 Project Districts .................. 1 2: Distribution of Sampled Population by Age Group and
Gender (Population Pyramid) ............................................. 4
Tables 1: Summary Statistics ............................................................ 3 2: Percent Distribution of the Basic
Socio-Demographic Characteristics .................................. 3 3: Percent Distribution of Households
Assets (% HHs) .................................................................. 5 4: Dwelling Characteristics and Materials
by Observation ................................................................... 5 5: Dwelling Energy Source ..................................................... 6 6: Water Source ..................................................................... 7 7: Drinking Water ................................................................... 8 8: Self-Reported Handwashing Behavior
with Soap by District .......................................................... 9 9: Household Main Sanitation Facility
Characteristics (% HHs) .................................................. 11 10: Household Main Sanitation Facility
Sharing and Safety (% HHs) ............................................ 12
8591-FM.pdf v8591-FM.pdf v 9/10/12 10:44 AM9/10/12 10:44 AM

11: Other Characteristics of Households’ Sanitary Condition (% HHs) ............................................. 13
12: Child Breastfeeding (Children < 2) ................................... 15 13: Infant/Young Child Feeding (Children < 2) ....................... 16 14: Infant/Young Child Learning
Environment (Children < 2) .............................................. 17 15: Anemia Prevalence (% of Children < 2) ........................... 18 16: Nutritional Status of Children < 2..................................... 19 17: Estimates of Z-Scores (in SD)
from Selected Datasets ................................................... 19
Scaling Up Handwashing and Rural Sanitation: Findings from a Baseline Survey in Tanzania Contents
vi Scaling Up Rural Sanitation
8591-FM.pdf vi8591-FM.pdf vi 9/7/12 4:15 PM9/7/12 4:15 PM

ALRI(s) Acute Lower Respiratory Infection(s)ARI(s) Acute Respiratory Infection(s)CLTS Community-Led Total SanitationDHS Demographic and Health SurveyHH HouseholdMUHAS Muhimbili University of Health and Allied SciencesSD(s) Standard Deviation(s)TZS Tanzanian ShillingWHO World Health OrganizationWSP Water and Sanitation Program
Abbreviations and Acronyms
www.wsp.org vii
8591-FM.pdf vii8591-FM.pdf vii 9/7/12 4:15 PM9/7/12 4:15 PM

8591-FM.pdf viii8591-FM.pdf viii 9/7/12 4:15 PM9/7/12 4:15 PM

www.wsp.org 1
Since 2007, the Water and Sanitation Program (WSP) has provided technical assistance to local and national govern-ments implementing large rural sanitation and handwash-ing promotion programs in various countries, under the umbrella of two related projects, Global Scaling Up Hand-washing and Global Scaling Up Rural Sanitation.3 The goal is to contribute to addressing the poor hygiene and sanita-tion conditions of large rural populations in the developing world. In Tanzania, the handwashing with soap and rural sanitation programs were phased into 10 rural districts in the second half of 2009.
Handwashing with soap at critical times (such as after con-tact with feces and before handling food) has been shown to substantially reduce the risk of diarrhea and acute re-spiratory infections (ARIs). The handwashing project aims to test whether handwashing with soap behavior can be generated and sustained among the poor and vulnerable using innovative pro-motional approaches. In a similar fashion, scaling-up rural sanitation focuses on learning how to com-bine the approaches of commu-nity-led total sanitation (CLTS), behavior change communications, and social marketing of sanitation to generate sanitation demand and strengthen the supply of sanitation products and services at scale, lead-ing to improved health for people in rural areas.
One of the global project’s objec-tives is to learn about and docu-ment the long-term health and welfare impacts of the country pro-gram’s interventions. This technical
IntroductionI.paper presents findings from the survey carried to assess the pre-program conditions of sanitation and handwashing in five out of the 10 districts where the program is being implemented in Tanzania. The household survey was com-missioned to the MUHAS. It was carried out between the end of 2008 and early 2009 in approximately 1,500 house-holds in the districts of Masasi, Musoma rural, Rufiji, Ir-inga rural, and Mpwapwa. The survey intended to serve as a baseline to the implementation of the program, but unanticipated problems with reliability of data and enu-merators training resulted in the cancelation of data collec-tion in five out of the 10 districts originally planned and the impossibility of using the data in longitudinal analysis as baseline to validate the evaluation randomized design, as it was originally intended.
3 For more information on Global Scaling Up Rural Sanitation and Handwashing, visit www.wsp.org/scalingupsanitation.
LakeVictoria
LakeTanganyika
LakeMalawi
INDIANOCEAN
DEM. REP.OF
CONGO
UGANDA
RWANDA
BURUNDI
KENYA
ZAMBIAMALAWI
MOZAMBIQUE
DODOMA
Dar es Salaam
RUFIJI
KITETO
IRINGA
KONDOA
MASASI
SUMBAWANGA
IGUNGA
KARAGWE
MPWAPWA
MUSOMA
RUFIJI
KITETO
IRINGA
KONDOA
MASASI
SUMBAWANGA
IGUNGA
KARAGWE
MPWAPWA
MUSOMA
0 50 100
KILOMETERS
PROJECT DISTRICTS*
NATIONAL CAPITAL
INTERNATIONALBOUNDARIES
IBR
D 38777
AU
GU
ST 2011
*Based on District boundaries of 2002.
LEGEND/KEY
FIGURE 1: MAP OF TANZANIA SHOWING 10 PROJECT DISTRICTS
8591-CH01.pdf 18591-CH01.pdf 1 9/7/12 4:17 PM9/7/12 4:17 PM

Scaling Up Handwashing and Rural Sanitation: Findings from a Baseline Survey in Tanzania Introduction
2 Scaling Up Rural Sanitation
as to the general status of sanitation and hygiene practices in the rural areas surveyed and some of the districts where the programs took place, prior to implementation activities. Findings are occasionally cross-tabulated by administrative location (districts and corresponding regions) or sanitary conditions; however, no confident relation should be as-sumed between these variables based on a simple empirical association.
In spite of difficulties experienced during data collection, this technical note presents summary descriptive statistics for key demographic, socioeconomic, hygiene, health, and child development variables that were considered the sim-plest in survey application and compare well with infor-mation obtained from other surveys. The figures presented here have been positively validated against existing infor-mation from available household surveys, in particular the 2010 DHS. The general aspects presented provide guidance
8591-CH01.pdf 28591-CH01.pdf 2 9/7/12 4:17 PM9/7/12 4:17 PM

www.wsp.org 3
Characteristics of Targeted HouseholdsII.
TABLE 1: SUMMARY STATISTICS
Mean
Household (HH) size 4.9
Number of children under five yrs per HH
at the time of survey, eligible HH only
1.4
Number of males per HH 2.4
HH Head:
Male (%) 84.8%
Age 37.6
Ever attended school (%) 84.8%
Worked outside household in last 12
months, age > 14 (%)
90.2%
Monthly Labor Income (in TZSs) 114,769
All HH Members:
Age 18.2
Ever attended school (%) 80.0%
Worked outside household in last 12
months, age > 14 (%)
61.5%
Table 1 shows a brief summary of household basic socio-economic characteristics. The main eligibility criteria used in the survey was that the household had at least one child under two years of age, in accordance to the target popula-tion of the program. We found that the average household comprised 4.9 individuals; among them there were, on av-erage, 2.4 male individuals. Consistent with the household eligibility criteria of having at least one child under two years of age, on average there were 1.4 children younger than five years old per household; 68% of households inter-viewed had exactly one child under five.
The mean age of the household members was 18.2 and 80% of household members have had some schooling. Ap-proximately 85% of the 1,586 interviewed households have a male household head. The average age of the household head is 37.6 years old; approximately 85% have had some level of school attendance and 90.2% reported working
outside the home. Finally, self-reported monthly income by the household head was 114,769 TZS. Although self-reported income is not always a reliable measure and has to be interpreted with caution, income of the head of household could be thought as a proxy for total household income. With an average household size of 4.9 members, equivalent per capita reported monthly income would be approximately 23,422 TZS. As a reference, reported mean per capita household monthly income in the 2007 Tanza-nia Mainland Household Budget Survey for rural areas was 28,418 TZS.
The following tables provide further analysis of the socio-demographic and socio-economic characteristics of the household. Table 2 presents the distribution of basic house-hold demographic variables: age of the household members
Age (% Individuals):
0–4 27.8
5–9 13.6
10–14 9.3
15–19 7.0
20–24 8.3
25–29 8.8
30–34 8.4
35–39 5.7
40–44 4.0
45–49 2.5
50+ 4.8
Total 100
Percentage of HHs with following # of children under 5:
1 child 68.0
2 children 27.9
3 or more children 4.1
Total 100
TABLE 2: PERCENT DISTRIBUTION OF THE BASIC SOCIO-DEMOGRAPHIC CHARACTERISTICS
8591-CH02.pdf 38591-CH02.pdf 3 9/7/12 4:18 PM9/7/12 4:18 PM

Scaling Up Handwashing and Rural Sanitation: Findings from a Baseline Survey in Tanzania Characteristics of Targeted Households
4 Scaling Up Rural Sanitation
4 Tanzania has had a successful mosquito net program for the past 10 years; nets are free to all pregnant mothers and children under five years of age, so, it is likely that these household nets were not purchased.
The typical household in the program
areas of rural Tanzania is headed by a
male and comprises five members living in
a single detached dwelling with clay floor
and mud or brick walls.
The targeted population is young; on
average, more than 50% of the household
members are under 14 years old. This is
consistent with figures from rural mainland
Tanzania.
and the total number of children under the age of five per household. The target population was very young; on average, more than 50% of the household mem-bers were under 14 years old. Figure 2 presents the sample population distribu-tion by age group and gender, reflecting compliance with the enrollment criteria.
Table 3 shows assets of households and other ownerships. In terms of assets, more than half of the households (54.9%) had a radio or a cassette or CD player. Items associated with more well-off households such as TVs or VCRs were scarce: 2.1% and 1.3% of the households reported having such items. On average, 39.5% of the households had one or more bicycles and 71.6% had mattresses. We also observed that the large majority of the households owned mosquito nets and bed frames, 79.2% and 80.1% respectively.4 Most households possessed some type of farm tools (89.4%) and a little more than half of the households owned animals (52%).
The analysis of the household dwelling type and construction materials is sum-marized in Table 4. Most households (82.5%) allowed enumerators to enter the household to observe dwelling characteristics. Among the observable households, we found that the most common type of dwelling was a detached, independent
Percentage of population in the sample by age groups
Males (%)
0–4
16
5–9
10–14
15–19
20–24
25–29
30–34
35–39
40–44
45–49
50+
Females (%)
14 12 10 8 6 4 2 0 2 4 6 8 10 12 14 16
FIGURE 2: DISTRIBUTION OF SAMPLED POPULATION BY AGE GROUP AND GENDER (POPULATION PYRAMID)
8591-CH02.pdf 48591-CH02.pdf 4 9/7/12 4:18 PM9/7/12 4:18 PM

Scaling Up Handwashing and Rural Sanitation: Findings from a Baseline Survey in Tanzania Characteristics of Targeted Households
www.wsp.org 5
The average household uses kerosene for
lighting, wood for cooking, and in about
half of the cases owns a few animals and
a bicycle.
Bed frame 80.1
Mosquito net 79.2
Mattress 71.6
Radio, CD, cassette 54.9
Stove (gas or other) 40.4
Bicycle 39.5
Cell phone 21.6
Clothes Iron (charcoal) 10.3
Sewing machine 4.2
Other house/other buildings 2.2
TV 2.1
Motorbike 1.4
VCR, DVD 1.3
Machinery, equipment 0.9
Clothes Iron (electric) 0.8
Blender 0.8
Automobile or truck 0.3
HH owns farm equipment 89.4
HH owns other piece of land besides home 46.8
HH has animals 52.0
Number of different livestock owned by HH (average) 0.96
HH allows enumerator to observe housing
characteristics (% HHs)
82.5
Type of Dwelling (% observable HHs):
Detached house 43.9
Buildings 24.8
Apartment 6.3
Multi-family house 5.5
Room in a larger dwelling 0.9
Improvised housing unit 0.7
NA/Missing * 17.9
TOTAL 100
Walling Materials (% observable HHs):
Unbaked brick, adobe 34.5
Mud 30.7
Brick 24.9
Other (including tin sheeting, bamboo) 5.5
Wood, logs 2.8
Concrete 1.5
TOTAL 100
Roofing Materials (% observable HHs):
Tin, zinc sheeting 47.9
Other (including canvas, brick, concrete, adobe) 39.5
Bamboo 5.7
Mud 5.2
Wood, logs 1.8
TOTAL 100
Flooring Materials (% observable HHs):
Clay, earthen floor 78.8
Concrete 15.1
Other (incl. tile, linoleum, parquet) 6.0
TOTAL 100
TABLE 3: PERCENT DISTRIBUTION OF HOUSEHOLD ASSETS (% HHs)
TABLE 4: DWELLING CHARACTERISTICS AND MATERIALS BY OBSERVATION
8591-CH02.pdf 58591-CH02.pdf 5 9/7/12 4:18 PM9/7/12 4:18 PM

Scaling Up Handwashing and Rural Sanitation: Findings from a Baseline Survey in Tanzania Characteristics of Targeted Households
6 Scaling Up Rural Sanitation
dwelling (43.9%). The most common construction mate-rial of walls was unbaked brick (34.5%); followed by mud and baked brick (30.7% and 24.9%, respectively). The use of other walling materials such as concrete or wood was rare. Tin or zinc sheeting was the most common type of roofing material (47.9%). In 78.8% of the observable dwellings, the floor was clay, or earthen floor, and only 15.1% of ob-servable households had concrete floors.
The survey also included information regarding the type of energy source used for lighting and cooking in the dwelling (see Table 5). For dwelling lighting source, the large major-ity of the households (86.1%) used kerosene, with wood being the second alternative (7.2%). Most of the house-holds (91%) used wood as the primary cooking fuel, fol-lowed by charcoal (5.9%).
Dwelling Lighting Source (% HHs):
Kerosene 86.1
Wood 7.2
Electricity 2.3
Other (incl. peat, candles, battery, solar, charcoal) 2.1
No Lighting 1.6
Gas 0.6
Total 100.0
Dwelling Cooking Fuel (% HHs):
Wood 91.0
Charcoal 5.9
Kerosene 1.8
Other (incl. coal, peat) 1.1
No Fuel for Cooking 0.2
Total 100.0
TABLE 5: DWELLING ENERGY SOURCE
8591-CH02.pdf 68591-CH02.pdf 6 9/7/12 4:18 PM9/7/12 4:18 PM

www.wsp.org 7
Water SourcesIII.The pre-program survey also investigated the household water source and the treatment that household mem-bers apply to drinking water. Questions related to water source were disaggregated by season (rainy versus dry
TABLE 6: WATER SOURCE
JMP defined improved water source (% HHs) 49.7
Source of Water for Drinking Use (% HHs):
Dug well…
unprotected 27.1
protected 7.7
Piped water into…
public tap, standpipe 24.2
yard, plot, dwelling 1.3
Surface water 19.2
Tube well, worewhole 10.1
Rainwater 5.1
Spring water…
unprotected 3.3
protected 1.4
Other sources, water
Vendor 0.8
TOTAL 100
Source location (% HHs):
Elsewhere 55.1
In own yard, plot 31.5
In own dwelling 13.4
TOTAL 100
Covered source (% HHs):
Open 64.7
Covered 30.6
Other answer 4.8
TOTAL 100
Who mainly collects water in HH (% HHs):
Adult woman 94.2
Adult man 3.2
Child < 15 years 1.6
Other members 1.1
TOTAL 100
TABLE 7: DRINKING WATER
Stores drinking water in home (% HHs) 86.0
Frequency of washing drinking water storage (% HHs
that indicated storing drinking water at home):
More than once per week 59.8
Once per week 19.2
Rarely 18.8
Never wash 2.3
TOTAL 100.0
Cleansing agent used to wash drinking water storage
(% HHs that indicated washing water storage):
Soap, detergent, bleach 53.4
Water only 33.5
Other 10.0
Mud 2.5
Ash 0.7
TOTAL 100.0
Prepares water before drinking (% HHs):
No 68.4
Yes 24.4
Sometimes 7.2
Method of preparing water (% HHs that indicated
preparing water before drinking)*:
Boil 43.2
Stand and settle water before drinking 32.3
Strain through a cloth 22.9
Filter 7.3
Chlorine 5.7
Iodine 0.8
*For HH which answered both Yes and Sometimes. Multiple
responses are permitted.
season); however, because almost every household had the same water source throughout the year, we present results for the rainy season only. Results are summarized in Tables 6 and 7.
8591-CH03.pdf 78591-CH03.pdf 7 9/7/12 4:17 PM9/7/12 4:17 PM

Scaling Up Handwashing and Rural Sanitation: Findings from a Baseline Survey in Tanzania Water Sources
8 Scaling Up Rural Sanitation
As Table 6 shows, almost half of the households (49.7%) reported having ac-cess to an improved water source. When taking a narrower look at the data, we find three main sources of drinking water in the surveyed households: piped water from public tap (24.2%), unprotected dug well (27.1%), and surface water (19.2%). On average, 31.5% of these water sources were located in the household’s own yard or plot, 13.4% within the dwelling, and the rest (55.1%) are located elsewhere, suggesting most of households could be investing some significant amount of time collecting water. Regarding features of the water source, 30.6% of the households used a water source that was covered, while 64.7% reported using uncovered water sources. In the vast majority of the house-holds (94.2%), an adult female was in charge of collecting water from the source. The task was performed by an adult male in only 3.2% of the households and by a child under 15 years old in 1.6% of the households.
Finally, we explored practices related to drinking water consumption (Table 7). The majority of households stored drinking water at home, but only 24.4% re-ported treating the water before drinking it. Of these, less than half (43%) men-tioned boiling the water as one of the treatments. This suggests that water safety practices could be considerably improved in these districts in order to prevent waterborne diseases.
In rural Tanzania, collecting water is a
woman’s task (94.2% of households).
On average, only about half of households
(49.7%) have access to an improved water
source, which is generally not in their
dwellings or on their plots.
8591-CH03.pdf 88591-CH03.pdf 8 9/7/12 4:17 PM9/7/12 4:17 PM

www.wsp.org 9
Handwashing BehaviorIV.Handwashing with soap at critical times (such as after contact with feces and before handling food) has been shown to substantially reduce the risk of diarrhea. Children under five years of age represent the age group most susceptible to diar-rheal disease and acute lower respiratory infections (ALRIs), two major causes of childhood morbidity and mortality in less developed countries. These infections, usually transferred from dirty hands to food or water sources or to the mouth directly through hand-to-mouth contact, can be prevented if mothers/caregivers wash their hands with soap at critical times such as before feeding a child, cook-ing or eating, and after using a toilet or having contact with a child’s feces. In this analysis, these are considered as critical junctures.
Handwashing behavior is difficult to assess. In this study, we relied on two sources: self-reported handwashing at critical times and, as a proxy measure, spot-check observations of whether the household had a designated place for handwashing with both soap and water available. An additional measure assessed the cleanli-ness of the caretaker’s hands through direct observation, which is another proxy indicator of handwashing with soap behavior.
In the rural Tanzanian areas surveyed, a majority of the caregivers—more than 78%—reported having used soap to wash hands at least once in the previous 24 hours. However, when asked under what circumstances they last used soap to wash hands, only 33.7% mentioned at least one of the critical times (see Table 8).
Most caregivers reported using soap
to wash their hands at least once in the
previous 24 hours, but when asked the
circumstance in which they last washed,
only 33.7% mentioned a critical time and
only 21.2% mentioned after using the
toilet.
DISTRICT (REGION)
Iringa
(Iringa)
Masasi
(Mtwara)
Mpwapwa
(Dodoma)
Musoma
(Mara)
Rufiji
(Pwani) TOTAL
Washed hands with soap at least once during the following events
During at least one critical juncture 34.0 35.9 37.4 27.1 36.3 33.7
Using the toilet 22.7 15.1 30.1 13.7 24.7 21.2
Cooking or preparing food 13.6 17.6 12.2 11.4 10.1 12.5
Feeding children 9.1 19.5 11.3 5.3 7.5 9.7
Cleaning children’s bottom 11.6 7.3 13.5 6.7 6.4 9.1
Washed hands with soap at least
once in previous 24 hours 86.9 78.0 83.1 72.6 76.0 78.5
TABLE 8: CAREGIVERS SELF-REPORTED HANDWASHING BEHAVIOR WITH SOAP BY DISTRICT (% PREVIOUS 24 HOURS)
8591-CH04.pdf 98591-CH04.pdf 9 9/7/12 4:16 PM9/7/12 4:16 PM

Scaling Up Handwashing and Rural Sanitation: Findings from a Baseline Survey in Tanzania Handwashing Behavior
10 Scaling Up Rural Sanitation
Only 21.2% mentioned “using the toilet” among the occasions in which they had used soap to wash hands since the previous day, and only 9.1% mentioned “clean-ing children’s bottom.” In relation to the other critical times, 12.5% of caregivers reported that they had washed hands with soap at times of cooking or food prepa-ration, and 9.7% of caregivers mentioned when feeding a child. On average, self-reported handwashing with soap was relatively higher among wealthier than poorer households for most critical junctures. Table 8 also shows disaggregation by districts and regions. Among all districts, there were slight differences, show-ing Mara with the lowest rates of handwashing and Dodoma with the highest. However, when inspecting wealth and regional breakdowns there were no clear patterns; population in these rural districts seemed fairly homogenous.
8591-CH04.pdf 108591-CH04.pdf 10 9/7/12 4:16 PM9/7/12 4:16 PM

www.wsp.org 11
SanitationV.Although sanitation coverage in Tanzania is relatively high since a “latrinisation” program was introduced by the government in the early 1970s,5 most of rural Tanzania still relies on basic latrines, which do not separate humans from excreta and are described as “fixed-point open defecation.” Over the years, many of those basic latrines lacked adequate maintenance or fell into disrepair. In this section, we investigate the most common sanitation facilities available in the households surveyed, and some of their features.
Table 9 presents the different types of sanitation facilities reported. Unfortunately, there were ex-post reports of problems with the interpretation that enumera-tors gave to the type of facilities, in particular the flush to pit latrine classifica-tion, which apparently was understood as any latrine with water present by the side. However, the presence of water likely was used as a method of anal cleans-ing, rather than for flushing. Taking this caveat into consideration, we could no longer use the original classification and thus grouped pit latrines of any type. Pit latrines thus reached 89% predominance from adding the 35.6% of house-holds that reported having a pit latrine without slab or open pit, the 39.6% that
5 World Bank, 1996.
TABLE 9: HOUSEHOLD MAIN SANITATION FACILITY CHARACTERISTICS (% HHs)
HH Main Sanitation Facility:
Pit latrine… 88.9
with flush (water present) 39.6
without slab, open pit 35.6
with slab 12.7
ventilated improved 1.1
Open defecation 9.2
Flush other (piped sewer system, septic tank or elsewhere) 0.9
Composting toilet 0.4
Other (e.g. bucket, hanging toilet) 0.4
Total 100
Location of Main Sanitation Facility:
In household yard 81.1
Less than 10 min walk from the household 10.9
Other 5.4
Household 1.5
Inside household 1.0
TOTAL 100
The most common type of toilet facility
was a pit latrine, present in almost 89%
of households. Only 12.7% of households
reported having a pit latrine with slab.
Open defecation was reported in 9.2% of
households.
8591-CH05.pdf 118591-CH05.pdf 11 9/7/12 4:16 PM9/7/12 4:16 PM

Scaling Up Handwashing and Rural Sanitation: Findings from a Baseline Survey in Tanzania Sanitation
12 Scaling Up Rural Sanitation
reported having a latrine with what can be understood as flush-water present by the side, the 1.1% that reported having a ventilated improved pit latrine, and the mere 12.7% of households that reported having a pit latrine with slab.
These numbers seem consistent with the 2010 DHS survey for rural mainland, which found that 71.4% of households used a pit latrine without slab or open pit, while 6.3% of households used a pit latrine with slab. Open defecation was reported in 9.2% of the households, while for rural mainland, the DHS reported 17.8% of open defecation (no facility/bush/field). Regarding location, most of the sanitation facilities were located in the household yard (81.1%) and another 10.9% were located within a 10-minute walk from the dwelling.
We present findings about household main sanitation facility safety and sharing in Table 10. A large majority of the sanitation facilities were not shared with other households in the neighborhood (86.2%) and were reported as private (89.9%). Of those reportedly sharing (13.8%), in most cases they shared with two or three
Most facilities were located in the
household’s yard (81.1%). There was
no apparent gender bias in the use of
facilities; men and women reportedly
shared them in 96.7% of households
interviewed.
Sanitation facility in HH is…
not exclusive for men or women 96.7
private 89.9
not shared with other HHs in the neighborhood 86.2
shared with other HHs: 13.8
1 other HH (% of shared HHs) 5.5
2 other HHs (% of shared HHs) 46.1
3 other HHs (% of shared HHs) 18.0
3+ other HHs (% of shared HHs) 30.4
Average number of people sharing the toilet 5.94
Women in HH feel that sanitation facility…
is safe to use during day time 87.8
is safe to use during night 82.0
provides enough privacy during defecation 75.5
HH most knowledgeable member reports children < 5 not
feeling safe using sanitation facility 51.3
With the main sanitation facility, the HH is…
somewhat satisfied 29.6
very satisfied 26.7
less than satisfied 23.5
completely dissatisfied 19.6
TABLE 10: HOUSEHOLD MAIN SANITATION FACILITY SHARING AND SAFETY (% HHs)
8591-CH05.pdf 128591-CH05.pdf 12 9/7/12 4:16 PM9/7/12 4:16 PM
Scaling Up Handwashing and Rural Sanitation: Findings from a Baseline Survey in Tanzania Sanitation
www.wsp.org 13
other households. In addition, there was no apparent gender bias in the use of facilities; men and women reportedly shared them in 96.7% of households in-terviewed. The DHS for rural mainland found 80.2% of households not sharing facilities and 12.6% sharing with another household.
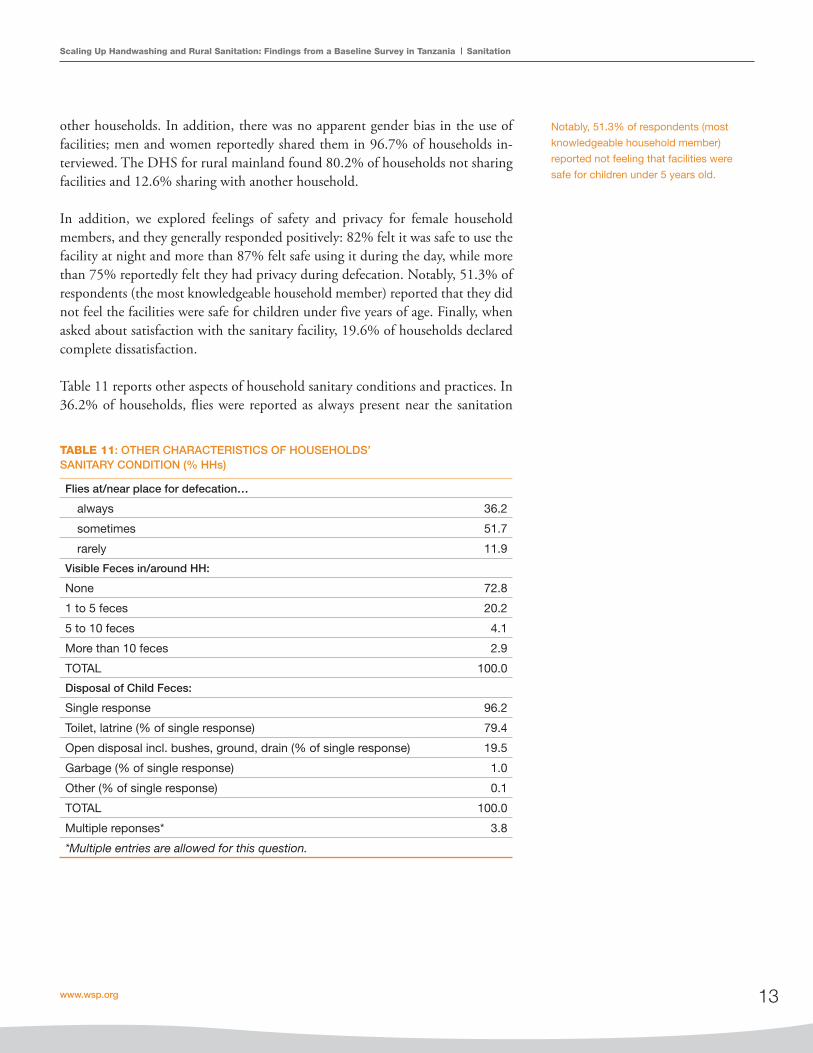
In addition, we explored feelings of safety and privacy for female household members, and they generally responded positively: 82% felt it was safe to use the facility at night and more than 87% felt safe using it during the day, while more than 75% reportedly felt they had privacy during defecation. Notably, 51.3% of respondents (the most knowledgeable household member) reported that they did not feel the facilities were safe for children under five years of age. Finally, when asked about satisfaction with the sanitary facility, 19.6% of households declared complete dissatisfaction.
Table 11 reports other aspects of household sanitary conditions and practices. In 36.2% of households, flies were reported as always present near the sanitation
Notably, 51.3% of respondents (most
knowledgeable household member)
reported not feeling that facilities were
safe for children under 5 years old.
TABLE 11: OTHER CHARACTERISTICS OF HOUSEHOLDS’ SANITARY CONDITION (% HHs)
Flies at/near place for defecation…
always 36.2
sometimes 51.7
rarely 11.9
Visible Feces in/around HH:
None 72.8
1 to 5 feces 20.2
5 to 10 feces 4.1
More than 10 feces 2.9
TOTAL 100.0
Disposal of Child Feces:
Single response 96.2
Toilet, latrine (% of single response) 79.4
Open disposal incl. bushes, ground, drain (% of single response) 19.5
Garbage (% of single response) 1.0
Other (% of single response) 0.1
TOTAL 100.0
Multiple reponses* 3.8
*Multiple entries are allowed for this question.
8591-CH05.pdf 138591-CH05.pdf 13 9/7/12 4:16 PM9/7/12 4:16 PM

Scaling Up Handwashing and Rural Sanitation: Findings from a Baseline Survey in Tanzania Sanitation
14 Scaling Up Rural Sanitation
facility. Flies can act as vectors of transmission, and some studies have associated them with certain diarrhea-causing pathogens.
Finally, we asked about the presence of visible feces, as they are the most common source of diarrhea pathogens in the environment. In most cases in this survey, no visible animal or human feces were observed inside or around the household (72.8%). However, in 20.2% of the households, one to five pieces of feces were visible. Unsafe disposal of children’s feces has increasingly gained attention as a factor associated with diarrhea risk. In this survey, most households reported a consistent practice surrounding child feces disposal (over 96% chose a unique method of disposal). Among these, most households relied on disposal in the latrine or sanitation facility (almost 80%), but a considerable proportion reported that child feces were disposed of in the open (19.5%).
When handling children’s feces, most
households relied on disposal to the
latrine or sanitation facility (almost 80%);
however, a considerable proportion
reported that they were disposed of in the
open (19.5%).
8591-CH05.pdf 148591-CH05.pdf 14 9/7/12 4:16 PM9/7/12 4:16 PM

www.wsp.org 15
Child Care EnvironmentVI.
6 Colostrum is produced prior to mature breast milk during pregnancy and through the first 3–6 days of life. It contains not only necessary nutrients but also properties that help protect the baby from viral and bacterial infections.
It is largely recognized that characteristics of the caregiver and the quality of care a child receives have huge impacts on young children’s health, nutritional status, and development beyond variation due to socio-economic and education vari-ables. We collected information on feeding practices, caregiving behavior, and caregiver well-being in order to more carefully tease out the potential effects of the behavior change interventions on child health and development.
Table 12 summarizes breastfeeding habits within the interviewed households. The average breastfeeding duration was 15 months, and 93% of the children received colostrum6 during the first three days after childbirth. Only 15.7% of the mothers fed their babies liquids other than colostrum or breast milk during the first three days of life. Of those children who were fed other liquid, more than two-thirds were provided with plain water.
TABLE 12: CHILD BREASTFEEDING (CHILDREN < 2)
Child ever breastfed at the time of survey
(% children < 2) 98.4
Still breastfeeding (% children ever breastfed) 87.9
Average months of breastfeeding
(for children ever breastfed) 15.0
During the first three days after birth, ….
colostrum was fed (% children < 2) 93.0
liquid other than colostrum or breast milk was fed
(% children < 2) 15.7
Single Response 87.0
Plain water 60.6
Sugar-salt solution 10.8
Milk other than breast 7.5
Other liquids 7.4
Sugar, glucose water 5.0
Tea or gripe water 4.6
Instant formula 4.1
Multiple Responses 13.0
8591-CH06.pdf 158591-CH06.pdf 15 9/7/12 4:16 PM9/7/12 4:16 PM

Scaling Up Handwashing and Rural Sanitation: Findings from a Baseline Survey in Tanzania Child Care Environment
16 Scaling Up Rural Sanitation
The survey also included a section on children’s diet, summarized in Table 13. Specifically, caregivers of infants under the age of two were asked about liquids and food given to their children in the day previous to the interview. Almost 90% of the children were given plain water since the previous day; breast milk consumption (89%) was very high as expected for children under the age of two. Homemade gruel was also consumed by a majority of children (72.1%). Interest-ingly, one-fifth of the children were given tea or coffee (20.3%). With respect to
Liquids given the day before survey taken (% children):
Plain water 89.5
Breast milk 89.0
Homemade porridge or gruel 72.1
Caffeine beverages 20.3
Fortified child food 8.1
Fruit juice 6.1
Other milks or instant formula 3.2
% of children that were given solid or semi-solid food
the day before survey taken 70.3
Food given (% children who had solid or semisolid food the day before):
Cereal, rice, other grain-based food 94.7
Other fruits, vegetables 89.9
Beans, peas, lentils 86.2
Fruits or vegetables rich in vitamin A (carrots, yams,
mango, papaya, green leaf vegetables) 82.4
Meat red, white 80.3
Potatoes, yucca, other roots 73.9
Oil, fats, butter 48.9
Average number of times solid or semi-solid food was
given the day before survey taken 2.41
1 meal 15.8
2 meals 38.6
3 meals 37.2
3+ meals 8.4
Feed themselves with utensils or hands (% children who
had solid or semi-solid food the day before) 68.6
Received vitamin A supplement in the last 6 months
(% children < 2) 56.4
Given iron pills or syrup in the last seven days before
survey taken (% children < 2) 25.1
TABLE 13: INFANT/YOUNG CHILD FEEDING (CHILDREN < 2)
8591-CH06.pdf 168591-CH06.pdf 16 9/7/12 4:16 PM9/7/12 4:16 PM

Scaling Up Handwashing and Rural Sanitation: Findings from a Baseline Survey in Tanzania Child Care Environment
www.wsp.org 17
food given the day before, 70.3% of the children received solid or semi-solid food 2.41 times on average. When asked about dietary supplements, 25.1% of caregiv-ers declared giving iron pills or syrup to their children in the seven days prior to the survey and 56.4% mentioned having provided vitamin A supplement to their children at least once in the previous six months. A large number of caregivers (68.6%) also mentioned that children who had been given solid or semi-solid food the day before had also fed themselves.
Furthermore, there were specific questions related to household support for learning and development, including the frequency with which adults engaged children in various activities recognized as promoting language and cognitive de-velopment. Table 14 shows that 85.9% of the children under the age of two played with household objects, and in more than 50% of cases, adults had sung songs with their children. Only 2.4% of the children had attended an early education program. Although most respondents reportedly took their children outside the home in the three days prior to the survey (71.5%), a low number of caregivers reported reading books (13.7%) or telling stories to their children (14.5%) in the same period.
Most children under the age of two
are breast-fed (89%) and play with
household objects (85.9%). In more than
50% of cases, adults sing songs with
their children. Caregivers reported rarely
reading books (13.7%) or telling stories to
the child (14.5%) in the three days prior to
the survey.
Child plays with household objects (% children) 85.9
Adult take child outside home (% caregivers associated with children < 2) 71.5
Adult sings songs with child (% caregivers associated with children < 2) 50.1
Adult spend time naming, counting, drawing with child
(% caregivers associated with children < 2) 23.8
Adult tells stories to child (% caregivers associated with children < 2) 14.5
Adult reads books with child (% caregivers associated with children < 2) 13.7
Child attended early education programs (% children) 2.4
TABLE 14: INFANT/YOUNG CHILDREN LEARNING ENVIRONMENT (CHILDREN < 2)
8591-CH06.pdf 178591-CH06.pdf 17 9/7/12 4:16 PM9/7/12 4:16 PM

Child Health and Anthropometric MeasuresVII.
7 In the DHS, “the prevalence of symptoms of ARI was estimated by asking mothers whether their children under age 5 had been ill with a cough accompanied by short, rapid breathing in the two weeks preceding the survey.” (DHS, 2010)
8 World Health Organization, 2005 and 2006.
The survey also intended to provide information on anemia prevalence, children’s diarrhea prevalence, ALRI, and other health symptoms; child development; and child growth in order to generate evidence on the association with sanita-tion and hygiene interventions. However, validation of the symptom-related data and nutritional indexes against infor-mation from other surveys suggested measurement prob-lems during data collection. In light of this, results are not reported in detail.
Presence of anemia was measured by hemoglobin concen-tration in children between six months and two years of age (<110g/L per international standards), and findings are sum-marized in Table 15. The majority (79.3%) of samples taken indicated the presence of anemia. Estimates from the 2010 DHS reported 58.1% prevalence of anemia in rural main-land and between 68.7% and 81.1% for children between six months and two years of age, which seemed consistent with the levels reported in our sample. There were no major differences for households with improved water source (78.4%) or unimproved water source (80.5%). Regarding different levels by districts, the percentage of anemia preva-lence is highest among children living in Pwani (88.9%) and lowest among children living in Dodoma (71.6%).
Diarrhea was defined as the reported presence of three or more loose or watery stools over a 24-hour period or one or more stools with blood and/or mucus present, using symp-tom data reported from caregivers. Acute lower respiratory
infection was defined using the clinical case definition of the World Health Organization (WHO 2005), which di-agnoses a child as having an ALRI when he/she presents constant cough or difficulty breathing and raised respira-tory rate symptoms, as reported by the caregiver.
Whereas estimates from the 2010 DHS reported prevalence of diarrhea among children under five at 14.6% in main-land, 13.6% in mainland rural areas, and approximately 20% for children under 24 months old, the findings in re-lation to caregiver-reported diarrhea for our sample of chil-dren under two was below 2.0% (between 19 and 30 cases reported out of a total of 2,164 children under two years old). Similarly, caregiver-reported two-day and seven-day ALRI prevalence was positive only in eight and nine cases in the sample, respectively (approximately 1,500 households), while the 2010 DHS survey reported 4.7% prevalence of ARI for children under 24 months old.7 The inconsistency suggests serious under-reporting in the sample and doubts about reliability of data symptom collected. In light of this, results are not presented in detail here.
The survey also intended to include baseline anthropo-
metric measures of children under the age of two, such as weight, height, and arm and head circumference. This in-formation is important in order to assess the average growth and development of the children. To analyze the child growth findings, anthropometric Z-scores were assigned by compar-ing children in the sample to the WHO reference population median and standard deviation (SD) for each of the afore-mentioned variables.8 The reference population is designed to be internationally applicable regardless of ethnicity, socio-economic status, or feeding practices. The Z-score for each measure indicates the number of SD units from the median
TABLE 15: ANEMIA PREVALENCE (% OF CHILDREN < 2)
(Hb < 110 g/L)
District (Region):
Rufiji (Pwani) 88.9
Masasi (Mtwara) 83.7
Iringa (Iringa) 80.3
Musoma (Mara) 72.8
Mpwapwa (Dodoma) 71.6
Sanitary Conditions:
Improved sanitation 82.1
Unimproved sanitation 76.0
Improved water source 78.4
Unimproved water source 80.5
Place for handwashing w/ soap and water 81.3
No place for handwashing w/ soap and water 79.2
Overall 79.3
8591-CH07.pdf 188591-CH07.pdf 18 9/7/12 4:15 PM9/7/12 4:15 PM

Scaling Up Handwashing and Rural Sanitation: Findings from a Baseline Survey in Tanzania Child Health and Anthropometric Measures
www.wsp.org 19
of the reference population. The WHO guidelines for child growth use a Z-score cutoff of less than –2 SDs below the me-dian of the reference population for low growth levels (stunted, wasted, and underweight) and less than –3 SDs from the me-dian, indicating severity of the condition (severely stunted, wasted, and underweight). In addition, children with a weight-for-height index of more than 2 SDs above the median refer-ence population are considered obese.
Table 16 presents information on children’s nutritional sta-tus based on the indexes. Unfortunately, these suggest low quality of measurements during data collection as well.
Validation of these figures against comparable datasets posed doubts about their reliability (Table 17). In our sample, an average of 58.3% of children were stunted and 35.1% were severely stunted (height-for-age Z-score); 2.2% were wasted or malnourished and 0.4% were severely wasted (weight-for-height Z-score); and 10.6% were underweight and 2.7% were severely underweight (weight-for-age Z-score).
For example, the mean height-for-age Z-score was –3.56, a relatively large number indicating generalized stunting; this figure was higher than the rural mean Z-score of –1.8 reported in the 2010 DHS and other comparable datasets. When trimming down the height-for-age to levels feasible by WHO standards (between –6 to +6), near 20% of the sample was lost. After trimming, the mean height-for-age Z-score became –2.38, which could be plausible. However, high variability of height-for-age Z-scores (not shown here) relative to other countries also suggested poor quality mea-surements. Finally, the finding of 9.1% of children report-edly overweight was unlikely in comparison with the 0.6% reported in the DHS for rural mainland. Similarly, the weight-for-height mean Z-score was positive, which was inconsistent with the other indexes and similar datasets. In light of these apparent inconsistencies and the problems ex-perienced during data collection, we abstain from reporting more detailed figures here.
TABLE 16: NUTRITIONAL STATUS OF CHILDREN < 2
Height-for-age Weight-for-height Weight-for-age
Background
characteristics
Percentage
below –3 SD
Percentage
below –2 SD
Mean
Z-score (SD)
Percentage
below –3 SD
Percentage
below –2 SD
Percentage
over +2 SD
Mean Z–
score (SD)
Percentage
below –3 SD
Percentage
below –2 SD
Percentage
over +2 SD
Mean Z–
score (SD)
DHS 2010,
rural mainland *
17.8 44.7 –1.80 1.2 4.6 4.9 0.00 4.1 16.7 0.6 –1.00
WSP, 5 districts 35.1 58.3 –2.38 0.4 2.2 38.7 1.05 2.7 10.6 9.1 –0.38
*Source: 2010 Tanzania Demographic and Health Survey (DHS)
Dataset
Height-for-age
mean Z-score (SD)
Weight-for-height
mean Z-score (SD)
Weight-for-age
mean Z-score (SD)
WSP Tanzania, five districts –2.38 1.05 –0.38
Tanzania DHS, 2010 (rural mainland) –1.8 0.0 –1.0
WSP Senegal –0.55 –0.48 –0.67
WSP Himachal Pradesh, India –1.28 –0.58 –1.21
WSP Madhya Pradesh, India –1.92 –1.08 –2.18
Rural Water Project Kenya –1.85 na na
Tamil Nadu, India –1.98 na na
WSP Peru –1.13 0.46 –0.28
WSP East Java, Indonesia –0.88 –0.43 –0.78
TABLE 17: ESTIMATES OF Z-SCORES (IN SD) FROM SELECTED DATASETS
8591-CH07.pdf 198591-CH07.pdf 19 9/7/12 4:16 PM9/7/12 4:16 PM

ConclusionVIII.The findings presented in this technical report provide a snapshot of the target population before the rural sanita-tion and handwashing behavior change programs started. The report explores their household demographics, socio-economic situation, caretaker’s handwashing behav-ior, water sources and sanitation facilities, and key child health and growth measures. Due to problems during data collection, figures required validation against information from other surveys. As a result, we reported only summary descriptive statistics for variables that were considered the simplest in survey administration and that compare well with information obtained from other surveys, in partic-ular the 2010 DHS. Symptom reporting and anthropo-metric measures seemed particularly affected by quality problems in data collection.
Limited baseline knowledge of the critical times for wash-ing hands indicated that there was scope for improving handwashing behavior in the target population. Likewise, there was limited access to improved water sources, a scar-city of pit latrines with slabs, and reports of open defecation in a non-negligible proportion of households. Underlying challenges also included unsafe facilities for little children and poor practices related to disposal of child feces.
The impact evaluation planned will rely exclusively on post-intervention data given the problems experienced during baseline data collection. The survey will be carried out dur-ing 2012 and the full report will be published during 2013. The study hopes to enable a close examination of the links between poor sanitation, handwashing behavior, and health, and to provide evidence for future projects in rural Tanzania.
8591-CH08.pdf 208591-CH08.pdf 20 9/7/12 4:15 PM9/7/12 4:15 PM
Scaling Up Handwashing and Rural Sanitation: Findings from a Baseline Survey in Tanzania Conclusion
www.wsp.org 21
D. de Waal (2005) National Water Sector Assessment, Tan-zania. WaterAid. https://www.wateraid.org/other/startdownload.asp?DocumentID=142&mode=plugin.
National Bureau of Statistics (NBS) Tanzania and ICF Macro (2011) Tanzania Demographic and Health Survey 2010, NBS and ICF Macro.
World Bank (1996) Tanzania: Social Sector Review. Re-port No. 14039-TA. The World Bank. Washing-ton, D.C.
World Health Organization/UNICEF Joint Monitor-ing Programme for Water Supply and Sanita-tion Website. http://www.wssinfo.org/definitions/infrastructure.html.
World Health Organization (2005) Pocket Book of Hospi-tal Care for Children: Guidelines for the Management of Common Illnesses with Limited Resources. Geneva. WHO Press.
World Health Organization (2006) WHO Child Growth Standards: Length/Height-for-Age, Weight-for-Age, Weight-for-Length, Weight-for-Height and Body Mass Index-for-Age: Methods and Development. Geneva. WHO Press.
Y. Coombes and N. Paynter (2010) Scaling Up Handwashing Tanzania: A Handwashing Behavior Change Journey. The World Bank Water and Sanitation Program. Washington, D.C.
References
8591-CH08.pdf 218591-CH08.pdf 21 9/7/12 4:15 PM9/7/12 4:15 PM

8591-CH08.pdf 228591-CH08.pdf 22 9/7/12 4:15 PM9/7/12 4:15 PM

Scaling Up Handwashing and Rural Sanitation: Findings from a Baseline Survey in Tanzania
Bertha Briceño and Ahmad Yusef
September 2012
The Water and Sanitation Program is a multi-donor partnership administered by the World Bank to support poor people in obtaining affordable, safe, and sustainable access to water and sanitation services.
Global Scaling Up Rural Sanitation
WATER AND SANITATION PROGRAM: TECHNICAL PAPER
8591-COVR.pdf i 9/10/12 11:14 AM