Embed Size (px)
Citation preview
Scaling-up Microfinance for India’s Rural Poor
Priya Basu* World Bank
and Pradeep Srivastava **
National Council of Applied Economic Research, India
Abstract
This paper reviews the current level and pattern of access to finance for India’s rural poor and examines some of the key microfinance approaches in India, taking a close look at the most dominant among these, the Self Help Group (SHG) Bank Linkage initiative. It empirically analyzes the success with which SHG Bank Linkage has been able to reach the poor, examines the reasons behind this, and the lessons learned. The analysis in the paper draws heavily on a recent rural access to finance survey of 6,000 households in India, undertaken by the authors. The main findings and implications of the paper are as follows: India’s rural poor currently have very little access to finance from formal sources. Microfinance approaches have tried to fill the gap. Among these, the growth of SHG Bank Linkage has been particularly remarkable, but outreach remains modest in terms of the proportion of poor households served. The paper recommends that, if SHG Bank Linkage is to be scaled-up to offer mass access to finance for the rural poor, then much more attention will need to be paid towards: the promotion of high quality SHGs that are sustainable, clear targeting of clients, and ensuring that banks linked to SHGs price loans at cost-covering levels. At the same time, the paper argues that, in an economy as vast and varied as India’s, there is scope for diverse microfinance approaches to coexist. Private sector microfinanciers need to acquire greater professionalism, and the government, too, can help by creating a flexible architecture for microfinance innovations, including through a more enabling policy, legal and regulatory framework. Finally, the paper argues that, while microfinance can, at minimum, serve as a quick way to deliver finance to the poor, the medium-term strategy to scale-up access to finance for the poor should be to ‘graduate’ microfinance clients to formal financial institutions. The paper offers some suggestions on what it would take to reform these institutions with an eye to improving access for the poor.
World Bank Policy Research Working Paper 3646, June 2005 The Policy Research Working Paper Series disseminates the findings of work in progress to encourage the exchange of ideas about development issues. An objective of the series is to get the findings out quickly, even if the presentations are less than fully polished. The papers carry the names of the authors and should be cited accordingly. The findings, interpretations, and conclusions expressed in this paper are entirely those of the authors. They do not necessarily represent the view of the World Bank, its Executive Directors, or the countries they represent. Policy Research Working Papers are available online at http://econ.worldbank.org.
Priya Basu ([email protected]) is Senior Economist in the Finance and Private Sector Unit, South Asia Region of the World Bank. **Pradeep Srivastava is Chief Economist, National Council of Applied Economic Research (NCAER), India. The authors gratefully acknowledge comments from Anjali Kumar, Asli Demirguc-Kunt and Jim Hanson on an earlier version of this paper. We also thank Niraj Verma for his inputs and Reema Datta for research assistance. The paper draws on a larger Economic and Sector Work study on access to finance, which was funded by the South Asia Finance and Private Sector Development unit of the World Bank.
WPS3646
Pub
lic D
iscl
osur
e A
utho
rized
Pub
lic D
iscl
osur
e A
utho
rized
Pub
lic D
iscl
osur
e A
utho
rized
Pub
lic D
iscl
osur
e A
utho
rized
1
TABLE OF CONTENTS
I. INTRODUCTION..................................................................................................................................... 1
II. ACCESS TO FINANCE FOR THE POOR: SOME EVIDENCE ...................................................... 3 2.1 THE CURRENT LEVEL AND PATTERN OF ACCESS TO FORMAL FINANCE ............................................... 3 2.2 INFORMAL FINANCE ............................................................................................................................ 10
III. NEW APPROACHES TO DELIVERING FINANCE TO THE POOR: MICROFINANCE IN INDIA .......................................................................................................................................................... 11
3.1 SHG BANK LINKAGE: LINKING BANKS TO GRASSROOTS BORROWERS............................................... 11 3.2 ‘GRAMEEN REPLICATOR- TYPE’ MICROFINANCE INSTITUTIONS.......................................................... 12
IV. EVALUATING SHG BANK LINKAGE........................................................................................... 16 4.1 HOW EFFECTIVE HAS SHG BANK LINKAGE BEEN IN TARGETING THE POOR? .................................... 16 4.2 IMPACT ON VULNERABILITY OF POOR HOUSEHOLDS .......................................................................... 19 4.3 SOME LESSONS FROM SHG BANK LINKAGE........................................................................................ 19 4.4 KEY CONCERNS, GOING FORWARD ..................................................................................................... 20
V. MEETING THE CHALLENGE OF SCALING-UP ACCESS TO FINANCE FOR INDIA’S RURAL POOR ........................................................................................................................................... 22
5.1 SCALING-UP MICROFINANCE .............................................................................................................. 22 5.2 MAKING THE FORMAL FINANCIAL SECTOR BETTER AT BANKING FOR THE POOR ............................... 26
REFERENCES ........................................................................................................................................... 30
1
Scaling-up Microfinance for India’s Rural Poor
I. Introduction Since the early national plans, successive governments in independent India have emphasized the link between improving access to finance and reducing poverty, a stance that has had influence globally.1, 2 The need to improve financial access for India’s poor, the overwhelming majority of whom are concentrated in rural areas, 3 motivated the establishment of a vast network of rural cooperative credit banks in the 1950s, followed by a drive to nationalize commercial banks, launched in 1969. This led to thousands of new bank branches in rural areas across the country. The strategy during the 1970s and 1980s gave the lead role to the nationalized (state-owned) commercial banks, who were charged with loosening the grip of traditional informal sector moneylenders through the use of targeted low-priced loans. The 1990s saw the partial deregulation of interest rates, increased competition in the banking sector, and new microfinance approaches, most notably, a nationwide attempt, pioneered by non-governmental organizations (NGOs) and now supported by the state, to create links between commercial banks, NGOs, and informal local groups (‘self-help groups’, or SHGs). Better known as ‘SHG Bank Linkage’, this approach has grown dramatically over the past decade, and while its outreach is still modest in terms of the proportion of poor households served, many believe it is destined to become the country’s dominant system of mass-outreach banking for the poor. However, informal sector lenders remain a strong presence in rural India, delivering finance to the poor, the vast majority of whom still do not have access to either formal or semi-formal (microfinance) sectors. Scaling-up access to finance for India’s rural poor, to meet their diverse financial needs (savings, credit, insurance against unexpected events, etc.) through flexible products at competitive prices, presents a formidable challenge in a country as vast and varied as India. But the opportunities, too, are plentiful, and government has an important role to play in creating space and a flexible architecture for innovations. This paper begins with a brief review in Section II of the current level and pattern of access to formal finance for India’s rural households, with a focus on the poor. The review draws on a recent survey conducted jointly by the World Bank and the National Council of Applied Economic Research, India (NCAER) - the Rural Finance Access Survey, 2003 (RFAS-2003). It highlights inadequacies in rural access to formal finance and the extortionary terms of informal finance, which provide a strong need and ample space for innovative microfinance approaches— that combine the safety and reliability of formal finance with the convenience and flexibility of informal finance—to serve the financial needs of India’s rural poor. Section III examines some of the key microfinance initiatives in India over the past decade. Section IV takes a closer look at the most dominant among the recent microfinance approaches, SHG Bank Linkage. It evaluates the success with which this approach has been able to reach out to the poor, analyzes the reasons
1 The focus on poverty and finance was articulated most famously in the 1954 Reserve Bank of India (RBI) report on the All-India Rural Credit Survey of 1951-52 (RBI, 1954). 2 For a good discussion on the link between finance and poverty see Rajan and Zingales (2003). For a discussion on the microeconomic underpinnings of the welfare implications of improved access to financial intermediation, see World Bank (2003a). 3 Of the estimated 260 million Indians (or 26% of the population) who live in poverty, some 193 million (or 74%) live in rural areas. Another 180 million rural people are “near poor”. A majority of these households are marginal or small farmers, and the poorest households are landless.
2
behind its success and lessons learned, and identifies the main issues and concerns in scaling-up. Section V concludes by providing some suggestions on what needs to be done to scale-up access to finance for India's rural poor.
3
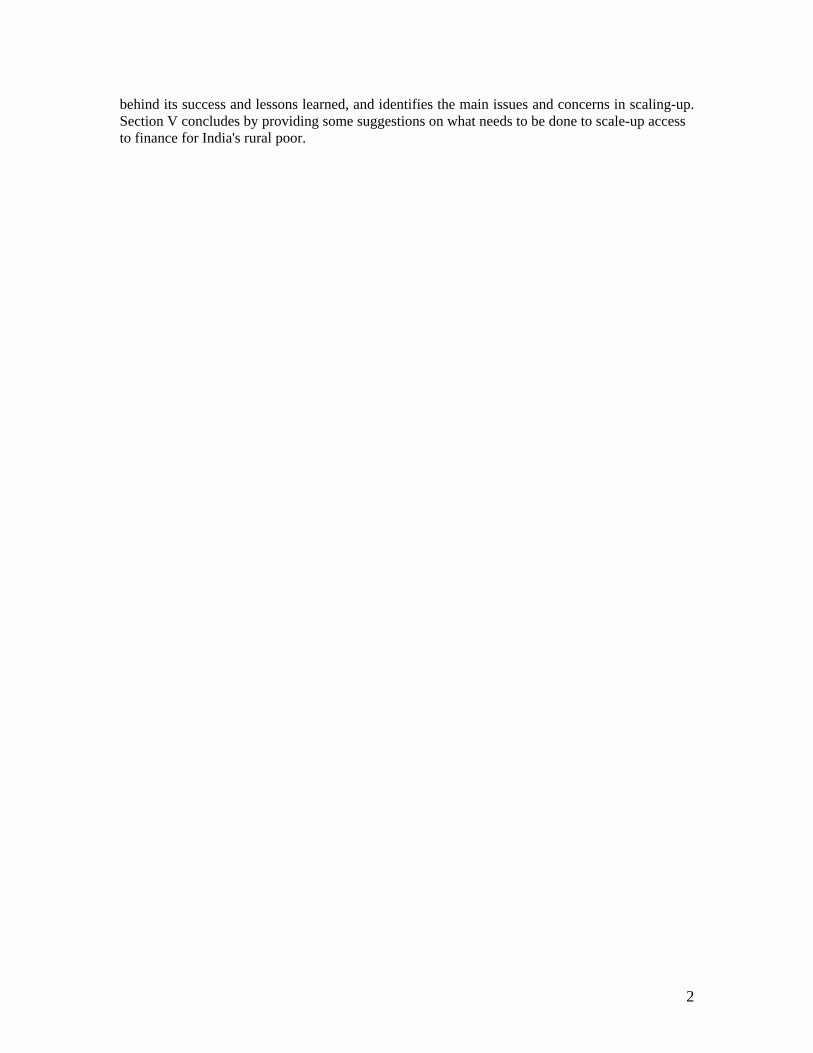
II. Access to Finance for the Poor: Some Evidence4 2.1 The Current Level and Pattern of Access to Formal Finance India has a deep financial system. Financial assets in India amount to about US$430 billion, in nominal terms, compared to less than US$250 billion in Argentina, US$330 billion in Malaysia, or US$386 billion in Mexico, despite India’s significantly lower per capita income. The share of financial assets in GDP in India is about 93%, compared to 81% in Argentina and 68% in Mexico. (Table 1).
Table 1: Depth of Financial Markets – India and Other Emerging Economies (1999/2000)
Total Financial Assets* (US$m)
Equity Market Capitalization /
GDP (%)
Equities - Value
Traded /GDP (%)
Domestic Public
Bonds on Issue /
GDP (%)
Domestic Private
Bonds on Issue /
GDP (%)
Total Financial Assets* / GDP (%)
GDP per capita 1999
Atlas Method
(curr. US$)
Private Credit / GDP
(%) Brazil 780,739 39.0 17.0 40.9 8.9 139.7 4,350 50.9Argentina 231,166 44.0 2.1 11.8 1.0 81.0 7,550 24.2México 386,366 24.7 7.9 9.2 2.1 68.3 4,440 32.3India 437,293 34.2 104.7 21.8 0.4 92.8 440 36.4China 2,153,717 42.5 66.8 19.5 8.5 199.4 780 128.9Malaysia 331,302 146.5 65.5 29.6 50.0 370.9 3,390 144.8Korea 1,091,499 64.7 233.1 16.9 45.1 267.0 8,490 140.3*Simplified definition based on aggregate of assets described in this table. Sources: World Development Indicators; IFS; IFC - Emerging Markets Database; BIS Financial depth is attributable in large part to India’s vast network of financial institutions, including those focused on rural customers. The 1970s and 1980s saw a rapid expansion of India’s financial system into rural areas. Following Indira Gandhi’s bank nationalization drive, launched in 1969, commercial banks were required to open rural branches and, between 1973 and 1985, bank branches in rural areas grew at an average of 15.2% each year, about double the growth rate of branches in semi-urban (6.4%), urban (7.8%) and metropolitan (7.5%) areas. Today, India has over 32,000 rural branches of commercial banks and regional rural banks (RRBs), some 14,000 cooperative bank branches, 98,000 primary agricultural credit societies (PACS), not to speak of the thousands of mutual fund sellers, several non-bank finance companies (NBFCs) and a large post office network with 154,000 outlets that are required to focus on deposit mobilization and money transfers.
4 For a more detailed discussion of the current level and pattern of access to finance in India, see World Bank (2004).
4
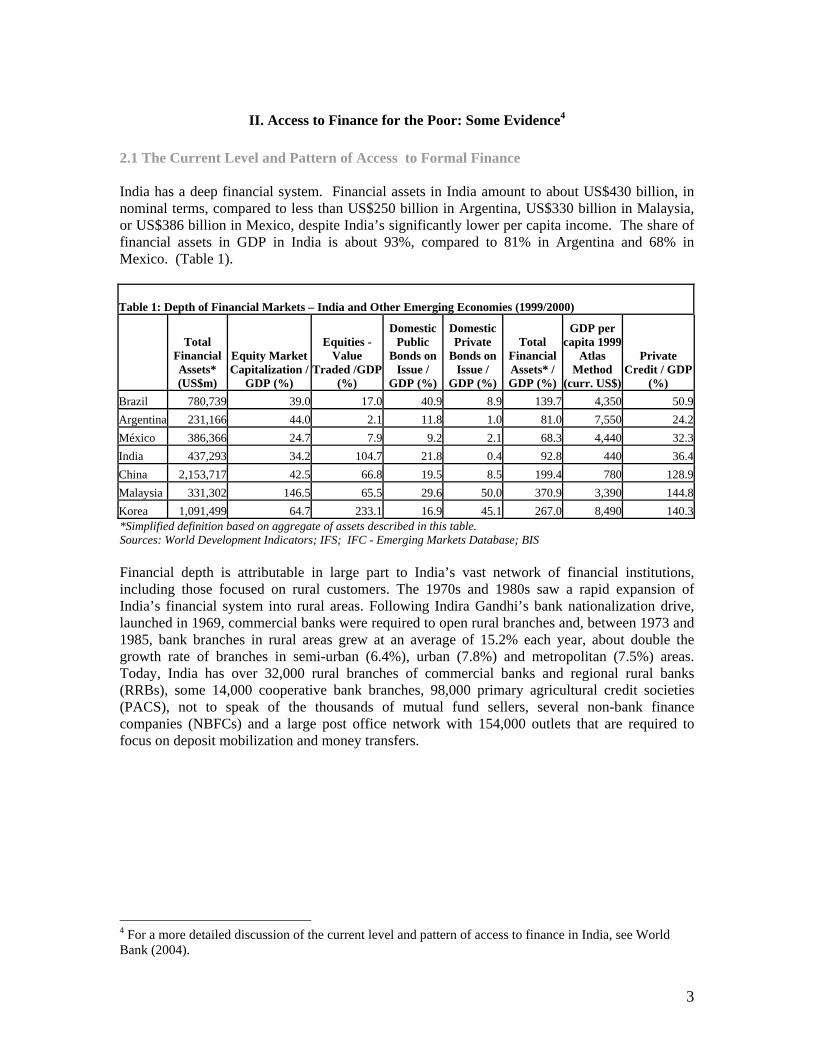
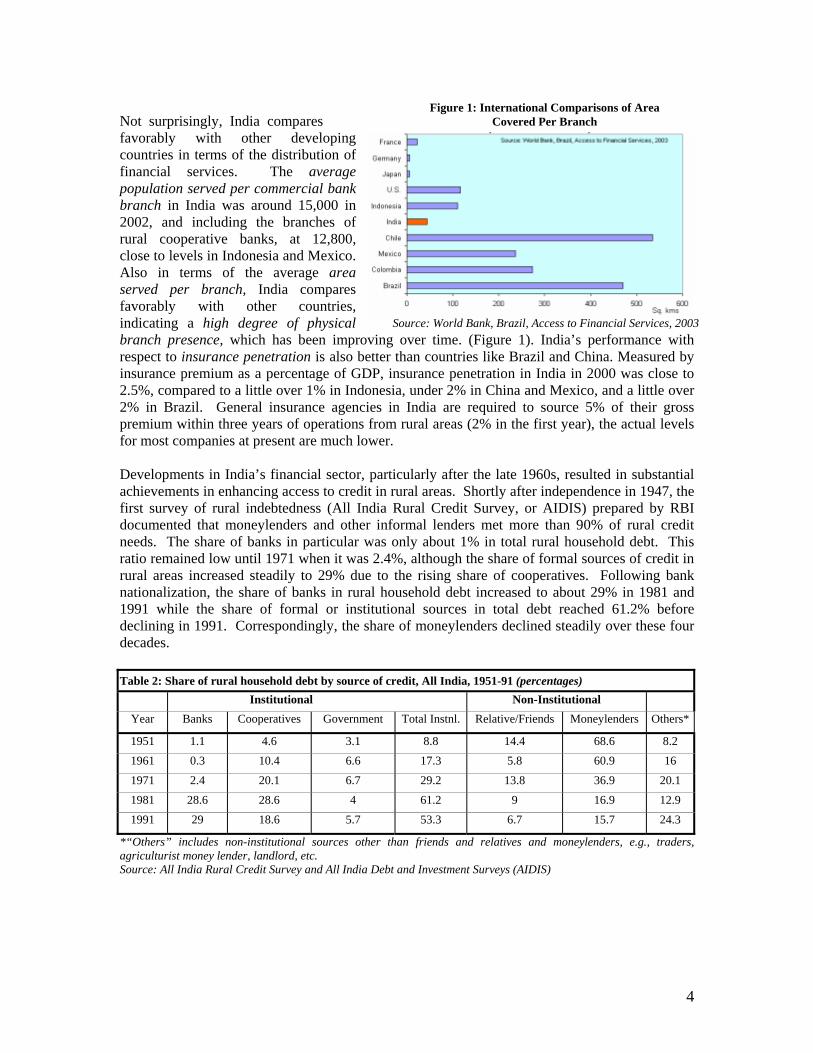
Not surprisingly, India compares favorably with other developing countries in terms of the distribution of financial services. The average population served per commercial bank branch in India was around 15,000 in 2002, and including the branches of rural cooperative banks, at 12,800, close to levels in Indonesia and Mexico. Also in terms of the average area served per branch, India compares favorably with other countries, indicating a high degree of physical branch presence, which has been improving over time. (Figure 1). India’s performance with respect to insurance penetration is also better than countries like Brazil and China. Measured by insurance premium as a percentage of GDP, insurance penetration in India in 2000 was close to 2.5%, compared to a little over 1% in Indonesia, under 2% in China and Mexico, and a little over 2% in Brazil. General insurance agencies in India are required to source 5% of their gross premium within three years of operations from rural areas (2% in the first year), the actual levels for most companies at present are much lower. Developments in India’s financial sector, particularly after the late 1960s, resulted in substantial achievements in enhancing access to credit in rural areas. Shortly after independence in 1947, the first survey of rural indebtedness (All India Rural Credit Survey, or AIDIS) prepared by RBI documented that moneylenders and other informal lenders met more than 90% of rural credit needs. The share of banks in particular was only about 1% in total rural household debt. This ratio remained low until 1971 when it was 2.4%, although the share of formal sources of credit in rural areas increased steadily to 29% due to the rising share of cooperatives. Following bank nationalization, the share of banks in rural household debt increased to about 29% in 1981 and 1991 while the share of formal or institutional sources in total debt reached 61.2% before declining in 1991. Correspondingly, the share of moneylenders declined steadily over these four decades. Table 2: Share of rural household debt by source of credit, All India, 1951-91 (percentages)
Institutional Non-Institutional
Year Banks Cooperatives Government Total Instnl. Relative/Friends Moneylenders Others*
1951 1.1 4.6 3.1 8.8 14.4 68.6 8.2 1961 0.3 10.4 6.6 17.3 5.8 60.9 16
1971 2.4 20.1 6.7 29.2 13.8 36.9 20.1 1981 28.6 28.6 4 61.2 9 16.9 12.9
1991 29 18.6 5.7 53.3 6.7 15.7 24.3
*“Others” includes non-institutional sources other than friends and relatives and moneylenders, e.g., traders, agriculturist money lender, landlord, etc. Source: All India Rural Credit Survey and All India Debt and Investment Surveys (AIDIS)
Figure 1: International Comparisons of Area Covered Per Branch
Source: World Bank, Brazil, Access to Financial Services, 2003
5
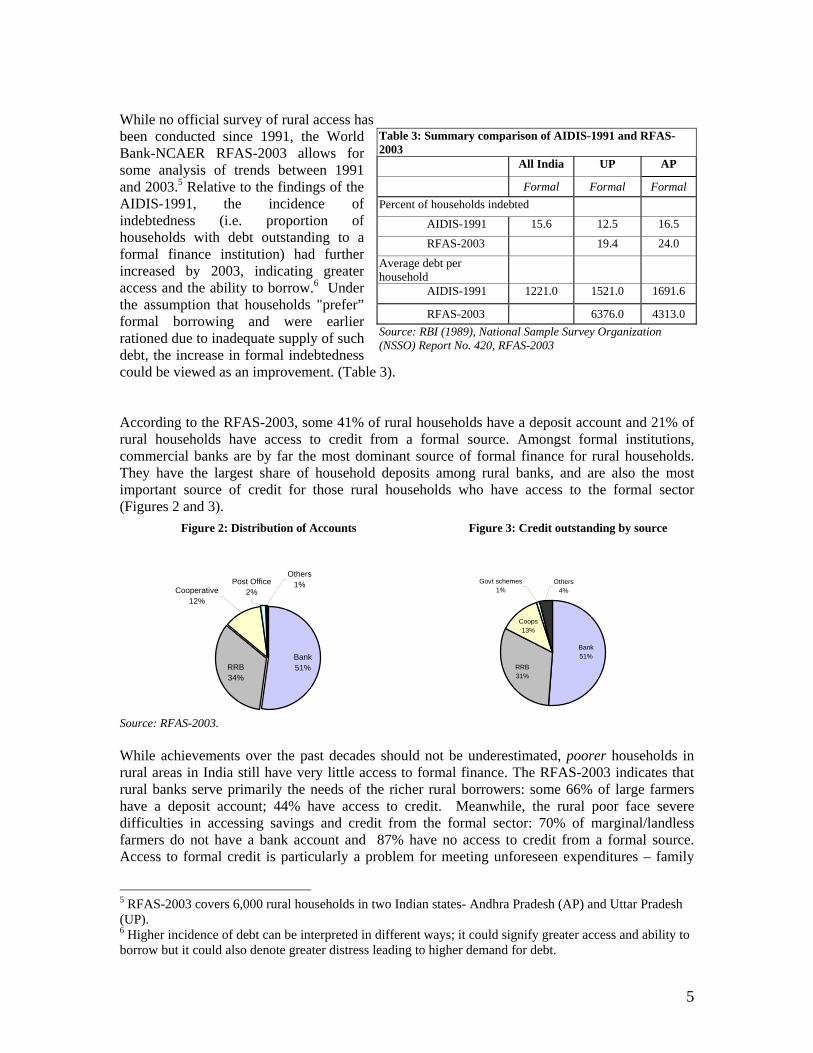
While no official survey of rural access has been conducted since 1991, the World Bank-NCAER RFAS-2003 allows for some analysis of trends between 1991 and 2003.5 Relative to the findings of the AIDIS-1991, the incidence of indebtedness (i.e. proportion of households with debt outstanding to a formal finance institution) had further increased by 2003, indicating greater access and the ability to borrow.6 Under the assumption that households "prefer” formal borrowing and were earlier rationed due to inadequate supply of such debt, the increase in formal indebtedness could be viewed as an improvement. (Table 3). According to the RFAS-2003, some 41% of rural households have a deposit account and 21% of rural households have access to credit from a formal source. Amongst formal institutions, commercial banks are by far the most dominant source of formal finance for rural households. They have the largest share of household deposits among rural banks, and are also the most important source of credit for those rural households who have access to the formal sector (Figures 2 and 3).
Source: RFAS-2003. While achievements over the past decades should not be underestimated, poorer households in rural areas in India still have very little access to formal finance. The RFAS-2003 indicates that rural banks serve primarily the needs of the richer rural borrowers: some 66% of large farmers have a deposit account; 44% have access to credit. Meanwhile, the rural poor face severe difficulties in accessing savings and credit from the formal sector: 70% of marginal/landless farmers do not have a bank account and 87% have no access to credit from a formal source. Access to formal credit is particularly a problem for meeting unforeseen expenditures – family
5 RFAS-2003 covers 6,000 rural households in two Indian states- Andhra Pradesh (AP) and Uttar Pradesh (UP). 6 Higher incidence of debt can be interpreted in different ways; it could signify greater access and ability to borrow but it could also denote greater distress leading to higher demand for debt.
Table 3: Summary comparison of AIDIS-1991 and RFAS-2003
All India UP AP
Formal Formal Formal Percent of households indebted
AIDIS-1991 15.6 12.5 16.5
RFAS-2003 19.4 24.0
Average debt per household
AIDIS-1991 1221.0 1521.0 1691.6
RFAS-2003 6376.0 4313.0 Source: RBI (1989), National Sample Survey Organization (NSSO) Report No. 420, RFAS-2003
Others1%
Cooperative12%
Post Office2%
RRB34%
Bank51% RRB
31%
Bank51%
Coops13%
Govt schemes1%
Others4%
Figure 2: Distribution of Accounts Figure 3: Credit outstanding by source
6
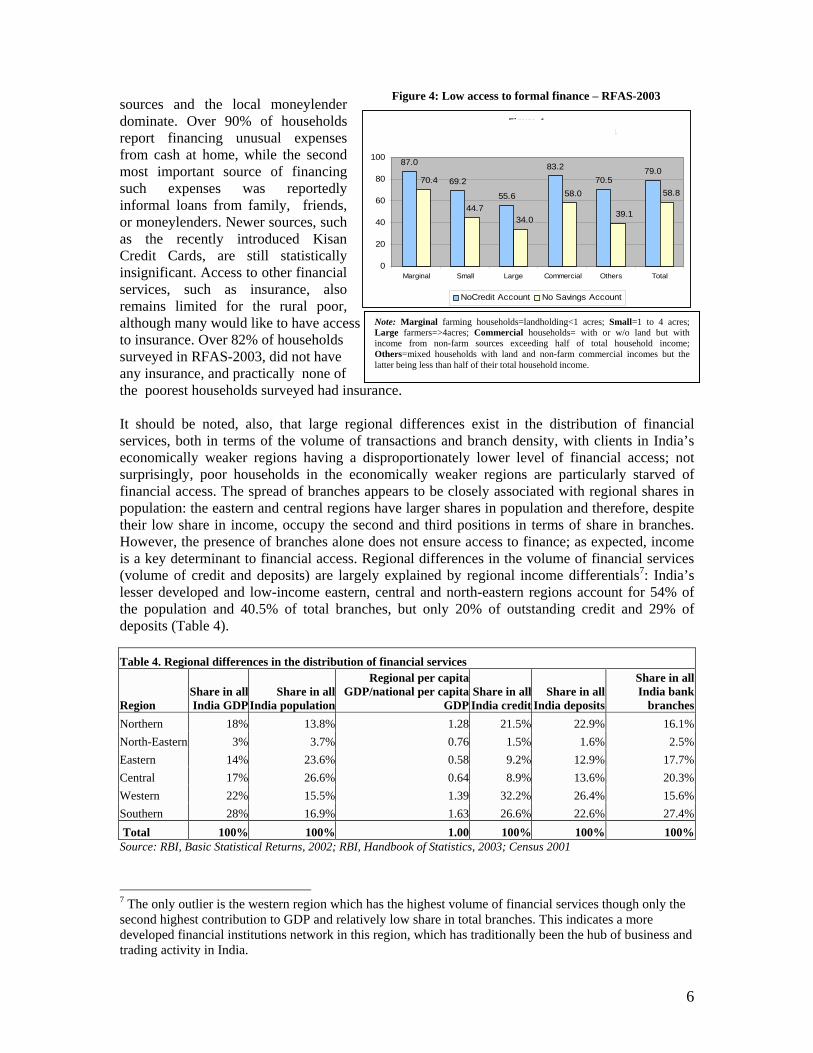
Note: Marginal farming households=landholding<1 acres; Small=1 to 4 acres; Large farmers=>4acres; Commercial households= with or w/o land but with income from non-farm sources exceeding half of total household income; Others=mixed households with land and non-farm commercial incomes but the latter being less than half of their total household income.
sources and the local moneylender dominate. Over 90% of households report financing unusual expenses from cash at home, while the second most important source of financing such expenses was reportedly informal loans from family, friends, or moneylenders. Newer sources, such as the recently introduced Kisan Credit Cards, are still statistically insignificant. Access to other financial services, such as insurance, also remains limited for the rural poor, although many would like to have access to insurance. Over 82% of households surveyed in RFAS-2003, did not have any insurance, and practically none of the poorest households surveyed had insurance. It should be noted, also, that large regional differences exist in the distribution of financial services, both in terms of the volume of transactions and branch density, with clients in India’s economically weaker regions having a disproportionately lower level of financial access; not surprisingly, poor households in the economically weaker regions are particularly starved of financial access. The spread of branches appears to be closely associated with regional shares in population: the eastern and central regions have larger shares in population and therefore, despite their low share in income, occupy the second and third positions in terms of share in branches. However, the presence of branches alone does not ensure access to finance; as expected, income is a key determinant to financial access. Regional differences in the volume of financial services (volume of credit and deposits) are largely explained by regional income differentials7: India’s lesser developed and low-income eastern, central and north-eastern regions account for 54% of the population and 40.5% of total branches, but only 20% of outstanding credit and 29% of deposits (Table 4).
Source: RBI, Basic Statistical Returns, 2002; RBI, Handbook of Statistics, 2003; Census 2001
7 The only outlier is the western region which has the highest volume of financial services though only the second highest contribution to GDP and relatively low share in total branches. This indicates a more developed financial institutions network in this region, which has traditionally been the hub of business and trading activity in India.
Table 4. Regional differences in the distribution of financial services
Region Share in all India GDP
Share in allIndia population
Regional per capita GDP/national per capita
GDPShare in all India credit
Share in all India deposits
Share in all India bank
branchesNorthern 18% 13.8% 1.28 21.5% 22.9% 16.1%North-Eastern 3% 3.7% 0.76 1.5% 1.6% 2.5%Eastern 14% 23.6% 0.58 9.2% 12.9% 17.7%Central 17% 26.6% 0.64 8.9% 13.6% 20.3%Western 22% 15.5% 1.39 32.2% 26.4% 15.6%Southern 28% 16.9% 1.63 26.6% 22.6% 27.4% Total 100% 100% 1.00 100% 100% 100%
Figure 4Low access to formal finance - RFAS 2003
87.0
69.2
55.6
83.270.5
79.0
58.8
39.1
58.0
34.044.7
70.4
0
20
40
60
80
100
Marginal Small Large Commercial Others Total
NoCredit Account No Savings Account
Figure 4: Low access to formal finance – RFAS-2003
7
2.1.1 What explains the lack of access to formal finance by the rural poor? The failure of India’s rural banks to deliver finance to the poor may be attributed to a combination of factors affecting both banks and their clients. From the perspective of the rural banks, serving the rural poor is a high-risk, high-cost proposition. First, is the problem of uncertainty. As in many other countries, uncertainty about the repayment capacity of poor rural borrowers, and their irregular/volatile income streams and expenditure patterns (Box 1), in the absence of credit information, serve to drive up default risk. Problems of uncertainty are exacerbated by the borrower’s inability to provide collateral, and/or difficulties in contract design and enforcement and in repossession of collateral. Also, the rural poor are perceived as “bad clients” because they typically want to borrow for consumption smoothening rather than investment purposes, and if they do borrow for investment, they lack information on how to make their business viable. Second, the transaction costs of rural lending in India are high, mainly due to the small loan size, high frequency of transactions in rural finance, large geographical spread and heterogeneity of borrowers, and widespread illiteracy. For private sector banks – their lack of a rural branch network is an additional problem.
H o u s e h o l d s h a v e u n c e r t a i n / i r r e g u l a r i n c o m e s t r e a m s
S o u r c e s o f i n c o m e
O th e r s
A g r ic u l t u r e a n d a l l ie d a c t iv i t ie s ( 4 4 .5 % )
B u s in e s s
w a g e s( 4 7 .5 % )
T r a d in g
W a g e s ( i r r e g u la r )( 3 0 .3 % )
W a g e s ( p a r t t im e )( 5 .5 % )
W a g e s ( f u l l t im e )( 1 1 .7 % )
S o u r c e s o f in c o m e F ir s t S e c o n d A g r i c u ltu re /a ll i e d 4 4 .6 5 9 .6W a g e s /s a la r y 4 7 .5 3 3 .0B u s i n e s s / t r a d i n g 4 . 9 4 .8O t h e r s 3 . 0 2 .6
H o u s e h o l d s h a v e u n c e r t a i n / i r r e g u l a r i n c o m e s t r e a m s
S o u r c e s o f i n c o m e
O th e r s
A g r ic u l t u r e a n d a l l ie d a c t iv i t ie s ( 4 4 .5 % )
B u s in e s s
w a g e s( 4 7 .5 % )
T r a d in g
W a g e s ( i r r e g u la r )( 3 0 .3 % )
W a g e s ( p a r t t im e )( 5 .5 % )
W a g e s ( f u l l t im e )( 1 1 .7 % )
O th e r s
A g r ic u l t u r e a n d a l l ie d a c t iv i t ie s ( 4 4 .5 % )
B u s in e s s
w a g e s( 4 7 .5 % )
T r a d in g
W a g e s ( i r r e g u la r )( 3 0 .3 % )
W a g e s ( p a r t t im e )( 5 .5 % )
W a g e s ( f u l l t im e )( 1 1 .7 % )
S o u r c e s o f in c o m e F ir s t S e c o n d A g r i c u ltu re /a ll i e d 4 4 .6 5 9 .6W a g e s /s a la r y 4 7 .5 3 3 .0B u s i n e s s / t r a d i n g 4 . 9 4 .8O t h e r s 3 . 0 2 .6
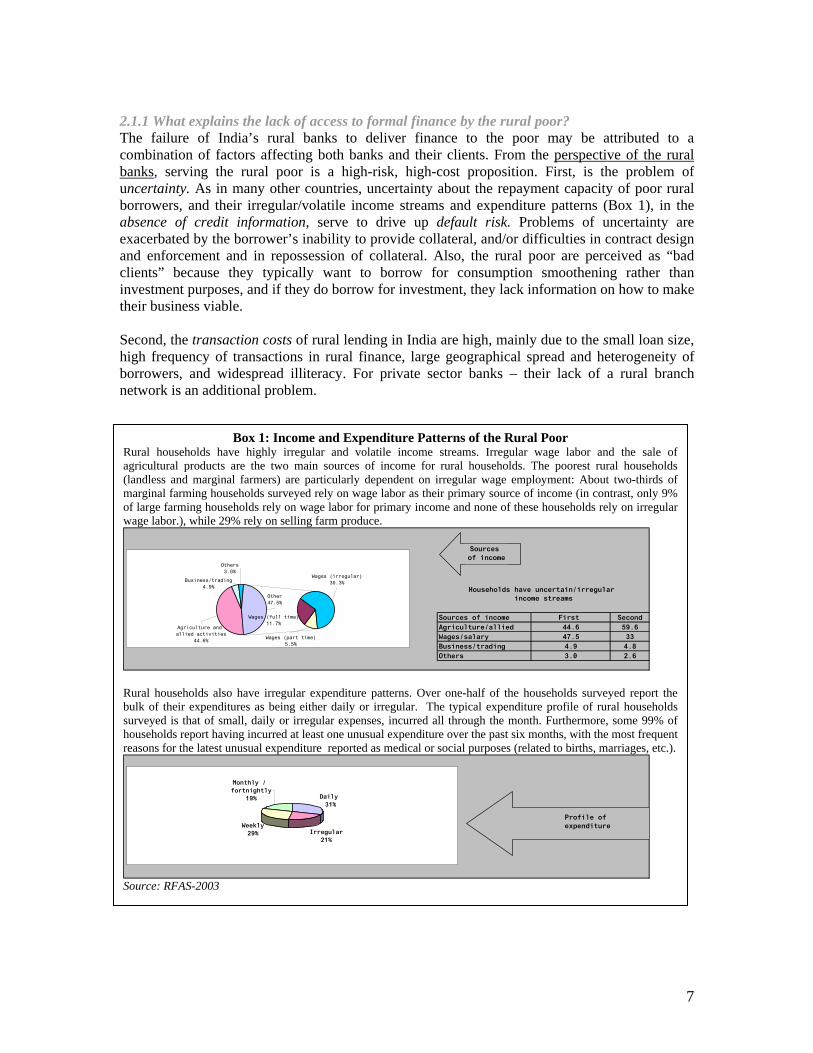
Box 1: Income and Expenditure Patterns of the Rural Poor Rural households have highly irregular and volatile income streams. Irregular wage labor and the sale of agricultural products are the two main sources of income for rural households. The poorest rural households (landless and marginal farmers) are particularly dependent on irregular wage employment: About two-thirds of marginal farming households surveyed rely on wage labor as their primary source of income (in contrast, only 9% of large farming households rely on wage labor for primary income and none of these households rely on irregular wage labor.), while 29% rely on selling farm produce.
Sources of income First SecondAgriculture/allied 44.6 59.6Wages/salary 47.5 33Business/trading 4.9 4.8Others 3.0 2.6
Households have uncertain/irregular income streams
Business/trading4.9%
Others3.0%
Wages (part time)5.5%
Agriculture and allied activities
44.6%
Wages (irregular)30.3%
Wages (full time)11.7%
Other47.5%
Sources of income
Rural households also have irregular expenditure patterns. Over one-half of the households surveyed report the bulk of their expenditures as being either daily or irregular. The typical expenditure profile of rural households surveyed is that of small, daily or irregular expenses, incurred all through the month. Furthermore, some 99% of households report having incurred at least one unusual expenditure over the past six months, with the most frequent reasons for the latest unusual expenditure reported as medical or social purposes (related to births, marriages, etc.).
Daily 31%
Irregular21%
Weekly29%
Monthly / fortnightly
19%
Profile of expenditure
Source: RFAS-2003
8
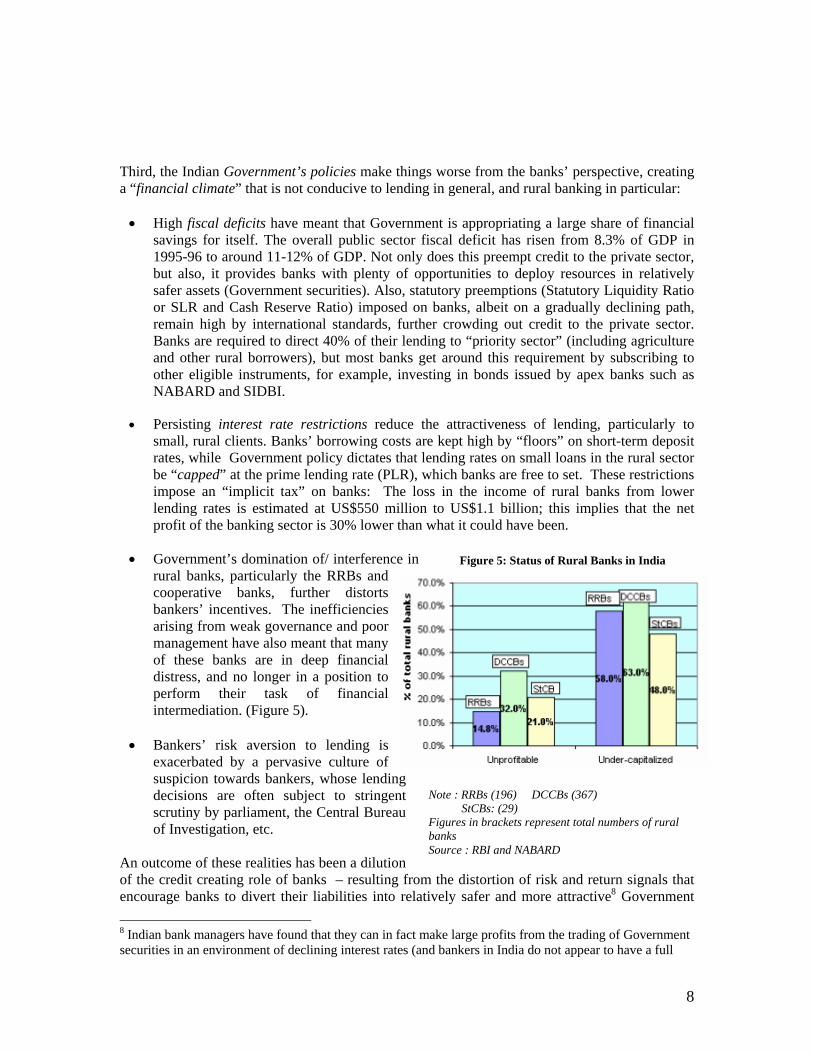
Figure 5: Status of Rural Banks in India
Note : RRBs (196) DCCBs (367) StCBs: (29) Figures in brackets represent total numbers of rural banks Source : RBI and NABARD
Third, the Indian Government’s policies make things worse from the banks’ perspective, creating a “financial climate” that is not conducive to lending in general, and rural banking in particular: • High fiscal deficits have meant that Government is appropriating a large share of financial
savings for itself. The overall public sector fiscal deficit has risen from 8.3% of GDP in 1995-96 to around 11-12% of GDP. Not only does this preempt credit to the private sector, but also, it provides banks with plenty of opportunities to deploy resources in relatively safer assets (Government securities). Also, statutory preemptions (Statutory Liquidity Ratio or SLR and Cash Reserve Ratio) imposed on banks, albeit on a gradually declining path, remain high by international standards, further crowding out credit to the private sector. Banks are required to direct 40% of their lending to “priority sector” (including agriculture and other rural borrowers), but most banks get around this requirement by subscribing to other eligible instruments, for example, investing in bonds issued by apex banks such as NABARD and SIDBI.
• Persisting interest rate restrictions reduce the attractiveness of lending, particularly to
small, rural clients. Banks’ borrowing costs are kept high by “floors” on short-term deposit rates, while Government policy dictates that lending rates on small loans in the rural sector be “capped” at the prime lending rate (PLR), which banks are free to set. These restrictions impose an “implicit tax” on banks: The loss in the income of rural banks from lower lending rates is estimated at US$550 million to US$1.1 billion; this implies that the net profit of the banking sector is 30% lower than what it could have been.
• Government’s domination of/ interference in
rural banks, particularly the RRBs and cooperative banks, further distorts bankers’ incentives. The inefficiencies arising from weak governance and poor management have also meant that many of these banks are in deep financial distress, and no longer in a position to perform their task of financial intermediation. (Figure 5).
• Bankers’ risk aversion to lending is
exacerbated by a pervasive culture of suspicion towards bankers, whose lending decisions are often subject to stringent scrutiny by parliament, the Central Bureau of Investigation, etc.
An outcome of these realities has been a dilution of the credit creating role of banks – resulting from the distortion of risk and return signals that encourage banks to divert their liabilities into relatively safer and more attractive8 Government 8 Indian bank managers have found that they can in fact make large profits from the trading of Government securities in an environment of declining interest rates (and bankers in India do not appear to have a full
9
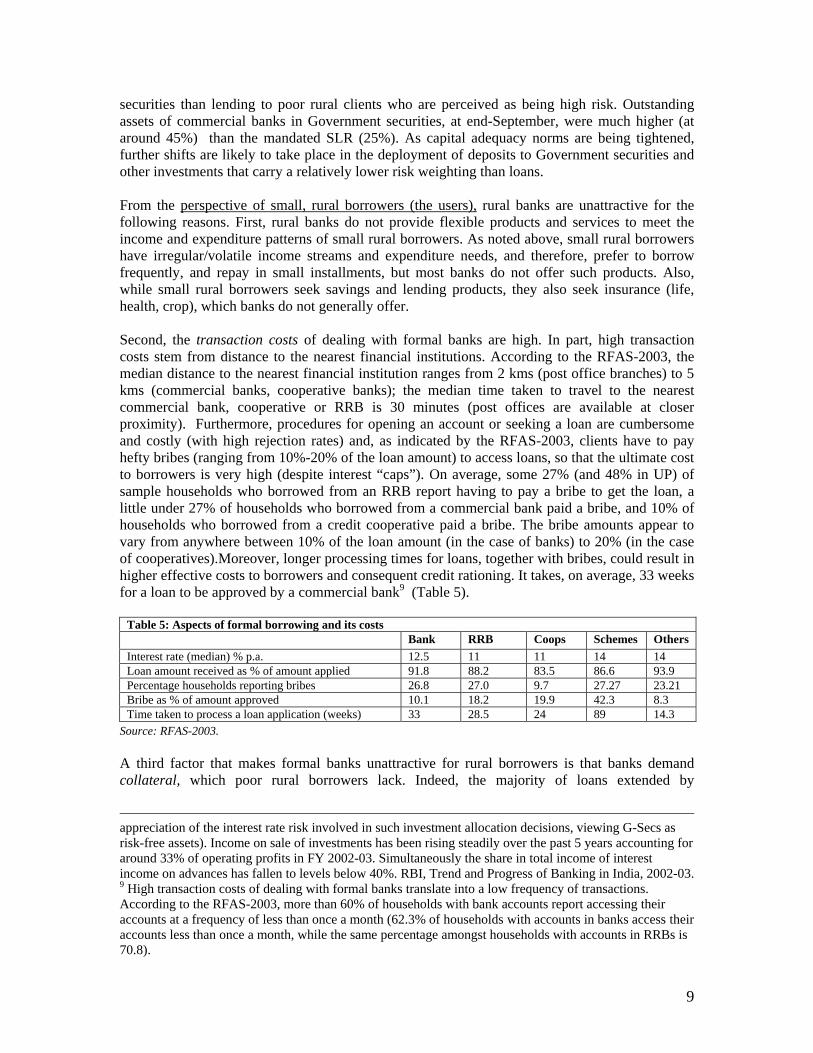
securities than lending to poor rural clients who are perceived as being high risk. Outstanding assets of commercial banks in Government securities, at end-September, were much higher (at around 45%) than the mandated SLR (25%). As capital adequacy norms are being tightened, further shifts are likely to take place in the deployment of deposits to Government securities and other investments that carry a relatively lower risk weighting than loans. From the perspective of small, rural borrowers (the users), rural banks are unattractive for the following reasons. First, rural banks do not provide flexible products and services to meet the income and expenditure patterns of small rural borrowers. As noted above, small rural borrowers have irregular/volatile income streams and expenditure needs, and therefore, prefer to borrow frequently, and repay in small installments, but most banks do not offer such products. Also, while small rural borrowers seek savings and lending products, they also seek insurance (life, health, crop), which banks do not generally offer. Second, the transaction costs of dealing with formal banks are high. In part, high transaction costs stem from distance to the nearest financial institutions. According to the RFAS-2003, the median distance to the nearest financial institution ranges from 2 kms (post office branches) to 5 kms (commercial banks, cooperative banks); the median time taken to travel to the nearest commercial bank, cooperative or RRB is 30 minutes (post offices are available at closer proximity). Furthermore, procedures for opening an account or seeking a loan are cumbersome and costly (with high rejection rates) and, as indicated by the RFAS-2003, clients have to pay hefty bribes (ranging from 10%-20% of the loan amount) to access loans, so that the ultimate cost to borrowers is very high (despite interest “caps”). On average, some 27% (and 48% in UP) of sample households who borrowed from an RRB report having to pay a bribe to get the loan, a little under 27% of households who borrowed from a commercial bank paid a bribe, and 10% of households who borrowed from a credit cooperative paid a bribe. The bribe amounts appear to vary from anywhere between 10% of the loan amount (in the case of banks) to 20% (in the case of cooperatives).Moreover, longer processing times for loans, together with bribes, could result in higher effective costs to borrowers and consequent credit rationing. It takes, on average, 33 weeks for a loan to be approved by a commercial bank9 (Table 5).
Table 5: Aspects of formal borrowing and its costs Bank RRB Coops Schemes Others Interest rate (median) % p.a. 12.5 11 11 14 14 Loan amount received as % of amount applied 91.8 88.2 83.5 86.6 93.9 Percentage households reporting bribes 26.8 27.0 9.7 27.27 23.21 Bribe as % of amount approved 10.1 18.2 19.9 42.3 8.3 Time taken to process a loan application (weeks) 33 28.5 24 89 14.3
Source: RFAS-2003. A third factor that makes formal banks unattractive for rural borrowers is that banks demand collateral, which poor rural borrowers lack. Indeed, the majority of loans extended by
appreciation of the interest rate risk involved in such investment allocation decisions, viewing G-Secs as risk-free assets). Income on sale of investments has been rising steadily over the past 5 years accounting for around 33% of operating profits in FY 2002-03. Simultaneously the share in total income of interest income on advances has fallen to levels below 40%. RBI, Trend and Progress of Banking in India, 2002-03. 9 High transaction costs of dealing with formal banks translate into a low frequency of transactions. According to the RFAS-2003, more than 60% of households with bank accounts report accessing their accounts at a frequency of less than once a month (62.3% of households with accounts in banks access their accounts less than once a month, while the same percentage amongst households with accounts in RRBs is 70.8).
10
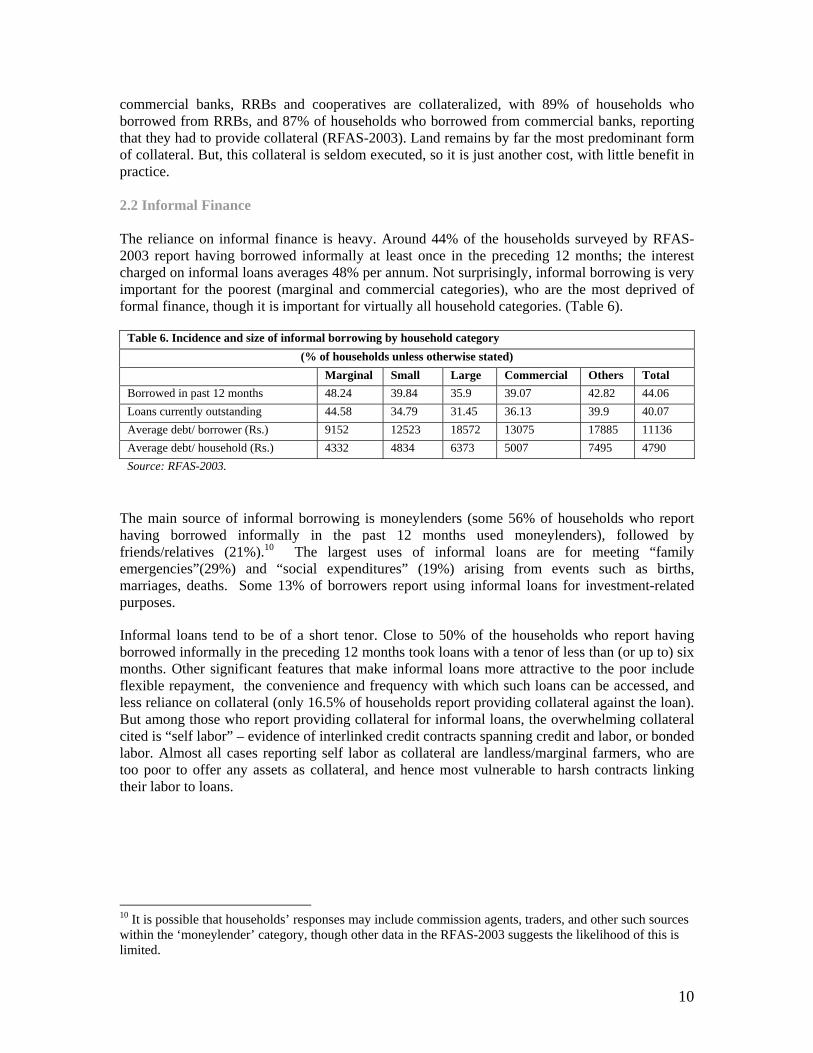
commercial banks, RRBs and cooperatives are collateralized, with 89% of households who borrowed from RRBs, and 87% of households who borrowed from commercial banks, reporting that they had to provide collateral (RFAS-2003). Land remains by far the most predominant form of collateral. But, this collateral is seldom executed, so it is just another cost, with little benefit in practice. 2.2 Informal Finance The reliance on informal finance is heavy. Around 44% of the households surveyed by RFAS- 2003 report having borrowed informally at least once in the preceding 12 months; the interest charged on informal loans averages 48% per annum. Not surprisingly, informal borrowing is very important for the poorest (marginal and commercial categories), who are the most deprived of formal finance, though it is important for virtually all household categories. (Table 6).
Table 6. Incidence and size of informal borrowing by household category (% of households unless otherwise stated)
Marginal Small Large Commercial Others Total Borrowed in past 12 months 48.24 39.84 35.9 39.07 42.82 44.06 Loans currently outstanding 44.58 34.79 31.45 36.13 39.9 40.07 Average debt/ borrower (Rs.) 9152 12523 18572 13075 17885 11136 Average debt/ household (Rs.) 4332 4834 6373 5007 7495 4790 Source: RFAS-2003.
The main source of informal borrowing is moneylenders (some 56% of households who report having borrowed informally in the past 12 months used moneylenders), followed by friends/relatives (21%).10 The largest uses of informal loans are for meeting “family emergencies”(29%) and “social expenditures” (19%) arising from events such as births, marriages, deaths. Some 13% of borrowers report using informal loans for investment-related purposes.
Informal loans tend to be of a short tenor. Close to 50% of the households who report having borrowed informally in the preceding 12 months took loans with a tenor of less than (or up to) six months. Other significant features that make informal loans more attractive to the poor include flexible repayment, the convenience and frequency with which such loans can be accessed, and less reliance on collateral (only 16.5% of households report providing collateral against the loan). But among those who report providing collateral for informal loans, the overwhelming collateral cited is “self labor” – evidence of interlinked credit contracts spanning credit and labor, or bonded labor. Almost all cases reporting self labor as collateral are landless/marginal farmers, who are too poor to offer any assets as collateral, and hence most vulnerable to harsh contracts linking their labor to loans.
10 It is possible that households’ responses may include commission agents, traders, and other such sources within the ‘moneylender’ category, though other data in the RFAS-2003 suggests the likelihood of this is limited.
11
III. New Approaches to Delivering Finance to the Poor: Microfinance in India
Inadequacies in rural access to formal finance and the seemingly extortionary terms of informal finance for the poor provide a strong need and ample space for innovative approaches to serve the financial needs of India’s rural poor. Over the last decade, efforts have been made by government, financial institutions, and NGOs, often in partnership, to develop new financial delivery approaches. These microfinance approaches have been designed to combine the safety and reliability of formal finance with the convenience and flexibility that are typically associated with informal finance. They typically involve providing thrift, credit and other financial services and products of very small amounts to the poor, with the aim to raise income levels and improve living standards. But microfinance still plays a modest role in India. At the All-India level, less than 5% of poor rural households have access to microfinance (as compared to 65% in Bangladesh) but significant variations exist across states. The southern states in particular, account for almost 75% of funds flowing under microfinance programs. By far the most successful model of microfinance in India, in terms of scale and outreach, is SHG Bank Linkage, with other models, such as the ‘Grameen-type’ independent microfinance institutions, lagging far behind.
3.1 SHG Bank Linkage: Linking Banks to Grassroots Borrowers There has been growing excitement about SHG Bank Linkage, and many believe it is destined to become the country’s dominant system of mass-outreach banking for the poor. The SHG model was started in the 1980s by social-development NGOs11, many of whom took up group-formation (especially of women) as their main tool. Having group members learn how to pool savings into loans – mostly small, short-term consumption loans – was seen as empowering disadvantaged women, socially and politically as well as financially. By 1992 the NGOs had, heroically, persuaded government to take the idea seriously. Legal obstacles were removed and subsidies made available so that SHGs could take bulk loans from banks that could be on-lent to group members who could use them to take up or expand microbusinesses. The model evolved so that SHG Bank Linkage today involves having the group save, and then linking it to a bank (usually the rural branch of a state-owned commercial bank, but also RRBs, cooperative banks, etc Funds saved by SHGs are placed in a group deposit account in the bank. The group then borrows from the bank (at about 12% per annum), using its saving and group guarantee as the collateral. To encourage banks to lend to SHGs, NABARD has provided subsidized refinancing support to banks, although the demand for such refinancing has declined as banks begin to discover that SHG lending is quite profitable, and characterized by default rates (less than 1%) that are, in fact, much lower than the rate of default on their regular lending portfolios (11%-12%). Banks typically provide the group a loan amounting to four times the group’s savings but, as the group matures, and based on the group’s track record, banks are ready to lend more. Borrowed and saved funds are rotated through lending within the group using flexible repayment schedules (usually monthly repayment); SHGs thus save, borrow and repay collectively. SHG funds may be distributed either to one or more members of the group – who are personally responsible for repayment to the group, or spent collectively by the group. The group is free to decide the interest 11 The two main NGOs to start this process were MYRADA in Karnataka and PRADAN in Rajasthan (and later in Tamil Nadu and Jharkhand)
12
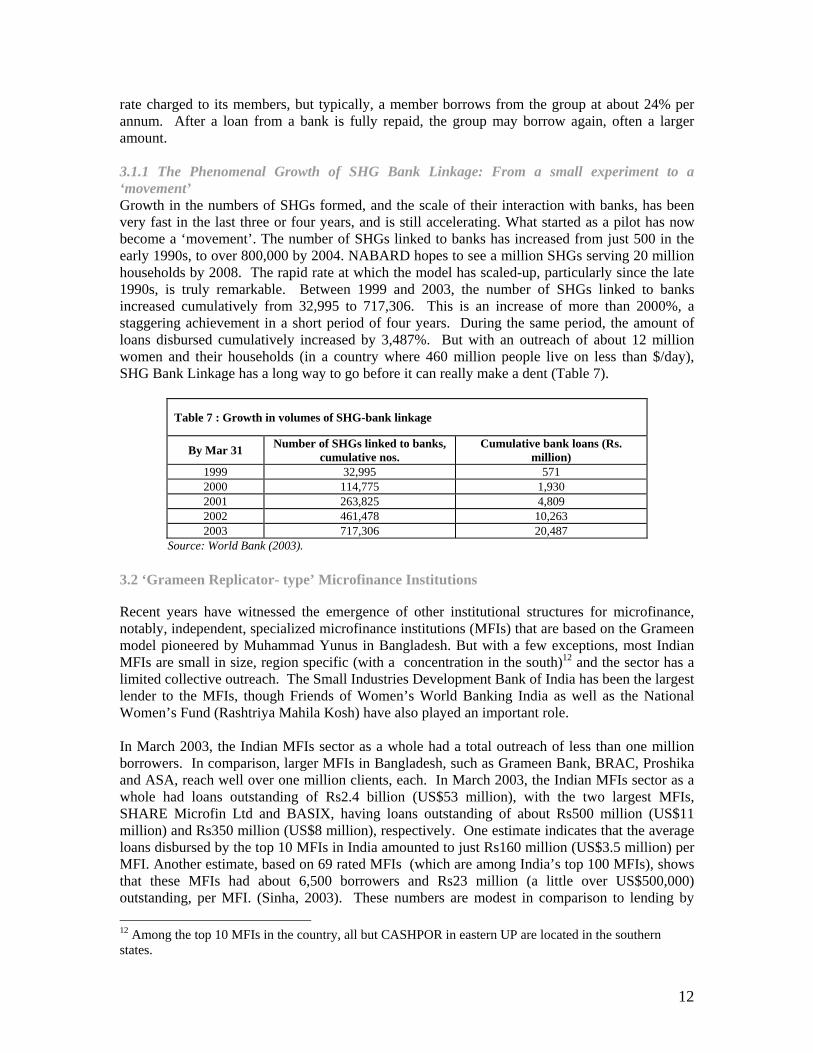
rate charged to its members, but typically, a member borrows from the group at about 24% per annum. After a loan from a bank is fully repaid, the group may borrow again, often a larger amount. 3.1.1 The Phenomenal Growth of SHG Bank Linkage: From a small experiment to a ‘movement’ Growth in the numbers of SHGs formed, and the scale of their interaction with banks, has been very fast in the last three or four years, and is still accelerating. What started as a pilot has now become a ‘movement’. The number of SHGs linked to banks has increased from just 500 in the early 1990s, to over 800,000 by 2004. NABARD hopes to see a million SHGs serving 20 million households by 2008. The rapid rate at which the model has scaled-up, particularly since the late 1990s, is truly remarkable. Between 1999 and 2003, the number of SHGs linked to banks increased cumulatively from 32,995 to 717,306. This is an increase of more than 2000%, a staggering achievement in a short period of four years. During the same period, the amount of loans disbursed cumulatively increased by 3,487%. But with an outreach of about 12 million women and their households (in a country where 460 million people live on less than $/day), SHG Bank Linkage has a long way to go before it can really make a dent (Table 7).
Table 7 : Growth in volumes of SHG-bank linkage
By Mar 31 Number of SHGs linked to banks, cumulative nos.
Cumulative bank loans (Rs. million)
1999 32,995 571 2000 114,775 1,930 2001 263,825 4,809 2002 461,478 10,263 2003 717,306 20,487
Source: World Bank (2003). 3.2 ‘Grameen Replicator- type’ Microfinance Institutions Recent years have witnessed the emergence of other institutional structures for microfinance, notably, independent, specialized microfinance institutions (MFIs) that are based on the Grameen model pioneered by Muhammad Yunus in Bangladesh. But with a few exceptions, most Indian MFIs are small in size, region specific (with a concentration in the south)12 and the sector has a limited collective outreach. The Small Industries Development Bank of India has been the largest lender to the MFIs, though Friends of Women’s World Banking India as well as the National Women’s Fund (Rashtriya Mahila Kosh) have also played an important role. In March 2003, the Indian MFIs sector as a whole had a total outreach of less than one million borrowers. In comparison, larger MFIs in Bangladesh, such as Grameen Bank, BRAC, Proshika and ASA, reach well over one million clients, each. In March 2003, the Indian MFIs sector as a whole had loans outstanding of Rs2.4 billion (US$53 million), with the two largest MFIs, SHARE Microfin Ltd and BASIX, having loans outstanding of about Rs500 million (US$11 million) and Rs350 million (US$8 million), respectively. One estimate indicates that the average loans disbursed by the top 10 MFIs in India amounted to just Rs160 million (US$3.5 million) per MFI. Another estimate, based on 69 rated MFIs (which are among India’s top 100 MFIs), shows that these MFIs had about 6,500 borrowers and Rs23 million (a little over US$500,000) outstanding, per MFI. (Sinha, 2003). These numbers are modest in comparison to lending by 12 Among the top 10 MFIs in the country, all but CASHPOR in eastern UP are located in the southern states.
13
MFIs in Bangladesh: Grameen Bank’s loan portfolio alone exceeds that of the entire microfinance sector in India by a factor of five whereas BRAC’s portfolio is more than three times that of all MFIs in India; both ASA’s and Proshika’s portfolios are also larger than that of the entire microfinance sector in India.
In addition to the relatively small scale of their operations, Indian MFIs also tend to have a narrow scope, offering a limited range of financial services beyond credit. Only a handful of MFIs, such as VSSU (West Bengal) offer savings as a service. Insurance is also provided by only a few MFIs. And only the three top MFIs in India offer a composite set of services to their customers. For example, SEWA Ahmedabad provides a combination of savings and credit through its Sri Mahila SEWA Urban Cooperative Bank and insurance services managed through its Vimo SEWA affiliate, which front ends for the Life Insurance Corporation (LIC) and a number of general insurance companies. Similarly, the BASIX group’s Krishna Bhima Samruddhi Local Area Bank, is able to provide all the services – savings, including daily deposits collected from the doorstep of its borrowers, credit for a range of purposes from crop loans to non-farm activities and to SHGs; and crop insurance to farmers under the Kisan Credit Card / Rashtriya Krishi Bima Yojana as well as a weather indexed crop product developed by ICICI Lombard. BASIX retails life insurance on behalf of AVIVA Life Insurance Company and provides livestock insurance to its borrowers through Royal Sundaram General Insurance Company.
SHARE, one of the three largest MFIs in India, has recently piloted, in partnership with ICICI Bank, a private sector bank, an innovative approach involving the securitization of the micro loan portfolios of MFIs. Two such deals have recently been completed in the state of AP. In the larger one, ICICI Bank paid US$4.3 million for a portfolio of 42,500 small loans from SHARE. SHARE will be responsible for collecting the loans. The securitization is not asset-backed; ICICI Bank will have as collateral instead a “first loss” guarantee of an 8% deposit from the total from Grameen Foundation. The approach has many advantages: ICICI Bank manages to reach borrowers it could never otherwise have approached, and palm off most of the administration to SHARE. This also helps it meet its government-set target of directing 40% of its loans to the “priority sectors”, including 18% to farmers. SHARE secures a new source of funds, off SHARE’s balance sheet, at a cost that is 3 to 4 percentage points cheaper than it pays for a bank loan. This will help SHARE meet its aim of increasing the number of borrowers from under 300,000 now to 1 million. The deal also helps create a new asset class for which there is demand among the more liquid investors. While such securitizations can be done for the better MFIs, for which credit ratings are available, replication would pose a serious challenge, given the paucity of reliable, independent information on the bulk of the MFIs and their loan portfolios. Also, at present, there is no secondary market for the securities, but ICICI bank is talking to CRISIL, a credit rating agency, about the prospects for its rating the paper, and is hoping that over time, other banks will enter the market too. The limited scale and scope of Indian MFIs, relative to the MFI giants in Indonesia and Bangladesh, reflects the following interrelated factors: • First, MFIs suffer from the lack of a sufficient pool of managerial and technical skills. As
microfinance is a specialized activity and given that many MFIs have evolved from NGOs that have otherwise been focusing on grant based activities, staff tend to have a stronger inclination towards social development issues and tend to possess limited skills in finance, accounting and business management. Expertise in internal controls, credit appraisal and risk management, MIS, financial control and management, financial analysis, business planning, systems development, new product design, etc. tends to be lacking.
14
• Second, and partly as a result of their managerial and technical weaknesses, Indian MFIs
today find it difficult to mobilize commercial funding. Most MFIs face a serious shortage of equity necessary to leverage debt and increase client outreach at a faster rate. Sa-Dhan, the leading network of MFIs in the country, projects a requirement of equity funds of Rs100 crores (US$22 million), that can be absorbed immediately by MFIs. ICICI Bank, that has partnership arrangements with 30 MFIs at present, with plans to increase this to around 50 MFIs in a year’s time, also projects the lack of equity for the second rung of MFIs (40-45 out of the 50 they plan to target) as being a constraint/requirement to scaled up debt financing by them. Also, banks like IDBI Bank indicate that while they are willing and interested in increasing the debt exposure to MFIs, lack of equity capital (and management capacity) amongst MFIs constrains them from doing so. Since 200013, debt financing from banks to MFIs has grown rapidly relative to earlier years – available data from four private sector banks shows that the banks’ exposure to MFIs is today in excess of Rs200 crores (US$44 million); this compares to SIDBI’s exposure of Rs120 crores, US$26 million) 14. However, this growth has been targeted at a relatively small set of 10-15 better MFIs and commercial banks are still risk averse when it comes to lending to a larger set of MFIs, pointing out that considerable potential to scale up commercial bank lending to MFIs exists. At present, the exposure of commercial banks to lending to MFIs constitutes a miniscule fraction (0.1%) of the balance sheets of these banks.
The cost of funds for Indian MFIs is relatively high, and unlike in Bangladesh and a number of other countries, the Indian MFI sector has not benefited from grants/subsidized funding. Unlike in, say, Bangladesh, where Palli Karma-Sahayak Foundation (PKSF) lends to MFIs at 4-6 per cent p.a. (less than half the market interest rate), Indian MFIs, right from inception, tend to raise debt (from SIDBI, FWWB or commercial banks) at market rates (between 11-13.5 per cent p.a.). While, in many ways, this is a more sustainable way to grow, in practice, the high cost of funds combined with problems in accessing equity, has meant that achieving profitability and growth has been more difficult for Indian MFIs than their counterparts in countries like Bangladesh.
• Third, the absence of an enabling policy, legal and regulatory framework is often cited by MFI representatives as a factor constraining their ability to access funds, and hence, scale-up. MFIs can mobilize deposits only if they convert themselves into an NBFC and receive an ‘investment grade’ rating from a corporate rating agency. This is difficult for most MFI-NBFCs; based on past examples, on account of the typically geographically concentrated and non-collateralized portfolios that MFIs have, rating agencies, in almost all cases, have not assigned the required credit rating. The minimum start-up capital requirement for registering as an NBFC (Rs20 million or US$450,000) is typically beyond the reach of most MFIs.15
13 The year 2000 corresponds to RBI allowing commercial banks lending to MFIs as constituting priority sector lending and also to the maturing and scaling up of some of the better MFIs in India. 14 In recent years, debt financing to MFIs from commercial banks, has increased significantly. These banks include Canara Bank, ICICI Bank, UTI Bank, Andhra Bank, HDFC Bank, ABN Amro Bank, IDBI Bank, amongst others. ICICI Bank, through a partnership model, has witnessed a growth of Rs100 crores in their debt portfolio to MFIs over the last year, taking the total portfolio to Rs120 crores, the same portfolio as SIDBI. IDBI Bank, HDFC Bank and UTI Bank also have an exposure together of over Rs80 crores to MFIs. 15 In Indonesia, for instance, the comparable minimum capital requirement ranges from US$58,000-232,000. In the Philippines, the start-up minimum capital requirement for rural banks is between US$68,000-170,000; this has prompted the conversion of many erstwhile microfinance institutions/NGOs into rural banks.
15
Similarly, the minimum capital requirements for insurance companies (Rs1 billion, or US$23 million) are high. MFIs have problems raising equity, too: NGOs are not allowed to invest in MFI equity, because of the charitable status of NGOs under Sections 11 and 12 of the Income Tax Act. Regulation on foreign direct investment (FDI) in MFIs dictates rather high minimum levels; foreign equity must be a minimum of US$500,000 for FDI upto 51%, US$5 million for FDI between 51-75%, and US$50 million for FDI 75-100%. Since 2002, MFIs are no longer allowed to raise debt from foreign donors and development finance institutions through the ‘External Commercial Borrowing’ (ECB) route. Furthermore, oversight is fragmented across many government agencies resulting in inefficiencies; a large number of government ministries/departments/agencies are responsible for MFIs, and coordination between them is poor.16
16 Issues affecting MFIs are handled by various government departments, including various departments of RBI (such as the Department of Non-Banking Supervision, which looks after NBFCs, and the Exchange Control Department).
16
IV. Evaluating SHG Bank Linkage 4.1 How Effective Has SHG Bank Linkage Been in Targeting the Poor? Although data available to us cannot answer this question directly, we can look at some indirect indicators on the relationship between SHGs and the poor using results of the RFAS-2003 for the states of AP and UP. 17
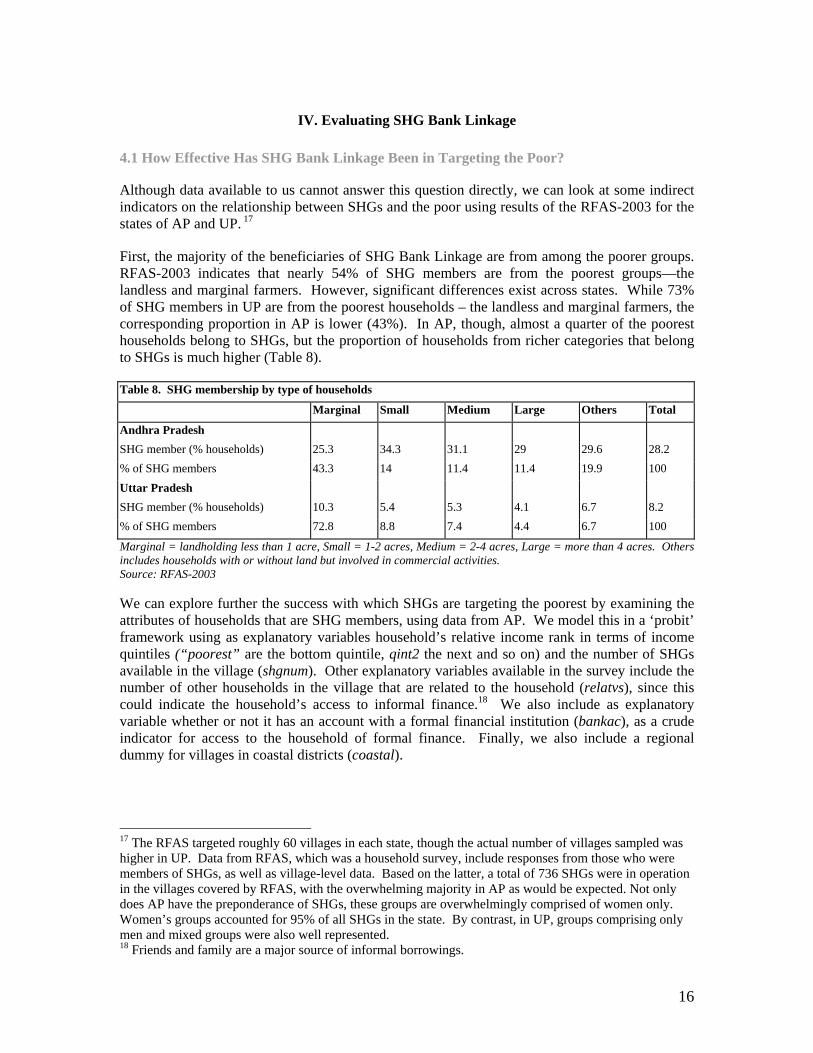
First, the majority of the beneficiaries of SHG Bank Linkage are from among the poorer groups. RFAS-2003 indicates that nearly 54% of SHG members are from the poorest groups—the landless and marginal farmers. However, significant differences exist across states. While 73% of SHG members in UP are from the poorest households – the landless and marginal farmers, the corresponding proportion in AP is lower (43%). In AP, though, almost a quarter of the poorest households belong to SHGs, but the proportion of households from richer categories that belong to SHGs is much higher (Table 8).
Table 8. SHG membership by type of households
Marginal Small Medium Large Others Total
Andhra Pradesh SHG member (% households) 25.3 34.3 31.1 29 29.6 28.2 % of SHG members 43.3 14 11.4 11.4 19.9 100 Uttar Pradesh SHG member (% households) 10.3 5.4 5.3 4.1 6.7 8.2 % of SHG members 72.8 8.8 7.4 4.4 6.7 100
Marginal = landholding less than 1 acre, Small = 1-2 acres, Medium = 2-4 acres, Large = more than 4 acres. Others includes households with or without land but involved in commercial activities. Source: RFAS-2003 We can explore further the success with which SHGs are targeting the poorest by examining the attributes of households that are SHG members, using data from AP. We model this in a ‘probit’ framework using as explanatory variables household’s relative income rank in terms of income quintiles (“poorest” are the bottom quintile, qint2 the next and so on) and the number of SHGs available in the village (shgnum). Other explanatory variables available in the survey include the number of other households in the village that are related to the household (relatvs), since this could indicate the household’s access to informal finance.18 We also include as explanatory variable whether or not it has an account with a formal financial institution (bankac), as a crude indicator for access to the household of formal finance. Finally, we also include a regional dummy for villages in coastal districts (coastal).
17 The RFAS targeted roughly 60 villages in each state, though the actual number of villages sampled was higher in UP. Data from RFAS, which was a household survey, include responses from those who were members of SHGs, as well as village-level data. Based on the latter, a total of 736 SHGs were in operation in the villages covered by RFAS, with the overwhelming majority in AP as would be expected. Not only does AP have the preponderance of SHGs, these groups are overwhelmingly comprised of women only. Women’s groups accounted for 95% of all SHGs in the state. By contrast, in UP, groups comprising only men and mixed groups were also well represented. 18 Friends and family are a major source of informal borrowings.
17
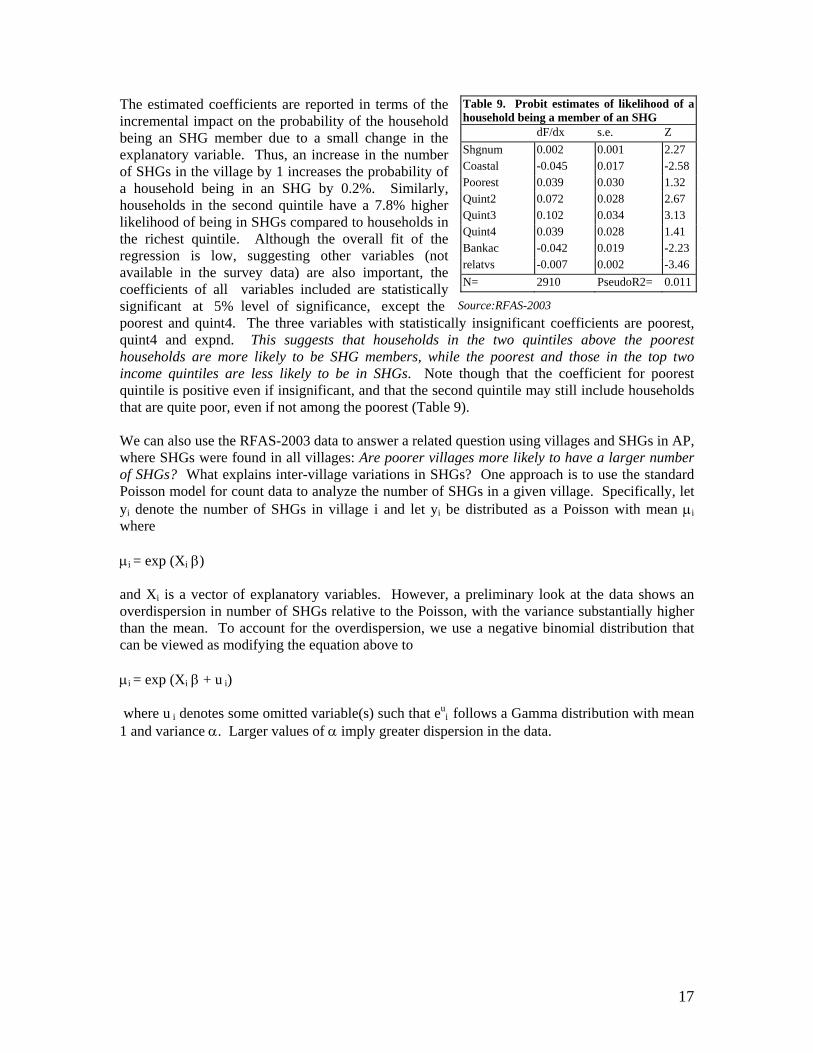
The estimated coefficients are reported in terms of the incremental impact on the probability of the household being an SHG member due to a small change in the explanatory variable. Thus, an increase in the number of SHGs in the village by 1 increases the probability of a household being in an SHG by 0.2%. Similarly, households in the second quintile have a 7.8% higher likelihood of being in SHGs compared to households in the richest quintile. Although the overall fit of the regression is low, suggesting other variables (not available in the survey data) are also important, the coefficients of all variables included are statistically significant at 5% level of significance, except the poorest and quint4. The three variables with statistically insignificant coefficients are poorest, quint4 and expnd. This suggests that households in the two quintiles above the poorest households are more likely to be SHG members, while the poorest and those in the top two income quintiles are less likely to be in SHGs. Note though that the coefficient for poorest quintile is positive even if insignificant, and that the second quintile may still include households that are quite poor, even if not among the poorest (Table 9). We can also use the RFAS-2003 data to answer a related question using villages and SHGs in AP, where SHGs were found in all villages: Are poorer villages more likely to have a larger number of SHGs? What explains inter-village variations in SHGs? One approach is to use the standard Poisson model for count data to analyze the number of SHGs in a given village. Specifically, let yi denote the number of SHGs in village i and let yi be distributed as a Poisson with mean μi where μi = exp (Xi β) and Xi is a vector of explanatory variables. However, a preliminary look at the data shows an overdispersion in number of SHGs relative to the Poisson, with the variance substantially higher than the mean. To account for the overdispersion, we use a negative binomial distribution that can be viewed as modifying the equation above to μi = exp (Xi β + u i) where u i denotes some omitted variable(s) such that eu
i follows a Gamma distribution with mean 1 and variance α. Larger values of α imply greater dispersion in the data.
Table 9. Probit estimates of likelihood of a household being a member of an SHG dF/dx s.e. Z Shgnum 0.002 0.001 2.27 Coastal -0.045 0.017 -2.58 Poorest 0.039 0.030 1.32 Quint2 0.072 0.028 2.67 Quint3 0.102 0.034 3.13 Quint4 0.039 0.028 1.41 Bankac -0.042 0.019 -2.23 relatvs -0.007 0.002 -3.46 N= 2910 PseudoR2= 0.011
Source:RFAS-2003
18
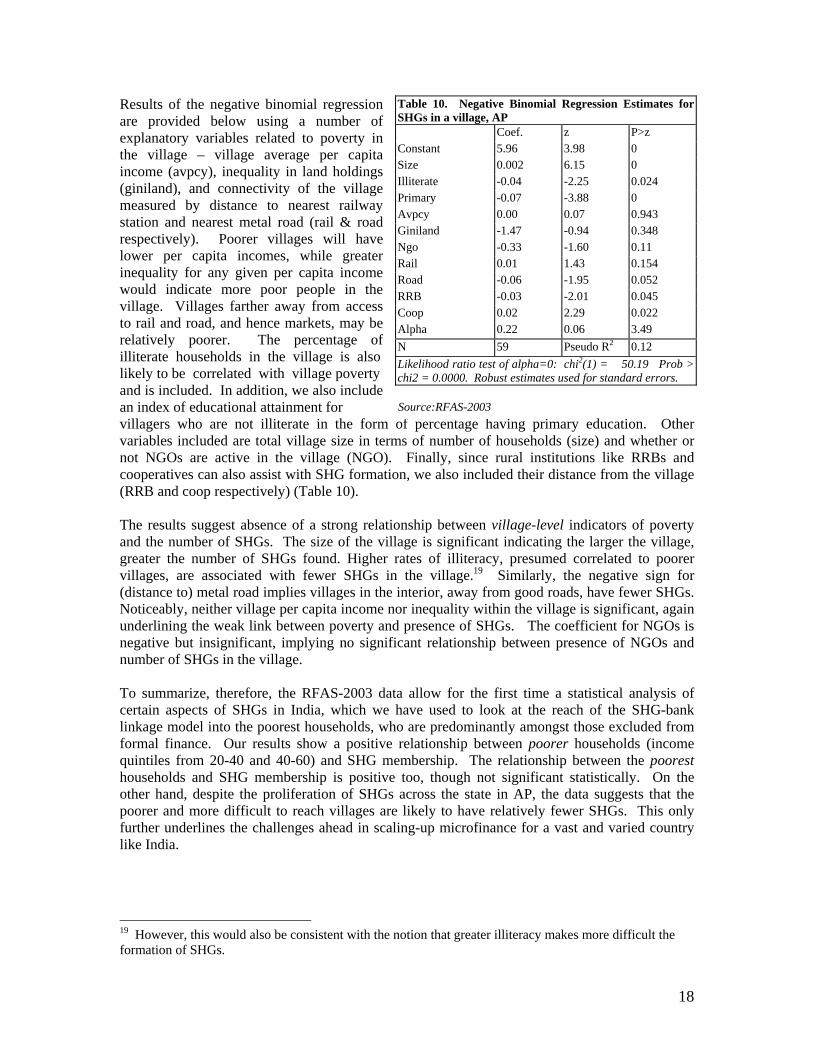
Results of the negative binomial regression are provided below using a number of explanatory variables related to poverty in the village – village average per capita income (avpcy), inequality in land holdings (giniland), and connectivity of the village measured by distance to nearest railway station and nearest metal road (rail & road respectively). Poorer villages will have lower per capita incomes, while greater inequality for any given per capita income would indicate more poor people in the village. Villages farther away from access to rail and road, and hence markets, may be relatively poorer. The percentage of illiterate households in the village is also likely to be correlated with village poverty and is included. In addition, we also include an index of educational attainment for villagers who are not illiterate in the form of percentage having primary education. Other variables included are total village size in terms of number of households (size) and whether or not NGOs are active in the village (NGO). Finally, since rural institutions like RRBs and cooperatives can also assist with SHG formation, we also included their distance from the village (RRB and coop respectively) (Table 10). The results suggest absence of a strong relationship between village-level indicators of poverty and the number of SHGs. The size of the village is significant indicating the larger the village, greater the number of SHGs found. Higher rates of illiteracy, presumed correlated to poorer villages, are associated with fewer SHGs in the village.19 Similarly, the negative sign for (distance to) metal road implies villages in the interior, away from good roads, have fewer SHGs. Noticeably, neither village per capita income nor inequality within the village is significant, again underlining the weak link between poverty and presence of SHGs. The coefficient for NGOs is negative but insignificant, implying no significant relationship between presence of NGOs and number of SHGs in the village. To summarize, therefore, the RFAS-2003 data allow for the first time a statistical analysis of certain aspects of SHGs in India, which we have used to look at the reach of the SHG-bank linkage model into the poorest households, who are predominantly amongst those excluded from formal finance. Our results show a positive relationship between poorer households (income quintiles from 20-40 and 40-60) and SHG membership. The relationship between the poorest households and SHG membership is positive too, though not significant statistically. On the other hand, despite the proliferation of SHGs across the state in AP, the data suggests that the poorer and more difficult to reach villages are likely to have relatively fewer SHGs. This only further underlines the challenges ahead in scaling-up microfinance for a vast and varied country like India.
19 However, this would also be consistent with the notion that greater illiteracy makes more difficult the formation of SHGs.
Table 10. Negative Binomial Regression Estimates for SHGs in a village, AP Coef. z P>z Constant 5.96 3.98 0 Size 0.002 6.15 0 Illiterate -0.04 -2.25 0.024 Primary -0.07 -3.88 0 Avpcy 0.00 0.07 0.943 Giniland -1.47 -0.94 0.348 Ngo -0.33 -1.60 0.11 Rail 0.01 1.43 0.154 Road -0.06 -1.95 0.052 RRB -0.03 -2.01 0.045 Coop 0.02 2.29 0.022 Alpha 0.22 0.06 3.49 N 59 Pseudo R2 0.12 Likelihood ratio test of alpha=0: chi2(1) = 50.19 Prob > chi2 = 0.0000. Robust estimates used for standard errors.
Source:RFAS-2003
19
4.2 Impact on Vulnerability of Poor Households Recent analyses indicate that access to loans under SHG Bank Linkage has contributed to the reduction in vulnerability of poor households.20 This reduction in vulnerability takes the form of: (1) Improvement in asset position: the program significantly improved the asset position (comprising livestock and consumer durables) of sample households. The average increase in assets was about 72%, from Rs6,843 to Rs11,793 in real terms (in one to three years). About 59% of households saw assets increase after groups were formed. Before the groups were formed, one in three households had no assets; after the groups were formed that changed to one in six; (2) Increase in savings: the average savings per member more than tripled, from Rs460 before the group to Rs1,444 after; (3) Changes in borrowing patterns and activities financed: average borrowing per household increased from Rs4,282 to Rs8,341. A shift was observed in the activities of the self-help groups, with a lower share of consumption and cultivation loans after the groups formed and a larger share of allied agricultural activities and small businesses; (4) Increase in employment: employment per household went from an average of 318 days a year to 375 days. The proportion of employment generated through nonfarm and off-farm activities increased; (5) Increase in consumption expenditure: consumption expenditure per household per month increased from Rs799 to Rs993. Per capita consumption increased from Rs197 per month to Rs249; (6) Impact on income: the average net income per household increased from Rs 20,177 to Rs26,889. About 43% of the incremental income generated was from nonfarm activities; (7) Impact on poverty: about 234 households were below the poverty line before groups were formed, compared with 122 after; (8) Social impact: 89% of members reported that, as a result of the group’s activities, they could meet officials from the government or from banks, while about 77% had never had that opportunity before. Changes were also reported regarding attitudes toward women. Further work should be conducted on the performance of the program from the point of view of the financial institutions that provide the linkage. This would provide lessons on the costs and benefits associated with the self-help group model, including which entity in the linkage covers what costs, what financial benefits banks get from the self-help group program, potential adjustments and innovations banks have made to the self-help group model, and incentives that motivate them to be involved in the program and in microfinance in general. It will be particularly important to analyze private banks to draw on their experiences and assess their potential to play a larger role in microfinance in India.
4.3 Some Lessons from SHG Bank Linkage In large part, the success of SHG Bank Linkage may be attributable to the fact that it is well aligned with Indian history and circumstances, and capitalizes on the country’s vast network of rural bank branches. The idea of local savings-and-loan clubs enjoying access to formal financial services by becoming corporate customers of banks is a good one and is practiced in a small way in many countries. A well-run club can keep its reserves at the bank and take bulk loans which it can on-lend to its members at a premium, covering its costs and rewarding its savers in the process. In India, this practice seems particularly appropriate on two counts: First, the country has active NGOs that have been zealous in their efforts towards group formation; NGOs view SHGs as having many benefits (such as women’s empowerment) beyond microfinance. Second, and perhaps even more important, SHG Bank Linkage seems particularly suited to India because
20 See, for example, Puhazhendhi and Satyasai (2000) and World Bank (2003).
20
the model capitalizes on the country’s vast (and unique) network of rural banks that are otherwise unable to reach out to the poor. Equally important, the success of SHG Bank Linkage underscores just how important a role skillful leadership, good policy, and a conducive legal and regulatory framework can play. Indeed, the role of government in establishing the necessary policy and legal framework, and the leadership role assumed by NABARD in championing the movement, cannot be underestimated. Government recognized the potential of SHG banking very early on in the movement’s history; NABARD was given the task of leading this effort and it took to task with exemplary diligence. It involved NGOs, commercial banks, RRBs and even cooperative banks in forming SHGs and then linking those up with nearby bank branches. Legal obstacles were removed and the RBI issued Guidelines in 1992, to experiment with a pilot of 500 SHGs to link with banks. This pilot program as well as the work of a number of NGOs was reviewed by a Working Group on Bank Lending to the Poor through NGOs and SHGs (1995) and detailed guidelines were drawn to encourage banks to use this method. To encourage banks to lend to SHGs, NABARD made available subsidized refinancing to banks for their lending to SHGs, so that the groups could take bulk loans from banks that could be on-lent to group members who could use them to take up or expand microbusinesses. (More recently, such subsidized refinancing to banks has been phased out, as banks have begun to see SHG lending as a profitable and commercially viable business). Further inducements for banks came in the form of allowing banks to count SHG lending towards their legal obligation to direct a fraction of their loans to the poor (‘priority sector lending’ obligations). It seemed an ideal way to realize an old Indian dream – to make the vast network of rural banks key suppliers of loans to the poor. 4.4 Key Concerns, Going Forward 4.4.1 Outreach The outreach of SHG Bank Linkage, however, remains limited, reaching only about 12 million women and their households (in a country where 460 million people live on less than $/day). The outstandings of the SHG program in March 2003 were around Rs10 billion (US$217 million), thus catering to 2.2% to 6.6% of the estimated demand. (Mahajan and Ramola, 2003). And loan amounts remain small. In 2003, SHG member households got an average of Rs1,766 as credit, after being in a group and meeting monthly for anywhere between 9 to 24 months. In 2002-03 only 22% of SHGs existing at the beginning of the year, received loans during the course of the year – even assuming a two year loan period, this means that more than half of the existing SHGs did not receive a loan during the year. In addition, the program remains concentrated in the southern states of India: the Southern region accounts for 65% of the SHGs linked and over 75% of the amount disbursed. In contrast, the North- eastern region accounts for 0.6% of the SHGs and 0.3% of the amount. Even the densely populated and highly poor Eastern region accounts for 12.6% of the SHGs linked and 5.9 % of the amount. 21 4.4.2 Sustainability Even its most enthusiastic supporters have voiced concerns about the sustainability of SHG Bank Linkage. An important concern relates to the lack of clarity over who is to play the key role of
21 NGOs that have promoted a large number of SHGs for linkage with banks such as the IDSSS Indore, NBJK, Hazaribagh, PRADAN all over Jharkhand, RGVN in Assam and Orissa, PREM in Orissa and VWS in West Bengal.
21
promoting and maintaining groups to ensure quality, and how the costs of doing so are to be met.22 In the early phase of the SHG movement, the tasks of promoting, nurturing and strengthening groups23, were performed by grass roots NGOs. However, in NABARD’s zeal to link a cumulative total of one million SHGs to banks by 2008, and as SHG Bank Linkage has caught the attention of politicians who view the program as an easy vote winner, quantitative targets on the number of groups to be promoted each year are overriding concerns about the quality of the groups promoted. Many of the recent groups have been promoted by institutions that either lack the required skills and local knowledge or ones that are driven by short term monetary incentives. Many groups have come together on an ad hoc basis, only because they want a loan. Inadequate attention to group quality could threaten the longer term credibility and viability of the entire program. Indeed, recent evidence suggests that the quality of groups is already beginning to suffer. A recent APMAS Survey in 2002 indicated that only 17% of all groups were of adequate quality for bank linkage and this was in a state which is considered the leader in the movement. Concerns have also been expressed about the financial sustainability of SHG Bank Linkage. The state-owned commercial banks and RRBs, which are the main players in SHG banking, have been increasing their lending to SHGs dramatically, but this has been done without much attention to the actual costs of doing business with SHGs. Banks have been lending to SHGs at interest rates of between 12% and 12.5%. Recently, two state-owned banks, the State Bank of India and Andhra Bank, have announced their intention to lend at 9% per annum, viewing SHG lending as a highly profitable business. Recent studies, however, indicate that the all inclusive costs of lending to SHGs are in fact much higher than what state-owned banks seem to think, and could range anywhere between 15% (which is what private banks like ICICI Bank charge when they lend to SHGs) to 28%. In a study of five RRB branches, Sinha (2003) shows that the all inclusive costs of lending to SHGs (taking into account the relatively high transaction costs of dealing with SHGs as well the costs of group formation, which banks are increasingly beginning to bear) would translate into interest rates of anywhere between 22% and 28% per year, and in one case, where the RRB was located in a low density, forested district, the costs translated into interest rates as high as 48% per annum. The SHG portfolio is a small part of the total bank lending, portfolio quality is good, and it may be possible to cross subsidize this, but unless banks charge interest rates to recover costs, the model’s financial viability and longer term sustainability may be jeopardized.
22 The estimated cost of creating and sustaining new and high quality SHGs is controversial, with NABARD claiming that it is as low as Rs1000 (US$22) per group and NGOs saying it takes as much Rs12,000 (US$267). The Ministry of Rural Development has established a norm of Rs10,000 (US$222) per group, which experts claim is realistic. 23 These tasks include inculcating in the groups a culture of savings and repayment, teaching them bookkeeping skills, strengthening their internal capacity to undertake administrative tasks (accounting, meeting minutes, correspondence, and negotiations with bankers) and commercial activities (business start-ups, marketing, and re-investment), ensuring the groups remain financially sustainable and have the ability to weather personal losses (accidents, sickness, death), and natural disasters, etc.
22
V. Meeting the Challenge of Scaling-Up Access to Finance for India’s Rural Poor 5.1 Scaling-Up Microfinance With significant achievements in recent years, SHG-Bank Linkage needs to be actively supported since, among alternatives in the microfinance sector, this is where there appears to be maximum potential for scaling-up, while leveraging on India’s vast network of rural banks. At the same time, in an economy as large and varied as India’s, there is much scope for diversity and new approaches. Government has an important role to play in creating space for innovation and a flexible architecture for new, independent microfinance institutions. What are the critical issues in scaling-up SHG Bank Linkage and various other models of microfinance in India? This section draws on lessons learned, on what to do and what not do to, based on the experience with SHG Bank Linkage and other microfinance approaches in India, and experience from around the world. 5.1.1 Enabling policy, legal and regulatory framework An enabling policy, legal and regulatory framework is critical to scaling-up. Such a framework is already in place for SHG Bank Linkage, and scaling-up the model would require the government to simply ensure that the existing framework is maintained. This would require ensuring that the model continues to have a champion with a clear leadership role – a task which NABARD has assumed with exemplary diligence by introducing policies and measures to encourage banks to lend to SHGs. And it would require the authorities to maintain a ‘hands-off’ regulatory policy. Government could play an important role in establishing an enabling policy, legal and regulatory framework for MFIs. While the success of individual MFIs is largely attributable to their visionary leaders, this is clearly not enough to mainstream the cause of MFIs. Advocates of MFIs argue that immediate measures needed include the following: (i) reducing minimum start-up capital requirements to facilitate the transformation of MFIs into NBFCs; (ii) encouraging multiple sources of equity for MFIs; (iii) facilitating MFIs to raise debt, including permitting MFIs to mobilize savings, with safeguards; (iv) developing a set of prudential norms that are more appropriate to institutions serving the poor, and set up supervision mechanisms around those norms. They argue that better policy coordination among the various government ministries/departments/agencies that cover MFI issues would also help greatly. Understandably, the Indian authorities appear reluctant to introduce tiered regulations for MFIs, as this would mean the regulation and supervision of a new class of financial institutions whose deposits would probably be guaranteed (at least implicitly) by government. An alternative to introducing tiered regulations could be for government to facilitate transitional funding (equity and debt) support to MFIs that would enable these institutions to graduate into formal institutions such as NBFCs or banks. One suggestion that has been floated recently in this context is for government to establish, in partnership with public and private financial institutions, and possibly donors, a microfinance equity and credit guarantee fund that would facilitate the outreach and sustainability of micro finance through the following instruments: (i) equity/quasi equity support to a set of competitively selected MFIs to facilitate their transformation into microfinance focused banks or NBFCs that operate as regulated financial entities; (ii) credit guarantees to commercial banks for lending to MFIs, so as to facilitate access by MFIs to commercial bank funding; (iii) credit enhancement product designed to enable MFIs to access capital markets, specifically bond markets.
23
5.1.2 Attention to quality, and the importance of financial sustainability Scaling-up SHG Bank Linkage requires attention to the quality and sustainability of groups, their promoters and lenders (banks). A strong focus on the quality of SHGs by their NGO promoters was a key factor in the success of this model in its pilot phase. But in recent years, growing concerns have emerged about group quality as well as the ability of partner banks to properly assess, monitor and manage risk on their SHG portfolios. Going forward, if SHG Bank Linkage is to be scaled-up, NABARD and its partners face several challenges,24 key among which include ensuring that high quality groups are created and maintained, and that concerns over numeric targets of group creation and linkage do not override attention to group quality and resilience. In particular, the success and sustainability of SHG Bank Linkage depends crucially upon greater clarity about who is to play the key role of maintaining quality, and how the costs of doing so are to be met. A clear strategy is required on how new groups will be promoted, and who will fund this. If NGOs remain involved as promoters and ‘minders’ of the groups, they will need to be paid to do so, yet in the long run, with their social-development perspective, NGOs are not ideal candidates for this role, and nor is it clear who are to be their long-term paymasters. But the banks themselves, whose business is financial services, are unlikely to want to do more than ensure that their loans are safe, and will not take on the time-consuming task of helping groups manage the bookkeeping of their internal savings and loan accounts. Left to themselves, without outside assistance, most groups will have great difficulty maintaining quality, and the poorer they are the truer this will be. 25 Equally, efforts need to focus on ensuring that banks price their loans to SHGs at rates that would cover their costs and ensure financial sustainability of SHG banking. Banks also need to focus more on monitoring and managing SHG lending risk. Similarly, attention is needed to ensure the quality of MFIs. Many Indian MFIs suffer from weak governance and management structures, and the absence of adequate internal controls and financial discipline – issues that must be addressed.
5.1.3 Clear targeting of clients Equally important is the need to ensure proper targeting of clients. The dual pursuit of social ends and financial profits is an ongoing tension for all in microfinance. While our analysis of SHG Bank Linkage indicates that the model has so far successfully targeted the poorer segments, mission drift is a common fear as pressures mount to serve richer clients with larger loans (and thereby to earn higher profits per loan since transaction costs per rupee tend to fall with loan size). Keeping focused on its target population is thus critical to the success of microfinance in India, as elsewhere. The experiences of Bangladesh, Indonesia and elsewhere offer some useful pointers for India. There has been much debate about how stringently to target, and how best to do it in practice. A first priority is to clearly determine who is being targeted and define eligibility rules. In Bangladesh, Grameen and BRAC employ eligibility rules to restrict attention to households 24 Some ideas on how this may be done are set out in Seibel (2001). For example, Seibel believes that SHG-Bank Linkages may be particularly appropriate for geographically remote areas which are hard to reach with more intensive approaches that require frequent contact with clients. In Bangladesh, too, SHG work has done best among tribal groups in such areas (see Matthew, 2003, writing about Ashrai, an NGO that uses SHG methods). 25 As Fisher and Sriram (2002) reminds us, we shouldn’t be naïve enough to believe that, just because a group of poor women come together to run a savings-and-loan club, they will be immune from the corrosive effects of poor management, confused accounting, capture of assets by the leadership, and other kinds of abuse.
24
holding under a half acre of land. Grameen expands the definition to also exclude households with more than the equivalent of an acre’s worth of assets. BRAC excludes households without a manual laborer. Others, like SafeSave, rely on geographic targeting, restricting attention to specific slums in Dhaka. Microfinance in Bangladesh has earned a reputation for maintaining a focus on women from functionally landless households (although this has softened in practice). In Indonesia, BRI has also focused on serving the under-served, but, in contrast, it has focused on low-income households (and not just those below the poverty line) and most clients are men. The eligibility rules, though, tend to be less stringent than they would seem at first. In practice, both Grameen and BRAC staff make exceptions to the half-acre rule, and some estimates suggest that as many as 30% of borrowers may be over the half-acre line. The deviations may reflect that land is low-quality or that households are large so that per capita holdings are relatively low. At other times, the rules may be stretched simply to give access to community members who will be promising program members. 5.1.4 Appropriate products and services and good staffing are critical to ensuring effectiveness The stretching of rules is kept in check by other practices which have a strong bearing on who is attracted to microfinance and who is turned away. Those practices include how products are designed, how staff are compensated, what messages are delivered from headquarters, and who is recruited onto staff. Group promoters from local communities are generally better able to target poorer households. Product design is another means of targeting. Lending in groups and sending staff to villages has been credited with much of microfinance’s appeal in Bangladesh, as in India. A critical but less-heralded breakthrough for Grameen was to create a loan product that allowed borrowers to repay in small, weekly installments. This suited poor households well, since they could repay out of the regular bits of income coming in daily or near-daily. Charging appropriate interest rates has also helped stem leakage of resources from target populations to those richer or politically-favored. On the savings side, BRI has tried to encourage broad access by maintaining very low minimum balances (US$0.57) and low minimum deposits for opening accounts. New depositors can start an account with 10,000 rupiah (just over US$1), and the new savings products have given BRI its most notable success in serving the poor. On the borrowing side, BRI requires borrowers to put up collateral to secure loans, but the bank has chosen to be very flexible in what it will accept, so that collateral is not a major constraint when seeking poor clients. A survey completed in 2000, for example, shows that 88% of non-customers had acceptable collateral of some sort. In order to push still further, BRI has instituted products that require no collateral at all for loans up to rupiah 2 million (US$225), offered at the discretion of the unit manager. 5.1.5 Inclusiveness and competition in the microfinance sector can generate high payoffs The inclusiveness of SHG Bank Linkage, which has involved a partnership between government, NGOs, and a range of rural banks (commercial banks, RRBs, cooperative banks) has already generated a strong payoff. Further gains in terms of outreach and financial sustainability may be reaped through involving private sector banks and MFIs in SHG Banking. Indeed, recent experiments indicate good prospects for scaling-up models that are variations of SHG Banking, and involve MFIs as intermediaries between SHGs and private sector banks (who want to enter the market, but don’t have the branch network). Encouraged by early results, the new private sector banks, most notably ICICI Bank, but also UTI Bank and HDFC Bank, are actively seeking exposure in the microfinance sector. While their
25
current exposure to microfinance is too small to make a difference to their overall portfolio, these newer banks are pursuing innovative approaches to microfinance – as a potential business and not merely as a social or priority sector lending obligation. Key innovations include a pilot scheme by ICICI bank that uses NGOs or MFIs26, traders, or local brokers (who are close to the farmer by the nature of their business), as intermediaries/ ‘service providers’ for loans to groups of small and marginal farmers. The tasks of loan appraisal, processing, management, collection, etc. are delegated to the NGO/MFI/intermediary but the loans are always on the books of the bank (ICICI funds the borrower directly and the loan does not pass through the NGO/MFIs). The bank provides an initial loan to the NGO/MFI to develop SHGs, but then requires that the NGO/MFI repay the loan in a few years and become a viable unit through charging service fees to the groups directly. Banks are also experimenting with an approach now termed the “Integrated Agricultural Service Provider” (IASP) approach. One version of this that has been piloted with successful results is the ICICI Bank Farmer Service Center operating model (Mahindra Shubhlabh model). Preliminary evidence suggests that this model reaches small farmers. Under this model, the bank identifies an IASP (Shubhlabh) that has a good relationship with farmers and provides genuine and timely information through extension services, and enters into a tripartite agreement with the IASP and the output buyer. Credit is provided to farmers on the recommendation of the IASP, the farmer pledges his produce to the output buyer at a market-based price, the IASP provides inputs to the farmer. Loan processing, disbursement and collection are effectively done by the IASP, while the credit decision remains nominally with the bank. At the end of the season, the farmer supplies the crop to the output buyer and the output buyer deducts the loan amount from the sale proceeds and remits the loan to ICICI Bank in full settlement of the loan amount. The IASP receives a service fee for the loan processing and supervision services (1.5% on recovered loans). The model creates a symbiotic relationship between the input supplier, financier and trader. This reduces transaction costs and the risk exposure of all parties and, therefore, presents a relatively low-cost way of serving the rural poor engaged in marginal or smaller farming. It helps improve information collection, reduces credit risk, and increases access to rural financing. Other variations on this model include trader farmer financing model (Rallis – HLL) in Haryana’s Basmati growing area, where Rallis, as an IASP, provides comprehensive field support with fortnightly checks and ensures pest control; and farmer financing coupled with insurance model, being piloted in Tamil Nadu’s cotton growing area (Appachi). The latter offers tailor-made insurance packages and bulk storage capacity to farmers in order to avoid contamination. Equally, there is space for independent, specialized MFIs in the Indian microfinance market that could provide the necessary competition to SHG Bank Linkage in the area of savings and credit provision, and also complement the services provided by SHG bank Linkage. Evidence from elsewhere in Asia, and particularly from Bangladesh and Indonesia, suggests that good, reliable, responsive, long-term MFIs for the poor can go a long way in improving access to finance. (Morduch and Rutherford, 2003). India faces a formidable challenge in creating mass-outreach retailers of the Grameen or BRI kind. Recent studies also indicate the key role that can be played by MFIs that provide composite services, given the wide array of financial transactions (both borrowing and lending, often simultaneously, and at all levels of income) that characterize the financial life of the poor (Ruthven, 2001; Patole and Ruthven, 2001). The RFAS-2003 also
26 ICICI Bank has launched a pilot effort for this jointly with Cashpor Micro Credit, a section 25 company specially set up for this purpose by Cashpor Financial and Technical Services Ltd, in the Chandauli district of Uttar Pradesh.
26
supports this conclusion. The poor are constantly borrowing, lending, saving, withdrawing, using and losing money, through contingencies, and calamities. They need someone to help them with all these transactions. Composite service providers are preferable from the viewpoint of reducing the number of agencies with whom a poor household must deal, thus reducing transaction costs. Moreover, if a composite agency has a good internal MIS, it can use the savings history of a household as a “collateral” for loans. Similarly, if the same agency provides insurance for lives or livelihoods, it will be more willing to give a loan. From the MFIs’ point of view, transaction costs come down as the same delivery system can be used, with the addition of training, software and some staff. As discussed above, the growth of the MFI sector is closely related to a more conducive policy, legal and regulatory framework. 5.1.6 Overcoming geographic concentration in microfinance Another issue of concern is that microfinance in India continues to be skewed in its geographical distribution. The underlying causes for this include the general malaise in the economy of the central, eastern and north eastern states, with very little resultant demand for credit among the subsistence poor, and the absence (for historical reasons) of good quality NGOs, that are willing to initiate microfinance programs in these states (there are a large number of small NGOs but all of them with limited experience and outreach) (Mahajan and Ramola, 2003). Expanding the reach of microfinance to states in central, eastern and north eastern India is not a challenge that can be met overnight. To begin with, overall economic growth has to pick up in these states. Investments are required in areas such as watershed development, small-scale irrigation, livestock up gradation and forest regeneration. Unfortunately, none of these are amenable to the “small, short and unsecured” nature of microcredit loans. These require long term, lumpy public investments. However, once made, they unlock the potential for enhancing the livelihoods of millions of poor people, moving them up from subsistence production to surplus production and thereby increasing the demand for credit. One simple example of this is the dramatic increase in the demand for credit once irrigation becomes available to erstwhile rain-fed farmers.
A proposal for increasing the number of good NGOs in the lesser-served states was made by the Tenth Five Year Plan Working Group on Poverty Alleviation Programs (Planning Commission, 2002), which recommended that well established NGOs be asked to set up branches in selected poor districts and that they be funded for this on an assured though declining basis for the first three to five years. The experience of the Rashtriya Gramin Vikas Nidhi and the Rashtriya Mahila Kosh in supporting hundreds of small NGOs all over the eastern region is useful in this regard and lessons from such experience need to be taken into account. Another proposal has been to incubate MFIs in poorer districts under the guidance of established MFIs. This particular proposal by BASIX, known as the “3+3+3 program” envisages supporting a local social entrepreneur with operating funds and on-lending funds till the operations reach break even in an estimated three years. 5.2 Making the Formal Financial Sector Better at Banking for the Poor There is a view that microfinance can, at minimum, serve as a quick way to deliver finance in the interim; the idea is to then graduate microfinance clients to formal finance institutions where they can access standard “individual” loans,27 possibly on a fully commercial basis. An immediate
27 Critics of the SHG movement argue that, like the not-so-poor, poor people, given the choice, prefer an individual service, prefer the simplicity of having a reliable retailer look after the bookkeeping instead of having to do it themselves, and prefer to avoid the risks involved in owning and managing their own mini-
27
problem arises in that there are no obvious lenders for SHG or MFI customers to graduate to – none yet are close to offering the reliability, convenience, continuity, and flexibility required by low-income customers. Nor is the notion of graduation built explicitly into the design of microfinance in India. In Indonesia, in contrast, Bank Rakyat Indonesia has worked closely with (and in fact supervises) the Badan Kredit Desa network, which has for some been a feeder to BRI. Even so, there is relatively little graduation overall from the BKDs to BRI, partly because BRI is only now developing products that work well for the smallest-scale clients. In Bangladesh, the pretext of graduation has been universally abandoned for lack of an appealing next step—and for the desire of NGOs to continue working with clients with whom they have developed relationships over many years. If the idea of graduation is a serious one in India, strong efforts must be made now to reform the rural finance markets and institutions (like the commercial banks and the RRBs) with an eye to improving the efficiency of the sector and designing services and products appropriate for small clients. Indeed, India’s vast network of rural banks potentially presents a tremendous advantage, and one on which the country could capitalize in delivering finance for the poor. Over the longer term, therefore, efforts to promote microfinance should go hand-in-hand with efforts to make the formal sector better at “banking the poor”, and both government and the private sector can play a critical role in this context. An immediate challenge is for formal sector institutions to introduce products and services that are not only reliable and available on a continuous basis, but are also flexible and convenient, and also to introduce measures that allow for low-cost ways of reaching the rural poor. Here, microfinance can offer some useful lessons to formal banks. Over the medium term, key reforms in government policy are required to improve the overall incentive framework, and the regulatory and legal system within which rural banks operate, so as to promote greater efficiency and competition in rural finance. 5.2.1 Low-cost ways of reaching the rural poor through the formal sector Currently, most banks operating in rural areas, the majority of which are state-owned banks, do not seem to be tailored to meet the needs of the rural poor in an efficient and effective manner. The responsibility for introducing more flexible products and services, that would better match the needs of the rural poor, rests with bankers. But Government, given its domination of rural finance institutions, also has an important role to play in spearheading change. In this context, microfinance offers a number of lessons for formal banks:
Introducing flexible products: Small rural clients prefer to borrow frequently, and repay in small installments; banks could usefully explore the possibility of offering new and more flexible loan products, like those offered by microfinance. Increased use by insurance companies, of the large and deep branch presence of the postal branch network28 (as well as the commercial bank network) for channeling insurance products, backed by adequate training of staff, could help lower transaction costs and improve access to insurance.
The need for composite financial services: While small rural borrowers seek savings and lending services, they also seek insurance (life, health, crop); bank branches in rural areas would do well
financial institution. This is especially true of the very poor, who are often illiterate and ill-equipped to maintain a good set of books for anything but the simplest inflexible transactions over short periods. See Morduch and Rutherford (2003). 28 RFAS-2003 data showed that post office branches had the closest proximity (2 kms on average) to rural clients compared to branches of commercial banks, RRBs and cooperatives (5 kms on average).
28
to explore opportunities to offer composite financial services, as they have begun to do in urban areas, and as some microfinanciers have begun to offer in rural and urban areas.
Simplification of procedures to open a bank account, access credit, etc. could also go a long way in encouraging the poor to bank with the formal sector, by reducing clients’ transaction costs. The KCC experiment is a move in the right direction, but it needs to be scaled-up and accompanied by other procedural changes.
Better staffing policies and doorstep banking: The high recovery rates of microfinance are associated with staffing policies that allow recruiting staff from the local area who understand clients’ needs, and a focus on doorstep banking. State-owned banks operating in rural areas currently do not have the flexibility to recruit staff locally, but staffing policies could be revisited. Doorstep banking is costly, but the gains from better recovery and cost savings from hiring local staff in rural branches could well outweigh the higher transaction costs of doorstep banking. Use of technology: Banks can use technology to drive down their transaction costs, for example, through the introduction of smart cards and biometrics. 5.2.2 Improving the incentive regime, and promoting competition Interest rates. One obvious area could be for Government to revisit its policy of setting interest rate “caps” on rural lending rates and “floors” on the deposit rates. As noted above, caps and floors have the opposite effect of what is intended – poor borrowers are cut off from access and end up paying higher interest rates to informal lenders. Meanwhile, banks face an implicit tax (cost) that is not insignificant. Revisiting the policy on ‘priority sector’ lending. Government should also consider revisiting its policy on priority sector lending requirements imposed on banks which, in any case, are not fully observed and often circumvented through such means as subscription by banks to NABARD and SIDBI bonds. One option, that would allow the most competitive lender to emerge in rural areas and minimize distortions, is for government to make the priority lending obligation “tradable”. The most competitive lender would then be paid by the less well placed banks to effectively take on their priority lending requirements for a price. Creating such a market for priority lending requirements would benefit both banks and the rural poor, who would be able to access finance from the most efficient and competitive institution. Entry of new private banks in rural finance. Some private banks such as ICICI Bank have shown a growing interest in entering India’s rural finance sector—and have introduced innovative approaches and financial products to reach the rural poor. Government needs to do what it takes to create an environment that would make it possible and profitable for interested private banks to enter the rural finance market. This would require liberalizing interest rates (see above) so that lending to small, rural clients can become a more profitable business for banks. It would also require revisiting branch licensing policies (private banks may be interested in buying up the branch networks of the government-owned rural banks). And it would require strengthening the supervision of rural banks so as to help wean out the good from the bad banks and create further space for new, private sector entrants. The entry of private banks could have a good demonstration effect for the public sector banks on how to reduce transaction costs in rural banking and how to make rural banking profitable. Restructuring the RRBs and rural cooperative banks. Restructuring the RRBs and rural cooperative banks poses a major challenge. Various Government-appointed task forces and committees have highlighted what needs to be done to deal with the weaker RRBs and
29
cooperative banks; the challenge really is to build consensus for reforms and implement the changes. As a first step, the regulation and supervision of these banks needs to be urgently strengthened. Prudential regulation standards related to capital adequacy, asset classification, income recognition and provisioning need to be upgraded and introduced in a phased manner, and the supervisory enforcement improved. Weaknesses in regulatory standards, poor enforcement and regulatory forbearance, have undermined market discipline and have contributed to the deep financial distress that characterizes many RRBs and cooperatives.
Better regulation and supervision would pave the way for the restructuring of rural banks. It would help wean out the adequately capitalized banks from the weaker banks (undercapitalized banks, and those that are insolvent). The proper enforcement of prudential norms would mean that the weaker banks are forced to address their problems through such means as mergers or closures. At the same time, this would need to be accompanied by operational restructuring, involving improvements in governance to reduce state interference, better management, staffing policies that allow banks to employ local staff who are familiar with the community and thereby better able to address the needs of their client, and the introduction of new products, such as loans with flexible repayment terms, and better services, such as door-step banking that can help better meet the needs of rural clients and minimize risk. In introducing new products and services for the rural poor, lessons could be drawn from microfinance. Beyond these measures, Government can also play an active role in other areas to facilitate increased efficiency of rural finance markets. Better laws and regulations governing financial transactions, a judiciary that can enforce contracts, the demarcation of property and improvements in land titling, better credit information, and an enhanced regulatory, supervisory and legal framework to support the development of price insurance products, price derivatives instruments and commodities futures markets can go a long way in helping India’s rural poor access finance on better terms.
30
References APEC, 2002 ‘Microbanking Development, Regulation and Supervision’, Chapter 2 of 2002 APEC Economic Outlook, Singapore: Asia Pacific Economic Cooperation Secretariat
CGAP, (2000) Focus Note No 18: Exploring Client Preferences in Microfinance: Some observations from SafeSave. Washington DC: World Bank.
Deshpande, Ramesh and Verma, Niraj (2003). “Review of Rural Finance Institutions in India”. Background paper prepared for the World Bank. World Bank, Washington DC.
Fernando, Nimal and Meyer, Richard (2002). “ASA – the Ford Motor Model of Microfinance,” ADB Finance for the Poor 3 (2), Manila: Asian Development Bank.
Fisher, Thomas and Sriram, M. S. (2002) Beyond Micro-Credit: Putting Development Back into Micro-Finance. New Delhi: Vistar.
Government of India, Ministry of Finance, (2001). “Report of the Joint Committee on Revitalization Support to Co-operative Credit Structure” (Patil Committee). New Delhi: Government of India.
Hashemi, Syed, Sidney Ruth Schuler, and Ann P. Riley (1996). “Rural Credit Programs and Women's Empowerment in Bangladesh,” World Development 24 (4): 635 - 653.
Hess, Ulrich and Klapper, Leora F. (2003). “The Use of New Products, Processes and Technology for the Delivery of Rural and Microfinance Loans in India”. Background paper prepared for the World Bank. World Bank, Washington DC.
Hickson, Robert (1999). Reaching extreme poverty: financial services for the very poor. Nairobi, Kenya: MicroSave-Africa.
Mahajan, Vijay and Ramola Gupta, Bharti (2003). “Microfinance in India: Banyan Tree and Bonsai”. Background paper prepared for the World Bank. World Bank, Washington DC.
Meyer, Richard (2002). “Microfinance, Poverty Alleviation, and Improving Food Security: Implications for India,” chapter in Rattan Lal, ed., Food Security and Environmental Quality. Boca Raton, Florida: CRC Press.
Morduch, Jonathan (1999a). “Between the Market and State: Can Informal Insurance Patch the Safety Net?” World Bank Research Observer 14 (2), August: 187 - 207.
Morduch, Jonathan (1999b). “The Microfinance Promise,” Journal of Economic Literature 37 (4), December:1569 - 1614.
Morduch, Jonathan and Rutherford, Stuart (2003). “Microfinance: analytical issues for India”, Background paper prepared for the World Bank. World Bank, Washington DC.
Mutesasira, Leonard (1999). “Savings and Needs: An Infinite Variety”, Kampala, MicroSave-Africa.
31
Patten, Richard and Jay Rosengard (1991). Progress with Profits: The Development of Rural Banking in Indonesia. San Francisco, CA: International Center for Economic Growth/HIID.
Rajan, Raghuram and Luigi Zingales (2003).Saving Capitalism from the Capitalists: How Open Financial Markets Challenge the Establishment and Spread Prosperity to Rich and Poor Alike.
Reddy, Y. V. (1999). “Future of Rural Banking.” Prof. G. Ram Reddy Third Endowment Lecture, Hyderabad, India, December 4, 1999.
RBI [Reserve Bank of India] (1954). All-India Credit Survey. Bombay: RBI.
RBI [Reserve Bank of India] (2004). “Report of the Advisory Committee on Flow of Credit to Agriculture and Related Activities from the Banking System”. (Vyas Committee). Mumbai: RBI.
RBI [Reserve Bank of India] (2000). “Report of the Task Force to study the Cooperative Credit System and Suggest Measures for its Strengthening”. (Capoor Committee). Mumbai: RBI.
Robinson, Marguerite (2001). The Microfinance Revolution. Washington, DC: The World Bank.
Rutherford, Stuart (1996). ASA, the Biography of an NGO. Dhaka, ASA.
Rutherford, Stuart (2000). The Poor and their Money. Delhi: Oxford University Press.
Rutherford, Stuart (2002). “Money Talks: Conversations with Poor Households in Bangladesh about Managing Money,” University of Manchester Institute for Development Policy and Management, Finance and Development Research Programme Paper 45.
Ruthven, Orlanda (2001). “Money Mosaics: Financial Choice and Strategy in a West Delhi Squatter Settlement,” University of Manchester Institute for Development Policy and Management, Finance and Development Research Programme Paper 32.
Ruthven, Orlanda and Kumar, Sushil (2002). “Fine-grain Finance: Financial Choice and Strategy Among the Poor in Rural North India,” University of Manchester Institute for Development Policy and Management, Finance and Development Research Programme Paper 57.
Srivastava, Pradeep and Shukla, Rajesh (2004). “Rural Financial Access Survey : Summary Findings”. Background paper prepared for the World Bank. World Bank, Washington DC.
Srivastava, Pradeep (2004): “Rural Credit and Finance in Uttar Pradesh: A Case study of Three Villages”. Background paper prepared for the World Bank. World Bank, Washington DC. Seibel, Hans Dieter (2001). “SHG Banking: A Financial Technology for Reaching Marginal Areas and the Very Poor.” Cologne, University of Cologne.
Sinha, Sanjay and Patole, Meenal (2002). “Microfinance and the Poverty of Financial Services: How the Poor in India could be Better Served,” University of Manchester Institute for Development Policy and Management, Finance and Development Research Programme Paper 56.
Thomas, Susan (2004). “Agriculture Commodity Markets in India: Policy Issues for Growth”. Background paper prepared for the World Bank. World Bank, Washington DC.
32
Todd, Helen (1996). Women at the Center: Grameen Bank Borrowers After One Decade. Dhaka: University Press Ltd.
World Bank (2003). “Microfinance in India: Issues, Challenges and Policy Options”. Washington DC: World Bank.
World Bank (2003a) “Improving Access to Finance in Brazil”. Washington DC: World Bank.
World Bank (2003b). “India: Development Policy Review: Sustaining Reform, Reducing Poverty”. Washington DC. World Bank.
World Bank (2004). Scaling-up Access to Finance for India’s Rural Poor. Report No. 30740-IN. Washington DC: World Bank.
Wright, Graham (2000). Microfinance Systems: Designing Quality Financial Services for the Poor. London: Zed Press; Dhaka: University Press Limited.
Yunus, Muhammad (2002). Grameen Bank II: Designed to Open New Possibilities. Dhaka: Grameen Bank. [Available at www.grameen-info.org/bank/bank2.html.]