Embed Size (px)
Citation preview
1
Scandinavian – Mediterranean
Rail Freight Corridor
Implementation Plan
2
Version Management
Date (Hour) Changed made by Organisation Summary of changes 29.06.2015 Sophie Ismaier Coordination Group 07.09.2015 Lars Stenegard ScanMed RFC VII 6.2 deleted, ERTMS text included 02.10.2015 Lars Stenegard ScanMed RFC Post 23rd ExB meeting comments inserted and crosscheck
footnotes 06.10.2015 Lars Stenegard ScanMed RFC Final Statement of the ExB on the issue of ERTMS included 22.10.2015 Lars Stenegard ScanMed RFC Final
3
TABLE OF CONTENTS
I. List of abbreviations ........................................................................................................................ 4 II. Introduction ..................................................................................................................................... 5
II.1. Legal Background ......................................................................................................................... 5
II.2. Aim of the Implementation Plan .................................................................................................. 6
II.3. General Objectives of ScanMed RFC ............................................................................................ 6
III. General Characteristics of ScanMed RFC ........................................................................................ 7 III.1. Corridor description .................................................................................................................... 7
III.2. Crossing points, overlapping sections and shared stretches .................................................... 13
IV. Organization of the ScanMed RFC ................................................................................................. 13 IV.1. Governance Structure ............................................................................................................... 13
IV.2. Communication ......................................................................................................................... 17
V. Essential Elements of the Transport Market Study ....................................................................... 19 V.1. Objectives of the TMS ................................................................................................................ 19
V.2. Catchment area .......................................................................................................................... 19
V.3.2. Analysis of corridor-related rail freight services ..................................................................... 24
V.3.3. Criteria for modal choice ......................................................................................................... 26
V.4. Evaluation of future transport market development ................................................................ 28
V.5. Conclusions and recommendations ........................................................................................... 34
VI. Investment Plan – Approach and Overview .................................................................................. 43 VI.1. List of Corridor-relevant investment projects ........................................................................... 43
VI.2. Plan for the implementation of interoperable systems ............................................................ 48
VI.3. Plan for the management of the capacity of rail freight ........................................................... 57
VII. Key performance indicators (KPIs) and monitoring ...................................................................... 58 VII.1. Quality ...................................................................................................................................... 58
VII.2. Capacity .................................................................................................................................... 60
VII.3. Availability ................................................................................................................................ 60
VIII. Measures ....................................................................................................................................... 60 VIII.1. Coordination of possessions ................................................................................................... 60
VIII.2. C-OSS ....................................................................................................................................... 61
VIII.3. Allocation of capacity .............................................................................................................. 62
VIII.4. Authorized applicants ............................................................................................................. 62
VIII.5. Traffic Management ................................................................................................................ 62
VIII.6. Corridor Information Document (CID) .................................................................................... 63
IX. Annexes ......................................................................................................................................... 64
4
I. List of abbreviations
B3 System Requirement Specification Baseline 3
CER Community of European Railways
CID Corridor Information Document
CIP Customer Information Platform
CNC Core network corridors
C-OSS Corridor One-Stop-Shop
CR Conventional rail
DG MOVE Directorate General Mobility and Transport
D/R Development and Review
HGV Heavy Goods Vehicle
EC European Commission
ERA European Rail Agency
ERTMS European Rail Traffic Management System
ETCS European Train Control System
ETISPlus European Transport Information System Plus1
EU European Union
ExB Executive Board
GSM-R Global System for Mobile communication – Railway
IM Infrastructure Manager
IWW Inland Waterways
KPI Key Performance Indicator
MB Management Board
MoS Motorways of the Sea
NUTS 2 /3 Nomenclature of Units for Territorial Statistics – Level 2 and Level 32
O/D Origin and Destination
PaP Pre-arranged Train Path
PCS Path Coordination System
PESTL Political, Economic, Social, Technical and Logistical Analysis
RAG Railway Advisory Group
RFC Rail Freight Corridor
RNE RailNetEurope
RU Railway Undertaking
SERAC Single European Rail Area Committee
SRS System Requirement Specification
SWL Single Wagon Load
SWOT Strength, Weaknesses, Opportunities and Threat Analysis
TAF/TSI Technical Specification for Interoperability of Telematic Application for Freight
TAG Terminals Advisory Group
TEN-T Trans-European Network for Transport
TIS Train Information System
TMS Transport Market Study
TSI Technical Specification for Interoperability
WG Working Group
1 http://www.etisplus.eu/default.aspx
2 http://ec.europa.eu/eurostat/c/portal/layout?p_l_id=629283&p_v_l_s_g_id=0
5
II. Introduction
II.1. Legal Background
The legal basis of the Scandinavian Mediterranean RFC (hereafter “ScanMed RFC”) consists of
Regulation (EU) No 913/2010, Art.48of Regulation (EU) No 1315/2013 and Art.29 of Regulation (EU)
No 1316/2013 and Directive 2012/34/EU:
REGULATION (EU) No 913/2010 OF THE EUROPEAN PARLIAMENT AND OF THE COUNCIL of 22
September 2010 concerning a European rail network for competitive freight;
Aim of the Regulation (EU) No 913/2010 is to foster the efficiency of international rail freight by
creating conditions under which “freight trains can (…) easily pass from one national network to
another.”3 It encloses such measures as the publication of coordinated pre-arranged
international train paths, the set-up of a corridor one-stop-shop to facilitate access of the
customer to these paths, and a better coordinated traffic management.
In its Annex, this Regulation originally defined nine initial freight corridors to be taken into
operation in November 2013 or 2015 and enclosed a Rail Freight Corridor 3 “Stockholm –
Malmö-Copenhagen-Hamburg-Innsbruck-Verona-Palermo” as one of these nine initial freight
corridors.
REGULATION (EU) No 1315/2013 OF THE EUROPEAN PARLIAMENT AND OF THE COUNCIL of 11
December 2013 on Union Guidelines for the development of the Trans-European Transport
Network and repealing Decision No 661/2010/EU;
Aim of Regulation (EU) No 1315/2013 is to update the frame of TEN-T policy by moving from
individual priority projects to a two-layer network approach composed of a comprehensive
network and of a core network – the latter being a subpart of the former. Within the core
network, major multimodal axes were distinguished on basis of their utmost European
importance. These axes, understood from an EU-perspective as the backbone of a Trans-
European Transport Network, were given as from 2014 specific attention in terms of EU-co-
funding. Correlatively, they were given individual governance under the concept of “core
network corridors” (CNC).
Unlike RFCs, which focus on operational measures, CNCs are strongly focused on infrastructure
planning and investment. However, duplication of activity is to be avoided, as RFCs and CNCs are
meant to coordinate their works4.
REGULATION (EU) No 1316/2013 OF THE EUROPEAN PARLIAMENT AND OF THE COUNCIL of 11
December 2013 establishing the Connecting Europe Facility, amending Regulation (EU) No
913/2010 and repealing Regulations (EC) No 680/2007 and (EC) No 67/2010;
Regulation (EU) No 1316/2013 is the financial component of the updated TEN-T policy frame. It
further encloses the principle of “aligning” RFCs to CNCs. By this is meant that:
a Core network corridor corresponds only to one RFC and vice versa;
RFCs will be prolonged in order to make both RFC and CNC maps more consistent with one
another
Based on these principles, Regulation (EU) No 1316/2013 amended the Annex to Regulation (EU)
No 913/2010. As a consequence, ScanMed RFC was extended to Oslo, Trelleborg, La Spezia,
3 Recital 5 of the introduction to Regulation (EU) No 913/2010
4 S. Art.48.1 of Regulation (EU) No 1315/2013
6
Livorno, Ancona, Taranto and Augusta. Entry into operation of the extensions is due until 3 years
after establishment according to the original timetable, i.e. until 10th November 2018, at the
latest.
DIRECTIVE 2012/34/EU OF THE EUROPEAN PARLIAMENT AND OF THE COUNCIL of 21
November 2012 establishing a single European railway area;
Also referred to as the Recast of the First Railway Package, Directive 2012/34/EU lays down the
rules applicable to the management of railway infrastructure and to rail transport activities, sets
the criteria applicable to the issuing, renewal or amendment of licenses by a Member State
intended for railway undertakings which are or will be established in the Union as well as it sets
the principles and procedures applicable to the setting and collecting of railway infrastructure
charges and the allocation of railway infrastructure capacity.
II.2. Aim of the Implementation Plan
According to Art.9 of Regulation (EU) No 913/2010, the Implementation Plan shall present all
measures and steps taken to establish ScanMed RFC until 10th November 2015. It defines core
concepts and updates corridor customers as well as the EU-Commission and the Ministries in charge
of transport on the frame in which the corridor is planned to go live.
In particular, the Implementation Plan encloses:
a description of the characteristics of the freight corridor, including bottlenecks,
the essential elements of the Transport Market Study,
the objectives for the freight corridors, in particular in terms of performance of the freight
corridor expressed as the quality of the service and the capacity of the freight corridor,
the indicative investment plan,
the measures to implement the provisions of Articles 12 to 19 of Regulation (EU) No
913/2010.
The Implementation Plan is reviewed and updated regularly.
II.3. General Objectives of ScanMed RFC
In the spirit of Regulation (EU) No 913/2010, the ultimate objective of which is to foster the
competitiveness of rail freight, the Executive Board defined general objectives of ScanMed RFC5,
which read as follows:
Corridor vision:
A well performing competitive corridor with seamless service and end to end control of train
movements and wagons
Quality objectives:
Integrated service planning with expedient service to applicants
Coordinated traffic management will ensure operation in line with timetable
Harmonized and user-friendly customer IT interfaces to allow end to end control
Capacity objectives:
Supply of high-quality train paths in line with market demand
Good interoperability and operational compatibility to increase commercial speed, pay-load
and efficiency
5 S. Annex II
7
Systematic mitigation of bottlenecks, in particular at national and system borders
Availability objectives:
Planned capacity available to applicants/users
Systematic contingency handling of recurrent causes for delays
Aligned business concept with terminals
For the monitoring of these General Objectives, Key Performance Indicators (KPIs) are defined and
explained in Chapter VII of the present document.
III. General Characteristics of ScanMed RFC
III.1. Corridor description
III.1.1. Corridor Routing
Definitions
Following Art.2.2.a of Regulation (EU) No 913/2010, ScanMed RFC consists of all designated railway
lines, including the infrastructure and its equipment, that connects two or more terminals along
principal and, where necessary, diversionary lines. The network of principal and diversionary lines
builds up the corridor routing.
Principal lines designate those sections of the corridor routing on which Pre-arranged train paths are
offered. Principal lines connect together at least the nodes mentioned in the Annex of Regulation
(EU) No 913/2010, and may connect the extensions as from November 2018 at the latest.
Diversionary lines designate those sections on which corridor trains may temporarily be re-routed,
for e.g. in case of traffic disturbances or of works affecting capacity on principal lines. Pre-arranged
paths are in principle not offered on diversionary lines. Specific circumstances, for e.g. works of
longer duration, may however lead to exceptionally offer Pre-arranged paths on diversionary lines as
well.
Expected lines designate those sections that are either secured or under construction, for this reason
yet or entirely in service but planned to be taken as part of the routing of ScanMed RFC after their
entry into operation.
ScanMed relevant terminals designate the installations provided along the freight corridor specially
arranged to allow either the loading and/or the unloading of goods onto/from freight trains, and the
integration of rail freight services with road, maritime, river and air services, and either the forming
or modification of the composition of freight trains6.
Feeders and outflow paths are paths with which Corridor trains are either brought from their origin
to the Rail Freight Corridor (feeder) or from Rail Freight Corridor to their destination (outflow path).
Corridor trains designate trains running on a path crossing at least one corridor border and allocated
by the C-OSS.
Corridor borders designate border-crossing points between two countries located on a line of the
Corridor.
Crossing points designate those nodes where two or more RFCs join or cross each other. A crossing
point may or may not be associated to overlapping sections.
6 Art.2.2.c of Regulation (EU) No 913/2010
8
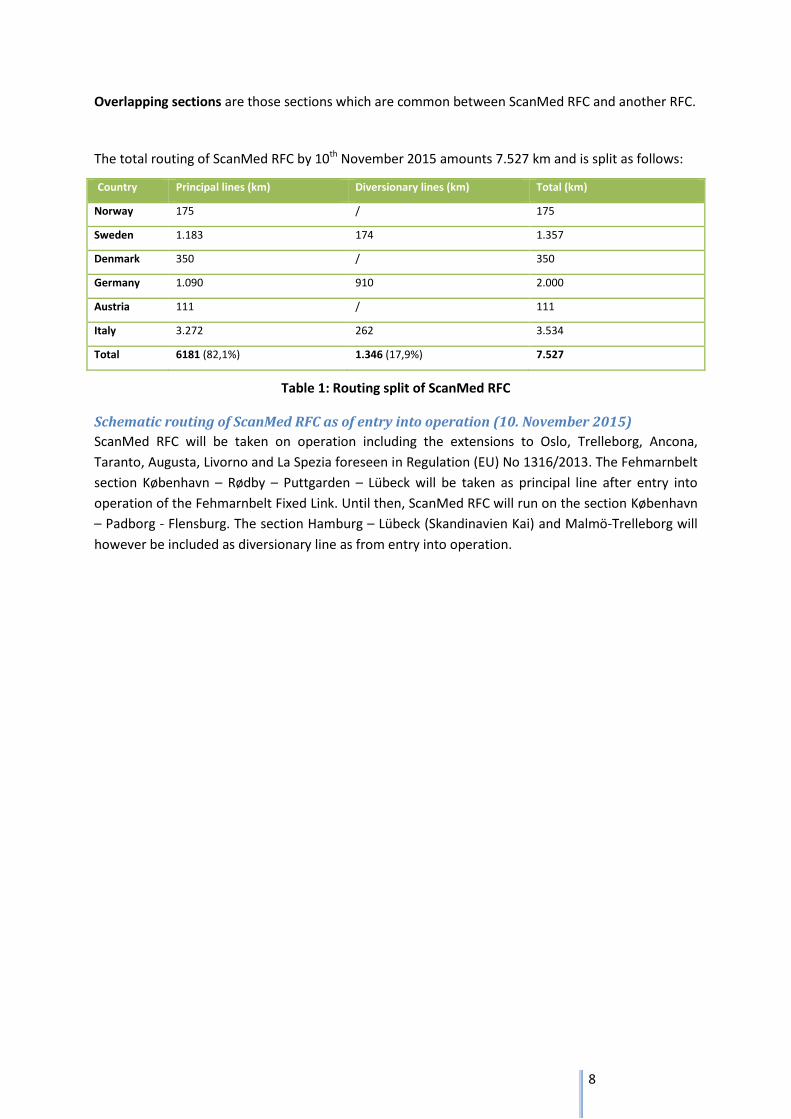
Overlapping sections are those sections which are common between ScanMed RFC and another RFC.
The total routing of ScanMed RFC by 10th November 2015 amounts 7.527 km and is split as follows:
Country Principal lines (km) Diversionary lines (km) Total (km)
Norway 175 / 175
Sweden 1.183 174 1.357
Denmark 350 / 350
Germany 1.090 910 2.000
Austria 111 / 111
Italy 3.272 262 3.534
Total 6181 (82,1%) 1.346 (17,9%) 7.527
Table 1: Routing split of ScanMed RFC
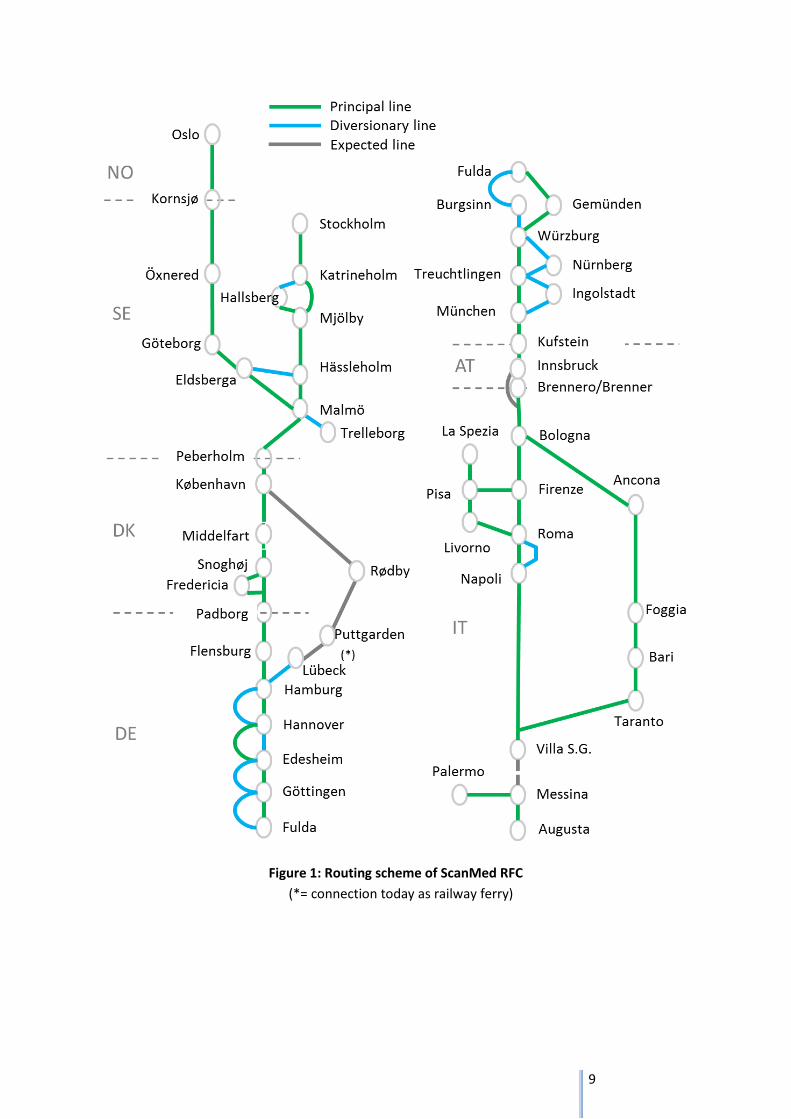
Schematic routing of ScanMed RFC as of entry into operation (10. November 2015)
ScanMed RFC will be taken on operation including the extensions to Oslo, Trelleborg, Ancona,
Taranto, Augusta, Livorno and La Spezia foreseen in Regulation (EU) No 1316/2013. The Fehmarnbelt
section København – Rødby – Puttgarden – Lübeck will be taken as principal line after entry into
operation of the Fehmarnbelt Fixed Link. Until then, ScanMed RFC will run on the section København
– Padborg - Flensburg. The section Hamburg – Lübeck (Skandinavien Kai) and Malmö-Trelleborg will
however be included as diversionary line as from entry into operation.
9
Figure 1: Routing scheme of ScanMed RFC
(*= connection today as railway ferry)
10
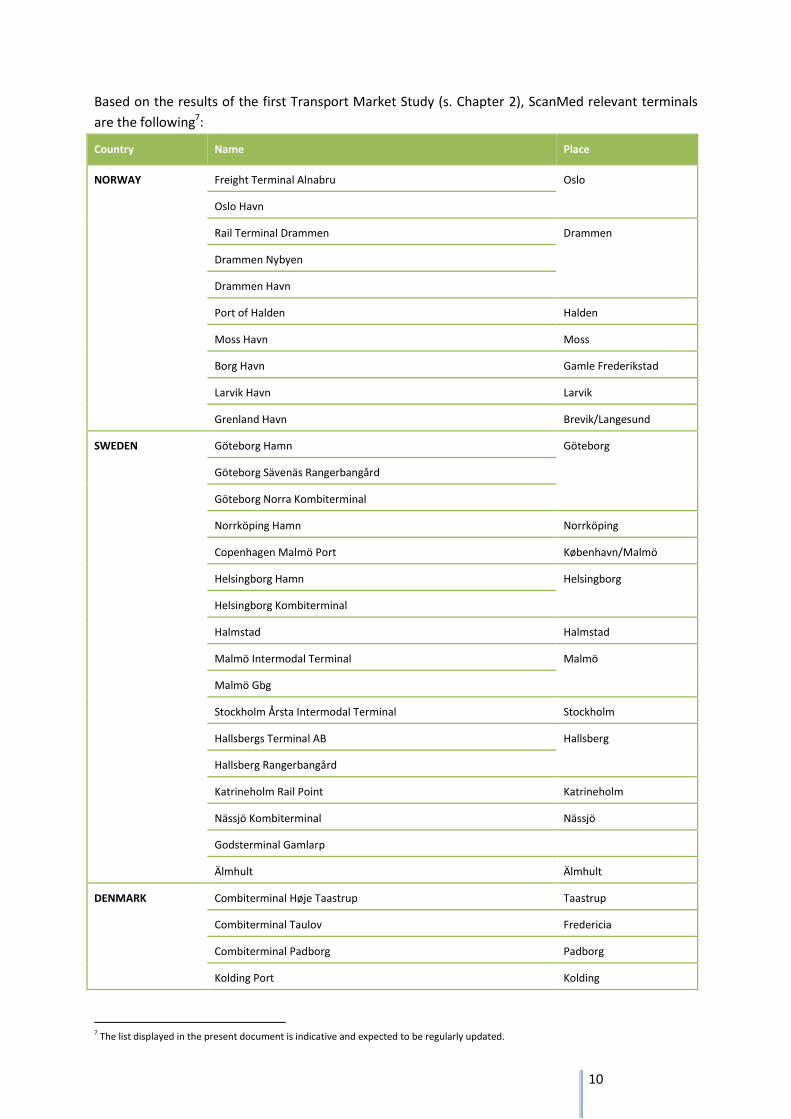
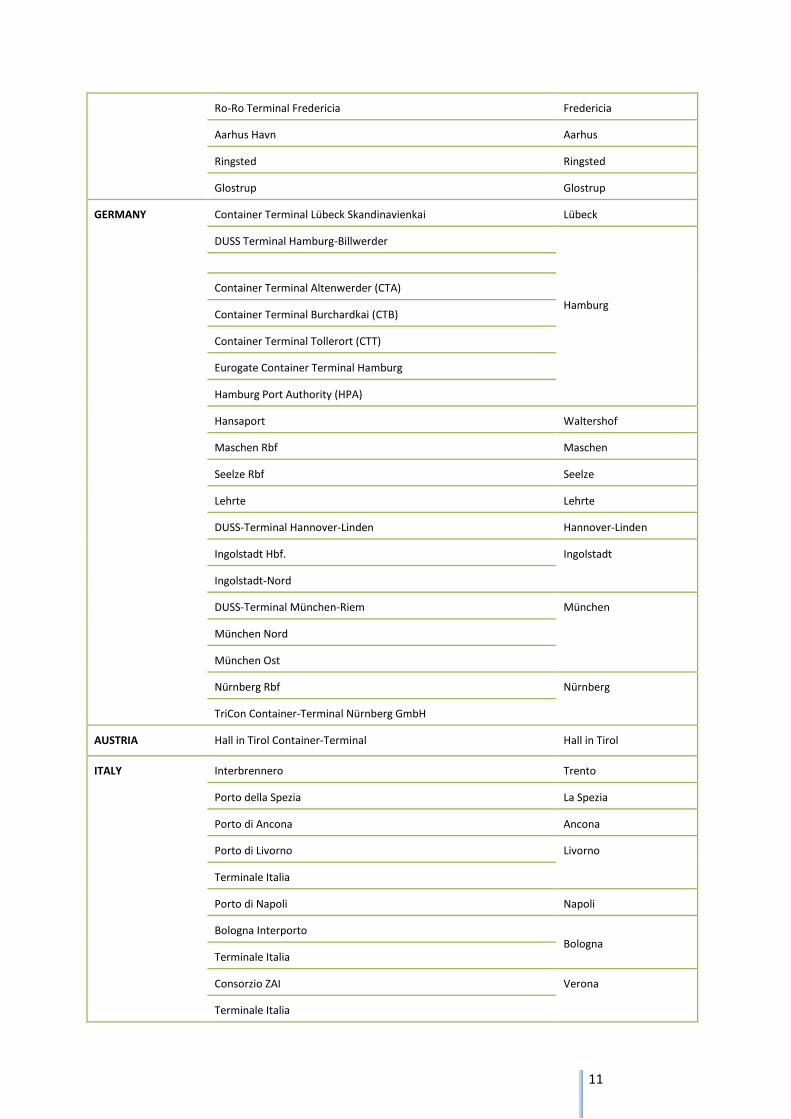
Based on the results of the first Transport Market Study (s. Chapter 2), ScanMed relevant terminals
are the following7:
Country Name Place
NORWAY Freight Terminal Alnabru Oslo
Oslo Havn
Rail Terminal Drammen Drammen
Drammen Nybyen
Drammen Havn
Port of Halden Halden
Moss Havn Moss
Borg Havn Gamle Frederikstad
Larvik Havn Larvik
Grenland Havn Brevik/Langesund
SWEDEN Göteborg Hamn Göteborg
Göteborg Sävenäs Rangerbangård
Göteborg Norra Kombiterminal
Norrköping Hamn Norrköping
Copenhagen Malmö Port København/Malmö
Helsingborg Hamn Helsingborg
Helsingborg Kombiterminal
Halmstad Halmstad
Malmö Intermodal Terminal Malmö
Malmö Gbg
Stockholm Årsta Intermodal Terminal Stockholm
Hallsbergs Terminal AB Hallsberg
Hallsberg Rangerbangård
Katrineholm Rail Point Katrineholm
Nässjö Kombiterminal Nässjö
Godsterminal Gamlarp
Älmhult Älmhult
DENMARK Combiterminal Høje Taastrup Taastrup
Combiterminal Taulov Fredericia
Combiterminal Padborg Padborg
Kolding Port Kolding
7 The list displayed in the present document is indicative and expected to be regularly updated.
11
Ro-Ro Terminal Fredericia Fredericia
Aarhus Havn Aarhus
Ringsted Ringsted
Glostrup Glostrup
GERMANY Container Terminal Lübeck Skandinavienkai Lübeck
DUSS Terminal Hamburg-Billwerder
Hamburg
Container Terminal Altenwerder (CTA)
Container Terminal Burchardkai (CTB)
Container Terminal Tollerort (CTT)
Eurogate Container Terminal Hamburg
Hamburg Port Authority (HPA)
Hansaport Waltershof
Maschen Rbf Maschen
Seelze Rbf Seelze
Lehrte Lehrte
DUSS-Terminal Hannover-Linden Hannover-Linden
Ingolstadt Hbf. Ingolstadt
Ingolstadt-Nord
DUSS-Terminal München-Riem München
München Nord
München Ost
Nürnberg Rbf Nürnberg
TriCon Container-Terminal Nürnberg GmbH
AUSTRIA Hall in Tirol Container-Terminal Hall in Tirol
ITALY Interbrennero Trento
Porto della Spezia La Spezia
Porto di Ancona Ancona
Porto di Livorno Livorno
Terminale Italia
Porto di Napoli Napoli
Bologna Interporto Bologna
Terminale Italia
Consorzio ZAI Verona
Terminale Italia
12
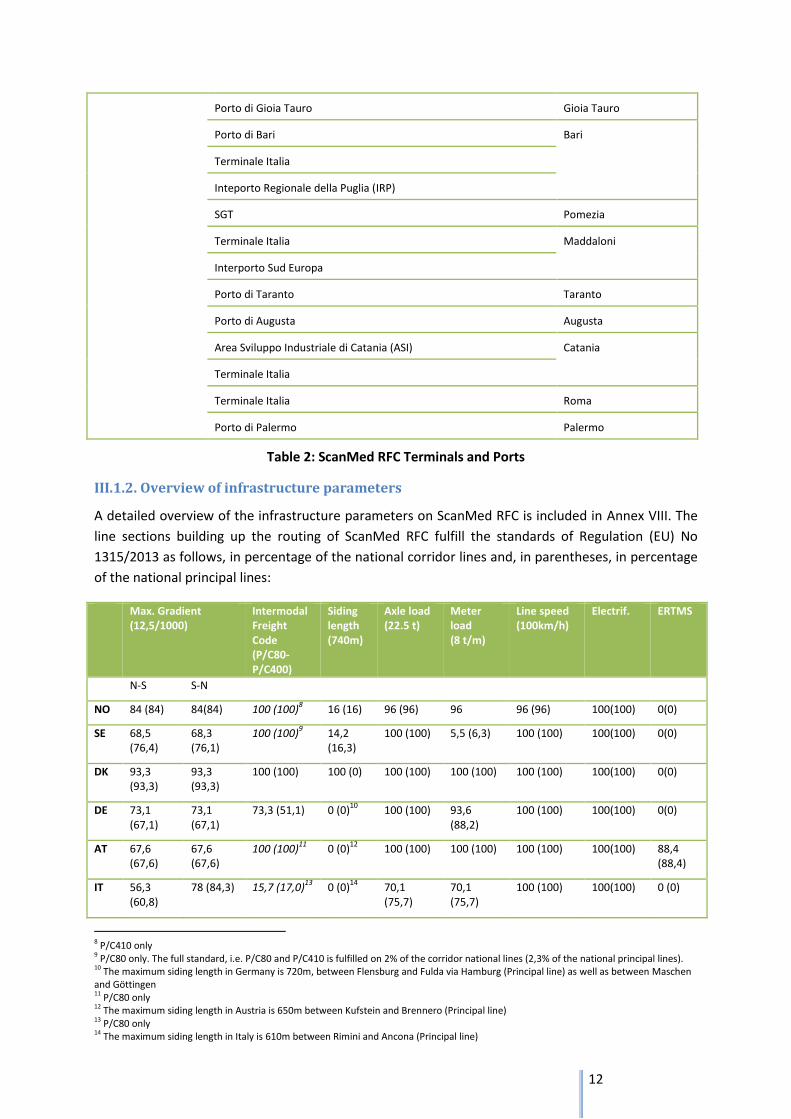
Porto di Gioia Tauro Gioia Tauro
Porto di Bari Bari
Terminale Italia
Inteporto Regionale della Puglia (IRP)
SGT Pomezia
Terminale Italia Maddaloni
Interporto Sud Europa
Porto di Taranto Taranto
Porto di Augusta Augusta
Area Sviluppo Industriale di Catania (ASI) Catania
Terminale Italia
Terminale Italia Roma
Porto di Palermo Palermo
Table 2: ScanMed RFC Terminals and Ports
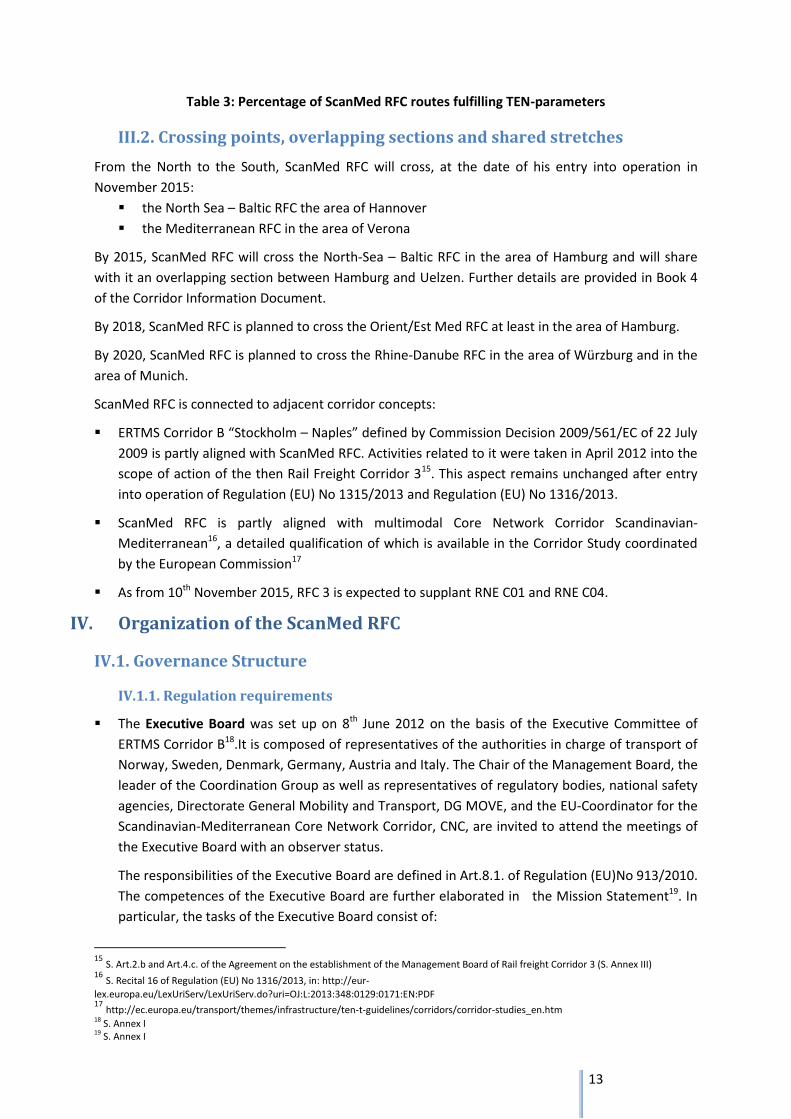
III.1.2. Overview of infrastructure parameters
A detailed overview of the infrastructure parameters on ScanMed RFC is included in Annex VIII. The
line sections building up the routing of ScanMed RFC fulfill the standards of Regulation (EU) No
1315/2013 as follows, in percentage of the national corridor lines and, in parentheses, in percentage
of the national principal lines:
Max. Gradient (12,5/1000)
Intermodal Freight Code (P/C80-P/C400)
Siding length (740m)
Axle load (22.5 t)
Meter load (8 t/m)
Line speed (100km/h)
Electrif.
ERTMS
N-S S-N
NO 84 (84) 84(84) 100 (100)8 16 (16) 96 (96) 96 96 (96) 100(100) 0(0)
SE 68,5 (76,4)
68,3 (76,1)
100 (100)9 14,2
(16,3) 100 (100) 5,5 (6,3) 100 (100) 100(100) 0(0)
DK 93,3 (93,3)
93,3 (93,3)
100 (100) 100 (0) 100 (100) 100 (100) 100 (100) 100(100) 0(0)
DE 73,1 (67,1)
73,1 (67,1)
73,3 (51,1) 0 (0)10
100 (100) 93,6 (88,2)
100 (100) 100(100) 0(0)
AT 67,6 (67,6)
67,6 (67,6)
100 (100)11
0 (0)12
100 (100) 100 (100) 100 (100) 100(100) 88,4 (88,4)
IT 56,3 (60,8)
78 (84,3) 15,7 (17,0)13
0 (0)14
70,1 (75,7)
70,1 (75,7)
100 (100) 100(100) 0 (0)
8 P/C410 only 9 P/C80 only. The full standard, i.e. P/C80 and P/C410 is fulfilled on 2% of the corridor national lines (2,3% of the national principal lines). 10 The maximum siding length in Germany is 720m, between Flensburg and Fulda via Hamburg (Principal line) as well as between Maschen and Göttingen 11 P/C80 only 12 The maximum siding length in Austria is 650m between Kufstein and Brennero (Principal line) 13 P/C80 only 14 The maximum siding length in Italy is 610m between Rimini and Ancona (Principal line)
13
Table 3: Percentage of ScanMed RFC routes fulfilling TEN-parameters
III.2. Crossing points, overlapping sections and shared stretches
From the North to the South, ScanMed RFC will cross, at the date of his entry into operation in
November 2015:
the North Sea – Baltic RFC the area of Hannover
the Mediterranean RFC in the area of Verona
By 2015, ScanMed RFC will cross the North-Sea – Baltic RFC in the area of Hamburg and will share
with it an overlapping section between Hamburg and Uelzen. Further details are provided in Book 4
of the Corridor Information Document.
By 2018, ScanMed RFC is planned to cross the Orient/Est Med RFC at least in the area of Hamburg.
By 2020, ScanMed RFC is planned to cross the Rhine-Danube RFC in the area of Würzburg and in the
area of Munich.
ScanMed RFC is connected to adjacent corridor concepts:
ERTMS Corridor B “Stockholm – Naples” defined by Commission Decision 2009/561/EC of 22 July
2009 is partly aligned with ScanMed RFC. Activities related to it were taken in April 2012 into the
scope of action of the then Rail Freight Corridor 315. This aspect remains unchanged after entry
into operation of Regulation (EU) No 1315/2013 and Regulation (EU) No 1316/2013.
ScanMed RFC is partly aligned with multimodal Core Network Corridor Scandinavian-
Mediterranean16, a detailed qualification of which is available in the Corridor Study coordinated
by the European Commission17
As from 10th November 2015, RFC 3 is expected to supplant RNE C01 and RNE C04.
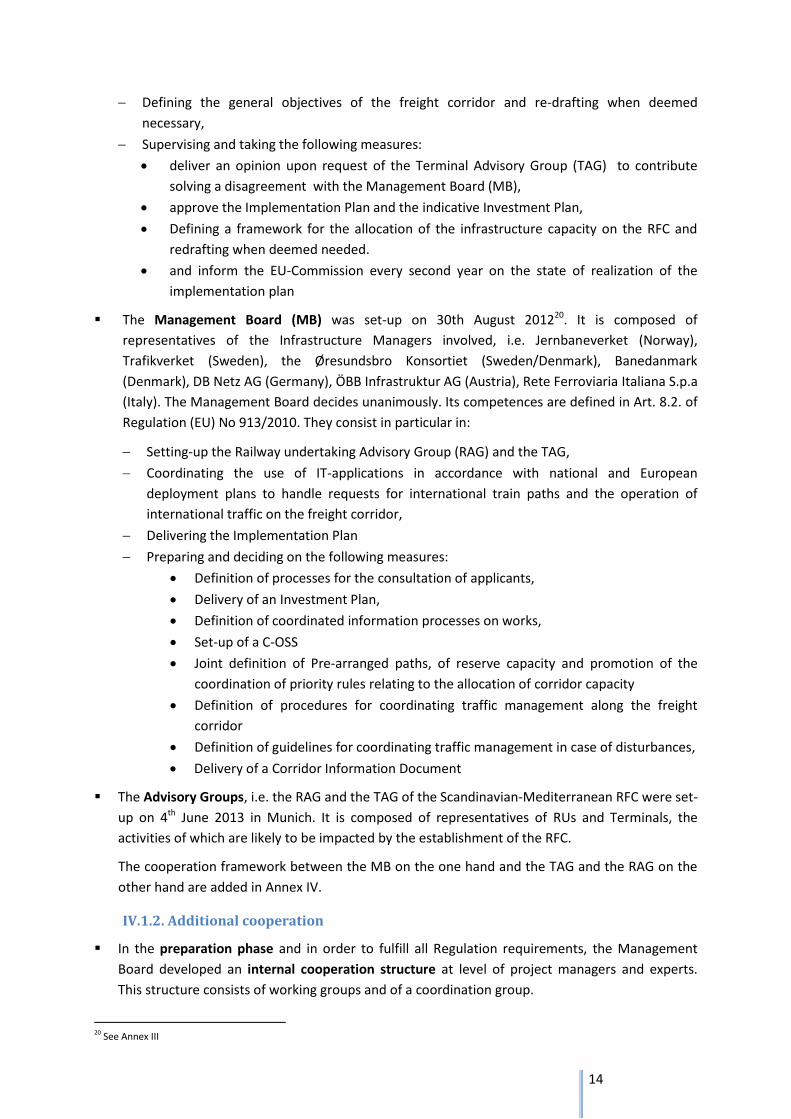
IV. Organization of the ScanMed RFC
IV.1. Governance Structure
IV.1.1. Regulation requirements
The Executive Board was set up on 8th June 2012 on the basis of the Executive Committee of
ERTMS Corridor B18.It is composed of representatives of the authorities in charge of transport of
Norway, Sweden, Denmark, Germany, Austria and Italy. The Chair of the Management Board, the
leader of the Coordination Group as well as representatives of regulatory bodies, national safety
agencies, Directorate General Mobility and Transport, DG MOVE, and the EU-Coordinator for the
Scandinavian-Mediterranean Core Network Corridor, CNC, are invited to attend the meetings of
the Executive Board with an observer status.
The responsibilities of the Executive Board are defined in Art.8.1. of Regulation (EU)No 913/2010.
The competences of the Executive Board are further elaborated in the Mission Statement19. In
particular, the tasks of the Executive Board consist of:
15
S. Art.2.b and Art.4.c. of the Agreement on the establishment of the Management Board of Rail freight Corridor 3 (S. Annex III) 16
S. Recital 16 of Regulation (EU) No 1316/2013, in: http://eur-
lex.europa.eu/LexUriServ/LexUriServ.do?uri=OJ:L:2013:348:0129:0171:EN:PDF 17
http://ec.europa.eu/transport/themes/infrastructure/ten-t-guidelines/corridors/corridor-studies_en.htm 18 S. Annex I 19 S. Annex I
14
Defining the general objectives of the freight corridor and re-drafting when deemed
necessary,
Supervising and taking the following measures:
deliver an opinion upon request of the Terminal Advisory Group (TAG) to contribute
solving a disagreement with the Management Board (MB),
approve the Implementation Plan and the indicative Investment Plan,
Defining a framework for the allocation of the infrastructure capacity on the RFC and
redrafting when deemed needed.
and inform the EU-Commission every second year on the state of realization of the
implementation plan
The Management Board (MB) was set-up on 30th August 201220. It is composed of
representatives of the Infrastructure Managers involved, i.e. Jernbaneverket (Norway),
Trafikverket (Sweden), the Øresundsbro Konsortiet (Sweden/Denmark), Banedanmark
(Denmark), DB Netz AG (Germany), ÖBB Infrastruktur AG (Austria), Rete Ferroviaria Italiana S.p.a
(Italy). The Management Board decides unanimously. Its competences are defined in Art. 8.2. of
Regulation (EU) No 913/2010. They consist in particular in:
Setting-up the Railway undertaking Advisory Group (RAG) and the TAG,
Coordinating the use of IT-applications in accordance with national and European
deployment plans to handle requests for international train paths and the operation of
international traffic on the freight corridor,
Delivering the Implementation Plan
Preparing and deciding on the following measures:
Definition of processes for the consultation of applicants,
Delivery of an Investment Plan,
Definition of coordinated information processes on works,
Set-up of a C-OSS
Joint definition of Pre-arranged paths, of reserve capacity and promotion of the
coordination of priority rules relating to the allocation of corridor capacity
Definition of procedures for coordinating traffic management along the freight
corridor
Definition of guidelines for coordinating traffic management in case of disturbances,
Delivery of a Corridor Information Document
The Advisory Groups, i.e. the RAG and the TAG of the Scandinavian-Mediterranean RFC were set-
up on 4th June 2013 in Munich. It is composed of representatives of RUs and Terminals, the
activities of which are likely to be impacted by the establishment of the RFC.
The cooperation framework between the MB on the one hand and the TAG and the RAG on the
other hand are added in Annex IV.
IV.1.2. Additional cooperation
In the preparation phase and in order to fulfill all Regulation requirements, the Management
Board developed an internal cooperation structure at level of project managers and experts.
This structure consists of working groups and of a coordination group.
20 See Annex III
15
The working groups, each composed of an expert per Infrastructure Manager (IM)
involved with the exception of the Øresundsbro Konsortiet, represented by Trafikverket,
are:
Transport Market Study: set up in May 2012 and in charge of conducting the
Transport Market Study (TMS). The working group completed its activities in
August 2014
OSS/Capacity Management: set-up in October 2012 and in charge of developing
common solutions for implementing Art.12, 13 and Art.14 of Regulation (EU) No
913/2010, as well as to contribute to defining common solutions for Art.12 and
to the Corridor Information Document; due to the need of specific expertise in
Network Statements not represented in the WG OSS/Capacity Management, a
subgroup was set-up in February 2014 to deliver the first Corridor Information
Document (CID). For the same reason, a subgroup Possessions was established in
March 2014 to deliver a corridor proposal for implementing Art. 12.
Traffic and Performance Management: set-up in January 2013 and in charge of
developing common solutions for implementing Art.16, Art.17 and Art.19 of
Regulation (EU) No 913/2010,
Infrastructure: set-up in July 2013 and in charge of preparing the Investment
plan and the description of infrastructure parameters and bottlenecks along the
corridor; the working group completed its activities in September 2014.
Interoperability: set-up in December 2013 and in charge of delivering, in close
cooperation with the WG Infrastructure, the plan for the implementation of
interoperable systems; the working group completed its activities in May 2014.
A Coordination Group, composed of project managers from the IMs involved with the
exception of the Øresundsbro Konsortiet, represented by Trafikverket, consolidates,
whenever required, the input of the working groups. The Coordination Group further
supervises the timely implementation of the Corridor Project plan, prepares meetings of
the Management Board as well as of the Advisory groups and fulfills all necessary
transversal tasks such as preparing EU-submissions for funding or drafting a
Communication Plan. The Coordination Group completed its activities in September
2015.
For the operational phase, the Management Board has agreed on a lean structure, consisting in:
The Managing Director, responsible for the overall corridor management and
development, and for representing ScanMed RFC towards third parties. The Managing
Director acts upon mandate of the Management Board.
The Project Manager, responsible for coordinating the working groups, for ensuring
timely delivery, the regular update of documents and reports of the corridor and for
representing the corridor in cross-corridor working groups. The Project Manager reports
to the Managing Director.
The Corridor One Stop Shop (C-OSS), responsible for fulfilling the tasks foreseen in Art.13
of Regulation (EU) No 913/2010. The C-OSS Manager makes decisions on the allocation
16
of PaPs and Reserve Capacity, promotes the Corridor and gathers relevant information
for further quality and performance monitoring.
The Corridor Staff works together with Program Implementation Managers appointed by the
involved Infrastructure Managers to represent them for the day-to-day Corridor Management.
The Management Board will further set-up expert working groups and subgroups on an ad hoc
basis aiming at updating, adapting and/or upgrading the corridor deliverables and offer. These
working groups will in particular focus on the update of the Corridor Information Document,
including the Implementation and the Investment Plan, on the regular update of the Transport
Market Study, on Traffic and Performance Management, on the Capacity Management, including
the handling of information on works and possessions.
In order to set a stable frame for common action, ScanMed RFC is to be organized in an
Association of Austrian law.
In addition, ScanMed RFC has been involved in the preparation phase in cross-corridor instances.
The RFCs coordinate together, as well as with the European Association of Infrastructure
Managers, RailNetEurope (RNE), in order to generate a network effect among themselves. Such
coordination results from two concordant groups:
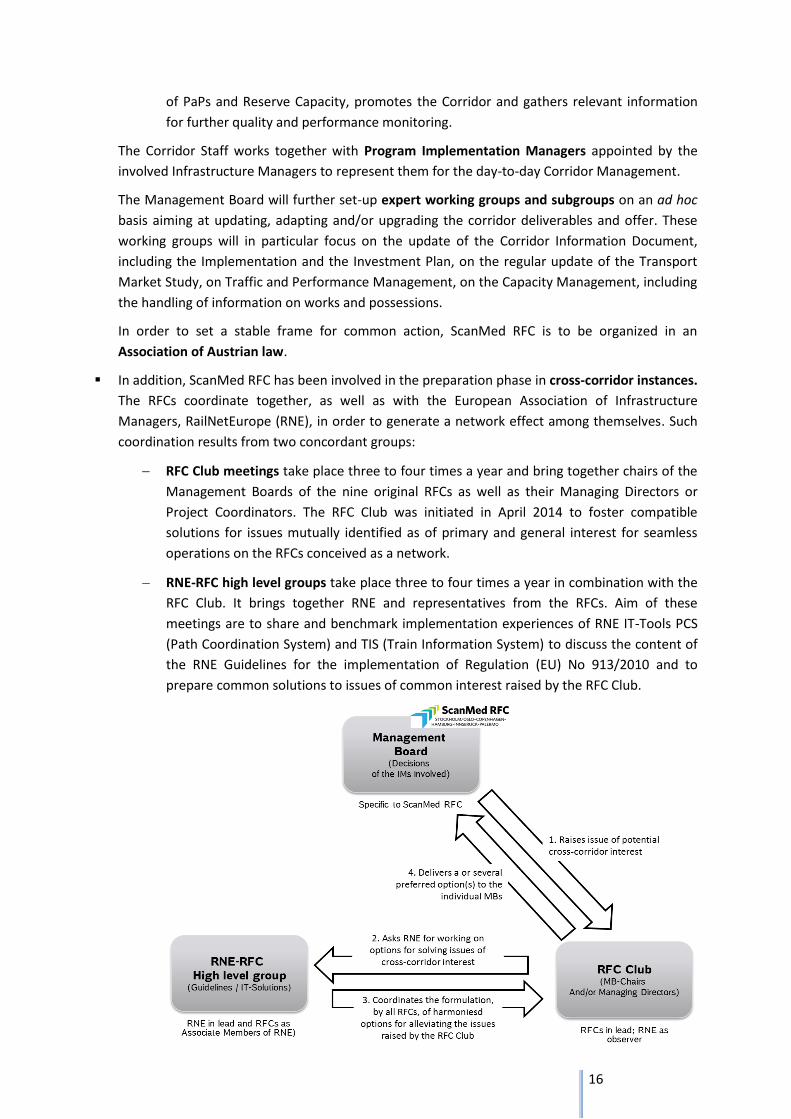
RFC Club meetings take place three to four times a year and bring together chairs of the
Management Boards of the nine original RFCs as well as their Managing Directors or
Project Coordinators. The RFC Club was initiated in April 2014 to foster compatible
solutions for issues mutually identified as of primary and general interest for seamless
operations on the RFCs conceived as a network.
RNE-RFC high level groups take place three to four times a year in combination with the
RFC Club. It brings together RNE and representatives from the RFCs. Aim of these
meetings are to share and benchmark implementation experiences of RNE IT-Tools PCS
(Path Coordination System) and TIS (Train Information System) to discuss the content of
the RNE Guidelines for the implementation of Regulation (EU) No 913/2010 and to
prepare common solutions to issues of common interest raised by the RFC Club.
17
Figure 2: Coordination of the RFCs – Schematic view
IV.1.3. Co-ordination at EU-level
At EU-Level, the RFCs are invited to share their state of implementation and best practices as
well as raise questions of legal interpretation or any matters of interest towards the
European Commission. This exchange of views occurs in three groups:
The Corridor Group takes place 3 to 4 times a year and is chaired by EU-Coordinator for
ERTMS and RFCs, Mr. Karel Vinck. The Corridor Group brings together representatives
from the Management Boards, from the Executive Boards and representatives from the
EU-Commission. Aim of the meetings is to share and benchmark implementation
experiences as well as to receive a feedback with respect to the requirements of
Regulation (EU) No 913/2010.
The IMs are invited twice a year to attend a meeting of the SERAC21 Working Group on
Rail Freight Corridors The common session with IMs is an opportunity to be updated on
the EU Commissions views on the ongoing implementation of the RFCs.
ScanMed RFC is regularly invited to the Corridor Forum for the implementation of the
multimodal TEN-T Core Network Corridor Scandinavian – Mediterranean. Although this
Corridor is primarily focused on infrastructure investments and their European co-
funding, ScanMed RFC is also given the opportunity to comment studies and working
documents, to the extent that their scope and objective overlap with that of the RFC.
IV.2. Communication
IV.2.1. General Approach
Communication within ScanMed RFC covers three kind of flows:
Flows between the Executive Board and the Management Board are continuous.22 Meetings of
the Executive Board take place four times in a year. Whereas the Management Board receives
agendas and minutes for all meetings of the Executive Board, the Chairman of the Management
Board as well as the Leader of the Coordination Group attend and report on the state of
development of ScanMed RFC in the field of competences of the Infrastructure Managers.
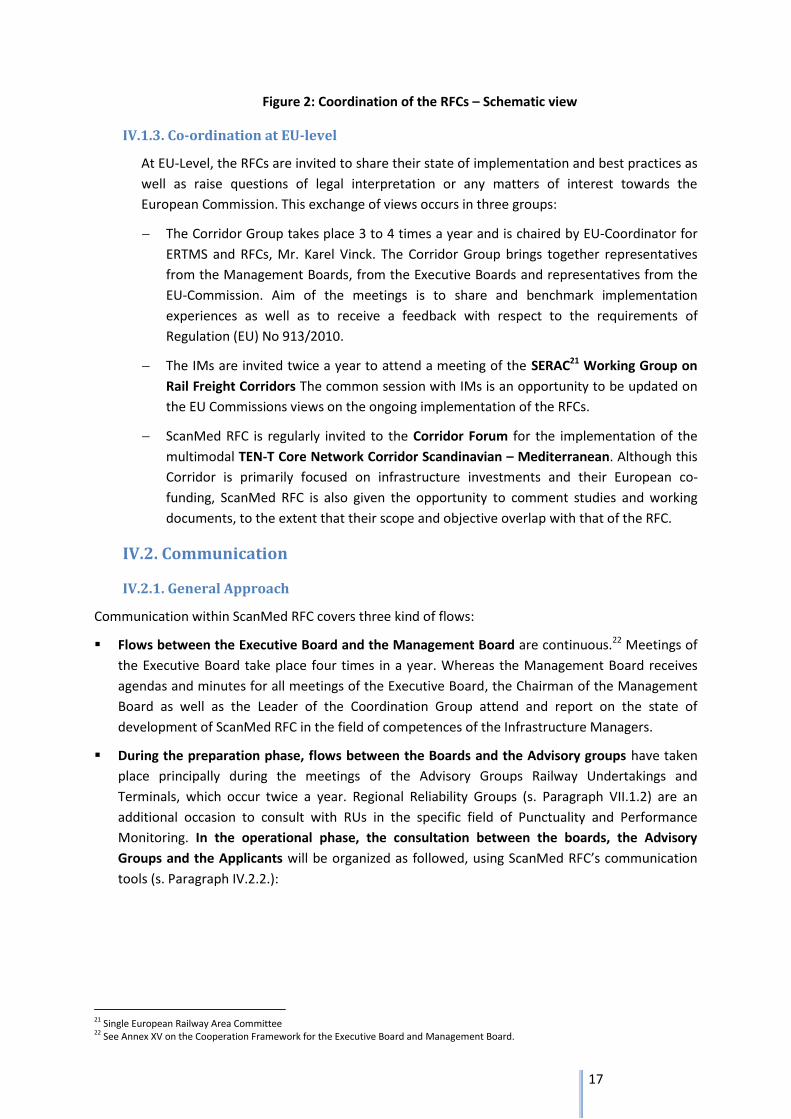
During the preparation phase, flows between the Boards and the Advisory groups have taken
place principally during the meetings of the Advisory Groups Railway Undertakings and
Terminals, which occur twice a year. Regional Reliability Groups (s. Paragraph VII.1.2) are an
additional occasion to consult with RUs in the specific field of Punctuality and Performance
Monitoring. In the operational phase, the consultation between the boards, the Advisory
Groups and the Applicants will be organized as followed, using ScanMed RFC’s communication
tools (s. Paragraph IV.2.2.):
21 Single European Railway Area Committee 22 See Annex XV on the Cooperation Framework for the Executive Board and Management Board.
18
Figure 3: Consultation flows of the Advisory groups and the Applicants
Flows between the Boards and third parties23 include the exchange of information, at regular
meetings, with the SERAC Working Group on Rail Freight Corridors, the Corridor Group chaired
by EU-Coordinator Mr. Karel Vinck, the Corridor Forum for the implementation of the TEN-T Core
Network Corridors, RailNetEurope and the other RFCs in the frame of the RFC Club (s. Paragraph
IV.1.2.)
IV.2.2. Communication tools
ScanMed RFC will use three communication tools:
A website as portal, accessible under the address http://www.scanmedfreight.eu or
http://www.scan-med-rfc.eu : this address leads until launch of a permanent website to a
temporary corridor information webpage hosted by Banedanmark.
The permanent website will provide general updates on Rail Freight Corridors and the ScanMed
RFC, as well as a link to its C-OSS,
A Customer Information Platform (CIP), accessible either through the website or directly: the
platform aims at providing customers and stakeholders with:
an interactive map providing detailed information on routing (e.g.: principal, diversionary
and connecting lines), terminals, infrastructure parameters per section relevant for rail
freight traffic (e.g.: section length, intermodal freight code, interoperability gauge, line
category, multinational gauge)
a publication area in which all corridor relevant documents, at first place the Corridor
Information Document, will be easily accessible. Detailed information on the C-OSS,
Terms and Conditions, the Investment Plan, Traffic and Performance Management and
the Transport Market Study will be stored in this area.
23 As provided in Art.9(5) of Regulation (EU) No. 913/2010, ScanMed RFC may in future develop a dialogue with regional and/or local administration in respect of the Implementation Plan.
19
V. Essential Elements of the Transport Market Study
As an essential part of the implementation plan for the freight corridor a Transport Market Study
(TMS) has to be carried out according to Article 9.3 of the Regulation (EU) No 913/2010. A cost-
benefit analysis has not been carried out for this first Implementation Plan. It may however be
conducted together with future updates when, beyond the implementation of the requirements
included in Regulation (EU) No 913/2010, the costs and revenues in relation with ScanMed RFC will
be reliably measurable.
V.1. Objectives of the TMS
The main objective of the TMS is to provide the Member States and the Infrastructure Managers in
ScanMed RFC as well as other stakeholders with a detailed analysis of the freight market
development and future customer demand on the corridor. As a part of the implementation plan for
the ScanMed RFC it supports the definition of a corridor offer, tailored to meet the expectations of
customers. In order to achieve these goals the study focuses on the following major issues:
Analysis and evaluation of the present transport market situation covering all transport modes
Forecast of transport market developments based on an analysis of socio-economic trends
Analysis of strengths, weaknesses, opportunities and threats of rail freight traffic on the corridor
Recommendations for operational and organisational improvements of rail freight traffic
Support of the definition of parameters for corridor capacity
To obtain an insider’s view of the specific interests, opinions and development trends of stakeholders
operating within the corridor, 57 personal interviews using an extensive questionnaire and 80 web-
based surveys were carried out in the corridor countries. These interviews with the stakeholders,
including railway operators, terminal and port operators, road carriers and shipping companies,
forwarders and logistics providers, authorities as well as shippers, helped to
understand the customers’ requirements and future market demand
analyse the criteria for choice of the transport mode and define the main parameters for the
attractiveness of the different modes
evaluate the future transport market development
define measures and recommendations to facilitate rail freight traffic, and
amend, verify and consolidate statistical data and information
V.2. Catchment area
The catchment area was defined taking into account the extensions introduced in Annex 2 of
Regulation (EU) No 1316/2013 and consists of the NUTS 2 or NUTS 3 regions surrounding a reference
routing derived from the Corridor nodes, as listed in Annex 2 of Regulation (EU) No 1316/2013.
Based on the reference routing the following border crossings have been identified within
ScanMed RFC:
Norway - Sweden: Kornsjø
Sweden - Denmark: Malmö / Kastrup, Peberholm
Denmark - Germany: Padborg / Flensburg
Germany - Austria: Kiefersfelden / Kufstein
20
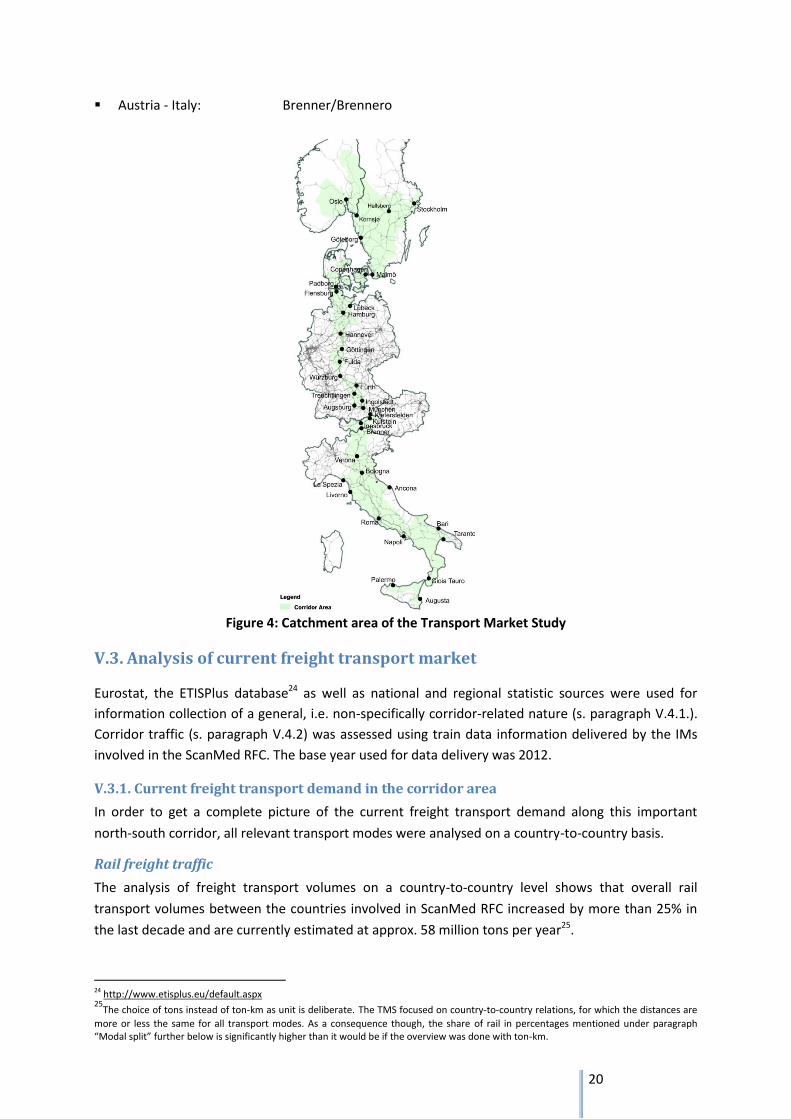
Austria - Italy: Brenner/Brennero
Figure 4: Catchment area of the Transport Market Study
V.3. Analysis of current freight transport market
Eurostat, the ETISPlus database24 as well as national and regional statistic sources were used for
information collection of a general, i.e. non-specifically corridor-related nature (s. paragraph V.4.1.).
Corridor traffic (s. paragraph V.4.2) was assessed using train data information delivered by the IMs
involved in the ScanMed RFC. The base year used for data delivery was 2012.
V.3.1. Current freight transport demand in the corridor area
In order to get a complete picture of the current freight transport demand along this important
north-south corridor, all relevant transport modes were analysed on a country-to-country basis.
Rail freight traffic
The analysis of freight transport volumes on a country-to-country level shows that overall rail
transport volumes between the countries involved in ScanMed RFC increased by more than 25% in
the last decade and are currently estimated at approx. 58 million tons per year25.
24 http://www.etisplus.eu/default.aspx 25
The choice of tons instead of ton-km as unit is deliberate. The TMS focused on country-to-country relations, for which the distances are
more or less the same for all transport modes. As a consequence though, the share of rail in percentages mentioned under paragraph “Modal split” further below is significantly higher than it would be if the overview was done with ton-km.
21
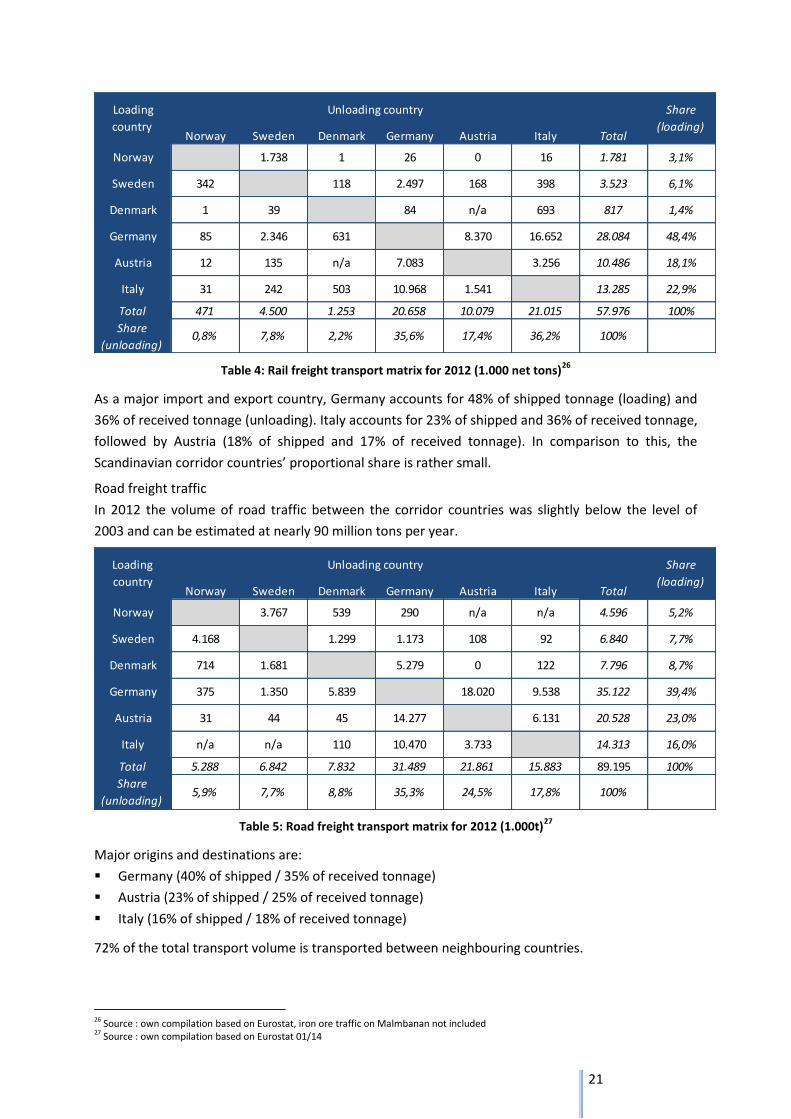
Table 4: Rail freight transport matrix for 2012 (1.000 net tons)26
As a major import and export country, Germany accounts for 48% of shipped tonnage (loading) and
36% of received tonnage (unloading). Italy accounts for 23% of shipped and 36% of received tonnage,
followed by Austria (18% of shipped and 17% of received tonnage). In comparison to this, the
Scandinavian corridor countries’ proportional share is rather small.
Road freight traffic
In 2012 the volume of road traffic between the corridor countries was slightly below the level of
2003 and can be estimated at nearly 90 million tons per year.
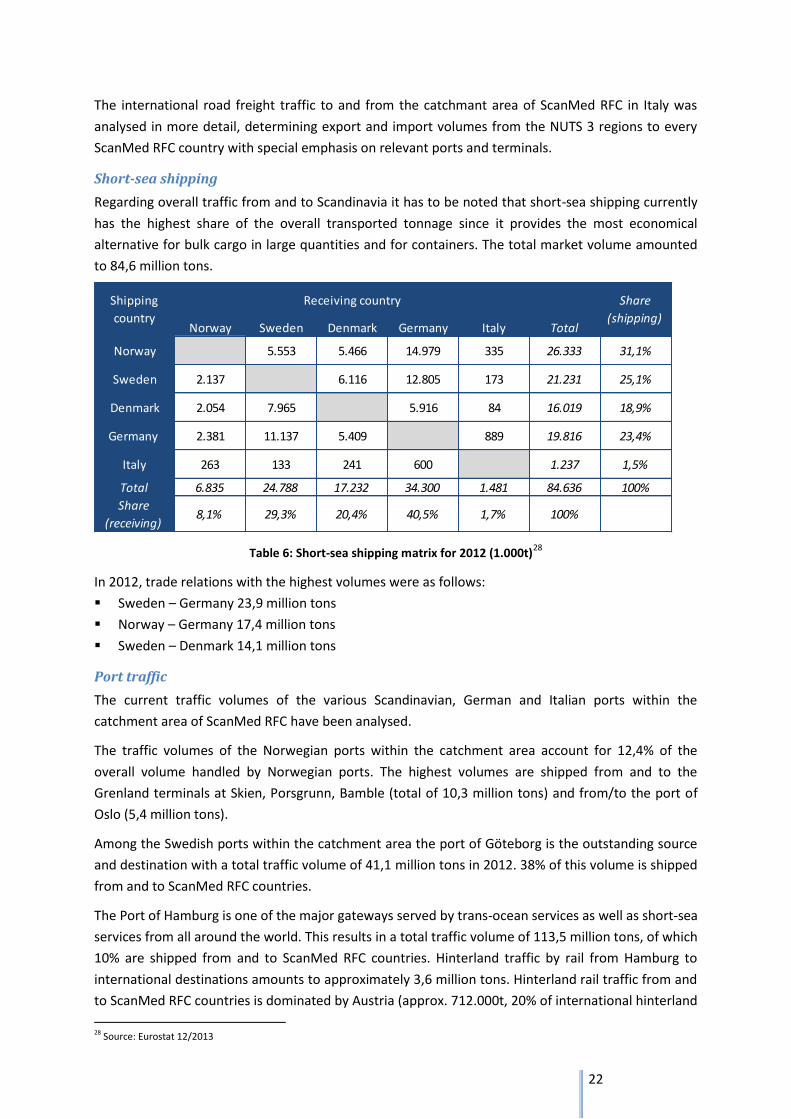
Table 5: Road freight transport matrix for 2012 (1.000t)27
Major origins and destinations are:
Germany (40% of shipped / 35% of received tonnage)
Austria (23% of shipped / 25% of received tonnage)
Italy (16% of shipped / 18% of received tonnage)
72% of the total transport volume is transported between neighbouring countries.
26 Source : own compilation based on Eurostat, iron ore traffic on Malmbanan not included 27 Source : own compilation based on Eurostat 01/14
Norway Sweden Denmark Germany Austria Italy Total
Norway 1.738 1 26 0 16 1.781 3,1%
Sweden 342 118 2.497 168 398 3.523 6,1%
Denmark 1 39 84 n/a 693 817 1,4%
Germany 85 2.346 631 8.370 16.652 28.084 48,4%
Austria 12 135 n/a 7.083 3.256 10.486 18,1%
Italy 31 242 503 10.968 1.541 13.285 22,9%
Total 471 4.500 1.253 20.658 10.079 21.015 57.976 100%
36,2% 100%0,8% 7,8%Share
(unloading)2,2% 35,6% 17,4%
Loading
country
Unloading country Share
(loading)
Norway Sweden Denmark Germany Austria Italy Total
Norway 3.767 539 290 n/a n/a 4.596 5,2%
Sweden 4.168 1.299 1.173 108 92 6.840 7,7%
Denmark 714 1.681 5.279 0 122 7.796 8,7%
Germany 375 1.350 5.839 18.020 9.538 35.122 39,4%
Austria 31 44 45 14.277 6.131 20.528 23,0%
Italy n/a n/a 110 10.470 3.733 14.313 16,0%
Total 5.288 6.842 7.832 31.489 21.861 15.883 89.195 100%
Share
(loading)
Unloading country
35,3% 24,5% 100%5,9% 7,7% 8,8%Share
(unloading)17,8%
Loading
country
22
The international road freight traffic to and from the catchmant area of ScanMed RFC in Italy was
analysed in more detail, determining export and import volumes from the NUTS 3 regions to every
ScanMed RFC country with special emphasis on relevant ports and terminals.
Short-sea shipping
Regarding overall traffic from and to Scandinavia it has to be noted that short-sea shipping currently
has the highest share of the overall transported tonnage since it provides the most economical
alternative for bulk cargo in large quantities and for containers. The total market volume amounted
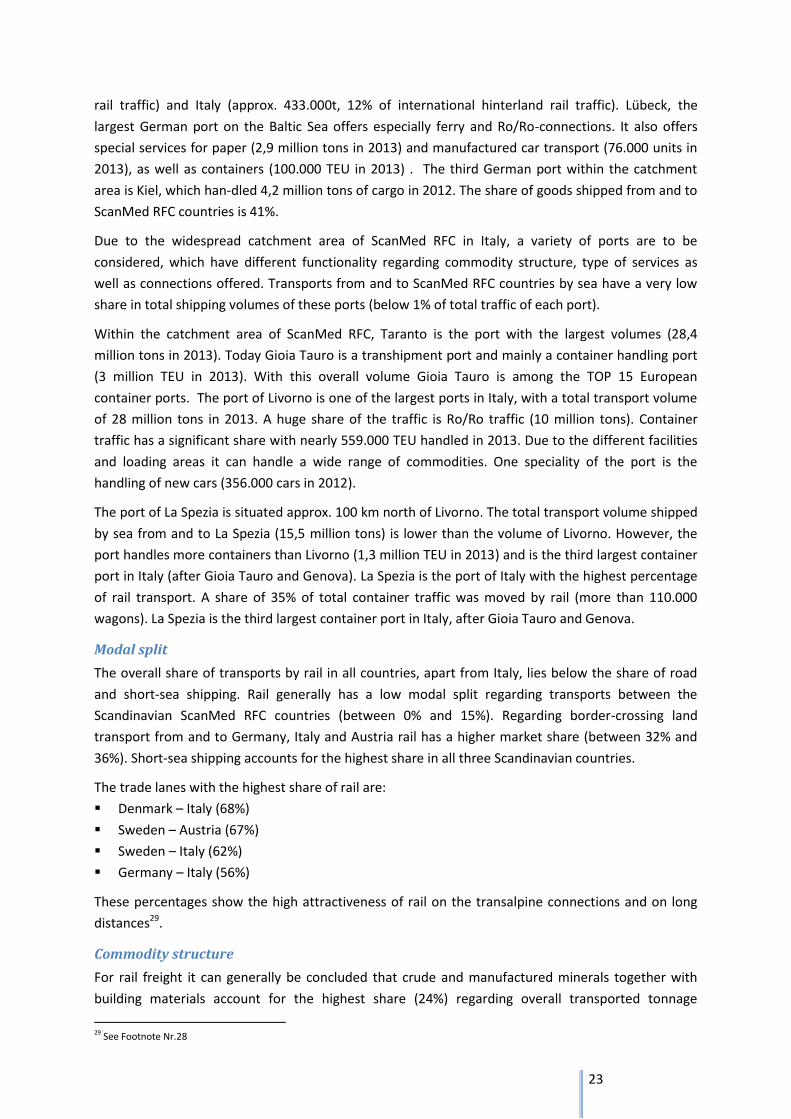
to 84,6 million tons.
Table 6: Short-sea shipping matrix for 2012 (1.000t)28
In 2012, trade relations with the highest volumes were as follows:
Sweden – Germany 23,9 million tons
Norway – Germany 17,4 million tons
Sweden – Denmark 14,1 million tons
Port traffic
The current traffic volumes of the various Scandinavian, German and Italian ports within the
catchment area of ScanMed RFC have been analysed.
The traffic volumes of the Norwegian ports within the catchment area account for 12,4% of the
overall volume handled by Norwegian ports. The highest volumes are shipped from and to the
Grenland terminals at Skien, Porsgrunn, Bamble (total of 10,3 million tons) and from/to the port of
Oslo (5,4 million tons).
Among the Swedish ports within the catchment area the port of Göteborg is the outstanding source
and destination with a total traffic volume of 41,1 million tons in 2012. 38% of this volume is shipped
from and to ScanMed RFC countries.
The Port of Hamburg is one of the major gateways served by trans-ocean services as well as short-sea
services from all around the world. This results in a total traffic volume of 113,5 million tons, of which
10% are shipped from and to ScanMed RFC countries. Hinterland traffic by rail from Hamburg to
international destinations amounts to approximately 3,6 million tons. Hinterland rail traffic from and
to ScanMed RFC countries is dominated by Austria (approx. 712.000t, 20% of international hinterland
28 Source: Eurostat 12/2013
Norway Sweden Denmark Germany Italy Total
Norway 5.553 5.466 14.979 335 26.333 31,1%
Sweden 2.137 6.116 12.805 173 21.231 25,1%
Denmark 2.054 7.965 5.916 84 16.019 18,9%
Germany 2.381 11.137 5.409 889 19.816 23,4%
Italy 263 133 241 600 1.237 1,5%
Total 6.835 24.788 17.232 34.300 1.481 84.636 100%
Share
(receiving)8,1% 29,3% 20,4% 40,5% 1,7% 100%
Shipping
country
Receiving country Share
(shipping)
23
rail traffic) and Italy (approx. 433.000t, 12% of international hinterland rail traffic). Lübeck, the
largest German port on the Baltic Sea offers especially ferry and Ro/Ro-connections. It also offers
special services for paper (2,9 million tons in 2013) and manufactured car transport (76.000 units in
2013), as well as containers (100.000 TEU in 2013) . The third German port within the catchment
area is Kiel, which han-dled 4,2 million tons of cargo in 2012. The share of goods shipped from and to
ScanMed RFC countries is 41%.
Due to the widespread catchment area of ScanMed RFC in Italy, a variety of ports are to be
considered, which have different functionality regarding commodity structure, type of services as
well as connections offered. Transports from and to ScanMed RFC countries by sea have a very low
share in total shipping volumes of these ports (below 1% of total traffic of each port).
Within the catchment area of ScanMed RFC, Taranto is the port with the largest volumes (28,4
million tons in 2013). Today Gioia Tauro is a transhipment port and mainly a container handling port
(3 million TEU in 2013). With this overall volume Gioia Tauro is among the TOP 15 European
container ports. The port of Livorno is one of the largest ports in Italy, with a total transport volume
of 28 million tons in 2013. A huge share of the traffic is Ro/Ro traffic (10 million tons). Container
traffic has a significant share with nearly 559.000 TEU handled in 2013. Due to the different facilities
and loading areas it can handle a wide range of commodities. One speciality of the port is the
handling of new cars (356.000 cars in 2012).
The port of La Spezia is situated approx. 100 km north of Livorno. The total transport volume shipped
by sea from and to La Spezia (15,5 million tons) is lower than the volume of Livorno. However, the
port handles more containers than Livorno (1,3 million TEU in 2013) and is the third largest container
port in Italy (after Gioia Tauro and Genova). La Spezia is the port of Italy with the highest percentage
of rail transport. A share of 35% of total container traffic was moved by rail (more than 110.000
wagons). La Spezia is the third largest container port in Italy, after Gioia Tauro and Genova.
Modal split
The overall share of transports by rail in all countries, apart from Italy, lies below the share of road
and short-sea shipping. Rail generally has a low modal split regarding transports between the
Scandinavian ScanMed RFC countries (between 0% and 15%). Regarding border-crossing land
transport from and to Germany, Italy and Austria rail has a higher market share (between 32% and
36%). Short-sea shipping accounts for the highest share in all three Scandinavian countries.
The trade lanes with the highest share of rail are:
Denmark – Italy (68%)
Sweden – Austria (67%)
Sweden – Italy (62%)
Germany – Italy (56%)
These percentages show the high attractiveness of rail on the transalpine connections and on long
distances29.
Commodity structure
For rail freight it can generally be concluded that crude and manufactured minerals together with
building materials account for the highest share (24%) regarding overall transported tonnage
29 See Footnote Nr.28
24
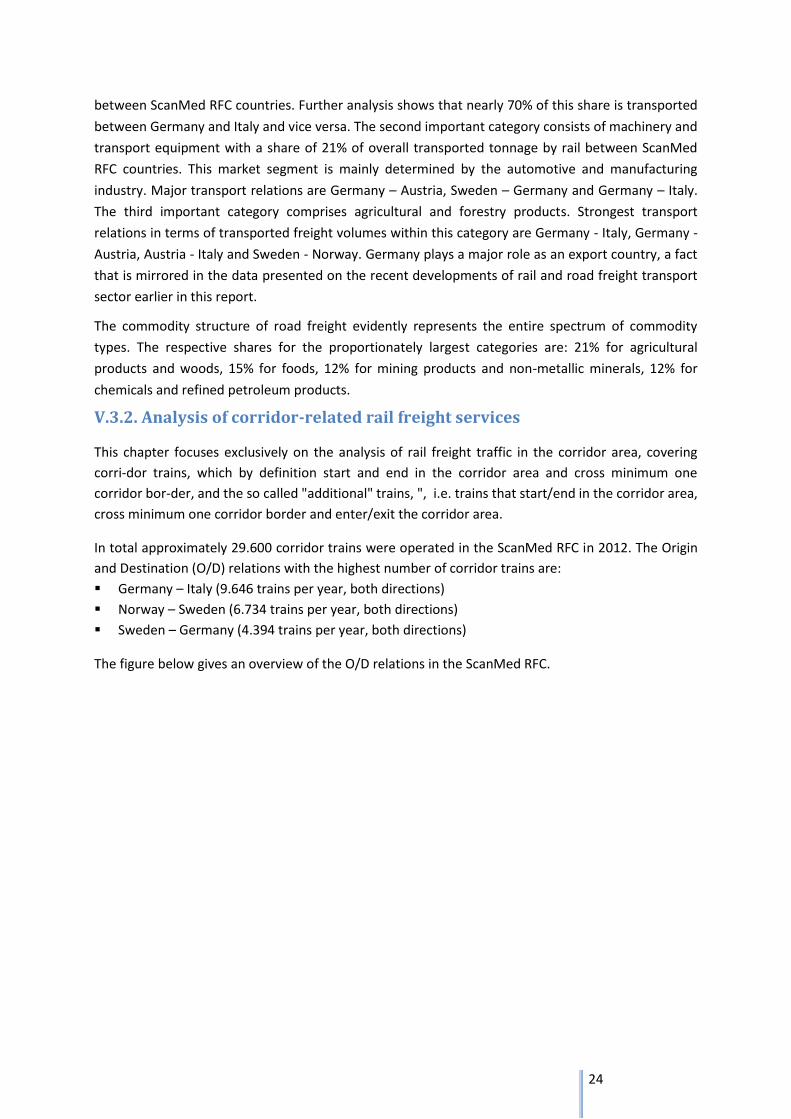
between ScanMed RFC countries. Further analysis shows that nearly 70% of this share is transported
between Germany and Italy and vice versa. The second important category consists of machinery and
transport equipment with a share of 21% of overall transported tonnage by rail between ScanMed
RFC countries. This market segment is mainly determined by the automotive and manufacturing
industry. Major transport relations are Germany – Austria, Sweden – Germany and Germany – Italy.
The third important category comprises agricultural and forestry products. Strongest transport
relations in terms of transported freight volumes within this category are Germany - Italy, Germany -
Austria, Austria - Italy and Sweden - Norway. Germany plays a major role as an export country, a fact
that is mirrored in the data presented on the recent developments of rail and road freight transport
sector earlier in this report.
The commodity structure of road freight evidently represents the entire spectrum of commodity
types. The respective shares for the proportionately largest categories are: 21% for agricultural
products and woods, 15% for foods, 12% for mining products and non-metallic minerals, 12% for
chemicals and refined petroleum products.
V.3.2. Analysis of corridor-related rail freight services
This chapter focuses exclusively on the analysis of rail freight traffic in the corridor area, covering
corri-dor trains, which by definition start and end in the corridor area and cross minimum one
corridor bor-der, and the so called "additional" trains, ", i.e. trains that start/end in the corridor area,
cross minimum one corridor border and enter/exit the corridor area.
In total approximately 29.600 corridor trains were operated in the ScanMed RFC in 2012. The Origin
and Destination (O/D) relations with the highest number of corridor trains are:
Germany – Italy (9.646 trains per year, both directions)
Norway – Sweden (6.734 trains per year, both directions)
Sweden – Germany (4.394 trains per year, both directions)
The figure below gives an overview of the O/D relations in the ScanMed RFC.
25
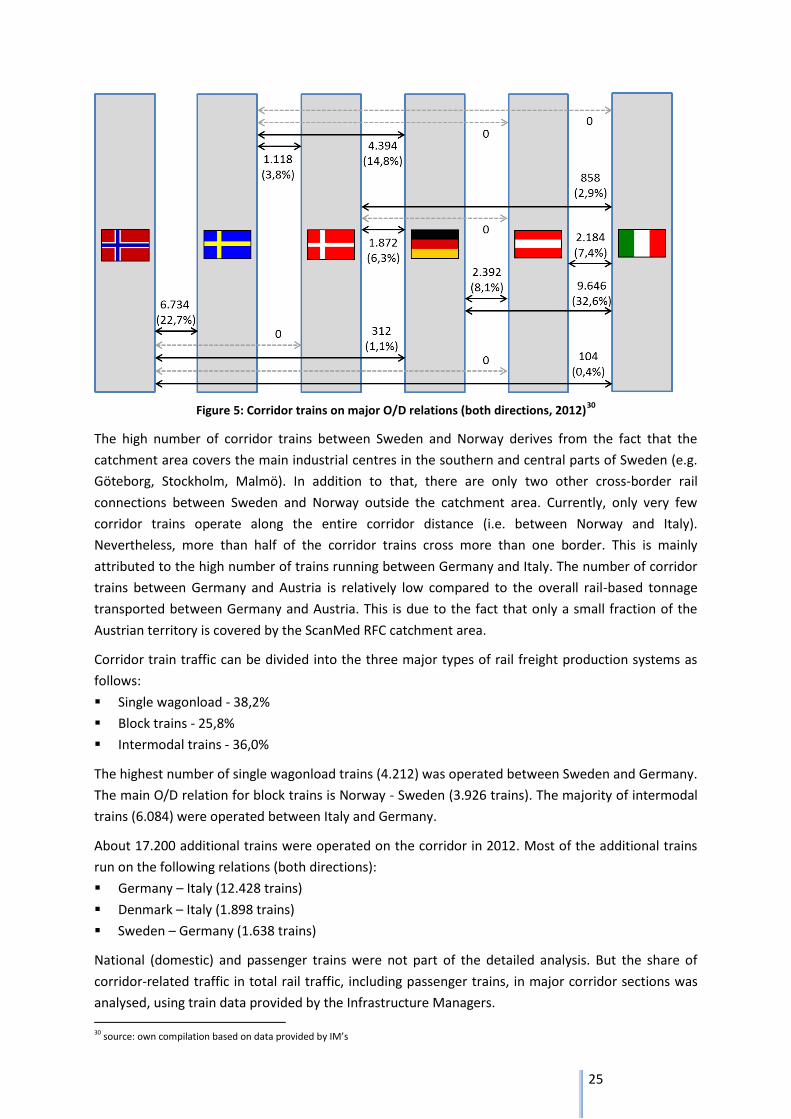
Figure 5: Corridor trains on major O/D relations (both directions, 2012)30
The high number of corridor trains between Sweden and Norway derives from the fact that the
catchment area covers the main industrial centres in the southern and central parts of Sweden (e.g.
Göteborg, Stockholm, Malmö). In addition to that, there are only two other cross-border rail
connections between Sweden and Norway outside the catchment area. Currently, only very few
corridor trains operate along the entire corridor distance (i.e. between Norway and Italy).
Nevertheless, more than half of the corridor trains cross more than one border. This is mainly
attributed to the high number of trains running between Germany and Italy. The number of corridor
trains between Germany and Austria is relatively low compared to the overall rail-based tonnage
transported between Germany and Austria. This is due to the fact that only a small fraction of the
Austrian territory is covered by the ScanMed RFC catchment area.
Corridor train traffic can be divided into the three major types of rail freight production systems as
follows:
Single wagonload - 38,2%
Block trains - 25,8%
Intermodal trains - 36,0%
The highest number of single wagonload trains (4.212) was operated between Sweden and Germany.
The main O/D relation for block trains is Norway - Sweden (3.926 trains). The majority of intermodal
trains (6.084) were operated between Italy and Germany.
About 17.200 additional trains were operated on the corridor in 2012. Most of the additional trains
run on the following relations (both directions):
Germany – Italy (12.428 trains)
Denmark – Italy (1.898 trains)
Sweden – Germany (1.638 trains)
National (domestic) and passenger trains were not part of the detailed analysis. But the share of
corridor-related traffic in total rail traffic, including passenger trains, in major corridor sections was
analysed, using train data provided by the Infrastructure Managers.
30 source: own compilation based on data provided by IM’s
26
V.3.3. Criteria for modal choice
The choice of transport mode is driven by a company’s desire to remain competitive by serving their
customers both effectively and efficiently. According to international studies and results of the
stakeholder interviews, the major criteria, which strongly influence the choice of mode, could be
grouped into the three categories:
transport cost
transport time
transport quality, including factors like reliability, punctuality, safety & security and travel
information
Based on interview results, rail scores medium on time and costs, but has an advantage in terms of
predictability/punctuality and a disadvantage in terms of adaptation/flexibility. This was mirrored in
reports by the stakeholders, who stated that ad-hoc train services (as opposed to timetable traffic)
offer the necessary flexibility for customers, although today the proportion of ad-hoc traffic is
reportedly low. Most stakeholders either assumed stagnation in ad-hoc traffic levels or at best a
moderate increase. This could therefore be a response of rail to enhance its attractiveness to
customers in terms of one central aspect to transport quality, i.e. flexible adaptation to customer
needs.
Regarding the interview results on choice of transport mode, price emerged as the most prominent
mode-determining factor. However, further issues such as type of cargo (time sensitive or not) and
transport route (and hence available alternative modes) must be taken into the equation as well,
when considering a mode’s competitiveness.
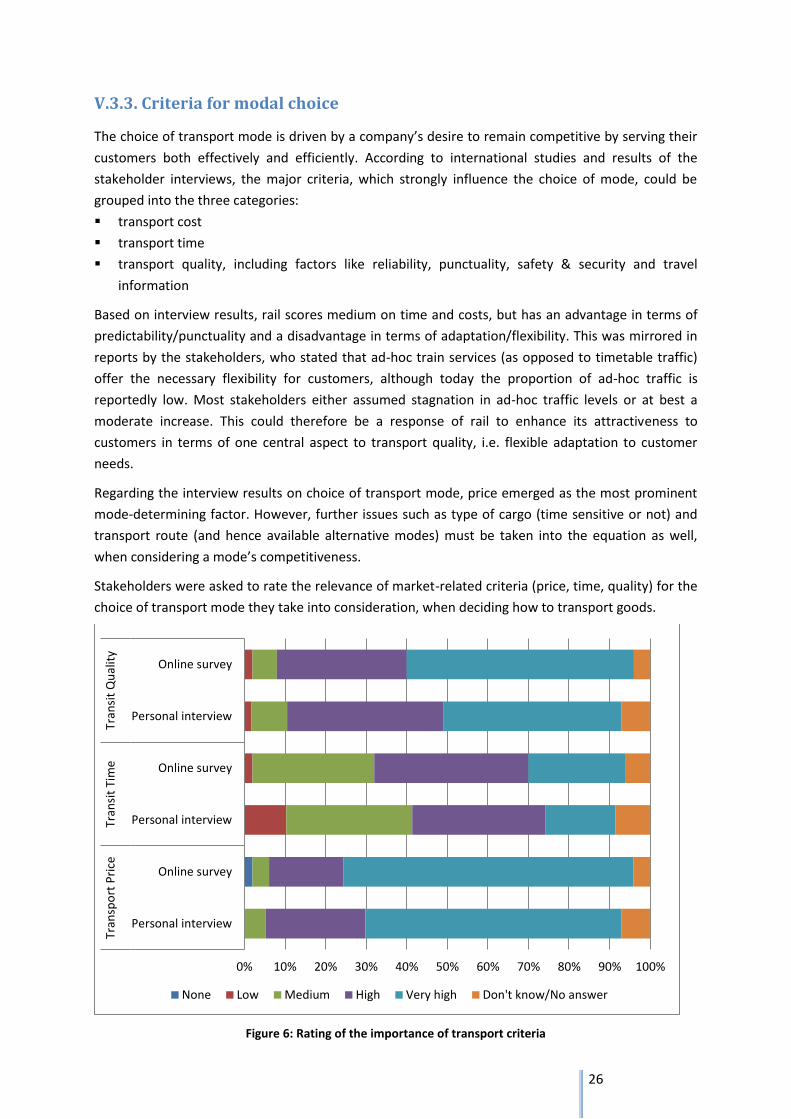
Stakeholders were asked to rate the relevance of market-related criteria (price, time, quality) for the
choice of transport mode they take into consideration, when deciding how to transport goods.
Figure 6: Rating of the importance of transport criteria
0% 10% 20% 30% 40% 50% 60% 70% 80% 90% 100%
Personal interview
Online survey
Personal interview
Online survey
Personal interview
Online survey
Tran
spo
rt P
rice
Tran
sit
Tim
eTr
ansi
t Q
ual
ity
None Low Medium High Very high Don't know/No answer
27
The interview results showed that both response groups rated the three transport criteria quality,
time and price very similarly. Transport price received the most “high” and “very high” ratings from
both. This finding is in line with the common credo that, to both the final customer and the operator
“price is all that matters” and thus is the determining factor in mode choice (before further factors
are considered). This is further underlined, when the transport criteria are presented by commodity
group.
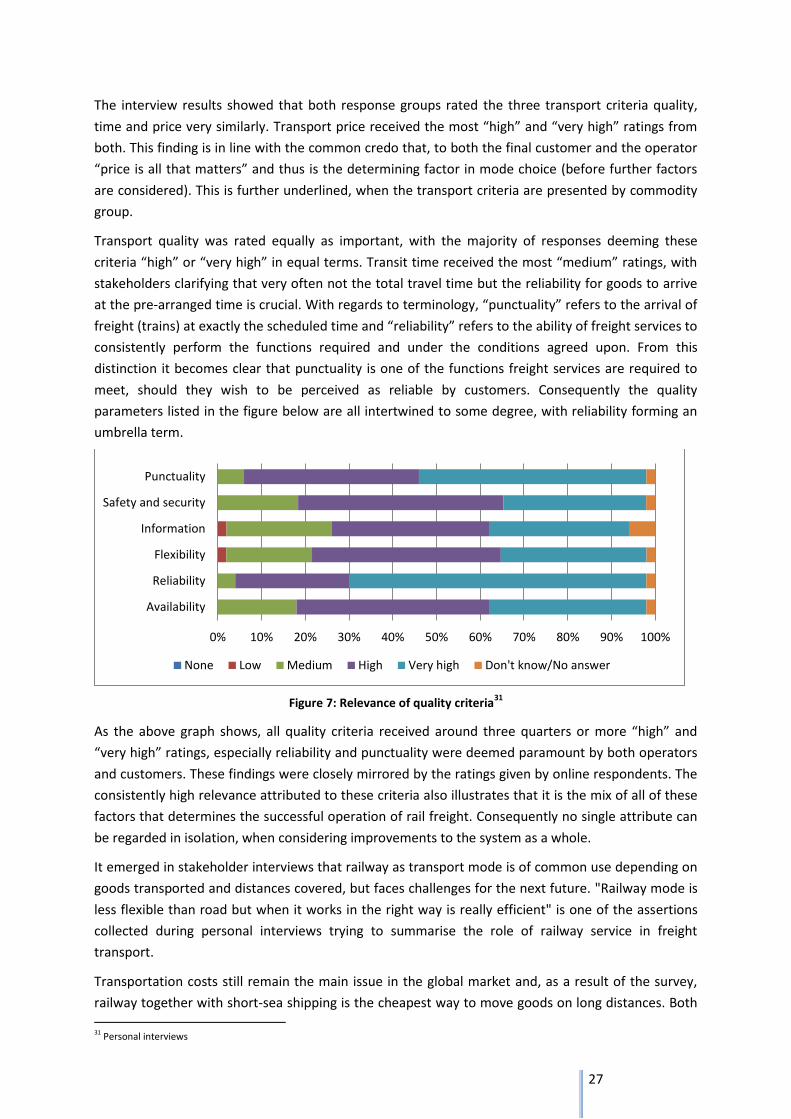
Transport quality was rated equally as important, with the majority of responses deeming these
criteria “high” or “very high” in equal terms. Transit time received the most “medium” ratings, with
stakeholders clarifying that very often not the total travel time but the reliability for goods to arrive
at the pre-arranged time is crucial. With regards to terminology, “punctuality” refers to the arrival of
freight (trains) at exactly the scheduled time and “reliability” refers to the ability of freight services to
consistently perform the functions required and under the conditions agreed upon. From this
distinction it becomes clear that punctuality is one of the functions freight services are required to
meet, should they wish to be perceived as reliable by customers. Consequently the quality
parameters listed in the figure below are all intertwined to some degree, with reliability forming an
umbrella term.
Figure 7: Relevance of quality criteria31
As the above graph shows, all quality criteria received around three quarters or more “high” and
“very high” ratings, especially reliability and punctuality were deemed paramount by both operators
and customers. These findings were closely mirrored by the ratings given by online respondents. The
consistently high relevance attributed to these criteria also illustrates that it is the mix of all of these
factors that determines the successful operation of rail freight. Consequently no single attribute can
be regarded in isolation, when considering improvements to the system as a whole.
It emerged in stakeholder interviews that railway as transport mode is of common use depending on
goods transported and distances covered, but faces challenges for the next future. "Railway mode is
less flexible than road but when it works in the right way is really efficient" is one of the assertions
collected during personal interviews trying to summarise the role of railway service in freight
transport.
Transportation costs still remain the main issue in the global market and, as a result of the survey,
railway together with short-sea shipping is the cheapest way to move goods on long distances. Both
31 Personal interviews
0% 10% 20% 30% 40% 50% 60% 70% 80% 90% 100%
Availability
Reliability
Flexibility
Information
Safety and security
Punctuality
None Low Medium High Very high Don't know/No answer
28
transport modes are strong in the transportation of mass goods and are in some cases in competition
with each other often due to the lack of access to the railway network. Their integration would surely
lead to a more efficient trip chain and to strengthen the role of each mode in their respective area of
influence.
Travel time does not appear to be a peculiar quality of railway mode. Nonetheless, time is not
generally considered to be a key issue in the current global market especially for those good
categories that mainly interest railway mode. On the other hand, railway could really grab position in
the "time competition" due to the improvements in the node management and in the
communication and cooperation among infrastructure companies, terminals, ports, shippers and
other stakeholders.
The flexibility and ability to adapt to customer requirements remains highly important. Its
implementation is highly complex in the railway sector as it requires a strong relationship between
Infrastructure Manager and railway operators whose "time to market" are different and of different
nature.
V.4. Evaluation of future transport market development
The evaluation of future freight traffic development is based on the comprehensive analysis of the
current market situation and both traffic forecast and long-term trends derive their basic information
and input from a PESTL analysis and are complemented by stakeholder interview results.
V.4.1. PESTL-Analysis
Factors influencing rail freight in ScanMed RFC can be divided into five categories: political, economic
social, technological and logistical (PESTL). These factors have been analysed accordingly.
As a result barriers and opportunities, influencing future traffic in ScanMed RFC, were identified.
Political analysis
EU Directives have been largely transposed into national law.
For transport modes other than rail, road pricing models as a financial disincentive for road
freight transportation are widely known and debated concepts not without controversy. Austria
has implemented a comprehensive charging system whilst in Denmark support for this approach
has been lacking.
ScanMed RFC countries undertake measures to promote longer trucks (Germany and Sweden),
and encourage the shift of freight from road and rail onto either inland waterways or short-sea
shipping.
Generally the ScanMed RFC countries been very successfully implementing EU policies on rail
freight traffic. The railway liberalisation index provided by IBM and Humboldt University of Berlin
shows that all ScanMed RFC countries have made significant progress since 2007. Four of the six
ScanMed RFC countries have an index of 800 or higher which indicates an advanced liberalisation
of the railway market, demonstrating that there is a significant impact of EU-driven liberalisation
in national legislation.
Economic analysis
Overall the economic development within the ScanMed RFC countries has been positive,
showing a recovery from the economic crisis from 2009 up to 2012.
29
Out of all ScanMed RFC countries Norway was hit the least by this crisis with a GDP decrease of -
1,6% in 2009 compared to the previous year and therefore recovered quickest too.
All other ScanMed RFC countries experienced an average GDP decrease ranging between -5,0%
and -5,7%, except for Austria where it was less pronounced with -3,8%.
A generally positive development in foreign trade can be observed. The ScanMed RFC countries
play a rather significant role for trade with each other. At least one ScanMed RFC country is
usually among the top-3 trade partners of the other respective ScanMed RFC countries.
Germany plays a major role as import and export partner to all other ScanMed RFC countries and
the Scandinavian countries have strong trade connections with each other.
Italy’s top-3 import and export partners are Germany, France and China.
The GDP forecasts available expect a positive development in the near future (i.e. up to 2017) in
all corridor countries, with higher growth rates in the northern part of the corridor.
Social analysis
Unemployment levels increased significantly after 2008/2009 as a result of the economic crisis
and started to decrease again in 2012.
The average income shows an overall rise, though the in-work at-risk poverty rate has been
increasing in all ScanMed RFC countries.
Technical and organisational analysis
Diversity across the ScanMed RFC countries in terms of infrastructure quality and standards exist.
Technical bottlenecks regarding the different signalling and electrification systems are present
and require costly solutions (e.g. multi-system locomotives or locomotive changes at border
crossings).
No restrictions regarding loading and track gauges exist, but the corner height of semi-trailers
and swap bodies poses a problem south of Bologna, where lower corner heights are required
than along the rest of ScanMed RFC. They necessitate either the use of special – and more
expensive – pocket waggons or the transfer from rail to road.
Capacity problems at some terminals affect the efficiency of intermodal freight transportation
and the freight transport chain. To mitigate this, several development projects in all ScanMed
RFC countries are underway32.
Logistical analysis
Overall good logistical conditions and a good terminal infrastructure network along ScanMed RFC
prevail. Each country provides several ports and terminals as well as interconnections for
intermodal transportation.
Despite RoLa initiatives for road freight traffic, the Brenner remains a bottleneck, especially for
rail freight. The Brenner Base Tunnel – to be in place by 202633 – promises an improvement to
the situation and is therefore of long-term relevance for the development of ScanMed RFC.
32 Some of them are: Oslo Alnabru Terminal; upgrade of container terminal in Stockholm port; extension of MegaHub Lehrte; new terminal for combined transport in the port of Ancona 33 According to ÖBB Infrastruktur AG
30
V.4.2. Forecast of future transport volumes
The traffic forecast is based on findings of the analysis of the current situation and the PESTL analysis,
with the socio-economic development being the decisive factor. It also takes into account the results
of the stakeholder interviews. The forecast covers the short-term period up to 2017.
For rail freight traffic development on a country-to-country level the highest growth rates are
forecasted for rail freight exports from Norway and Sweden. There will only be a moderate increase
of rail freight traffic from Denmark, Germany and Austria. Exports by rail from Italy show only a
relatively low increase. There will be no significant changes in the county-to-country relations within
the short-term forecast period. In 2017, the highest rail freight volumes will be transported between
Germany and Italy.
For the majority of the country-to-country relations, rail freight traffic is increasing faster than road
transport. Relatively low increases will occur in road freight transports to and from Denmark and
Italy. Up to 2017 the highest road freight volumes will be transported between Germany and
Austria/Italy.
In the short-sea shipping sector the highest growth rates are expected for exports from Norway and
Sweden. Only an insignificant increase in short-sea transportations to and from Italy is projected.
Also in 2017 the biggest short-sea shipping volumes will be transported between Germany and the
Scandinavian countries.
Only insignificant changes in the overall modal split of freight transport between the corridor
countries are expected by 2017. The share of total rail freight transport between the corridor
countries slightly decreases while short-sea shipping remains the dominant transport mode between
the Scandinavian countries.
Forecasts on corridor-related rail freight traffic are based on growth rates for overall rail freight
traffic between corridor countries. As the forecast of rail freight traffic in ScanMed RFC refers to
numbers of trains (not freight volumes), it must be noted that such a projection always bears
uncertainties. Based on the development of transport demand (by quantities of goods), the
extrapolated number of trains required may deviate from the actual number of trains that will
operate by 2017. The definite number of trains resulting from any new trade relation is consequently
very hard to accurately predict in traffic models. This point was also emphasised by train and
terminal operators in the personal interviews.
The number of corridor trains will increase by 5,7% (1.695 trains) over the forecast period. Thus, a
total number of 31.309 corridor trains are expected to operate in 2017. For corridor train traffic the
highest growth rates are observed between the Scandinavian countries. Germany - Italy remains the
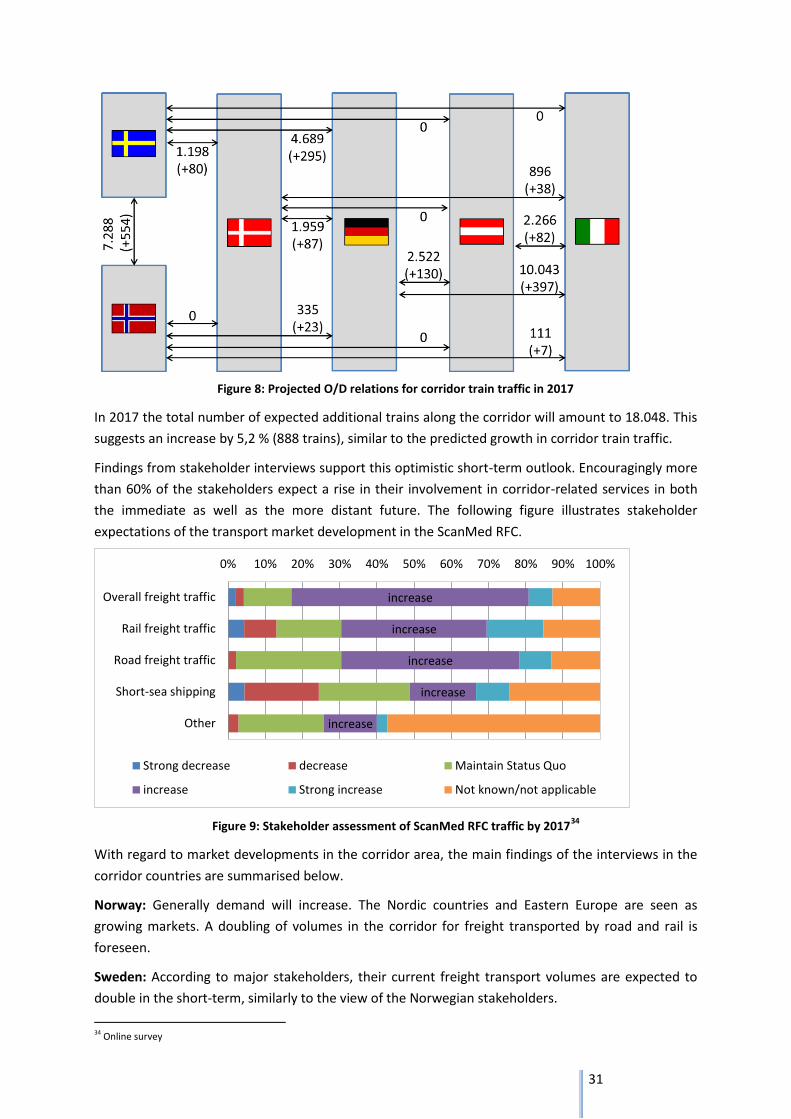
major O/D relation in ScanMed RFC. The following figure shows the major O/D relations in 2017.
31
Figure 8: Projected O/D relations for corridor train traffic in 2017
In 2017 the total number of expected additional trains along the corridor will amount to 18.048. This
suggests an increase by 5,2 % (888 trains), similar to the predicted growth in corridor train traffic.
Findings from stakeholder interviews support this optimistic short-term outlook. Encouragingly more
than 60% of the stakeholders expect a rise in their involvement in corridor-related services in both
the immediate as well as the more distant future. The following figure illustrates stakeholder
expectations of the transport market development in the ScanMed RFC.
Figure 9: Stakeholder assessment of ScanMed RFC traffic by 201734
With regard to market developments in the corridor area, the main findings of the interviews in the
corridor countries are summarised below.
Norway: Generally demand will increase. The Nordic countries and Eastern Europe are seen as
growing markets. A doubling of volumes in the corridor for freight transported by road and rail is
foreseen.
Sweden: According to major stakeholders, their current freight transport volumes are expected to
double in the short-term, similarly to the view of the Norwegian stakeholders.
34 Online survey
increase
increase
increase
increase
increase
0% 10% 20% 30% 40% 50% 60% 70% 80% 90% 100%
Overall freight traffic
Rail freight traffic
Road freight traffic
Short-sea shipping
Other
Strong decrease decrease Maintain Status Quo
increase Strong increase Not known/not applicable
32
Denmark: Generally growth is expected, however, how high this will be depends largely on the
industry sector (e.g. pulp/paper production has been decreasing lately). Nevertheless, stakeholder
estimations of between 1% growth p.a. (and 10-15% over the entire time-period) suggest a stable
outlook.
Germany: Overall, stakeholders foresee growth, however, its rate differed greatly between individual
responses ranging between 2% p.a. and 20% p.a.. Only a minority predicts stagnation (in part due to
Italy’s long-lasting recession) or a moderate rise for their company’s involvement.
Italy: Most stakeholders expect a recovery with the aim for a low/slight increase in growth. The more
optimistic answers foresee 8% growth for business in the time-period and a fivefold increase in
transported tonnage (however for road and rail together).
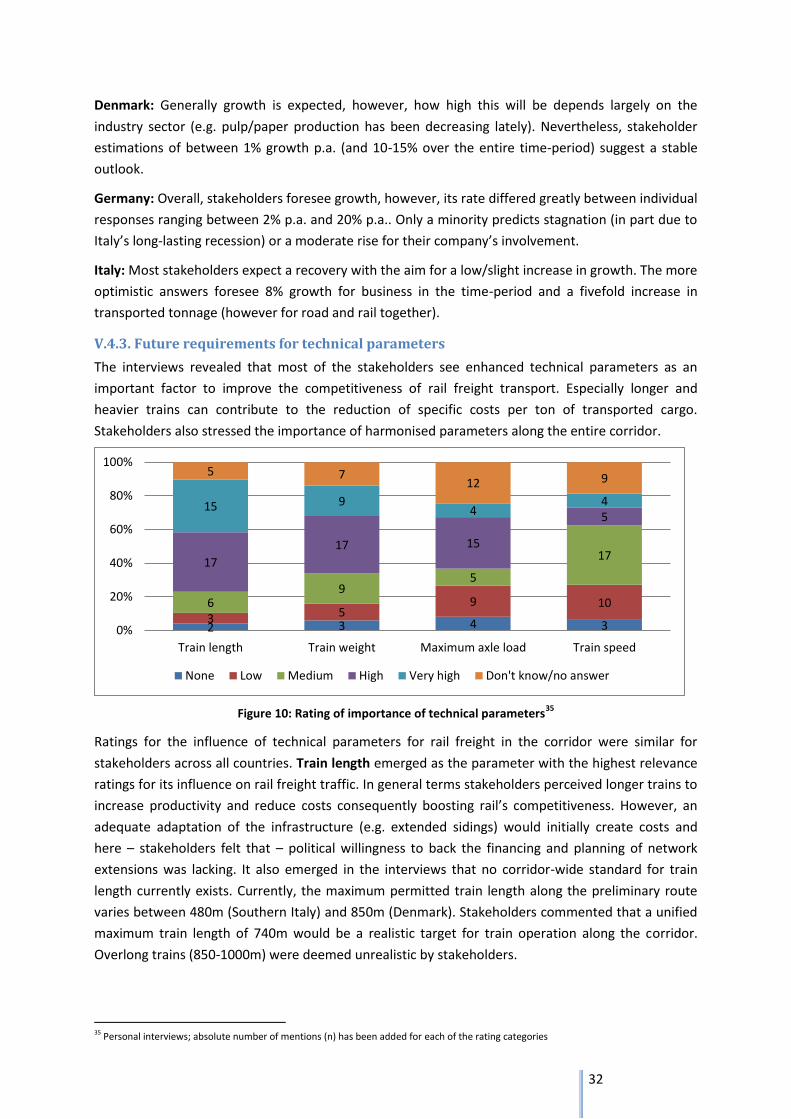
V.4.3. Future requirements for technical parameters
The interviews revealed that most of the stakeholders see enhanced technical parameters as an
important factor to improve the competitiveness of rail freight transport. Especially longer and
heavier trains can contribute to the reduction of specific costs per ton of transported cargo.
Stakeholders also stressed the importance of harmonised parameters along the entire corridor.
Figure 10: Rating of importance of technical parameters35
Ratings for the influence of technical parameters for rail freight in the corridor were similar for
stakeholders across all countries. Train length emerged as the parameter with the highest relevance
ratings for its influence on rail freight traffic. In general terms stakeholders perceived longer trains to
increase productivity and reduce costs consequently boosting rail’s competitiveness. However, an
adequate adaptation of the infrastructure (e.g. extended sidings) would initially create costs and
here – stakeholders felt that – political willingness to back the financing and planning of network
extensions was lacking. It also emerged in the interviews that no corridor-wide standard for train
length currently exists. Currently, the maximum permitted train length along the preliminary route
varies between 480m (Southern Italy) and 850m (Denmark). Stakeholders commented that a unified
maximum train length of 740m would be a realistic target for train operation along the corridor.
Overlong trains (850-1000m) were deemed unrealistic by stakeholders.
35 Personal interviews; absolute number of mentions (n) has been added for each of the rating categories
2 3 4 3 3 5
9 10 6 9
5
17 17
17 15
5 15 9
4 4
5 7 12 9
0%
20%
40%
60%
80%
100%
Train length Train weight Maximum axle load Train speed
None Low Medium High Very high Don't know/no answer
33
An increase in train weight was considered desirable, as this too is a price-determining factor.
However, train weight is not solely dependent on the cargo’s weight and certain routes/sections can
only support lower weights (e.g. Kiel channel and the Brenner Pass constitute weight-related
bottlenecks). In sum, however, train weight was not deemed particularly relevant for combined
traffic and extensive D4 standard coverage was felt to be sufficient by stakeholders.
No need was voiced by stakeholders to alter the axle load of 22.5t, as this is already the maximum
and, though closely related to length and weight, it is of little relevance to combined traffic.
With regards to maximum speed the stakeholders stressed that the average travel speed is more
important than maximum speed and that the last mile is very often the determining factor with
regards to reliable overall travel times. Though 120-140km/h would be technically possible in
Germany it was felt by stakeholders that a constant maximum speed of 100-120km/h would be both
sufficient and less costly. Reported travel speeds for Italy were a lot lower (as low as 50km/h in one
instance) and this highlights stakeholders’ opinions that freight trains’ speed has not been sufficiently
harmonised to date.
With regards to the influence of longer and/or heavier trains on transport volumes stakeholders
commonly stated that enhancing these parameters would render rail-based freight transport more
efficient, allow for competitive pricing due to higher transport volumes and hence lower units costs.
However the network infrastructure was deemed the main hindering factor to enable longer and
heavier trains. Here, it was felt by stakeholders, a long-term solution to international bottlenecks
presently dampening train lengths and weights ought to be sought.
V.4.4. Identification of long term trends likely to impact international rail freight
Studies projecting both economic and freight traffic development trends expect an overall positive
economic development, increased integration of European markets and thereby growing transport
demand in the coming years. This is assumed despite the economic crisis of 2008/2009, from which
most European countries, especially the ScanMed RFC countries, have been recovering fairly well.
This expected growth is supported by the following assumptions36:
a growing worldwide network of production, logistics and transport
a growing degree of labour division both within the EU member states and worldwide
an increase of goods’ volumes on site and transported around the globe
an increase of international trade will influence volumes of long-distance hinterland traffic
a possible goods’ structure effect for rail freight traffic
Rail freight might especially be able to benefit from this growth as long-distance hinterland
transportation (>300km) will increase. Rail freight will, however, have to become more efficient and
benefit more from interoperability and inter-modality investments, in order not to lose possible
growth to other transport modes. Seamless door-to-door transport chains are necessary for freight
customers and these depend on:
the production costs on the mainline run
railway infrastructure
interoperability in Europe
transparent information politics for customers
36 comp. König/Hecht 2012
34
safety and security measures along the route
Overall, a further growth of transport volumes and transport performance along the corridor is to be
expected also in the long term. Stakeholder interviews and the current market studies regarding the
economic and transport-related development within the EU and in the ScanMed RFC countries tend
to confirm this assumption. Despite this positive trend, a major change of modal split in favour of rail
is not likely to occur by 2030. Rail traffic development along ScanMed RFC will be positively affected
by two major infrastructure projects: the implementation of the Brenner Base tunnel and the
realisation of the Fixed Fehmarnbelt link. The related traffic forecasts indicate that – in the best case
scenario – both the overall market situation and the positive effects of these investments could lead
to a doubling of freight transport volumes by 2030. The resulting cost and time savings as well as
improvements to operational stability will strengthen the competitive situation of rail transport.
However, these investments alone will not lead to a major change of modal split in favour of rail.
From the current point of view, intermodal transport will contribute more to any additional rail
volumes than wagonload traffic. Although the technical network conditions on the corridor are
generally already suitable for intermodal transport, an upgrade of the loading gauge on Italian line
sections south of Verona for transport of semi-trailers on conventional pocket wagons might support
the development of intermodal transport.
The share of hinterland traffic from and to the major sea ports in Italy and Germany is currently very
low and the growth potential appears limited in comparison to other rail freight corridors (e. g.
Rhine-Alpine and North Sea Baltic corridors). However, an attractive ScanMed RFC could support the
development of hinterland services from the Italian ports to southern Germany.
V.5. Conclusions and recommendations
V.5.1. SWOT Analysis37
The SWOT analysis was applied as an analytical tool to identify strengths and weaknesses for the
development of rail freight traffic in ScanMed RFC. The possible opportunities and threats are
derived from these strengths and weaknesses and assessed according to their influence on rail
freight developments.
For the means of this study, four categories have been identified and assessed by SWOT analysis
technique:
Institutional elements are understood to be external factors, such as EU legal acts, safety
standards, and organisational frameworks in the ScanMed RFC countries.
Economic elements refer to overall economic developments in the EU as well as per ScanMed
RFC country, per transport mode and per type of good.
Organisational elements represent the internal dimension that can be influenced by the IMs
themselves (while the institutional elements influence the overall market development and its
functions). These include cross-country cooperation, information policies and other general
factors.
Technical and infrastructural elements include issues such as ERTMS deployment status along
ScanMed RFC as well as bottlenecks.
37 SWOT stands for Strengths, Weaknesses, Opportunities and Threats

35
The Table reported below summarizes the main results achieved by the SWOT Analysis for each of
the above listed categories.
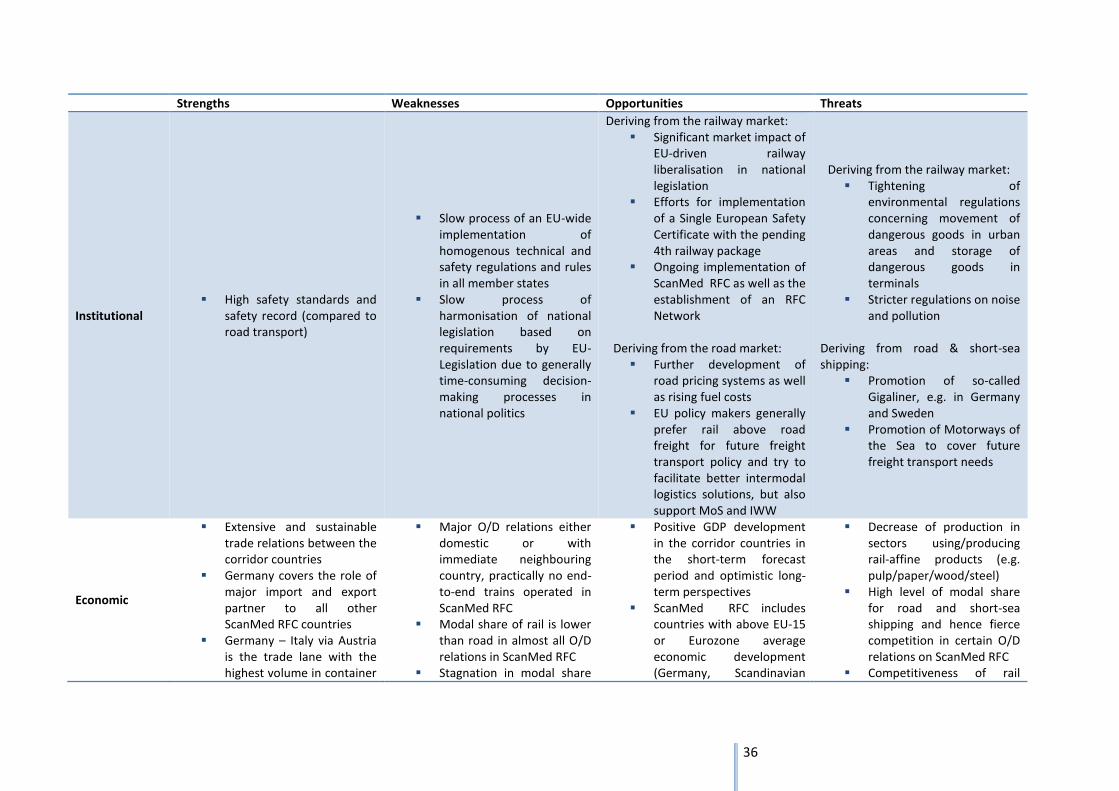
36
Strengths Weaknesses Opportunities Threats
Institutional High safety standards and
safety record (compared to road transport)
Slow process of an EU-wide implementation of homogenous technical and safety regulations and rules in all member states
Slow process of harmonisation of national legislation based on requirements by EU-Legislation due to generally time-consuming decision-making processes in national politics
Deriving from the railway market: Significant market impact of
EU-driven railway liberalisation in national legislation
Efforts for implementation of a Single European Safety Certificate with the pending 4th railway package
Ongoing implementation of ScanMed RFC as well as the establishment of an RFC Network
Deriving from the road market:
Further development of road pricing systems as well as rising fuel costs
EU policy makers generally prefer rail above road freight for future freight transport policy and try to facilitate better intermodal logistics solutions, but also support MoS and IWW
Deriving from the railway market: Tightening of
environmental regulations concerning movement of dangerous goods in urban areas and storage of dangerous goods in terminals
Stricter regulations on noise and pollution
Deriving from road & short-sea shipping:
Promotion of so-called Gigaliner, e.g. in Germany and Sweden
Promotion of Motorways of the Sea to cover future freight transport needs
Economic
Extensive and sustainable trade relations between the corridor countries
Germany covers the role of major import and export partner to all other ScanMed RFC countries
Germany – Italy via Austria is the trade lane with the highest volume in container
Major O/D relations either domestic or with immediate neighbouring country, practically no end-to-end trains operated in ScanMed RFC
Modal share of rail is lower than road in almost all O/D relations in ScanMed RFC
Stagnation in modal share
Positive GDP development in the corridor countries in the short-term forecast period and optimistic long-term perspectives
ScanMed RFC includes countries with above EU-15 or Eurozone average economic development (Germany, Scandinavian
Decrease of production in sectors using/producing rail-affine products (e.g. pulp/paper/wood/steel)
High level of modal share for road and short-sea shipping and hence fierce competition in certain O/D relations on ScanMed RFC
Competitiveness of rail
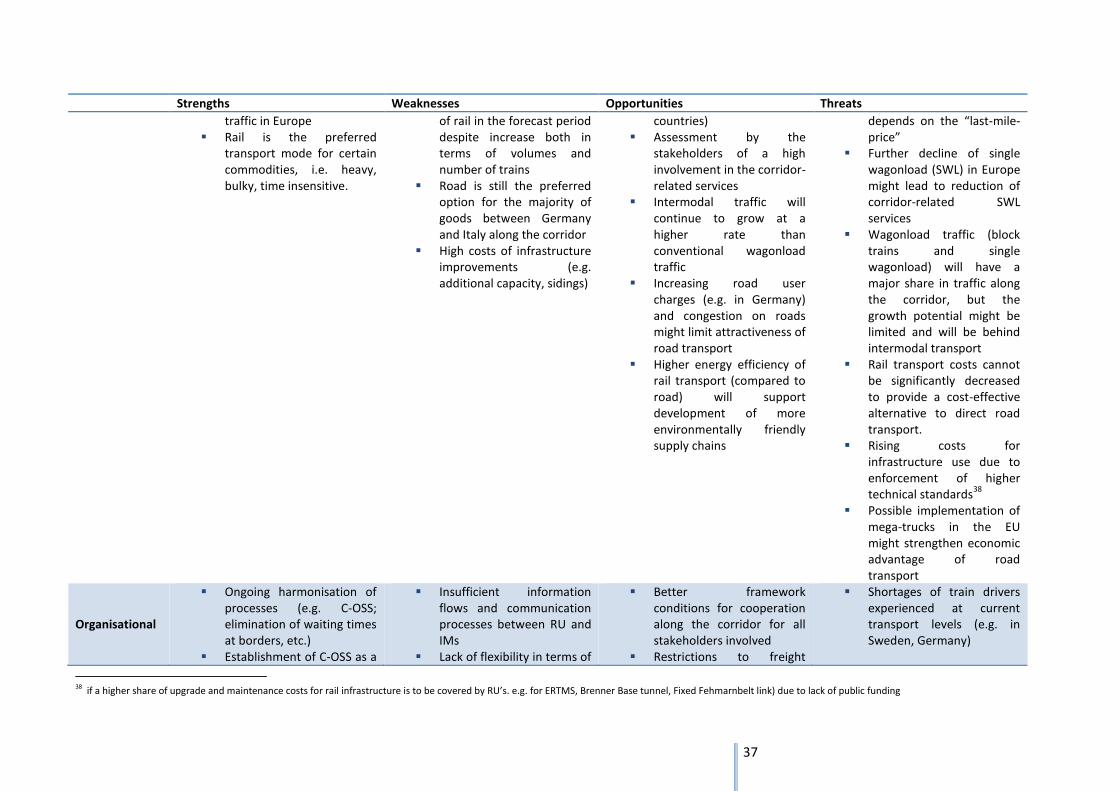
37
Strengths Weaknesses Opportunities Threats
traffic in Europe Rail is the preferred
transport mode for certain commodities, i.e. heavy, bulky, time insensitive.
of rail in the forecast period despite increase both in terms of volumes and number of trains
Road is still the preferred option for the majority of goods between Germany and Italy along the corridor
High costs of infrastructure improvements (e.g. additional capacity, sidings)
countries) Assessment by the
stakeholders of a high involvement in the corridor-related services
Intermodal traffic will continue to grow at a higher rate than conventional wagonload traffic
Increasing road user charges (e.g. in Germany) and congestion on roads might limit attractiveness of road transport
Higher energy efficiency of rail transport (compared to road) will support development of more environmentally friendly supply chains
depends on the “last-mile-price”
Further decline of single wagonload (SWL) in Europe might lead to reduction of corridor-related SWL services
Wagonload traffic (block trains and single wagonload) will have a major share in traffic along the corridor, but the growth potential might be limited and will be behind intermodal transport
Rail transport costs cannot be significantly decreased to provide a cost-effective alternative to direct road transport.
Rising costs for infrastructure use due to enforcement of higher technical standards
38
Possible implementation of mega-trucks in the EU might strengthen economic advantage of road transport
Organisational
Ongoing harmonisation of processes (e.g. C-OSS; elimination of waiting times at borders, etc.)
Establishment of C-OSS as a
Insufficient information flows and communication processes between RU and IMs
Lack of flexibility in terms of
Better framework conditions for cooperation along the corridor for all stakeholders involved
Restrictions to freight
Shortages of train drivers experienced at current transport levels (e.g. in Sweden, Germany)
38 if a higher share of upgrade and maintenance costs for rail infrastructure is to be covered by RU’s. e.g. for ERTMS, Brenner Base tunnel, Fixed Fehmarnbelt link) due to lack of public funding
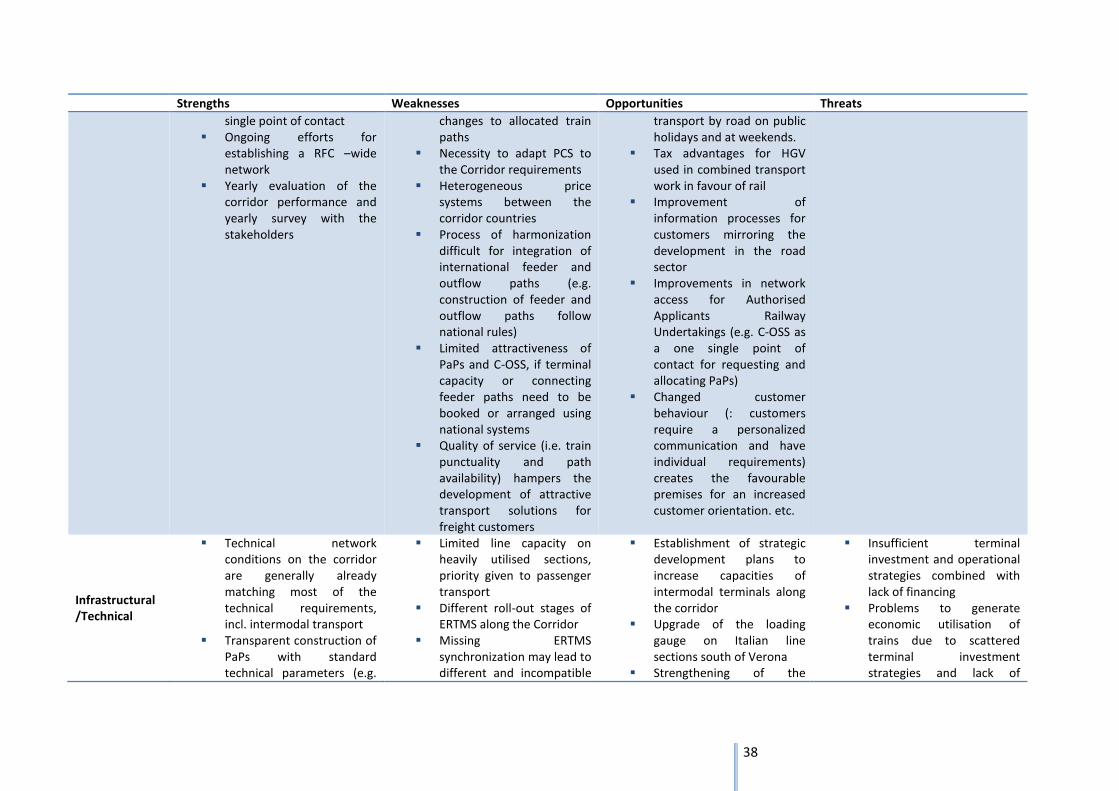
38
Strengths Weaknesses Opportunities Threats
single point of contact Ongoing efforts for
establishing a RFC –wide network
Yearly evaluation of the corridor performance and yearly survey with the stakeholders
changes to allocated train paths
Necessity to adapt PCS to the Corridor requirements
Heterogeneous price systems between the corridor countries
Process of harmonization difficult for integration of international feeder and outflow paths (e.g. construction of feeder and outflow paths follow national rules)
Limited attractiveness of PaPs and C-OSS, if terminal capacity or connecting feeder paths need to be booked or arranged using national systems
Quality of service (i.e. train punctuality and path availability) hampers the development of attractive transport solutions for freight customers
transport by road on public holidays and at weekends.
Tax advantages for HGV used in combined transport work in favour of rail
Improvement of information processes for customers mirroring the development in the road sector
Improvements in network access for Authorised Applicants Railway Undertakings (e.g. C-OSS as a one single point of contact for requesting and allocating PaPs)
Changed customer behaviour (: customers require a personalized communication and have individual requirements) creates the favourable premises for an increased customer orientation. etc.
Infrastructural /Technical
Technical network conditions on the corridor are generally already matching most of the technical requirements, incl. intermodal transport
Transparent construction of PaPs with standard technical parameters (e.g.
Limited line capacity on heavily utilised sections, priority given to passenger transport
Different roll-out stages of ERTMS along the Corridor
Missing ERTMS synchronization may lead to different and incompatible
Establishment of strategic development plans to increase capacities of intermodal terminals along the corridor
Upgrade of the loading gauge on Italian line sections south of Verona
Strengthening of the
Insufficient terminal investment and operational strategies combined with lack of financing
Problems to generate economic utilisation of trains due to scattered terminal investment strategies and lack of
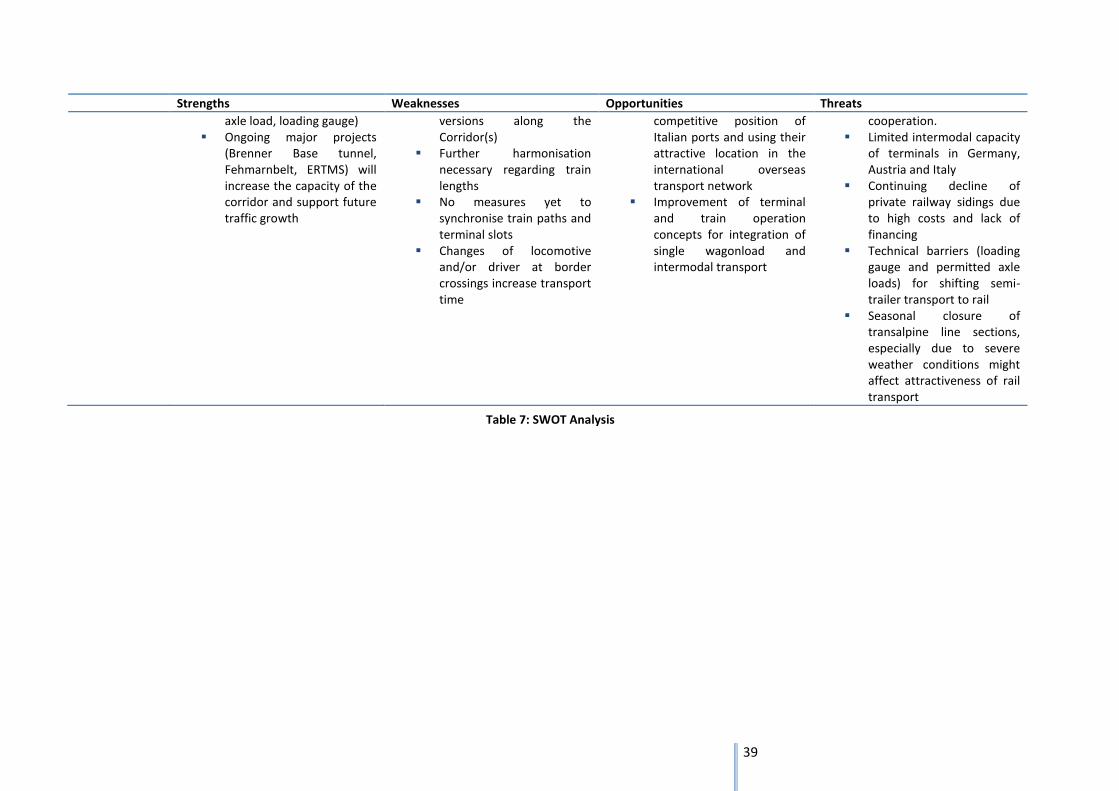
39
Strengths Weaknesses Opportunities Threats
axle load, loading gauge) Ongoing major projects
(Brenner Base tunnel, Fehmarnbelt, ERTMS) will increase the capacity of the corridor and support future traffic growth
versions along the Corridor(s)
Further harmonisation necessary regarding train lengths
No measures yet to synchronise train paths and terminal slots
Changes of locomotive and/or driver at border crossings increase transport time
competitive position of Italian ports and using their attractive location in the international overseas transport network
Improvement of terminal and train operation concepts for integration of single wagonload and intermodal transport
cooperation. Limited intermodal capacity
of terminals in Germany, Austria and Italy
Continuing decline of private railway sidings due to high costs and lack of financing
Technical barriers (loading gauge and permitted axle loads) for shifting semi-trailer transport to rail
Seasonal closure of transalpine line sections, especially due to severe weather conditions might affect attractiveness of rail transport
Table 7: SWOT Analysis
40
V.5.2. Recommendations
Institutional
Overall, the IMs cannot drive the implementation process concerning the institutional reform steps
on a national level alone, but they can push for a coordinated process across all ScanMed RFC
countries in order to maximise the strengths, which the liberalisation brings to freight traffic growth.
The IMs should therefore push for a harmonised approach to overcome the different levels of
implementation and harmonisation on the corridor. This concerns in particular the EU-wide
implementation of homogenous technical and safety regulations and rules in all member states.
Economical
From an economic point of view, the IMs should closely monitor the future economic developments
and the effects on ScanMed RFC. They need to clearly communicate the need for investments in
order to fulfil EU-wide and national policies on moving freight from road to rail. As overall costs have
a huge impact on the competiveness of rail freight the IMs should strive for an efficient infrastructure
pricing regime keeping rail freight competitive.
Organisational
(a) Corridor capacity offer
The current distribution of corridor trains clearly shows that the majority of corridor trains are not
crossing more than two corridor borders. On some of the cross-border sections (Malmö-
Copenhagen-Hamburg, Verona-Innsbruck-Munich) a higher number of corridor trains exist as
indicated in the number of corridor trains before and after these sections. This is likely to have its
origins in the existing production system, where SWL traffic at the border stations/yards is being
consolidated into international trains, but also in the change of national to international train
numbers (and vice versa) at these stations. But it is also an indication that the demand for long Pre-
arranged train paths is rather low as the RUs do not want to commit themselves and try to keep the
PaPs as short as possible to be able to react in a more flexible manner in the pre- and post-trip in the
respective country’s hinterland.
This observation is also seconded by an indication from the stakeholders that they need a higher
flexibility and availability, meaning to be able to have train path booking as flexible as possible (on a
short notice, to be able to react to market requirements or changes), which in turn should be as
highly available as possible (capacity-wise). The long lead times (i.e. booking required 9-12 months in
advance) from ordering to utilising a train path shifts the economic risk entirely to the railway
operators.
Therefore within the next couple of years the necessity to offer Pre-arranged paths along the
corridor from a market point of view corresponding to Regulation (EU) No 913/2010 (offer
internationally coordinated Pre-arranged train paths 11 months in advance) across more than 2
corridor borders is quite negligible at the moment. It is not expected that this number of trains to
increase dramatically over the next 5 years.
It can be expected that in the future RUs might go for Pre-arranged train paths at sections across
borders where capacity restraints exist (bottlenecks, no diversionary routes available) in order to
secure relevant capacity for its own traffic and to gain a competitive advantage.
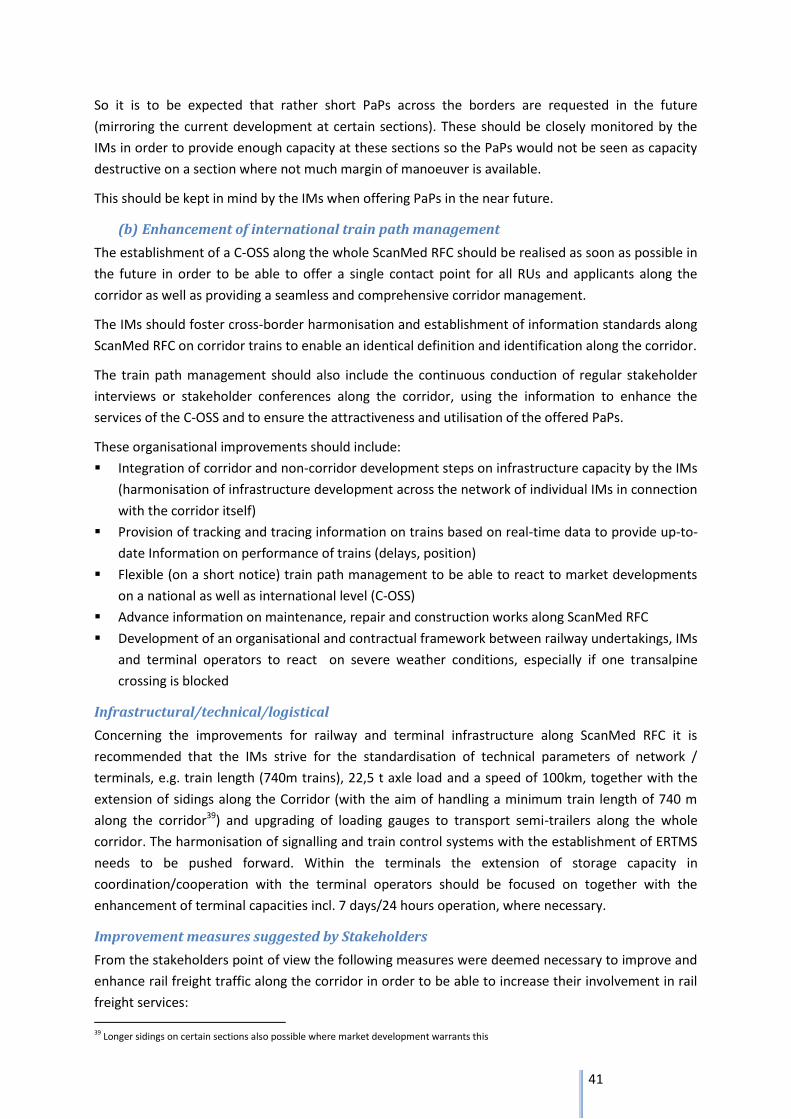
41
So it is to be expected that rather short PaPs across the borders are requested in the future
(mirroring the current development at certain sections). These should be closely monitored by the
IMs in order to provide enough capacity at these sections so the PaPs would not be seen as capacity
destructive on a section where not much margin of manoeuver is available.
This should be kept in mind by the IMs when offering PaPs in the near future.
(b) Enhancement of international train path management
The establishment of a C-OSS along the whole ScanMed RFC should be realised as soon as possible in
the future in order to be able to offer a single contact point for all RUs and applicants along the
corridor as well as providing a seamless and comprehensive corridor management.
The IMs should foster cross-border harmonisation and establishment of information standards along
ScanMed RFC on corridor trains to enable an identical definition and identification along the corridor.
The train path management should also include the continuous conduction of regular stakeholder
interviews or stakeholder conferences along the corridor, using the information to enhance the
services of the C-OSS and to ensure the attractiveness and utilisation of the offered PaPs.
These organisational improvements should include:
Integration of corridor and non-corridor development steps on infrastructure capacity by the IMs
(harmonisation of infrastructure development across the network of individual IMs in connection
with the corridor itself)
Provision of tracking and tracing information on trains based on real-time data to provide up-to-
date Information on performance of trains (delays, position)
Flexible (on a short notice) train path management to be able to react to market developments
on a national as well as international level (C-OSS)
Advance information on maintenance, repair and construction works along ScanMed RFC
Development of an organisational and contractual framework between railway undertakings, IMs
and terminal operators to react on severe weather conditions, especially if one transalpine
crossing is blocked
Infrastructural/technical/logistical
Concerning the improvements for railway and terminal infrastructure along ScanMed RFC it is
recommended that the IMs strive for the standardisation of technical parameters of network /
terminals, e.g. train length (740m trains), 22,5 t axle load and a speed of 100km, together with the
extension of sidings along the Corridor (with the aim of handling a minimum train length of 740 m
along the corridor39) and upgrading of loading gauges to transport semi-trailers along the whole
corridor. The harmonisation of signalling and train control systems with the establishment of ERTMS
needs to be pushed forward. Within the terminals the extension of storage capacity in
coordination/cooperation with the terminal operators should be focused on together with the
enhancement of terminal capacities incl. 7 days/24 hours operation, where necessary.
Improvement measures suggested by Stakeholders
From the stakeholders point of view the following measures were deemed necessary to improve and
enhance rail freight traffic along the corridor in order to be able to increase their involvement in rail
freight services:
39 Longer sidings on certain sections also possible where market development warrants this
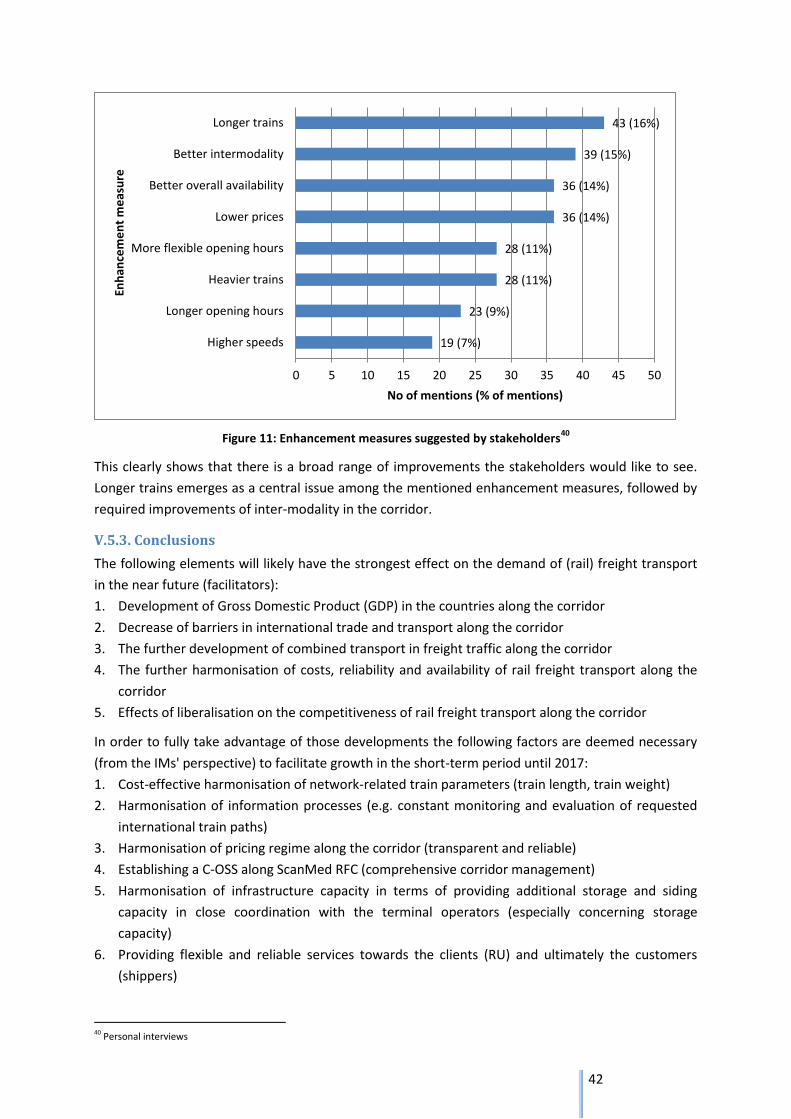
42
Figure 11: Enhancement measures suggested by stakeholders40
This clearly shows that there is a broad range of improvements the stakeholders would like to see.
Longer trains emerges as a central issue among the mentioned enhancement measures, followed by
required improvements of inter-modality in the corridor.
V.5.3. Conclusions
The following elements will likely have the strongest effect on the demand of (rail) freight transport
in the near future (facilitators):
1. Development of Gross Domestic Product (GDP) in the countries along the corridor
2. Decrease of barriers in international trade and transport along the corridor
3. The further development of combined transport in freight traffic along the corridor
4. The further harmonisation of costs, reliability and availability of rail freight transport along the
corridor
5. Effects of liberalisation on the competitiveness of rail freight transport along the corridor
In order to fully take advantage of those developments the following factors are deemed necessary
(from the IMs' perspective) to facilitate growth in the short-term period until 2017:
1. Cost-effective harmonisation of network-related train parameters (train length, train weight)
2. Harmonisation of information processes (e.g. constant monitoring and evaluation of requested
international train paths)
3. Harmonisation of pricing regime along the corridor (transparent and reliable)
4. Establishing a C-OSS along ScanMed RFC (comprehensive corridor management)
5. Harmonisation of infrastructure capacity in terms of providing additional storage and siding
capacity in close coordination with the terminal operators (especially concerning storage
capacity)
6. Providing flexible and reliable services towards the clients (RU) and ultimately the customers
(shippers)
40 Personal interviews
19 (7%)
23 (9%)
28 (11%)
28 (11%)
36 (14%)
36 (14%)
39 (15%)
43 (16%)
0 5 10 15 20 25 30 35 40 45 50
Higher speeds
Longer opening hours
Heavier trains
More flexible opening hours
Lower prices
Better overall availability
Better intermodality
Longer trains
No of mentions (% of mentions)
Enh
ance
me
nt
me
asu
re
43
7. Enhancing the service portfolio to ease network access for all corridor network users (e.g. train
handling and shunting services on shunting yards)
One of the major factors that will improve the market share of rail freight in the future will be the
price of the services including total cost of use, followed by factors like reliability and flexibility of the
services. Added to that are service information for clients and customers and service orientation
towards the customers (shippers).
VI. Investment Plan – Approach and Overview
VI.1. List of Corridor-relevant investment projects
Following Art.11 of Regulation (EU) No 913/2010, ScanMed RFC delivered a list of projects for the
extension, renewal or redeployment of the railway infrastructure.
The list of projects was defined jointly, using information from the indicative national investment
plans, with an aim to emphasize those projects that have a positive impact, in terms of efficiency and
competitiveness, on international rail freight along the Corridor including cross-border barriers and
barriers somewhere else. The components of the list are an indicative commitment of Member
States to provide the necessary resources for the development of the Corridor and may encounter
adjustments in time, costs and financing.
The list of projects that are relevant for managing the capacity of international rail freight is detailed
in Annex VII. The Annex provides information on the nature of the project, its cost, the contribution
of EU-Funding whenever relevant, the financing status and the benefit expected from the project for
the capacity of international rail freight.
Following this approach, the IMs of ScanMed RFC identified 99 projects and clustered them in
three different time horizons:
Short term: 2014-2019
Medium term: 2020-2024
Long term: 2025 and beyond
three different maturity stages:
Secured: financed and approved projects;
Planned: not yet financed or approved projects;
D/R (Development and Review): Studies or projects to be shifted in time.
The list encloses projects reaching a total cost of 98 billion €41.
41 ERTMS and CBTC deployment in Denmark, the cost of which is estimated at approx. 2,0 billion€ is not included in the cost overview given in this chapter, as ScanMed RFC stretches could not be individualized within the deployment project on the whole national network.
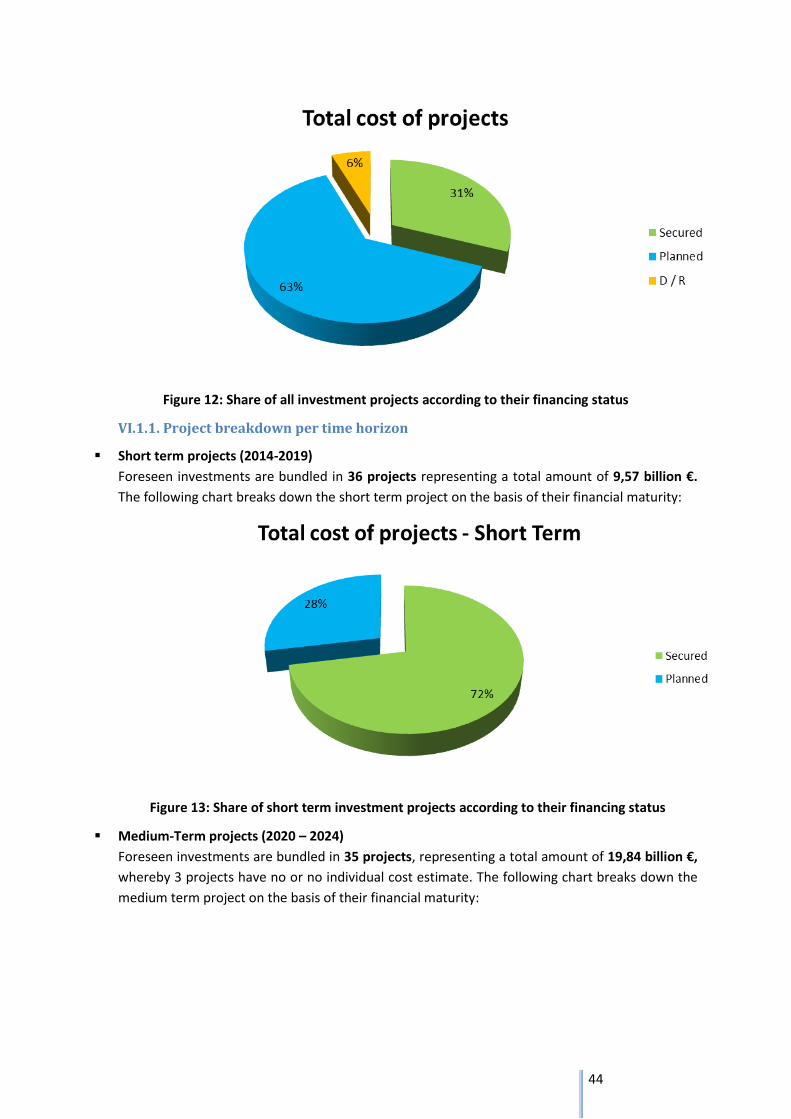
44
Figure 12: Share of all investment projects according to their financing status
VI.1.1. Project breakdown per time horizon
Short term projects (2014-2019)
Foreseen investments are bundled in 36 projects representing a total amount of 9,57 billion €.
The following chart breaks down the short term project on the basis of their financial maturity:
Figure 13: Share of short term investment projects according to their financing status
Medium-Term projects (2020 – 2024)
Foreseen investments are bundled in 35 projects, representing a total amount of 19,84 billion €,
whereby 3 projects have no or no individual cost estimate. The following chart breaks down the
medium term project on the basis of their financial maturity:
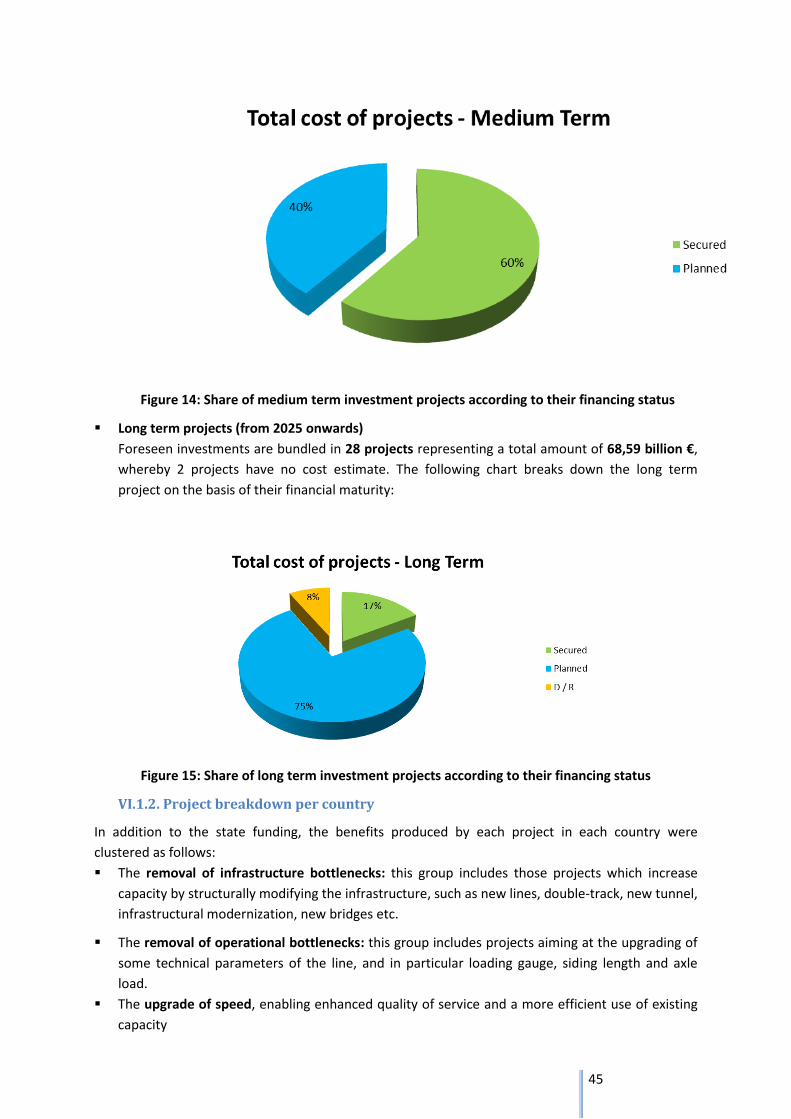
45
Figure 14: Share of medium term investment projects according to their financing status
Long term projects (from 2025 onwards)
Foreseen investments are bundled in 28 projects representing a total amount of 68,59 billion €,
whereby 2 projects have no cost estimate. The following chart breaks down the long term
project on the basis of their financial maturity:
Figure 15: Share of long term investment projects according to their financing status
VI.1.2. Project breakdown per country
In addition to the state funding, the benefits produced by each project in each country were
clustered as follows:
The removal of infrastructure bottlenecks: this group includes those projects which increase
capacity by structurally modifying the infrastructure, such as new lines, double-track, new tunnel,
infrastructural modernization, new bridges etc.
The removal of operational bottlenecks: this group includes projects aiming at the upgrading of
some technical parameters of the line, and in particular loading gauge, siding length and axle
load.
The upgrade of speed, enabling enhanced quality of service and a more efficient use of existing
capacity
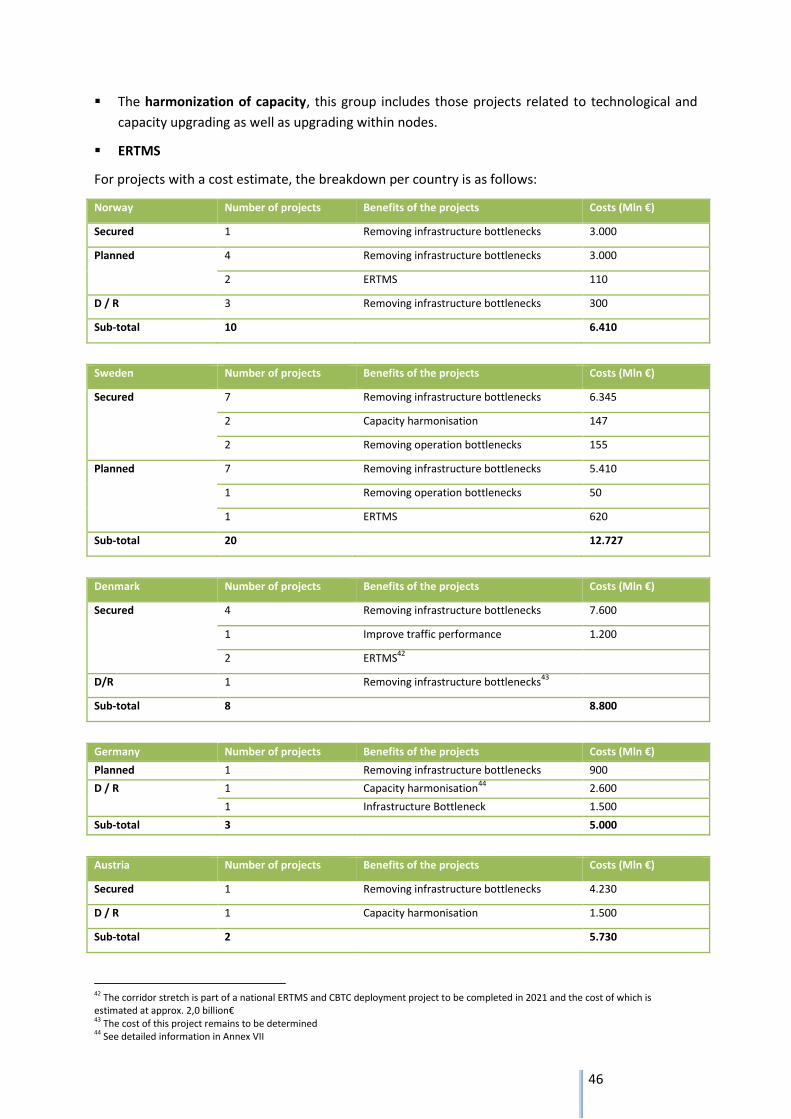
46
The harmonization of capacity, this group includes those projects related to technological and
capacity upgrading as well as upgrading within nodes.
ERTMS
For projects with a cost estimate, the breakdown per country is as follows:
Norway Number of projects Benefits of the projects Costs (Mln €)
Secured 1 Removing infrastructure bottlenecks 3.000
Planned 4 Removing infrastructure bottlenecks 3.000
2 ERTMS 110
D / R 3 Removing infrastructure bottlenecks 300
Sub-total 10 6.410
Sweden Number of projects Benefits of the projects Costs (Mln €)
Secured 7 Removing infrastructure bottlenecks 6.345
2 Capacity harmonisation 147
2 Removing operation bottlenecks 155
Planned 7 Removing infrastructure bottlenecks 5.410
1 Removing operation bottlenecks 50
1 ERTMS 620
Sub-total 20 12.727
Denmark Number of projects Benefits of the projects Costs (Mln €)
Secured 4 Removing infrastructure bottlenecks 7.600
1 Improve traffic performance 1.200
2 ERTMS42
D/R 1 Removing infrastructure bottlenecks43
Sub-total 8 8.800
Germany Number of projects Benefits of the projects Costs (Mln €)
Planned 1 Removing infrastructure bottlenecks 900
D / R
1 Capacity harmonisation44
2.600
1 Infrastructure Bottleneck 1.500
Sub-total 3 5.000
Austria Number of projects Benefits of the projects Costs (Mln €)
Secured 1 Removing infrastructure bottlenecks 4.230
D / R 1 Capacity harmonisation 1.500
Sub-total 2 5.730
42 The corridor stretch is part of a national ERTMS and CBTC deployment project to be completed in 2021 and the cost of which is estimated at approx. 2,0 billion€ 43 The cost of this project remains to be determined 44 See detailed information in Annex VII
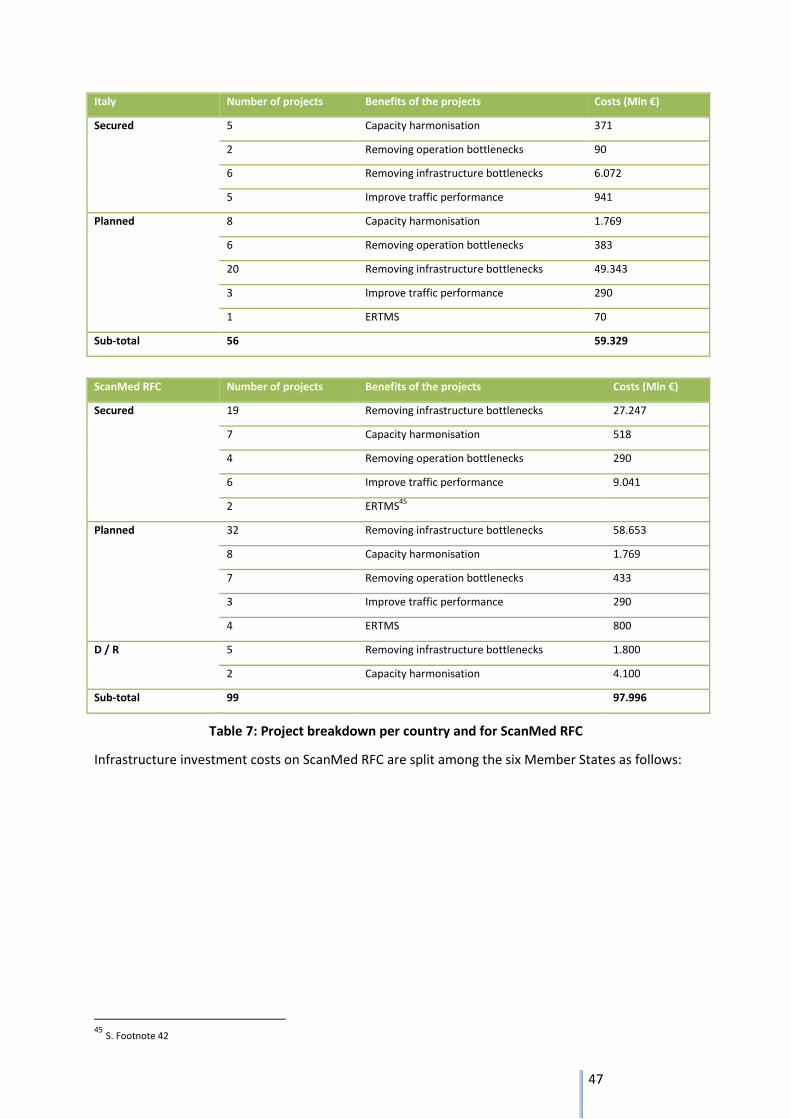
47
Italy Number of projects Benefits of the projects Costs (Mln €)
Secured 5 Capacity harmonisation 371
2 Removing operation bottlenecks 90
6 Removing infrastructure bottlenecks 6.072
5 Improve traffic performance 941
Planned
8 Capacity harmonisation 1.769
6 Removing operation bottlenecks 383
20 Removing infrastructure bottlenecks 49.343
3 Improve traffic performance 290
1 ERTMS 70
Sub-total 56 59.329
ScanMed RFC Number of projects Benefits of the projects Costs (Mln €)
Secured 19 Removing infrastructure bottlenecks 27.247
7 Capacity harmonisation 518
4 Removing operation bottlenecks 290
6 Improve traffic performance 9.041
2 ERTMS45
Planned 32 Removing infrastructure bottlenecks 58.653
8 Capacity harmonisation 1.769
7 Removing operation bottlenecks 433
3 Improve traffic performance 290
4 ERTMS 800
D / R 5 Removing infrastructure bottlenecks 1.800
2 Capacity harmonisation 4.100
Sub-total 99 97.996
Table 7: Project breakdown per country and for ScanMed RFC
Infrastructure investment costs on ScanMed RFC are split among the six Member States as follows:
45
S. Footnote 42
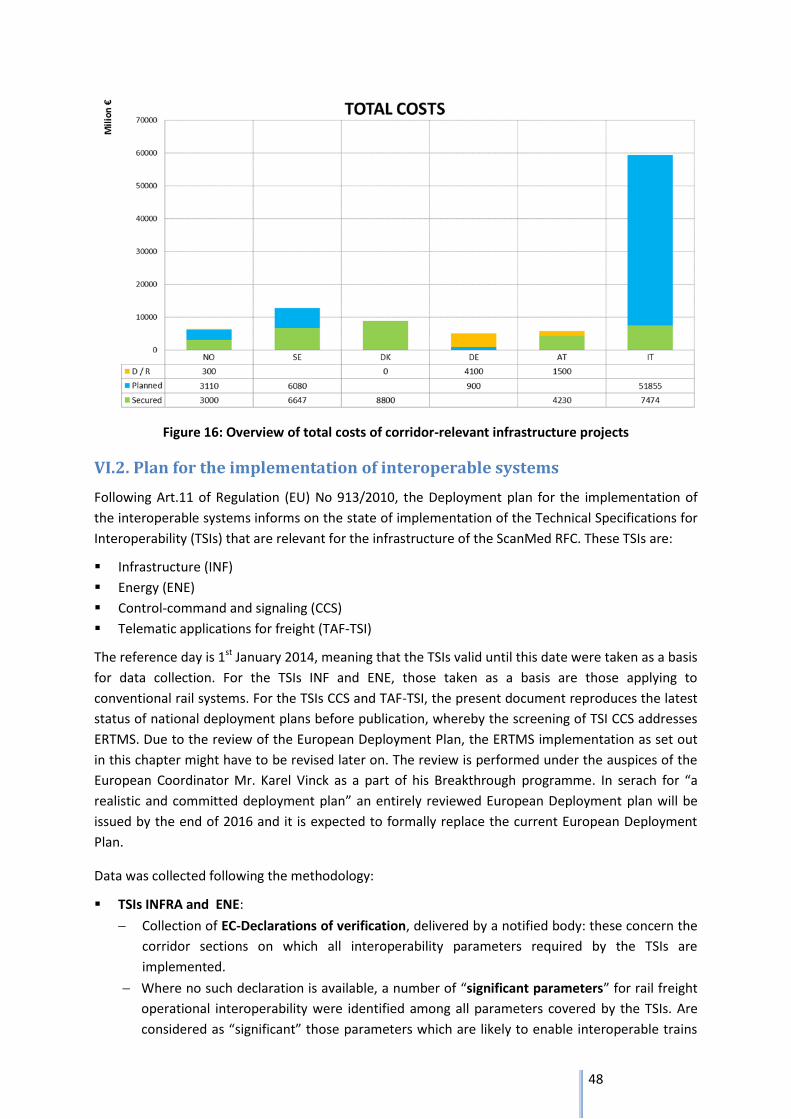
48
Figure 16: Overview of total costs of corridor-relevant infrastructure projects
VI.2. Plan for the implementation of interoperable systems
Following Art.11 of Regulation (EU) No 913/2010, the Deployment plan for the implementation of
the interoperable systems informs on the state of implementation of the Technical Specifications for
Interoperability (TSIs) that are relevant for the infrastructure of the ScanMed RFC. These TSIs are:
Infrastructure (INF)
Energy (ENE)
Control-command and signaling (CCS)
Telematic applications for freight (TAF-TSI)
The reference day is 1st January 2014, meaning that the TSIs valid until this date were taken as a basis
for data collection. For the TSIs INF and ENE, those taken as a basis are those applying to
conventional rail systems. For the TSIs CCS and TAF-TSI, the present document reproduces the latest
status of national deployment plans before publication, whereby the screening of TSI CCS addresses
ERTMS. Due to the review of the European Deployment Plan, the ERTMS implementation as set out
in this chapter might have to be revised later on. The review is performed under the auspices of the
European Coordinator Mr. Karel Vinck as a part of his Breakthrough programme. In serach for “a
realistic and committed deployment plan” an entirely reviewed European Deployment plan will be
issued by the end of 2016 and it is expected to formally replace the current European Deployment
Plan.
Data was collected following the methodology:
TSIs INFRA and ENE:
Collection of EC-Declarations of verification, delivered by a notified body: these concern the
corridor sections on which all interoperability parameters required by the TSIs are
implemented.
Where no such declaration is available, a number of “significant parameters” for rail freight
operational interoperability were identified among all parameters covered by the TSIs. Are
considered as “significant” those parameters which are likely to enable interoperable trains
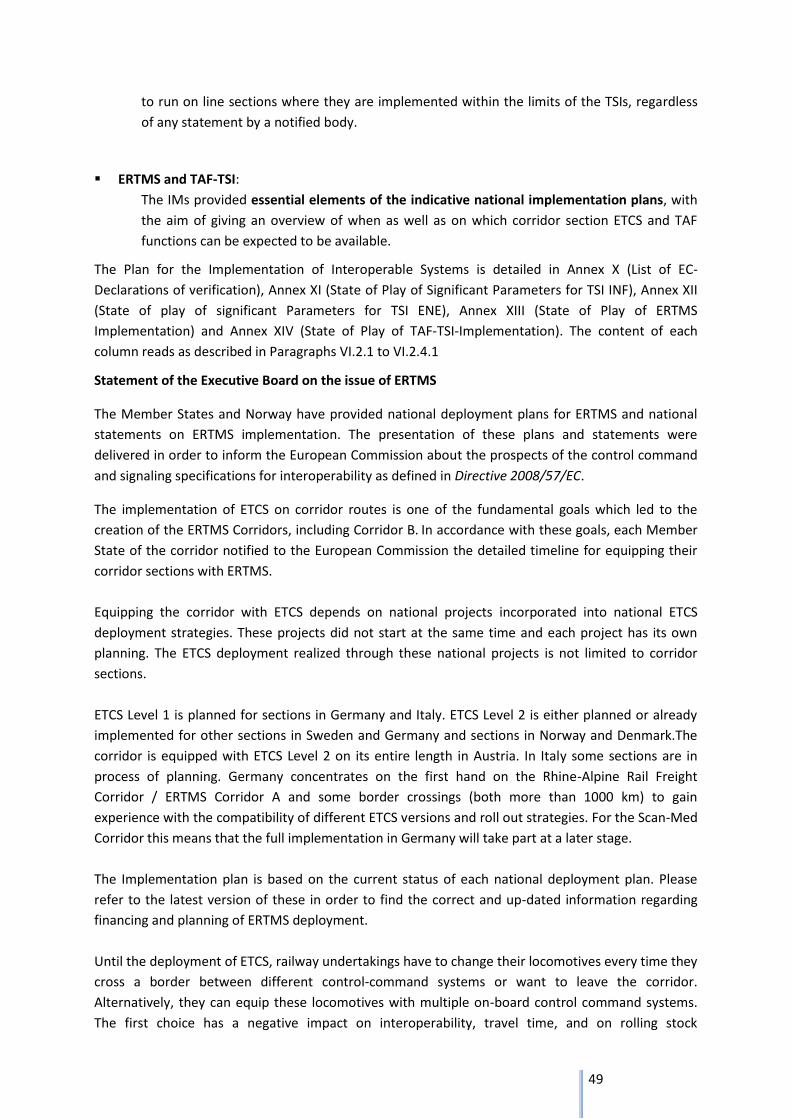
49
to run on line sections where they are implemented within the limits of the TSIs, regardless
of any statement by a notified body.
ERTMS and TAF-TSI:
The IMs provided essential elements of the indicative national implementation plans, with
the aim of giving an overview of when as well as on which corridor section ETCS and TAF
functions can be expected to be available.
The Plan for the Implementation of Interoperable Systems is detailed in Annex X (List of EC-
Declarations of verification), Annex XI (State of Play of Significant Parameters for TSI INF), Annex XII
(State of play of significant Parameters for TSI ENE), Annex XIII (State of Play of ERTMS
Implementation) and Annex XIV (State of Play of TAF-TSI-Implementation). The content of each
column reads as described in Paragraphs VI.2.1 to VI.2.4.1
Statement of the Executive Board on the issue of ERTMS
The Member States and Norway have provided national deployment plans for ERTMS and national
statements on ERTMS implementation. The presentation of these plans and statements were
delivered in order to inform the European Commission about the prospects of the control command
and signaling specifications for interoperability as defined in Directive 2008/57/EC.
The implementation of ETCS on corridor routes is one of the fundamental goals which led to the
creation of the ERTMS Corridors, including Corridor B.
In accordance with these goals, each Member
State of the corridor notified to the European Commission the detailed timeline for equipping their
corridor sections with ERTMS.
Equipping the corridor with ETCS depends on national projects incorporated into national ETCS
deployment strategies. These projects did not start at the same time and each project has its own
planning. The ETCS deployment realized through these national projects is not limited to corridor
sections.
ETCS Level 1 is planned for sections in Germany and Italy. ETCS Level 2 is either planned or already
implemented for other sections in Sweden and Germany and sections in Norway and Denmark.The
corridor is equipped with ETCS Level 2 on its entire length in Austria. In Italy some sections are in
process of planning. Germany concentrates on the first hand on the Rhine-Alpine Rail Freight
Corridor / ERTMS Corridor A and some border crossings (both more than 1000 km) to gain
experience with the compatibility of different ETCS versions and roll out strategies. For the Scan-Med
Corridor this means that the full implementation in Germany will take part at a later stage.
The Implementation plan is based on the current status of each national deployment plan. Please
refer to the latest version of these in order to find the correct and up-dated information regarding
financing and planning of ERTMS deployment.
Until the deployment of ETCS, railway undertakings have to change their locomotives every time they
cross a border between different control-command systems or want to leave the corridor.
Alternatively, they can equip these locomotives with multiple on-board control command systems.
The first choice has a negative impact on interoperability, travel time, and on rolling stock
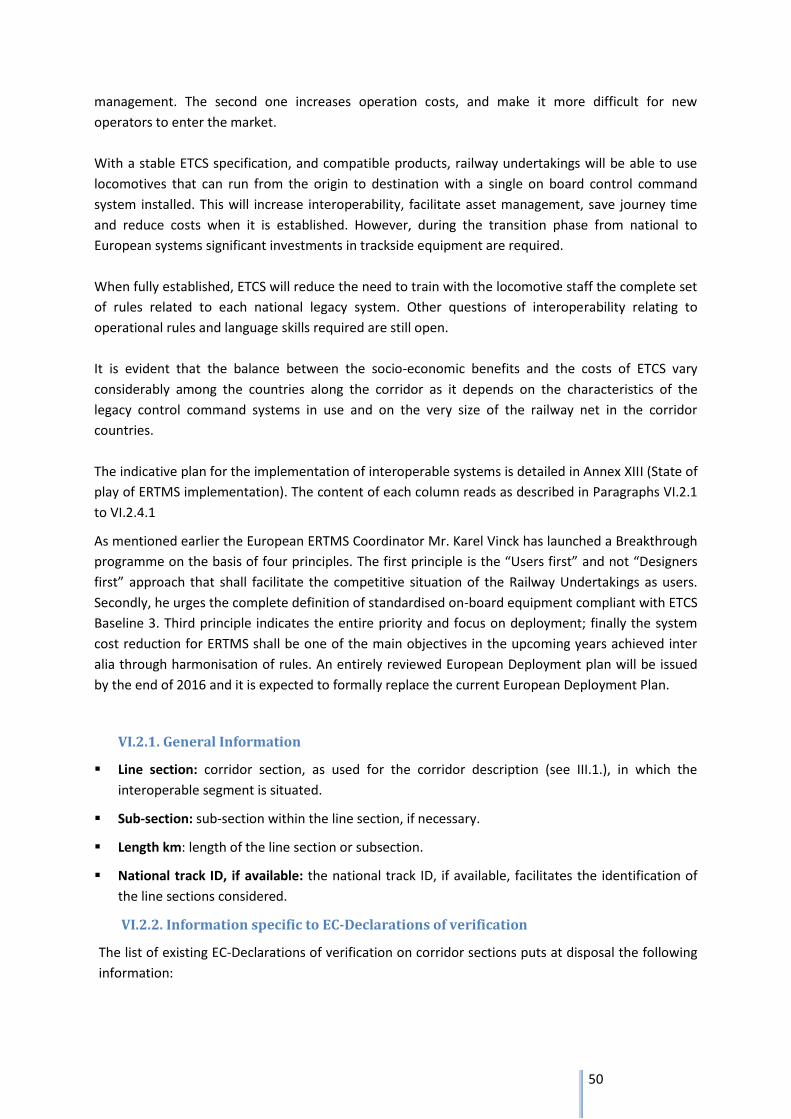
50
management. The second one increases operation costs, and make it more difficult for new
operators to enter the market.
With a stable ETCS specification, and compatible products, railway undertakings will be able to use
locomotives that can run from the origin to destination with a single on board control command
system installed. This will increase interoperability, facilitate asset management, save journey time
and reduce costs when it is established. However, during the transition phase from national to
European systems significant investments in trackside equipment are required.
When fully established, ETCS will reduce the need to train with the locomotive staff the complete set
of rules related to each national legacy system. Other questions of interoperability relating to
operational rules and language skills required are still open.
It is evident that the balance between the socio-economic benefits and the costs of ETCS vary
considerably among the countries along the corridor as it depends on the characteristics of the
legacy control command systems in use and on the very size of the railway net in the corridor
countries.
The indicative plan for the implementation of interoperable systems is detailed in Annex XIII (State of
play of ERTMS implementation). The content of each column reads as described in Paragraphs VI.2.1
to VI.2.4.1
As mentioned earlier the European ERTMS Coordinator Mr. Karel Vinck has launched a Breakthrough
programme on the basis of four principles. The first principle is the “Users first” and not “Designers
first” approach that shall facilitate the competitive situation of the Railway Undertakings as users.
Secondly, he urges the complete definition of standardised on-board equipment compliant with ETCS
Baseline 3. Third principle indicates the entire priority and focus on deployment; finally the system
cost reduction for ERTMS shall be one of the main objectives in the upcoming years achieved inter
alia through harmonisation of rules. An entirely reviewed European Deployment plan will be issued
by the end of 2016 and it is expected to formally replace the current European Deployment Plan.
VI.2.1. General Information
Line section: corridor section, as used for the corridor description (see III.1.), in which the
interoperable segment is situated.
Sub-section: sub-section within the line section, if necessary.
Length km: length of the line section or subsection.
National track ID, if available: the national track ID, if available, facilitates the identification of
the line sections considered.
VI.2.2. Information specific to EC-Declarations of verification
The list of existing EC-Declarations of verification on corridor sections puts at disposal the following
information:

51
Line section to which the EC-Declaration applies: interoperable segment to which the EC-
Declaration of verification applies. This segment is identical with the line section stated on the
front page of the EC-Declaration of verification.
From [km], to which the declaration applies: origin, in kilometers, of the line section to which
the EC-Declaration of verification applies.
To [km], to which the declaration applies: end, in kilometers, of the line section, to which the
EC-declaration of verification applies.
Verified [INF/ENE/CCS]: verified subsystem according to the EC-Declaration of verification.
Certificate ID: the certificate ID facilitates the identification of the EC-Declaration of verification.
Date of issue [Month, Year]: date of issue, in month and year, of the EC-Declaration of
verification.
VI.2.3. Information specific to the significant parameters
VI.2.3.1. TSI Infrastructure
Structure gauge: current structure gauge in Gabarit A, B or C. In cases, where there is no exact
classification in Gabarit possible, the national structure gauge definitions (as in Austria) or the
intermodal freight code (as in Italy) is given.
Maximum gradients of each line section and the corresponding uphill direction (South-North, or
North-South).
Minimum radius of horizontal curves on each line section
Nominal track gauge of each line section
Cant on each line section
Cant deficiency on plain track and on through route on each line section
In-Service geometry of switches and crossings: information on whether national limits for In-
Service geometry of switches and crossings meet the requirements of the TSI Infrastructure.
Maximum unguided length of fixed obtuse crossings: information on whether the national limits
for Maximum unguided length of fixed obtuse crossings meet the requirements of the TSI
Infrastructure.
Track resistance to vertical loads, Resistance of new bridges to traffic loads- Vertical loads and
Resistance of existing bridges and earth works of traffic loads: information on the category of
the line section.
VI.2.3.2. TSI Energy
Voltage and frequency on each line section.
Maximum train current in Ampere [A]
Current capacity, DC systems, trains at still stand: current capacity at DC systems for trains at
still stand. This parameter is only applicable if the energy supply system is a DC system.
Contact wire height, variation in contact wire height, lateral deviation, pantograph gauge,
mean contact force, phase separation sections, system separation sections – Pantograph raised
and System separation sections – Pantographs lowered: information on whether these
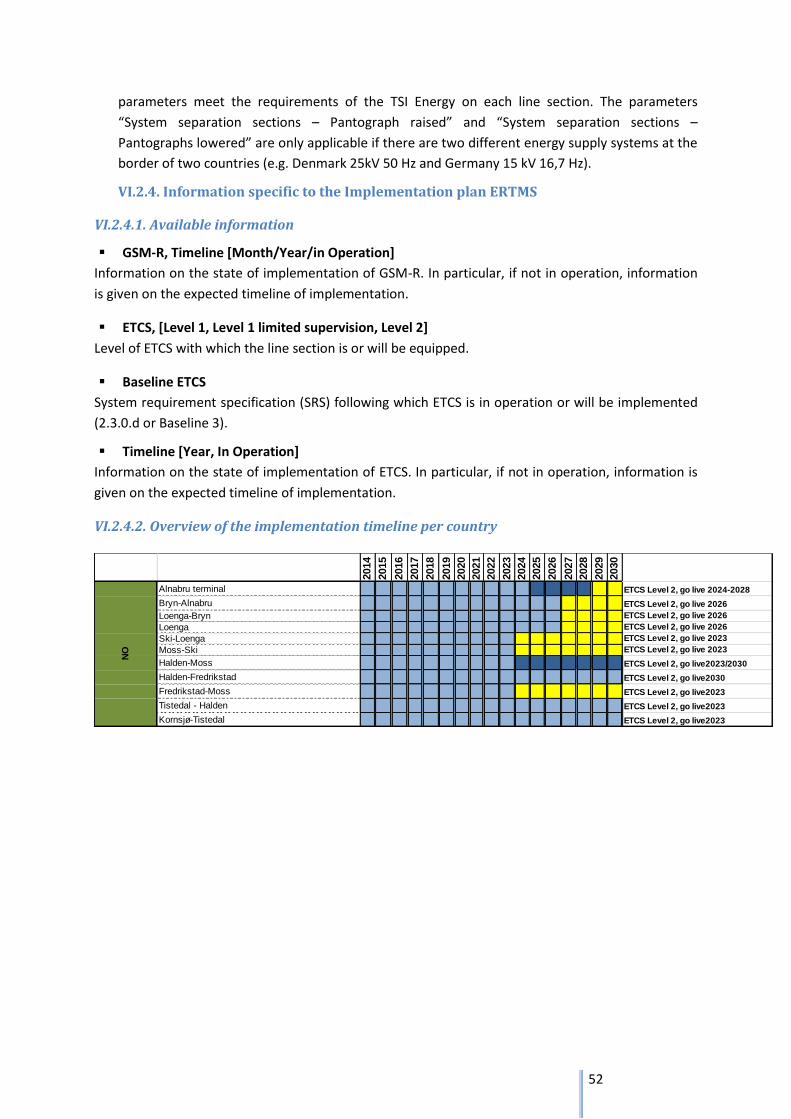
52
parameters meet the requirements of the TSI Energy on each line section. The parameters
“System separation sections – Pantograph raised” and “System separation sections –
Pantographs lowered” are only applicable if there are two different energy supply systems at the
border of two countries (e.g. Denmark 25kV 50 Hz and Germany 15 kV 16,7 Hz).
VI.2.4. Information specific to the Implementation plan ERTMS
VI.2.4.1. Available information
GSM-R, Timeline [Month/Year/in Operation]
Information on the state of implementation of GSM-R. In particular, if not in operation, information
is given on the expected timeline of implementation.
ETCS, [Level 1, Level 1 limited supervision, Level 2]
Level of ETCS with which the line section is or will be equipped.
Baseline ETCS
System requirement specification (SRS) following which ETCS is in operation or will be implemented
(2.3.0.d or Baseline 3).
Timeline [Year, In Operation]
Information on the state of implementation of ETCS. In particular, if not in operation, information is
given on the expected timeline of implementation.
VI.2.4.2. Overview of the implementation timeline per country
2014
2015
2016
2017
2018
2019
2020
2021
2022
2023
2024
2025
2026
2027
2028
2029
2030
Alnabru terminal ETCS Level 2, go live 2024-2028
Bryn-Alnabru ETCS Level 2, go live 2026
Loenga-Bryn ETCS Level 2, go live 2026
Loenga ETCS Level 2, go live 2026
Ski-Loenga ETCS Level 2, go live 2023
Moss-Ski ETCS Level 2, go live 2023
Halden-Moss ETCS Level 2, go live2023/2030
Halden-Fredrikstad ETCS Level 2, go live2030
Fredrikstad-Moss ETCS Level 2, go live2023
Tistedal - Halden ETCS Level 2, go live2023
Kornsjø-Tistedal ETCS Level 2, go live2023
NO
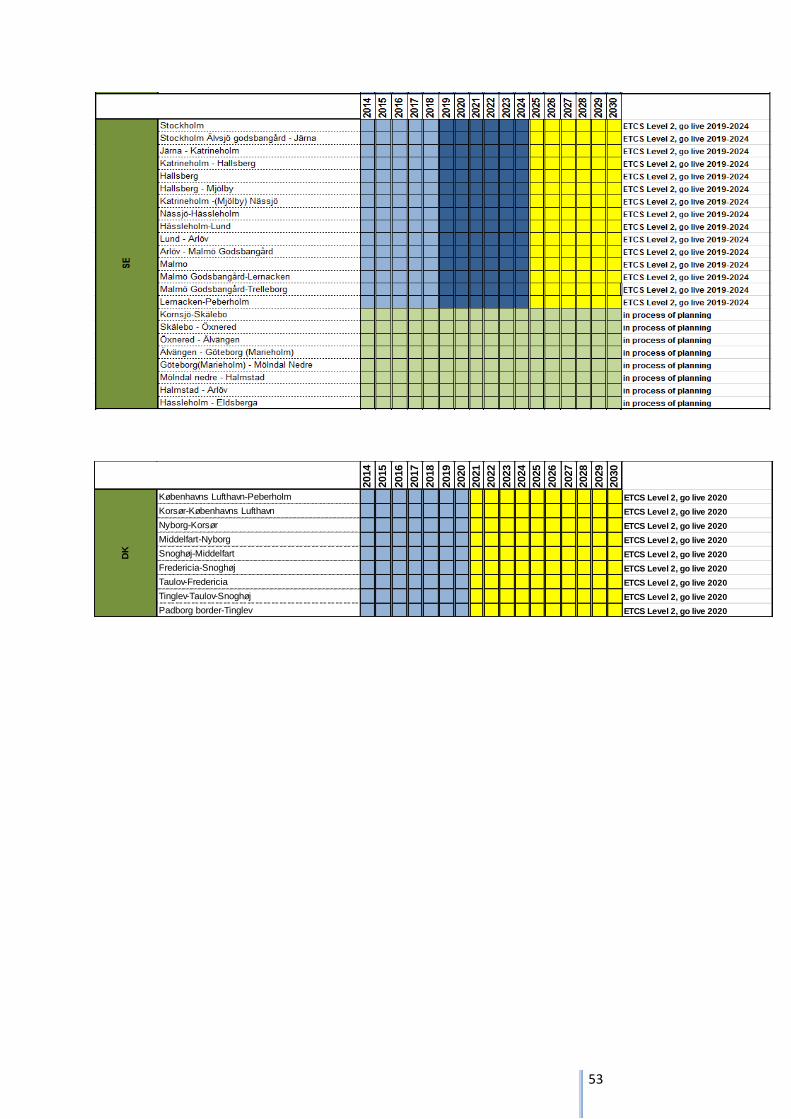
53
2014
2015
2016
2017
2018
2019
2020
2021
2022
2023
2024
2025
2026
2027
2028
2029
2030
Københavns Lufthavn-Peberholm ETCS Level 2, go live 2020
Korsør-Københavns Lufthavn ETCS Level 2, go live 2020
Nyborg-Korsør ETCS Level 2, go live 2020
Middelfart-Nyborg ETCS Level 2, go live 2020
Snoghøj-Middelfart ETCS Level 2, go live 2020
Fredericia-Snoghøj ETCS Level 2, go live 2020
Taulov-Fredericia ETCS Level 2, go live 2020
Tinglev-Taulov-Snoghøj ETCS Level 2, go live 2020
Padborg border-Tinglev ETCS Level 2, go live 2020
DK
in process of planing
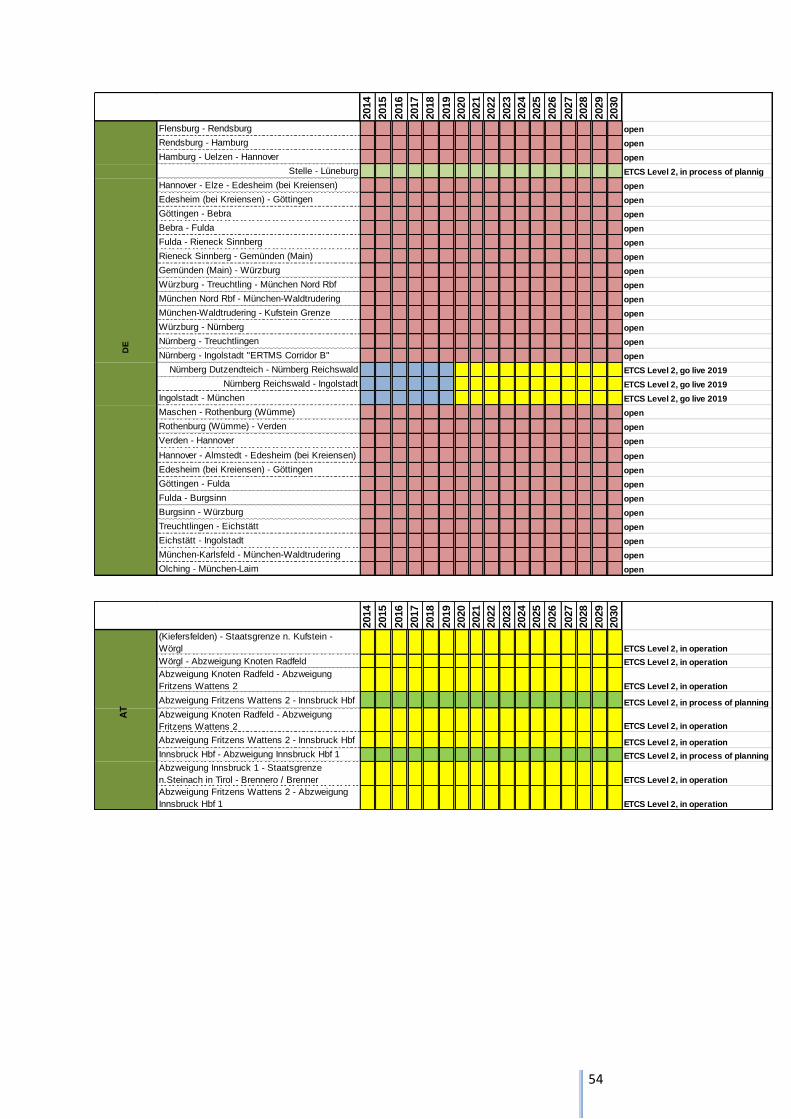
54
2014
2015
2016
2017
2018
2019
2020
2021
2022
2023
2024
2025
2026
2027
2028
2029
2030
Flensburg - Rendsburg open
Rendsburg - Hamburg open
Hamburg - Uelzen - Hannover open
Stelle - Lüneburg ETCS Level 2, in process of plannig
Hannover - Elze - Edesheim (bei Kreiensen) open
Edesheim (bei Kreiensen) - Göttingen open
Göttingen - Bebra open
Bebra - Fulda open
Fulda - Rieneck Sinnberg open
Rieneck Sinnberg - Gemünden (Main) open
Gemünden (Main) - Würzburg open
Würzburg - Treuchtling - München Nord Rbf open
München Nord Rbf - München-Waldtrudering open
München-Waldtrudering - Kufstein Grenze open
Würzburg - Nürnberg open
Nürnberg - Treuchtlingen open
Nürnberg - Ingolstadt "ERTMS Corridor B" open
Nürnberg Dutzendteich - Nürnberg Reichswald ETCS Level 2, go live 2019
Nürnberg Reichswald - Ingolstadt ETCS Level 2, go live 2019
Ingolstadt - München ETCS Level 2, go live 2019
Maschen - Rothenburg (Wümme) open
Rothenburg (Wümme) - Verden open
Verden - Hannover open
Hannover - Almstedt - Edesheim (bei Kreiensen) open
Edesheim (bei Kreiensen) - Göttingen open
Göttingen - Fulda open
Fulda - Burgsinn open
Burgsinn - Würzburg open
Treuchtlingen - Eichstätt open
Eichstätt - Ingolstadt open
München-Karlsfeld - München-Waldtrudering open
Olching - München-Laim open
DE
2014
2015
2016
2017
2018
2019
2020
2021
2022
2023
2024
2025
2026
2027
2028
2029
2030
(Kiefersfelden) - Staatsgrenze n. Kufstein -
Wörgl ETCS Level 2, in operation
Wörgl - Abzweigung Knoten Radfeld ETCS Level 2, in operation
Abzweigung Knoten Radfeld - Abzweigung
Fritzens Wattens 2 ETCS Level 2, in operation
Abzweigung Fritzens Wattens 2 - Innsbruck Hbf ETCS Level 2, in process of planning
Abzweigung Knoten Radfeld - Abzweigung
Fritzens Wattens 2 ETCS Level 2, in operation
Abzweigung Fritzens Wattens 2 - Innsbruck Hbf ETCS Level 2, in operation
Innsbruck Hbf - Abzweigung Innsbruck Hbf 1 ETCS Level 2, in process of planning
Abzweigung Innsbruck 1 - Staatsgrenze
n.Steinach in Tirol - Brennero / Brenner ETCS Level 2, in operation
Abzweigung Fritzens Wattens 2 - Abzweigung
Innsbruck Hbf 1 ETCS Level 2, in operation
AT
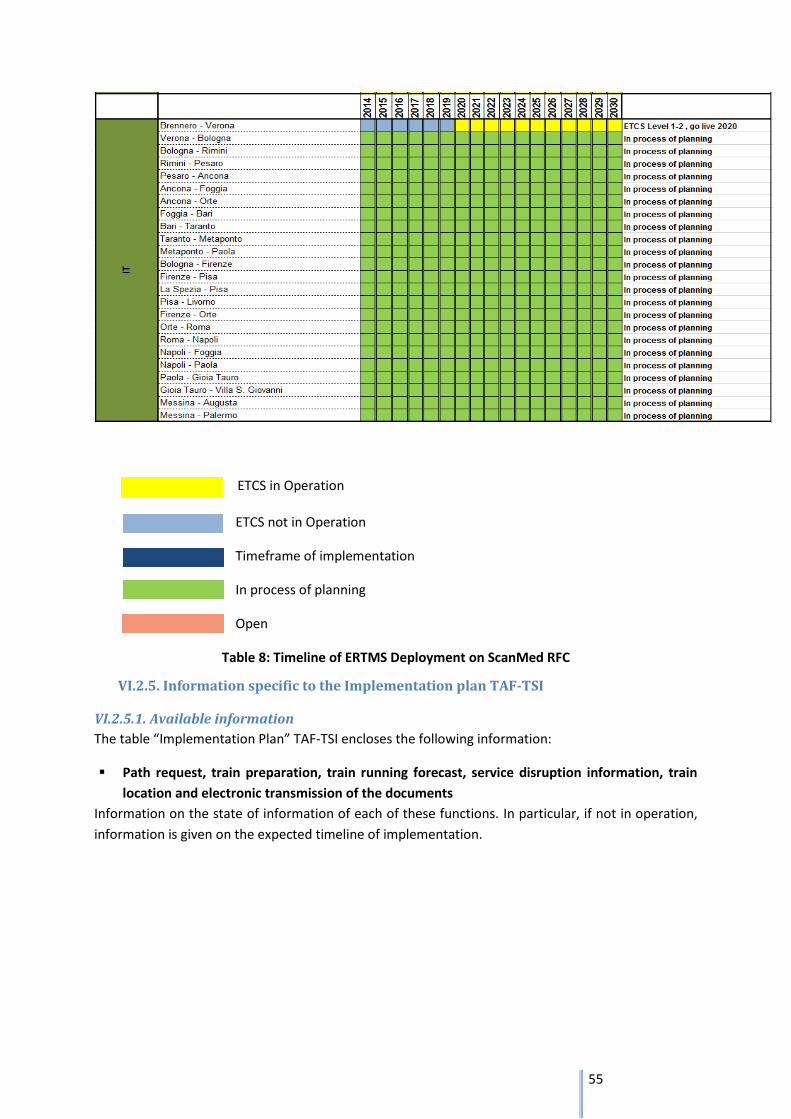
55
ETCS in Operation
ETCS not in Operation
Timeframe of implementation
In process of planning
Open
Table 8: Timeline of ERTMS Deployment on ScanMed RFC
VI.2.5. Information specific to the Implementation plan TAF-TSI
VI.2.5.1. Available information
The table “Implementation Plan” TAF-TSI encloses the following information:
Path request, train preparation, train running forecast, service disruption information, train
location and electronic transmission of the documents
Information on the state of information of each of these functions. In particular, if not in operation,
information is given on the expected timeline of implementation.
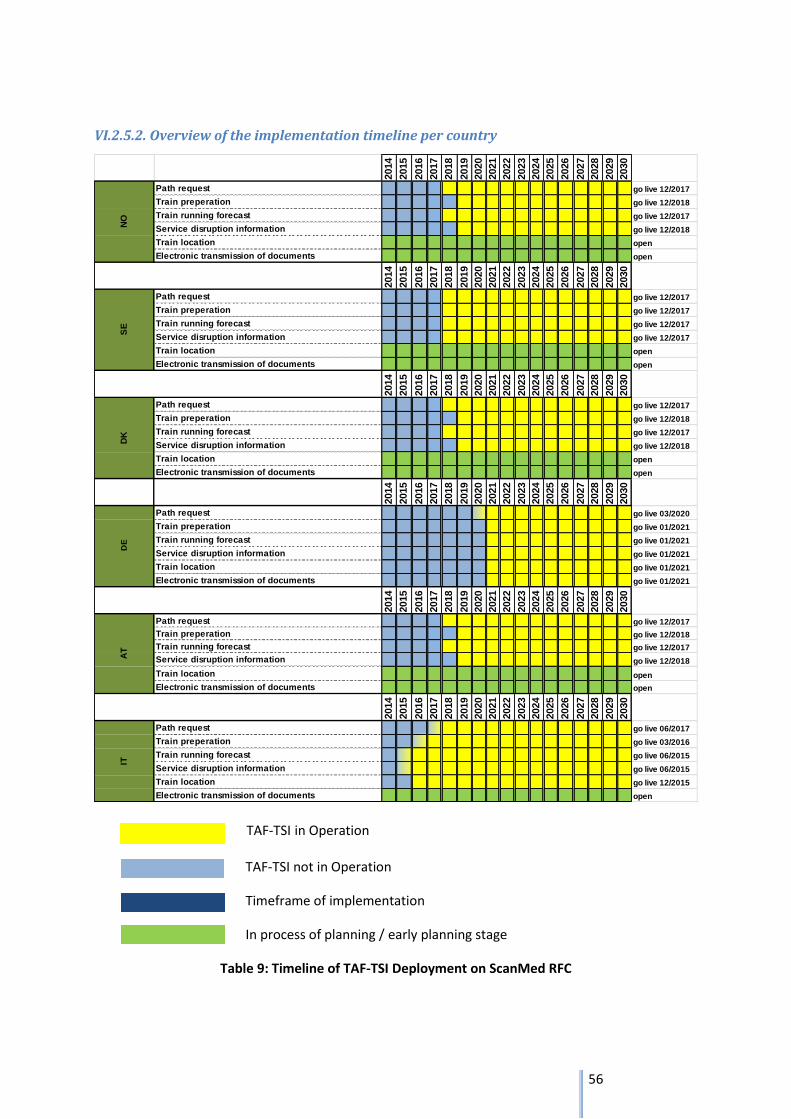
56
VI.2.5.2. Overview of the implementation timeline per country
TAF-TSI in Operation
TAF-TSI not in Operation
Timeframe of implementation
In process of planning / early planning stage
Table 9: Timeline of TAF-TSI Deployment on ScanMed RFC
2014
2015
2016
2017
2018
2019
2020
2021
2022
2023
2024
2025
2026
2027
2028
2029
2030
Path request go live 12/2017
Train preperation go live 12/2018
Train running forecast go live 12/2017
Service disruption information go live 12/2018
Train location open
Electronic transmission of documents open
2014
2015
2016
2017
2018
2019
2020
2021
2022
2023
2024
2025
2026
2027
2028
2029
2030
Path request go live 12/2017
Train preperation go live 12/2017
Train running forecast go live 12/2017
Service disruption information go live 12/2017
Train location open
Electronic transmission of documents open
2014
2015
2016
2017
2018
2019
2020
2021
2022
2023
2024
2025
2026
2027
2028
2029
2030
Path request go live 12/2017
Train preperation go live 12/2018
Train running forecast go live 12/2017
Service disruption information go live 12/2018
Train location open
Electronic transmission of documents open
2014
2015
2016
2017
2018
2019
2020
2021
2022
2023
2024
2025
2026
2027
2028
2029
2030
Path request go live 03/2020
Train preperation go live 01/2021
Train running forecast go live 01/2021
Service disruption information go live 01/2021
Train location go live 01/2021
Electronic transmission of documents go live 01/2021
2014
2015
2016
2017
2018
2019
2020
2021
2022
2023
2024
2025
2026
2027
2028
2029
2030
Path request go live 12/2017
Train preperation go live 12/2018
Train running forecast go live 12/2017
Service disruption information go live 12/2018
Train location open
Electronic transmission of documents open
2014
2015
2016
2017
2018
2019
2020
2021
2022
2023
2024
2025
2026
2027
2028
2029
2030
Path request go live 06/2017
Train preperation go live 03/2016
Train running forecast go live 06/2015
Service disruption information go live 06/2015
Train location go live 12/2015
Electronic transmission of documents open
IT
NO
SE
DK
DE
AT
in process of planing
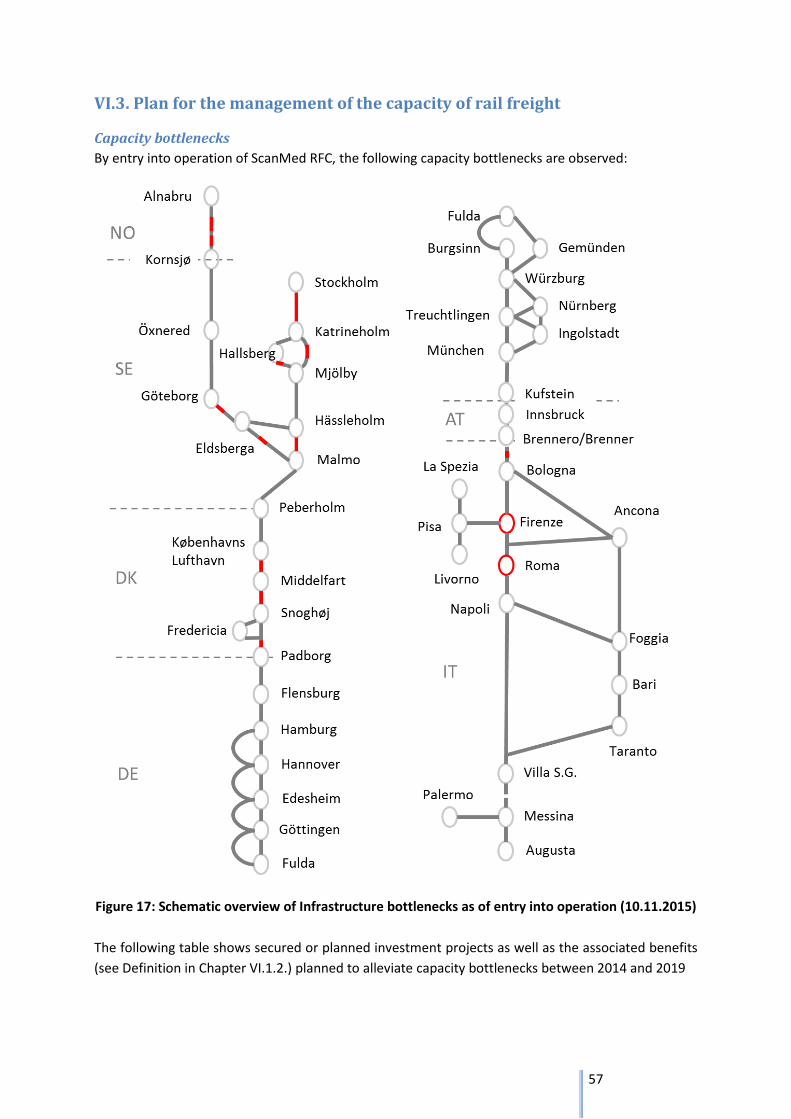
57
VI.3. Plan for the management of the capacity of rail freight
Capacity bottlenecks
By entry into operation of ScanMed RFC, the following capacity bottlenecks are observed:
Figure 17: Schematic overview of Infrastructure bottlenecks as of entry into operation (10.11.2015)
The following table shows secured or planned investment projects as well as the associated benefits
(see Definition in Chapter VI.1.2.) planned to alleviate capacity bottlenecks between 2014 and 2019
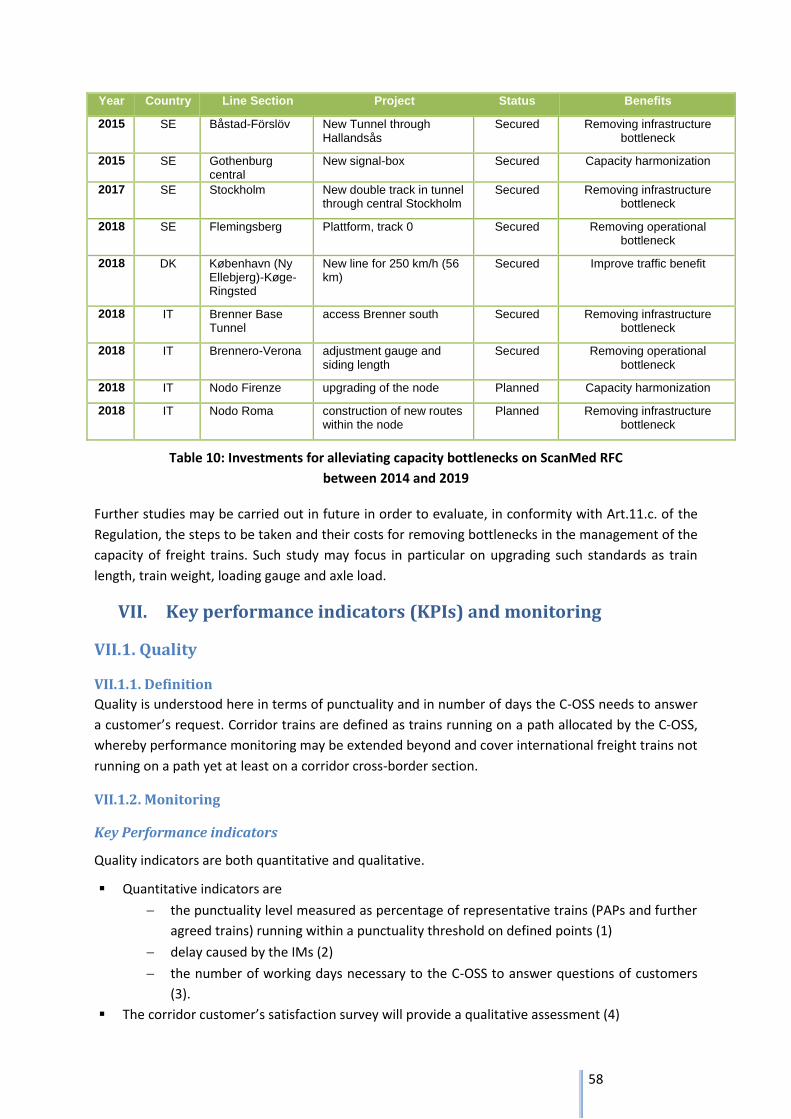
58
Year Country Line Section Project Status Benefits
2015 SE Båstad-Förslöv New Tunnel through Hallandsås
Secured Removing infrastructure bottleneck
2015 SE Gothenburg central
New signal-box Secured Capacity harmonization
2017 SE Stockholm New double track in tunnel through central Stockholm
Secured Removing infrastructure bottleneck
2018 SE Flemingsberg Plattform, track 0 Secured Removing operational bottleneck
2018 DK København (Ny Ellebjerg)-Køge-Ringsted
New line for 250 km/h (56 km)
Secured Improve traffic benefit
2018 IT Brenner Base Tunnel
access Brenner south Secured Removing infrastructure bottleneck
2018 IT Brennero-Verona adjustment gauge and siding length
Secured Removing operational bottleneck
2018 IT Nodo Firenze upgrading of the node Planned Capacity harmonization
2018 IT Nodo Roma construction of new routes within the node
Planned Removing infrastructure bottleneck
Table 10: Investments for alleviating capacity bottlenecks on ScanMed RFC
between 2014 and 2019
Further studies may be carried out in future in order to evaluate, in conformity with Art.11.c. of the
Regulation, the steps to be taken and their costs for removing bottlenecks in the management of the
capacity of freight trains. Such study may focus in particular on upgrading such standards as train
length, train weight, loading gauge and axle load.
VII. Key performance indicators (KPIs) and monitoring
VII.1. Quality
VII.1.1. Definition
Quality is understood here in terms of punctuality and in number of days the C-OSS needs to answer
a customer’s request. Corridor trains are defined as trains running on a path allocated by the C-OSS,
whereby performance monitoring may be extended beyond and cover international freight trains not
running on a path yet at least on a corridor cross-border section.
VII.1.2. Monitoring
Key Performance indicators
Quality indicators are both quantitative and qualitative.
Quantitative indicators are
the punctuality level measured as percentage of representative trains (PAPs and further
agreed trains) running within a punctuality threshold on defined points (1)
delay caused by the IMs (2)
the number of working days necessary to the C-OSS to answer questions of customers
(3).
The corridor customer’s satisfaction survey will provide a qualitative assessment (4)
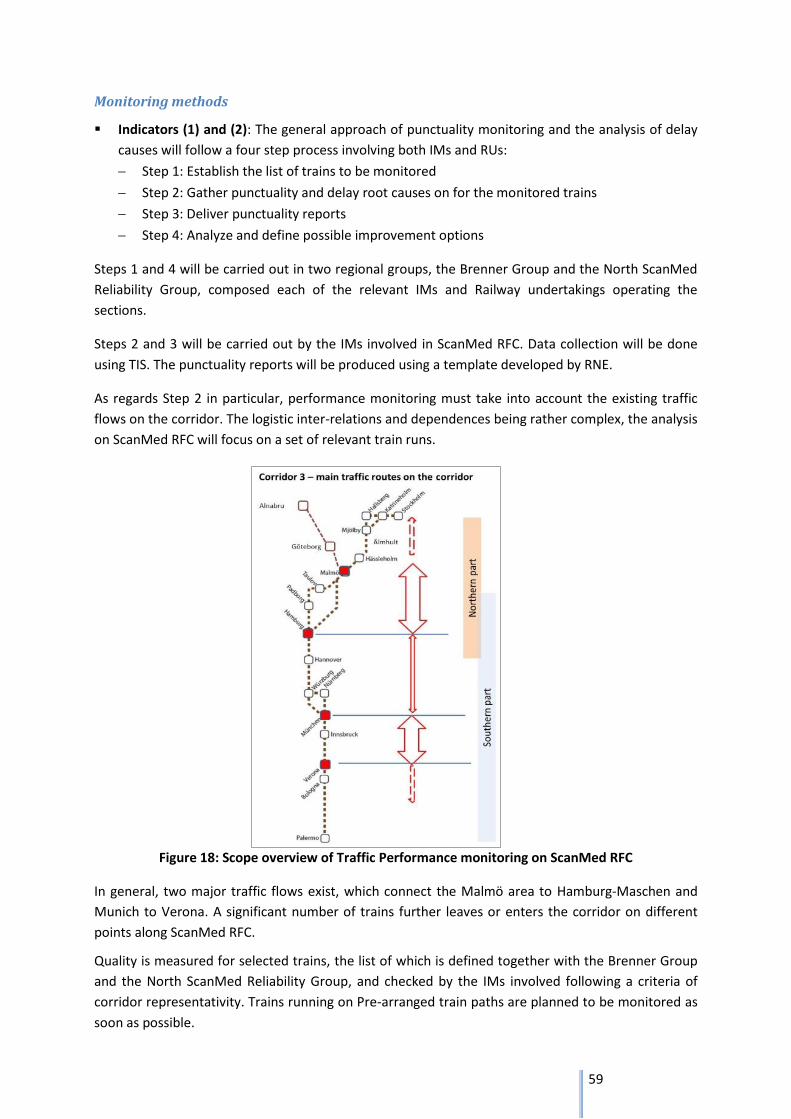
59
Monitoring methods
Indicators (1) and (2): The general approach of punctuality monitoring and the analysis of delay
causes will follow a four step process involving both IMs and RUs:
Step 1: Establish the list of trains to be monitored
Step 2: Gather punctuality and delay root causes on for the monitored trains
Step 3: Deliver punctuality reports
Step 4: Analyze and define possible improvement options
Steps 1 and 4 will be carried out in two regional groups, the Brenner Group and the North ScanMed
Reliability Group, composed each of the relevant IMs and Railway undertakings operating the
sections.
Steps 2 and 3 will be carried out by the IMs involved in ScanMed RFC. Data collection will be done
using TIS. The punctuality reports will be produced using a template developed by RNE.
As regards Step 2 in particular, performance monitoring must take into account the existing traffic
flows on the corridor. The logistic inter-relations and dependences being rather complex, the analysis
on ScanMed RFC will focus on a set of relevant train runs.
Figure 18: Scope overview of Traffic Performance monitoring on ScanMed RFC
In general, two major traffic flows exist, which connect the Malmö area to Hamburg-Maschen and
Munich to Verona. A significant number of trains further leaves or enters the corridor on different
points along ScanMed RFC.
Quality is measured for selected trains, the list of which is defined together with the Brenner Group
and the North ScanMed Reliability Group, and checked by the IMs involved following a criteria of
corridor representativity. Trains running on Pre-arranged train paths are planned to be monitored as
soon as possible.
60
Performance monitoring will give an overview of quality at representative points of the corridor by
displaying punctuality, in percentage of trains passing the measuring point within 30 minutes from
schedule.
Indicator 3: the number of working days needed to the C-OSS to respond to a customer’s request
will be registered by the C-OSS itself. The report of the C-OSS will be assessed against the results
of the Customer Satisfaction Survey.
VII.2. Capacity
VII.2.1. Definition
Capacity designates in the present document corridor capacity. It encloses national and cross-border
segments of Pre-arranged paths (PaPs) as well as reserve capacity slots constructed after X-4. It
reflects the utilization of offered corridor capacity with respect to total capacity on a given line
section.
VII.2.2. Monitoring
Key performance indicators
Capacity indicators are quantitative and can be listed as follows:
Number of offered PaP-Segments at X-11
Number of requests for PaP-Segments at X-8 (in % of total PaP-Segment offered)
Double booking of PaP-Segments at X-8
Number of allocated PaP-segments (in % of total PaP-Segment offered)
Offered Reserve Capacity
Allocated Reserve Capacity
Monitoring methods
The C-OSS will be in charge of collecting the basic information for each KPI mentioned above. PCS will
be used as IT-support.
VII.3. Availability
VII.3.1. Definition
Availability is understood here as the possibility for ScanMed RFC customers to operate a corridor
train on principal and diversionary routes with a high performance of the existing infrastructure.
VII.3.2. Monitoring
Availability monitoring will focus on the alleviation of infrastructure bottlenecks. It will be assessed
through regular updates of the Investment Plan.
VIII. Measures
VIII.1. Coordination of possessions
VIII.1.1. Definition
Following Art.12 of Regulation (EU) No 913/2010, information on works and possessions will be
published on the website of ScanMed RFC in a coordinated manner and on CIP as soon as available.
61
Coordination will follow the RNE Guidelines on the coordination and publication of works and
possessions46, published on 6th November 201347.
Whereas works are understood as any kind of maintenance or engineering works on the
infrastructure and its equipment, possessions are defined as “Times when parts of the infrastructure
are used by the IM in order to manage the infrastructure. The reasons may be any activities of the IM
on the infrastructure or its equipment (e.g. maintenance, repair, renewal, enhancement,
construction).”48
The intention of Art.12 being the provision of coordinated information on capacity restriction, it will
be applied to possessions rather than to works.
VIII.1.2. Criteria for the possessions to be published
All possessions impacting corridor capacity will be published. Impacts are:
Reduction of speed, weight and train length
Track closure
Line closure involving re-routing
VIII.1.3. Process and timeline
Coordinated information on possessions will be gathered using an MS-Excel based corridor map and
table. The document will be published on the website of the ScanMed RFC.
The process and timeline of coordinated information on possessions are described in Book 4 Chapter
8 of the Corridor Information Document.
VIII.2. C-OSS
VIII.2.1. Competences
Following Art.13 of Regulation (EU) No 913/2010, the IMs involved in ScanMed RFC will set up a joint
body acting as single point of contact for corridor capacity request. The competences of the C-OSS
will be shared between core, promotion and monitoring tasks, for which the IMs will also bring
relevant input.
46 Please note that the information provided should be used for rough orientation purposes only and may not constitute the basis for any legal claim. Publication of possessions does not substitute any national law or legislation and RUs/applicants must refer to national Network Statements. 47 http://www.rne.eu/tl_files/RNE_Upload/Downloads/RFC%20Guidelines/Guidelines%20for%20Coordination-Publication%20of%20Works%20and%20Possessions.pdf 48 RNE Guidelines on the coordination and publication of works and possessions, p.4 and 5
Competences of the C-OSS Contribution of the IMs
C-OSS Core competences
PaPs and Reserve Capacity
Monitoring of PaPs construction
Publication (Corridor website, PCS)
Sales and allocation Publication of information on works and possessions
(Corridor website)
Hand-over of the decided number of coordinated PAP sections at X-12
Cooperation in the construction of coordinated feeders and outflow paths and of tailor-made offers in case of conflicting requests
International coordination an update of information on works and possessions
Designation of a or several dedicated contact persons for all recurring tasks
Information of the C-OSS on approvals of RUs and Applicants
Update of the available Reserve Capacity
C-OSS Promotion competences
Communication on the Corridor’s offer Construction of competitive PaPs meeting
62
Table 11: Competences of the C-OSS and contributions of the IMs
VIII.2.2. Processes
The C-OSS will use PCS for its core function and the website of the ScanMed RFC for promotion and
monitoring.
The processes applied by the C-OSS are described in Book 4 Chapter 3 of the Corridor Information
Document.
VIII.3. Allocation of capacity
VIII.3.1. Principles
Following Art.14 of Regulation (EU) No 913/2010, Corridor Capacity will be allocated in the yearly
timetable in form of Pre-arranged train paths (PaPs) and in form of Reserve Capacity after X-4.
Further details are provided in the Framework for the Allocation of Capacity (Annex V) and in Book 4
of the Corridor Information Document49.
VIII.3.2. Priority rules
Priority rules are in the course of being harmonized in a multi-corridor manner.
VIII.4. Authorized applicants
Following Art.15 of Regulation (EU) 913/2010, “applicants other than railway undertakings or the
international groupings that they make up, such as shippers, freight forwarders and combined
transport operators, may request international pre-arranged train paths (…) and reserve capacity
(…).”
Further information on the access of Applicants to Corridor Capacity can be found in:
the Framework on the allocation of capacity
Book 4, Paragraph 3.2. of the Corridor Information Document
VIII.5. Traffic Management
VIII.5.1. Cross-border traffic management
All existing operational cross-border regulations are updated or in the course of being updated
according to bilateral agreements already reached. The resulting update of procedures between
neighbouring Infrastructure Managers either has taken place or is underway.
VIII.5.2. Traffic Management in case of disturbances
Following Art.17 of Regulation (EU) No 913/2010, ScanMed RFC delivered Guidelines for Traffic
Management in case of disturbances. The guidelines are published in Book 4 Chapter 7 of the
Corridor Information Document.
49 As the consultation process with the Advisory Groups Railway Undertakings and Terminals as well as with the Applicants started, the FCA for Timetable 2017 had not yet been adopted.
Knowledge transfer for the use of PCS Support to the customers for placing a request
expectations of the customers Frequent support of corridor managers and/or
national OSS towards the customers
C-OSS Monitoring competences
Collection of data for KPI-Monitoring
63
A disturbance is defined as any unplanned occurrence impacting operations negatively, i.e. producing
a reduction of capacity.
These guidelines:
Describe the general operational proceedings in case of disturbance for the ScanMed RFC. In
particular, it provides a state of play of international information systems already in use.
Set principles that the existing bilateral cross-border agreements between the IMs must relate
to. The guidelines have no legally binding value that would add to the existing cross-border
agreements. However, the existing bilateral agreements will be checked against these principles
on a yearly basis.
Provide, in an annex, contact details at the IMs involved with the aim of facilitating the return to
regular traffic conditions in the event of disturbance impacting hand-overs at cross-border
points.
VIII.6. Corridor Information Document (CID)
VIII.6.1. Structure
In accordance with Article 18 of the Regulation the Management Board shall publish a document,
containing the procedures for the management of the freight corridor, hereinafter referred to as the
Corridor Information Document ("CID"). In order to preserve a recognition effect and to facilitate
access to comparable information from one RFC to another, the CID of ScanMed RFC will follow the
RNE Guidelines50. The CID is structured in five books:
Book 1: Generalities
Book 2: Corridor-relevant excerpts of national network statements, as delivered according to
Art.27 of Directive 2012/34/EU
Book 3: Description of terminals
Book 4: Procedure for capacity and traffic management
Book 5: Implementation Plan
The 1st CID is published on 10th November 2015 and expresses the entry into operation of ScanMed
RFC according to Regulation (EU) No 913/2010. For this first CID, Book 2 will be based on network
statements published in December 2014 and applying to timetable 2016. A second CID is due to be
published in January 2016 with excerpts of the network statements which will apply to the timetable
2017.
50
http://www.rne.eu/tl_files/RNE_Upload/Network%20Statements/Corridor%20Statement/Specification%20-
%20Corridor%20Information%20Document%20V1.4.pdf
64
IX. Annexes
The present Implementation Plan encloses the following annexes:
Annex I - Mission Statement of the Executive Board of 2nd June 2012
Annex II – General Objectives of ScanMed RFC
Annex III - Agreement on the Establishment of the Management Board of Rail Freight Corridor 3
of 30th August 2012
Annex IV – Cooperation frameworks between the Management Board and the Advisory Groups
Railway Undertakings and Terminals
Annex V - Framework for the Allocation of Capacity (FCA)51
Annex VI - Common Declaration of the European Rail Freight Corridors for their cooperation in
facilitating the RFC network (RFC Club)
Annex VII - List of Corridor-relevant investment projects
Annex VIII – Description of technical parameters of the infrastructure “as-is” by entry of
operation
Annex IX – Description of technical parameters of the infrastructure realized and planned
Annex X - List of EC-Declaration of Verifications
Annex XI - State of play of significant parameters for TSI Infrastructure
Annex XII – State of play of significant parameters for TSI Energy)
Annex XIII - State of play of ERTMS implementation (ETCS and GSM-R)
Annex XIV- State of play of TAF-TSI implementation
Annex XV – Cooperation Framework for Executive Board and Management Board, Rail Freight
Corridor 3
The Annexes displayed in zip-files:
Annexes 1-15.zip
51 As the consultation process with the Advisory Groups Railway Undertakings and Terminals as well as with the Applicants started, the FCA for Timetable 2017 had not yet been adopted. The FCA will be added as Annex V to the implementation Plan as soon as available.