Embed Size (px)
Citation preview
Scanned by CamScanner

Scanned by CamScanner
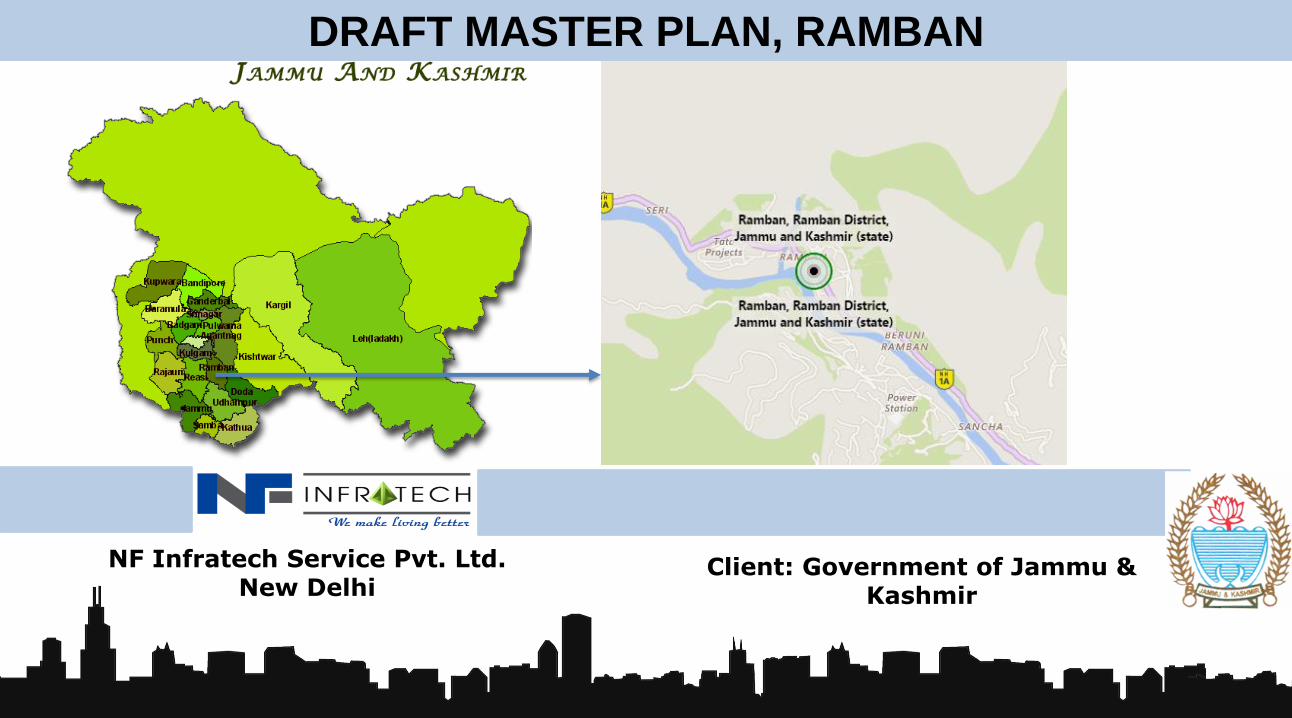
NF Infratech Service Pvt. Ltd. New Delhi
Client: Government of Jammu & Kashmir
DRAFT MASTER PLAN, RAMBAN

TEAM MEMBERS
Mr. Joginder Singh Chief Town Planner, Jammu
Mr.Anil Raina Senior Town Planner
Mr. Surjeet Singh Town Planner
ADVISORY TEAM (CLIENT) TOWN PLANNING ORGANISATION, JAMMU
V. K. Dhar Associate Consultant
Gundeep Singh Ishar Urban Planner
Manish Dahiya Urban Planner
Kuldeep Singh Infrastructure Planner
Rajat Gupta Urban Planner
Wajiha Aziz Urban Planner
Surabhi Shandil Architect-Planner
Abhishek Singh GIS Specialist
WORKING TEAM (CONSULTANT) NF INFRATECH SERVICE PVT. LTD., NEW DELHI

CONTENTS
PART - I
•Back ground of the Project
•Aim & objectives for the preparation of Master Plan
•Methodology adopted
PART – II
•Site Analysis (Location & Regional setting)
•Topography
•Local Planning Area
•Preparation of Base and Existing Land uses
•Analysis of Physical and Socio economic Data
PART - III
•Projections & Requirements
•Problems & Potentials
•Possible development scenario and Concept Details

AIM
Town Planning Organization, Jammu is preparing the Master Plan for Ramban through the consultant NF Infratech Services Pvt. Ltd. to make the
city more vibrant, livable and creditworthy.
The Master Plan will formulate a long-term vision to promote growth in a systematic way. It will help in rationalizing the land use
pattern and facilitate the identification of sectoral investments and reform areas needed to transform the Local Planning Area
Ramban.
The Municipal Committee (MC) and Local Planning Area (LPA) together comprises of 7 villages.
The villages are Pernote, Seri, Maitra Govindpura, Tatarsoo, Chanderkote, Karol and Neera.
The area under MC is 136 Ha.
The total local planning area is 3444 Ha.

OBJECTIVES
Identifying existing gaps in physical and social
infrastructure and to bridge those gaps.
Making town assessment and to suggest strategies
for its economic development.
Rationalization of Landuse
and their interrelationships.
Minimizing haphazard and uncontrolled growth of
town/cities and to achieve planned growth and
development in order to
provide healthy living
environment.
Rationalizing the orderly
movement of traffic and transportation within the town and defining the area for laying
down network of various
services.
Indicating physical and social
infrastructure for optimum use.
Ensuring systematic, balanced
and integrated development.
The prime objective of the Master Plan is to promote, guide and rationalize the future growth and development of urban centers.
Master Plan is an appropriate and scientific tool for promoting systematic & planned growth of the town in the form of the following:

METHODOLOGY
Identification of Local Planning Area
Preparation of Existing land use plan (on GIS platform)
Assessment and analysis of Local Planning Area
Gaps and Problem Identification
Carrying out SWOT analysis Defining conceptual
framework
Preparation of the concept plan
Evolving proposed land use plan and traffic &
transportation plan along with Development Control
Regulations (DCR)

Base Map
Existing Land-use
Master Plan
8
TECHNIQUES FOR PREPARATION OF MASTER PLAN

PART - I
•Back ground of the Project
•Aim & objectives for the preparation of Master Plan
•Methodology adopted
PART – II
•Site Analysis (Location & Regional setting)
•Topography
•Local Planning Area
•Preparation of Base and Existing Land uses
•Analysis of Physical and Socio economic Data
PART - III
•Projections & Requirements
•Problems & Potentials
•Possible development scenario and Concept Details

LOCATION OF RAMBAN
• Ramban is located on the right bank of river Chenab at 33°14' N and
75°017'E longitudes with an altitude of 1000 m Above Mean Sea Level
(AMSL).
• The boundary lines of Ramban Tehsil have come to be drawn
from Udhampur District on its south, Doda District on its east while Gool
& Banihal Tehsils on its west and north respectively
Ramban Town Ramban District

REGIONAL SETTINGS
Town Distance (Km.)
Jammu 147
Srinagar 146
Udhampur 86
Doda 82
Anantnag 88
Regional Setting - Ramban Town (2011).
• Ramban town is almost equidistant from Jammu and
Srinagar since it is located at about 150 km from Jammu and
about 150 km from Srinagar on NH-44 linking Jammu &
Srinagar.
• The boundary lines of Ramban Tehsil have come to be drawn
from Udhampur District on its south, Doda District on its east
while Gool & Banihal Tehsils on its west and north respectively.
• The nearest railway stations to Ramban are Banihal - 38
km and Udhampur - 86 km.
• The nearest airport is Jammu airport.

PHYSICAL CHARACTERISTICS
Contour Map- Ramban (2004-2014)
• Ramban is all mountainous with very difficult
terrain.
• Topography is the typical representation of medium
and small hills.
• Average elevation of 1,156 meters (3,793 feet) and
is a newly formed district of the state of Jammu and
Kashmir.
• Elevation in the LPA ranges from 375 to 480m. The
northern part of the town has hilly terrain, the
central region around river Chenab and Ramban
town are relatively flat and steep slopes are
observed on either side of Chenab
• Soils which are mainly observed in this area are
mountainous soil and loamy Soil.
• The availability of flat developable land in
Ramban is very less due to the hilly terrain. The
contour levels vary from 660 m to 1905

PHYSICAL CHARACTERISTICS
Slope Map- Ramban (2004-2014)
• The district experiences warm summers and severe
winters and the climate varies according to the
altitude.
• The average high temperature during summer rises
upto 35°C max. in the low lying areas like Ramban
town located in between steep Mountains on the
banks of river Chenab and drops to sub zero in the
high altitude areas.

PHYSICAL PATTERN OF GROWTH
• The town has grown on both the sides of NH-
44 which promotes development and it is
growing fast in the direction of Maitra &
Govindpura villages (South-East, across river
Chenab).
• Both these villages provide space for future
outgrowth of Ramban town.
• New residential areas are coming up along
Jammu-Srinagar National Highway and some
new developments are also there in Pernote.
• The map shows that the development is mostly
along National Highway and on slope of
Mitra, Karol, Neera, Kawbagh and Naibasti
within the Municipal limits.

LOCAL PLANNING AREA (LPA)
• Ramban LPA covers an area of 3,444 hectares with a
total population of 17,461.
List of Villages under Local Planning Area.
Settlement Population (2011)
% of LPA population
Households Area (Ha)
LPA Total 17461 100 3361 3444
LPA villages 13865 79.4 2632 3308
Pernote 3260 18.7 678 691
Seri 2023 11.6 409 637
Maitra Gobind Pura
4108 23.5 682
565
Tatarsu 1260 7.2 224 290
Chanderkot 1501 8.6 272 455
Karol 370 2.1 105 278
Neera 1343 7.7 262 392
Decadal Wise LPA Population
Settlement LPA (Rural)
LPA (Urban)
LPA (Total)
1981 Population 2,568 2,189 4,757
% 54 46 100
2001 Population 8,001 3,118 11,119
% 72 28 100
2011 Population 13,865 3,596 17,461
% 79.40 20.60 100
To Srinagar

LAND SUITIBILITY
• There are various Sensitive zones,
Categorized on different Parameters,
like Slope, Water Bodies, Forests, Wild
Life, Prime Agriculture etc.
I. Unsuitable Zones are non
developable areas. This is
environmental sensitive area.
II. Moderate Zone are also non
developable areas. Army and River
Chenab are categorised this zones
III. Suitable zones are fit for
development. Most of the proposals
are given in this zone.
Zone Area (Ha) Percentage
No-Development Zone 762 22.13
Water Body 215 6.24
Moderately Suitable Zone
954 27.70
Suitable Zone 1513 43.93
Total 3444 100.00

DEMOGRAPHY
WARD-WISE POPULATION DENSITY
• High Density Area - The density gradient as
per 2011 Census shows that ward 3 has a
gross density greater than 100 persons per
hectare (pph) which is above standard.
• Medium Density - The density of ward no. 4
is above 50 pph.
• Low density - All the other wards have a
density ranging between 16 to 35 pph only.
• Old built-up residential areas of the town fall
under the high and medium density zones. The
other wards fall in the low density zone showing
a concentrated core town with scattered built up
area in the periphery of the town.

DEMOGRAPHY
Population of Ramban LPA, Ramban MC and Ramban Rural area
Population
1981 2001 2011
Ramban MC 2,189 3,118 3,596
Ramban LPA (Rural) 2,568 8,001 13,865
Total Ramban LPA 4,757 11,119 17,461
POPULATION GROWTH
SEX RATIO OF RAMBAN LPA AND MC (2011)
1971-81 1981-1991* 1991-2001* 2001-11
LPA Total 57.9% 66.9% 66.9% 57.0%
LPA Urban 38.5% 21.2% 21.2% 15.3%
LPA Rural 79.5% 105.8% 105.8% 73.3%
57.9%
66.9% 66.9%
57.0%
38.5% 21.2% 21.2%
15.3%
79.5%
105.8% 105.8%
73.3%
0.0%
20.0%
40.0%
60.0%
80.0%
100.0%
120.0%
Decad
al G
ro
wth
Rate
in
%
920
823
802 840
929
700
750
800
850
900
950
Ramban Town LPA Rural Ramban
District
J&K State India (Urban)
Fem
ale
s p
er 1
00
0
male
s
• Sex ratio of Ramban town (920) is found only marginally lower
compared to the Urban India (929), but significantly higher than the
State Average(840) and District Average(901) in 2011.
Values for 1991 are not included because in the year 1991, the Census survey was not conducted
in J&K
Source: Census of India – 2011
Ramban town experienced a growth rate of 42.40% and 15.30%
during 1981-2001 & 2001-2011 respectively. A declining growth rate
is seen during the last decade.

DEMOGRAPHY
LITERACY & EDUCATION
WORK FORCE PARTICIPATION
Source: Census of India - 1971, 1981, 2001, 2011 Village and Town Directory, Jammu district for population estimates of 1991
Composition of Work-Force Comparison–Ramban LPA & town (2011).
Ramban Town LPA Rural LPA Average Ramban District J&K State India (Urban)
Total 71.8% 52.2% 56.2% 43.7% 77.1% 84.1%
Male 78.1% 59.3% 62.6% 55.6% 83.9% 88.8%
Female 64.9% 38.6% 45.6% 30.6% 69.0% 79.1%
71.8
%
52.2
%
56.2
%
43.7
%
77.1
%
84.1
%
78.1
%
59.3
%
62.6
%
55.6
%
83.9
%
88.8
%
64.9
%
38.6
%
45.6
%
30.6
%
69.0
%
79.1
%
Lit
eracy R
ate
Population Total Workers Main
Workers Marginal Workers
Jammu & Kashmir
10143700 3753815 (37.01%)
2590132 (69%)
1163683 (31%)
Ramban Town
3596 1011 (28.11%) 900 (89%) 111 (11%)
LPA Villages
13865 4616 (33.29%) 3277
(71%) 1339 (29%)
Total LPA 17461 5627 (32.23%) 4177
(74%) 1450 (26%)
Ramban town has a literacy rate of 71.5%, lower than
the literacy rate of urban India (84.1%) and State’s
Average (77.1%), but higher compared to the district
and LPA averages (43.7% & 56.2%).
Literacy Rate-Ramban MC, LPA Villages, Jammu District, J&K State and Urban India (2011).
• Workforce Participation Rate (WPR) in the town is 28.11%, (constituting the
main and marginal workers) which is lower than the State and LPA.
• 94% workers of the town are engaged in other activities (secondary and
tertiary), 5.6% are engaged in primary activities (cultivators and agricultural
workers) and 3% are engaged in household industries
Other Workers (secondary &
tertiary), 94.0%
Cultivators, 4.4%
Agriculture workers, 1.2%
Household industrial workers, 0.5% Other Workers (secondary &
tertiary)
Cultivators
Agriculture workers
Household industrial workers

EXISTING LAND USE DISTRIBUTION
Seri
Pernote
Neera
Karol
Tatarsoo
Maitra and Govindpura
Ramban
Seri
Ramban
Pernote
Maitra Gobindpora
Tatarsoo
Chanderkot
Karol
Neera

EXISTING LAND USE DISTRIBUTION
Existing Landuse Distribution – Ramban MC (2014).
Landuse Existing use
(Ha)
% of Developed
Area
% of Total Area
Developed Area
Residential 16 19.3 11.7
Commercial 4 4.8 2.9
Industrial 0 0.0 0.0
Public And Semi-Public 30 36.1 21.9
Utility Services 2 2.4 1.5
Recreational 0 0.0 0.0
Transport and Communication 31 37.3 22.6
Subtotal Developed Area 83 100.0 60.6
Un-developed Area
Agriculture 0 0.0 0.0
Plantation 27 50.0 19.7
Orchards 0 0.0 0.0
Hills & Forests 0 0.0 0.0
Open Land 1 1.9 0.7
Water Bodies/Streams 10 18.5 7.3
Army 16 29.6 11.7
Subtotal Undeveloped Area 54 100.0 39.4
Grand Total 137 100.0
Traffic and Transportation
22.8%
Public and Semi-Public
22.1%
Plantation 19.9%
Residential 11.8%
Army 11.8%
Water Bodies/Streams
7.4%
Commercial 2.9%
Utility Services 1.5%
Traffic and Transportation Public and Semi-Public Plantation
Residential Army Water Bodies/Streams
Commercial Utility Services

EXISTING LAND USE DISTRIBUTION
Existing Landuse Distribution – Ramban LPA (2014).
Description Existing Landuse
% of the Subtotal
% of Total Area
Developed Area
Residential 88 46.81 2.56
Commercial 5 2.66 0.15
Public And Semi-Public
38 20.21 1.10
Recreational 0 0.00 0.00
Utility Services 1 0.53 0.03
Transport and Communication
56 29.79 1.63
Sub-Total Developed Area
188 100.0 5.46
Un-Developed Area
Agriculture 365 11.21 10.60
Plantation 58 1.78 1.68
Orchards 19 0.58 0.55
Open Scrub 67 2.05 1.95
Forests And Hills 2514 77.21 73.00
Water Bodies/Streams
215 6.60 6.24
Army 18 0.55 0.52
Sub-Total Undeveloped Area
3256 100.0 94.54
Grand total 3444 100.0
Residential, 2.56 Commercial, 0.15
Public And Semi-Public, 1.1
Recreational, 0 Utility Services, 0.03
Transport and Communication, 1.63
Agriculture, 10.6
Plantation, 1.68
Orchards, 0.55
Open Scrub, 1.95
Forests And Hills, 73
Water Bodies/Streams, 6.24
Army, 0.52
Residential Commercial Public And Semi-Public
Recreational Utility Services Transport and Communication
Agriculture Plantation Orchards
Open Scrub Forests And Hills Water Bodies/Streams
Army
EXISTING LAND USE DISTRIBUTION
RESIDENTIAL
COMMERCIAL
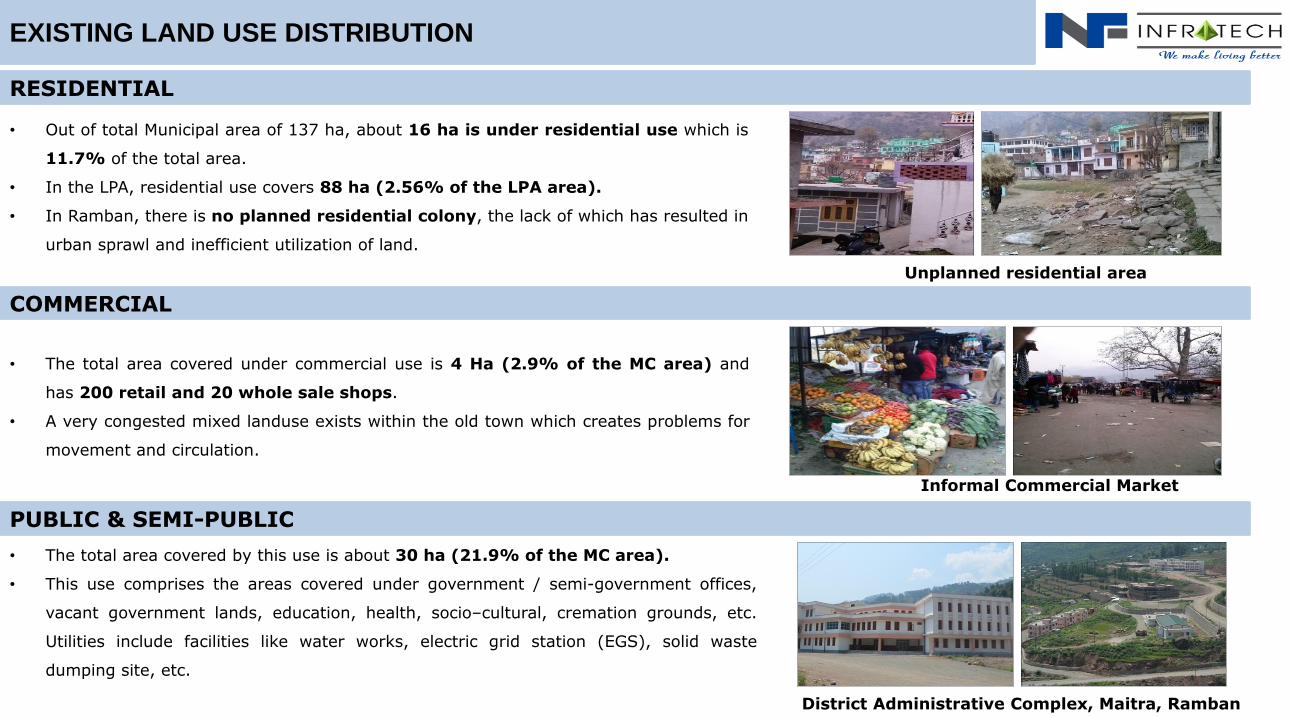
• Out of total Municipal area of 137 ha, about 16 ha is under residential use which is
11.7% of the total area.
• In the LPA, residential use covers 88 ha (2.56% of the LPA area).
• In Ramban, there is no planned residential colony, the lack of which has resulted in
urban sprawl and inefficient utilization of land.
• The total area covered under commercial use is 4 Ha (2.9% of the MC area) and
has 200 retail and 20 whole sale shops.
• A very congested mixed landuse exists within the old town which creates problems for
movement and circulation.
PUBLIC & SEMI-PUBLIC
• The total area covered by this use is about 30 ha (21.9% of the MC area).
• This use comprises the areas covered under government / semi-government offices,
vacant government lands, education, health, socio–cultural, cremation grounds, etc.
Utilities include facilities like water works, electric grid station (EGS), solid waste
dumping site, etc.
Unplanned residential area
Informal Commercial Market
District Administrative Complex, Maitra, Ramban

PHYSICAL INFRASTRUCTURE
WATER SUPPLY
SEWERAGE
Water Supply Pipelines along Streets and Drains - Ramban Town (2014).
Source: PHE Department, Ramban(2013)
Water Supply details (Town Wise).
Open Drains – Ramban MC (2014).
• Presently, Ramban is totally deprived of sewerage facility.
• The existing system of the town includes septic tank, pit tank or directly dumping into drain. The polluted water of septic tank is also dumped
eventually into the drains of the town area.
Source of drinking water
Quantity (MLD)
No. of Connection
Consumption (LPCD)
Area Covered (sqkm)
Treatment of Total Water Supply (%)
Chenab, Maitra & Seri Nallah
0.33 380 40.6 1.1 70% (max capacity
22.6 KLD)
DRAINAGE
• Ramban town has a network of both natural and manmade open drains/ nallah,
with a general slope of North to South.
• About 75% of the drains within the MC boundary are pucca drains.
• There are various nallahs and streams flowing throughout the Ramban LPA (Maitra
nallah, Kawbagh nallah, Seri nallah, Karol nallah) which drains the water from
Chenab on either side.
• Most of the residential areas have water supply and drainage system.
• There are only one Water Reservoir in Ramban MC in ward no 1 which serve
the most part of the town.

PHYSICAL INFRASTRUCTURE
SOLID WASTE MANAGEMENT
ELECTRICITY
Solid Waste Disposal on Hill Slopes within and Outside the Town - Ramban Town (2014).
• In Ramban urban limits, house to house collection of the solid waste is
carried out through a number of sanitary workers deployed by M.C.
• Presently, 0.1 ton out of the total 0.3 ton of solid waste is collected every
day.
• The city practices open disposal of waste without undertaking any pre-treatment
of the waste. There is no identified any permanent landfill site and the
waste generated is dumped along the NH-44.
Electric Supply –Ramban Town (2010-11).
Source/Distance of
power plant (km)
Total Electricity
Demand (MW)
Total
Electricity
Supply (MW)
Total consumption
(Lakh units per
month)
Receiving station, Ramban – 1km
2.95 2.279 18.504
Electricity Consumption Characteristics –Ramban Town (2010-11).
Category No of connections Percentage
LT Residential 1274 68
LT Commercial 473 25
LT Others 135 7
Total 1882 100
• The electric supply to Ramban is made through a single 220 KV receiving station at Maitra. There is mismatch between demand (2.95 MW)
and supply (2.279 M). Shortage of 0.671 MW electricity.
• 68% of the connections are residential, 25% are commercial and 7% are other connections.
• Key issues are Poor Maintenance of street lights, rural settlements lack street lights, time duration for electricity supply is less, especially in rural
areas, limited use of renewable sources of energy (like solar power) for power generation.

SOCIAL INFRASTRUCTURE
EDUCATION
• The educational facilities in Ramban are found to be adequate as per the
URDPFI guidelines.
• Educational facilities are not well distributed over the town area.
• Traffic congestion and parking problems are caused by unplanned manner
of locating and placing the educational institutions, especially within
the congested areas.
• Lack of adequate playgrounds, parking areas, etc. in the institutions located
in the congested areas.
HEALTH AND MEDICAL FACILITIES
• Health facilities within the residential areas create problems of congestion and
illegal parking as well as landuse violations.
• The main hospital has a congested access because of weak traffic
management.
• The medical facilities in the rural areas are inadequate.
• The District Hospital requires some traffic management in order to avoid the
passing through traffic via its two main gates, thus becoming unsafe.
Name of Facility Ramban LPA Total Existing Shortage
Pre-Primary School 3 4 7 0
Primary School 6 4 10 0
Middle School 3 2 5 0
High School 4 1 5 0
Senior Secondary School
1 1 2 0
B.Ed. College 1 0 1 0
Degree College 0 1 1 0
Training Institute 2 0 2 0
Educational Facilities - Ramban LPA and Town (2013).
Health Facilities–Ramban Town (2013).
Particulars of Existing Health Institution in Ramban
Town Existing Nos.
Primary Health Centre 2
Primary Health Sub-Centre 4
Multi-Specialty/District Hospital 1

INFRASTRUCTURE
District Administrative Complex, Maitra, Ramban
Water Supply Pipelines along Streets and Drains - Ramban Town (2014).
Dargah Janaab Fareed Aladin Baghdaadi
ITI Ramban

HOUSING
Housing - Ramban old town
• With increase in population, number of houses has
also recorded an increase.
• Housing Department, Jammu and Kashmir has
framed no housing schemes in the case of
Ramban.
• Govt. agencies like Ramban Municipal Committee
have also not provided any housing and most of the
residential areas have grown with the efforts of
individuals.
• In the absence of availability of status of housing and
congestion index, the gap in the MC area has
been estimated on the basis of difference in
households (729) and occupied residential
houses (550).
• So, the existing housing shortage is 179.
• The use of residential premises for other purposes
like commercial and educational use is also
widespread.
Key issues in Housing
Lack of public housing or public housing schemes.
Unchecked growth of residential construction.
The central area of the town is overcrowded.
Lack of planned housing in the town.

Detail of Major Roads –Ramban Town
Name ROW (m) Building Line from the Centre of the Road (m)
Length in km
Gool Road 10 7.5 1.86
Maitra Govindpora Road 5.20 7.5 7
Neera Road 5.20 7.5 4
Kanthi/Degree College Road
10
7.5
0.50
TRAFFIC & TRANSPORTATION
Description of Major Roads under Ramban LPA
Hierarchy Name of Road Length of Road (km)
Right of Way (m)
Carriage Way (m)
R1 NH-44 linking Jammu to Srinagar
12.5 9-12 7-10
Source: GREF Batote Ramban, (2015).
Bus Stand- Ramban Town
Ramban Bus Stand
To Srinagar On-Street Parking - Ramban
Town
TRAFFIC & TRANSPORTATION
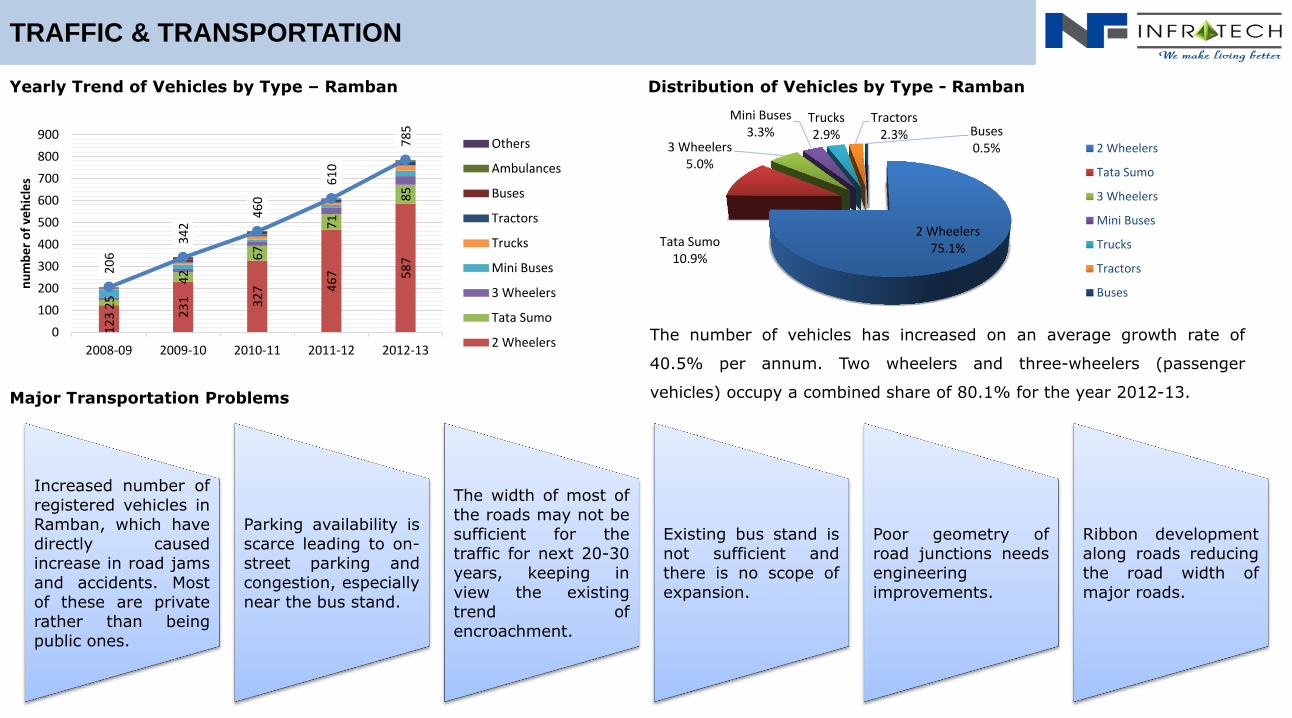
Increased number of registered vehicles in
Ramban, which have
directly caused increase in road jams
and accidents. Most
of these are private
rather than being
public ones.
Parking availability is scarce leading to on-street parking and
congestion, especially near the bus stand.
The width of most of the roads may not be sufficient for the
traffic for next 20-30
years, keeping in
view the existing trend of
encroachment.
Existing bus stand is
not sufficient and
there is no scope of
expansion.
Poor geometry of
road junctions needs
engineering
improvements.
Ribbon development
along roads reducing
the road width of
major roads.
Yearly Trend of Vehicles by Type – Ramban
12
3 23
1
32
7 46
7
58
7
25
42
67
71
85
20
6
34
2 4
60
61
0
78
5
0
100
200
300
400
500
600
700
800
900
2008-09 2009-10 2010-11 2011-12 2012-13
nu
mb
er
of
veh
icle
s
Others
Ambulances
Buses
Tractors
Trucks
Mini Buses
3 Wheelers
Tata Sumo
2 Wheelers
Distribution of Vehicles by Type - Ramban
2 Wheelers 75.1% Tata Sumo
10.9%
3 Wheelers 5.0%
Mini Buses 3.3%
Trucks 2.9%
Tractors 2.3% Buses
0.5% 2 Wheelers
Tata Sumo
3 Wheelers
Mini Buses
Trucks
Tractors
Buses
Major Transportation Problems
The number of vehicles has increased on an average growth rate of
40.5% per annum. Two wheelers and three-wheelers (passenger
vehicles) occupy a combined share of 80.1% for the year 2012-13.

PART - I
•Back ground of the Project
•Aim & objectives for the preparation of Master Plan
•Methodology adopted
PART – II
•Site Analysis (Location & Regional setting)
•Topography
•Local Planning Area
•Preparation of Base and Existing Land uses
•Analysis of Physical and Socio economic Data
PART - III
•Projections & Requirements
•Problems & Potentials
•Possible development scenario and Concept Details

PROJECTIONS AND DEMAND ANALYSIS
POPULATION PROJECTIONS
Assumed Population Projection of Ramban (Urban and LPA).
Area Population Growth Rate % Population Growth Rate % Population Growth Rate % Population Growth Rate % Population
Year 2001 2011 2021 2031 2035
Urban 3118 15.33 3596 14 4099 13 4632 5.2 4873
Rural 8001 73.29 3865 65 22877 60 36604 23.2 45096
Total 11119 57.04 17461 54.50 26977 52.86 41236 21.18 49969
COMMERCIAL PROJECTIONS
Norms and hierarchy and area calculations for commercial areas.
Category Area per 1000 persons (sqm)
Area Required (Ha)
No. of Shops
Convenience Shopping 220 1.10 1 for 110 persons
Local Shopping including Service Centre
300 1.50 1 for 200 persons
Community Centre with Service Centre
500 2.50 1 for 200 persons
District Centre 880 4.40 1 for 300 persons
Total 9.50
• The existing commercial area (5 Ha) is sufficient as per the URDPFI
• Additional area of 4.50 ha will be required by 2035.
• 727 shops required for projected population
The future planning for the preparation of Ramban Master Plan, 2035 is taken by assuming that the population of the urban area shall rise to about 4,873
and total LPA (Including Ramban urban and villages) to 49,969 by the year 2035.
WORKFORCE PROJECTIONS
Main Workers and Projected Workforce Category Wise of Ramban M.C.
Type of workers 2011 % of
workforce
2021
Assumed % of Workforce
Workers
Cultivators 44 4.35 5 61
Agriculture workers 12 1.19 2 25
Household Industrial workers
5 0.49 1 12
Secondary and Tertiary 950 93.97 92 1,131
• It has been assumed that the employment pattern of Ramban town
will be slightly changed with the pace of urbanization
Area Population
(2035)
Water Supply Sewerage
Requirement (LPCD)
Requirement (MLD)
Requirement (80% of water required - MLD)
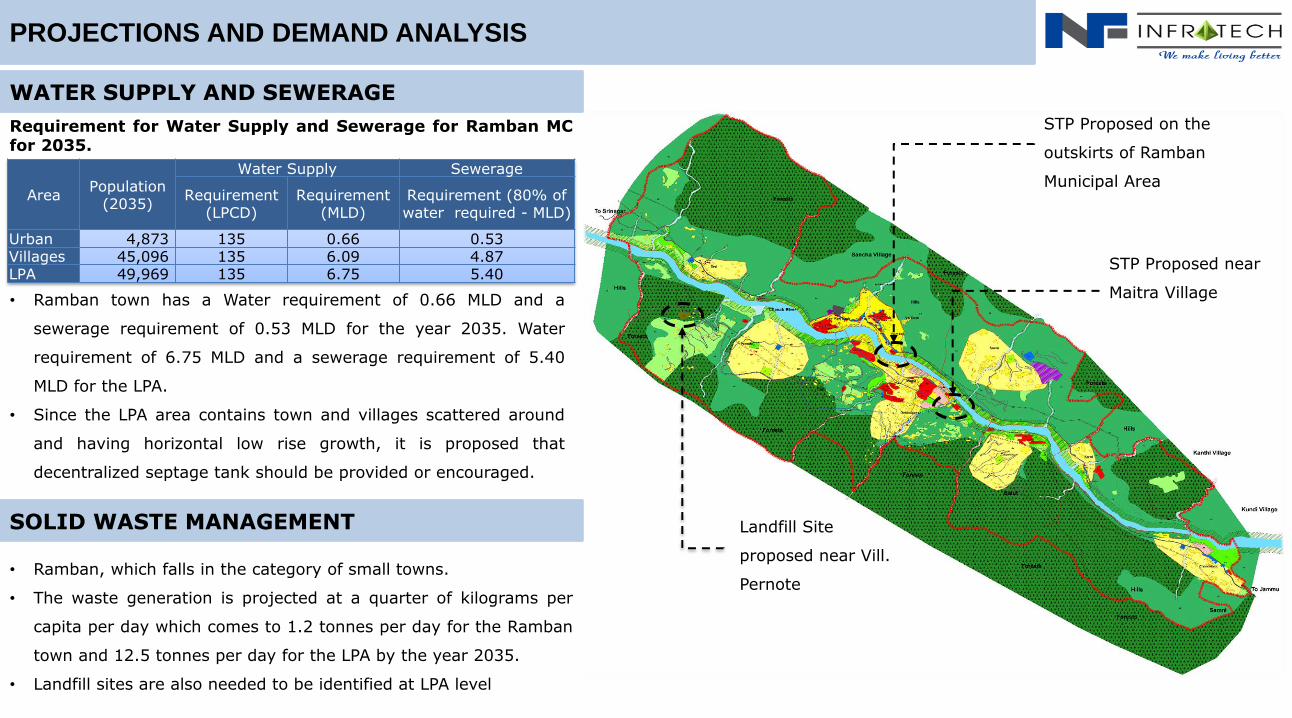
Urban 4,873 135 0.66 0.53 Villages 45,096 135 6.09 4.87 LPA 49,969 135 6.75 5.40
PROJECTIONS AND DEMAND ANALYSIS
Requirement for Water Supply and Sewerage for Ramban MC for 2035.
• Ramban, which falls in the category of small towns.
• The waste generation is projected at a quarter of kilograms per
capita per day which comes to 1.2 tonnes per day for the Ramban
town and 12.5 tonnes per day for the LPA by the year 2035.
• Landfill sites are also needed to be identified at LPA level
WATER SUPPLY AND SEWERAGE
SOLID WASTE MANAGEMENT
• Ramban town has a Water requirement of 0.66 MLD and a
sewerage requirement of 0.53 MLD for the year 2035. Water
requirement of 6.75 MLD and a sewerage requirement of 5.40
MLD for the LPA.
• Since the LPA area contains town and villages scattered around
and having horizontal low rise growth, it is proposed that
decentralized septage tank should be provided or encouraged.
Landfill Site
proposed near Vill.
Pernote
STP Proposed on the
outskirts of Ramban
Municipal Area
STP Proposed near
Maitra Village

PROJECTIONS AND DEMAND ANALYSIS
HEALTH CARE
Year Total No. of Households Power Requirement (MW)
LPA Urban LPA Urban
2011 3,563 729 7.13 1.46
2035 10,198 995 20.40 1.99
Particulars Standards Future
Requirement
Existing Need Area
Required (Ha)
District Hospital 1/80,000 1 1 0 0
Primary Health Centre
1/20,000 2 2 0 0
Health Sub Centre 1/10,000 1 4 1 0.067
Dispensary 1/ 15,000 3 0 3 0.36
Nursing Home/Maternity Centre
1/ 15,000 3 0 3 0.6
Total 7 1.027
Requirement of Medical Facilities.
• An additional Health Sub Centre, 3 Dispensaries & 3 Nursing/
Maternity Centres are required till 2035
• No further need of electric sub-stations is projected by
2035 for the town but one sub-station would be required for the
LPA.
• However, with regard to the High-Tension line, a radius of 15 m
needs to be earmarked for no developmental activity.
POWER
Future Requirement of Power for LPA.

PROJECTIONS AND DEMAND ANALYSIS
EDUCATION
Requirement of Educational Facilities (LPA Level).
• There is a requirement of 2 pre-primary cum primary schools and 1 Senior Secondary School in the education sector in Ramban LPA,
considering the projected population of the LPA in 2035.
Name of Facility Urban LPA Total Norms Existing Shortage
Requirement for 2035 Area Required (Ha)
Pre-Primary School 3 4 7 1 for 4000 0 2 0.6
Primary School 6 4 10 Middle School 3 2 5
1 for 15000 0 1 0.5 High School 4 1 5 Senior Secondary School 1 1 2 B.Ed. College 1 0 1
1 for 30000 0 0 0
Degree College 0 1 1 0 0 0 Training Institute 2 0 2 - 0 0 0 Total 20 13 33 0 3 1.1
SOCIO CULTURAL & SAFETY MANAGEMENT FACILITIES
Requirement of socio Cultural & Other facilities (LPA Level).
Type of Facility Existing Number Norms Future Requirement
Required Area (Ha) 2021 2035
Recreational Club 0 1 for 1,00,000 0 1 1 Library 0 1 for 15,000 2 1 0.75 Post Office 1 1 for 50,000 0 0 0 Petrol Pump 3 - - - - Cremation & Burial Grounds 3 1 for 10,000 According to local conditions Police Station 1 1 for 90,000 - - - Fire Station 1 1 for 50,000 - - - Religious Sites 10+ 1 for 10,000 - - - Total 1.75
There is requirement of community recreational club and library for the projected population in 2035. Fire station is adequate in terms of numbers
but inadequate in terms of coverage. A single fire station cannot respond quickly to the needs of entire LPA. .

There is a need to provide emphasis in developing such facilities in Ramban town. The present land allocation for the recreational facilities is very low in
comparison of the growth of the town. There is a great need to provide more gardens, parks and playgrounds in the town.
HOUSING STOCK
Type of Facility Standards with Min. Area Requirement Existing Area (Ha) Required Area (Ha)
Housing Area Park 1/5000 persons (0.5 Ha) 0 5
Neighborhood Park 1/10000 persons (1.2 Ha) 0 6
Exhibition Ground/Play Ground For entire town at 1 or more sites depending upon space availability 0 4
Residential Unit Play Area 1/5000 persons (0.5 Ha) 0 5
Neighborhood Play Area 1/15000 persons (1.5 Ha) 0 4.5
Total 24.50
PROJECTIONS AND DEMAND ANALYSIS
RECREATIONAL FACILITIES
Requirement of Recreational Facilities – Ramban Town (2035).
Description Figures
Projected population for Ramban LPA for 2035 49,969
Existing Population for Ramban LPA for 2011 17,461
Additional Population 32,508
Existing LPA Developed Area Density (persons per hectare) 93
Already developed land under LPA (Hectares) 188
Proposed gross area density as per URDPFI for small towns in hill area (persons per hectare) 72
Additional land required (Hectares) 506
LAND REQUIREMENT
Housing Stock Existing and Projected Demand –Ramban Town.
Year Population No. of Households No. of Houses Shortage
LPA Urban LPA Urban LPA Urban LPA Urban
2011 17,461 3,596 3,563 729 - 550 179 179
2035 49,969 4,873 10,198 995 10,198 995 6,814 445
• There is shortage of 179 houses in LPA and 179 houses in MC. In
2035, there will be shortage of 6814 houses in LPA and 445 in MC. • To accommodate the additional population for 2015 (32,508),
additional area required is 506 hectares.
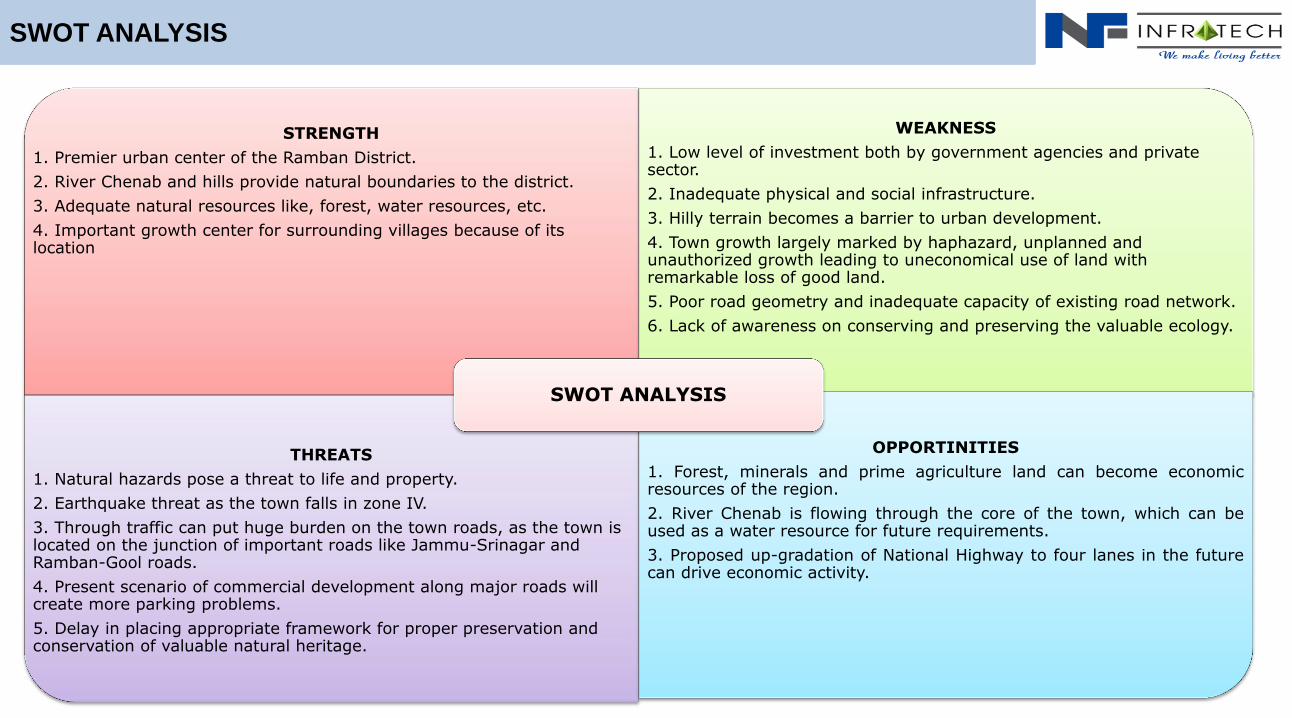
SWOT ANALYSIS
STRENGTH
1. Premier urban center of the Ramban District.
2. River Chenab and hills provide natural boundaries to the district.
3. Adequate natural resources like, forest, water resources, etc.
4. Important growth center for surrounding villages because of its location
WEAKNESS
1. Low level of investment both by government agencies and private sector.
2. Inadequate physical and social infrastructure.
3. Hilly terrain becomes a barrier to urban development.
4. Town growth largely marked by haphazard, unplanned and unauthorized growth leading to uneconomical use of land with remarkable loss of good land.
5. Poor road geometry and inadequate capacity of existing road network.
6. Lack of awareness on conserving and preserving the valuable ecology.
THREATS
1. Natural hazards pose a threat to life and property.
2. Earthquake threat as the town falls in zone IV.
3. Through traffic can put huge burden on the town roads, as the town is located on the junction of important roads like Jammu-Srinagar and Ramban-Gool roads.
4. Present scenario of commercial development along major roads will create more parking problems.
5. Delay in placing appropriate framework for proper preservation and conservation of valuable natural heritage.
OPPORTINITIES
1. Forest, minerals and prime agriculture land can become economic resources of the region.
2. River Chenab is flowing through the core of the town, which can be used as a water resource for future requirements.
3. Proposed up-gradation of National Highway to four lanes in the future can drive economic activity.
SWOT ANALYSIS

VISION
For the Master Plan, it is necessary to formulate a long term (2035) vision for Ramban town that takes into account the
present strengths, opportunities, weaknesses (limitations) and threats (SWOT). For visualizing the growth and development
of Ramban town, care has been taken to include the related requirement along with needs and aspirations of the people.
“To secure the planned development of the town as well as to provide quality infrastructure to its citizens to
improve the quality of life in an inclusive and environmentally sustainable manner”.

OBJECTIVES
• The objective of the Master Plan is to create enabling spatial and Landuse planning frameworks to achieve the vision of
LPA Ramban. The long term vision and the mission statements would require spatial Landuse planning, infrastructure planning,
planning of transportation, effective management and operation of infrastructure services, and regulating and enforcing plan
proposals.
• Specific objectives are as follows:
To develop
Ramban town as
the working
center for the
LPA and promote
compact
development of
the area by
minimizing
disturbance to
eco-sensitive
areas like forest
and hilly areas.
To minimize
haphazard,
unplanned and
sub-standard
growth and
development of
the town and to
achieve planned
growth to create
healthy
environment.
To effectively
manage the
traffic and
transportation
within the town
through the
mechanism of
rationalizing the
Landuse pattern
defined in the
Master Plan.
Optimum use of
Natural resources
and promote eco-
tourism
especially in
North East and
North West part
of the Local area.
Regulate physical
infrastructure
including Water
supply, Solid
waste and
Drainage system.
Developing and
making optimum
utilization of
existing water
bodies and
creating
additional water
bodies by
utilizing the low-
lying area along
river Chenab like
rafting.
Developing and
improving
existing gardens,
parks and open
spaces, besides
creating new
open spaces to
make Ramban
Local area green.
Decongestion
and providing the
basic
infrastructure in
the core area of
the town.

CONCEPT FOR THE PREPARATION OF RAMBAN MASTER PLAN
• On the basis of existing trend
of development and studies it
is observed that the
development activities around
Ramban are concentrated
along main roads passing
through the town besides the
area falling in the vicinity of
existing developed area of the
town.
• Besides, other economic
activities are to be explored
keeping in view of potential of
the area, along with support
infrastructure to cater the
future needs of the people.
Seri
Ramban
Pernote
Maitra Gobindpora
Tatarsoo
Chanderkot
Karol
Neera

Zone I
•Area enclosed by core area(dense residential area).
•Area of 52 hectares, which constitutes merely 1.51%
of the area of the Ramban LPA.
• It covers wards 1, 3 and 4 fully and wards 2 and 5 partially.
•Due to the dense residential developments,
narrow streets and specialized markets, the zone is proposed for
preservation, conservation and up-gradation of infrastructure in order to
make it the core area of the town.
Zone II
•Area enclosed by MC boundary.
•This Zone comprises of an area of
85 hectares and constitutes the remaining 62% of the total area of the town (2.47% of LPA).
• It consists of the ward nos. 6 and 7 fully and 2 and 5 partially.
•The projected population will be accommodated partially in this
area. The majority of the development is unplanned and the commercial areas along
major roads have been developed without parking spaces.
•A number of educational and institutional buildings also exist in this Zone.
Zone III
•Area outside MC limit and up to the Urbanisable limit.
•This Zone includes the area of Maitra village on the western side of
Chenab.
•The Zone constitutes an
area of 164ha.
•This area has rural
settlements with hills and some agricultural fields.
• It also has sporadic development, which is both unplanned and
haphazard including many government offices.
• It is largely a low density area, which is growing in an unplanned manner
Zone IV
•Agricultural/rural area/Defense/forest (Controlled Area).
•The Zone has the largest area of 3143ha (91.26% of LPA).
•The area is mainly agricultural in nature containing village
abadis, agricultural land forest lands on all sides of the region and water bodies (including
Chenab).
•To retain the green character of
this Zone, it is proposed to prevent or minimize the conversion of agricultural land
into non-agricultural use such as residential, commercial, etc.
PLANNING & DEVELOPMENT PROPOSALS
Ramban LPA covering an area of 3444 hectares has been visualized into four different Zones that are described in detail below:
PROPOSED ZONE DEVELOPMENT
Area distribution among proposed Zones – Ramban LPA.

PROPOSED ZONE DEVELOPMENT
Ramban
To Srinagar Zone I
Zone II
Zone III
Zone IV

PROPOSED LAND USE PLAN
Seri
Pernote
Neera
Karol
Tatarsoo
Maitra Govindpura
Ramban Seri
Ramban
Pernote
Maitra Gobindpora
Tatarsoo
Chanderkot
Karol
Neera
To Srinagar
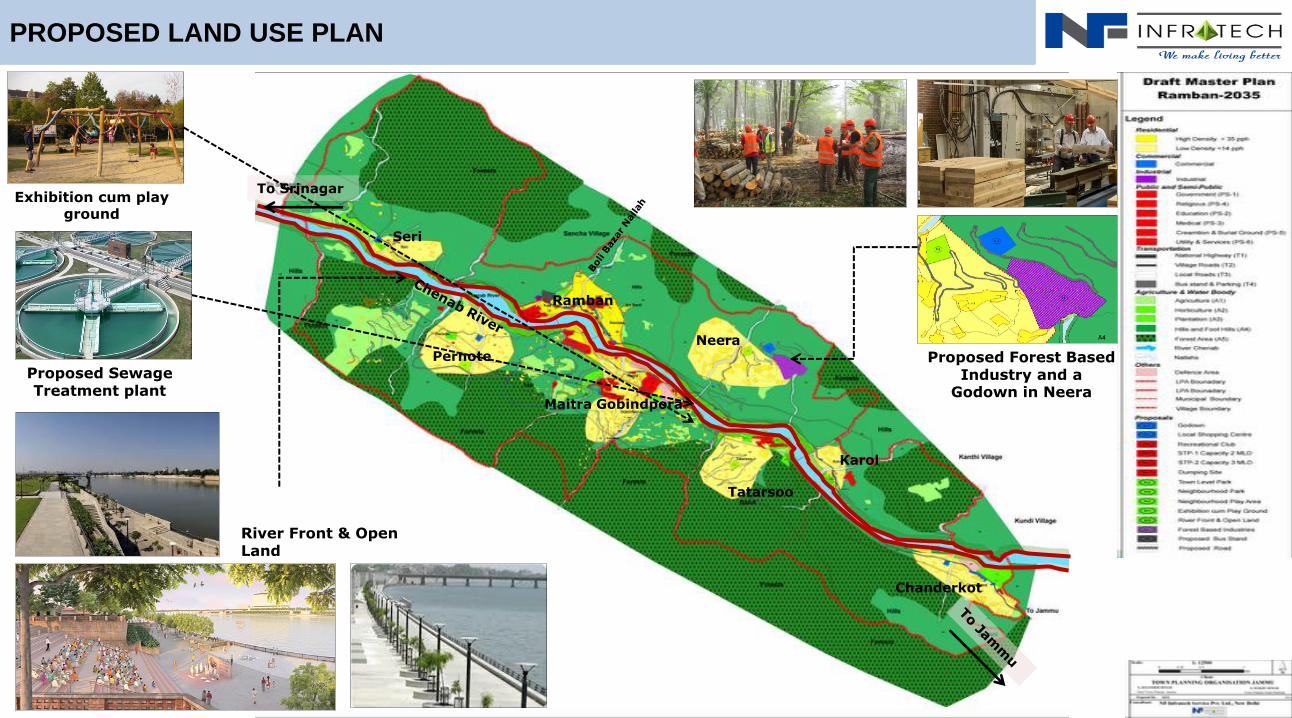
PROPOSED LAND USE PLAN
Proposed Forest Based Industry and a
Godown in Neera
River Front & Open Land
Seri
Ramban
Pernote
Maitra Gobindpora
Tatarsoo
Chanderkot
Karol
Neera
To Srinagar Exhibition cum play
ground
Proposed Sewage Treatment plant

PROPOSED LAND USE PLAN
Proposed Land Use for Overall area 2035 (Area in Ha).
Description Proposed Land Use Ha (2035)
% of the Developed
Area
% of Total Area
Developed
Residential 490 70.20 14.23
Commercial 15 2.15 0.44
Industrial 9 1.29 0.26
Public and Semi-Public
44 6.30 1.28
Utility Services 10 1.43 0.29
Recreational 23 3.30 0.67
Traffic and Transportation
107 15.33 3.11
Total 698 100 20
Undeveloped
Agriculture 148 5.39 4.30
Plantation 47 1.71 1.36
Orchards 9 0.33 0.26
Hills & Forests 2260 82.30 65.62
Open Land 49 1.78 1.42
Water Bodies/Streams
215 7.83 6.24
Army 18 0.66 0.52
Total 2746 100 80
Grand Total 3444 100
Residential , 14.23
Commercial , 0.44 Industrial , 0.26
Public and Semi-Public , 1.28
Utility Services , 0.29
Recreational , 0.67
Traffic and Transportation , 3.11
Agriculture , 4.3
Plantation , 1.36
Orchards , 0.26
Hills & Forests , 65.62
Open Land , 1.42
Water Bodies/Streams ,
6.24
Army , 0.52
Residential Commercial Industrial
Public and Semi-Public Utility Services Recreational
Traffic and Transportation Agriculture Plantation
Orchards Hills & Forests Open Land
Water Bodies/Streams Army

LAND SUITABILITY MAP FOR PROPOSED LANDUSE
I. Unsuitable Zones are non
developable areas. This is
environmental sensitive area.
II. Moderate Zone are also non
developable areas. Army and River
Chenab are categorised this zones
III. Suitable zones are fit for
development. Most of the
proposals are given in this zone.
River Front development, Bus
stand, STPs, exhibition cum play
grounds and other proposals lies
in suitable zone.

PROPOSED TRAFFIC AND TRANSPORTATION PLAN
Proposed Bus stand (2 HA) outside Ramban MC
Proposed Road
To Srinagar
Kosi Nalah
The National Highway is already slated
for up-gradation of existing bus stand.
Cross Section of Proposed Roads
Hierarchy Name of Road Existing
ROW (m)
Proposed Right of Way (m)
Proposed Building Line
(m) National Highway
Srinagar-Jammu NH-44
12 30 18
Village Road Gool Road 10 16 10 Village Road Maitra Govindpora
Road 5.20 10
7
Village Road Neera Road 5.20 10 7 Village Road Kanthi/Degree
College Road 10 13
9

PROPOSED TRAFFIC AND TRANSPORTATION PLAN
o Rationalizing conflicting movements at major
intersections, particularly during peak hours.
o Minimizing the cross traffic and side-street traffic by
regulating the gaps in the medians.
o Up-gradation of existing bridge connecting both
sides of Ramban town across Chenab.
PROPOSALS FOR URBAN ROADS (WIDENING/STRENGTHENING OF EXISTING ROADS)
PROPOSALS FOR RURAL ROADS
• The 12 villages in the planning area which have population of 500 and above as per 2011 census, need to be undertaken on a priority
basis for the development of pucca roads under Prime Minister Gram Sadak Yojana (PMGSY) or Bharat Nirman Programme.
• In the villages having more than 1,000 population, the carriage way could be limited to 3m with preferably cement concrete/brick
pavement/block pavement depending upon the local conditions.
• Road geometry at number of junctions have to be improved that have recorded high rate of accidents. The junctions for immediate
improvement are Main Chowk and Tehsil Chowk.
JUNCTION IMPROVEMENTS
Hierarchy Name of Road Existing ROW(m)
Proposed Right of Way (m)
Proposed Building Line
(m)
National Highway Srinagar-Jammu NH-44 12 16 12
Village Road Gool Road 10 16 12
Village Road Maitra Govindpora Road 5.20 10 8
Village Road Neera Road 5.20 10 8
Village Road Kanthi/Degree College Road
10 13 9
• There is no possibility or scope of widening of existing Right of Way (ROW) of these roads due to thickly built up areas existing within
the town. So some of the measures to improve the existing conditions are as follows:

PROPOSED INFRASTRUCTURE STRATEGIES
• A study has already been done by the PHE Department of Ramban under the Integrated Development Scheme for Small and
Medium Town (IDSSMT)and conceptual proposals for the water supply network has also proposed. It is proposed to keep this
proposal, as it is by PHE Department for the development of water supply network.
• Recycling of the waste water – It will minimize the wastage in the water supply system and creating awareness among community
for water conservation and minimize the pressure on ground water and will recharge the ground water.
PROPOSED WATER SUPPLY NETWORK
PROPOSED SEWAGE TREATMENT PLANT
• It is proposed that decentralized septage tank should be provided or encouraged and 2 Sewage Treatment Plants have been
proposed at suitable locations within the LPA.
• A maximum of 0.8 Hectares of land in Seri village outside the urbanizable limit has been proposed for the sanitary land fill site for
solid waste. It is proposed that the site must be acquired by the Municipal Committee, Ramban.
PROPOSED SOLID WASTE MANAGEMENT
PROPOSED SOLID WASTE MANAGEMENT
• There is a need to develop an integrated drainage system.
• The entire watershed and catchment areas of town must be mapped for effective drainage system of the planning area.
• Catchment area and watershed management will help in the agricultural productivity of the hinterland

50
ORGANIZATIONAL STRUCTURE OF RAMBAN DEVELOPMENT AUTHORITY

THANK YOU