Embed Size (px)
Citation preview
Bradley 2013
MicroeconomicsEconomics: a social science that studies the allocation of scarce resources to the production of goods and services used to satisfy consumers’ unlimited wants.
Scarcity, Choice and Opportunity Cost:Definitions:
Factors of Production:
Land – all productive resources supplied by nature Labour – human effort, physical and mental, directed to the production of goods and services Capital – man made resource used in the production of goods and services Entrepreneurship – organizes and manages factors of production, innovation etc.
Opportunity Cost:
Refers to the real cost in terms of the next best alternative that has to be forgone
Free Goods – free goods incur no opportunity cost whatsoever Economic Goods – production that incurs an opportunity cost, but is not charged to the
consumer, or “free of charge” goods,
3 Main Questions:
What and how much to produce? Allocative efficiency How to produce? Productive efficiency For whom to produce? Distributive efficiency
3 Main Decision-Making Bodies:
Households – aim to maximise satisfaction/utility from consuming a combination of goods given their limited income
Firms – aim to maximise profits from production of goods and services subject to the costs of scarce factors of production
Government – need to allocate tax revenue to fund projects and initiatives that fulfil microeconomic and macroeconomic objectives, social welfare
Absolute Advantage: perform activity with less resources
Comparative Advantage: perform activity at lower opportunity cost

Bradley 2013
Marginalist Principle
Undergirded by the assumption of Maximising Behaviour – that all rational actors will aim to maximise certain objectives, generally known as utils. The rational decision for a self-interested actor would be the optimal combination of resource allocation that maximises utility.
Production/Consumption makes sense if Marginal Benefit(MB) > Marginal Cost (MC)/ Marginal Private Benefit(MPB) > Marginal Private Cost (MPC) Firms - producing up to the point where Marginal Cost (MC) = Marginal Revenue (MR) Governments – considering Marginal Social Benefit (MSB)> Marginal Social Cost(MSC)
The Marginalist Principle is important because it allows us to find this optimal choice whereby utility is maximised because we will always choose up to the point that the benefits accrued is equal to the cost incurred.
Hence, most of our economic choices are made at the margin. We consider the “marginal cost” or the cost of consuming just a bit more against the “marginal benefit”, the benefit of consuming just a bit more.
This guarantees economic efficiency – and ensures that scarce resources are allocated optimally to produce the outcome that is optimal to society
Free Market Relies on:
Private Ownership of Property Freedom of Choice and Enterprise Pursuit of Self-Interest Competition Price Mechanism – Price functions as both a signal and incentive. Decisions of producers
determine supply and buyers determine demand. The interaction of demand and supply determines the price. Hence, the Price Mechanism allows for allocative, productive and distributive efficiency.
Bradley 2013
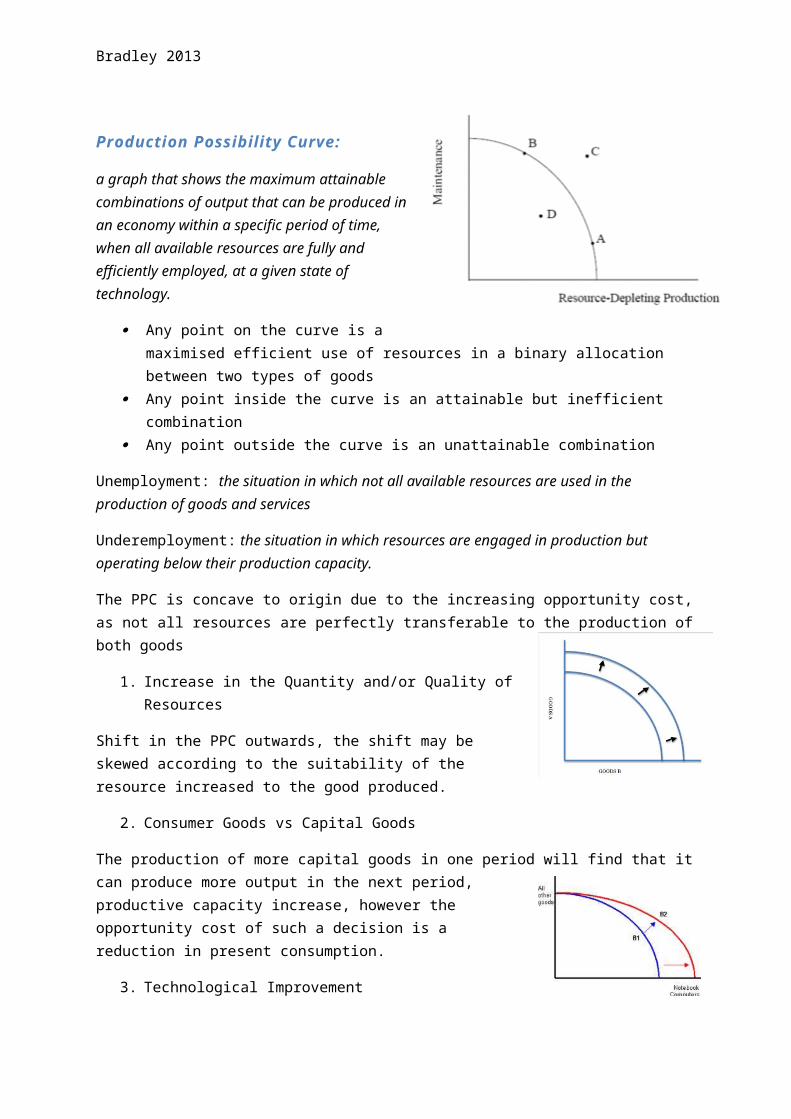
Production Possibility Curve:
a graph that shows the maximum attainable combinations of output that can be produced in an economy within a specific period of time, when all available resources are fully and efficiently employed, at a given state of technology.
Any point on the curve is a maximised efficient use of resources in a binary allocation between two types of goods
Any point inside the curve is an attainable but inefficient combination Any point outside the curve is an unattainable combination
Unemployment: the situation in which not all available resources are used in the production of goods and services
Underemployment: the situation in which resources are engaged in production but operating below their production capacity.
The PPC is concave to origin due to the increasing opportunity cost, as not all resources are perfectly transferable to the production of both goods
1. Increase in the Quantity and/or Quality of Resources
Shift in the PPC outwards, the shift may be skewed according to the suitability of the resource increased to the good produced.
2. Consumer Goods vs Capital Goods
The production of more capital goods in one period will find that it can produce more output in the next period, productive capacity increase, however the opportunity cost of such a decision is a reduction in present consumption.
3. Technological Improvement
If technological improvement favours either good, the PPC curve may be skewed.
Unemployment – not all the available resources are used in the production of goods and services
Underemployment – resources are engaged in production but are operating below their production capacity.

Bradley 2013
Demand-Supply Model:Definitions:
Free Market Economy: an economy where all economic decisions are taken by individual households and firms, with no government intervention, resources are allocated according to market forces of demand and supply.
Characteristics:
Private ownership of property – Land and capital are owned by individuals, not collectively. Economic freedom – People are free to use their factors of production as they see fit,
producers are free to produce what they like, how they like, etc. Consumers are free to buy what they please – consumer sovereignty
Self interest – everyone acts in own self interest. Producers seek to maximise profit, consumers seek to maximise satisfaction, workers try to maximise their incomes
Competition – everyone competes in producing goods, offering labour and buying goods. Limited role for Government – Government provides legal framework to protect property
rights, but beyond that keeps out of economy Price Mechanism – Prices act to coordinate the whole system, Changes in S and D cause Ps
to alter and consumers and producers respond accordingly (prices convey information)o Role of price in conveying information to buyers and sellers
Market Equilibrium – a position from which there is no inherent tendency to change, where buyers and sellers are on aggregate satisfied with the current combination of price and quantity of a good bought or sold (Ceteris Paribus)
Equilibrium Price – Price at which quantity demanded is equal to the quantity supplied, i.e. the price at which equilibrium quantity is traded OR market clearing price.
Market is said to be at disequilibrium where quantity demanded and supplied are not the same. This results in shortages or surpluses.
At prices above equilibrium, there will be a surplus in the market, exerting downward pressure on the price as suppliers compete with each other and lower prices.
At prices below equilibrium, there will be a shortage in the market, exerting upward pressure on the price as consumers compete amongst each other and offer higher prices
Price levels tend toward equilibrium in dynamic markets.
Bradley 2013
Demand and Supply:
An increase in demand will raise the equilibrium price and quantity, conversely a decrease in demand will lower the equilibrium price and quantity. Ceteris Paribus.
D1 moves to D2, resulting in an increase of price from P1 to P2, and an increase in quantity from Q1 to Q2
An increase in supply will lower the equilibrium price but still increase the equilibrium quantity, in contrast a decrease in supply will result in a lower equilibrium quantity but a higher equilibrium price.
S1 moves to S2, resulting in a decrease of price from P1 to P2, and an increase in quantity from Q1 to Q2
Simultaneous increases in D and S will result in greater quantity supplied but an uncertain price change
Simultaneous decreases in D and S will result in a lesser quantity supplied but an uncertain price change.
An increase in D but a decrease in S will result in a definite price increase but an indeterminate equilibrium quantity.
A decrease in D but an increase in S will result in a definite price fall but an indeterminate equilibrium quantity.
Bradley 2013
Demand Theory:Definition:
Demand: refers to the amount that consumers are willing and able to purchase at any given price over a given period of time. (for demand to be effective, willingness to pay must be supported by ability to pay)
Real income: Real purchasing power
Normal Good: demand for good varies proportionately with income
Inferior Good: demand falls as income increases
The quantity demanded of a good and service is inversely related to its price, ceteris paribus.Exceptions? Vablen and Giffen(inferior) goods
A movement along the demand curve is a change in the quantity demanded
A movement of the demand curve is a change in demando Any factor that influences buying plans other than
the price of a good.
Substitution Effect: the effect of a change in price on quantity demanded arising from the consumer switching to or from alternative products
Income effect: the effect of a change in the price of a commodity on quantity demanded arising from the consumer becoming better or worse off(change in real income) as a result of the price change. An increase in price leads to a decrease in Purchasing power.
Factors Influencing Market Demand (Non Price Determinants):
1. Taste and Preferences
The effect of advertisements, education, culture and age group Temporary increases in demand due to fads Permanent decreases in demand for old technology as a result of new inventions Seasonal Changes – climactic conditions and/or festivals
2. Expectations of Future Prices
If people expect the price of the good to increase, they will increase demand in current market even when prices have not increased yet, ceteris paribus
3. Income in the case of normal goods
An increase in income leads to a rightward shift in the demand curve, and a decrease in income leads to a leftward shift

Bradley 2013
The converse is true for inferior goods as consumers switch to better substitutes
4. Prices of Interrelated Goods
Changes in the price of substitutes or complements can also affect demand.
Prices of Substitute Goods
A substitute is a commodity that can be used in place of another, it satisfies the same want and are competitive in demand.
e.g. Coca-Cola and Pepsi, MRT and Taxi Services, Cadbury’s and Nestle Chocolate, Milk and Yoghurt
Hence, an increase in the price of one good results in a rise in the demand for its substitute, as consumers switch from one good to another
Prices of Complementary Goods
A complementary good is a good that is used in conjunction with another, they are jointly demanded to satisfy the same want, and are thus in joint demand.
e.g. tea and sugar, cars and petrol, digital cameras and memory sticks, DVD and DVD players, computers and computer software
A fall in the price of one good leads to an increase in demand for a complement good, this is because a fall in the price of one good leads to a bigger quantity of the quantity good and that good being purchased, which increases demand.
5. Government Policies
Direct Tax Policy
Direct tax is a tax on people’s incomes. Changes in direct tax rates affect people’s disposable income (the income available for spending after payment of income tax)
An increase in the income tax rate will reduce people’s disposable income. This reduces purchasing power, leading to a decrease in a demand for goods and services.
Direct Subsidy Policy
Direct subsidies are payments made by the government to the consumers. Direct subsidies increases purchasing power of consumers and hence demand
6. Population
Affects the number of potential consumers or the size of the market
Absolute increase or decrease in total population Change in demographic/composition of the population

Bradley 2013
7. Interest Rates
Rate of interest is the price of borrowing or using money
Changes in the rate of interest affect the level of demand by consumers, especially those than rely on loans or hire purchase
8. Exchange Rates
Changes in the rate of exchange will affect foreign demand for a country’s goods and services. Strong currencies find it easier to import whereas weak currencies find it easier to export.
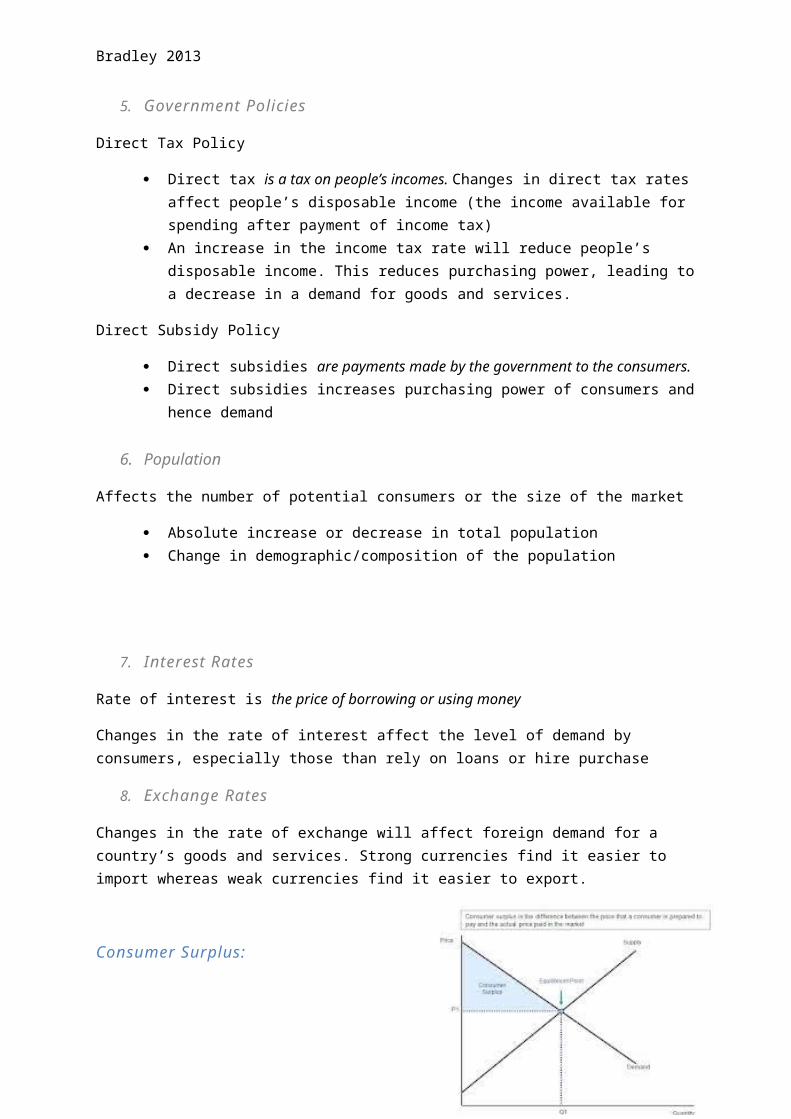
Consumer Surplus:
Consumer Surplus: is the difference between the maximum amount that consumers are willing to pay for a given quantity of a good and what they actually pay
In a competitive market, the price is actually determined by the market and demand and supply forces, the maximum amount that consumers are willing to pay gives an indication of the value of benefit (satisfaction) that consumers derive from buying the good.
Consumer surplus is also the measure of consumer welfare, the bigger the surplus the higher the level of consumer welfare.

Bradley 2013
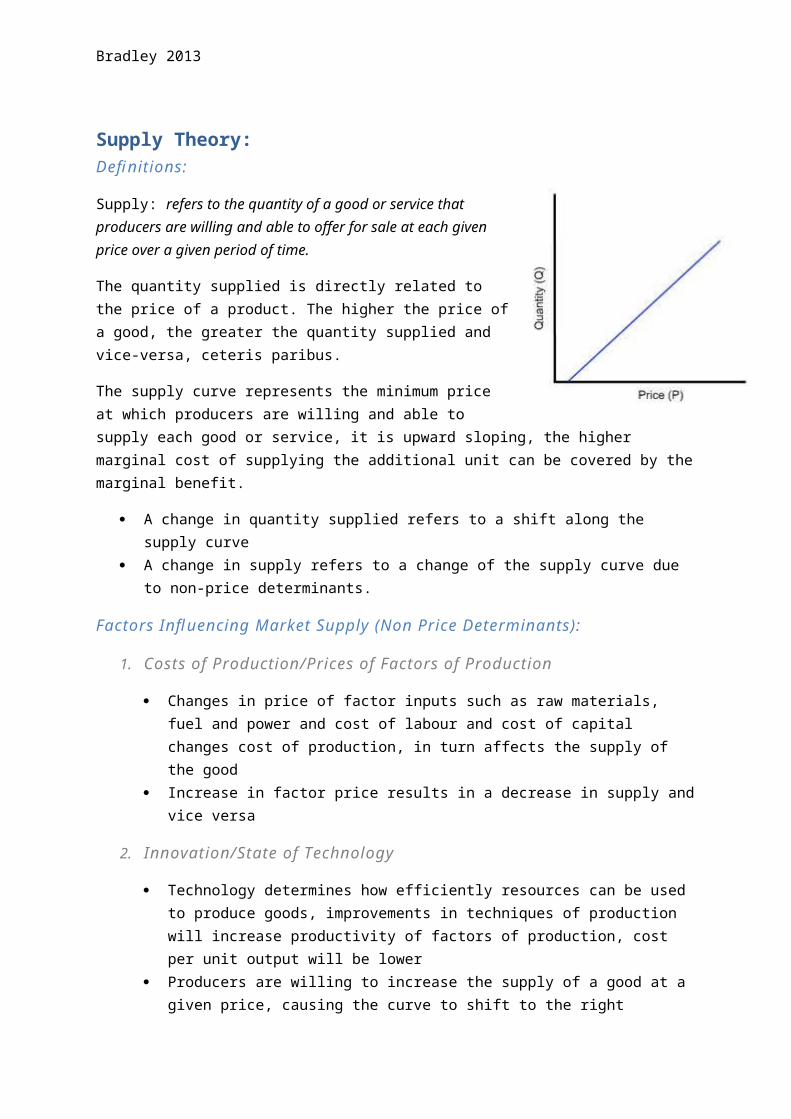
Supply Theory:Definitions:
Supply: refers to the quantity of a good or service that producers are willing and able to offer for sale at each given price over a given period of time.
The quantity supplied is directly related to the price of a product. The higher the price of a good, the greater the quantity supplied and vice-versa, ceteris paribus.
The supply curve represents the minimum price at which producers are willing and able to supply each good or service, it is upward sloping, the higher marginal cost of supplying the additional unit can be covered by the marginal benefit.
A change in quantity supplied refers to a shift along the supply curve A change in supply refers to a change of the supply curve due to non-price determinants.
Factors Influencing Market Supply (Non Price Determinants):
1. Costs of Production/Prices of Factors of Production
Changes in price of factor inputs such as raw materials, fuel and power and cost of labour and cost of capital changes cost of production, in turn affects the supply of the good
Increase in factor price results in a decrease in supply and vice versa
2. Innovation/State of Technology
Technology determines how efficiently resources can be used to produce goods, improvements in techniques of production will increase productivity of factors of production, cost per unit output will be lower
Producers are willing to increase the supply of a good at a given price, causing the curve to shift to the right
3. Natural Factors
Favourable Climatic Conditions such as abundant and reliable rainfall as well as absence of pests increases the supply of agricultural products
Occurrence of natural phenomena such as natural disasters will reduce the supply of agricultural produce.
4. Number of Firms
An increase in the number of firms producing the good increases supply and gives a rightward shift in the supply curve and vice-versa
Bradley 2013
This follows from the fact that market supply is the sum of all individual supplies
5. Government Policies
Government policies on indirect taxation and subsidies affect the cost of production of firms and therefore the supply of a good
Indirect Taxes taxes imposed on expenditure of goods and services for example GST, increases the cost of production for firms leading to fall in supply and leftward shift in supply curve
o Ad Valorem Taxes = Percentage Taxeso Unit Tax
Indirect Subsidy is a payment made to producers by the government and is equivalent to a decrease in the cost of production. This leads to a rise in supply and a rightward shift in the supply curve.
6. Prices of Related Goods: Joint Supply
Joint Supply: production of goods that are derived from a single product, so that it is not possible to produce more of one without producing more of the other.
E.g. Butter and skimmed milk, petrol and diesel, beef and leather. Increase in the price of one leads to an increase in its quantity supplied and also an
increase in supply of the other joint product
7. Prices of Related Goods: Competitive Supply
Competitive Supply: production of one OR the other by the same firm, the goods compete for the use of the same resources and producing more means producing less of the other.
E.g. wheat or corn, farmer may choose to switch from one to the other according to price fluctuations.
8. Expectations of Future Price Changes
If the price is expected to rise, producers may temporarily reduce the amount they sell in the market, building up stocks and only releasing them when the price rises.
At current prices, producers are willing to supply less than they otherwise would, this is represented by a leftward shift in the supply curve.
The opposite would be true if producers expect prices to fall.
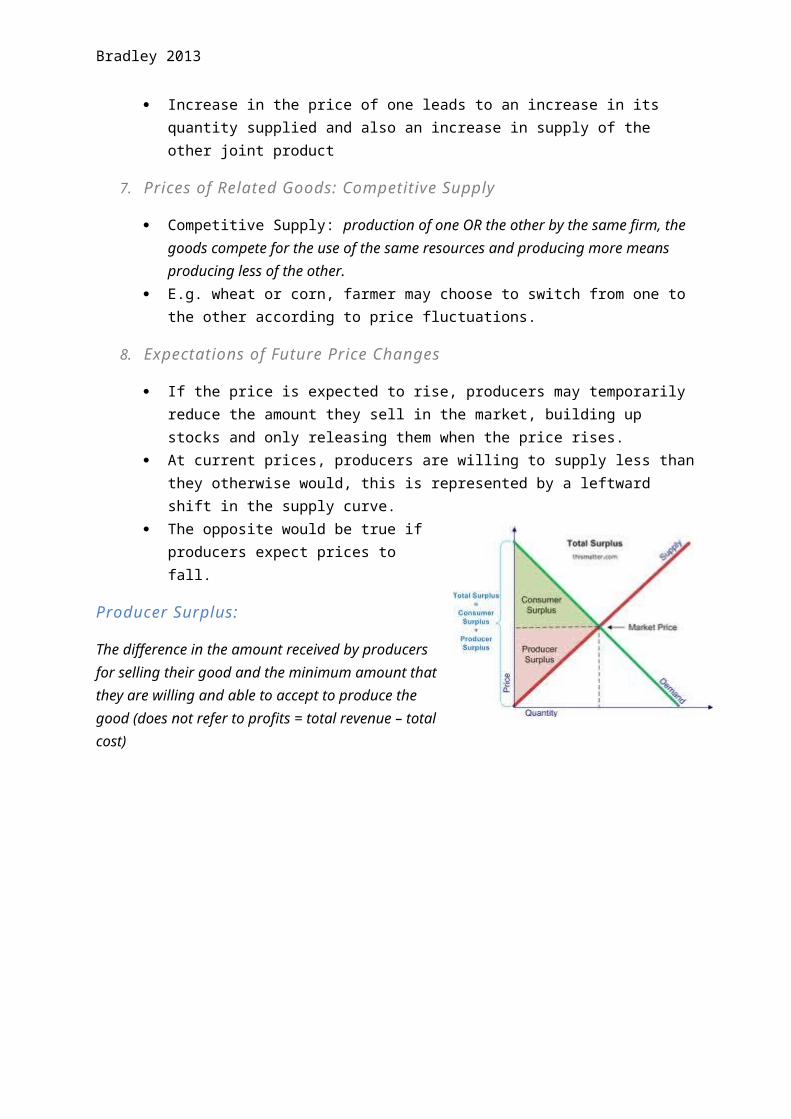
Producer Surplus:
The difference in the amount received by producers for selling their good and the minimum amount that they are willing and able to accept to produce the good (does not refer to profits = total revenue – total cost)
Bradley 2013

Bradley 2013
Role of Price Mechanism in Resource Allocation:
Free Market Economy: an economy where all economic decisions are taken by individual households and firms, with no government intervention, resources are allocated according to market forces of demand and supply.
Characteristics:
Private ownership of property – Land and capital are owned by individuals, not collectively. Economic freedom – People are free to use their factors of production as they see fit,
producers are free to produce what they like, how they like, etc. Consumers are free to buy what they please – consumer sovereignty
Self interest – everyone acts in own self interest. Producers seek to maximise profit, consumers seek to maximise satisfaction, workers try to maximise their incomes
Competition – everyone competes in producing goods, offering labour and buying goods. Limited role for Government – Government provides legal framework to protect property
rights, but beyond that keeps out of economy Price Mechanism – Prices act to coordinate the whole system, Changes in S and D cause Ps
to alter and consumers and producers respond accordingly (prices convey information)o Role of price in conveying information to buyers and sellers
Price Mechanism:
Price as Signal – prices communicate information to decision makers
Price as Incentive – prices motivate decision makers to respond to the information
Product Market vs Factor/Resource Market
factor resources are allocated according to the forces of demand and supply in both the factor resource markets and the final product markets. Changes in the final product markets can have effects on the factor resource markets. Resource movements.
Demand for factors of production is a derived demand; refers to demand for one good or service that occurs as a result of the demand for another intermediate/final good or service.
An increase in demand for a product will result in an increase in a demand for the factor good.
Economic Efficiency in Competitive Markets
Efficiency: best possible use of resources; allocative and productive efficiency
Allocative Efficiency: society produces and consumes a combination of goods and services that maximises welfare. Right goods in right quantities
This is achieved when Price = Marginal Cost, valuation of last unit of good consumed is equal to the opportunity cost in producing that last unit of good.
Bradley 2013
Marginal Social Cost = Marginal Social Benefit, when the additional
Productive Efficiency: situation where firms produces goods by using the fewest possible resources. Alternatively it could be interpreted at given output at lowest possible cost
This is achieved when: Firms produce at the lowest point on the long run average cost curve from Society’s point of view, or when Firms produce at any point on the long run average cost curve from firm’s point of view.

Bradley 2013
Elasticities of Demand and Supply:Definitions:
Elasticity: is a measure of the responsiveness of a variable to changes in price or any of the variable’s determinants.
Price Elasticity of Demand (PED): is a measure of the responsiveness of the quantity demanded of a good to a change in its price, Ceteris Paribus.
Income Elasticity of Demand (YED): is a measure of the responsiveness of demand of a good to a change in consumers’ income, ceteris paribus.
Cross Elasticity of Demand (XED): is a measure of the responsiveness of demand of a good to a change in price of another good, ceteris paribus.
Price Elasticity of Supply (PES): is a measure of the responsiveness of the quantity supplied of a good to a change in its price, Ceteris Paribus
Price Elasticity of Demand:
Formula:
PED = Percentage Change in Qd/Percentage change in P
= Q/Q0 + P/P0
=Q/P x P0/Q0
The coefficient of PED is normally negative because of the inverse relationship between price and quantity demanded. The negative sign is thus ignored and the absolute value is considered.
Note: Elasticity of Demand is always considered in relation to a change in supply, and vice versa.
Bradley 2013
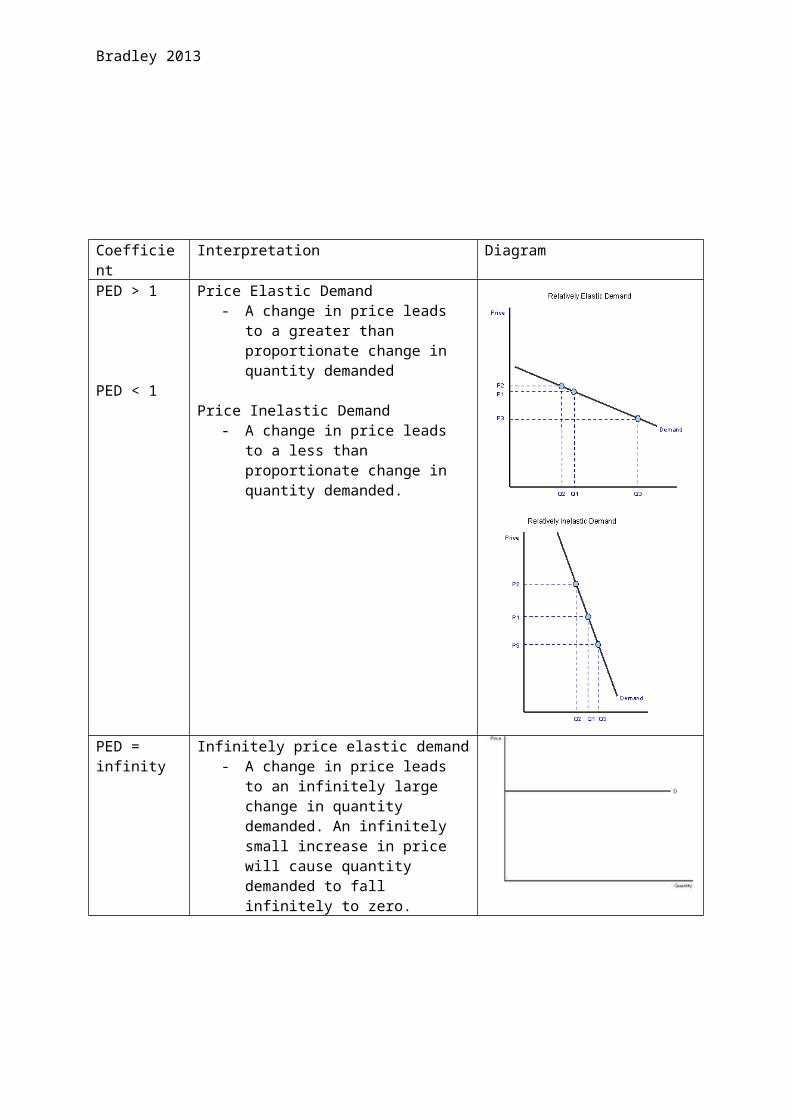
Coefficient Interpretation DiagramPED > 1
PED < 1
Price Elastic Demand- A change in price leads to a greater
than proportionate change in quantity demanded
Price Inelastic Demand- A change in price leads to a less than
proportionate change in quantity demanded.
PED = infinity Infinitely price elastic demand- A change in price leads to an
infinitely large change in quantity demanded. An infinitely small increase in price will cause quantity demanded to fall infinitely to zero.
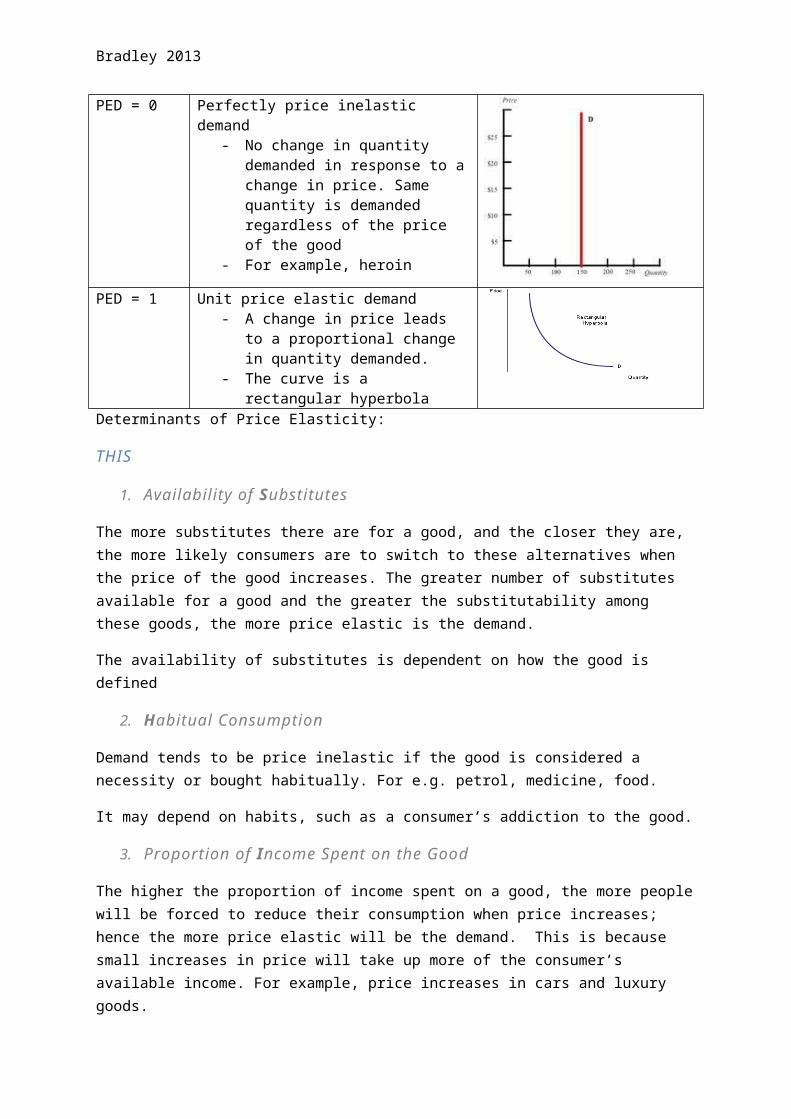
PED = 0 Perfectly price inelastic demand- No change in quantity demanded in
response to a change in price. Same quantity is demanded regardless of the price of the good
- For example, heroin
Bradley 2013
PED = 1 Unit price elastic demand- A change in price leads to a
proportional change in quantity demanded.
- The curve is a rectangular hyperbola
Determinants of Price Elasticity:
THIS
1. Availability of Substitutes
The more substitutes there are for a good, and the closer they are, the more likely consumers are to switch to these alternatives when the price of the good increases. The greater number of substitutes available for a good and the greater the substitutability among these goods, the more price elastic is the demand.
The availability of substitutes is dependent on how the good is defined
2. Habitual Consumption
Demand tends to be price inelastic if the good is considered a necessity or bought habitually. For e.g. petrol, medicine, food.
It may depend on habits, such as a consumer’s addiction to the good.
3. Proportion of Income Spent on the Good
The higher the proportion of income spent on a good, the more people will be forced to reduce their consumption when price increases; hence the more price elastic will be the demand. This is because small increases in price will take up more of the consumer’s available income. For example, price increases in cars and luxury goods.
4. Time Period
When the price of a good rises, the consumer will take time to respond to price changes, adjust their consumption pattern and find alternatives, the longer the time period the more price elastic demand will be.
Usefulness of PED
PED is able to analyse the effects of a price change arising from a change in government policy or firms pricing policy, (Ceteris Paribus).
PED and Firms Pricing Decisions
Relationship between PED and Total Revenue: Price x Quantity
If demand for product is price inelastic, ceteris paribus, then firms should raise price to maximise total revenue.
Bradley 2013
If demand for product is price elastic, ceteris paribus, then firms should lower its price so as to increase total revenue.
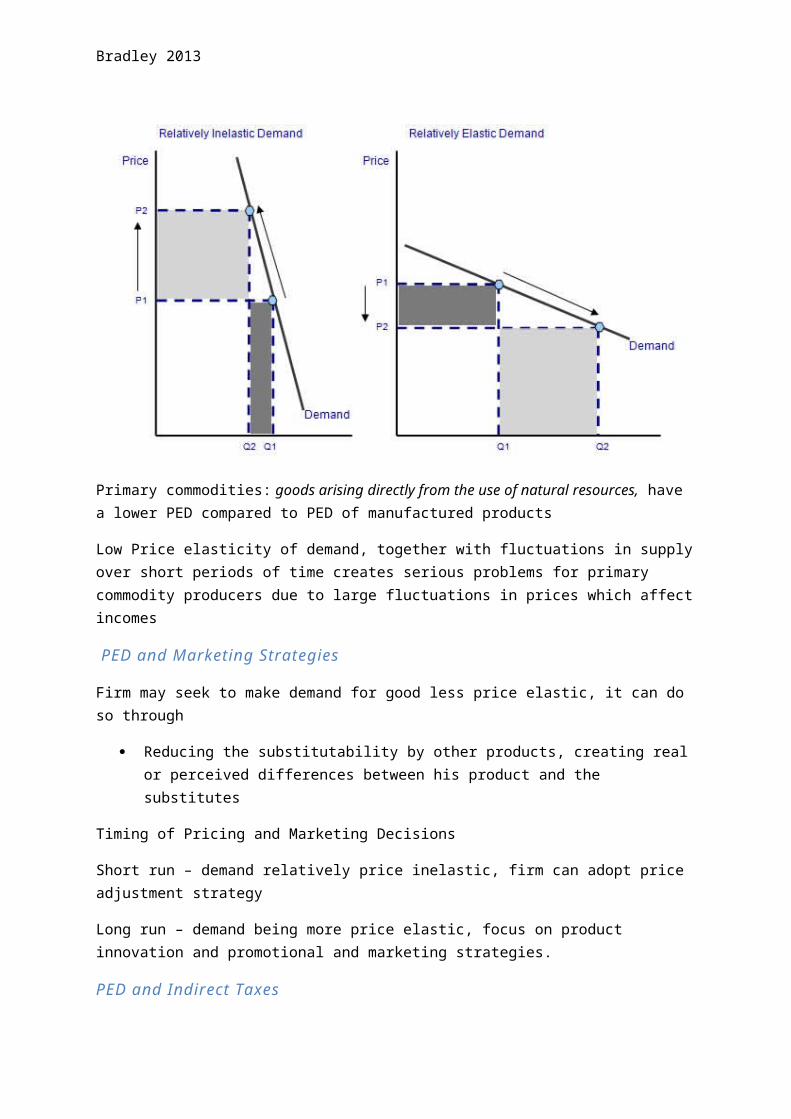
If demand is price elastic, then price and Total Revenue move in opposite directions, an increase in price leads to a decrease in total revenue and vice versa
If demand is price inelastic, then price and Total Revenue move in the same direction, an increase in price leads to an increase in total revenue and vice versa
Primary commodities: goods arising directly from the use of natural resources, have a lower PED compared to PED of manufactured products
Low Price elasticity of demand, together with fluctuations in supply over short periods of time creates serious problems for primary commodity producers due to large fluctuations in prices which affect incomes
PED and Marketing Strategies
Firm may seek to make demand for good less price elastic, it can do so through
Reducing the substitutability by other products, creating real or perceived differences between his product and the substitutes
Timing of Pricing and Marketing Decisions
Short run – demand relatively price inelastic, firm can adopt price adjustment strategy
Bradley 2013
Long run – demand being more price elastic, focus on product innovation and promotional and marketing strategies.
PED and Indirect Taxes
Lower the price elasticity, the greater government revenue. Price Inelastic Goods usually taxed
Income Elasticity of Demand
Income Elasticity of Demand (YED) measures the responsiveness of demand of a good to a change in consumers’ income, ceteris paribus.
YED helps us predict how much the demand curve will shift for a given change in income, ceteris paribus.
Formula:
YED = (% in quantity demanded/% in income)
=Q/Qo divided by Y/Yo
=Q/Y x Yo/Qo
Coefficient of YED can either be positive, negative or zero.
If YED is negative (YED <0), the good is an inferior good, an increase in income will lead to a fall in demand for the good
If YED is positive (YED>0), the good is a normal good, an increase in income will lead to an increase in demand for that good.
If it is positive but less than one (0 < YED < 1), demand for good is income inelastic, a percentage increase in income produces a smaller percentage increase in quantity demanded. E.g. necessities.
If it is positive and greater than one (YED > 1), the demand for that good is income-elastic, a percentage increase in income produces a larger percentage increase in quantity demanded. E.g. Luxury goods.
Determinants of Income Elasticity of Demand:
Mostly determined by the degree of necessity of the good. The more basic an item is in the consumption pattern of households, the lower is its income elasticity of demand.
The nature of a good is dependent on the level of income of the consumer, a good can be a luxury good at low income levels, a necessity at middle income levels and an inferior good at very high income levels.
An increase in income will produce a small rightward shift in the demand curve for necessities, and a large rightward shift for luxuries, in the case of an inferior good, an increase in income results in a leftward shift
Bradley 2013
Applications of Income Elasticity of Demand:
YED is important to firms when incomes are changing in a country. Firms can ascertain the nature of their product and plan the future output accordingly. Income elasticity of demand also helps firms in planning the future size of the market for their product
Responding to changes in income, if household incomes are rising, firms could
Produce goods which are income elastic (luxury goods) Make products more income elastic by making it more prestigious or luxurious Stock up more of the normal and luxury goods in anticipation of the rise in demand Plan to expand the number of retail outlets it has
If household incomes are falling or expected to fall, firms could
Stock up or switch to goods which are more income inelastic in demand e.g. necessities Focus marketing efforts on groups that view the good as essential Promote the good as value for money to the budget conscious
Targeting different consumer groups
YED and the Government
Can help the government predict demand patterns and allow government to project changes in government policies.
Cross Price Elasticity of Demand (XED)
Cross price elasticity of demand (XED) measures the responsiveness of demand of a good to a change in price of another good, ceteris paribus.
XED predicts how much the demand curve for a particular good will shift in response to a given change in the price of another good, ceteris paribus.
Formula:
XED (of good A) =%in quantity demanded of good A/% in price of good B
=Qa/Qa divided by Pb/Pb
=Qa/Pb x Pb/Qa
Interpretation of Sign and Coefficient
If XED is negative (XED <0), the two goods are complements. An increase in the price of one good leads to a fall in the demand for the other good. The larger the absolute value of the negative XED, the greater is the complementarity between the two goods.
Bradley 2013
If XED is zero (XED = 0), the two goods are unrelated.
If XED is positive, (XED > 0), the two goods are substitutes. An increase in the price of one good will lead to an increase in the demand for the other good.
If XED is positive but less than one ( 0 < XED < 1) the two goods are not very close substitutes since the demand for one does not respond very much to a change in price of the other
If XED is greater than one (XED>1) then the two goods are close substitutes, hence the value of XED shows the degree of substitutability between the two goods, the larger the value of XED the greater is the substitutability between the two goods.
Determinants of XED:
The determinants of XED are the relationship between the two goods and the closeness of the substitute and complement.
Applications of XED:
XED and Firms:
Pricing Policies: a firm may have a product that has a high positive XED in relation to his rivals product (close substitutes), in such a case the firm will have to respond to changes in the price of the rival’s product (price cuts, price raise?)
Should the competitor lower the price of his good, firm has to respond by lowering price of his good to prevent loss – striving to be as cost efficient as possible
Marketing Sales Strategies:o Making good less substitutable so that it is less affected by the pricing policies of the
rival firms. Advertising or improving producto Complementary goods, linking marketing plans to pricing policy of other firms,
collaborations or packaging.
Price Elasticity of Supply (PES)
Price Elasticity of Supply (PES) is defined as a measure of the responsiveness of quantity supplied to a change in the commodity’s own price, ceteris paribus.
PES gives us an indication of the ease at which a firms production can be expanded when price changes.
Formula
PES = (%in quantity supplied)/(% in price)
=Q/Qo divided by P/Po
Bradley 2013
=Q/P x Po/Qo
Interpretation of Coefficient
Coefficient Interpretation Diagram
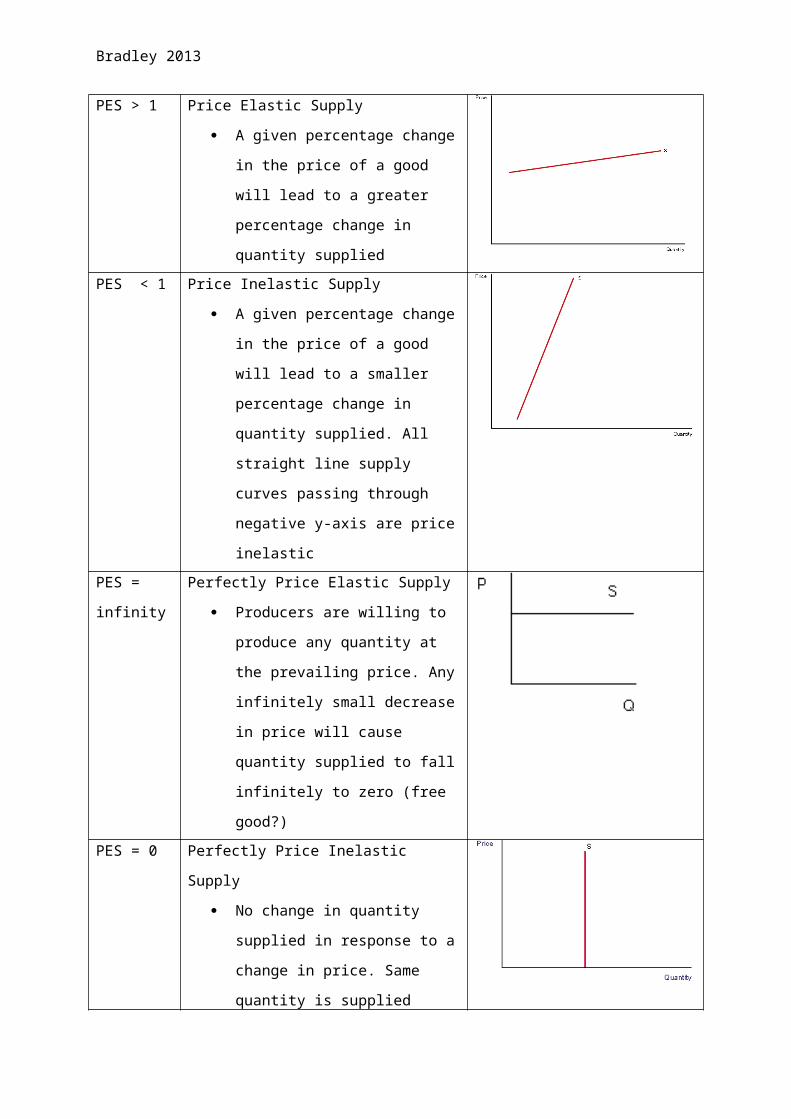
PES > 1 Price Elastic Supply
A given percentage change in the
price of a good will lead to a greater
percentage change in quantity
supplied
PES < 1 Price Inelastic Supply
A given percentage change in the
price of a good will lead to a smaller
percentage change in quantity
supplied. All straight line supply
curves passing through negative y-
axis are price inelastic
PES = infinity Perfectly Price Elastic Supply
Producers are willing to produce any
quantity at the prevailing price. Any
infinitely small decrease in price will
cause quantity supplied to fall
infinitely to zero (free good?)
PES = 0 Perfectly Price Inelastic Supply
No change in quantity supplied in
response to a change in price. Same
quantity is supplied regardless of the
price of good
Bradley 2013
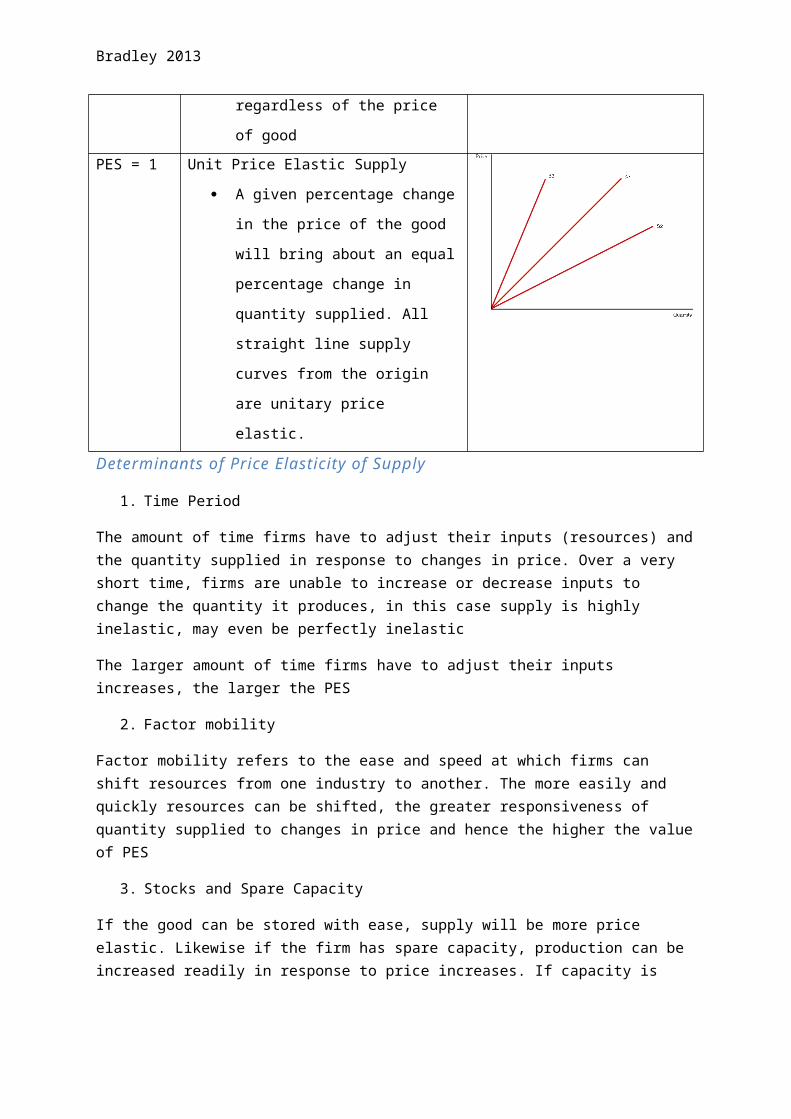
PES = 1 Unit Price Elastic Supply
A given percentage change in the
price of the good will bring about an
equal percentage change in quantity
supplied. All straight line supply
curves from the origin are unitary
price elastic.
Determinants of Price Elasticity of Supply
1. Time Period
The amount of time firms have to adjust their inputs (resources) and the quantity supplied in response to changes in price. Over a very short time, firms are unable to increase or decrease inputs to change the quantity it produces, in this case supply is highly inelastic, may even be perfectly inelastic
The larger amount of time firms have to adjust their inputs increases, the larger the PES
2. Factor mobility
Factor mobility refers to the ease and speed at which firms can shift resources from one industry to another. The more easily and quickly resources can be shifted, the greater responsiveness of quantity supplied to changes in price and hence the higher the value of PES
3. Stocks and Spare Capacity
If the good can be stored with ease, supply will be more price elastic. Likewise if the firm has spare capacity, production can be increased readily in response to price increases. If capacity is maxed, it will be more difficult. Hence the greater the spare capacity, the higher the PES
4. Length of production period
The shorter the time period for producers to convert inputs into outputs, the more price elastic is the supply of the good. Supply of agricultural goods tends to be price inelastic, in contrast manufacturing goods are more price elastic because the time taken is relatively short
Applications:
In general, primary commodities usually have a lower PES than manufactured products. Hence there are greater price fluctuations in relatively price inelastic goods.
Bradley 2013
Limitations: (Specific limitations to each Elasticity Concept)
Factors affecting supply
CRINGE
Cost of production Inter-related goods (competitive supply- chicken and eggs and joint supply- beef and
leather) Innovation- new technology etc Natural Factors- drought flood etc Government Policies- subsidies and taxes (when drawing the graph, use the specific tax/ ad
valorem tax graphs if taxes Consumer expectations (consumer irrationality etc "my bike is outside")
Difficulties in computing exact elasticity values due to income differences/socio-cultural differences
Ceteris Paribus assumption does not hold true in the real world.
PED
Factors affecting demand can range from Income, change in prices of other Goods, etc
Limitations: different changing factors like income (recession) or changes in prices of complements or substitutes will render PED expectations less accurate.
YED
Which income group do you pick as a representative? To different groups (rich and poor) there will be fairly different attitudes that exist towards the product.
Defining a target group is difficult, understanding income differences.
XED
Is useful when
(A) Substitute good: tries to either make good more competitive by lowering price or make it less substitutable. However- cost of making it less substitutable may not be feasible (overall increase of revenue may not be substantial)

Bradley 2013
(B) Complement good: tries to joint market the good: however this may not be possible due to difficulty of working with another company and/or associated cost. Company may not be able to increase profit or revenue by intended amount due to amount spent on making themselves more competitive/attractive
Question types:
-how will this market/industry be able to use this information
-how useful will this be to firms (maximise profit maximise revenue minimise cost)
Bradley 2013
Government Intervention and Impacts on Market Outcomes:
Indirect Taxes
Indirect taxes are compulsory payments levied by the government on expenditure/spending, they can be classified into 3 types: general expenditure taxes, excise duties and customs duties. These taxes are paid to government by the producers. Producers may pass some if not all of the tax burden onto consumers, depending on the relative price elasticity of demand and supply of the good.
Indirect taxes lead to a leftward shift in the supply curve, lead to lower quantity and higher prices, however the price will not ruse by full amount of tax because demand curve is downward sloping.
An indirect tax can either be a specific tax or an ad valorem tax. A specific tax or a per unit tax is a constant sum levied on each unit of the good sold and will shift the supply curve vertically upwards (parallel).
An ad valorem or percentage tax is a tax pegged at a certain percentage price of the good, hence the curve pivots upwards anti-clockwise.
Incidence of Tax: distribution of the burden of taxation between consumers and sellers.
Price Elasticity of Demand and Supply and Tax Incidence
In the case of a relatively inelastic demand, the producers will bear less of the burden than the consumers. Vice versa
Indirect Subsidy
A negative tax or payment to the producers by the government, the effect of an indirect subsidy is to lower the cost of production, thereby shifting the supply curve downwards by the amount of the subsidy.
Hence the benefit of an indirect subsidy is shared between consumers and producers as well depending on the price elasticity of demand and supply.
If Supply is Elastic but Demand is Inelastic, consumers receive a greater share of the subsidy when demand is relatively less price-elastic than supply.
Conversely, if demand is more price elastic than subsidy, producers receive a greater share of the subsidy.
Price Controls
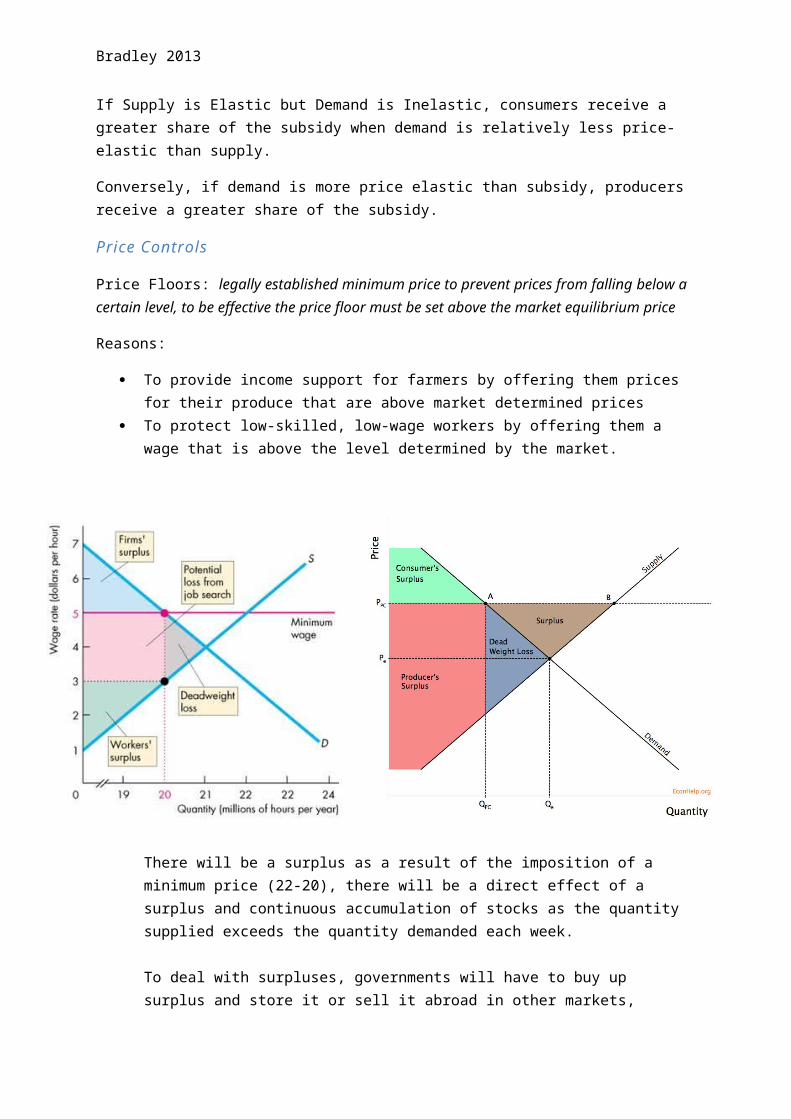
Price Floors: legally established minimum price to prevent prices from falling below a certain level, to be effective the price floor must be set above the market equilibrium price
Reasons:
Bradley 2013
To provide income support for farmers by offering them prices for their produce that are above market determined prices
To protect low-skilled, low-wage workers by offering them a wage that is above the level determined by the market.
There will be a surplus as a result of the imposition of a minimum price (22-20), there will be a direct effect of a surplus and continuous accumulation of stocks as the quantity supplied exceeds the quantity demanded each week.
To deal with surpluses, governments will have to buy up surplus and store it or sell it abroad in other markets, storage costs vs exporting surplus at a subsidized price to make it competitive.
Firm Inefficiency – inefficient firms do not face incentives to cut costs by using more efficient means of production as they have a minimum guaranteed price.
Over allocation of resources – new producers may be attracted, creating even greater surpluses, too many resources may be allocated and thus resulting in allocative inefficiency, missing the social optimum
Negative welfare impacts – Changes in consumers and producers surplus, a deadweight welfare loss is experienced, represents welfare benefits that are lost to society because resources are not allocated efficiently.
Bradley 2013
Labour surpluses and unemployment
Illegal workers at wages below the minimum wage.
Bradley 2013
Maximum Price (Price Ceilings)
Legally established maximum price to prevent prices from rising above a certain level, must be set below market equilibrium price.
Maximum price is usually imposed with the aim of achieving some form of equity, for example rent controls make housing more affordable to low-income earners or food price controls to make necessities more affordable.
Consequences:
Shortage:
When a price ceiling is established below equilibrium price, it results in shortages as quantity demanded exceeds the quantity supplied. Prices are not allowed to rise to eliminate the shortages
Non-Price Rationing:
Rationing refers to a method of dividing something among possible users, this no longer functions and hence will result in queues, distribution of coupons or restrictions of sales to favoured customers
Underground or Black Markets:
The emergence of a black market results in producers selling goods illegally at prices above the maximum price.
Bradley 2013
To minimise these problems, the government can encourage supply through drawing on past surpluses, direct production or giving subsidies or tax relief, alternatively it can reduce demand by controlling income or producing more alternatives
Under production relative to social optimum quantity, society is worse off to underallocation of resources, leading to allocative inefficiency.
Bradley 2013

Bradley 2013
Labour Market:The market for labour is a market for a factor of production. It is similar to any other market, in the labour market, buyers and sellers transact labour for wages
Demand for Labour:
Is a derived demand, therefore demand for labour is intrinsically linked to the monetary value of the additional goods and services that additional unit of labour producers
Demand for labour is downward sloping in a competitive market.
Supply of Labour:
Made up of individuals who are willing and able to work for a given wage
Supply curve for labour is upward sloping.
Non Wage Determinants of Demand and Supply of Labour
Changes in price of the final product it produces, the demand for labour is dependent upon the demand of the goods and services that it produces
Changes in the physical output each unit of labour is able to produce (productivity of labour)o May be due to advancements in technology or education o The higher output per worker encourages firms to employ more workers, hence
demand curve for labour shifts to the right Changes in prices of other factors of production used in production
o Capital can be seen as a substitute for labour in certain production processes, better capital shifts demand to the left
o Resources may be complementary to labour, the increase or decrease in one of them employed in production results in the same increase or decrease in labour.
Long Term Supply of Labour:
Changes in Size of Population, foreign labour policy, birth rates/death rates Labour Force Participation Rate, retirement age, demographic Changes in tax and benefits levels
Supply of Labour to a Particular Industry
Changes in Educational Attainments, Number of people Qualified to hold the job Changes in job scope/job conditions
o E.g. job satisfaction, working environment, job security, status, power, holidays Changes in wage rate and non-wage benefits in other industries
Wage Differentials
Bradley 2013
Non-Competing Groups – labour market is made out of many sub groups Compensating Differentials – jobs differ in attractiveness and are influenced greatly
by non-pecuniary aspects of the job Labour Market Imperfections (trade unions) and Government Intervention Non Economic Factors – Such as Discrimination
Wage Determination in Singapore – Govt Intervention
National Wages Council (NWC) consisting of:o Ministry of Manpower (MOM)o National Trade Union Congress (NTUC)o Singapore National Employers Federation (SNEF)
Bradley 2013
Essay Writing:
1. Definitions2. Diagrams3. Discuss Relevant Economic Theory4. Distinguish between that which is important and that which
is not important5. Discern between relatively more and relatively less
important6. Draw appropriate conclusions
Step 1: What is the question asking for?
Step 2: What terms need to be defined?
Step 3: What diagrams need to be drawn (which concepts am I explaining?)
Step 4: What are 2 – 3 important points I must explain?
Step 5: What are the conclusions I must draw specific to the question?
Step 6: How can I evaluate these points? (which is more important, bring in other concepts)