Embed Size (px)
Citation preview

SCARF Annual Report 2011-2012
15/10/12 SCARF_Annual_Report_2011-2012.vfinal 1
SCARF Annual Report 2011-2012 Version: Final Date: 16/10/2012 Edited by Peter Oliver ([email protected] UH ) 01235 441564 Content written by the respective authors
DATE REVISION CHANGES 15/10/12 Final Published 05/09/12 1.2 Scientific Content Added 07/08/12 1.1 SCARF Stats, availability 07/06/12 1.0 Initial document
Abstract Annual Report on the Usage and Scientific Impact of the SCARF Service
Dissemination
The is a public document

SCARF Annual Report 2011-2012
15/10/12 SCARF_Annual_Report_2011-2012.vfinal 2
Contents
U1.U USCARF ServiceU __________________________________________________________________________________ 4
U1.1U USCARF Usage by DepartmentU _____________________________________________________________ 4
U1.2U USCARF AvailabilityU _____________________________________________________________________ 5
U1.3U USCARF Developments 2011-12U ____________________________________________________________ 7
U1.4U UFuture DevelopmentU _____________________________________________________________________ 7
U1.5U UHelp and SupportU _______________________________________________________________________ 7
U2.U UPublications and Presentations U _____________________________________________________________________ 8
U2.1U UPublicationsU ____________________________________________________________________________ 8
U2.2U UPresentationsU ___________________________________________________________________________ 8
U2.3U UCoursesU _______________________________________________________________________________ 8
U3.U UScience HighlightsU _______________________________________________________________________________ 8
U3.1U UStewart F. Parker (ISIS)U _________________________________________________________________ 8 U3.1.1U UInelastic neutron scattering spectroscopy (INS) U ____________________________________________ 8
U3.2U UJ. C. Crabtree, S. C. Parker (University of Bath), J. A. Purton (STFC, Daresbury) U ________________ 11 U3.2.1U UGCMC simulations of CO2 adsorption in zeolites U __________________________________________ 11
U3.3U UAR Bell (Oxford, CLF)U _________________________________________________________________ 13 U3.3.1U UMagnetic field amplification driven by energetic particle streaming. U ___________________________ 13
U3.4U UJames Holloway (UCL, STFC-CLF)U _______________________________________________________ 15 U3.4.1U UDiamond Simulations.U _______________________________________________________________ 15
U3.5U UGabriella Graziano (University College of London), Jiří Klimeš (University College of London), Felix Fernandez-Alonso (ISIS), Angelos Michaelides (University College of London)U _________________________ 16
U3.5.1U UDensity functional theory study of the interaction of molecular hydrogen and soft layered materials U __ 16
U3.6U URob Williamson (ISIS)U __________________________________________________________________ 19 U3.6.1U ULongitudinal Beam Dynamics Simulations of ISIS and its Upgrades U ___________________________ 19
U3.7U USanghamitra. Mukhopadhyay (ISIS)U ______________________________________________________ 21 U3.7.1U UUnderstanding Atomic Scale properties of Functional Materials using Density Functional Theory U ____ 21
U3.8U UAJ Ramirez-Cuesta (ISIS)U _______________________________________________________________ 24 U3.8.1U UStudying dynamics using Inelastic Neutron Scattering and Computer Modelling: Neutron Scattering and the EnvironmentU ____________________________________________________________________________ 24
U3.9U UDean Adams (ISIS)U _____________________________________________________________________ 26 U3.9.1U UHigh Intensity Beam Studies on the ISIS Synchrotron using ORBIT. U __________________________ 26
U3.10U UDavid S.D. Gunn, Ilian T. Todorov, John A. Purton (CSED) U __________________________________ 28 U3.10.1U UDefect Formation and Oxygen Vacancy Migration in Gd2Ti2O7 and Gd2Zr2O7 PyrochloresU _________ 28
U3.11U UC. W. Yong (CSED) and R. Strange (Molecular Biophysics Group, Faculty of Health and Life Sciences, University o f Liverpool) U _______________________________________________________________________ 29
U3.11.1U UComputational Studies of motor neuron disease mutants of Cu,Zn superoxide dismutase (SOD1) - insight into mechanisms of toxicity. U _____________________________________________________________ 29
U3.12U UA.P.L.Robinson, Plasma Physics Group, (CLF)U _____________________________________________ 30 U3.12.1U UUltra-intense lasersU _________________________________________________________________ 30
U3.13U UBin Qiao (QUB), Macro Borghesi (QUB), Matthew Zepf (QUB), David Neely (RAL) U ______________ 31 U3.13.1U UScarf usage summary of Queens University Belfast plasma physics in 2012 U _____________________ 31
U3.14U URowan Hargreaves (ISIS)U _______________________________________________________________ 35 U3.14.1U UMeasuring the effect of temperature on micelle structure using wide Q-range neutron diffraction U ____ 35
U3.15U UE. Higson1,2, R. Trines2, R. Bingham2,3, and P.A. Norreys1,2,4 [1]University of Oxford [2] Central Laser Facility, [3] University of Strathclyde, [4] Imperial College London.U ___________________________________ 37

SCARF Annual Report 2011-2012
15/10/12 SCARF_Annual_Report_2011-2012.vfinal 3
U3.15.1U UThe role of phase front deformation on the growth of the filamentation instability in laser-plasma interactionsU ________________________________________________________________________________ 37
U1.U UAPPENDIX : SCARF Hardware DetailsU ____________________________________________________________ 41
U2.U UAPPENDIX: Index of Figures U ____________________________________________________________________ 41
U3.U UAPPENDIX: Publications and Presentations U ________________________________________________________ 43
U4.U UAPPENDIX: SCARF Queue Usage 2011-12U _________________________________________________________ 47
U4.1U UGeneral SCARF QueueU _________________________________________________________________ 47
U4.2U USCARF-Lexicon[1-2] Queues U ____________________________________________________________ 48
U4.3U USCARF-IBISU __________________________________________________________________________ 49
U4.4U USCARF Total Power draw (amps) U ________________________________________________________ 49
U4.5U UFilesystem UsageU _______________________________________________________________________ 50
U4.6U UNetworkingU ___________________________________________________________________________ 51
U5.U UAppendix – SCARF DevelopmentsU _________________________________________________________________ 52
U5.1U UTechnical DevelopmentsU ________________________________________________________________ 52
U5.2U UApplication StackU ______________________________________________________________________ 53
U5.3U UStaff MovementsU _______________________________________________________________________ 53
SCARF Annual Report 2011-2012
15/10/12 SCARF_Annual_Report_2011-2012.vfinal 4
1. 0BSCARF SERVICE
SCARF is a High Performance Cluster for STFC staff, Facilities (ISIS, DIAMOND, CLF) and their users. The SCARF Service was started in 2004 and has been upgraded year on year and now represents a significant capital investment in High Performance Computing. Overall SCARF now has over 2700 CPU cores, 6.7TB memory and 100TB of diskspace (Details in Appendix 1). This report covers the year 2011-12 and outlines the research that SCARF has enabled. 1.1 8BSCARF Usage by Department
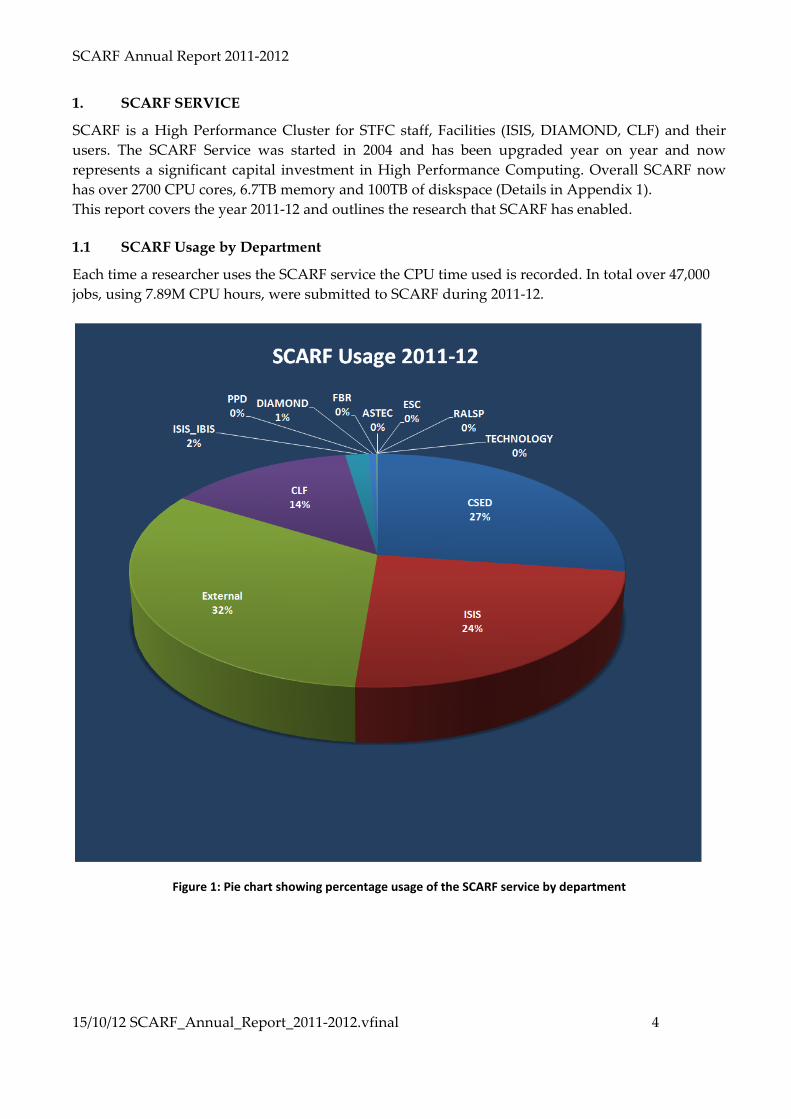
Each time a researcher uses the SCARF service the CPU time used is recorded. In total over 47,000 jobs, using 7.89M CPU hours, were submitted to SCARF during 2011-12.
Figure 1: Pie chart showing percentage usage of the SCARF service by department
SCARF Annual Report 2011-2012
15/10/12 SCARF_Annual_Report_2011-2012.vfinal 5
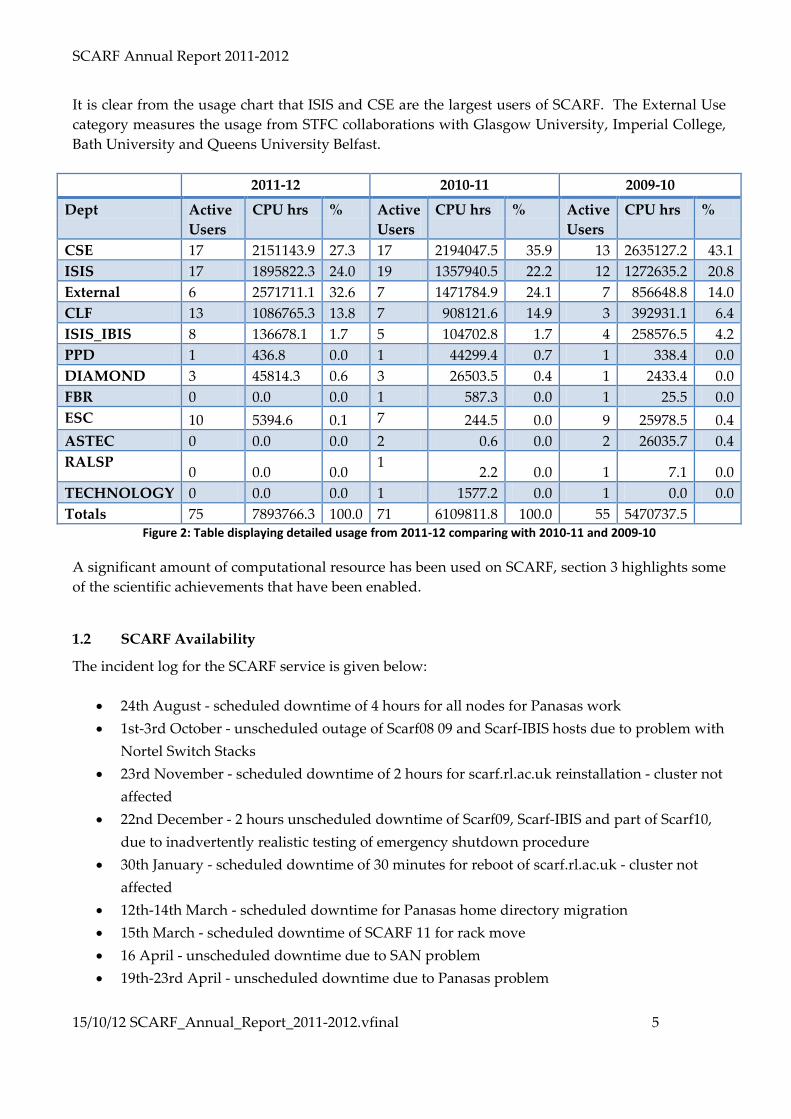
It is clear from the usage chart that ISIS and CSE are the largest users of SCARF. The External Use category measures the usage from STFC collaborations with Glasgow University, Imperial College, Bath University and Queens University Belfast.
2011-12 2010-11 2009-10
Dept Active Users
CPU hrs % Active Users
CPU hrs % Active Users
CPU hrs %
CSE 17 2151143.9 27.3 17 2194047.5 35.9 13 2635127.2 43.1 ISIS 17 1895822.3 24.0 19 1357940.5 22.2 12 1272635.2 20.8 External 6 2571711.1 32.6 7 1471784.9 24.1 7 856648.8 14.0 CLF 13 1086765.3 13.8 7 908121.6 14.9 3 392931.1 6.4 ISIS_IBIS 8 136678.1 1.7 5 104702.8 1.7 4 258576.5 4.2 PPD 1 436.8 0.0 1 44299.4 0.7 1 338.4 0.0 DIAMOND 3 45814.3 0.6 3 26503.5 0.4 1 2433.4 0.0 FBR 0 0.0 0.0 1 587.3 0.0 1 25.5 0.0 ESC 10 5394.6 0.1 7 244.5 0.0 9 25978.5 0.4 ASTEC 0 0.0 0.0 2 0.6 0.0 2 26035.7 0.4 RALSP
0 0.0 0.0 1
2.2 0.0 1 7.1 0.0 TECHNOLOGY 0 0.0 0.0 1 1577.2 0.0 1 0.0 0.0 Totals 75 7893766.3 100.0 71 6109811.8 100.0 55 5470737.5
Figure 2: Table displaying detailed usage from 2011-12 comparing with 2010-11 and 2009-10
A significant amount of computational resource has been used on SCARF, section 3 highlights some of the scientific achievements that have been enabled.
1.2 9BSCARF Availability
The incident log for the SCARF service is given below:
• 24th August - scheduled downtime of 4 hours for all nodes for Panasas work • 1st-3rd October - unscheduled outage of Scarf08 09 and Scarf-IBIS hosts due to problem with
Nortel Switch Stacks • 23rd November - scheduled downtime of 2 hours for scarf.rl.ac.uk reinstallation - cluster not
affected • 22nd December - 2 hours unscheduled downtime of Scarf09, Scarf-IBIS and part of Scarf10,
due to inadvertently realistic testing of emergency shutdown procedure • 30th January - scheduled downtime of 30 minutes for reboot of scarf.rl.ac.uk - cluster not
affected • 12th-14th March - scheduled downtime for Panasas home directory migration • 15th March - scheduled downtime of SCARF 11 for rack move • 16 April - unscheduled downtime due to SAN problem • 19th-23rd April - unscheduled downtime due to Panasas problem
SCARF Annual Report 2011-2012
15/10/12 SCARF_Annual_Report_2011-2012.vfinal 6
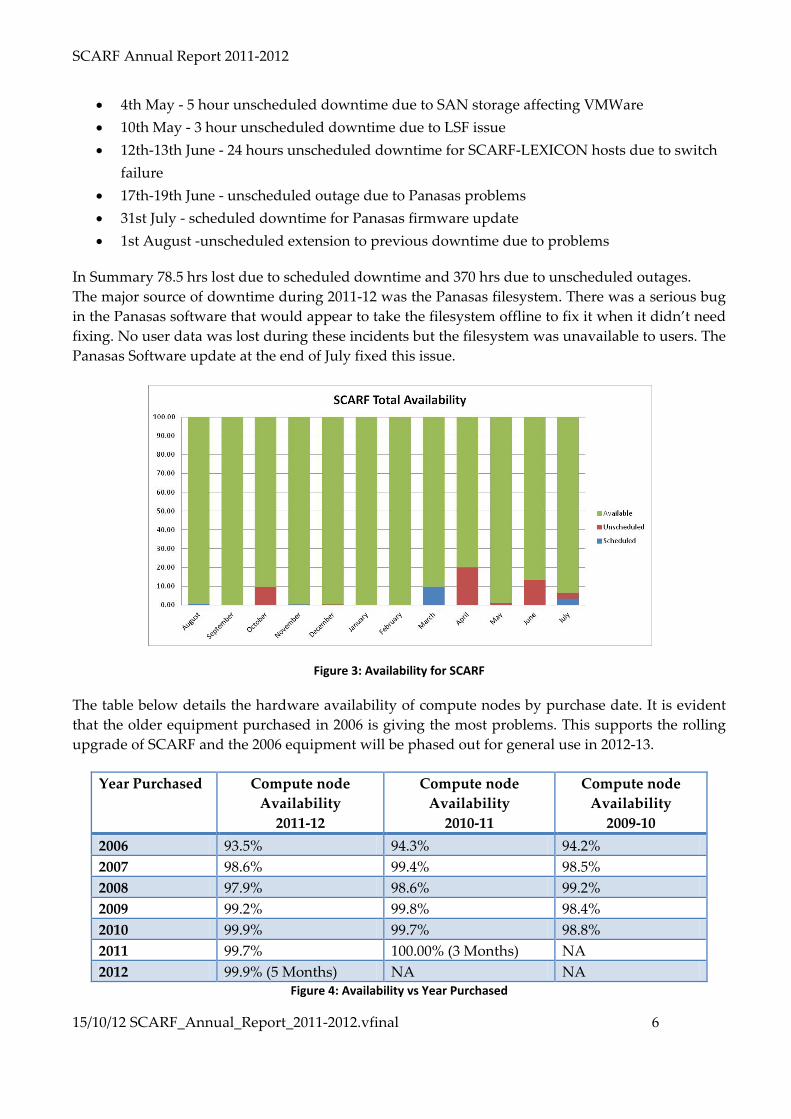
• 4th May - 5 hour unscheduled downtime due to SAN storage affecting VMWare • 10th May - 3 hour unscheduled downtime due to LSF issue • 12th-13th June - 24 hours unscheduled downtime for SCARF-LEXICON hosts due to switch
failure • 17th-19th June - unscheduled outage due to Panasas problems • 31st July - scheduled downtime for Panasas firmware update • 1st August -unscheduled extension to previous downtime due to problems
In Summary 78.5 hrs lost due to scheduled downtime and 370 hrs due to unscheduled outages. The major source of downtime during 2011-12 was the Panasas filesystem. There was a serious bug in the Panasas software that would appear to take the filesystem offline to fix it when it didn’t need fixing. No user data was lost during these incidents but the filesystem was unavailable to users. The Panasas Software update at the end of July fixed this issue.
Figure 3: Availability for SCARF
The table below details the hardware availability of compute nodes by purchase date. It is evident that the older equipment purchased in 2006 is giving the most problems. This supports the rolling upgrade of SCARF and the 2006 equipment will be phased out for general use in 2012-13.
Year Purchased Compute node Availability
2011-12
Compute node Availability
2010-11
Compute node Availability
2009-10 2006 93.5% 94.3% 94.2% 2007 98.6% 99.4% 98.5% 2008 97.9% 98.6% 99.2% 2009 99.2% 99.8% 98.4% 2010 99.9% 99.7% 98.8% 2011 99.7% 100.00% (3 Months) NA 2012 99.9% (5 Months) NA NA
Figure 4: Availability vs Year Purchased

SCARF Annual Report 2011-2012
15/10/12 SCARF_Annual_Report_2011-2012.vfinal 7
1.3 10BSCARF Developments 2011-12
• Major SCARF Developments are listed below. A more detailed list can be found in Appendix 5
o New capacity added 192 Intel X5675 CPU cores for general use went into production in March
2012 48 Intel X5675 CPU cores for general use purchased by ISIS (Stuart Ansell)
went into production in March 2012
1.4 11BFuture Development
• SCARF 2013 Hardware Upgrade o ~300 CPU Cores for General Use
1.5 12BHelp and Support
For any queries concerning the SCARF service please email the SCARF Helpdesk; [email protected] U

SCARF Annual Report 2011-2012
15/10/12 SCARF_Annual_Report_2011-2012.vfinal 8
2. 1BPUBLICATIONS AND PRESENTATIONS
2.1 13BPublications
A list of publications is given in Appendix 3. A way of estimating the impact that SCARF has had is to analyse the Journal Impact Factor using the Journal Citation Reports published by Thomson Reuters (2011). The average Impact Factor for Journals published as a result of using SCARF is 4.4. This compares to an average impact factor across all 8200 journals of 2.07. This is a simplistic analysis but demonstrates that the science done on SCARF is having a significant impact. 2.2 14BPresentations
Scientists have presented their work at 15 international conferences (Appendix X3 X). This helps to demonstrate that the science enabled by SCARF is world class. 2.3 15BCourses
ISIS ran their annual Neutron training course with 10 students, using the Material Studio gateway on SCARF for the Computational Methods section of the course and used 310 CPU hrs.
3. 2BSCIENCE HIGHLIGHTS
3.1 16BStewart F. Parker (ISIS)
3.1.1 41BInelastic neutron scattering spectroscopy (INS)
Energy is a priority area of RCUK and a strategic goal of STFC. We have used SCARF to analyse two systems that are relevant to this theme: a series of C5 molecules important in catalysis and the low-energy modes in platinum diimine complexes that are germane to solar energy conversion. The ISIS Facility at RAL is the world‐leading centre for neutron vibrational (INS) spectroscopy of materials. One of the advantages of INS is that it is straightforward to compare the results of ab initio calculations with the experimental data. This is a synergistic process: comparison of observed and calculated spectra is a exacting test of the calculation, while the calculation provides unambiguous assignments of the spectra. On SCARF, for the C5 work we have used predominantly Gaussian 03 and for the Pt complexes we have used periodic density functional theory using the CASTEP code. In both cases, the work was only feasible because of the availability of SCARF. Industrial alkene chemistry covers a wide range of chemical processes. C2 - C4 alkenes dominate, although higher alkenes (C5 to ca. C18) are also industrially significant, with straight chain alkenes being particularly desirable because of their link to biodegradability. The alkenes are produced by selective hydrogenation of a mixed stream that contains a range of chain lengths. As a model of this system, we have investigated the hydrogenation of unsaturated C5 molecules over a palladium catalyst. By monitoring the gas phase species by infrared spectroscopy, it is possible to obtain molecular and isomeric specification. However, key to this process is a reliable assignment of the spectra of the individual components and this was sketchy for the C5 systems of interest here. XFigure 5 X shows a scheme for the hydrogenation of the C5 species, the mixed feedstock of cis- and trans-1,3-pentadiene plus cyclopentene as an impurity approximates to a C5 raffinate from a refinery. We have used a combination of infrared, Raman and INS spectroscopy to obtain complete spectra of all the molecules highlighted in red in Figure 5. Ab initio calculations of the potential energy surface, geometry, and vibrational transition energies were performed and simulations of the vibrational

SCARF Annual Report 2011-2012
15/10/12 SCARF_Annual_Report_2011-2012.vfinal 9
spectra compared to the experimental data, which enabled us to make complete vibrational assignments for all of the species of interest.
Figure 5: Scheme of the C5 species present over a working Pd/Al2O3 hydrogenation catalyst utilizing a mixed cis- and trans-1,3-pentadiene feedstock that contains cyclopentene as an impurity. Gas-phase species are denoted by (g) and adsorbed species by (ad). Assignment of the vibrational spectra of the molecules highlighted in red were provided by Gaussian 03 calculations on SCARF. In solar energy conversion, the key transient is a charge-separated excited state which is formed as a result of photoinduced charge transfer following the initial absorption of photons. Pt(II) diimine complexes with ancillary anionic ligands are frequently used as the light-absorbing part of extensive molecular assemblies designed for photoinduced electron transfer in applications such as dye-sensitized solar cells and hydrogen production. An as yet unanswered question, in relation to charge-transfer excited states is their deactivation pathways. It is widely accepted that low frequency vibrational modes play an important role in the vibrational energy redistribution and energy dissipation in the excited state. In this context, metal-ligand framework vibrational modes – such as Pt–S, Pt–N or Pt–Cl vibrations - are of major importance in fundamental questions of structure and dynamics. The assignment of the ground state vibrational spectrum is an essential first step towards the assignment of the excited state spectra. A comprehensive assignment of the vibrational spectra of the ground state of the platinum 2,2’-bipyridine (bpy) thiolate (SPh) complex, Pt(bpy)(SPh)2 as a prototype structure for a diversity of Pt(II) diimine chromophores was carried out. To assist in the analysis, comprehensive assignments of the vibrational spectra of diphenyl

SCARF Annual Report 2011-2012
15/10/12 SCARF_Annual_Report_2011-2012.vfinal 10
disulfide, 2,2′-bipyridine and Pt(bpy)Cl2, the ‘building blocks’ of the complex were also performed. The modes of particular interest, Pt–S, Pt–N and Pt–Cl vibrations, all lie below ~500 cm-1 which is readily accessible with Raman and INS spectroscopies. The analysis was complicated by the lack of a crystal structure for Pt(bpy)(SPh)2, the structure of which had to be first determined by CASTEP, see XFigure 6 X left part. Subsequent comparison of the observed and calculated INS spectra, see XFigure 6 X right part, gave confidence in both the structure and the assignments.
Figure 6: Left: the CASTEP geometry optimised structure of 2,2’-bipyridyl (bis)thiolate platinum (II), Pt(bpy)(SPh)2
calculated on SCARF. Right: Comparison of the INS spectrum of the complex generated from the structure shown on the left (blue trace) with that measured on TOSCA at ISIS (red trace).
SCARF Annual Report 2011-2012
15/10/12 SCARF_Annual_Report_2011-2012.vfinal 11
3.2 17BJ. C. Crabtree, S. C. Parker (University of Bath), J. A. Purton (STFC, Daresbury)
3.2.1 42BGCMC simulations of CO2 adsorption in zeolites
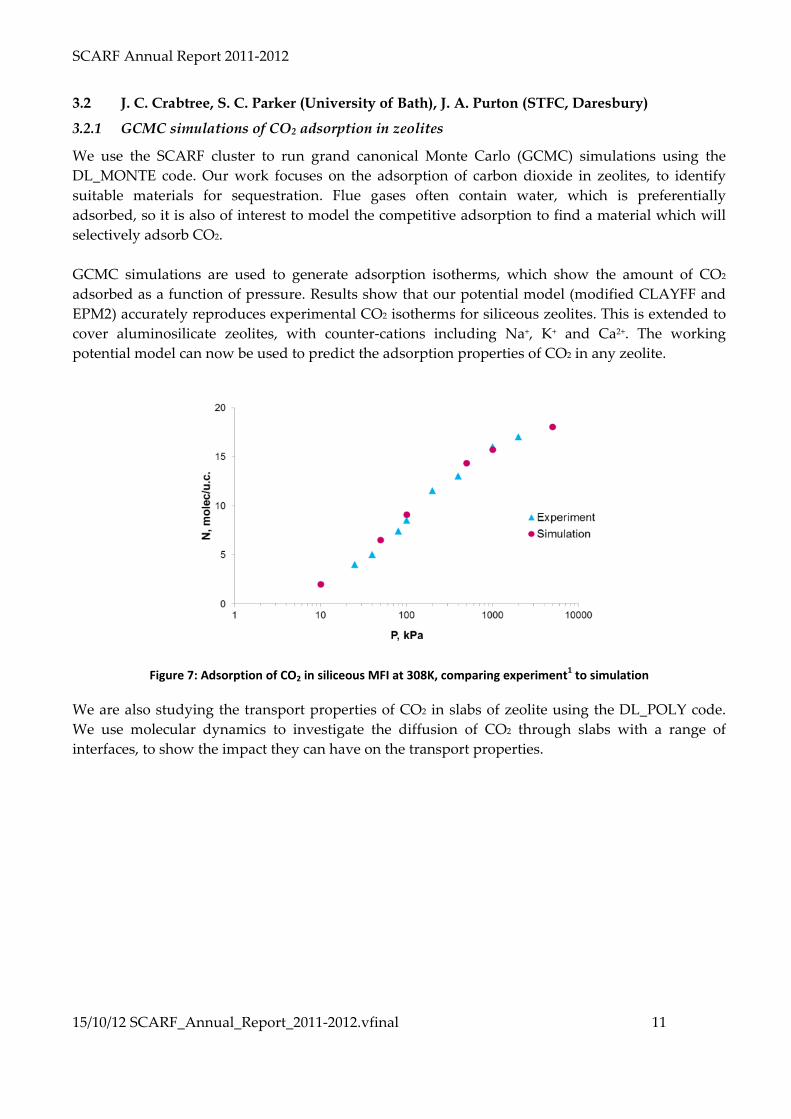
We use the SCARF cluster to run grand canonical Monte Carlo (GCMC) simulations using the DL_MONTE code. Our work focuses on the adsorption of carbon dioxide in zeolites, to identify suitable materials for sequestration. Flue gases often contain water, which is preferentially adsorbed, so it is also of interest to model the competitive adsorption to find a material which will selectively adsorb CO2. GCMC simulations are used to generate adsorption isotherms, which show the amount of CO2 adsorbed as a function of pressure. Results show that our potential model (modified CLAYFF and EPM2) accurately reproduces experimental CO2 isotherms for siliceous zeolites. This is extended to cover aluminosilicate zeolites, with counter-cations including Na+, K+ and Ca2+. The working potential model can now be used to predict the adsorption properties of CO2 in any zeolite.
Figure 7: Adsorption of CO2 in siliceous MFI at 308K, comparing experiment1 to simulation
We are also studying the transport properties of CO2 in slabs of zeolite using the DL_POLY code. We use molecular dynamics to investigate the diffusion of CO2 through slabs with a range of interfaces, to show the impact they can have on the transport properties.

SCARF Annual Report 2011-2012
15/10/12 SCARF_Annual_Report_2011-2012.vfinal 12
Figure 8: {011} siliceous FAU slab filled with CO2 (top). Diffusion density profile of CO2 in this slab (bottom), where red represents the favoured adsorption sites.
Preliminary work has been carried out on the adsorption of water in zeolites, comparing the adsorption isotherms for water potentials (SPC/FW and TIP3P/FS) to find which is most suitable for our purposes. Competitive adsorption of CO2 and water can then be modelled, to find candidates that adsorb CO2 preferentially over water. [1] A. Garcia-Sanchez et al., J. Phys. Chem. C, 113, 8814-8820, 2009

SCARF Annual Report 2011-2012
15/10/12 SCARF_Annual_Report_2011-2012.vfinal 13
3.3 18BAR Bell (Oxford, CLF)
3.3.1 43BMagnetic field amplification driven by energetic particle streaming.
Laboratory astrophysics is a growing subject, particularly in relation to experiments on high power lasers such as those available at the Central Laser Facility. In this past year an Oxford-led experiment (Gregori et al, Letter to Nature [1]) has reproduced the Biermann battery at a curved shock in a process thought to generate magnetic field in the early universe. In a recent theory paper [2] we show that resistively generated magnetic field, well known in laser-produced plasmas, may produce field in the voids between primordial galaxies. A further class of potential laser-plasma experiments builds upon the equivalence between energetic electron transport in the laboratory and cosmic ray acceleration at supernova shocks. Energetic electrons and cosmic rays are both described by the Vlasov-Fokker-Planck (VFP) equation [3]. This year we have used SCARF to solve the VFP equation for plasma instabilities driven by energetic particles. This is a computationally intensive procedure requiring novel numerical methods developed specifically to model time-dependent non-linear instability in six-dimensional configuration and momentum space. The simulation models the interaction of the energetic particles (modelled by the VFP equation) with a background plasma (modelled magnetohydrodynamically in 3D). XFigure 9 X shows the results of one simulation. A shock advances into the plasma from the right hand boundary. The particles gain energy at the shock and attempt to stream ahead of the shock. The streaming particles excite a plasma instability which generates magnetic field [4]. Spatial fluctuations in the magnetic field scatter the particles, inhibiting their streaming and confining them near the shock. The computer code solves the equations in a dimensionless form so the same model can be applied to both laboratory and astrophysical plasmas. In the astrophysical context the energetic particles are protons with energies of the order of 100TeV streaming ahead of supernova blast wave into the interstellar medium with a density of ~1 cm-3 and a magnetic field of a few microGauss. In the laboratory context, the energetic particles are electrons with energies of the order of 1MeV produced by laser-solid interactions and streaming into a plasma with a density of ~1018 cm-3 and a magnetic field of ~10kG. The relevant timescales are 100s of years in the astrophysical case and nanoseconds in the laboratory case. In this way, it should be possible with the aid of numerical simulation to validate a key aspect of high energy astrophysics in the laboratory. [1] Generation of scaled protogalactic seed magnetic fields in laser-produced shock wave. Gregori G; plus 26 authors, Nature 481, 480-483 (2012) [2] Resistive Magnetic field Generation at Cosmic Dawn. Miniati F; Bell AR, Astrophys J 729, 73 (2011) [3] Fast electron transport in laser-produced plasmas and the KALOS code for solution of the Vlasov-Fokker-Planck equation. Bell AR; Robinson APL; Sherlock M; et al., Plasma Phys Cont Fusion 48, R37-R57 (2006) [4] Turbulent amplification of magnetic field and diffusive shock acceleration of cosmic rays. Bell AR, Mon Not R Astr Soc 353, 550-558 (2004)

SCARF Annual Report 2011-2012
15/10/12 SCARF_Annual_Report_2011-2012.vfinal 14
Figure 9: Interaction of energetic particles with a magnetohydrodynamic (MHD) background plasma: (a) Background thermal pressure with a shock advancing from the right (b) energy density of energetic particles showing that some particles escape ahead of the shock and generate magnetic field that confines other particles at the shock (c) magnitude of the magnetic field excited by streaming energetic particles. The panels to the right display the same information in a different format. (d-f) show the structure of the magnetic field perpendicular to the direction of particle streaming.

SCARF Annual Report 2011-2012
15/10/12 SCARF_Annual_Report_2011-2012.vfinal 15
3.4 19BJames Holloway (UCL, STFC-CLF)
3.4.1 44BDiamond Simulations.
The Diamond simulation set aims to determine the viability of using the 3 GeV Diamond electron beam, at RAL, to drive plasma wakefield acceleration. If feasible, the Diamond beam could be used to generate a witness electron beam of 6 GeV and generate hard x-rays whilst experimentally demonstrating the self modulation instability for the first time. The Diamond simulation set is at a mature stage. Many configurations have been explored, and have led to the current set up of an ultra short high intensity laser pulse leading the Diamond beam into the plasma. The laser pulse drives an initial high amplitude wakefield which seeds the self modulation instability, enhancing its growth rate. Once modulated, the Diamond beam can drive a significant wakefield which can then be utilised. The bulk of the remaining simulations comprise of a parameter scan over laser intensity to optimize the seeding of the self modulation instability followed by a full length simulation of the optimized parameters. If feasible for the Diamond beam, plasma cells could be added to other existing synchrotron / linac facilities, potentially doubling the beam energy. The cells would only need of the order of a meter of beam line. The plasma cell and seed laser are relatively inexpensive considering the potential gains.
Figure 10: The Diamond beam before propagating through the plasma cell (top), after the plasma cell where microbunches are visible (middle) and the wakefield that has microbunched the beam (bottom).
SCARF Annual Report 2011-2012
15/10/12 SCARF_Annual_Report_2011-2012.vfinal 16
3.5 20BGabriella Graziano (University College of London), Jiří Klimeš (University College of London), Felix Fernandez-Alonso (ISIS), Angelos Michaelides (University College of London)
3.5.1 45BDensity functional theory study of the interaction of molecular hydrogen and soft layered materials
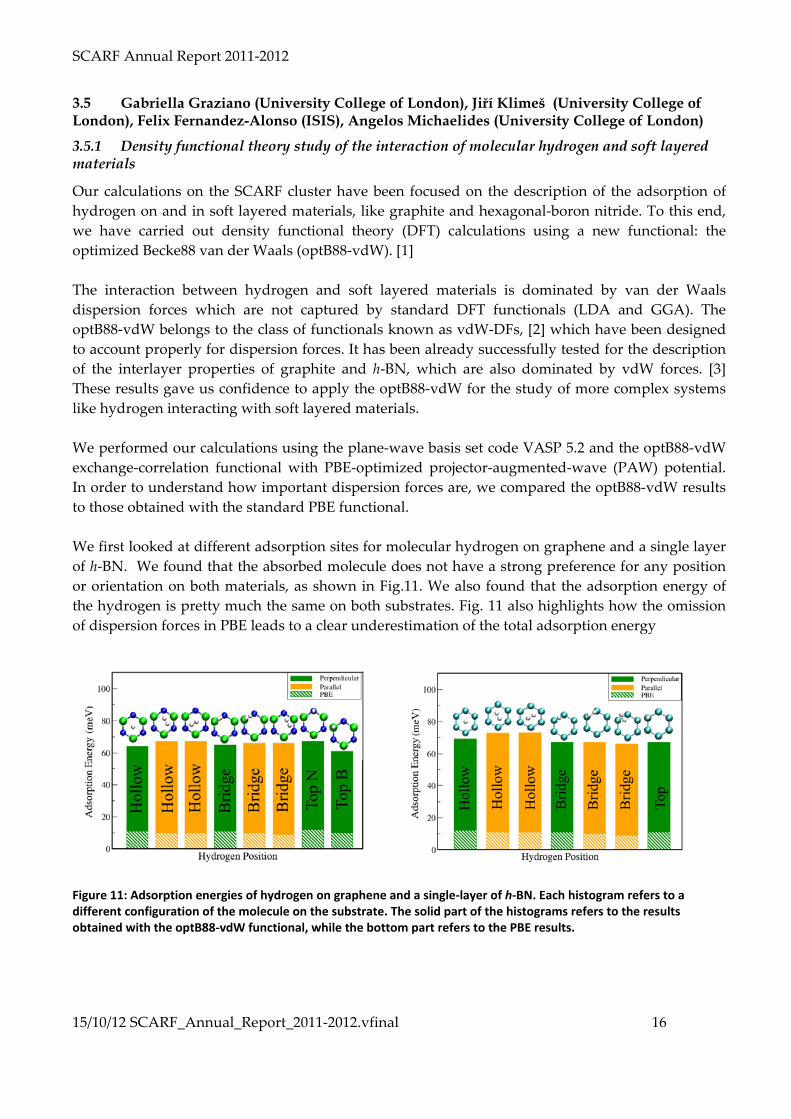
Our calculations on the SCARF cluster have been focused on the description of the adsorption of hydrogen on and in soft layered materials, like graphite and hexagonal-boron nitride. To this end, we have carried out density functional theory (DFT) calculations using a new functional: the optimized Becke88 van der Waals (optB88-vdW). [1] The interaction between hydrogen and soft layered materials is dominated by van der Waals dispersion forces which are not captured by standard DFT functionals (LDA and GGA). The optB88-vdW belongs to the class of functionals known as vdW-DFs, [2] which have been designed to account properly for dispersion forces. It has been already successfully tested for the description of the interlayer properties of graphite and h-BN, which are also dominated by vdW forces. [3] These results gave us confidence to apply the optB88-vdW for the study of more complex systems like hydrogen interacting with soft layered materials. We performed our calculations using the plane-wave basis set code VASP 5.2 and the optB88-vdW exchange-correlation functional with PBE-optimized projector-augmented-wave (PAW) potential. In order to understand how important dispersion forces are, we compared the optB88-vdW results to those obtained with the standard PBE functional. We first looked at different adsorption sites for molecular hydrogen on graphene and a single layer of h-BN. We found that the absorbed molecule does not have a strong preference for any position or orientation on both materials, as shown in Fig.11. We also found that the adsorption energy of the hydrogen is pretty much the same on both substrates. Fig. 11 also highlights how the omission of dispersion forces in PBE leads to a clear underestimation of the total adsorption energy
Figure 11: Adsorption energies of hydrogen on graphene and a single-layer of h-BN. Each histogram refers to a different configuration of the molecule on the substrate. The solid part of the histograms refers to the results obtained with the optB88-vdW functional, while the bottom part refers to the PBE results.

SCARF Annual Report 2011-2012
15/10/12 SCARF_Annual_Report_2011-2012.vfinal 17
We then studied the absorption of hydrogen in bulk graphite and h-BN, to try to infer the optimal interlayer spacing for both materials in order to host the gas molecule. The results reported in XFigure 12 X show how both materials need to expand their interlayer distance from ~3.3 Å to ~5.5 Å, and that the interlayer binding energy is substantially screened by the presence of the hydrogen molecule.
Figure 12: The solid lines refer to the interlayer binding curves of graphite and h-BN. The dashed curves refer to the interlayer binding of the two materials when an hydrogen molecule is absorbed between the layers. The dashed curves clearly highlight the expansion of the interlayer spacing of the two materials due to the absorption of the gas molecule and a subsequent decrease of the binding energy.
The expansion of the interlayer spacing in graphite and h-BN has an energetic cost, which makes the whole absorption process endothermic (~1 eV/H2 mol). In Fig. 13 we show how these energetic costs are substantially reduced if a pre-expanded material is used, leading to an adsorption energy per hydrogen molecule of ~150 meV/H2 mol.

SCARF Annual Report 2011-2012
15/10/12 SCARF_Annual_Report_2011-2012.vfinal 18
Figure 13: The dashed curves represent the absorption energy per hydrogen molecule as a function of interlayer spacing in graphite and h-BN, where the interlayer distance is ~3.33 Å. The solid lines refer to the absorption energy per hydrogen molecule in the pre-expanded materials.
These results provide important insights into the search of a suitable intercalant that minimises the energetic costs associated with the absorption of hydrogen. These intercalants can act as molecular pillars as well as increase the interaction between hydrogen and the substrate. To this end, we are currently exploring the intercalation of metals into these layered materials using this new functional. [1] J. Klimeš, D. R. Bowler, and A. Michaelides, J. Phys.: Condens. Matter 22, 022201 (2010). [2] M. Dion, H. Rydberg, E. Schroder, D. C. Langreth , and B. I. Lundqvist, Phys. Rev. Lett. 92, 246401 (2004). [3] G. Graziano, J. Klimeš, F. Fernandez-Alonso, and A. Michelides, J. Phys.: Condens. Matter, Accepted.
SCARF Annual Report 2011-2012
15/10/12 SCARF_Annual_Report_2011-2012.vfinal 19
3.6 21BRob Williamson (ISIS)
3.6.1 46BLongitudinal Beam Dynamics Simulations of ISIS and its Upgrades
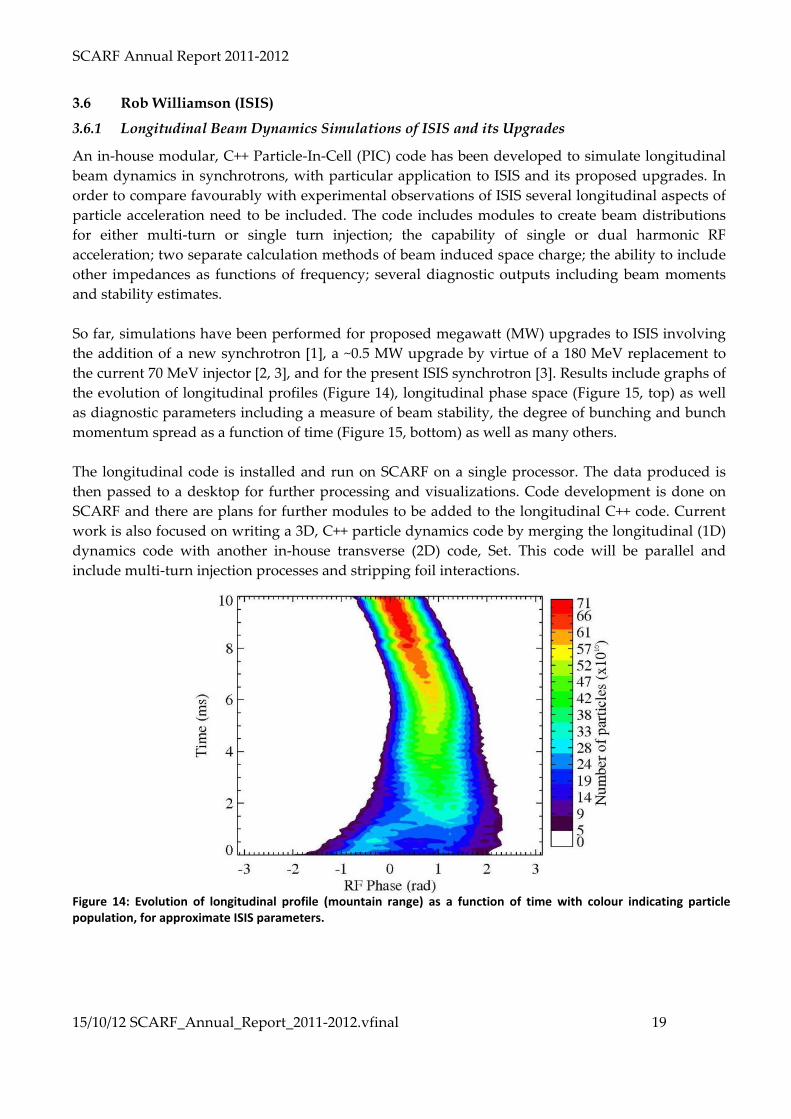
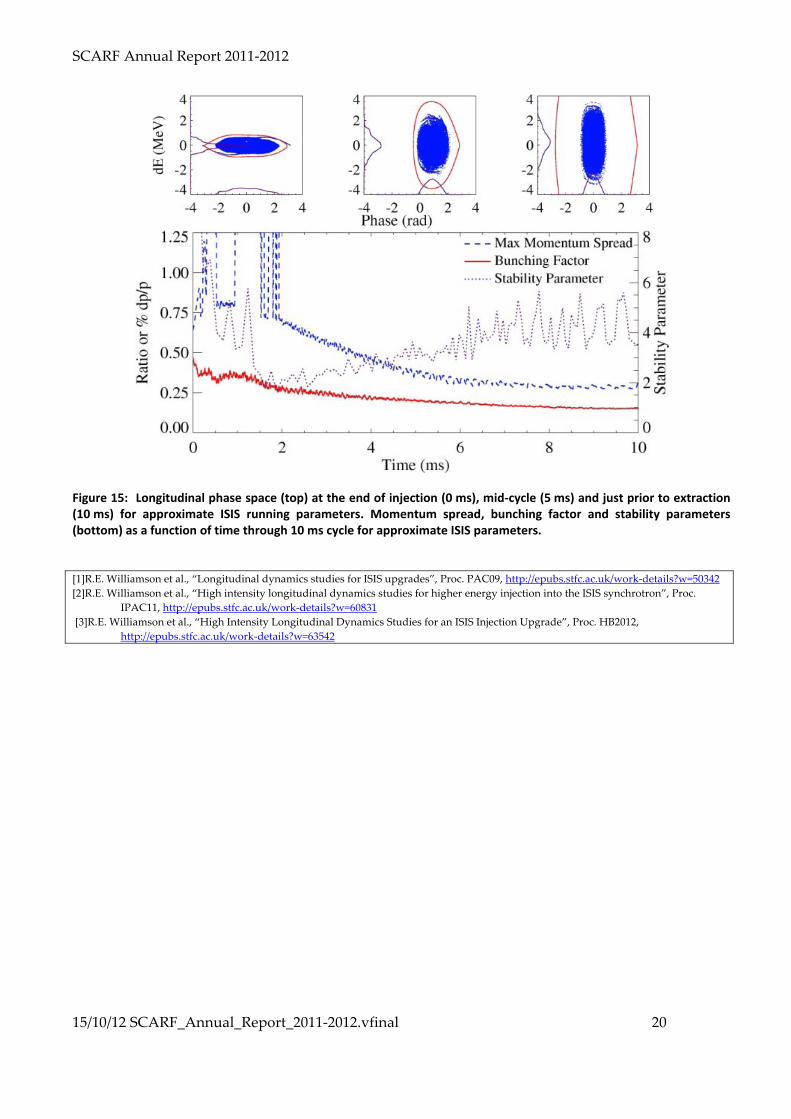
An in-house modular, C++ Particle-In-Cell (PIC) code has been developed to simulate longitudinal beam dynamics in synchrotrons, with particular application to ISIS and its proposed upgrades. In order to compare favourably with experimental observations of ISIS several longitudinal aspects of particle acceleration need to be included. The code includes modules to create beam distributions for either multi-turn or single turn injection; the capability of single or dual harmonic RF acceleration; two separate calculation methods of beam induced space charge; the ability to include other impedances as functions of frequency; several diagnostic outputs including beam moments and stability estimates. So far, simulations have been performed for proposed megawatt (MW) upgrades to ISIS involving the addition of a new synchrotron [1], a ~0.5 MW upgrade by virtue of a 180 MeV replacement to the current 70 MeV injector [2, 3], and for the present ISIS synchrotron [3]. Results include graphs of the evolution of longitudinal profiles (Figure 14), longitudinal phase space (Figure 15, top) as well as diagnostic parameters including a measure of beam stability, the degree of bunching and bunch momentum spread as a function of time (Figure 15, bottom) as well as many others. The longitudinal code is installed and run on SCARF on a single processor. The data produced is then passed to a desktop for further processing and visualizations. Code development is done on SCARF and there are plans for further modules to be added to the longitudinal C++ code. Current work is also focused on writing a 3D, C++ particle dynamics code by merging the longitudinal (1D) dynamics code with another in-house transverse (2D) code, Set. This code will be parallel and include multi-turn injection processes and stripping foil interactions.
Figure 14: Evolution of longitudinal profile (mountain range) as a function of time with colour indicating particle population, for approximate ISIS parameters.
SCARF Annual Report 2011-2012
15/10/12 SCARF_Annual_Report_2011-2012.vfinal 20
Figure 15: Longitudinal phase space (top) at the end of injection (0 ms), mid-cycle (5 ms) and just prior to extraction (10 ms) for approximate ISIS running parameters. Momentum spread, bunching factor and stability parameters (bottom) as a function of time through 10 ms cycle for approximate ISIS parameters. [1]R.E. Williamson et al., “Longitudinal dynamics studies for ISIS upgrades”, Proc. PAC09, HUhttp://epubs.stfc.ac.uk/work-details?w=50342 U [2]R.E. Williamson et al., “High intensity longitudinal dynamics studies for higher energy injection into the ISIS synchrotron”, Proc.
IPAC11, HUhttp://epubs.stfc.ac.uk/work-details?w=60831U [3]R.E. Williamson et al., “High Intensity Longitudinal Dynamics Studies for an ISIS Injection Upgrade”, Proc. HB2012,
HUhttp://epubs.stfc.ac.uk/work-details?w=63542UH

SCARF Annual Report 2011-2012
15/10/12 SCARF_Annual_Report_2011-2012.vfinal 21
3.7 22BSanghamitra. Mukhopadhyay (ISIS)
3.7.1 47BUnderstanding Atomic Scale properties of Functional Materials using Density Functional Theory
In the last one year I have used Scarf computer for following three projects:
Effect of Background Carriers on Magnetic Interactions in Mn doped Dilute Magnetic Silicon : Dilute magnetic semiconductors (DMS) have the potential for spintronic applications because possibility of manipulations of spins in these materials. The mature state of silicon technology offers high incentives for making silicon based DMS. Using hybrid exchange density functional calculations we show that the type of background carriers has significant effects on magnetic interactions in Mn doped dilute magnetic Si. We have used Gaussian based linear combination of atomic orbitals (LCAO) as our basis set and B3LYP hybrid exchange functionals, as implemented in the CRYSTAL code. In our calculations the p- and n-type Si were simulated by introducing an extra hole and an extra electron, respectively, in the 64 atoms Si supercell. The extra charge was compensated by a homogeneous background potential. Our calculations predict that with 1.6% Mn doping and of p-type Si the ground state is ferromagnetic, whereas other conditions remaining the same, the ground state becomes antiferromagnetic for the n-type Si. The exchange energies in Mn-doped extrinsic Si are higher by about 1 eV/Mn atom compared to the Mn doped intrinsic Si. Calculated electronic structures reveal that in p-type Si:Mn the hole localises over Mn and the short range magnetic coupling increases. On the other hand, in the n-type host electron-electron repulsion increases within Mn-Si impurity band and the short range coupling decreases destroying the long range spin polarisation. These calculations explain the observed ferromagnetism in the p-type Si:Mn at higher temperatures than in the n-type Si:Mn and the magnetic moments of the systems compare well with experiments [1].
Figure 16: Spin densities on the 110 plane of the (a) intrinsic Si (b ) p-type Si, (c) n-type Si host for the range of -0.02μB /bohr3 to 0.02μB/bohr3 with a step of 2x10⁻⁴ μB /bohr3. The blue lines are for majority spin states and red lines are for minority spin states. The highest magnitude of spins for each type of spin is at the centre of contours. (d) The long range spin polarisation of the p-type Si:Mn. The range of this plot is -0.02 μB/bohr3 to +0.0002 μB/bohr3. The range has been modified from the former to include atoms having very small spins over them.
(a) (b)
(c) (d)

SCARF Annual Report 2011-2012
15/10/12 SCARF_Annual_Report_2011-2012.vfinal 22
Electronic Structures and Thermodynamic Properties of LaCoO3, a Material for Solid Oxide Fuel Cell : LaCoO3 is a technologically important material in part because of its use as a cathode in a high temperature solid oxide fuel cells (SOFC). It exhibits complex and temperature-dependent electronic and magnetic properties. Below about 100K it has been reported as a nonmagnetic semiconductor, around 100-500K as a paramagnetic semiconductor and above 500K as a paramagnetic metal. We have used hybrid exchange density functional theory as implemented in CRYSTAL code to model the electronic structure of LaCoO3. Based on a rhombohedral unit cell of R-3c symmetry containing two Co atoms we find a mixed spin phase, comprising alternating low and high spin Co+3 ions, with a total energy at 0K just 57meV per formula unit above that of a non-magnetic semiconducting ground state. In the mixed spin phase the high-spin Co+3 ion have spin moments of 3.1μB and the state is insulating with a band gap of 2.2eV. Our calculations suggest that the effective on-site Coulomb repulsion energy, Ueff, on Co+3 ions are spin dependent. An estimate of the harmonic phonon free energy suggests that this mixed spin phase would become the more stable phase as the temperature increases, which is consistent with experimental evidence. An alternative intermediate spin state is higher in energy at all temperatures [2].
Figure 17: Rhombohedral structure of LaCoO3
Vibrational Properties of Organic Ferroelectric Croconic Acid : Croconic Acid (C5O5H2) is the first organic molecule which shows room temperature ferroelectricity in its crystalline form. The structure and vibrational properties of this crystal are important to understand its ferroelectric properties. In this investigation, we employed state-of-the-art calculations based on plane wave pseudo potential density functional theory (DFT) to predict the structure, vibrational and polarizability properties of Croconic acid and compared with in-house experiments. We investigated structures of Croconic Acid in both centro symmetric, space group Pcam, and non-centrosymmetric, space group Pca21, form using CASTEP code and dispersion corrected Perdew-Burke-Ernerhof generalised gradient approximation (PBE-GGA + D) in DFT. The experimentally obtained structures were relaxed using BFGS method and the centrosymmetric structure was found to be unstable with respect to the non-centro symmetric structure. The calculated bond lengths were in agreement with neutron diffraction results obtained from ISIS-IRIS instrument within 3%.

SCARF Annual Report 2011-2012
15/10/12 SCARF_Annual_Report_2011-2012.vfinal 23
The calculated vibrational spectrum compared well with inelastic neutron scattering (INS), infrared (IR) and Raman spectroscopic results. The polarizability of the crystal was identified by the large anisotropy of the Born effective charge tensors associated with the hydrogen ions, which also had directional properties. We predicted that these hydrogen ions had dominant role in the ferroelectric properties of the crystal [3].
Figure 18: Density functional simulation of IR spectrum of Croconic acid compared with experiment.
[1] S. Mukhopadhyay and N. M. Harrison, “Influence of background carriers on magnetic properties of Mn-doped dilute magnetic Si”, J. Mag. Mag. Mat, 324, 3748 (2012). [2] S. Mukhopadhyay, M. W. Finnis and N. M. Harrison, “Electronic Structures and Phonon Free Energies of LaCoO3 using Hybrid Exchange Density Functional Theory”, to be published in Phys. Rev. B (2012). [3] US. Mukhopadhyay U, M. Gutmann, D. Jochym, K. Refson and F. Fernandez-Alonso, “Crystalline Structure and Vibrational Properties of Organic Ferroelectric Croconic Acid : an Investigation using Density Functional Theory”, presented in the Joint CMD-24, ECOSS-29, ECSCD-11and CMMP-12 Conference held at Edinburgh, 3-7 September (2012).
SCARF Annual Report 2011-2012
15/10/12 SCARF_Annual_Report_2011-2012.vfinal 24
3.8 23BAJ Ramirez-Cuesta (ISIS)
3.8.1 48BStudying dynamics using Inelastic Neutron Scattering and Computer Modelling: Neutron Scattering and the Environment
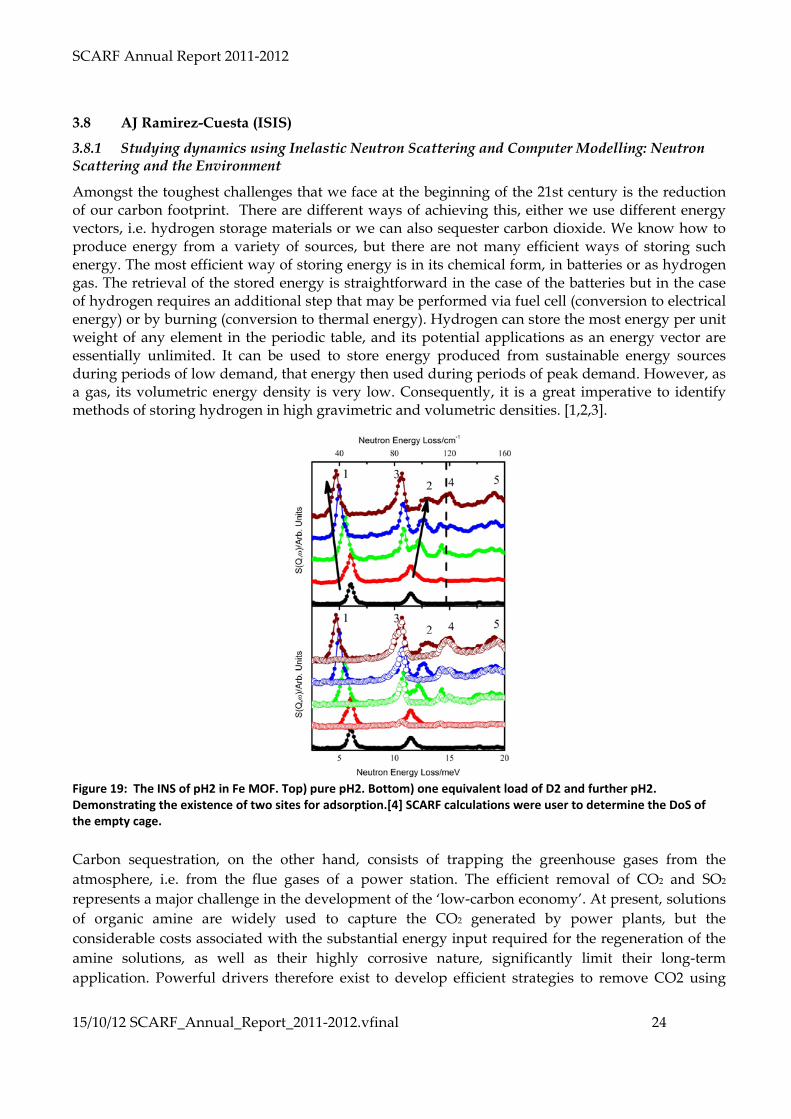
Amongst the toughest challenges that we face at the beginning of the 21st century is the reduction of our carbon footprint. There are different ways of achieving this, either we use different energy vectors, i.e. hydrogen storage materials or we can also sequester carbon dioxide. We know how to produce energy from a variety of sources, but there are not many efficient ways of storing such energy. The most efficient way of storing energy is in its chemical form, in batteries or as hydrogen gas. The retrieval of the stored energy is straightforward in the case of the batteries but in the case of hydrogen requires an additional step that may be performed via fuel cell (conversion to electrical energy) or by burning (conversion to thermal energy). Hydrogen can store the most energy per unit weight of any element in the periodic table, and its potential applications as an energy vector are essentially unlimited. It can be used to store energy produced from sustainable energy sources during periods of low demand, that energy then used during periods of peak demand. However, as a gas, its volumetric energy density is very low. Consequently, it is a great imperative to identify methods of storing hydrogen in high gravimetric and volumetric densities. [1,2,3].
Figure 19: The INS of pH2 in Fe MOF. Top) pure pH2. Bottom) one equivalent load of D2 and further pH2. Demonstrating the existence of two sites for adsorption.[4] SCARF calculations were user to determine the DoS of the empty cage.
Carbon sequestration, on the other hand, consists of trapping the greenhouse gases from the atmosphere, i.e. from the flue gases of a power station. The efficient removal of CO2 and SO2 represents a major challenge in the development of the ‘low-carbon economy’. At present, solutions of organic amine are widely used to capture the CO2 generated by power plants, but the considerable costs associated with the substantial energy input required for the regeneration of the amine solutions, as well as their highly corrosive nature, significantly limit their long-term application. Powerful drivers therefore exist to develop efficient strategies to remove CO2 using

SCARF Annual Report 2011-2012
15/10/12 SCARF_Annual_Report_2011-2012.vfinal 25
alternative materials that simultaneously demonstrate high adsorption capacity, high selectivity and high rates of regeneration at an economically viable cost.
Porous metal–organic framework (MOF) complexes are a sub-class of coordination polymers that show great promise for gas storage and separation because of their high surface area and tunable functional pore environment. Within the field of gas capture, there is particular emphasis on optimizing the interactions between the MOF hosts and the adsorbed gas molecules, leading to the discovery of new functional materials with better capture properties. Accordingly, the identification of preferred adsorption sites within a pore structure and the direct visualization of binding interactions represent important methodologies for understanding the mechanisms for the selective capture of CO2 and SO2. We have used TOSCA to study by INS and DFT modelling the interactions of NOTT 300 and CO2 and SO2. We determined the criteria of stability by the comparison between modelling and experiment. [5]
Figure 20: Determination of the absorption site of CO2 in NOTT 300 using INS and DFT (SCARF calculations)
The vibrational properties of solids and molecules are studied by spectroscopic methods. The stability of phases is determined by the thermodynamical functions, in particular the Gibbs free energy. We have improved and developed the methodology to do that as well. [6] [1] Ramirez-Cuesta A, Jones M, David W. Neutron scattering and hydrogen storage. MATERIALS TODAY. 2009;12(11):54-61. [2] Albinati, A., Colognesi, D., Georgiev, P. A., Jensen, C. M. and Ramirez-Cuesta, A. J. On the effect of thermal treatment and hydrogen vibrational dynamics in sodium alanates: An inelastic neutron scattering study. Journal of Alloys and Compounds 523, 108–113 (2012). [3] Yang, S. H.; Callear, S. K.; Ramirez-Cuesta, A. J.; David, W. I. F.; Sun, J. L.; Blake, A. J.; Champness, N. R.; Schroder, M., Pore with gate: modulating hydrogen storage in metal-organic framework materials via cation exchange. Faraday Discussions 2011, 151, 19-36. [4] Queen, WL, Bloch ED, Brown CM, Hudson MR, Mason JA, Murray LJ, Ramirez-Cuesta AJ, Peterson VK, and Long JR. Hydrogen adsorption in the metal-organic frameworks Fe-2(dobdc) and Fe-2(O-2)(dobdc). Dalton Transactions 41, 4180–4187 (2012). [5] Yang S., Sun J., Ramirez-Cuesta A.J., Callear S.K., David W.I.F, Anderson D., Newby A., Blake A.J., Parker J.E., Tang C.E. and Schröder M. "Direct Visualisation of Carbon Dioxide and Sulphur Dioxide in a Decorated Porous Host" Nature Chemistry, DOI: 10.1038/NCHEM.1457 [6] Borgschulte, A.; Gremaud, R.; Zuttel, A.; Martelli, P.; Remhof, A.; Ramirez-Cuesta, A.; Refson, K.; Bardaji, E.; Lohstroh, W.; Fichtner, M.; Hagemann, H.; Ernst, M., Experimental evidence of librational vibrations determining the stability of calcium borohydride. Physical Review B 2011, 83 (2)

SCARF Annual Report 2011-2012
15/10/12 SCARF_Annual_Report_2011-2012.vfinal 26
3.9 24BDean Adams (ISIS)
3.9.1 49BHigh Intensity Beam Studies on the ISIS Synchrotron using ORBIT.
The ISIS Synchrotron forms part of the accelerator chain for the spallation neutron source. High intensity beam operation is limited by uncontrolled beam losses which activate machine components limiting hands on maintenance. Beam loss in the synchrotron is dominated by the adiabatic RF trapping process and high intensity space charge effects. Studies are underway using the particle tracking code ORBIT to understand these mechanisms to allow lower beam loss operation. Understanding high intensity mechanisms are also important in the design of ISIS upgrades and future machines.
Synchrotron beam dynamics have be modelled in the particle tracking code ORBIT on the SCARF cluster. The model tracks 2x10⁶ macro particles over the first 3ms (3500 turns) of the synchrotron cycle covering the period of beam loss. The model includes injection painting dynamics, injection foil physics, RF acceleration, RF errors, collector systems, vacuum vessel apertures and 2.5D space charge. The model is fitted to longitudinal measured profiles through the acceleration cycle. Measured and simulated beam losses versus time are show in XFigure 21X below. The synchrotron operates with loss levels ~3 % over the first 3 ms of the cycle, simulation predicts ~ 6 %. Whilst simulation results are high they have good temporal agreement. Beam phase space distributions at 0 ms are shown in XFigure 22 X. Measured longitudinal profiles shown in the bottom right plot in orange show good agreement to simulation. Tomographic longitudinal phase space reconstructions from measured profiles are shown in XFigure 23 X and are in good agreement with simulation
Figure 21: Measured and simulation synchrotron beam loss.

SCARF Annual Report 2011-2012
15/10/12 SCARF_Annual_Report_2011-2012.vfinal 27
Figure 22: Simulated distributions at 0 ms.
Figure 23: Simulated longitudinal phase space and measured profile at 0ms (left). Tomographic phase space reconstruction (right).
SCARF Annual Report 2011-2012
15/10/12 SCARF_Annual_Report_2011-2012.vfinal 28
3.10 25BDavid S.D. Gunn, Ilian T. Todorov, John A. Purton (CSED)
3.10.1 50BDefect Formation and Oxygen Vacancy Migration in Gd2Ti2O7 and Gd2Zr2O7 Pyrochlores
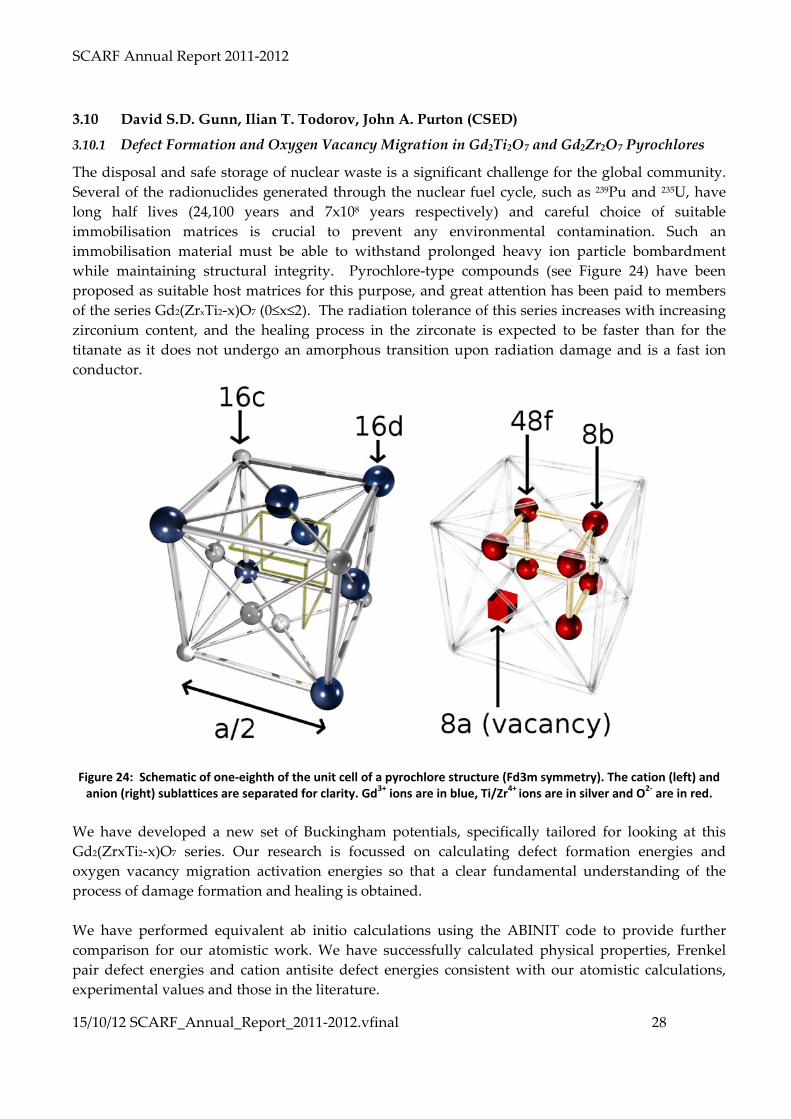
The disposal and safe storage of nuclear waste is a significant challenge for the global community. Several of the radionuclides generated through the nuclear fuel cycle, such as 239Pu and 235U, have long half lives (24,100 years and 7x10⁸ years respectively) and careful choice of suitable immobilisation matrices is crucial to prevent any environmental contamination. Such an immobilisation material must be able to withstand prolonged heavy ion particle bombardment while maintaining structural integrity. Pyrochlore-type compounds (see XFigure 24 X) have been proposed as suitable host matrices for this purpose, and great attention has been paid to members of the series Gd2(ZrxTi2-x)O7 (0≤x≤2). The radiation tolerance of this series increases with increasing zirconium content, and the healing process in the zirconate is expected to be faster than for the titanate as it does not undergo an amorphous transition upon radiation damage and is a fast ion conductor.
Figure 24: Schematic of one-eighth of the unit cell of a pyrochlore structure (Fd3m symmetry). The cation (left) and
anion (right) sublattices are separated for clarity. Gd3+ ions are in blue, Ti/Zr4+ ions are in silver and O2- are in red. We have developed a new set of Buckingham potentials, specifically tailored for looking at this Gd2(ZrxTi2-x)O7 series. Our research is focussed on calculating defect formation energies and oxygen vacancy migration activation energies so that a clear fundamental understanding of the process of damage formation and healing is obtained. We have performed equivalent ab initio calculations using the ABINIT code to provide further comparison for our atomistic work. We have successfully calculated physical properties, Frenkel pair defect energies and cation antisite defect energies consistent with our atomistic calculations, experimental values and those in the literature.
SCARF Annual Report 2011-2012
15/10/12 SCARF_Annual_Report_2011-2012.vfinal 29
3.11 26BC. W. Yong (CSED) and R. Strange (Molecular Biophysics Group, Faculty of Health and Life Sciences, University o f Liverpool)
3.11.1 51BComputational Studies of motor neuron disease mutants of Cu,Zn superoxide dismutase (SOD1) - insight into mechanisms of toxicity.
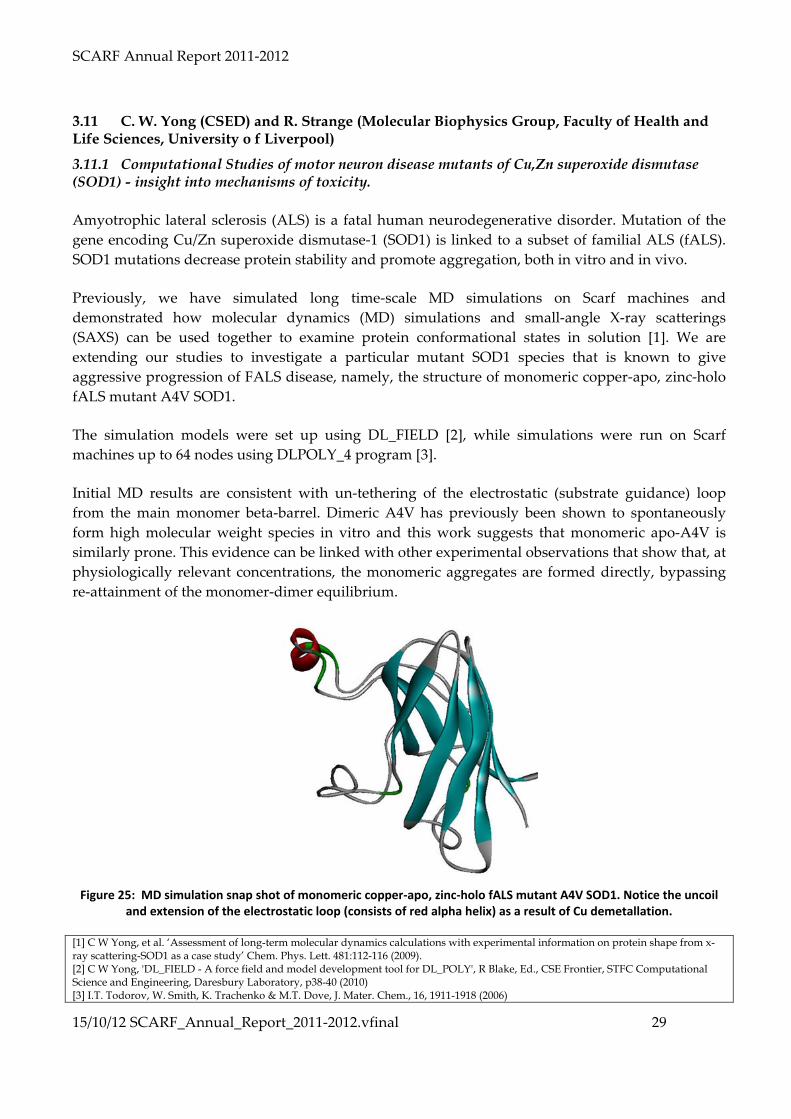
Amyotrophic lateral sclerosis (ALS) is a fatal human neurodegenerative disorder. Mutation of the gene encoding Cu/Zn superoxide dismutase-1 (SOD1) is linked to a subset of familial ALS (fALS). SOD1 mutations decrease protein stability and promote aggregation, both in vitro and in vivo.
Previously, we have simulated long time-scale MD simulations on Scarf machines and demonstrated how molecular dynamics (MD) simulations and small-angle X-ray scatterings (SAXS) can be used together to examine protein conformational states in solution [1]. We are extending our studies to investigate a particular mutant SOD1 species that is known to give aggressive progression of FALS disease, namely, the structure of monomeric copper-apo, zinc-holo fALS mutant A4V SOD1.
The simulation models were set up using DL_FIELD [2], while simulations were run on Scarf machines up to 64 nodes using DLPOLY_4 program [3].
Initial MD results are consistent with un-tethering of the electrostatic (substrate guidance) loop from the main monomer beta-barrel. Dimeric A4V has previously been shown to spontaneously form high molecular weight species in vitro and this work suggests that monomeric apo-A4V is similarly prone. This evidence can be linked with other experimental observations that show that, at physiologically relevant concentrations, the monomeric aggregates are formed directly, bypassing re-attainment of the monomer-dimer equilibrium.
Figure 25: MD simulation snap shot of monomeric copper-apo, zinc-holo fALS mutant A4V SOD1. Notice the uncoil
and extension of the electrostatic loop (consists of red alpha helix) as a result of Cu demetallation.
[1] C W Yong, et al. ‘Assessment of long-term molecular dynamics calculations with experimental information on protein shape from x-ray scattering-SOD1 as a case study’ Chem. Phys. Lett. 481:112-116 (2009). [2] C W Yong, 'DL_FIELD - A force field and model development tool for DL_POLY', R Blake, Ed., CSE Frontier, STFC Computational Science and Engineering, Daresbury Laboratory, p38-40 (2010) [3] I.T. Todorov, W. Smith, K. Trachenko & M.T. Dove, J. Mater. Chem., 16, 1911-1918 (2006)
SCARF Annual Report 2011-2012
15/10/12 SCARF_Annual_Report_2011-2012.vfinal 30
3.12 27BA.P.L.Robinson, Plasma Physics Group, (CLF)
3.12.1 52BUltra-intense lasers
Ultra-intense lasers have a number of potential applications with transformative capability. Two that are particularly interesting are the possibility of generating high energy ion beams (perhaps even for medical applications) and generating intense relativistic electrons beams in dense plasmas that can ignite compressed DT fuel for inertial fusion energy production.
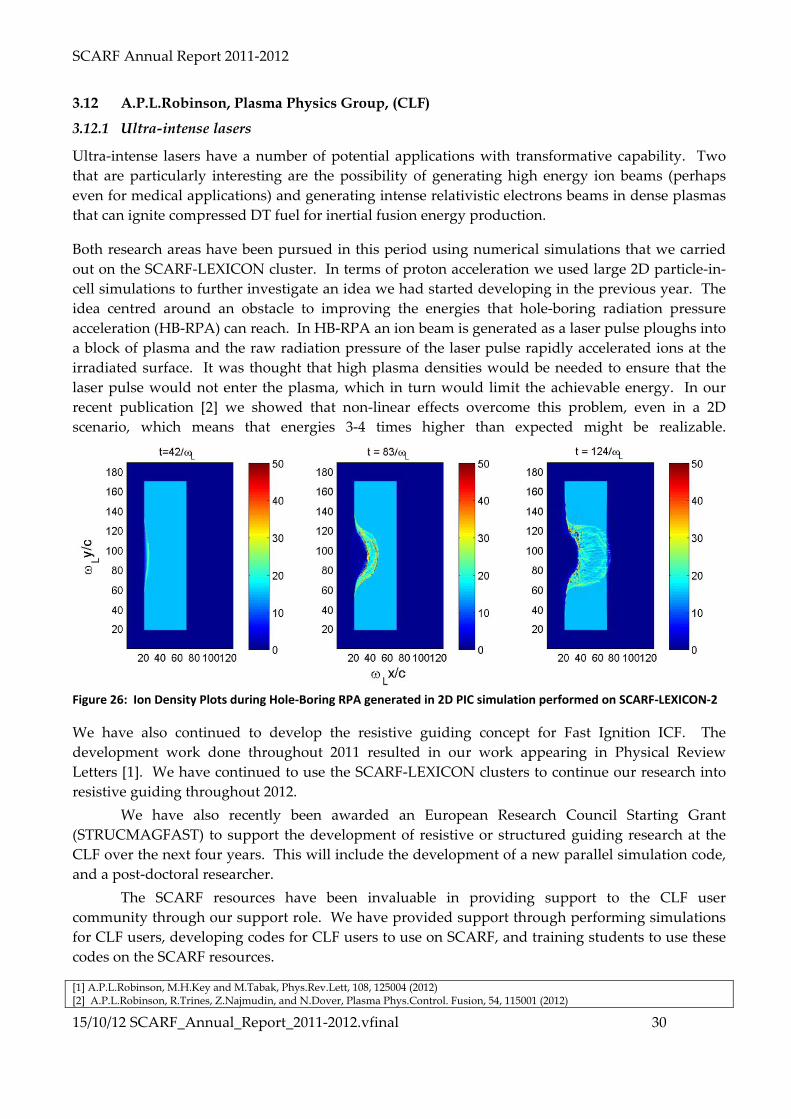
Both research areas have been pursued in this period using numerical simulations that we carried out on the SCARF-LEXICON cluster. In terms of proton acceleration we used large 2D particle-in-cell simulations to further investigate an idea we had started developing in the previous year. The idea centred around an obstacle to improving the energies that hole-boring radiation pressure acceleration (HB-RPA) can reach. In HB-RPA an ion beam is generated as a laser pulse ploughs into a block of plasma and the raw radiation pressure of the laser pulse rapidly accelerated ions at the irradiated surface. It was thought that high plasma densities would be needed to ensure that the laser pulse would not enter the plasma, which in turn would limit the achievable energy. In our recent publication [2] we showed that non-linear effects overcome this problem, even in a 2D scenario, which means that energies 3-4 times higher than expected might be realizable.
Figure 26: Ion Density Plots during Hole-Boring RPA generated in 2D PIC simulation performed on SCARF-LEXICON-2
We have also continued to develop the resistive guiding concept for Fast Ignition ICF. The development work done throughout 2011 resulted in our work appearing in Physical Review Letters [1]. We have continued to use the SCARF-LEXICON clusters to continue our research into resistive guiding throughout 2012.
We have also recently been awarded an European Research Council Starting Grant (STRUCMAGFAST) to support the development of resistive or structured guiding research at the CLF over the next four years. This will include the development of a new parallel simulation code, and a post-doctoral researcher.
The SCARF resources have been invaluable in providing support to the CLF user community through our support role. We have provided support through performing simulations for CLF users, developing codes for CLF users to use on SCARF, and training students to use these codes on the SCARF resources. [1] A.P.L.Robinson, M.H.Key and M.Tabak, Phys.Rev.Lett, 108, 125004 (2012) [2] A.P.L.Robinson, R.Trines, Z.Najmudin, and N.Dover, Plasma Phys.Control. Fusion, 54, 115001 (2012)

SCARF Annual Report 2011-2012
15/10/12 SCARF_Annual_Report_2011-2012.vfinal 31
3.13 28BBin Qiao (QUB), Macro Borghesi (QUB), Matthew Zepf (QUB), David Neely (RAL)
3.13.1 53BScarf usage summary of Queens University Belfast plasma physics in 2012
In the past year, Queen’s University Belfast (QUB) plasma physics group has carried out comprehensive particle-in-cell (PIC) modelling work on the SCARF cluster at Rutherford Appleton Laboratory in the area of laser-driven high-energy ion sources production. These modelling results have helped the group to understand the new ion acceleration mechanism, specifically radiation pressure acceleration (RPA), to explain the group’s experimental results on Vulcan and Gemini laser facilities. The PIC code “ILLUMINATION” of this group has also been benchmarked and improved in comparison with the experimental data.
In Summary:
3.13.1.1 56B Proposing the new hybrid light-sail (LS) - target normal sheath acceleration (TNSA) regime for ion acceleration by linearly polarized laser pulses at intensities of 1021Wcm-2
Through a large number of 2D PIC simulations on the SCARF-INTEL and theoretical modeling, we have identified a new RPA-dominated regime of quasimonoenergetic ion beam generation for LP laser pulses at intensities of 1020 –1021 Wcm-2. In this regime, with an appropriate coupling condition between foil thickness, laser intensity, and pulse duration satisfied, RPA could be dominant during the competition between RPA and TNSA mechanisms in a hybrid acceleration stage. Such a coupling condition has been analytically derived and verified by two-dimensional (2D) particle-in-cell (PIC) simulations. These show that 1.26 GeV quasimonoenergetic C6+ ion beam with energy spread ~0.1GeV and angular divergence <5° is obtained by irradiation of 80 nm ultrathin foils with LP pulses at intensities 1021 Wcm-2. The result is shown in following Fig. 1. We can see that the RPA dominated regime can be achieved by using ultrathin foils (tens ofnanometers) on contemporary high-contrast petawatt orsubpetawatt laser systems. Furthermore, a laser contrast in excess of 1010 is required for the regime; otherwise, the prepulse heating will lead to rapid foil disassembly. This theoretical and numerical work opens the proper way to verify the RPA scheme in experiments with optimized laser and target parameters, and has been published in Physical Review Letters [1].

SCARF Annual Report 2011-2012
15/10/12 SCARF_Annual_Report_2011-2012.vfinal 32
Figure 27: (a) C6+ density at t=83fs for a 80nm fully ionized carbon foil irradiated by LP laser pulses at intensities I0=3×10²¹ Wcm-2, wavelength λ=1.0μm and duration τL=67 fs, where the foil electron density is 600nc. (b) The corresponding C6+ energy spectra at t=53 (black line), 68 (blue line), and 83fs (red line), showing RPA dominated regime in hybrid RPA-TNSA acceleration. (c) and (d) C6+ density and spectra obtained by increasing foil thickness to l0=200nm, showing no pronounced spectral peak as RPA is non-dominated in the hybrid acceleration. (e) shows the scaling of the required foil thickness for the RPA-dominated regime with the laser power by fixing laser pulse duration at 66 fs, where the foil density is the same as in XFigure 27X(a). The corresponding points of the spectral cases of (b) and (d) are also marked in (e). 3.13.1.2 57B Scaling study of RPA with both experiments on Vulcan laser and PIC simulations
The extensive PIC simulations on SCARF cluster we have carried out have explained and supported our recent excellent experimental results on the PW Vulcan laser facility, which shows clear evidence of RPA narrow band spectral features emerging from ultrathin foil irradiation by sub-PW laser pulses, as seen in XFigure 28 X.

SCARF Annual Report 2011-2012
15/10/12 SCARF_Annual_Report_2011-2012.vfinal 33
Figure 28: (a) Schematic of the experimental setup. (b) Ion spectra obtained from 100 nm Cu target irradiated by a
LP laser pulse at I0 =∼ 3 × 10²⁰ W cm−2. Different line colours correspond to different ion species (see the figure legend), solid and dotted lines represent spectra obtained on TP1 and TP2 respectively. (c) Ion spectra obtained on
TP1 from 50 nm Cu target irradiated by a CP pulse at I0 =∼ 1.25 × 10²⁰ W cm−2. The proton spectra obtained with RCF, in the same shot, at different positions in the beam, corresponding to ~2°, ~7° and ~13° from the laser axis are also shown (dashed lines).
In particular, carbon ion peaks of up to ~7 MeV/nucleon (cut-off energy in excess of 10 MeV/nucleon) are produced for the first time, with nearly an order of magnitude higher particle flux than previously reported. The PIC simulation result in XFigure 29 X show that TNSA and HB takes place with the rising intensity of the laser pulse, accelerating ions from rear and front surfaces respectively. After the ions from the front surface pile up at the target rear surface forming a compressed layer, ions are accelerated predominantly by the LS mechanism resulting in the ion spectrum shown in the XFigure 29X(c), which reproduces the main features observed in the experimental data. The target remains highly reflective during the whole duration of the simulation and the carbon ions are accelerated in a snowplough fashion maintaining a dense layer as shown in the XFigure 29 X(d) and (e). It is interesting to note the debunching of the Cu ions after the laser pulse, as shown in the XFigure 29X(e), producing the exponential spectrum profile of XFigure 29 X(c), which resembles closely the experimental data.
Figure 29: (a) Graph showing comparison between five ion (Z/A = 0.5) spectra, where the spectral peaks are plotted in (b) as a function of a20τLS/χ. The experimental parameter set [a0, target material, target thickness(μm)] for the data points 1-7 are [15.5, Cu, 0.1], [10, Cu, 0.05], [13.8, Cu, 0.1], [7.5, Al, 0.1], [6.9, Al, 0.1], [13.6, Al, 0.5] and [14.1, Al, 0.8] respectively. The black solid line in (b) represents ion energy estimated from the analytical modeling described in the text. The red circles represent the data shown by Heing et. al. in the ref. [16]. (c) Ion spectra obtained from 2D multilayered PIC simulation for the data point ’1’ in (a), of which the experimental spectra is shown in the XFigure 27X(b). (d) and (e) shows 2D profiles of ion (black-proton, red-carbon and blue-Copper) density obtained from the 2D PIC simulation shown in (c) at 66 fs and 165 fs, respectively.
This is consistent with the scenario highlighted in our previous theoretical and modeling papers,

SCARF Annual Report 2011-2012
15/10/12 SCARF_Annual_Report_2011-2012.vfinal 34
where the heavier species in a multispecies target undergo decompression and Coulomb explosion, while the lighter species are stabilized by the excess electrons released by the heavier species.
The scaling with the laser and target parameters, point to a multispecies scenario of LS RPA acceleration is also given by numerous simulations in comparison with experimental data, shown in XFigure 30 X. The possibility of achieving spectral peaks beyond 100 MeV/nucleon, a key requirement for hadron theraphy, by tuning currently achievable laser and target parameters is discussed on the basis of the experimental scaling, and also verified by 2D PIC simulations.
These results have been accepted by Physical Review Letters [2].
Figure 30: Ion energy scaling (black solid line) as shown in the XFigure 29X(a), extrapolated to higher a20τLS/χ. Square points are the experimental data. The red circles represent the results reported in the literature, by multispecies PIC
simulations for stable LS acceleration. Dashed black line shows trend for a Eion ∝ (a2τLS/χ)2 scaling valid for ion energies. Solid and dashed blue lines plots expected ion energy by varying χ for 45 fs FWHM laser at I0 = 5 × 10²⁰W cm−2 and 450fs FWHM laser at I0 = 5 × 10¹⁹W cm−2 respectively. The insert shows the spectra obtained from a PIC simulation identical to the run shown in the XFigure 29X (c), except the laser fluence increased by a factor of 2 and target density decreased by a factor of 2.5.
[1] B. Qiao et al Phys. Rev. Lett. 108, 115002 (2012). [2] S. Kar, K.F. Kakolee, and B. Qiao et al., Phys. Rev. Lett. Accepted (2012)

SCARF Annual Report 2011-2012
15/10/12 SCARF_Annual_Report_2011-2012.vfinal 35
3.14 29BRowan Hargreaves (ISIS)
3.14.1 54BMeasuring the effect of temperature on micelle structure using wide Q-range neutron diffraction
Using wide Q-range neutron diffraction and Empirical Potential Structure Refinement (EPSR) we have been able to determine the effect of a 25 degree increase in temperature on the structure of C10TAB micelles in solution. We observe at the higher temperature that there is a far greater range of micelle sizes and that the micelles are more disordered with greater eccentricity and a less precisely defined interface between the hydrophobic core and outer corona than at ambient conditions. These are marked structural changes that are occurring as a result of a modest change in temperature.
The idea of self assembly is a simple one: an amphiphilic molecule will aggregate to shield their solvophobic parts from the solvent with their solvophilic moieties forming an interface to the solvent. Depending upon the concentration, the size and shape of the amphiphilic molecule a variety of different aggregates can form: spherical or elliptical micelles, rod-like micelles and more complicated bi-layer structures including vesicles and lamellae.
In the 1970s Tanford[1], Mitchell, Ninham and Israelachvili [2] developed a simple thermodynamic model to predict the morphology of structures that surfactants form in solution. These models distilled a single parameter, known as the packing parameter, that governed the size and shape of the aggregate formed. The packing parameter is a function of the average surfactant hydrophobic tail length and volume, and the area per surfactant molecule of the interface formed between the hydrophobic region and polar region of the aggregate. (NB while the tail length and volume are geometric properties, the interface area is in fact a free energy.) Unfortunately to capture all the subtleties of the different phenomena of surfactant self-assembly the model has increased in complexity.
The experimental technique wide Q-range neutron diffraction is able to interrogate the structure of liquid and disordered materials on length scales from the atomistic to the mesoscopic. This is in direct contrast with most other experimental techniques that either provide an indirect or range limited measurement of the micelle structure. Unfortunately the direct interpretation of the raw neutron diffraction data is, with exception of the simplest systems, very difficult or nigh on impossible.
We are able to interpret the diffraction data by the computer simulation technique EPSR, that refines 3d configurations of the molecules towards ones that are as consistent, as can be, with the measured diffraction data. Starting from an initial random configuration of molecules EPSR assembles the surfactant molecules into micelles, as expected. We now have a wealth of information about the micelles – everything from the atomistic detail of surface of the micelle (the counterion binding and water penetration) to the size and shape of the micelle itself.
Building on our previous study [3], our recent work has shown that we are able to see marked differences in the micelles formed at the two temperatures of 25C and 50C. XFigure 31X is an example of the sort of structural detail we able to extract from our models, it shows the atomic density profiles (ADPs) of various atom types from the centre of mass of the micelles found at the two temperatures revealing the difference in the cross-sectional structure of the micelles. From this it is

SCARF Annual Report 2011-2012
15/10/12 SCARF_Annual_Report_2011-2012.vfinal 36
clear that the interface between the hydrophobic part of the micelle and the outer polar region is less well defined at the higher temperature of 50C than at 25C. The ADPs corresponding to the surfactant headgroups and counterions are significantly broader at 50C than at 25C reflect the increased disorder at the higher temperature.
Figure 31: A comparison of the atomic density profiles (ADPs) calculated from the centre of mass of micelles containing between 40 and 48 surfactant molecules measured at 25C (lighter lines) and 50C (darker lines). The green lines correspond to the carbon atoms in the surfactant molecules' hydrophobic tail, and the blue lines correspond to the nitrogen atoms in the surfactants' headgroups. While the magenta/purple lines show the location of the bromide counterions and the red lines are the water molecule locations (NB the water ADPs have been scaled up by a factor of 10 for clarity).
The combination of wide Q-range neutron diffraction and EPSR is able to provide the molecular-level detail that is vital to understand self-assembly processes and more generally these sorts of systems where the large scale structure is governed by molecular-level interactions. For example, different counterions can produce radically different aggregates but what exactly is the mechanism – and where do the different counterions sit in relation to the aggregate? Insights from these sorts of study are of particular importance to the field of supramolecular templating--a method of forming nanostructured materials by using molecular aggregrates, like micelles, as scaffold to form the material around—which is used to manufacture molecular sieves and catalysts.
This sort of study would not be possible without the use of SCARF. Having access to the many cores on SCARF has allowed us to experiment with different models to improve the refinement process, to run multiple simulations of the same model to gain sufficient statistics and to concurrently run simulations using data from different neutron experiments for comparison. For some perspective, at present--due to EPSR currently being a serial code--8 months of CPU time is required for the analysis of one day of beam time!
[1] Tanford C, The Hydrophobic Effect; Wiley-Interscience. New York, 1973. [2] Israelachvili J, Mitchell D J, and Ninham B W; J. Chem. Soc., Faraday Trans. 2, 1976, 72, 1525. [3] Hargreaves R, Bowron D T, and Edler K; J. Am. Chem. Soc. 2011, 133, 16524–16536

SCARF Annual Report 2011-2012
15/10/12 SCARF_Annual_Report_2011-2012.vfinal 37
3.15 30BE. Higson1,2, R. Trines2, R. Bingham2,3, and P.A. Norreys1,2,4 [1]University of Oxford [2] Central Laser Facility, [3] University of Strathclyde, [4] Imperial College London.
3.15.1 55BThe role of phase front deformation on the growth of the filamentation instability in laser-plasma interactions
The filamentation instability plays an important role in the interaction of intense laser pulses with dense plasma or with solid targets. It can have a detrimental effect on processes ranging from channel formation in underdense plasma to target compression in Inertial Confinement Fusion prior to ignition. Previous results indicated that phase front deformation caused by transverse density fluctuations across the laser spot were an important factor in determining the onset and extent of laser pulse filamentation for plasma densities just below the critical density. In this paper, the role of such phase front deformation will be explored further. In this paper, particle-in-cell simulations are presented in which a low-intensity laser pulse propagates through a plasma with a prescribed density profile (a channel), obtained from two-dimensional particle-in-cell simulations of hole boring by relativistic laser beams. This way, the influence of the plasma density profile on the laser beam and its phase fronts can be studied while the laser beam is too weak to alter the density profile significantly. The following function was used to reproduce the charge density spatial profile (shown in XFigure 32 X):
f(x,y)=(3.75x10⁻³u16-9.5x10⁻³)exp(-u4)+0.01+4.0x10⁻³(exp(-64u2))
where 61 102
35000×
=π
xx
61 1023333×
=π
yy
)2
1( 11
yxu +=
When modelling of exponential ramp (as in XFigure 32X
) was required, f(x,y) was multiplied by a ramp factor for y less than the length of the ramp (Lramp).
])(8exp[Lramp
Lrampyramp −=

SCARF Annual Report 2011-2012
15/10/12 SCARF_Annual_Report_2011-2012.vfinal 38
(a)
(b)
Figure 32: (a) Colour plots of f(x,y) (b) Transverse line-out of the function under (a) at x1= 5500.
The 2D PIC simulation results depicted in XFigure 33Xc and XFigure 33 Xd have been obtained using the PIC code OSIRIS [31]. The simulation setup was the same as for XFigure 32X. As shown in XFigure 32 X and XFigure 33X, a plasma channel is then formed with steep walls (2–2.5 times the background density nb) and a low density near its axis (0.1–0.2 times nb). The channel in the quasi-static model closely follows the shape of the channel in the PIC simulations.
SCARF Annual Report 2011-2012
15/10/12 SCARF_Annual_Report_2011-2012.vfinal 39
In order to verify the predictions of the quasi-static model, a sequence of PIC simulations has been carried out. The simulations have been carried out on the CLF-owned Scarf-Lexicon cluster, using the particle-in-cell code Osiris. In the simulations, a reduced laser intensity of 1.3×10¹⁸ W cm−2 was used, corresponding to a0 = 0.01. This intensity is sufficiently low for the laser pulse not to significantly perturb the plasma, while the effect of the plasma density profile on laser pulse propagation is faithfully preserved. Numerical parameters of these simulations were as follows: box dimensions: 7825 × 3016 (in units of c/ωp); the time at which the snapshots were taken 7519 (in units of ωp-1). XFigure 33 X(a) shows the electric field at different times in the simulation, providing information individual wave-fronts, plasma density profiles given by equation (1). Shown in XFigure 33 X(b) is its transformation where the plasma density is doubled but its gradient with respect to the transverse direction is kept constant [2f(½x,y)]. One can clearly see that the greater phase discrepancy between wave-fronts, caused by a greater plasma density, causes the beam to bifurcate much faster. This also causes the beamlets to be more focused and intense, as shown by the red colours of the wave fronts. XFigure 33 X(c) shows a transformation that shrinks the transverse axis by a factor of two, increasing the transverse spatial gradient of phase change but keeping the other factors constant [f(2x,y)]. This requires consideration of the competition between increased self-focusing and the effect of the larger gradient. Comparison of XFigure 33X(a) and XFigure 33 X(c) provides compelling evidence that the larger gradient does indeed cause the beam to bifurcate faster. If this were not the case, then the increase in self-focusing would mean that the beam would split much more slowly. Hence this demonstrates that the larger gradient of phase change increases the bifurcation speed.

SCARF Annual Report 2011-2012
15/10/12 SCARF_Annual_Report_2011-2012.vfinal 40
(a) Plasma Density Profile = ),( yxf
(b) Plasma Density Profile = )],2
([2 yxf
(c) Plasma Density Profile = ),2( yxf
Figure 33: Effect of absolute plasma density and density gradient on laser beam propagation. (a) Propagation in the standard channel given by f(x,y). (b) Propagation in the modified channel 2f(x/2,y), so the amplitude of the density perturbation is doubled while the density gradients are preserved. (c) Propagation in the modified channel f(2x,y), so the density gradients are doubled while the amplitude of the density perturbation is preserved.
In conclusion, we have studied the influence of the transverse plasma profile on laser beam filamentation. It was found that this is strongly dependent on the width of the channel and the steepness of the channel walls. In the future, this may be used to control the onset of filamentation via the laser pulse spot diameter.

SCARF Annual Report 2011-2012
15/10/12 SCARF_Annual_Report_2011-2012.vfinal 41
1. 3BAPPENDIX : SCARF HARDWARE DETAILS
2. 4BAPPENDIX: INDEX OF FIGURES UFigure 1: Pie chart showing percentage usage of the SCARF service by department U ................................................................................................ 4 UFigure 2: Table displaying detailed usage from 2011-12 comparing with 2010-11 and 2009-10U ............................................................................... 5 UFigure 3: Availability for SCARF U ......................................................................................................................................................................................... 6 UFigure 4: Availability vs Year PurchasedU ........................................................................................................................................................................... 6 UFigure 5: Scheme of the C5 species present over a working Pd/Al2O3 hydrogenation catalyst utilizing a mixed cis- and trans-1,3-pentadiene feedstock that contains cyclopentene as an impurity. Gas-phase species are denoted by (g) and adsorbed species by (ad). Assignment of the vibrational spectra of the molecules highlighted in red were provided by Gaussian 03 calculations on SCARF.U .............. 9 UFigure 6: Left: the CASTEP geometry optimised structure of 2,2’-bipyridyl (bis)thiolate platinum (II), Pt(bpy)(SPh)2 calculated on SCARF. Right: Comparison of the INS spectrum of the complex generated from the structure shown on the left (blue trace) with that measured on TOSCA at ISIS (red trace). U ................................................................................................................................................................................................... 10 UFigure 7: Adsorption of CO2 in siliceous MFI at 308K, comparing experiment1 to simulationU ............................................................................... 11 UFigure 8: {011} siliceous FAU slab filled with CO2 (top). Diffusion density profile of CO2 in this slab (bottom), where red represents the favoured adsorption sites.U ................................................................................................................................................................................................... 12 UFigure 9: Interaction of energetic particles with a magnetohydrodynamic (MHD) background plasma: (a) Background thermal pressure with a shock advancing from the right (b) energy density of energetic particles showing that some particles escape ahead of the shock and generate magnetic field that confines other particles at the shock (c) magnitude of the magnetic field excited by streaming energetic particles. The panels to the right display the same information in a different format. (d-f) show the structure of the magnetic field perpendicular to the direction of particle streaming. U ..................................................................................................................................................... 14 UFigure 10: The Diamond beam before propagating through the plasma cell (top), after the plasma cell where microbunches are visible (middle) and the wakefield that has microbunched the beam (bottom). U .................................................................................................................... 15 UFigure 11: Adsorption energies of hydrogen on graphene and a single-layer of h-BN. Each histogram refers to a different configuration of the molecule on the substrate. The solid part of the histograms refers to the results obtained with the optB88-vdW functional, while the bottom part refers to the PBE results. U ............................................................................................................................................................................... 16 UFigure 12: The solid lines refer to the interlayer binding curves of graphite and h-BN. The dashed curves refer to the interlayer binding of the two materials when an hydrogen molecule is absorbed between the layers. The dashed curves clearly highlight the expansion of the interlayer spacing of the two materials due to the absorption of the gas molecule and a subsequent decrease of the binding energy.U ......... 17 UFigure 13: The dashed curves represent the absorption energy per hydrogen molecule as a function of interlayer spacing in graphite and h-BN, where the interlayer distance is ~3.33 Å. The solid lines refer to the absorption energy per hydrogen molecule in the pre-expanded materials.U ................................................................................................................................................................................................................................ 18 UFigure 14: Evolution of longitudinal profile (mountain range) as a function of time with colour indicating particle population, for approximate ISIS parameters. U ............................................................................................................................................................................................ 19 UFigure 15: Longitudinal phase space (top) at the end of injection (0 ms), mid-cycle (5 ms) and just prior to extraction (10 ms) for approximate ISIS running parameters. Momentum spread, bunching factor and stability parameters (bottom) as a function of time through 10 ms cycle for approximate ISIS parameters. U ................................................................................................................................................. 20 UFigure 16: Spin densities on the 110 plane of the (a) intrinsic Si (b ) p-type Si, (c) n-type Si host for the range of -0.02μB /bohr3 to 0.02μB/bohr3 with a step of 2x10⁻⁴ μB /bohr3. The blue lines are for majority spin states and red lines are for minority spin states. The
Host group CPU type and frequency Nodes Cores /node
Total cores
Interconnect Total memory
SCARF12 Intel X5675 @ 3.06GHz 20 12 240 QDR Infiniband 960GB SCARF11 Intel X5660 @ 2.8GHz 32 12 384 QDR Infiniband 768GB Lexicon-2/ SCARF10
Intel E5530 @ 2.40GHz 104 8 832 DDR Infiniband 2496 GB
IBIS/ SCARF09
Intel E5462 @ 2.80GHz 48 8 384 SDR Infiniband 768 GB
SCARF08 Intel E5430 @ 2.66GHz 46 8 368 SDR Infiniband 736 GB Lexicon/ SCARF07
AMD Opteron 275 @ 2.2GHz
73 4 292 GB Ethernet 584 GB
General/ SCARF06
AMD Opteron 285 @ 2.6GHz
50 4 200 Myrinet 400 GB
Grand Totals
373 2700 6712GB

SCARF Annual Report 2011-2012
15/10/12 SCARF_Annual_Report_2011-2012.vfinal 42
highest magnitude of spins for each type of spin is at the centre of contours. (d) The long range spin polarisation of the p-type Si:Mn. The range of this plot is -0.02 μB/bohr3 to +0.0002 μB/bohr3. The range has been modified from the former to include atoms having U ............... 21 UFigure 17: Rhombohedral structure of LaCoO3 U .............................................................................................................................................................. 22 UFigure 18: Density functional simulation of IR spectrum of Croconic acid compared with experiment. U ............................................................. 23 UFigure 19: The INS of pH2 in Fe MOF. Top) pure pH2. Bottom) one equivalent load of D2 and further pH2. Demonstrating the existence of two sites for adsorption.[4] SCARF calculations were user to determine the DoS of the empty cage. U ............................................................. 24 UFigure 20: Determination of the absorption site of CO2 in NOTT 300 using INS and DFT (SCARF calculations) U .............................................. 25 UFigure 21: Measured and simulation synchrotron beam loss. U ...................................................................................................................................... 26 UFigure 22: Simulated distributions at 0 ms. U ..................................................................................................................................................................... 27 UFigure 23: Simulated longitudinal phase space and measured profile at 0ms (left). Tomographic phase space reconstruction (right).U ........ 27 UFigure 24: Schematic of one-eighth of the unit cell of a pyrochlore structure (Fd3m symmetry). The cation (left) and anion (right) sublattices are separated for clarity. Gd3+ ions are in blue, Ti/Zr4+ ions are in silver and O2- are in red.U ............................................................... 28 UFigure 25: MD simulation snap shot of monomeric copper-apo, zinc-holo fALS mutant A4V SOD1. Notice the uncoil and extension of the electrostatic loop (consists of red alpha helix) as a result of Cu demetallation. U ........................................................................................................ 29 UFigure 26: Ion Density Plots during Hole-Boring RPA generated in 2D PIC simulation performed on SCARF-LEXICON-2 U ......................... 30 UFigure 27: (a) C6+ density at t=83fs for a 80nm fully ionized carbon foil irradiated by LP laser pulses at intensities I0=3×10²¹ Wcm-2, wavelength λ=1.0μm and duration τL=67 fs, where the foil electron density is 600nc. (b) The corresponding C6+ energy spectra at t=53 (black line), 68 (blue line), and 83fs (red line), showing RPA dominated regime in hybrid RPA-TNSA acceleration. (c) and (d) C6+ density and spectra obtained by increasing foil thickness to l0=200nm, showing no pronounced spectral peak as RPA is non-dominated in the hybrid acceleration. (e) shows the scaling of the required foil thickness for the RPA-dominated regime with the laser power by fixing laser pulse duration at 66 fs, where the foil density is the same as in Figure 27(a). The corresponding points of the spectral cases of (b) and (d) are also marked in (e).U ................................................................................................................................................................................................... 32 UFigure 28: (a) Schematic of the experimental setup. (b) Ion spectra obtained from 100 nm Cu target irradiated by a LP laser pulse at I0 =∼ 3 × 10²⁰ W cm−2. Different line colours correspond to different ion species (see the figure legend), solid and dotted lines represent spectra obtained on TP1 and TP2 respectively. (c) Ion spectra obtained on TP1 from 50 nm Cu target irradiated by a CP pulse at I0 =∼ 1.25 × 10²⁰ W cm−2. The proton spectra obtained with RCF, in the same shot, at different positions in the beam, corresponding to ~2°, ~7° and ~13° from the laser axis are also shown (dashed lines). U .......................................................................................................................................................... 33 UFigure 29: (a) Graph showing comparison between five ion (Z/A = 0.5) spectra, where the spectral peaks are plotted in (b) as a function of a20τLS/χ. The experimental parameter set [a0, target material, target thickness(μm)] for the data points 1-7 are [15.5, Cu, 0.1], [10, Cu, 0.05], [13.8, Cu, 0.1], [7.5, Al, 0.1], [6.9, Al, 0.1], [13.6, Al, 0.5] and [14.1, Al, 0.8] respectively. The black solid line in (b) represents ion energy estimated from the analytical modeling described in the text. The red circles represent the data shown by Heing et. al. in the ref. [16]. (c) Ion spectra obtained from 2D multilayered PIC simulation for the data point ’1’ in (a), of which the experimental spectra is shown in the Figure 27(b). (d) and (e) shows 2D profiles of ion (black-proton, red-carbon and blue-Copper) density obtained from the 2D PIC simulation shown in (c) at 66 fs and 165 fs, respectively. U .............................................................................................................................................. 33 UFigure 30: Ion energy scaling (black solid line) as shown in the Figure 29(a), extrapolated to higher a20τLS/χ. Square points are the experimental data. The red circles represent the results reported in the literature, by multispecies PIC simulations for stable LS acceleration. Dashed black line shows trend for a Eion ∝ (a2τLS/χ)2 scaling valid for ion energies. Solid and dashed blue lines plots expected ion energy by varying χ for 45 fs FWHM laser at I0 = 5 × 10²⁰W cm−2 and 450fs FWHM laser at I0 = 5 × 10¹⁹W cm−2 respectively. The insert shows the spectra obtained from a PIC simulation identical to the run shown in the Figure 29 (c), except the laser fluence increased by a factor of 2 and target density decreased by a factor of 2.5. U ............................................................................................................................................ 34 UFigure 31: A comparison of the atomic density profiles (ADPs) calculated from the centre of mass of micelles containing between 40 and 48 surfactant molecules measured at 25C (lighter lines) and 50C (darker lines). The green lines correspond to the carbon atoms in the surfactant molecules' hydrophobic tail, and the blue lines correspond to the nitrogen atoms in the surfactants' headgroups. While the magenta/purple lines show the location of the bromide counterions and the red lines are the water molecule locations (NB the water ADPs have been scaled up by a factor of 10 for clarity). U................................................................................................................................................ 36 UFigure 32: (a) Colour plots of f(x,y) (b) Transverse line-out of the function under (a) at x1= 5500.U ...................................................................... 38 UFigure 33: Effect of absolute plasma density and density gradient on laser beam propagation. (a) Propagation in the standard channel given by f(x,y). (b) Propagation in the modified channel 2f(x/2,y), so the amplitude of the density perturbation is doubled while the density gradients are preserved. (c) Propagation in the modified channel f(2x,y), so the density gradients are doubled while the amplitude of the density perturbation is preserved. U ...................................................................................................................................................... 40 UFigure 34: SCARF Queue Usage U ....................................................................................................................................................................................... 47 UFigure 35: SCARF-Lexicon Usage U ..................................................................................................................................................................................... 48 UFigure 36: SCARF Lexicon-2 Usage U .................................................................................................................................................................................. 48 UFigure 37: SCARF-IBIS Usage U ............................................................................................................................................................................................ 49 UFigure 38: SCARF Power Usage U ........................................................................................................................................................................................ 49 UFigure 39: GFlops/W for SCARF generations of equipment U ......................................................................................................................................... 50 UFigure 40: Filespace usage on the Panasas Storage U ......................................................................................................................................................... 50 UFigure 41: SCARF Network Topology U .............................................................................................................................................................................. 51 UFigure 42: SCARF06, SCARF-Lexicon[1-2], SCARF08, SCARF09 Network Usage U.................................................................................................... 51 UFigure 43: SCARF10 Network Usage U ................................................................................................................................................................................ 52 UFigure 44: SCARF11 and SCARF12 U ................................................................................................................................................................................... 52 UFigure 45: SCARF Application Stack U ................................................................................................................................................................................ 53
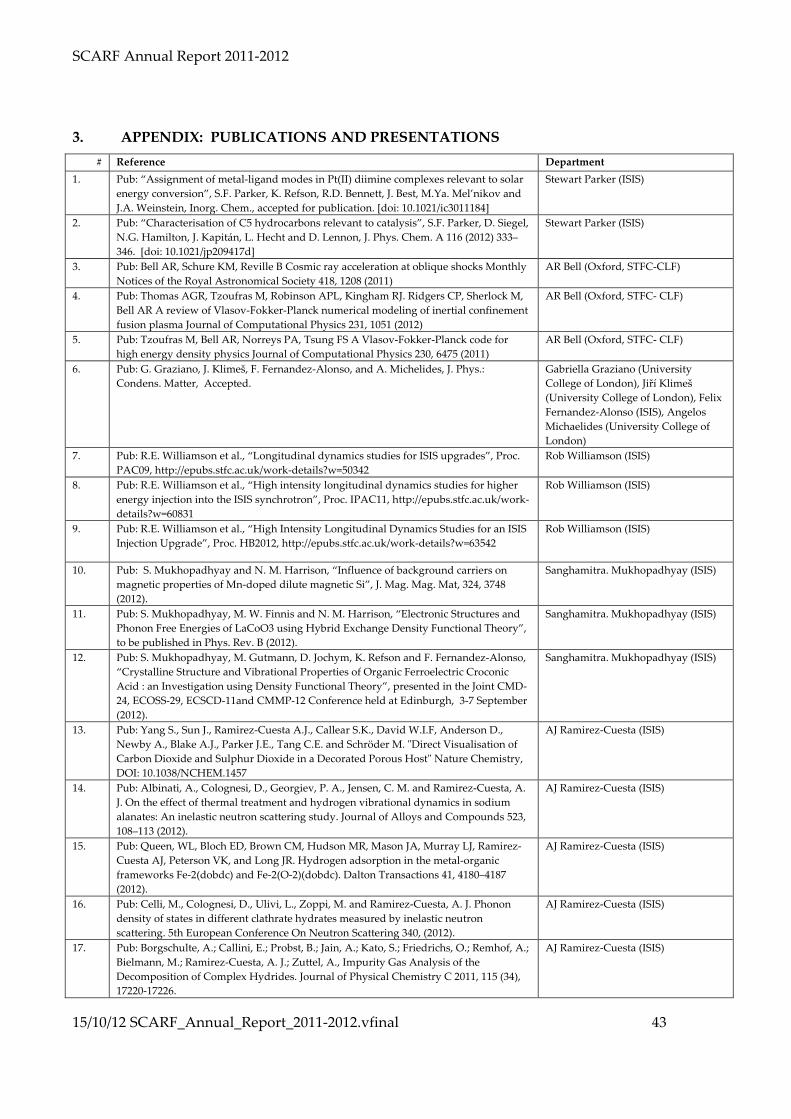
SCARF Annual Report 2011-2012
15/10/12 SCARF_Annual_Report_2011-2012.vfinal 43
3. 5BAPPENDIX: PUBLICATIONS AND PRESENTATIONS # Reference Department
1. Pub: “Assignment of metal-ligand modes in Pt(II) diimine complexes relevant to solar energy conversion”, S.F. Parker, K. Refson, R.D. Bennett, J. Best, M.Ya. Mel’nikov and J.A. Weinstein, Inorg. Chem., accepted for publication. [doi: 10.1021/ic3011184]
Stewart Parker (ISIS)
2. Pub: “Characterisation of C5 hydrocarbons relevant to catalysis”, S.F. Parker, D. Siegel, N.G. Hamilton, J. Kapitán, L. Hecht and D. Lennon, J. Phys. Chem. A 116 (2012) 333–346. [doi: 10.1021/jp209417d]
Stewart Parker (ISIS)
3. Pub: Bell AR, Schure KM, Reville B Cosmic ray acceleration at oblique shocks Monthly Notices of the Royal Astronomical Society 418, 1208 (2011)
AR Bell (Oxford, STFC-CLF)
4. Pub: Thomas AGR, Tzoufras M, Robinson APL, Kingham RJ. Ridgers CP, Sherlock M, Bell AR A review of Vlasov-Fokker-Planck numerical modeling of inertial confinement fusion plasma Journal of Computational Physics 231, 1051 (2012)
AR Bell (Oxford, STFC- CLF)
5. Pub: Tzoufras M, Bell AR, Norreys PA, Tsung FS A Vlasov-Fokker-Planck code for high energy density physics Journal of Computational Physics 230, 6475 (2011)
AR Bell (Oxford, STFC- CLF)
6. Pub: G. Graziano, J. Klimeš, F. Fernandez-Alonso, and A. Michelides, J. Phys.: Condens. Matter, Accepted.
Gabriella Graziano (University College of London), Jiří Klimeš (University College of London), Felix Fernandez-Alonso (ISIS), Angelos Michaelides (University College of London)
7. Pub: R.E. Williamson et al., “Longitudinal dynamics studies for ISIS upgrades”, Proc. PAC09, Hhttp://epubs.stfc.ac.uk/work-details?w=50342
Rob Williamson (ISIS)
8. Pub: R.E. Williamson et al., “High intensity longitudinal dynamics studies for higher energy injection into the ISIS synchrotron”, Proc. IPAC11, Hhttp://epubs.stfc.ac.uk/work-details?w=60831
Rob Williamson (ISIS)
9. Pub: R.E. Williamson et al., “High Intensity Longitudinal Dynamics Studies for an ISIS Injection Upgrade”, Proc. HB2012, Hhttp://epubs.stfc.ac.uk/work-details?w=63542
Rob Williamson (ISIS)
10. Pub: S. Mukhopadhyay and N. M. Harrison, “Influence of background carriers on magnetic properties of Mn-doped dilute magnetic Si”, J. Mag. Mag. Mat, 324, 3748 (2012).
Sanghamitra. Mukhopadhyay (ISIS)
11. Pub: S. Mukhopadhyay, M. W. Finnis and N. M. Harrison, “Electronic Structures and Phonon Free Energies of LaCoO3 using Hybrid Exchange Density Functional Theory”, to be published in Phys. Rev. B (2012).
Sanghamitra. Mukhopadhyay (ISIS)
12. Pub: S. Mukhopadhyay, M. Gutmann, D. Jochym, K. Refson and F. Fernandez-Alonso, “Crystalline Structure and Vibrational Properties of Organic Ferroelectric Croconic Acid : an Investigation using Density Functional Theory”, presented in the Joint CMD-24, ECOSS-29, ECSCD-11and CMMP-12 Conference held at Edinburgh, 3-7 September (2012).
Sanghamitra. Mukhopadhyay (ISIS)
13. Pub: Yang S., Sun J., Ramirez-Cuesta A.J., Callear S.K., David W.I.F, Anderson D., Newby A., Blake A.J., Parker J.E., Tang C.E. and Schröder M. "Direct Visualisation of Carbon Dioxide and Sulphur Dioxide in a Decorated Porous Host" Nature Chemistry, DOI: 10.1038/NCHEM.1457
AJ Ramirez-Cuesta (ISIS)
14. Pub: Albinati, A., Colognesi, D., Georgiev, P. A., Jensen, C. M. and Ramirez-Cuesta, A. J. On the effect of thermal treatment and hydrogen vibrational dynamics in sodium alanates: An inelastic neutron scattering study. Journal of Alloys and Compounds 523, 108–113 (2012).
AJ Ramirez-Cuesta (ISIS)
15. Pub: Queen, WL, Bloch ED, Brown CM, Hudson MR, Mason JA, Murray LJ, Ramirez-Cuesta AJ, Peterson VK, and Long JR. Hydrogen adsorption in the metal-organic frameworks Fe-2(dobdc) and Fe-2(O-2)(dobdc). Dalton Transactions 41, 4180–4187 (2012).
AJ Ramirez-Cuesta (ISIS)
16. Pub: Celli, M., Colognesi, D., Ulivi, L., Zoppi, M. and Ramirez-Cuesta, A. J. Phonon density of states in different clathrate hydrates measured by inelastic neutron scattering. 5th European Conference On Neutron Scattering 340, (2012).
AJ Ramirez-Cuesta (ISIS)
17. Pub: Borgschulte, A.; Callini, E.; Probst, B.; Jain, A.; Kato, S.; Friedrichs, O.; Remhof, A.; Bielmann, M.; Ramirez-Cuesta, A. J.; Zuttel, A., Impurity Gas Analysis of the Decomposition of Complex Hydrides. Journal of Physical Chemistry C 2011, 115 (34), 17220-17226.
AJ Ramirez-Cuesta (ISIS)

SCARF Annual Report 2011-2012
15/10/12 SCARF_Annual_Report_2011-2012.vfinal 44
18. Pub: Borgschulte, A.; Jain, A.; Ramirez-Cuesta, A. J.; Martelli, P.; Remhof, A.;
Friedrichs, O.; Gremaud, R.; Zuttel, A., Mobility and dynamics in the complex hydrides LiAlH(4) and LiBH(4). Faraday Discussions 2011, 151, 213-230.
AJ Ramirez-Cuesta (ISIS)
19. Pub: Colognesi, D.; Giannasi, A.; Ulivi, L.; Zoppi, M.; Ramirez-Cuesta, A. J.; Roth, A.; Fichtner, M., Raman and Inelastic Neutron Scattering Study on a Melt-Infiltrated Composite of NaAlH(4) and Nanoporous Carbon. Journal of Physical Chemistry A 2011, 115 (26), 7503-7510.
AJ Ramirez-Cuesta (ISIS)
20. Pub: Sato, T.; Ramirez-Cuesta, A. J.; Ikeda, K.; Orimo, S.; Yamada, K., Vibrational Properties of CaAlH(5) and alpha-AlH(3) with Different AlH(6) Networks Studied by Inelastic Neutron Scattering. Inorganic Chemistry 2011, 50 (17), 8007-8011.
AJ Ramirez-Cuesta (ISIS)
21. Pub: Beam Loss Studies of the ISIS Synchrotron using ORBIT. D.J. Adams. IPAC12 Dean Adams (ISIS) 22. Pub: Beam Loss Control in the ISIS Accelerator Facility. D.J. Adams HB2012 Dean Adams (ISIS) 23. Pub: Simulation and Measurement of Half Integer Resonance in Coasting Beams in the
ISIS Ring. C.M.Warsop. HB2012 Dean Adams (ISIS)
24. Pub: Injection and Stripping Foil Studies for a 180 MeV Injection upgrade at ISIS. B. Jones, HB2012
Dean Adams (ISIS)
25. Pub: A.P.L.Robinson, M.H.Key and M.Tabak, Phys.Rev.Lett, 108, 125004 (2012) A.P.L.Robinson (CLF) 26. Pub: A.P.L.Robinson, R.Trines, Z.Najmudin, and N.Dover, Plasma Phys.Control.
Fusion, 54, 115001 (2012) A.P.L.Robinson (CLF) 27. Pub: M.Quinn et al., Plasma Phys. Control.Fusion, 53,025007 (2011) A.P.L.Robinson (CLF) 28. Pub: X.H.Yang et al., Phys.Plasmas, 18, 093102 (2011) A.P.L.Robinson (CLF) 29. Pub: G.Chatterjee et al., Phys.Rev.Lett, 108, 235005 (2012) A.P.L.Robinson (CLF) 30. Pub: X.H.Yang, M.Borghesi, and A.P.L.Robinson, Phys.Plasmas, 19, 062702 (2012)
A.P.L.Robinson (CLF) 31.
Pub: B. Qiao et al Phys. Rev. Lett. 108, 115002 (2012).
Bin Qiao (QUB), Macro Borghesi (QUB), Matthew Zepf (QUB), David Neely (RAL)
32.
Pub: S. Kar, K.F. Kakolee, and B. Qiao et al., Phys. Rev. Lett. Accepted (2012)
Bin Qiao (QUB), Macro Borghesi (QUB), Matthew Zepf (QUB), David Neely (RAL)
33. Pub: The effect of temperature on C10TAB micelles, R Hargreaves, DT Bowron and K Edler, Soft Matter, 2013, (in prep.) Rowan Hargreaves (ISIS)
34. Pub: The effect of excess salt on C10TAB micelles in solution, Proceedings of Faraday Discussion 167, 2013 (in prep.). Rowan Hargreaves (ISIS)
35. Pub: R. Trines, F. Fiúza, et al., “Production of Picosecond, Kilojoule and Petawatt Laser Pulses via Raman Amplification of Nanosecond pulses”, Phys. Rev. Lett. 107, 105002 (2011).
E. Higson1,2, R. Trines2, R. Bingham2,3, and P.A. Norreys1,2,4 [1]University of Oxford [2] Central Laser Facility, [3] University of Strathclyde, [4] Imperial College London.
36.
Pub: A. Robinson, R. Trines, J. Polz and M. Kaluza, “Absorption of circularly polarized laser pulses in near-critical plasmas”, Plasma Phys. Contr. Fusion 53, 065019 (2011).
E. Higson1,2, R. Trines2, R. Bingham2,3, and P.A. Norreys1,2,4 [1]University of Oxford [2] Central Laser Facility, [3] University of Strathclyde, [4] Imperial College London.
37.
Pub: A. Robinson, R. Trines, N. Dover and Z. Najmudin, “Hole-boring radiation pressure acceleration as a basis for producing high-energy proton bunches”, Plasma Phys. Contr. Fusion 54, 115001 (2012).
E. Higson1,2, R. Trines2, R. Bingham2,3, and P.A. Norreys1,2,4 [1]University of Oxford [2] Central Laser Facility, [3] University of Strathclyde, [4] Imperial College London.
38.
Pub: G. Sarri et al., “Employing laser-accelerated proton beams to diagnose high intensity laser-plasma interactions”, AIP Conf. Proc. 1462, 149 (2011).
E. Higson1,2, R. Trines2, R. Bingham2,3, and P.A. Norreys1,2,4 [1]University of Oxford [2] Central Laser Facility, [3] University of Strathclyde, [4] Imperial College London.
39. Pub: R. Scott et al., “A study of fast electron energy transport in relativistically intense laser-plasma interactions with large density scale lengths”, Phys. Plasmas 19, 053104 (2012).
E. Higson1,2, R. Trines2, R. Bingham2,3, and P.A. Norreys1,2,4 [1]University of Oxford [2] Central Laser Facility, [3] University of Strathclyde, [4] Imperial
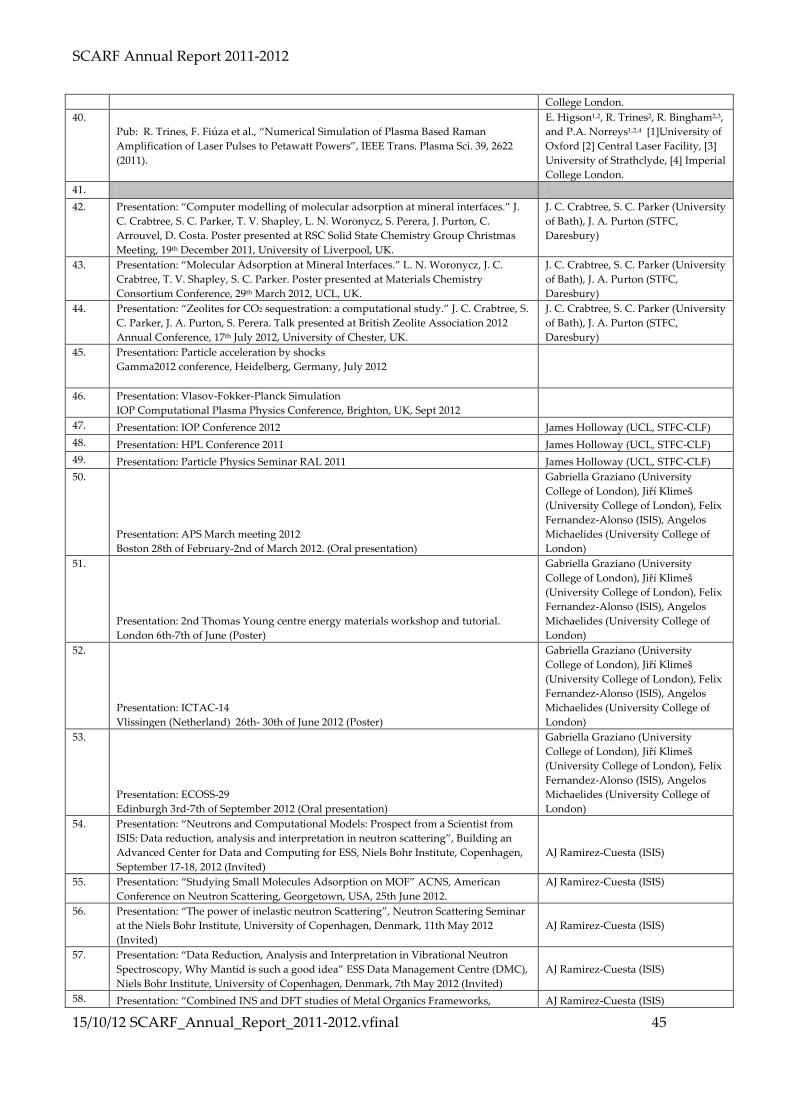
SCARF Annual Report 2011-2012
15/10/12 SCARF_Annual_Report_2011-2012.vfinal 45
College London. 40.
Pub: R. Trines, F. Fiúza et al., “Numerical Simulation of Plasma Based Raman Amplification of Laser Pulses to Petawatt Powers”, IEEE Trans. Plasma Sci. 39, 2622 (2011).
E. Higson1,2, R. Trines2, R. Bingham2,3, and P.A. Norreys1,2,4 [1]University of Oxford [2] Central Laser Facility, [3] University of Strathclyde, [4] Imperial College London.
41. 42. Presentation: “Computer modelling of molecular adsorption at mineral interfaces.” J.
C. Crabtree, S. C. Parker, T. V. Shapley, L. N. Woronycz, S. Perera, J. Purton, C. Arrouvel, D. Costa. Poster presented at RSC Solid State Chemistry Group Christmas Meeting, 19th December 2011, University of Liverpool, UK.
J. C. Crabtree, S. C. Parker (University of Bath), J. A. Purton (STFC, Daresbury)
43. Presentation: “Molecular Adsorption at Mineral Interfaces.” L. N. Woronycz, J. C. Crabtree, T. V. Shapley, S. C. Parker. Poster presented at Materials Chemistry Consortium Conference, 29th March 2012, UCL, UK.
J. C. Crabtree, S. C. Parker (University of Bath), J. A. Purton (STFC, Daresbury)
44. Presentation: “Zeolites for CO2 sequestration: a computational study.” J. C. Crabtree, S. C. Parker, J. A. Purton, S. Perera. Talk presented at British Zeolite Association 2012 Annual Conference, 17th July 2012, University of Chester, UK.
J. C. Crabtree, S. C. Parker (University of Bath), J. A. Purton (STFC, Daresbury)
45. Presentation: Particle acceleration by shocks Gamma2012 conference, Heidelberg, Germany, July 2012
46. Presentation: Vlasov-Fokker-Planck Simulation IOP Computational Plasma Physics Conference, Brighton, UK, Sept 2012
47. Presentation: IOP Conference 2012 James Holloway (UCL, STFC-CLF) 48. Presentation: HPL Conference 2011 James Holloway (UCL, STFC-CLF) 49. Presentation: Particle Physics Seminar RAL 2011 James Holloway (UCL, STFC-CLF) 50.
Presentation: APS March meeting 2012 Boston 28th of February-2nd of March 2012. (Oral presentation)
Gabriella Graziano (University College of London), Jiří Klimeš (University College of London), Felix Fernandez-Alonso (ISIS), Angelos Michaelides (University College of London)
51.
Presentation: 2nd Thomas Young centre energy materials workshop and tutorial. London 6th-7th of June (Poster)
Gabriella Graziano (University College of London), Jiří Klimeš (University College of London), Felix Fernandez-Alonso (ISIS), Angelos Michaelides (University College of London)
52.
Presentation: ICTAC-14 Vlissingen (Netherland) 26th- 30th of June 2012 (Poster)
Gabriella Graziano (University College of London), Jiří Klimeš (University College of London), Felix Fernandez-Alonso (ISIS), Angelos Michaelides (University College of London)
53.
Presentation: ECOSS-29 Edinburgh 3rd-7th of September 2012 (Oral presentation)
Gabriella Graziano (University College of London), Jiří Klimeš (University College of London), Felix Fernandez-Alonso (ISIS), Angelos Michaelides (University College of London)
54. Presentation: “Neutrons and Computational Models: Prospect from a Scientist from ISIS: Data reduction, analysis and interpretation in neutron scattering”, Building an Advanced Center for Data and Computing for ESS, Niels Bohr Institute, Copenhagen, September 17-18, 2012 (Invited)
AJ Ramirez-Cuesta (ISIS)
55. Presentation: “Studying Small Molecules Adsorption on MOF” ACNS, American Conference on Neutron Scattering, Georgetown, USA, 25th June 2012.
AJ Ramirez-Cuesta (ISIS)
56. Presentation: “The power of inelastic neutron Scattering”, Neutron Scattering Seminar at the Niels Bohr Institute, University of Copenhagen, Denmark, 11th May 2012 (Invited)
AJ Ramirez-Cuesta (ISIS)
57. Presentation: “Data Reduction, Analysis and Interpretation in Vibrational Neutron Spectroscopy, Why Mantid is such a good idea” ESS Data Management Centre (DMC), Niels Bohr Institute, University of Copenhagen, Denmark, 7th May 2012 (Invited)
AJ Ramirez-Cuesta (ISIS)
58. Presentation: “Combined INS and DFT studies of Metal Organics Frameworks, AJ Ramirez-Cuesta (ISIS)

SCARF Annual Report 2011-2012
15/10/12 SCARF_Annual_Report_2011-2012.vfinal 46
Probing the interactions of small molecules with the host material”, 6th International Symposium Hydrogen and Energy, Stoos, Switzerland, 22-27 January 2012.
59. Presentation: “Espectroscopia de Neutrones, Aplicaciones al estudio de materiales hidrogenados” Research seminar at the University of Malaga, Spain, 26th September 2011, (Invited)
AJ Ramirez-Cuesta (ISIS)
60. Presentation: “Applications of INS to hydrogen storage materials” UK-SHEC hydrogen and fuel cell Researchers Workshop, Bath University 8th September 2011. (Invited)
AJ Ramirez-Cuesta (ISIS)
61. Presentation: “Ab-Initio Calculations Of The Dynamics Of Select Hydrogen Containing Materials, Compared To Inelastic Neutron Scattering Spectra”, Swedish Neutron Scattering Society 2011 Meeting, Gothenburg, August 2011, (Invited).
AJ Ramirez-Cuesta (ISIS)
62. Presentation: “Studying hydrogen storage materials using Neutron Scattering” ECNS 2011, Prague, 21st July 2011.
AJ Ramirez-Cuesta (ISIS)
63. Presentation: EPSR at the extremes, R Hargreaves, EPSR Workshop Nov 2011. Rowan Hargreaves (ISIS) 64. Presentation: Invited presentation D T Bowron: e-Infrastructure South Centre for
Innovation meeting, June 2012. Rowan Hargreaves (ISIS) 65. Presentation: Invited talk K Edler: The effect of excess salt on micelle structure,
Mesostructure and Dynamics in Liquids and Solutions: Faraday Discussion 167, Sept 2013 Rowan Hargreaves (ISIS)
66. Presentation: “Production of Picosecond, Kilojoule and Petawatt Laser Pulses via Raman Amplification of Nanosecond pulses”, Inertial Fusion Science and Applications conference, Bordeaux, Sept. 2011.
E. Higson1,2, R. Trines2, R. Bingham2,3, and P.A. Norreys1,2,4 [1]University of Oxford [2] Central Laser Facility, [3] University of Strathclyde, [4] Imperial College London.
67. Presentation: “Production of Intense EM Pulses for Laser Driven Nuclear Fusion and High Energy Density Physics”, ITER-IAEA-ICTP Advanced Workshop on Fusion and Plasma Physics, Trieste, October 2011.
E. Higson1,2, R. Trines2, R. Bingham2,3, and P.A. Norreys1,2,4 [1]University of Oxford [2] Central Laser Facility, [3] University of Strathclyde, [4] Imperial College London.
68. Presentation: “Channelling, Filamentation and Bubble Formation in Laser-Driven Nuclear Fusion”, 30th UK Fusion Theory Meeting, Culham Science Centre, Abingdon, November 2011.
E. Higson1,2, R. Trines2, R. Bingham2,3, and P.A. Norreys1,2,4 [1]University of Oxford [2] Central Laser Facility, [3] University of Strathclyde, [4] Imperial College London.
69. Presentation: “Production of Picosecond, Kilojoule and Petawatt Laser Pulses via Raman Amplification of Nanosecond pulses”, 53rd Annual Meeting of the APS Division of Plasma Physics, Salt Lake City, November 2011.
E. Higson1,2, R. Trines2, R. Bingham2,3, and P.A. Norreys1,2,4 [1]University of Oxford [2] Central Laser Facility, [3] University of Strathclyde, [4] Imperial College London.
70.
Presentation: “Channelling and filamentation in laser-driven nuclear fusion”, Christmas High Power Laser Science Community Meeting, Abingdon, December 2011.
E. Higson1,2, R. Trines2, R. Bingham2,3, and P.A. Norreys1,2,4 [1]University of Oxford [2] Central Laser Facility, [3] University of Strathclyde, [4] Imperial College London.
71. Presentation: E. Higson, “The role of wave front deformation in laser-beam filamentation”, Christmas High Power Laser Science Community Meeting, Abingdon, December 2011.
E. Higson1,2, R. Trines2, R. Bingham2,3, and P.A. Norreys1,2,4 [1]University of Oxford [2] Central Laser Facility, [3] University of Strathclyde, [4] Imperial College London.
72. Presentation: “Raman compression of long laser pulses to picosecond duration for fast-ignition fusion and high energy density physics”, Third International Workshop on Laser-Matter Interaction, Porquerolles (France), June 2012.
E. Higson1,2, R. Trines2, R. Bingham2,3, and P.A. Norreys1,2,4 [1]University of Oxford [2] Central Laser Facility, [3] University of Strathclyde, [4] Imperial College London.
73.
Presentation: “Raman amplification of laser pulses to multi-petawatt powers in plasma”, 39th EPS Conference on Plasma Physics, Stockholm, July 2012.
E. Higson1,2, R. Trines2, R. Bingham2,3, and P.A. Norreys1,2,4 [1]University of Oxford [2] Central Laser Facility, [3] University of Strathclyde, [4] Imperial College London.

SCARF Annual Report 2011-2012
15/10/12 SCARF_Annual_Report_2011-2012.vfinal 47
4. 6BAPPENDIX: SCARF QUEUE USAGE 2011-12
A new reporting tool was deployed in May 2012 and hence there is no data before that period
Key:
• Red - number of jobs pending • Green – number of jobs running • yellow – number of jobs gathering CPUs so that they can run (large parallel jobs) • Blue - total number of Jobs (sum of Red, Green, Yellow)
4.1 31BGeneral SCARF Queue
Open to all SCARF Users with a capacity of ~1400 CPU cores
Figure 34: SCARF Queue Usage
The graph for the SCARF queue (and thus the combined SCARF/INTEL graph) shows consistently pending jobs for most of the year, which demonstrates that there is not sufficient capacity. This should be addressed by the next hardware procurement.

SCARF Annual Report 2011-2012
15/10/12 SCARF_Annual_Report_2011-2012.vfinal 48
4.2 32BSCARF-Lexicon[1-2] Queues
These queues are primarily for CLF use with a capacity of 292 and 544 CPU cores for SCARF Lexicon 1 & 2 respectively.
Figure 35: SCARF-Lexicon Usage
The graph for the SCARF-LEXICON queue shows peaky but significant usage, though this has dropped somewhat since the purchase of SCARF-LEXICON-2.
Figure 36: SCARF Lexicon-2 Usage
SCARF-LEXICON-2 is dominated by a large study from a user who submitted several hundred thousand jobs.
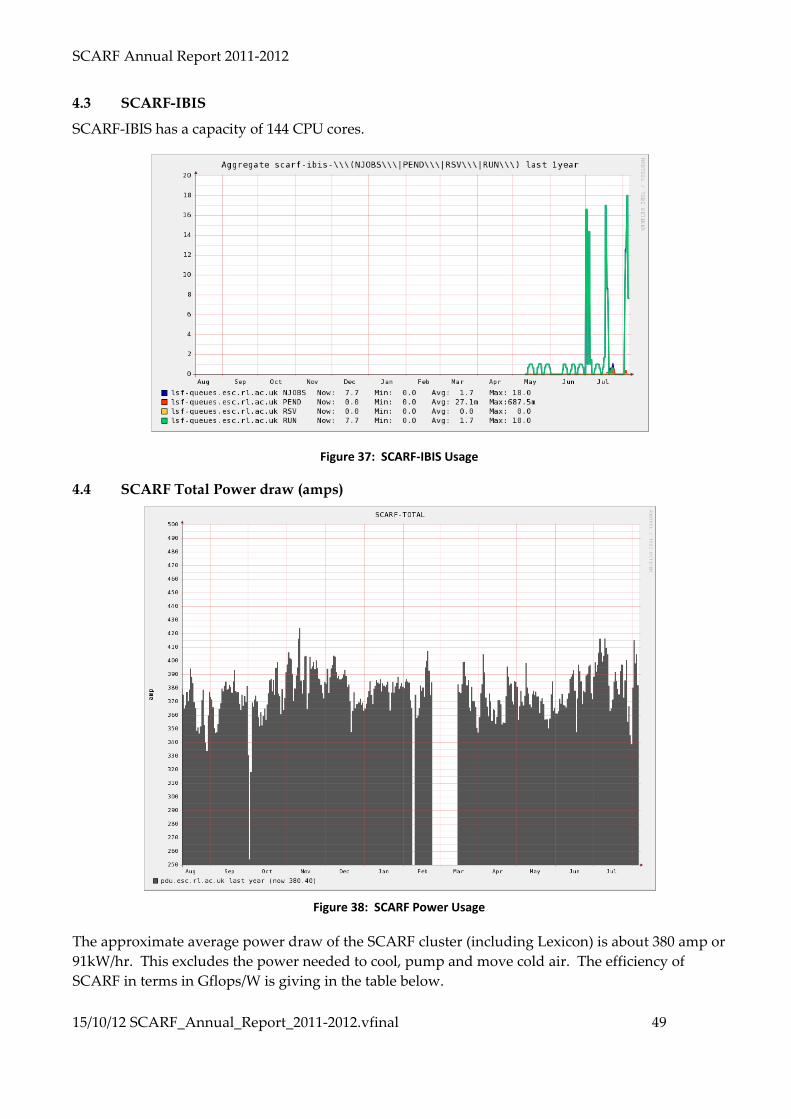
SCARF Annual Report 2011-2012
15/10/12 SCARF_Annual_Report_2011-2012.vfinal 49
4.3 33BSCARF-IBIS
SCARF-IBIS has a capacity of 144 CPU cores.
Figure 37: SCARF-IBIS Usage
4.4 34BSCARF Total Power draw (amps)
35B Figure 38: SCARF Power Usage
The approximate average power draw of the SCARF cluster (including Lexicon) is about 380 amp or 91kW/hr. This excludes the power needed to cool, pump and move cold air. The efficiency of SCARF in terms in Gflops/W is giving in the table below.

SCARF Annual Report 2011-2012
15/10/12 SCARF_Annual_Report_2011-2012.vfinal 50
Year Purchased Gflops/W 2006 0.07 2007 0.09 2008 0.21 2009 0.29 2010 0.32 2011 0.48 2012 0.50
Figure 39: GFlops/W for SCARF generations of equipment
From the above table it is clear that the Gflops/W achieved increase per generation of the SCARF equipment. This supports the continual refresh rate of SCARF hardware rather than a big bang approach.
4.5 36BFilesystem Usage
The plot below outlines the use of the Panasas filespace on the SCARF service. In Oct 2011 new hardware was procures and the migration of data took place during the Jan - March 2012. The Panasas storage was merged with the storage from the EMERALD GPU resource creating a larger and more performance system for both projects. Initial deployment issues (see section X1.2X) have mean that the combined storage of 5 shelves (2 SCARF and 3 EMERALD) is not yet fully available.
Figure 40: Filespace usage on the Panasas Storage
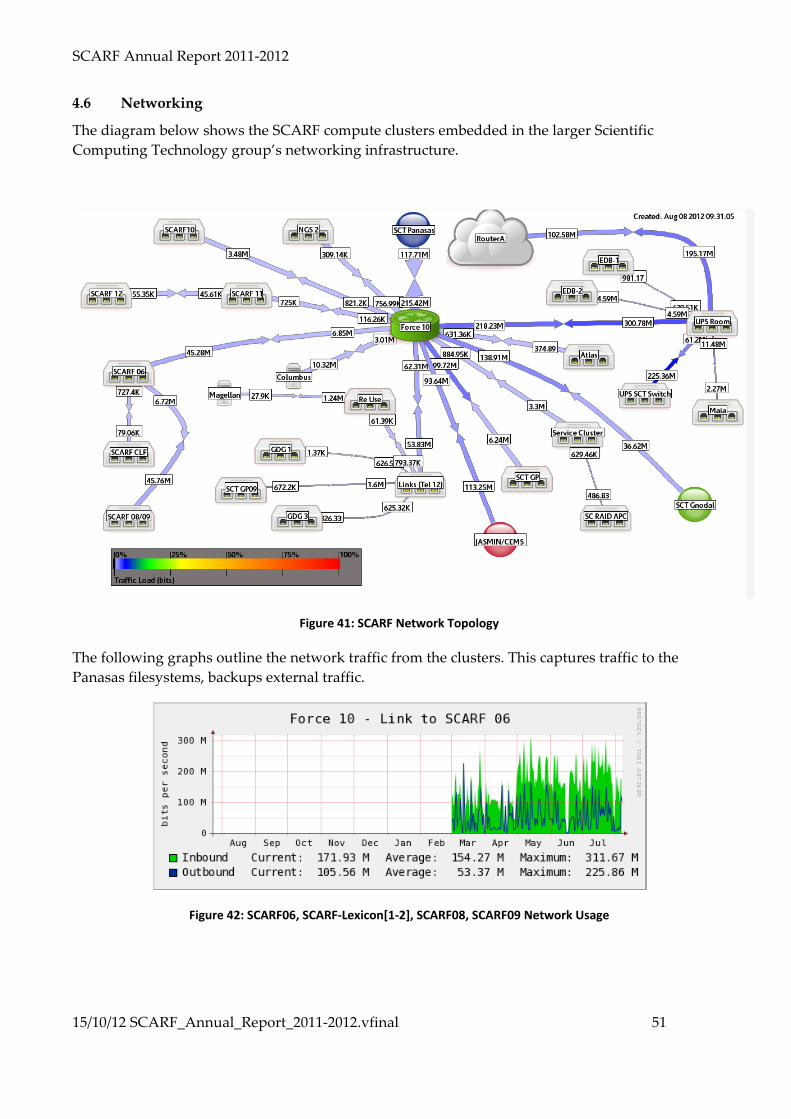
SCARF Annual Report 2011-2012
15/10/12 SCARF_Annual_Report_2011-2012.vfinal 51
4.6 37BNetworking
The diagram below shows the SCARF compute clusters embedded in the larger Scientific Computing Technology group’s networking infrastructure.
Figure 41: SCARF Network Topology
The following graphs outline the network traffic from the clusters. This captures traffic to the Panasas filesystems, backups external traffic.
Figure 42: SCARF06, SCARF-Lexicon[1-2], SCARF08, SCARF09 Network Usage

SCARF Annual Report 2011-2012
15/10/12 SCARF_Annual_Report_2011-2012.vfinal 52
Figure 43: SCARF10 Network Usage
Figure 44: SCARF11 and SCARF12
5. 7BAPPENDIX – SCARF DEVELOPMENTS
It has been a busy year for the SCARF service. Users’ will have noticed most impact with the additional of capacity and upgrades to applications. However, a lot of effort goes into improving the management of SCARF. SCARF is also part of NGS which allows users to use grid technology to access a larger pool of resources. 5.1 38BTechnical Developments
• The completion of the migration of the cluster nodes to RedHat 5 and LSF8 was completed in early August 2011,
• In Mid March the 2012 hardware tranche of 20 dual Intel x5675 nodes, providing 240 cores, was made available to users
• Also in mid March, we reorganised the layout of users' home directories moving from storing them in one volume in our Panasas system to a volume per user group. This allowed us to parallelise the backup of home directories reducing the amount of time spent backing them up.
• This migration of user's home directories also included a migration to 2 new Panasas ActiveStore 11 shelves, replacing the existing PAS-8 shelves, allowing us to increase the minimum home directory quota to 100GB per user.
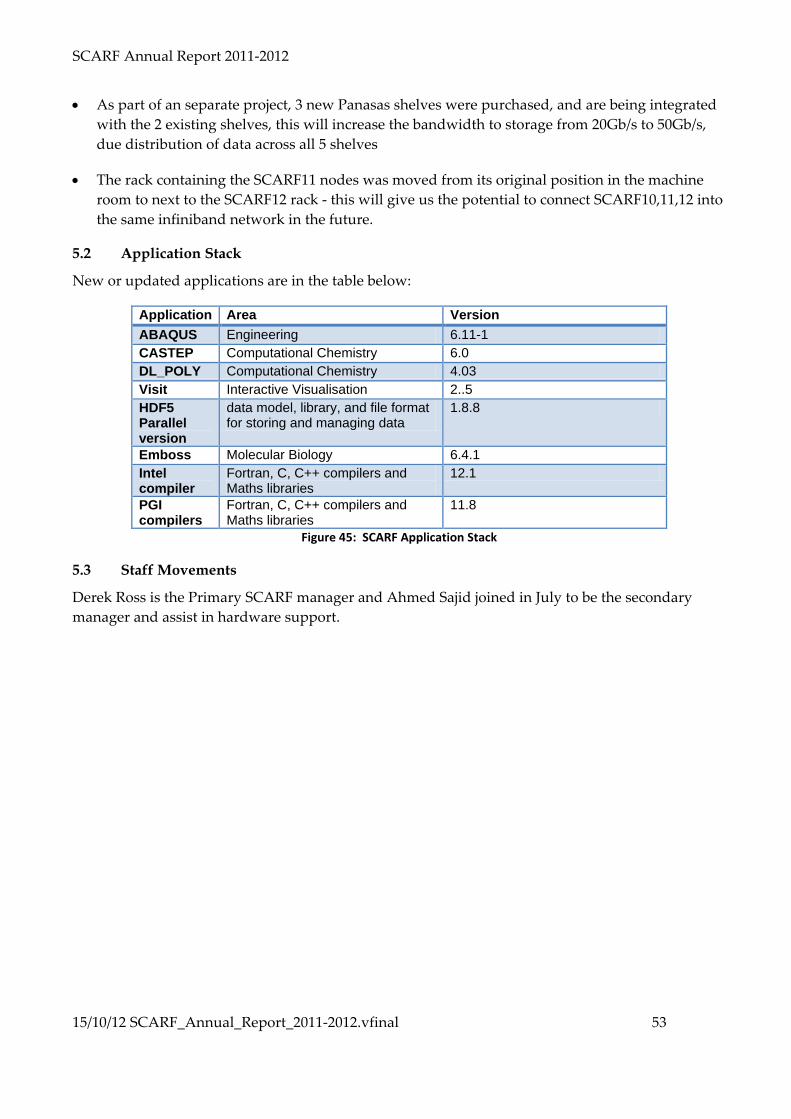
SCARF Annual Report 2011-2012
15/10/12 SCARF_Annual_Report_2011-2012.vfinal 53
• As part of an separate project, 3 new Panasas shelves were purchased, and are being integrated with the 2 existing shelves, this will increase the bandwidth to storage from 20Gb/s to 50Gb/s, due distribution of data across all 5 shelves
• The rack containing the SCARF11 nodes was moved from its original position in the machine room to next to the SCARF12 rack - this will give us the potential to connect SCARF10,11,12 into the same infiniband network in the future.
5.2 39BApplication Stack
New or updated applications are in the table below:
Application Area Version ABAQUS Engineering 6.11-1 CASTEP Computational Chemistry 6.0 DL_POLY Computational Chemistry 4.03 Visit Interactive Visualisation 2..5 HDF5 Parallel version
data model, library, and file format for storing and managing data
1.8.8
Emboss Molecular Biology 6.4.1 Intel compiler
Fortran, C, C++ compilers and Maths libraries
12.1
PGI compilers
Fortran, C, C++ compilers and Maths libraries
11.8
Figure 45: SCARF Application Stack
5.3 40BStaff Movements
Derek Ross is the Primary SCARF manager and Ahmed Sajid joined in July to be the secondary manager and assist in hardware support.