Embed Size (px)
Citation preview
Scarring effects of youth unemployment and informality Evidence from Argentina and Brazil*
Guillermo Cruces
Andrés Ham
Mariana Viollaz
April 2012
Abstract
This paper studies the effects of youth unemployment and informality on adult labor market
outcomes in Argentina and Brazil. We propose an econometric strategy based on cross-cohort
differences in youth labor market experiences in order to identify the effects of interest. The
main findings indicate strong and significant scarring effects: cohorts exposed to higher levels of
unemployment and informality in their youth fare systematically worse in the labor markets as
adults. However, the persistence and wage penalty effects are mainly present in the early years of
adulthood, and tend to dissipate with the passage of time. We also find that adverse effects are
stronger for workers with lower skills. The main contribution of these results is to add a further
dimension specific to developing and middle income countries – informality – to previous
studies of unemployment scarring in advanced economies.
JEL Classification: J24, J31, J64, O17
Key words: youth, unemployment, informality, scarring, Latin America
* This paper is part of the project: “Mercados laborales el crecimiento inclusivo en América Latina” supported by
IDRC and carried out at CEDLAS (www.labor-AL.org). The findings, interpretations and conclusions in this paper
do not necessarily reflect the views of the authors‟ affiliations.
Affiliation for Cruces, G: CEDLAS-UNLP, CONICET and IZA. Affiliation for Ham, A: University of Illinois at
Urbana-Champaign. Affiliation for Viollaz, M: CEDLAS-UNLP and CONICET. Corresponding author:
1
1. Introduction
Previous research on the labor market outcomes for young individuals is suggestive that
these workers tend to fare worse than adults. In particular, young workers earn lower wages, face
higher unemployment and have less access to formal jobs (Freeman and Wise, 1982; Weller,
2007; Bassi and Galiani, 2009). These results are not unusual at the beginning of the labor
market career when workers go to a search process that may result in high job turnover and
spells of unemployment. However, these findings have generated substantial interest in
determining whether these conditions have lasting effects into adulthood (usually referred to as
„scarring‟), or whether they gradually fade away and only temporarily „blemish‟ working lives
(Ruhm, 1991).
Possible explanations for the scarring effect of past labor market experiences can be found
in the human capital theory (Becker, 1994). The depreciation of firm-specific human capital and
the deterioration of general skills associated to a spell of unemployment can lead to lower future
wages and lower chances of finding employment. Since productivity is not perfectly observable,
those individuals with a history of unemployment may face a reduced probability of matching or
a lower wage offer if the employer uses this information as signaling low productivity
(Lockwood, 1991). Theories of job matching maintain that the unemployed may face an
increased probability of return to the labor market in a lower paid position suffering a cost-of-job
loss (Pissarides, 1994). Other explanations for the scarring effect are related to psychological
discouragement or habituation effects (Clark et al., 2001).
Most of the scarring literature has focused on the consequences of youth unemployment on
developed countries, finding that prolonged exposure to unemployment is associated with higher
future unemployment and lower wages1. However, in Latin American countries the unfavorable
conditions faced by young workers are not necessarily limited to unemployment. For instance,
most young workers begin their labor market experience in informal jobs (Hemmer and Mannel,
1989). These jobs have lower wages and are exempt from labor regulations and workplace
benefits when compared to the formal sector (Maloney, 2004). Notably, while informality may
be expected to be scarring based on these stylized facts, recent evidence has suggested that this
sector may actually serve as some sort of informal job training. Therefore, early experiences in
1 Section 2 reviews the literature on the relationship between youth labor market experiences and adult outcomes.
2
the informal sector need not harm an individual‟s career path in terms of employment prospects
or wages (Bosch and Maloney, 2010; Cunningham and Bustos, 2011).
In this context, this study aims to contribute to the literature on the role of the early career
labor market experiences on adult outcomes by analyzing how unemployment and informality
during youth are related to adult unemployment, informality and wages in Argentina and Brazil.
The estimates will provide empirical evidence on scarring from youth in a region where less
work has been carried out. This lack of evidence mostly responds to the requirement of long-
term panel data to measure scarring. However, this information is not widely available in Latin
America. This study proposes a suitable alternative, since the analysis may be feasibly conducted
using pseudo-panels which track birth cohorts. Thus, we use cross-cohort differences as the main
source of variability for identification, in contrast to previous studies that rely on different
individual labor market experiences within a single cohort.
The main findings show that youth unemployment and informality do have effects on adult
labor market outcomes. The state dependence and wage penalty effects are mainly present in the
early years of adulthood and tend to disappear with the passage of time. These results are also
different for adult individuals of different skill levels. Those with lower skills experience higher
wage losses and larger persistence effects.
The rest of this paper is organized as follows. The next section reviews the available
literature on the relationship between youth labor market experiences and adult outcomes.
Section 3 introduces the data and Section 4 the estimation framework. Section 5 presents a
descriptive analysis of the main labor market trends for the selected cohorts. Section 6 tests for
evidence of an empirical relationship between youth unemployment and informality on several
adult labor market outcomes. The last section concludes by drawing together the findings and
discussing their potential policy implications.
2. Literature Review
The school-to-work transition remains an important issue in developed and developing
countries. In general, this research suggests that early experiences in the labor market shape
individuals‟ paths when they become full-time employed adults (Nordstrom, 2011). In particular,
the majority of studies have focused on the effect of job stability (or „churning‟), unemployment,
3
and more recently, the type of employment into which young workers are generally inserted –
formal or informal– on adult outcomes such as wages and employment (or unemployment)
prospects.
Job stability during the initial years of employment and its consequences have been studied
by Holzer and LaLonde (1999), who find that increased tenure has a positive short-term effect on
employment for young workers, since instability usually declines as workers grow older. They
argue that churning amongst young workers is mostly due to the difficulty of finding a proper
employment match in the first job. In fact, Neumark (2002) suggests that the earnings gain
associated with one additional year of experience for young workers lies between 7-13% for men
and 12-24% for women in the US, which may reveal that obtaining a good match instead of
shopping around has its advantages.
Several studies have also focused on the consequences of unemployment on future
unemployment and subsequent earnings at all ages, with mixed evidence.2 For instance, Ruhm
(1991) initially found no evidence of unemployment scarring using data from the Panel Study of
Income Dynamics (PSID) for all workers. However, Jacobson et al. (1993) do find that displaced
workers present evidence of scarring and that this effect is relatively stable across the age locus.
However, since unemployment is higher during youth, several authors have questioned whether
scars from joblessness in this period are more relevant.
This research has found significant evidence of a relationship between youth
unemployment and future labor market outcomes. However, Gregory and Jukes (2001) make the
distinction that unemployment by itself is not the most relevant cause of lower future earnings,
but unemployment duration. In particular, they find that a one-year spell implies a wage penalty
of 10 percentage points for British men, which is also found by Gregg (2001). Arulampalam
(2000) looks at the effects of unemployment on re-employment wage using the British
Household Panel Survey. He finds that an unemployed individual on returning to work will earn
about 6% less in the first year and 14% less in the fourth year. Fairlie and Kletzer (2003)
estimate the (annual) wage loss from exposure to unemployment for men and women using the
National Longitudinal Survey of Youth and they show that it is 9% and 12.5%, respectively.
Gregg and Tominey (2005) find more pessimistic results: that longer spells of unemployment in
Britain have a wage penalty of 9-21% up to twenty years later. Mroz and Savage (2006) show
2 See Arulampalam et al. (2001) for a review of unemployment scarring.
4
that early unemployment affects both future job displacement and earnings up to ten years after
youth in the US. Using a multivariate duration model that controls for selection on observables
and unobservables, Cockx and Picchio (2011) find that prolonging unemployment drastically
decreases the chances of finding employment, but hardly affects the wage in subsequent
employment among young individuals who are already long term unemployed in Belgium.
Nilsen and Reiso (2011) analyze the relationship between past unemployment and future
labor market status (unemployed or out of the labor force) using a panel data of young workers
from Norway. They use a nearest-neighbor propensity score matching method to balance their
treatment and control groups and find that unemployment leaves young workers with long term
scars that decrease over time. Burgess et al. (2003) examine whether aggregate unemployment at
entry into de labor market impacts on later unemployment in Britain. Using a pseudo-panel
approach they find evidence of adverse effects for the unskilled and small beneficial effects for
the more skilled individuals.
The scarring effects from youth are not limited to instability and unemployment. A series
of recent studies have also begun to place attention on the effects of the first job held during
youth. Mainly, this literature has focused on the effect of having an informal job on future
employment prospects and wages. Young workers (mostly in developing countries), usually
begin their labor market experience in informal jobs (Hemmer and Mannel, 1989). In theory,
expectations would lead to assume that an initial employment experience in the informal sector
may perpetuate informality and hinder future earnings, since the probability of migration to the
formal sector is generally low as are the wages paid in that sector (Perry et al., 2007). However,
the evidence remains inconclusive on this matter and has been identified as a key area for further
research (Maloney, 2004). Some of the studies in this direction include Bosch and Maloney
(2010), who find that the informal sector provides young workers with training and experience
for better jobs that they could not obtain right out of school. Cunningham and Bustos (2011)
support this claim, arguing that young workers are only temporarily employed in the informal
sector and then move on to formal jobs once the premiums placed on health benefits and job
stability increase as they establish families. Moreover, they find that initiating the labor market
experience in the informal sector does not necessarily imply that workers will remain in that
sector, at least not permanently.
5
In summary, the previous literature suggests that early labor market experiences matter.
However, there are still some topics to address. First, while there is predominant evidence of
scarring for developed countries, evidence for developing countries and mainly Latin America is
less available. Youth experiences are particularly important in Latin America, since the
population in this region is relatively young on average (Brea, 2003). Second, while informality
may not be a significant concern in the US and OECD countries, Latin America has experienced
a large increase of the informal sector in the last decades (Gasparini and Tornarolli, 2009). Third,
the potential effects of youth insertion into the labor market are even more interesting in the
aftermath of the global recession, which some argue may have lasting consequences on those
currently entering the labor market (Bell and Blanchflower, 2010). This paper contributes to
these discussions by analyzing unemployment and informality scarring for two Latin American
countries, Argentina and Brazil. The findings will provide evidence on the labor market
experience of the youth and its future outcomes as adults, providing a backdrop to frame the
potential effects of the current aggregate labor conditions in the region on those currently
entering the labor force.
3. Data
3.1 Household surveys
The estimates in this paper are drawn from a large database of household surveys, the
Socio-Economic Database for Latin America and the Caribbean-SEDLAC (CEDLAS and World
Bank, 2011), compiled and homogenized by CEDLAS (Universidad Nacional de La Plata) and
the World Bank‟s LAC poverty group (LCSPP).3 These surveys have the advantage of being
comparable between countries, since most of the variables are homogenized using the
methodology in Gasparini (2011).4 For this study, we select a time series of household surveys
from Argentina and Brazil that include complete information on labor market variables such as
informality5, employment status and wages since the early 1980s.
3 See < http://sedlac.econo.unlp.edu.ar/eng/index.php>.
4 The methodology aims to generate maximum homogeneity, although some surveys are not entirely comparable. In
this paper, all variables used are comparable unless otherwise noted. 5 We use the legalistic perspective of informality and classify a worker as informal when he does not possess the
right to receive a pension when retired.
6
Argentina and Brazil provide an excellent framework to study the role of early labor
market experiences on adult outcomes in Latin America. First, the availability of an extended
time series of household surveys allows us to construct birth-cohorts from youth into adulthood,
covering a large part of adult working life. Second, in these countries young individuals have
experienced high levels of unemployment and informality. Therefore, the evaluation of the
potential effects of youth insertion into the labor market is an interesting topic of analysis from a
policy perspective. The prevention of youth unemployment and informality may have a long
lasting effect, preventing actual and future unemployment or informality for young individuals if
it succeeds or generating long run costs if it fails.
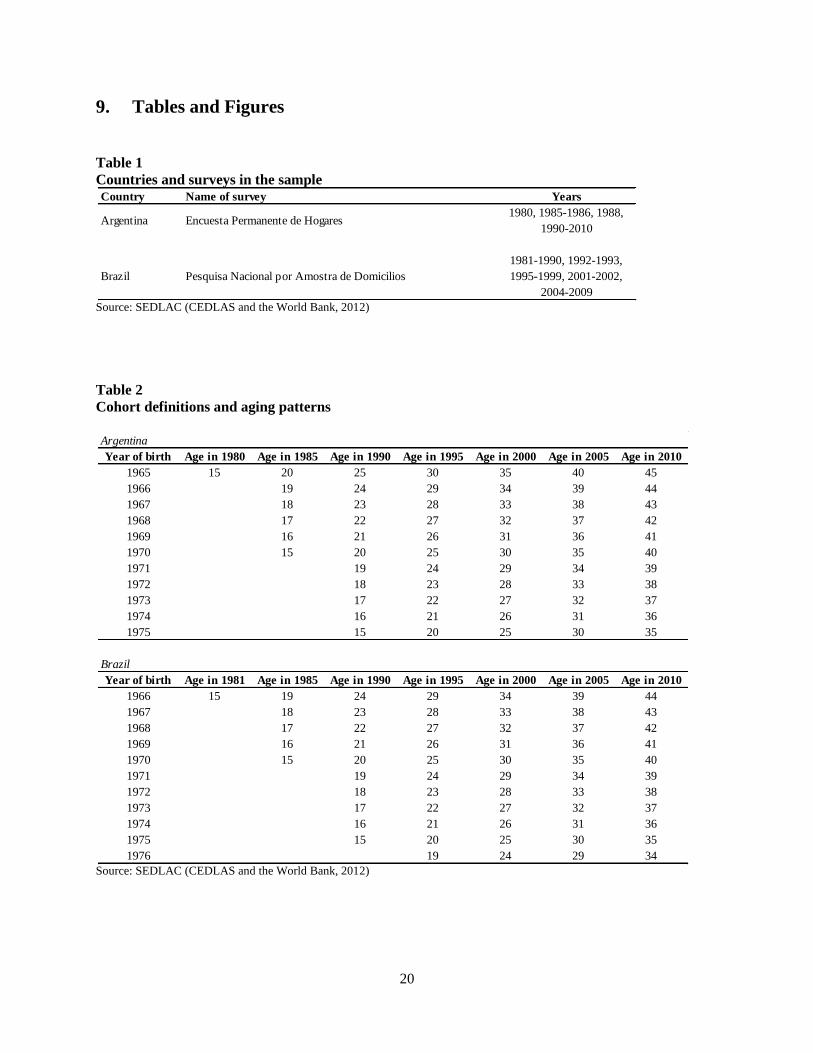
Table 1 lists the specific surveys used in the analysis spanning from 1980 (1981) to 2010
(2009) in Argentina (Brazil). This framework, which comprises 25 years for each of the
countries, provides the opportunity to assess both short and long term consequences of youth
labor market experiences on adult outcomes.
Since the Argentinean household survey was conducted only in the Greater Buenos Aires
area during the eighties, we restrict the analysis to this geographic region for the whole period.
The number of surveyed individuals went from 12,355 in 1980 to 16,505 in 2010 in the Greater
Buenos Aires. In Brazil, the number of individuals covered by the survey was of 482,198 in 1981
and 399,387 in 2009.
3.2 Constructing cohorts
The analysis of the relationship between past labor market experiences on adult labor
market outcomes requires tracking individuals over time. Although the available data does not
have a panel structure, we can track cohorts of individuals, with cohorts defined according to
their year of birth, or more conveniently, by their age in 1980 (Argentina) or 1981 (Brazil).
Table 2 defines the selected cohorts and describes their aging process throughout the
timeframe. The first cohort is comprised of individuals born in 1965 (Argentina) or 1966
(Brazil), who are aged 15 in the first available survey (1980 in Argentina and 1981 in Brazil).
The second cohort contains individuals born in 1966 (Argentina) or 1967 (Brazil) who are aged
15 in the second available survey. The following cohorts are defined in the same manner as more
data become available. In the last period of observation we have individuals between 35 and 45
years old in the case of Argentina or between 34 and 44 in the case of Brazil. We define youth as
7
ages 15-24, and adulthood as 25 or older. Therefore, we can learn about youth labor market
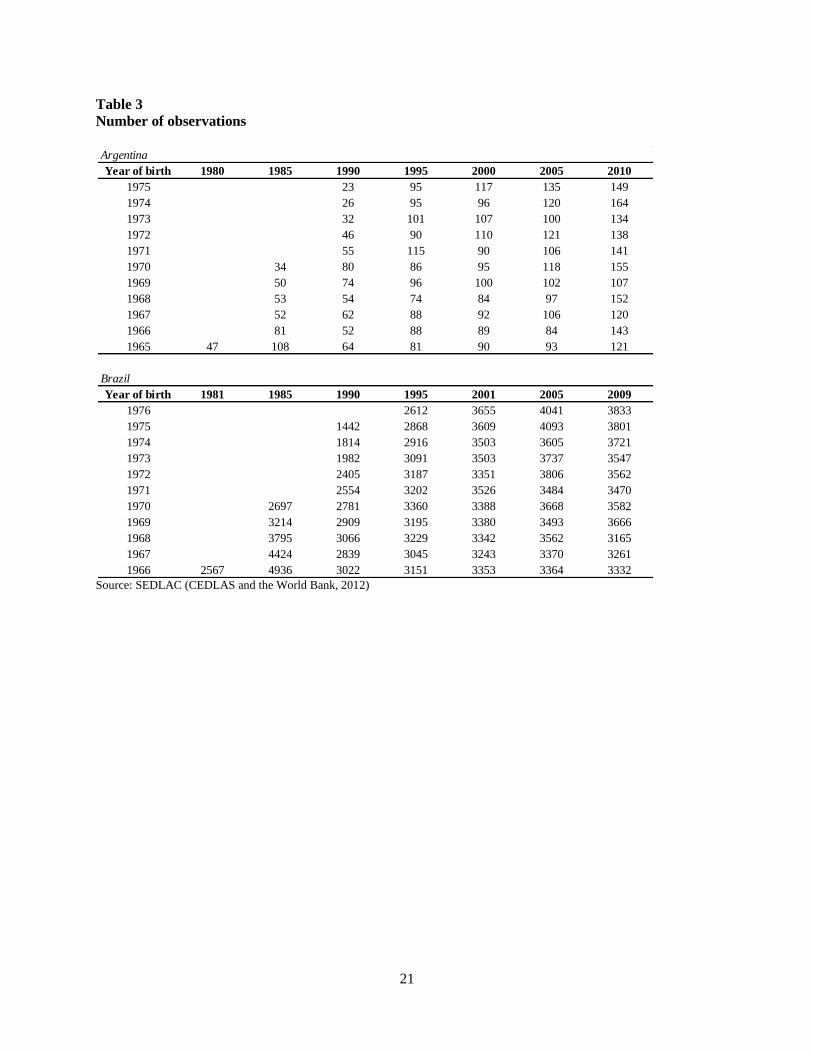
experiences for individuals in each birth cohort. Table 3 presents the number of individuals in
some of the cohort/year cells.
To avoid potential biases from individuals still in school, the sample does not include
those who are still attending formal education, who do not earn wages and individuals with
incomplete or invalid data on the variables of interest. We also restrict the sample excluding
those who are self-employed due to the potential problems associated to the measurement of
hourly wages and their informality status for this employment category. Following Deaton and
Paxson (1994), we average the variables of interest by age of individuals for each year of data,
and then track the sample one year older in the next survey according to the aging process shown
in Table 2. In this way, we can follow cohort means for twenty five years for each birth cohort of
individuals.
3.3 Between-cohort identification
This data allows identifying whether the experiences of each cohort in their youth show
evidence of lasting impact on adult labor market outcomes. Certainly, while observing
trajectories on individual-level panel data would be ideal, the availability of this kind of
information in the region is limited. In turn, cross-sectional data are recollected periodically in
most Latin American countries, regularly twice a year or at least annually. Therefore, repeated
cross-sections for a long timeframe present a unique opportunity to study the dynamic process of
scarring from youth experiences in Argentina and Brazil. To this end, we use between-cohort
variation for identification in contrast to previous studies that rely on different individual labor
market experiences within a single cohort.
The use of variation in labor market experiences at cohort level as the main source of
variability relies on the assumption that employers can substitute between individuals of different
ages at each point in time. Note that this assumption does not apply to a labor market that
exclusively employs a single cohort like the youth labor market (Burgess et al., 2003). However,
in this paper we define youth from 15 to 24 years old and the cohorts are defined as just 1-year
band, allowing the substitution in this age range in the youth labor market.
Another important feature of the cohort analysis is the response of labor market outcomes
to cohort size. For instance, smaller cohorts have incentives to increase their human capital
8
investment because the returns will be higher. On the contrary, those belonging to a large
generation are likely to find a depressant effect on earnings when entering to the labor force
(Ermisch, 1995). Given that our cohorts are defined at the most disaggregated level, we do not
expect that our findings are explained by this cohort size effect.
Using this data provides other advantages over traditional panel data (Antman and
McKenzie, 2007). First, in a long-term analysis, longitudinal data has the common problem of
sample attrition since it is difficult at best (and costly) to track individuals for long periods of
time. In this paper, scarring is evaluated throughout most of the adult life and also by short and
long term periods. Second, repeated cross-sections provide more stability for analyzing long-
term outcomes, omitting biases due to transitory shocks and short-run movements.
However, using repeated cross-sections also has some limitations. On the one hand,
pseudo-panels do not provide information on intra-cohort dynamics (Deaton, 1997). On the other
hand, since using this data implies estimating relationships at cohort level, this aggregation may
be a potential source of bias. We do not expect this to be a significant problem here, since
cohorts are tracked for a long period of time and the assumption that events like migration and
death do not alter the representativeness of each of the independent survey samples seems likely
to hold.
4. Empirical strategy
The birth cohort data previously described is used to obtain parameter estimates of two
youth labor market outcomes -unemployment and informality- on diverse adult outcomes –
unemployment, informality and wages-. Youth labor outcomes are captured by the average level
of unemployment or informality faced by each cohort during their youth (ages 15-24). Our main
model for adult people is given by the following equation
𝑌𝑐𝑡 = 𝑋𝑐𝑡𝛽 + 𝑍𝑐𝛿 + 𝑇𝑡𝛾 + 𝜂𝑐 + 휀𝑐𝑡 (1)
where Yct is the adult labor market outcome of interest (unemployment rate, informality rate or
log of hourly wages) at time t; Xct contains the average of individual characteristics within each
cohort/year cell such as gender, age and its squared, years of education, civil status, the average
9
of individuals that are household heads, and the mean number of children under 15 at home; Zc
captures the youth labor market experience faced by each birth cohort; Tt accounts for time
effects and ηc is the cohort unobserved heterogeneity (e.g. unobserved cohort propensity to
remain unemployed). ɛct is the idiosyncratic error where
𝐸 휀𝑐𝑡 𝑋𝑐𝑡 ,𝑍𝑐 , 𝜂𝑐 = 0 t=1,…,T (2)
In order to estimate the parameter of interest δ we face three econometric issues. First, the
identification of the causal effect of past unemployment or informality on adult labor market
outcomes is hard due to the cohort unobserved heterogeneity. Then, we cannot be confident
about the estimated parameters by an ordinary least squared (OLS) regression if we expect the
youth labor market variable Zc to be correlated to the unobserved heterogeneity at the cohort
level ηc.
Although the inclusion of birth cohorts fixed effects would allow us to control for
characteristics that are time-constant within each cohort, we have to consider that the variable of
interest has the same level of aggregation. This brings us to the second issue: there is no way to
distinguish the effect of the time-constant observable Zc from the time-constant unobservable ηc.
Finally, the third problem is related to the nature of our constructed data set. Age, cohort
and time are linearly dependent variables and the associated coefficients are not identified, even
when one category is dropped from each set of dummies (Deaton and Paxson, 1994). To deal
with this last issue we assume that time-effects impact proportionally on all age/cohorts cells. In
this way, we redefine the dependent variable Yct as in Burgess et al. (2003) where Yct is
normalized by the observed value of Y at date t. We rename this variable as 𝑌 ct, thus equation (1)
becomes
𝑌 𝑐𝑡 = 𝑋𝑐𝑡𝛽 + 𝑍𝑐𝛿 + 𝜂𝑐 + 휀𝑐𝑡 (3)
In light of this discussion we proposed two alternative estimation strategies. First, we define a
composite error term vct= ηc + ɛct, and estimate equation (3) by pooled OLS assuming
10
𝐸(𝑍𝑐′ 𝜂𝑐) = 0 (4)
Even when (4) holds, the composite errors will be serially correlated due to the presence
of the time-constant term ηc. Therefore, we make inference based on a robust variance matrix
and robust test statistics. Note that this first empirical strategy deals with the second econometric
issue defining a composite error term, while the first one is set aside at the price of making an
additional assumption. If (4) does not hold we expect a positive bias in our estimations. The
reasoning is as follows: the effect that the unobserved birth-cohort effect would have on the
explained variable (e.g. adult unemployment rate) should be of the same sign that the correlation
between the cohort effect and the explanatory variable of interest has (youth cohort
unemployment in this example).
The second strategy follows a two step estimation technique as in Burgess et al. (2003).
In the first step we estimate (3) excluding the variable of interest Zc but allowing the presence of
time-constant birth cohort effects ηc. The exclusion of the variable of interest allows us to control
for the first and the second econometric issues estimating the following model
𝑌 𝑐𝑡 = 𝑋𝑐𝑡𝛽 + 𝜂𝑐𝜌 + 휀𝑐𝑡 (5)
In the second step we regress the estimated birth-cohort fixed effects on the variable of interest
Zc. The estimated birth-cohort fixed effects capture the part of the variation on adult labor market
outcomes that can be explained by time-constant factors. The estimation of λ in the second step
isolates the part of that birth-cohort component that is correlated with youth labor market
experiences
𝜌 𝑐 = 𝑍𝑐𝜆 + 𝜗𝑐 (6)
Because the dependent variable in this second step is estimated, we estimate equation (6) by the
method of weighted least squares, using the inverse of the estimates of the variance of the birth-
cohort fixed effects from the first step as weights.
It is worth noticing that the estimation strategy just described faces the unobserved
heterogeneity problem by means of a two step estimation technique. This feature leads us to
11
contrast these results with that obtained with the first estimation strategy, where we made the no
correlation assumption (4). If we observe the same relationship between youth and adult labor
market outcomes, this would be suggesting that cohort effects are not confounding factors
affecting the results in the analyzed countries.
An important point of the empirical strategy is that the analysis assumes that youth labor
market experiences have an average effect over the entire adult life. This is a simplifying
assumption, since it is possible that while youth experiences may have no effect when
considering an individual‟s entire adult life, they may temporarily affect labor market outcomes.
Therefore, the setup needs to be expanded to include potential heterogeneities across the life
cycle. A categorical variable was created to capture these potential adverse effects across
adulthood. This variable has two categories which denote the passage of time: up to 10 years
after youth and between 10 and 20 years after youth. Indicator variables for each of these
categories were interacted with the youth labor market experience variable (Zc) to estimate
equation (3) above. These results will provide an indication of the short and long term
consequences of youth experiences on adult outcomes to determine whether youth
unemployment and informality represent temporary penalties or if the effect is observed many
years later.
The effect of youth labor market experiences could also be different for adult individuals
of different skill levels. We carry out this analysis allowing the effect of the variable of interest
to vary according to the years of education of adult individuals. We expect that any scarring
effect will be less for those individuals with higher skills.
5. Youth labor market outcomes: A descriptive analysis
Before moving on to the econometric results, we observe the evolution of the normalized
labor market outcomes of interest for some selected cohorts against age groups, separately for
males and females. In order to illustrate more clearly the patterns, we only include three cohorts
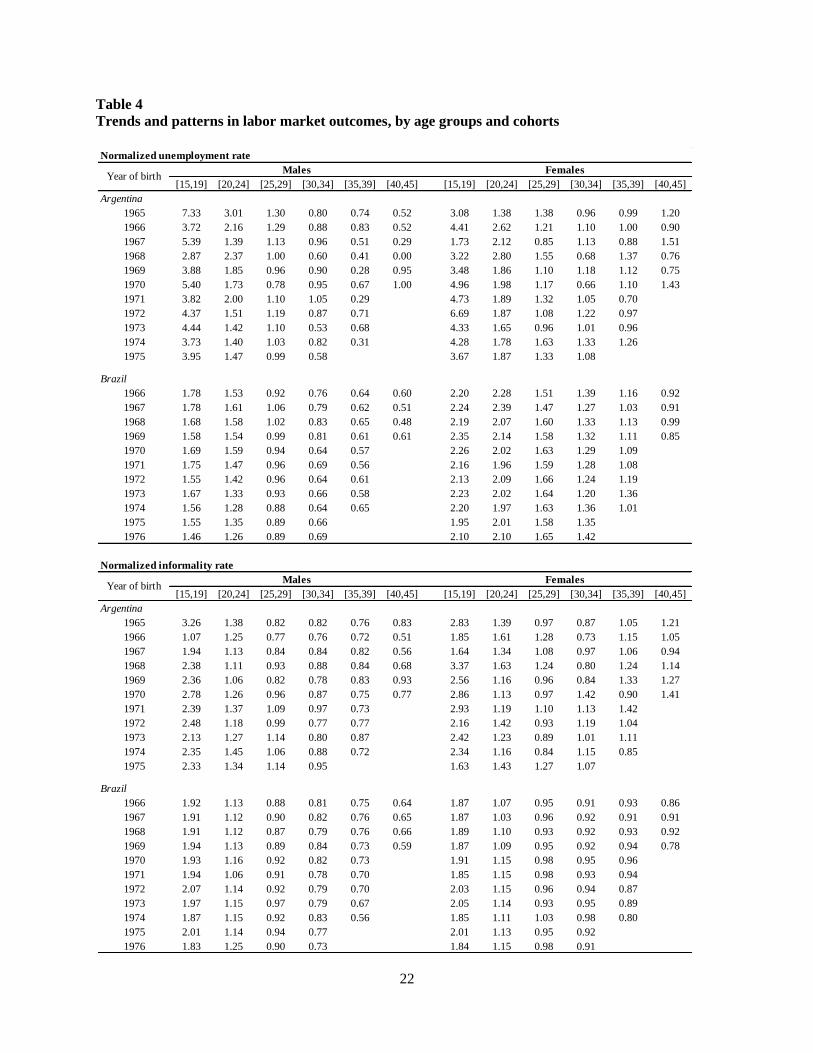
in the figures: the first, the last and the middle cohort. The averages are presented in Table 4 and
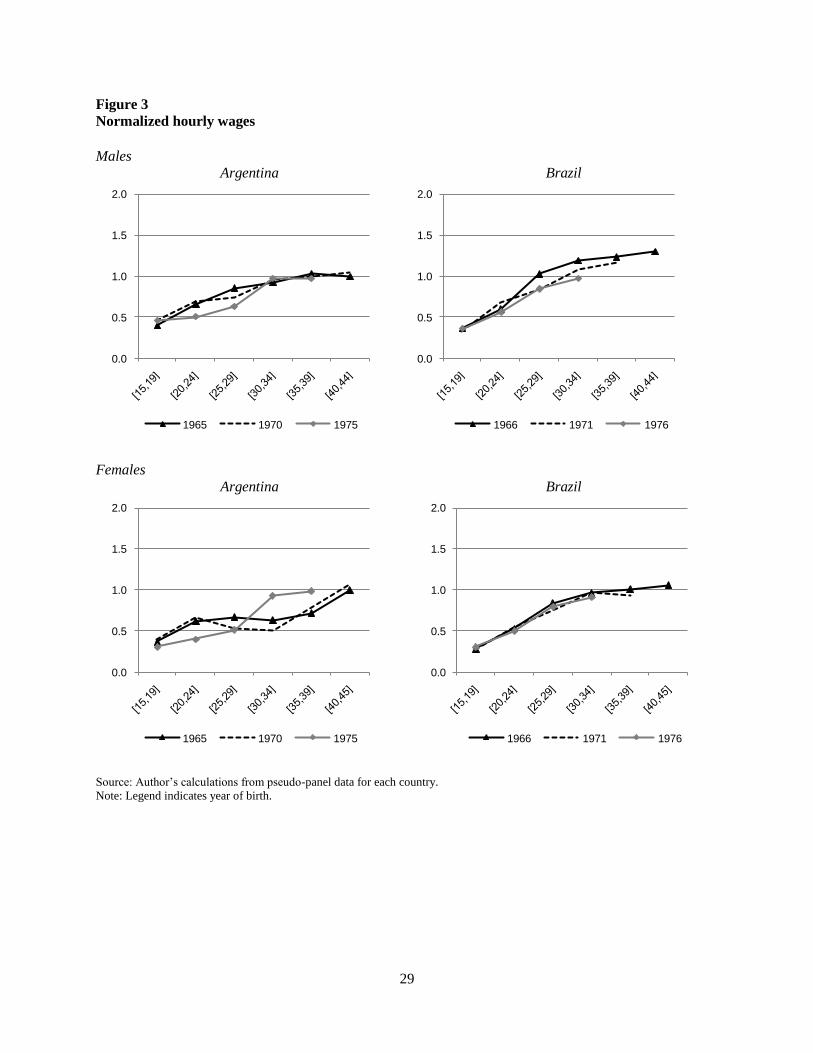
the same information is plotted in Figures 1 through 3.
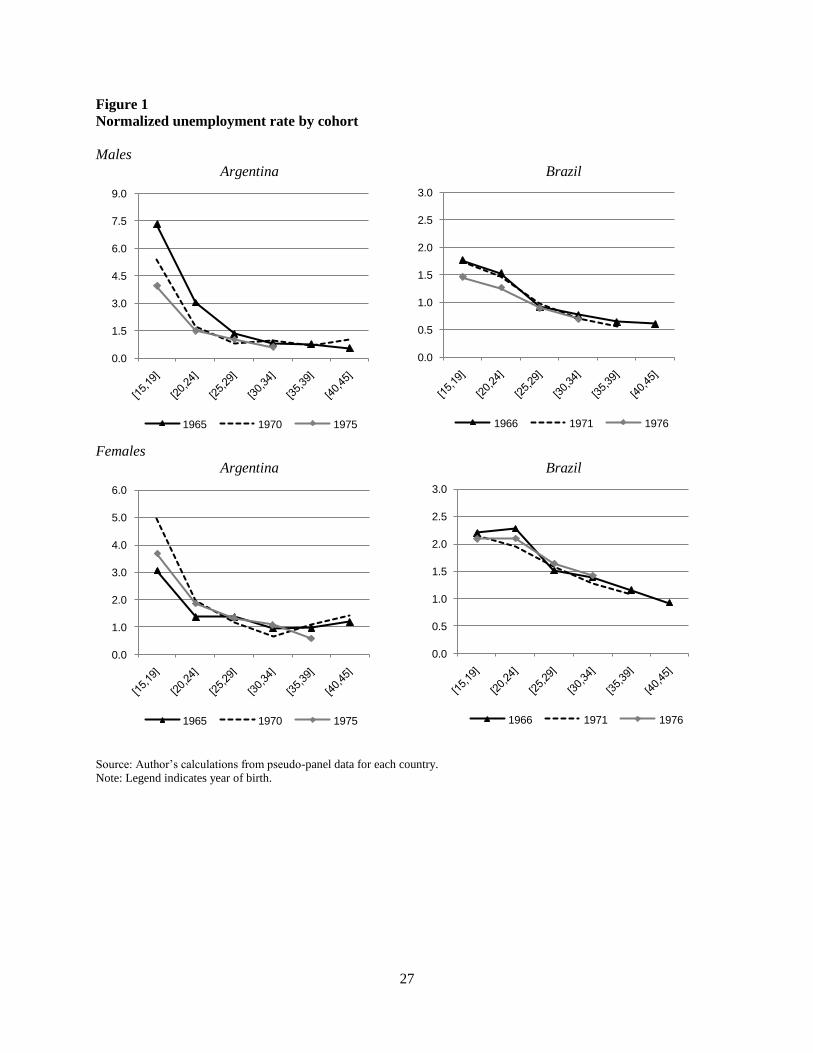
Figure 1 presents the trends in the normalized unemployment rate. The male
unemployment rate falls rapidly with age and stabilizes around the thirties. This pattern is less
12
marked in Brazil where the normalized unemployment during youth is not as high as in
Argentina. It is important to note that individuals in the 15-19 age range in this country
experienced an average unemployment rate seven times higher than the economy wide average.
This value corresponds to the oldest cohort that entered the labor market at the early eighties
when the economy wide unemployment was around 5%. By contrast, the youngest cohort
entered into the labor market at the early nineties with a total unemployment rate over 10%. That
means that young individuals in the newest cohort experienced higher unemployment levels in a
context of high economy wide unemployment.
The age-decreasing unemployment pattern is less marked for females in both countries.
While women in Argentina reach and unemployment rate similar to the national average around
30-34 years old (like Argentinean men), in Brazil female unemployment rate is over the national
value until the 40-45 age range. This last result reveals that the distribution of the normalized
unemployment rate for women is over that of men in Brazil.
In summary, the trends in the normalized unemployment rate show very different youth
experiences across cohorts, especially in Argentina, and signs of convergence as individuals get
older. But those cohorts with higher normalized unemployment during youth tend to show higher
normalized unemployment during adulthood, with smaller differences across cohorts around
adult age ranges.
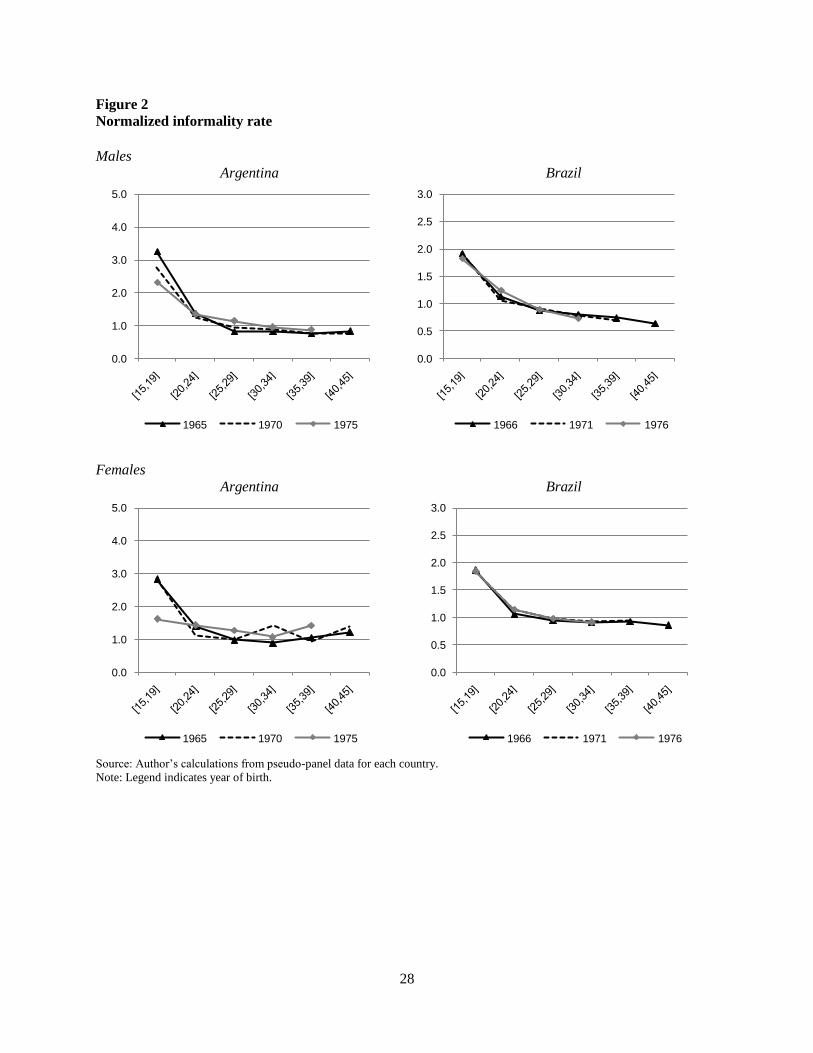
The normalized informality rate also displays an age-decreasing pattern both for males and
females, in Argentina and Brazil (Figure 2). The behavior of this labor market outcome is very
similar across cohorts in Brazil. Men and women reach the national average rate around the 25-
29 age range, but while men continue in an age-decreasing informality pattern, women stabilize
near the national value as they age. In Argentina, the oldest cohort shows a higher informality
rate for the 15-19 age range among men. This pattern can be explained by the relatively low
informality level at the early eighties –when the oldest cohort entered into the labor market- in
comparison with the rest of the period.
As in the normalized unemployment rate case, we find that cross-cohort differences in the
normalized informality rate are more marked in youth and they get reduced as people age.
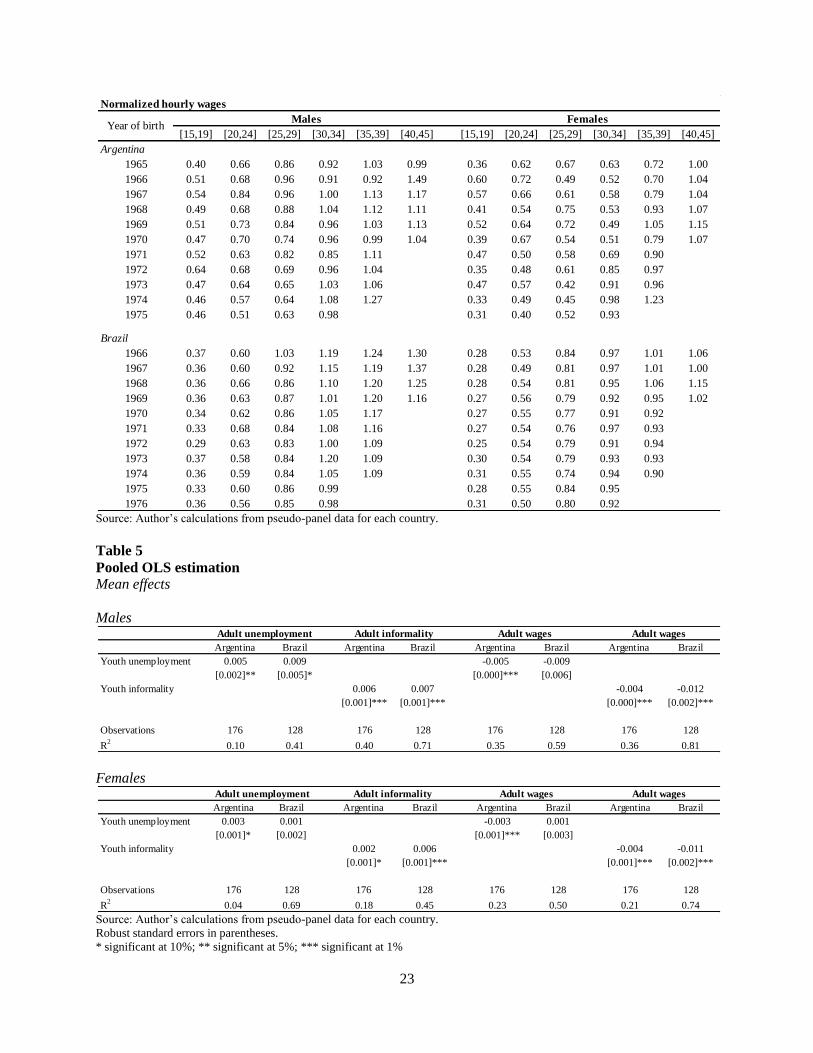
Finally, Figure 3 plots the trends in normalized hourly wages. Hourly wages clearly
increase with age and stabilize around the 40-44 age range. The youngest cohort shows lower
normalized wages across the age locus for males and females in Brazil and males in Argentina.
13
While in Argentina the normalized wage of the youngest cohort of men shows signals of a
catching-up response, this is not true in Brazil where the wage gap between the youngest and the
oldest cohort widened over time. In contrast to previous labor outcomes, wage differences across
cohorts get larger with age, and this behavior is particularly marked in Brazil.
All these findings provide a description on the relationships this paper seeks to study. On
the one hand, normalized unemployment and informality showed signs of convergence as
individuals get older, and in some cases those cohorts with higher normalized
unemployment/informality rates during youth tend to show higher normalized
unemployment/informality rates during adulthood. A different pattern was found in the case of
normalized hourly wages. While cross-cohort differences got larger with age in Brazil, the
behavior is not clear in Argentina. On the other hand, we observed very different youth
experiences across cohorts, reinforcing the use of between-cohort variation for identification.
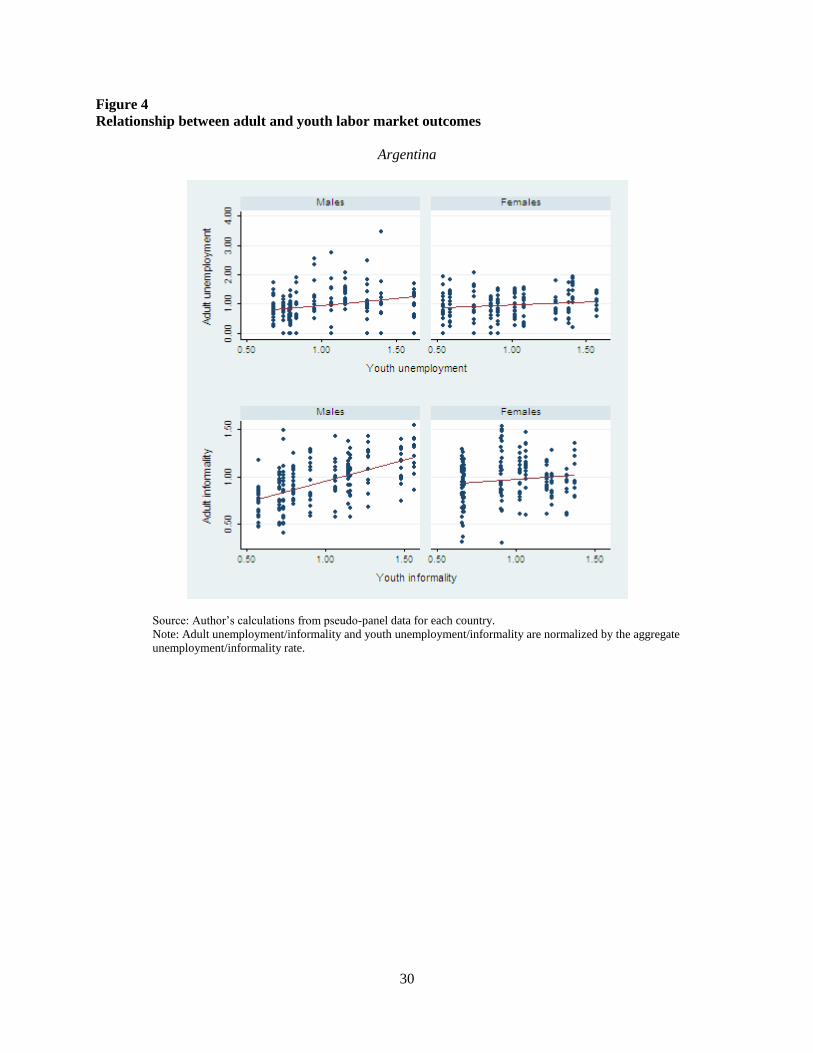
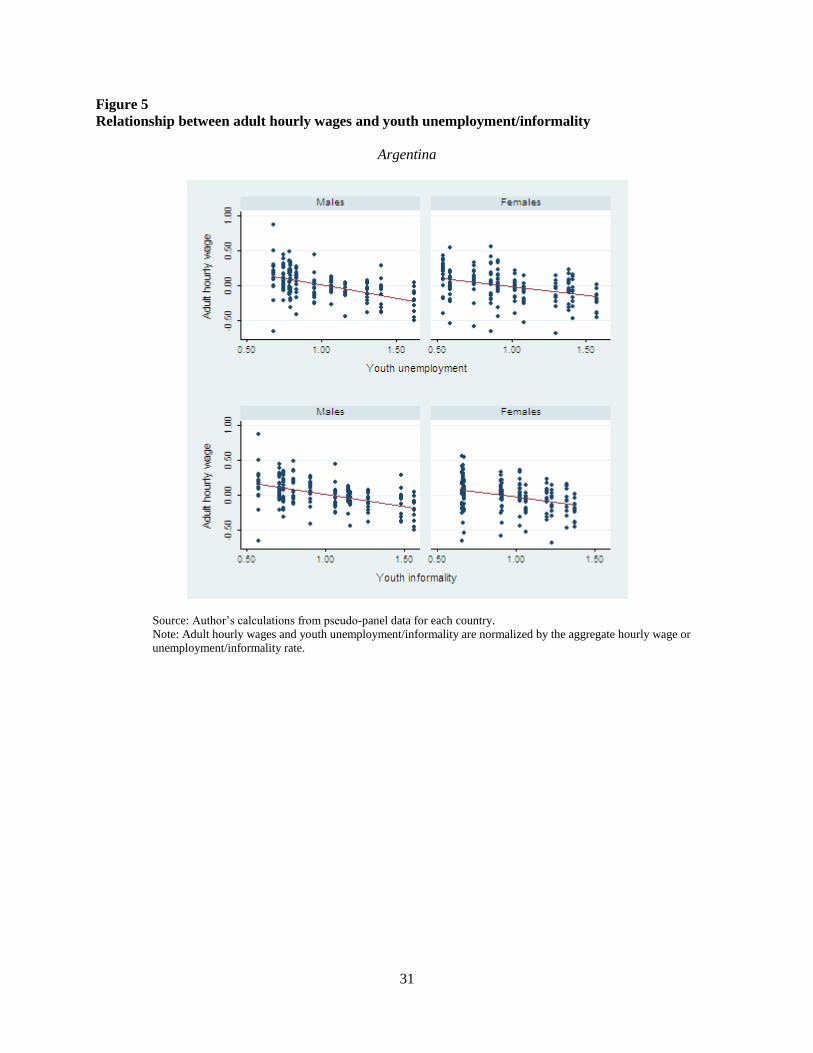
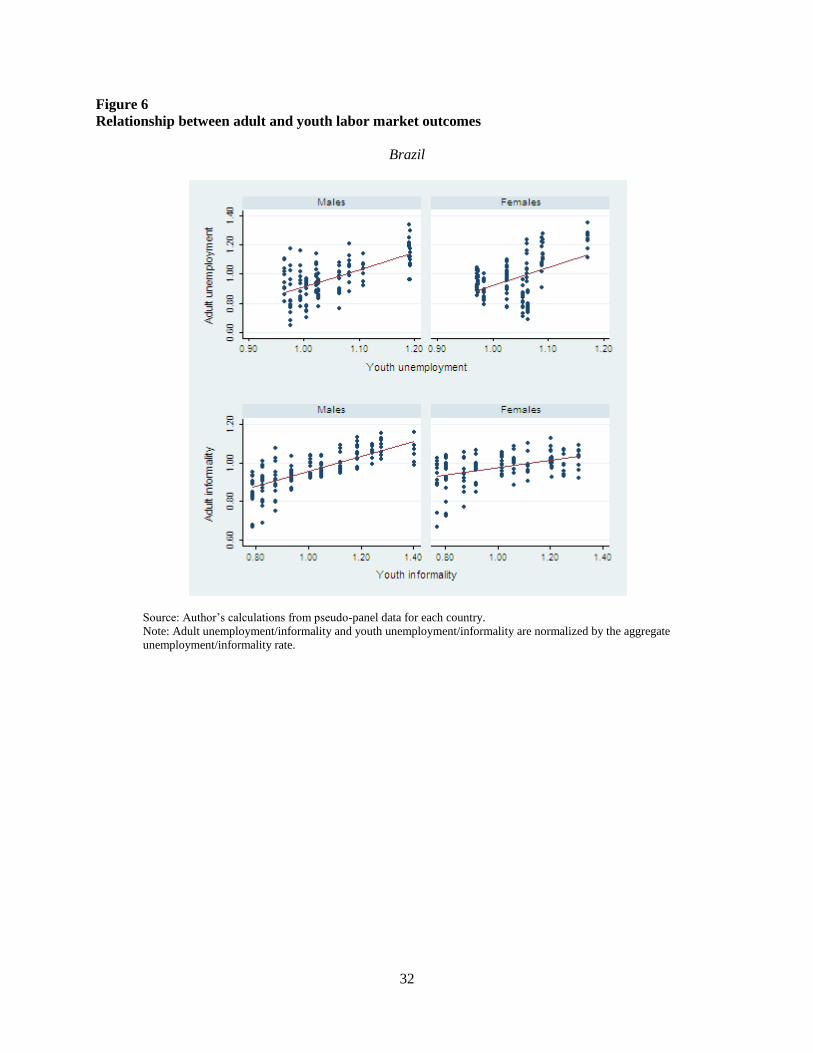
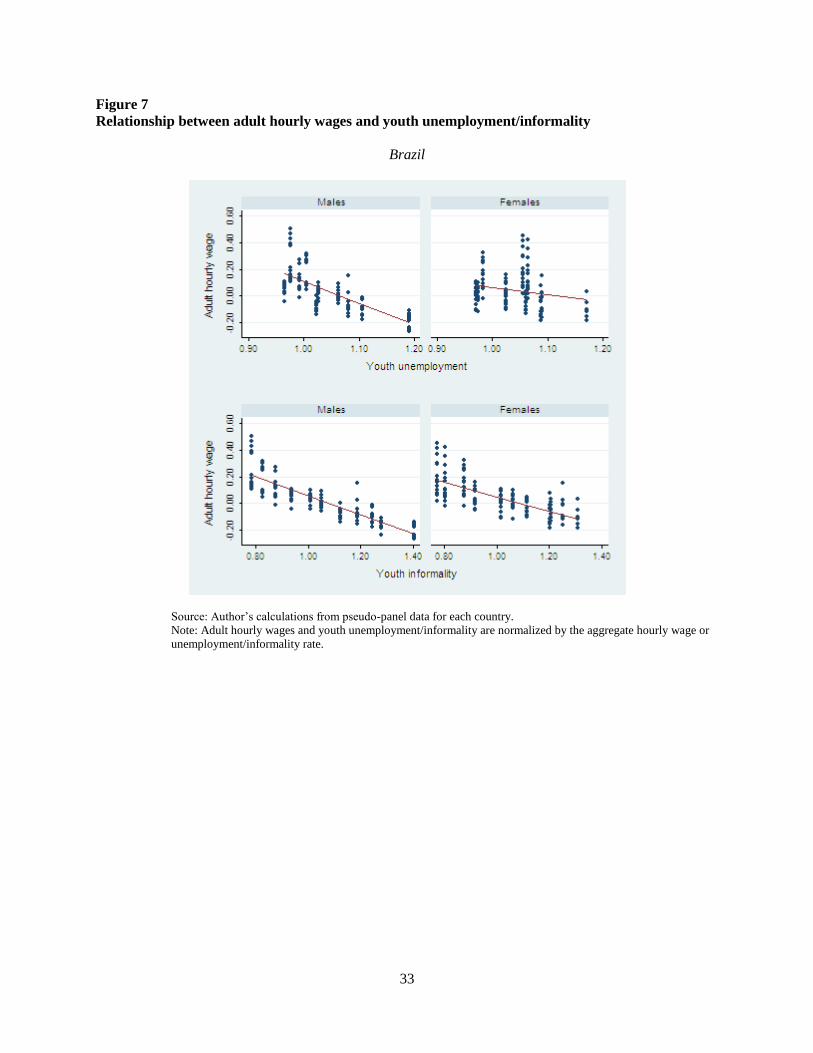
Figures 4 through 7 provide some additional preliminary evidence on the relationship
between youth and adult labor market outcomes. They show a positive association between
youth normalized unemployment/informality at the cohort level and these labor market outcomes
for adult individuals. The opposite association is found when we use hourly wages as the adult
labor market outcome of interest.
6. Findings
6.1 Pooled OLS estimation
The consequences of youth unemployment and informality will be assessed on several
outcome variables. For the first, these will be: normalized unemployment and the logarithm of
normalized hourly wages. For youth informality, the analysis will concentrate on normalized
adult informality and the logarithm of normalized wages.
Table 5 presents the estimated coefficient associated to the early career variable in equation
(3) above. Following the standard practice, we present separate results for males and females. All
regressions are weighted by the square root of the number of observations in each cohort. The
estimations show evidence of unemployment persistence for men, both in Argentina and Brazil.
In particular, an additional percentage point in the unemployment rate during youth is associated
to an increase of 0.5 (Argentina) to 0.9 (Brazil) percentage points in the adult normalized
14
unemployment rate. We also find a wage scarring effect that is statistically significant only in the
case of Argentina. The results associated to youth unemployment among women are significant
only in that country. The increase in adult unemployment in response to a one percentage point
increase in youth unemployment is of 0.3 percentage point, while the wage penalty is of 0.3%.
The estimated impact of early informality shows similar effects both for men and women in
Argentina and Brazil. The results show signals of informality persistence that range from 0.2
(women in Argentina) to 0.7 (men in Brazil) percentage points. The wage penalty is higher in
Brazil where the exposure to informality during youth reduces adult normalized wages in 1%.
While illustrative, these results assume that youth unemployment and informality have an
average effect during the entire adult life. Nevertheless, it may be that these experiences have
either short or long term consequences, which may not be properly captured by averaging out
across adulthood. Therefore, we obtain estimates allowing the presence of heterogeneities across
adult working lives.
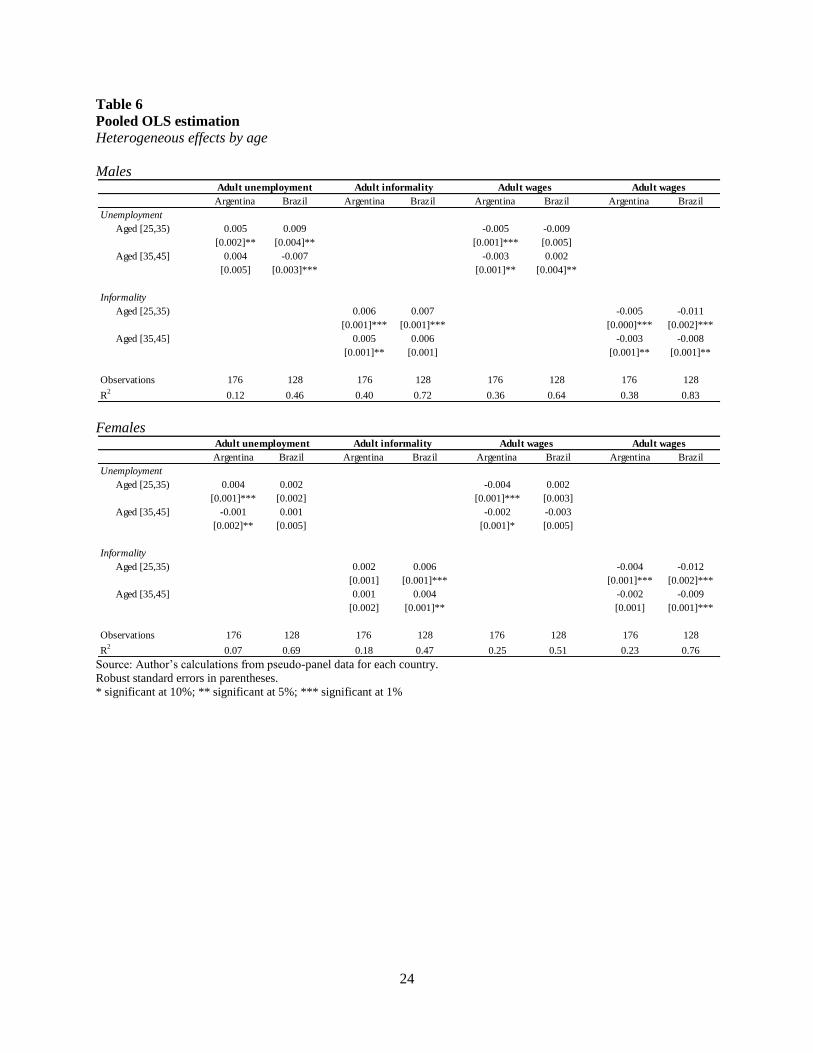
Table 6 shows the results obtained when we include interaction effects in order to capture
heterogeneities in the effect from youth unemployment and informality in the short and long
term. We find that youth unemployment in Argentina impacts on adult normalized
unemployment in the short term, but then the persistence effect disappears both for men and
women 10 years after youth. The wage penalty is of 0.5% for men and 0.4% for women in the
first ten years of adulthood, but then falls to 0.3% and 0.2% with the passage of time. These
results suggest a catch-up response that could be explained by the on-the-job training for those
workers with a history of youth unemployment. In Brazil the persistence effect is significant only
for men in the first ten years of the adult working life. The effect reverses between ten to twenty
years after youth.
The results are similar when we evaluate the effect of youth informality. The persistence
effect and the wage penalty appear at the beginning of the adult working life, and then decrease
or fade away with the passage of time, both for men and women in Argentina and Brazil.
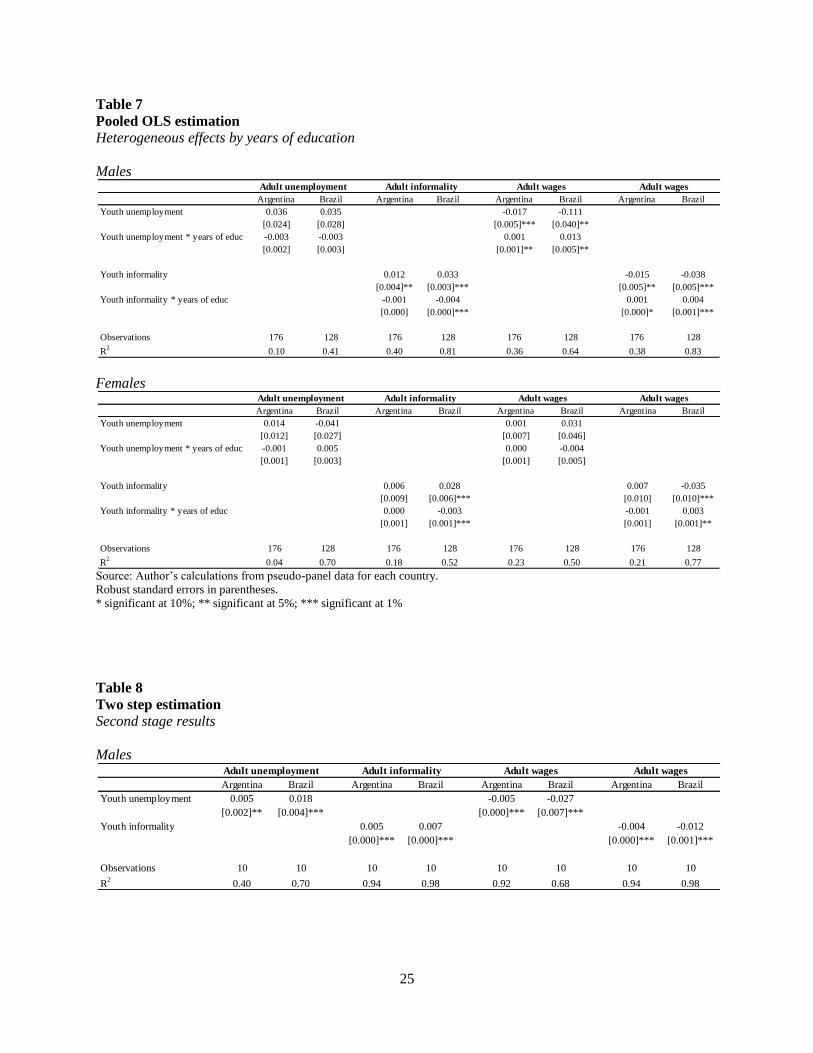
We finally evaluate the presence of heterogeneous effects for adult individuals of different
skill levels. The results are shown in Table 7 and reveal that unemployment persistence does not
vary by skill level. On the contrary, the wage loss associated to youth unemployment is higher
the lower the years of education for the group of men. For instance, the wage penalty for an
individual with no education is of 11% in Brazil, while it is of 2% for someone with complete
15
primary education; the effect reverses when an individual with complete secondary education or
higher is considered.
The same pattern is observed for informality persistence results among men. The expected
increase in the normalized informality rate is of 1.2 percentage points for an individual with no
education in Argentina. The increase is of 0.5 percentage points for someone with complete
primary education and the estimated effect is negative for an individual with complete secondary
education or higher. The informality persistence result among women is significant only in the
case of Brazil. These results may reflect the effect of informal work as a pathway to obtain
experience and tenure in different jobs for those with higher skills, which may enhance an
individual‟s chances to acquire a formal job as he ages. Therefore, the evidence does seem to fall
in line with the results from Bosch and Maloney (2010) and Cunningham and Bustos (2011) at
least for those individuals with secondary level or higher.
The wage penalty associated to youth informality by skill level is confirmed both in
Argentina and Brazil among men, while the result among women is significant only in Brazil.
The wage loss is lower in comparison with the wage scarring associated to youth unemployment.
An adult man earns 3.8% less when he has no education, and the penalty disappears for someone
with complete primary education or higher.
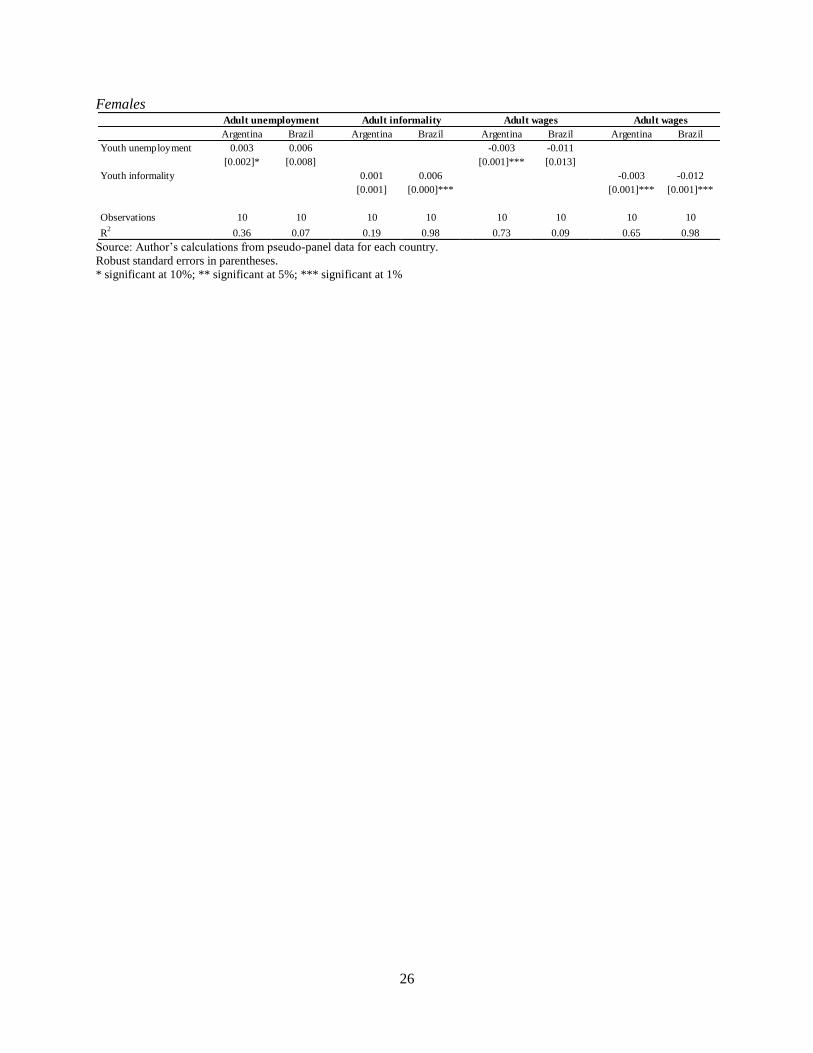
6.2 Two step estimation
This section presents the results obtained from the two stage estimation strategy described
in Section 4. More precisely, Table 8 shows the coefficient associated to the youth
unemployment or informality variable in equation (6).
The estimated effects of youth labor market variables on adult outcomes do not
substantially differ from that obtained with the pooled OLS regressions. In most of the cases we
obtain the same or a lower coefficient. These results suggest that birth-cohort effects are not
confounding factors in pooled OLS regressions for some of the labor outcomes, and that the bias
is positive (as expected) when the estimated coefficient is lower.
We can conclude that there exists evidence of state dependency in unemployment and
informality histories for men, both in Argentina and Brazil. The persistence effect of
unemployment is significant only in Argentina, as is the informality effect in Brazil among
women. Youth unemployment and informality also generates wage penalties in the future both
16
for men and women, in Argentina and Brazil. The only exception is the non significant effect of
youth unemployment in Brazil among women.
7. Discussion
This paper studied the relationship between the levels of youth unemployment and
informality and adult labor market outcomes in Argentina and Brazil using an extended time
series of household surveys spanning from the early 1980s to late 2000s.
In light of the econometric issues generally associated to the estimation of this type of
relationships, and those that arise using a pseudo-panel design, we proposed two alternative
empirical strategies relying on cross-cohort differences as the main source of variability.
The main findings indicate that youth unemployment and informality do have effects on
adult labor market outcomes both for males and females, and these results are robust to both
estimation strategies. The persistence effect and the wage penalty are mainly present in the early
years of adulthood and tend to decrease or disappear with the passage of time. These results are
also different for adult individuals of different skill levels. Those with lower skills experience
higher wage losses and larger persistence effects. When we allow for the presence of birth-
cohorts effects that differ from youth labor market experiences, the results also show state
dependency and wage penalties associated to youth unemployment and informality.
The main contribution of these results is to add a further dimension specific to developing
and middle income countries – informality – to the copiously documented scarring effects of
unemployment in advanced economies. These results are particularly relevant for policy making
in developing countries‟ labor markets. The detrimental effects of informality add a further layer
of complexity: active labor market policies for the young should not only aim at promoting
employment per se, but preferably formal employment. These results challenge the view that an
informal job still provides training and experience for better jobs that may not be obtained right
out of school. In this sense, measures such as the introduction of lower minimum wage levels for
youth in developed countries could, for instance, translate into lower levels of social security
contributions or payroll taxes for young workers. This would create a further incentive for
employers to register young workers. The importance of measures along these lines is

17
emphasized by the results on informality dependence, which only hold for workers with lower
levels of qualifications.
18
8. References
Antman, F. and D. McKenzie (2007). Earnings Mobility and Measurement Error: A Pseudo-Panel
Approach, Economic Development and Cultural Change, University of Chicago Press, 56,
pp. 125-161.
Arulampalam, W., P. Gregg and M. Gregory (2001). Unemployment scarring, The Economic Journal,
111(475), Features, pp. F577-F584.
Bassi, M. and S. Galiani (2009). Youth Labor Market in Latin America: A descriptive analysis,
Unpublished, Inter-American Development Bank, Washington DC.
Bosch, M. and W.F. Maloney (2010). Comparative analysis of labor market dynamics using Markov
processes: An application to informality, Labour Economics, 17(4), pp. 621-631.
Becker, G. (1994). Human Capital: A Theoretical and Empirical Analysis with Special Reference to
Education (3rd Edition). NBER Books, National Bureau of Economic Research.
Bell, D. and D.G. Blanchflower (2010). Youth unemployment: Déjà Vu?, IZA Discussion Papers 4705.
Brea, J.A. (2003). Population dynamics in Latin America, Population Bulletin, 58(1).
Burgess, S., C. Propper, H. Rees and A. Shearer (2003) The class of 1981: the effects of early career
unemployment on subsequent unemployment experiences, Labour Economics, 10(3), pp. 291-
309.
Clark, A., Y. Georgellis and P. Sanfey (2001). Scarring: The psychological impact of past
Unemployment, Economica, 68 (270), pp. 221-241.
Cockx, B. and M. Picchio (2011). Scarring Effects of Remaining Unemployed for Long-Term
Unemployed School-Leavers, IZA Discussion Papers 5937.
Cunningham, W. and J. Bustos (2011). Youth employment transitions in Latin America, Policy Research
Working Paper, No. 5521, The World Bank, Human Development Network, Children and Youth
Unit, Washington DC.
Deaton, A. (1997). The analysis of household surveys: A microeconometric approach to development
policy (Baltimore, MD: Johns Hopkins University Press).
Deaton, A. and Ch. Paxson (1994). Saving, Growth, and Aging in Taiwan. NBER Chapters, in: Studies in
the Economics of Aging, pp. 331-362, National Bureau of Economic Research.
Ermisch, J. (1995). Demographic developments and European labour markets. Scottish Journal of
Political Economy, 42 (3), pp. 331-346.
Fairlie, R.W. and L.G. Kletzer (2003). The long-term costs of job displacement for young adult workers,
Industrial & Labor Relations Review, 56(4), pp. 682-698.
Freeman, R.B. and D. Wise (1982). The youth labor market problem: Its nature, causes and consequences,
in: R.B. Freeman and D. Wise (Eds.), The youth labor market problem: Its nature, causes and
consequences (Chicago, IL: The University of Chicago Press), pp. 1-16.
Gasparini, L. and L. Tornarolli (2009). Labor informality in Latin America and the Caribbean: Patterns
and trends from household survey microdata, Desarrollo y Sociedad, 63(June), pp. 13-80.
Gasparini, L. (2011). A Guide to the SEDLAC: Socioeconomic Database for Latin America and the
Caribbean, CEDLAS and The World Bank, http://sedlac.econo.unlp.edu.ar/esp/metodologia.php.
Gregg, P. (2001). The impact of youth unemployment on adult unemployment in the NCDS, The
Economic Journal, 111(475), Features, pp. F626-F653.
19
Gregg, P. and E. Tominey (2005). The wage scar from male youth unemployment, Labour Economics,
12(4), pp. 487-509.
Gregory, M. and R. Jukes (2001). Unemployment and subsequent earnings: Estimating scarring among
British men 1984-1994, The Economic Journal, 111(475), Features, pp. F607-F625.
Hemmer, H. and C. Mannel (1989). On the economic analysis of the urban informal sector, World
Development, 17(10), pp. 1543-1552.
Holzer, H.J. and R. LaLonde (1999). Job change and job stability among less-skilled younger workers,
Harris School Working Paper Series, 99-28, The University of Chicago.
Lockwood, B. (1991). Information Externalities in the Labour Market and the Duration of
Unemployment, Review of Economic Studies, 58 (4), pp. 733-753.
Jacobson, L.S., R. LaLonde and D.G. Sullivan (1993). Earnings losses of displaced workers, The
American Economic Review, 83(4), pp. 685-709.
Maloney, W.F. (2004). Informality revisited, World Development, 32(7), pp. 1159-1178.
Mroz, T.A. and T.H. Savage (2006). The long-term effects of youth unemployment, Journal of Human
Resources, 41(2), pp. 259-293.
Neumark, D. (2002). Youth labor markets in the US: Shopping around vs. staying put, The Review of
Economics and Statistics, 84(3), pp. 462-482.
Nilsen, O. and K. Reiso (2011). Scarring Effects of Unemployment, IZA Discussion Papers 619.
Nordstrom, O. (2011). Scarring effects of the first labor market experience, IZA Discussion Paper, No.
5565, Bonn, Germany (March).
Pissarides, C. (1994). Search unemployment with on-the-job search, The Review of Economic Studies
61(3), pp. 457-475.
Perry G. E., W.F. Maloney, O. Arias, P. Fajnzylber, A. Mason and J. Saavedra-Chanduvi (2007).
Informality: Exit and Exclusion (The World Bank).
Ruhm, C.J. (1991). Are workers permanently scarred by job displacements? The American Economic
Review, 81(1), pp. 319-324.
SEDLAC (2011). Socio-Economic database for Latin America and the Caribbean (CEDLAS and The
World Bank), http://sedlac.econo.unlp.edu.ar/eng/index.php.
Weller, J. (2007). Youth employment: Characteristics, tensions and challenges, CEPAL Review, 92, pp.
61-82.
20
9. Tables and Figures
Table 1
Countries and surveys in the sample
Source: SEDLAC (CEDLAS and the World Bank, 2012)
Table 2
Cohort definitions and aging patterns
Source: SEDLAC (CEDLAS and the World Bank, 2012)
Country Name of survey Years
Argentina Encuesta Permanente de Hogares 1980, 1985-1986, 1988,
1990-2010
Brazil Pesquisa Nacional por Amostra de Domicilios
1981-1990, 1992-1993,
1995-1999, 2001-2002,
2004-2009
Argentina
Year of birth Age in 1980 Age in 1985 Age in 1990 Age in 1995 Age in 2000 Age in 2005 Age in 2010
1965 15 20 25 30 35 40 45
1966 19 24 29 34 39 44
1967 18 23 28 33 38 43
1968 17 22 27 32 37 42
1969 16 21 26 31 36 41
1970 15 20 25 30 35 40
1971 19 24 29 34 39
1972 18 23 28 33 38
1973 17 22 27 32 37
1974 16 21 26 31 36
1975 15 20 25 30 35
Brazil
Year of birth Age in 1981 Age in 1985 Age in 1990 Age in 1995 Age in 2000 Age in 2005 Age in 2010
1966 15 19 24 29 34 39 44
1967 18 23 28 33 38 43
1968 17 22 27 32 37 42
1969 16 21 26 31 36 41
1970 15 20 25 30 35 40
1971 19 24 29 34 39
1972 18 23 28 33 38
1973 17 22 27 32 37
1974 16 21 26 31 36
1975 15 20 25 30 35
1976 19 24 29 34
21
Table 3
Number of observations
Source: SEDLAC (CEDLAS and the World Bank, 2012)
Argentina
Year of birth 1980 1985 1990 1995 2000 2005 2010
1975 23 95 117 135 149
1974 26 95 96 120 164
1973 32 101 107 100 134
1972 46 90 110 121 138
1971 55 115 90 106 141
1970 34 80 86 95 118 155
1969 50 74 96 100 102 107
1968 53 54 74 84 97 152
1967 52 62 88 92 106 120
1966 81 52 88 89 84 143
1965 47 108 64 81 90 93 121
Brazil
Year of birth 1981 1985 1990 1995 2001 2005 2009
1976 2612 3655 4041 3833
1975 1442 2868 3609 4093 3801
1974 1814 2916 3503 3605 3721
1973 1982 3091 3503 3737 3547
1972 2405 3187 3351 3806 3562
1971 2554 3202 3526 3484 3470
1970 2697 2781 3360 3388 3668 3582
1969 3214 2909 3195 3380 3493 3666
1968 3795 3066 3229 3342 3562 3165
1967 4424 2839 3045 3243 3370 3261
1966 2567 4936 3022 3151 3353 3364 3332
22
Table 4
Trends and patterns in labor market outcomes, by age groups and cohorts
Normalized unemployment rate
[15,19] [20,24] [25,29] [30,34] [35,39] [40,45] [15,19] [20,24] [25,29] [30,34] [35,39] [40,45]
Argentina
1965 7.33 3.01 1.30 0.80 0.74 0.52 3.08 1.38 1.38 0.96 0.99 1.20
1966 3.72 2.16 1.29 0.88 0.83 0.52 4.41 2.62 1.21 1.10 1.00 0.90
1967 5.39 1.39 1.13 0.96 0.51 0.29 1.73 2.12 0.85 1.13 0.88 1.51
1968 2.87 2.37 1.00 0.60 0.41 0.00 3.22 2.80 1.55 0.68 1.37 0.76
1969 3.88 1.85 0.96 0.90 0.28 0.95 3.48 1.86 1.10 1.18 1.12 0.75
1970 5.40 1.73 0.78 0.95 0.67 1.00 4.96 1.98 1.17 0.66 1.10 1.43
1971 3.82 2.00 1.10 1.05 0.29 4.73 1.89 1.32 1.05 0.70
1972 4.37 1.51 1.19 0.87 0.71 6.69 1.87 1.08 1.22 0.97
1973 4.44 1.42 1.10 0.53 0.68 4.33 1.65 0.96 1.01 0.96
1974 3.73 1.40 1.03 0.82 0.31 4.28 1.78 1.63 1.33 1.26
1975 3.95 1.47 0.99 0.58 3.67 1.87 1.33 1.08
Brazil
1966 1.78 1.53 0.92 0.76 0.64 0.60 2.20 2.28 1.51 1.39 1.16 0.92
1967 1.78 1.61 1.06 0.79 0.62 0.51 2.24 2.39 1.47 1.27 1.03 0.91
1968 1.68 1.58 1.02 0.83 0.65 0.48 2.19 2.07 1.60 1.33 1.13 0.99
1969 1.58 1.54 0.99 0.81 0.61 0.61 2.35 2.14 1.58 1.32 1.11 0.85
1970 1.69 1.59 0.94 0.64 0.57 2.26 2.02 1.63 1.29 1.09
1971 1.75 1.47 0.96 0.69 0.56 2.16 1.96 1.59 1.28 1.08
1972 1.55 1.42 0.96 0.64 0.61 2.13 2.09 1.66 1.24 1.19
1973 1.67 1.33 0.93 0.66 0.58 2.23 2.02 1.64 1.20 1.36
1974 1.56 1.28 0.88 0.64 0.65 2.20 1.97 1.63 1.36 1.01
1975 1.55 1.35 0.89 0.66 1.95 2.01 1.58 1.35
1976 1.46 1.26 0.89 0.69 2.10 2.10 1.65 1.42
Normalized informality rate
[15,19] [20,24] [25,29] [30,34] [35,39] [40,45] [15,19] [20,24] [25,29] [30,34] [35,39] [40,45]
Argentina
1965 3.26 1.38 0.82 0.82 0.76 0.83 2.83 1.39 0.97 0.87 1.05 1.21
1966 1.07 1.25 0.77 0.76 0.72 0.51 1.85 1.61 1.28 0.73 1.15 1.05
1967 1.94 1.13 0.84 0.84 0.82 0.56 1.64 1.34 1.08 0.97 1.06 0.94
1968 2.38 1.11 0.93 0.88 0.84 0.68 3.37 1.63 1.24 0.80 1.24 1.14
1969 2.36 1.06 0.82 0.78 0.83 0.93 2.56 1.16 0.96 0.84 1.33 1.27
1970 2.78 1.26 0.96 0.87 0.75 0.77 2.86 1.13 0.97 1.42 0.90 1.41
1971 2.39 1.37 1.09 0.97 0.73 2.93 1.19 1.10 1.13 1.42
1972 2.48 1.18 0.99 0.77 0.77 2.16 1.42 0.93 1.19 1.04
1973 2.13 1.27 1.14 0.80 0.87 2.42 1.23 0.89 1.01 1.11
1974 2.35 1.45 1.06 0.88 0.72 2.34 1.16 0.84 1.15 0.85
1975 2.33 1.34 1.14 0.95 1.63 1.43 1.27 1.07
Brazil
1966 1.92 1.13 0.88 0.81 0.75 0.64 1.87 1.07 0.95 0.91 0.93 0.86
1967 1.91 1.12 0.90 0.82 0.76 0.65 1.87 1.03 0.96 0.92 0.91 0.91
1968 1.91 1.12 0.87 0.79 0.76 0.66 1.89 1.10 0.93 0.92 0.93 0.92
1969 1.94 1.13 0.89 0.84 0.73 0.59 1.87 1.09 0.95 0.92 0.94 0.78
1970 1.93 1.16 0.92 0.82 0.73 1.91 1.15 0.98 0.95 0.96
1971 1.94 1.06 0.91 0.78 0.70 1.85 1.15 0.98 0.93 0.94
1972 2.07 1.14 0.92 0.79 0.70 2.03 1.15 0.96 0.94 0.87
1973 1.97 1.15 0.97 0.79 0.67 2.05 1.14 0.93 0.95 0.89
1974 1.87 1.15 0.92 0.83 0.56 1.85 1.11 1.03 0.98 0.80
1975 2.01 1.14 0.94 0.77 2.01 1.13 0.95 0.92
1976 1.83 1.25 0.90 0.73 1.84 1.15 0.98 0.91
Males Females
Males Females
Year of birth
Year of birth
23
Source: Author‟s calculations from pseudo-panel data for each country.
Table 5
Pooled OLS estimation
Mean effects
Males
Females
Source: Author‟s calculations from pseudo-panel data for each country.
Robust standard errors in parentheses.
* significant at 10%; ** significant at 5%; *** significant at 1%
Normalized hourly wages
[15,19] [20,24] [25,29] [30,34] [35,39] [40,45] [15,19] [20,24] [25,29] [30,34] [35,39] [40,45]
Argentina
1965 0.40 0.66 0.86 0.92 1.03 0.99 0.36 0.62 0.67 0.63 0.72 1.00
1966 0.51 0.68 0.96 0.91 0.92 1.49 0.60 0.72 0.49 0.52 0.70 1.04
1967 0.54 0.84 0.96 1.00 1.13 1.17 0.57 0.66 0.61 0.58 0.79 1.04
1968 0.49 0.68 0.88 1.04 1.12 1.11 0.41 0.54 0.75 0.53 0.93 1.07
1969 0.51 0.73 0.84 0.96 1.03 1.13 0.52 0.64 0.72 0.49 1.05 1.15
1970 0.47 0.70 0.74 0.96 0.99 1.04 0.39 0.67 0.54 0.51 0.79 1.07
1971 0.52 0.63 0.82 0.85 1.11 0.47 0.50 0.58 0.69 0.90
1972 0.64 0.68 0.69 0.96 1.04 0.35 0.48 0.61 0.85 0.97
1973 0.47 0.64 0.65 1.03 1.06 0.47 0.57 0.42 0.91 0.96
1974 0.46 0.57 0.64 1.08 1.27 0.33 0.49 0.45 0.98 1.23
1975 0.46 0.51 0.63 0.98 0.31 0.40 0.52 0.93
Brazil
1966 0.37 0.60 1.03 1.19 1.24 1.30 0.28 0.53 0.84 0.97 1.01 1.06
1967 0.36 0.60 0.92 1.15 1.19 1.37 0.28 0.49 0.81 0.97 1.01 1.00
1968 0.36 0.66 0.86 1.10 1.20 1.25 0.28 0.54 0.81 0.95 1.06 1.15
1969 0.36 0.63 0.87 1.01 1.20 1.16 0.27 0.56 0.79 0.92 0.95 1.02
1970 0.34 0.62 0.86 1.05 1.17 0.27 0.55 0.77 0.91 0.92
1971 0.33 0.68 0.84 1.08 1.16 0.27 0.54 0.76 0.97 0.93
1972 0.29 0.63 0.83 1.00 1.09 0.25 0.54 0.79 0.91 0.94
1973 0.37 0.58 0.84 1.20 1.09 0.30 0.54 0.79 0.93 0.93
1974 0.36 0.59 0.84 1.05 1.09 0.31 0.55 0.74 0.94 0.90
1975 0.33 0.60 0.86 0.99 0.28 0.55 0.84 0.95
1976 0.36 0.56 0.85 0.98 0.31 0.50 0.80 0.92
Males FemalesYear of birth
Argentina Brazil Argentina Brazil Argentina Brazil Argentina Brazil
Youth unemployment 0.005 0.009 -0.005 -0.009
[0.002]** [0.005]* [0.000]*** [0.006]
Youth informality 0.006 0.007 -0.004 -0.012
[0.001]*** [0.001]*** [0.000]*** [0.002]***
Observations 176 128 176 128 176 128 176 128
R2
0.10 0.41 0.40 0.71 0.35 0.59 0.36 0.81
Adult wagesAdult informalityAdult unemployment Adult wages
Argentina Brazil Argentina Brazil Argentina Brazil Argentina Brazil
Youth unemployment 0.003 0.001 -0.003 0.001
[0.001]* [0.002] [0.001]*** [0.003]
Youth informality 0.002 0.006 -0.004 -0.011
[0.001]* [0.001]*** [0.001]*** [0.002]***
Observations 176 128 176 128 176 128 176 128
R2
0.04 0.69 0.18 0.45 0.23 0.50 0.21 0.74
Adult unemployment Adult informality Adult wages Adult wages
24
Table 6
Pooled OLS estimation
Heterogeneous effects by age
Males
Females
Source: Author‟s calculations from pseudo-panel data for each country.
Robust standard errors in parentheses.
* significant at 10%; ** significant at 5%; *** significant at 1%
Argentina Brazil Argentina Brazil Argentina Brazil Argentina Brazil
Unemployment
Aged [25,35) 0.005 0.009 -0.005 -0.009
[0.002]** [0.004]** [0.001]*** [0.005]
Aged [35,45] 0.004 -0.007 -0.003 0.002
[0.005] [0.003]*** [0.001]** [0.004]**
Informality
Aged [25,35) 0.006 0.007 -0.005 -0.011
[0.001]*** [0.001]*** [0.000]*** [0.002]***
Aged [35,45] 0.005 0.006 -0.003 -0.008
[0.001]** [0.001] [0.001]** [0.001]**
Observations 176 128 176 128 176 128 176 128
R2
0.12 0.46 0.40 0.72 0.36 0.64 0.38 0.83
Adult wagesAdult unemployment Adult informality Adult wages
Argentina Brazil Argentina Brazil Argentina Brazil Argentina Brazil
Unemployment
Aged [25,35) 0.004 0.002 -0.004 0.002
[0.001]*** [0.002] [0.001]*** [0.003]
Aged [35,45] -0.001 0.001 -0.002 -0.003
[0.002]** [0.005] [0.001]* [0.005]
Informality
Aged [25,35) 0.002 0.006 -0.004 -0.012
[0.001] [0.001]*** [0.001]*** [0.002]***
Aged [35,45] 0.001 0.004 -0.002 -0.009
[0.002] [0.001]** [0.001] [0.001]***
Observations 176 128 176 128 176 128 176 128
R2
0.07 0.69 0.18 0.47 0.25 0.51 0.23 0.76
Adult unemployment Adult informality Adult wages Adult wages
25
Table 7
Pooled OLS estimation
Heterogeneous effects by years of education
Males
Females
Source: Author‟s calculations from pseudo-panel data for each country.
Robust standard errors in parentheses.
* significant at 10%; ** significant at 5%; *** significant at 1%
Table 8
Two step estimation
Second stage results
Males
Argentina Brazil Argentina Brazil Argentina Brazil Argentina Brazil
Youth unemployment 0.036 0.035 -0.017 -0.111
[0.024] [0.028] [0.005]*** [0.040]**
Youth unemployment * years of educ -0.003 -0.003 0.001 0.013
[0.002] [0.003] [0.001]** [0.005]**
Youth informality 0.012 0.033 -0.015 -0.038
[0.004]** [0.003]*** [0.005]** [0.005]***
Youth informality * years of educ -0.001 -0.004 0.001 0.004
[0.000] [0.000]*** [0.000]* [0.001]***
Observations 176 128 176 128 176 128 176 128
R2
0.10 0.41 0.40 0.81 0.36 0.64 0.38 0.83
Adult unemployment Adult informality Adult wages Adult wages
Argentina Brazil Argentina Brazil Argentina Brazil Argentina Brazil
Youth unemployment 0.014 -0.041 0.001 0.031
[0.012] [0.027] [0.007] [0.046]
Youth unemployment * years of educ -0.001 0.005 0.000 -0.004
[0.001] [0.003] [0.001] [0.005]
Youth informality 0.006 0.028 0.007 -0.035
[0.009] [0.006]*** [0.010] [0.010]***
Youth informality * years of educ 0.000 -0.003 -0.001 0.003
[0.001] [0.001]*** [0.001] [0.001]**
Observations 176 128 176 128 176 128 176 128
R2
0.04 0.70 0.18 0.52 0.23 0.50 0.21 0.77
Adult unemployment Adult informality Adult wages Adult wages
Argentina Brazil Argentina Brazil Argentina Brazil Argentina Brazil
Youth unemployment 0.005 0.018 -0.005 -0.027
[0.002]** [0.004]*** [0.000]*** [0.007]***
Youth informality 0.005 0.007 -0.004 -0.012
[0.000]*** [0.000]*** [0.000]*** [0.001]***
Observations 10 10 10 10 10 10 10 10
R2
0.40 0.70 0.94 0.98 0.92 0.68 0.94 0.98
Adult unemployment Adult informality Adult wages Adult wages
26
Females
Source: Author‟s calculations from pseudo-panel data for each country.
Robust standard errors in parentheses.
* significant at 10%; ** significant at 5%; *** significant at 1%
Argentina Brazil Argentina Brazil Argentina Brazil Argentina Brazil
Youth unemployment 0.003 0.006 -0.003 -0.011
[0.002]* [0.008] [0.001]*** [0.013]
Youth informality 0.001 0.006 -0.003 -0.012
[0.001] [0.000]*** [0.001]*** [0.001]***
Observations 10 10 10 10 10 10 10 10
R2
0.36 0.07 0.19 0.98 0.73 0.09 0.65 0.98
Adult wages Adult wagesAdult unemployment Adult informality
27
Figure 1
Normalized unemployment rate by cohort
Males
Argentina Brazil
Females
Argentina Brazil
Source: Author‟s calculations from pseudo-panel data for each country.
Note: Legend indicates year of birth.
0.0
1.5
3.0
4.5
6.0
7.5
9.0
1965 1970 1975
0.0
0.5
1.0
1.5
2.0
2.5
3.0
1966 1971 1976
0.0
1.0
2.0
3.0
4.0
5.0
6.0
1965 1970 1975
0.0
0.5
1.0
1.5
2.0
2.5
3.0
1966 1971 1976
28
Figure 2
Normalized informality rate
Males
Argentina Brazil
Females
Argentina Brazil
Source: Author‟s calculations from pseudo-panel data for each country.
Note: Legend indicates year of birth.
0.0
1.0
2.0
3.0
4.0
5.0
1965 1970 1975
0.0
0.5
1.0
1.5
2.0
2.5
3.0
1966 1971 1976
0.0
1.0
2.0
3.0
4.0
5.0
1965 1970 1975
0.0
0.5
1.0
1.5
2.0
2.5
3.0
1966 1971 1976
29
Figure 3
Normalized hourly wages
Males
Argentina Brazil
Females
Argentina Brazil
Source: Author‟s calculations from pseudo-panel data for each country.
Note: Legend indicates year of birth.
0.0
0.5
1.0
1.5
2.0
1965 1970 1975
0.0
0.5
1.0
1.5
2.0
1966 1971 1976
0.0
0.5
1.0
1.5
2.0
1965 1970 1975
0.0
0.5
1.0
1.5
2.0
1966 1971 1976
30
Figure 4
Relationship between adult and youth labor market outcomes
Argentina
Source: Author‟s calculations from pseudo-panel data for each country.
Note: Adult unemployment/informality and youth unemployment/informality are normalized by the aggregate
unemployment/informality rate.
31
Figure 5
Relationship between adult hourly wages and youth unemployment/informality
Argentina
Source: Author‟s calculations from pseudo-panel data for each country.
Note: Adult hourly wages and youth unemployment/informality are normalized by the aggregate hourly wage or
unemployment/informality rate.
32
Figure 6
Relationship between adult and youth labor market outcomes
Brazil
Source: Author‟s calculations from pseudo-panel data for each country.
Note: Adult unemployment/informality and youth unemployment/informality are normalized by the aggregate
unemployment/informality rate.
33
Figure 7
Relationship between adult hourly wages and youth unemployment/informality
Brazil
Source: Author‟s calculations from pseudo-panel data for each country.
Note: Adult hourly wages and youth unemployment/informality are normalized by the aggregate hourly wage or
unemployment/informality rate.