Embed Size (px)
Citation preview
7/28/2019 Scatter Xray Radiation in Concrete
http://slidepdf.com/reader/full/scatter-xray-radiation-in-concrete 1/11
A study of scatter in diagnostic X-ray rooms
G MCVEY, D Phil and H WEATHERBURN, PhD
Medical Physics Department, The Churchill, Oxford Radcliffe Hospital NHS Trust, Headington, Oxford OX3 7LJ, UK
Abstract. An important part of determining the radiation protection requirements during X-ray room design isthe calculation of the amount of scatter inside and outside the planned locations of the shielding barriers. In thiswork, a Monte Carlo code has been developed to calculate the percentage scatter so that the current data can beconsolidated and new data can be provided as required. Calculations have been compared with measurementsto show that they are representative of scatter found in X-ray rooms. Scatter from the dose–area product meter
and the collimator system were found to provide large contributions to the measured scatter. A fluoroscopyroom containing a C-arm X-ray set was modelled with the Monte Carlo code. The scatter dose was calculatedat an X-ray room entrance behind the protective screen, acting as a secondary barrier, at the radiographer’sconsole. The variation of scatter with the position of the protective screen was studied. An empirical calculation,
which provided reasonable agreement with the Monte Carlo calculations, was found by using new data for thevariation of scatter from concrete with field size. If a door was placed in the X-ray room entrance behind theprotective screen, the results showed that it would not need to be lead lined.
The doses at points outside the planned locations for
shielding barriers, such as walls and doors, have to be
calculated as part of the radiation protection design
process for an X-ray room. This design has to take into
account primary, scatter and leakage radiation.
Appropriate data are obtained from various reports [1–4].
The older reports [1–3] provide data on the amount of
scatter and the transmission of primary radiation which
were measured using X-ray units with single phase
generators. These data need to be updated as the use of
modern X-ray units with medium frequency generators isbecoming increasingly common. The differences in the
penetrating power of the X-rays produced by the different
generators prompted Archer et al [5] and Simpkin [6, 7] to
produce new transmission data for primary and leakage
radiation. These new transmission data are mutually
consistent. A recent BIR report [4] presents new scatter
data which were measured by Williams [8]. However, this
work does not appear to be consistent with the earlier
reports. There is considerable variation of Williams’
scatter values in the forward and backward directions
compared with the older measured values [9, 10].
Therefore, scatter distributions in X-ray rooms are
investigated in this paper.A Monte Carlo code XYZSCAT, based on the EGS4
code system [11], has been developed for this purpose. The
scatter from blocks of solid water and concrete have been
calculated and compared with measurements carried out in
a fluoroscopy room at the Churchill Hospital, Oxford to
show that they are representative of scatter in a clinical
X-ray room. The comparison was carried out for tubevoltages between 49 kV and 121 kV, for scattering angles
between 45˚ and 150˚ and for field areas between 100 cm2
and 900 cm2. The XYZSCAT code calculates the scattercontributions from different components modelled in theX-ray room, for example, the dose–area product (DAP)meter. This work highlights the significant contributions tothe total scatter from materials other than the patient.
Sutton and Williams [4] provide worked examples for awide variety of shielding problems which may beencountered. However, they only give limited advice onthe common shielding problem of how to estimate the dosebehind the protective screen at the radiographer’s consoleproduced by scatter from the ceiling. Instantaneous dose isdifficult to measure at this position. Thus, a practical
benefit of Monte Carlo calculations is that they canprovide data for these situations. A fluoroscopy room atthe Royal Marsden Hospital, London was modelled withthe XYZSCAT code and the dose calculated at a roomentrance behind a protective screen at the radiographer’sconsole. In the past, an empirical calculation would havebeen used to estimate the scatter behind the protectivescreen. This method estimates the scatter from the concreteceiling as 5% at 1 m [4] using a 10 000 cm2 field area [1].
The XYZSCAT code has been used to provide new databy calculating the scatter from concrete for varying fieldarea. The methods described in this work are generallyapplicable and may be used for radiographic rooms aswell.
Methods and materials
Output and scatter measurements
Measurements were carried out in a fluoroscopy room at theChurchill Hospital, Oxford. The X-ray generator used was aPhilips Medio 65 CP-H (Philips Medical Systems, Eindhoven,
The Netherlands)with a Philips overcouch X-ray tube SRO 33100 with a 13˚target angle, 3.4 mmAl total filtration and a 3%peak voltage ripple. All measurements were performed in
Received 27 November 2002 and in final form 4 June 2003, accepted 7 August 2003.
Current address for G McVey, North Wales Medical Physics, GlanClwyd Hospital, Bodelwyddan, Denbighshire LL18 5UJ, UK.
Current address for H Weatherburn, Princess Noorah OncologyCenter, King Abdulaziz Medical City, PO Box 9515, Jeddah 21423,
Kingdom of Saudi Arabia.This work has been supported by a grant from Anglia and OxfordHealth Authority.
The British Journal of Radiology, 77 (2004), 28–38 E 2004 The British Institute of Radiology
DOI: 10.1259/bjr/93969091
28 The British Journal of Radiology, January 2004
7/28/2019 Scatter Xray Radiation in Concrete
http://slidepdf.com/reader/full/scatter-xray-radiation-in-concrete 2/11
radiographic mode. The incident air kerma (without back
scatter) and half value layers were measured using a Keithley
15 cm3 ionization chamber (Keithley Instruments, OH)
connected to a 37D electrometer (Pitman Instruments Ltd,
Surrey) for tube voltages between 49 kV and 121 kV. The
chamber had a calibration traceable to PTB (Physikalisch-
Technische Bundesanstalt), Germany. A DIGI-X instru-
ment using the Keithley chamber, remote controlled with‘‘oRTIgo’’ software (RTI Electronics AB, Molndal,
Sweden), was used to measure the X-ray tube filtration
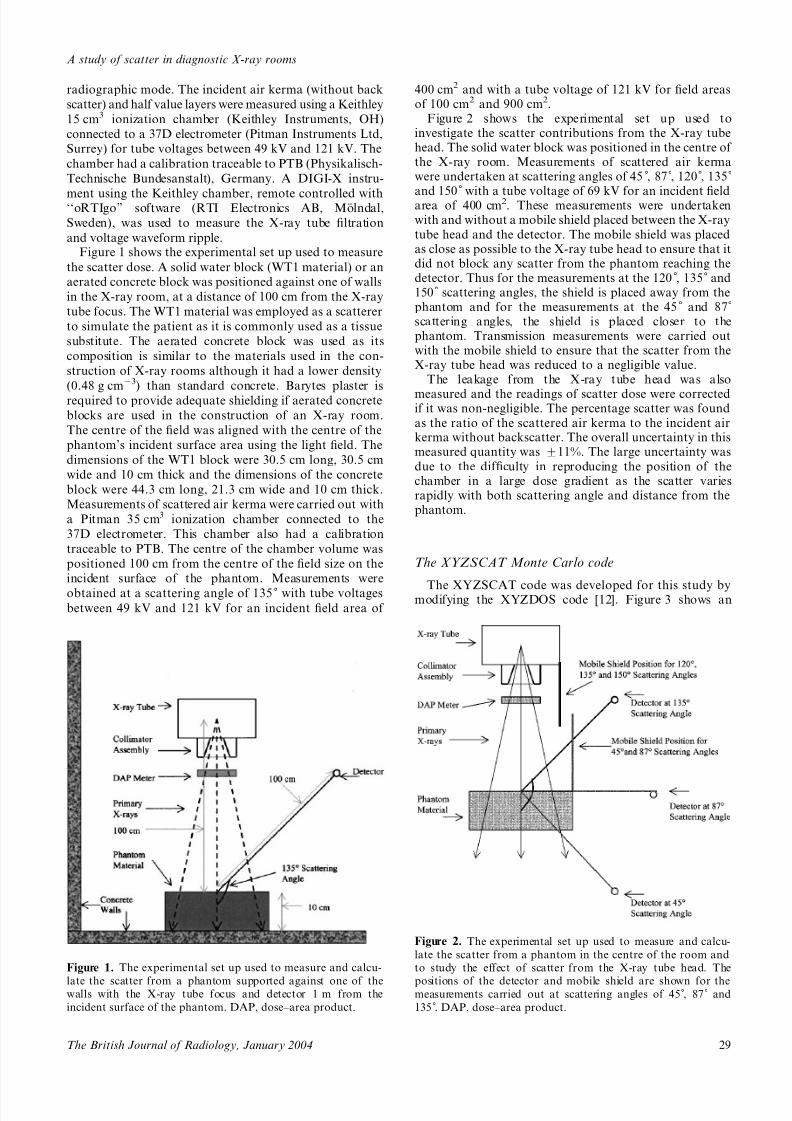
and voltage waveform ripple.Figure 1 shows the experimental set up used to measure
the scatter dose. A solid water block (WT1 material) or an
aerated concrete block was positioned against one of walls
in the X-ray room, at a distance of 100 cm from the X-ray
tube focus. The WT1 material was employed as a scatterer
to simulate the patient as it is commonly used as a tissue
substitute. The aerated concrete block was used as its
composition is similar to the materials used in the con-
struction of X-ray rooms although it had a lower density
(0.48 g cm23) than standard concrete. Barytes plaster is
required to provide adequate shielding if aerated concrete
blocks are used in the construction of an X-ray room.
The centre of the field was aligned with the centre of the
phantom’s incident surface area using the light field. The
dimensions of the WT1 block were 30.5 cm long, 30.5 cm
wide and 10 cm thick and the dimensions of the concrete
block were 44.3 cm long, 21.3 cm wide and 10 cm thick.
Measurements of scattered air kerma were carried out with
a Pitman 35 cm3 ionization chamber connected to the
37D electrometer. This chamber also had a calibration
traceable to PTB. The centre of the chamber volume was
positioned 100 cm from the centre of the field size on the
incident surface of the phantom. Measurements were
obtained at a scattering angle of 135˚ with tube voltagesbetween 49 kV and 121 kV for an incident field area of
400 cm2 and with a tube voltage of 121 kV for field areasof 100 cm2 and 900 cm2.
Figure 2 shows the experimental set up used toinvestigate the scatter contributions from the X-ray tubehead. The solid water block was positioned in the centre of the X-ray room. Measurements of scattered air kermawere undertaken at scattering angles of 45 , 87 , 120 , 135˚
and 150˚ with a tube voltage of 69 kV for an incident fieldarea of 400 cm2. These measurements were undertakenwith and without a mobile shield placed between the X-ray
tube head and the detector. The mobile shield was placedas close as possible to the X-ray tube head to ensure that itdid not block any scatter from the phantom reaching thedetector. Thus for the measurements at the 120 , 135˚ and150˚ scattering angles, the shield is placed away from thephantom and for the measurements at the 45˚ and 87˚scattering angles, the shield is placed closer to thephantom. Transmission measurements were carried outwith the mobile shield to ensure that the scatter from theX-ray tube head was reduced to a negligible value.
The leakage from the X-ray tube head was also
measured and the readings of scatter dose were correctedif it was non-negligible. The percentage scatter was found
as the ratio of the scattered air kerma to the incident airkerma without backscatter. The overall uncertainty in thismeasured quantity was ¡11%. The large uncertainty was
due to the difficulty in reproducing the position of thechamber in a large dose gradient as the scatter variesrapidly with both scattering angle and distance from thephantom.
The XYZSCAT Monte Carlo code
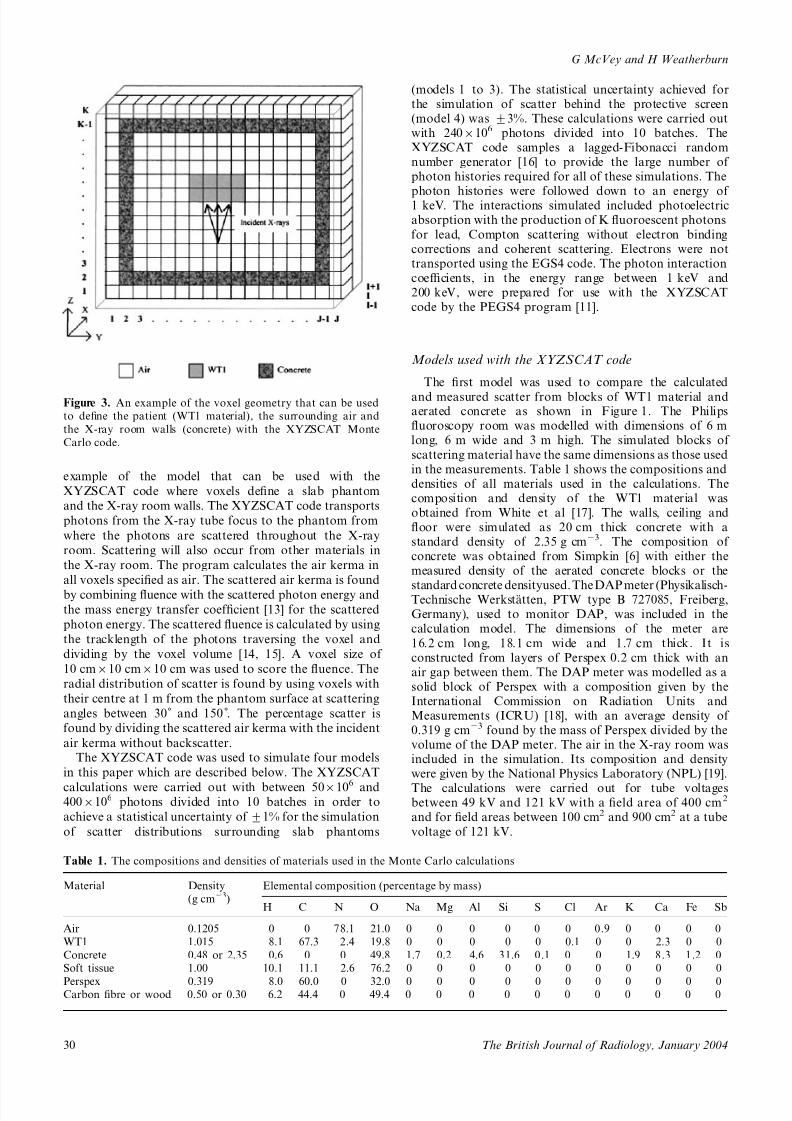
The XYZSCAT code was developed for this study bymodifying the XYZDOS code [12]. Figure 3 shows an
Figure 1. The experimental set up used to measure and calcu-
late the scatter from a phantom supported against one of thewalls with the X-ray tube focus and detector 1 m from the
incident surface of the phantom. DAP, dose–area product.
Figure 2. The experimental set up used to measure and calcu-
late the scatter from a phantom in the centre of the room and
to study the effect of scatter from the X-ray tube head. The
positions of the detector and mobile shield are shown for themeasurements carried out at scattering angles of 45 , 87˚ and
135 . DAP, dose–area product.
A study of scatter in diagnostic X-ray rooms
29The British Journal of Radiology, January 2004
7/28/2019 Scatter Xray Radiation in Concrete
http://slidepdf.com/reader/full/scatter-xray-radiation-in-concrete 3/11
example of the model that can be used with the
XYZSCAT code where voxels define a slab phantom
and the X-ray room walls. The XYZSCAT code transports
photons from the X-ray tube focus to the phantom from
where the photons are scattered throughout the X-ray
room. Scattering will also occur from other materials in
the X-ray room. The program calculates the air kerma in
all voxels specified as air. The scattered air kerma is found
by combining fluence with the scattered photon energy and
the mass energy transfer coefficient [13] for the scattered
photon energy. The scattered fluence is calculated by using
the tracklength of the photons traversing the voxel and
dividing by the voxel volume [14, 15]. A voxel size of
10 cm610 cm610 cm was used to score the fluence. The
radial distribution of scatter is found by using voxels with
their centre at 1 m from the phantom surface at scattering
angles between 30˚ and 150 . The percentage scatter is
found by dividing the scattered air kerma with the incident
air kerma without backscatter.The XYZSCAT code was used to simulate four models
in this paper which are described below. The XYZSCAT
calculations were carried out with between 506106 and4006106 photons divided into 10 batches in order to
achieve a statistical uncertainty of ¡1% for the simulation
of scatter distributions surrounding slab phantoms
(models 1 to 3). The statistical uncertainty achieved forthe simulation of scatter behind the protective screen(model 4) was ¡3%. These calculations were carried outwith 2406106 photons divided into 10 batches. TheXYZSCAT code samples a lagged-Fibonacci randomnumber generator [16] to provide the large number of photon histories required for all of these simulations. The
photon histories were followed down to an energy of 1 keV. The interactions simulated included photoelectricabsorption with the production of K fluoroescent photons
for lead, Compton scattering without electron bindingcorrections and coherent scattering. Electrons were nottransported using the EGS4 code. The photon interactioncoefficients, in the energy range between 1 keV and200 keV, were prepared for use with the XYZSCATcode by the PEGS4 program [11].
Models used with the XYZSCAT code
The first model was used to compare the calculated
and measured scatter from blocks of WT1 material andaerated concrete as shown in Figure 1. The Philipsfluoroscopy room was modelled with dimensions of 6 mlong, 6 m wide and 3 m high. The simulated blocks of
scattering material have the same dimensions as those usedin the measurements. Table 1 shows the compositions anddensities of all materials used in the calculations. Thecomposition and density of the WT1 material wasobtained from White et al [17]. The walls, ceiling andfloor were simulated as 20 cm thick concrete with astandard density of 2.35 g cm23. The composition of concrete was obtained from Simpkin [6] with either themeasured density of the aerated concrete blocks or the
standard concrete densityused. TheDAP meter (Physikalisch-Technische Werkstatten, PTW type B 727085, Freiberg,Germany), used to monitor DAP, was included in thecalculation model. The dimensions of the meter are
16.2 cm long, 18.1 cm wide and 1.7 cm thick. It isconstructed from layers of Perspex 0.2 cm thick with anair gap between them. The DAP meter was modelled as asolid block of Perspex with a composition given by theInternational Commission on Radiation Units andMeasurements (ICRU) [18], with an average density of 0.319 g cm23 found by the mass of Perspex divided by thevolume of the DAP meter. The air in the X-ray room wasincluded in the simulation. Its composition and densitywere given by the National Physics Laboratory (NPL) [19].
The calculations were carried out for tube voltagesbetween 49 kV and 121 kV with a field area of 400 cm2
and for field areas between 100 cm2 and 900 cm2 at a tube
voltage of 121 kV.
Figure 3. An example of the voxel geometry that can be used
to define the patient (WT1 material), the surrounding air and
the X-ray room walls (concrete) with the XYZSCAT Monte
Carlo code.
Table 1. The compositions and densities of materials used in the Monte Carlo calculations
Material Density
(g cm23)
Elemental composition (percentage by mass)
H C N O Na Mg Al Si S Cl Ar K Ca Fe Sb
Air 0.1205 0 0 78.1 21.0 0 0 0 0 0 0 0.9 0 0 0 0
WT1 1.015 8.1 67.3 2.4 19.8 0 0 0 0 0 0.1 0 0 2.3 0 0
Concrete 0.48 or 2.35 0.6 0 0 49.8 1.7 0.2 4.6 31.6 0.1 0 0 1.9 8.3 1.2 0
Soft tissue 1.00 10.1 11.1 2.6 76.2 0 0 0 0 0 0 0 0 0 0 0
Perspex 0.319 8.0 60.0 0 32.0 0 0 0 0 0 0 0 0 0 0 0Carbon fibre or wood 0.50 or 0.30 6.2 44.4 0 49.4 0 0 0 0 0 0 0 0 0 0 0
G McVey and H Weatherburn
30 The British Journal of Radiology, January 2004
7/28/2019 Scatter Xray Radiation in Concrete
http://slidepdf.com/reader/full/scatter-xray-radiation-in-concrete 4/11
The second model was used to investigate the scatterfrom the X-ray tube head as shown in Figure 2. The
calculations were carried out for tube voltages between
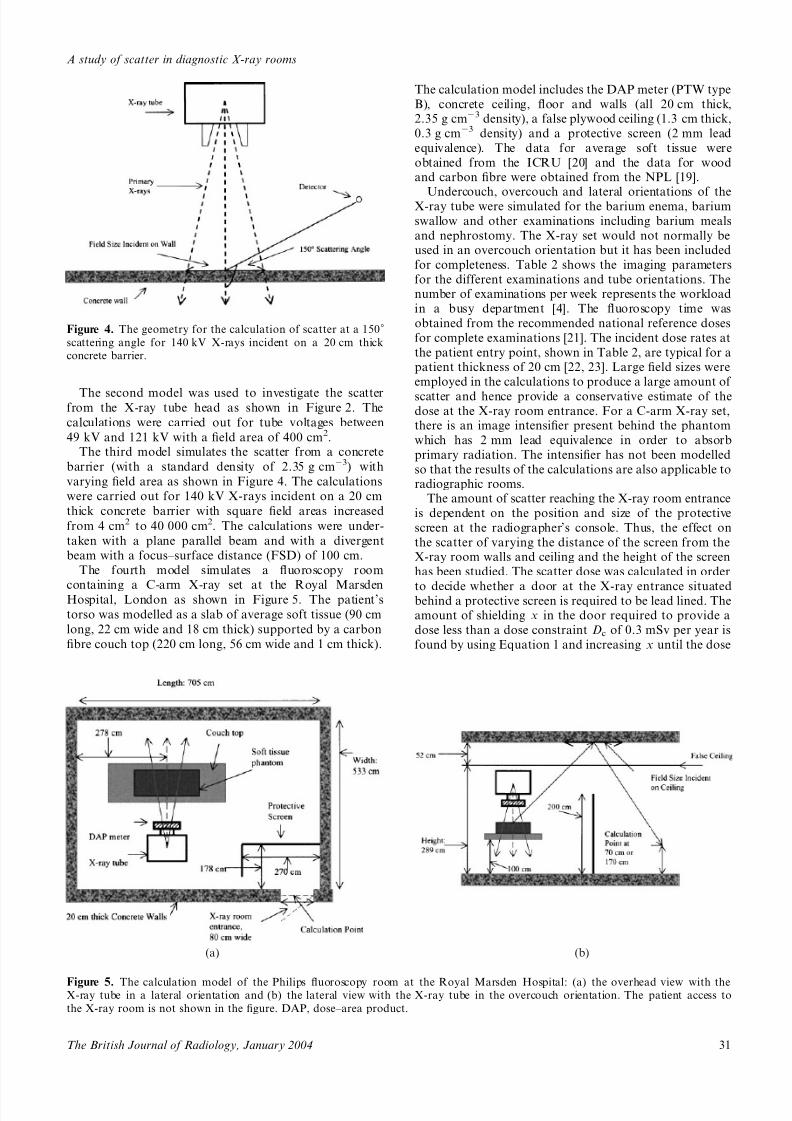
49 kV and 121 kV with a field area of 400 cm2.The third model simulates the scatter from a concrete
barrier (with a standard density of 2.35 g cm23) with
varying field area as shown in Figure 4. The calculations
were carried out for 140 kV X-rays incident on a 20 cm
thick concrete barrier with square field areas increased
from 4 cm2 to 40 000 cm2. The calculations were under-
taken with a plane parallel beam and with a divergent
beam with a focus–surface distance (FSD) of 100 cm.
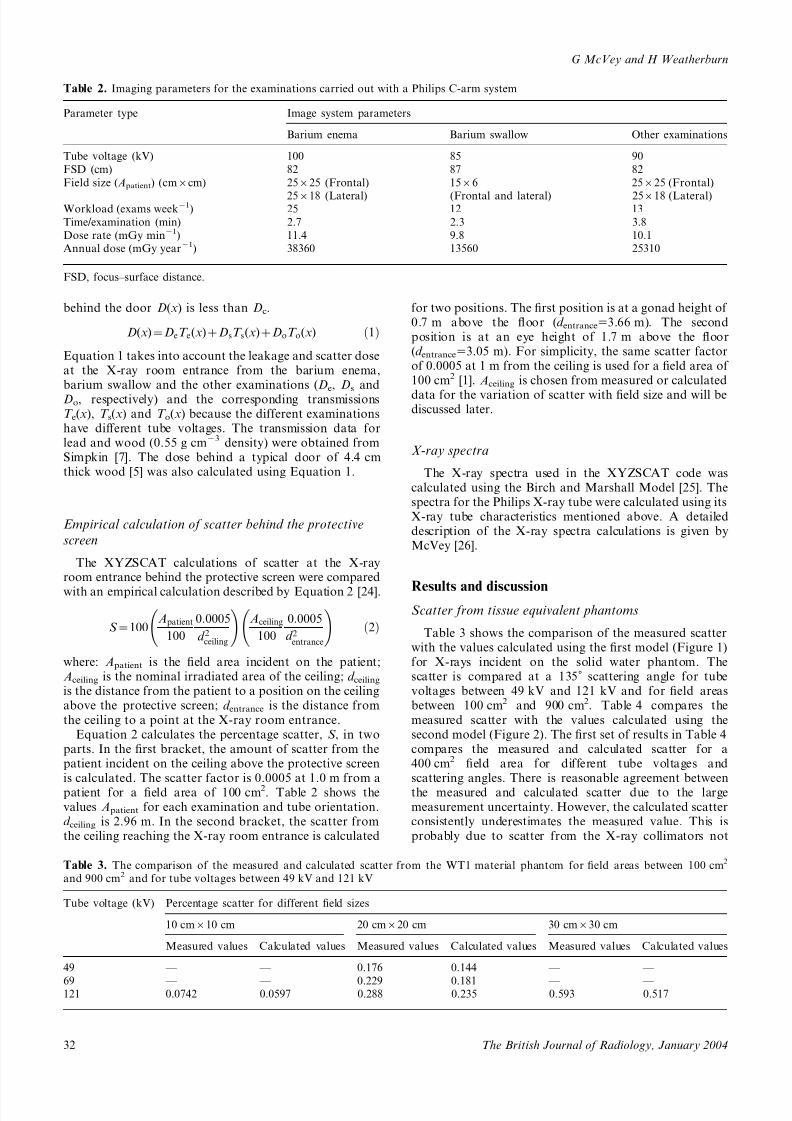
The fourth model simulates a fluoroscopy room
containing a C-arm X-ray set at the Royal MarsdenHospital, London as shown in Figure 5. The patient’s
torso was modelled as a slab of average soft tissue (90 cm
long, 22 cm wide and 18 cm thick) supported by a carbon
fibre couch top (220 cm long, 56 cm wide and 1 cm thick).
The calculation model includes the DAP meter (PTW type
B), concrete ceiling, floor and walls (all 20 cm thick,2.35 g cm23 density), a false plywood ceiling (1.3 cm thick,
0.3 g cm23 density) and a protective screen (2 mm lead
equivalence). The data for average soft tissue were
obtained from the ICRU [20] and the data for woodand carbon fibre were obtained from the NPL [19].
Undercouch, overcouch and lateral orientations of theX-ray tube were simulated for the barium enema, barium
swallow and other examinations including barium meals
and nephrostomy. The X-ray set would not normally beused in an overcouch orientation but it has been included
for completeness. Table 2 shows the imaging parameters
for the different examinations and tube orientations. Thenumber of examinations per week represents the workload
in a busy department [4]. The fluoroscopy time was
obtained from the recommended national reference doses
for complete examinations [21]. The incident dose rates at
the patient entry point, shown in Table 2, are typical for apatient thickness of 20 cm [22, 23]. Large field sizes were
employed in the calculations to produce a large amount of
scatter and hence provide a conservative estimate of thedose at the X-ray room entrance. For a C-arm X-ray set,there is an image intensifier present behind the phantom
which has 2 mm lead equivalence in order to absorb
primary radiation. The intensifier has not been modelled
so that the results of the calculations are also applicable toradiographic rooms.
The amount of scatter reaching the X-ray room entrance
is dependent on the position and size of the protective
screen at the radiographer’s console. Thus, the effect on
the scatter of varying the distance of the screen from theX-ray room walls and ceiling and the height of the screen
has been studied. The scatter dose was calculated in order
to decide whether a door at the X-ray entrance situatedbehind a protective screen is required to be lead lined. Theamount of shielding x in the door required to provide a
dose less than a dose constraint Dc of 0.3 mSv per year is
found by using Equation 1 and increasing x until the dose
(a) (b)
Figure 5. The calculation model of the Philips fluoroscopy room at the Royal Marsden Hospital: (a) the overhead view with theX-ray tube in a lateral orientation and (b) the lateral view with the X-ray tube in the overcouch orientation. The patient access to
the X-ray room is not shown in the figure. DAP, dose–area product.
Figure 4. The geometry for the calculation of scatter at a 150˚scattering angle for 140 kV X-rays incident on a 20 cm thick
concrete barrier.
A study of scatter in diagnostic X-ray rooms
31The British Journal of Radiology, January 2004
7/28/2019 Scatter Xray Radiation in Concrete
http://slidepdf.com/reader/full/scatter-xray-radiation-in-concrete 5/11
behind the door D(x) is less than Dc.
D(x)~DeT e(x)zDsT s(x)zDoT o(x) ð1Þ
Equation 1 takes into account the leakage and scatter doseat the X-ray room entrance from the barium enema,barium swallow and the other examinations (De, Ds andDo, respectively) and the corresponding transmissionsT e(x), T s(x) and T o(x) because the different examinationshave different tube voltages. The transmission data forlead and wood (0.55 g cm23 density) were obtained fromSimpkin [7]. The dose behind a typical door of 4.4 cmthick wood [5] was also calculated using Equation 1.
Empirical calculation of scatter behind the protective
screen
The XYZSCAT calculations of scatter at the X-rayroom entrance behind the protective screen were compared
with an empirical calculation described by Equation 2 [24].
S ~100Apatient
100
0:0005
d 2ceiling
!Aceiling
100
0:0005
d 2entrance
!ð2Þ
where: Apatient is the field area incident on the patient;
Aceiling is the nominal irradiated area of the ceiling; d ceilingis the distance from the patient to a position on the ceilingabove the protective screen; d entrance is the distance from
the ceiling to a point at the X-ray room entrance.Equation 2 calculates the percentage scatter, S , in two
parts. In the first bracket, the amount of scatter from thepatient incident on the ceiling above the protective screenis calculated. The scatter factor is 0.0005 at 1.0 m from apatient for a field area of 100 cm2. Table 2 shows thevalues Apatient for each examination and tube orientation.d ceiling is 2.96 m. In the second bracket, the scatter fromthe ceiling reaching the X-ray room entrance is calculated
for two positions. The first position is at a gonad height of 0.7 m above the floor (d entrance53.66 m). The secondposition is at an eye height of 1.7 m above the floor(d entrance53.05 m). For simplicity, the same scatter factorof 0.0005 at 1 m from the ceiling is used for a field area of 100 cm2 [1]. Aceiling is chosen from measured or calculated
data for the variation of scatter with field size and will bediscussed later.
X-ray spectra
The X-ray spectra used in the XYZSCAT code wascalculated using the Birch and Marshall Model [25]. Thespectra for the Philips X-ray tube were calculated using itsX-ray tube characteristics mentioned above. A detaileddescription of the X-ray spectra calculations is given byMcVey [26].
Results and discussionScatter from tissue equivalent phantoms
Table 3 shows the comparison of the measured scatterwith the values calculated using the first model (Figure 1)for X-rays incident on the solid water phantom. Thescatter is compared at a 135˚ scattering angle for tubevoltages between 49 kV and 121 kV and for field areasbetween 100 cm2 and 900 cm2. Table 4 compares the
measured scatter with the values calculated using thesecond model (Figure 2). The first set of results in Table 4compares the measured and calculated scatter for a400 cm2 field area for different tube voltages andscattering angles. There is reasonable agreement betweenthe measured and calculated scatter due to the largemeasurement uncertainty. However, the calculated scatterconsistently underestimates the measured value. This isprobably due to scatter from the X-ray collimators not
Table 2. Imaging parameters for the examinations carried out with a Philips C-arm system
Parameter type Image system parameters
Barium enema Barium swallow Other examinations
Tube voltage (kV) 100 85 90
FSD (cm) 82 87 82
Field size (Apatient) (cm6cm) 25625 (Frontal) 1566 25625 (Frontal)
25618 (Lateral) (Frontal and lateral) 25618 (Lateral)Workload (exams week21) 25 12 13
Time/examination (min) 2.7 2.3 3.8
Dose rate (mGy min21) 11.4 9.8 10.1
Annual dose (mGy year21) 38360 13560 25310
FSD, focus–surface distance.
Table 3. The comparison of the measured and calculated scatter from the WT1 material phantom for field areas between 100 cm2
and 900 cm2 and for tube voltages between 49 kV and 121 kV
Tube voltage (kV) Percentage scatter for different field sizes
10 cm610 cm 20 cm620 cm 30 cm630 cm
Measured values Calculated values Measured values Calculated values Measured values Calculated values
49 — — 0.176 0.144 — —
69 — — 0.229 0.181 — — 121 0.0742 0.0597 0.288 0.235 0.593 0.517
G McVey and H Weatherburn
32 The British Journal of Radiology, January 2004
7/28/2019 Scatter Xray Radiation in Concrete
http://slidepdf.com/reader/full/scatter-xray-radiation-in-concrete 6/11
accounted for in the XYZSCAT model and is discussed inmore detail in the next section. A rigorous validation of
the XYZSCAT code is described by McVey [26].The measured and calculated scatter is briefly compared
with the values given in the literature. For scatteringangles less than 90 , the measured and calculated scatter(Table 4) tends to be larger than that reported by Troutand Kelley [9] and Williams [8]. This is due to the solidwater block used in our work being thinner than thephantoms used in the published work. For scatteringangles greater than 90 , the measured and calculatedscatter (Tables 3 and 4) is substantially lower than thevalues of Williams [8] and greater than those of Trout andKelley [9] as their experimental arrangement did notinclude a DAP meter. Our values are lower than those of
Williams as in his experimental arrangement the X-raytube head was closer to the phantom which resulted in agreater scatter contribution from the DAP meter.
Both the measured and the calculated scatter have asimilar variation with tube voltage and field area. Thescatter at the 135˚ scattering angle increases by 64% forincreasing the tube voltage from 49 kV to 121 kV. There isalso a linear relationship between the scatter and field areafor slab phantoms. This agrees with the work of Bomfordand Burlin [10] for scatter in the backward direction.Trout and Kelley [9] did not find a linear relationship,which was possibly due to their use of a human torsoshaped phantom. This implies that the variation of scatter
from patients is not linear with field area and needs furtherinvestigation [26].
The effect of scatter from the surrounding materials in
an X-ray room
The second set of results in Table 4 shows the measured
scatter with the mobile shield in place (Figure 2) andcalculations carried out without the DAP meter includedin the simulation. There is reasonable agreement betweenthe measured and calculated percentage scatter due to thelarge measurement uncertainty. In Table 4, the differencesbetween the measured and calculated scatter are decreasedby shielding out the scatter from the X-ray tube head.
The scatter from the X-ray collimators could not readilybe modelled with the XYZSCAT code. Therefore, the
scatter produced by the collimator system was estimated asthe difference between the measured scatter without theshield and the scatter calculated with the DAP meter
included in the model. From Table 4, the scatter producedby the collimator system and its associated uncertainty are
estimated to be between 0.026¡0.008% to 0.077¡0.033%.Therefore, it is a significant proportion of the total
measured scatter. The estimated collimator scatter issimilar to the value of 0.04% measured by Trout andKelley [27].
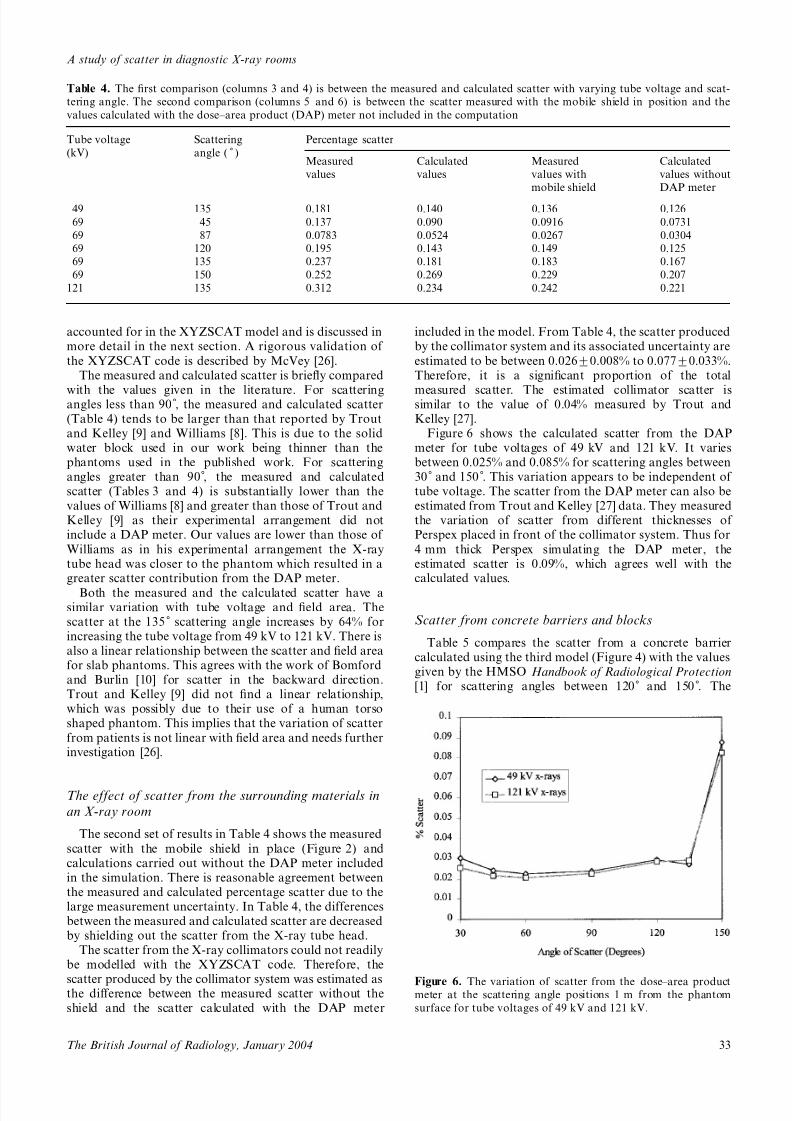
Figure 6 shows the calculated scatter from the DAPmeter for tube voltages of 49 kV and 121 kV. It variesbetween 0.025% and 0.085% for scattering angles between30˚ and 150 . This variation appears to be independent of tube voltage. The scatter from the DAP meter can also beestimated from Trout and Kelley [27] data. They measuredthe variation of scatter from different thicknesses of Perspex placed in front of the collimator system. Thus for
4 mm thick Perspex simulating the DAP meter, theestimated scatter is 0.09%, which agrees well with thecalculated values.
Scatter from concrete barriers and blocks
Table 5 compares the scatter from a concrete barriercalculated using the third model (Figure 4) with the valuesgiven by the HMSO Handbook of Radiological Protection[1] for scattering angles between 120˚ and 150 . The
Table 4. The first comparison (columns 3 and 4) is between the measured and calculated scatter with varying tube voltage and scat-
tering angle. The second comparison (columns 5 and 6) is between the scatter measured with the mobile shield in position and the
values calculated with the dose–area product (DAP) meter not included in the computation
Tube voltage
(kV)
Scattering
angle ( ˚ )
Percentage scatter
Measured
values
Calculated
values
Measured
values with
mobile shield
Calculated
values without
DAP meter
49 135 0.181 0.140 0.136 0.126
69 45 0.137 0.090 0.0916 0.0731
69 87 0.0783 0.0524 0.0267 0.0304
69 120 0.195 0.143 0.149 0.125
69 135 0.237 0.181 0.183 0.167
69 150 0.252 0.269 0.229 0.207
121 135 0.312 0.234 0.242 0.221
Figure 6. The variation of scatter from the dose–area productmeter at the scattering angle positions 1 m from the phantom
surface for tube voltages of 49 kV and 121 kV.
A study of scatter in diagnostic X-ray rooms
33The British Journal of Radiology, January 2004
7/28/2019 Scatter Xray Radiation in Concrete
http://slidepdf.com/reader/full/scatter-xray-radiation-in-concrete 7/11
average of the HMSO scatter factors corresponds to thevalue of 0.0005 used in Equation 2. The table also shows
the comparison of the measured scatter from an aeratedconcrete block with the values calculated using the firstmodel (Figure 1). All values are for a field area of
100 cm2. The HMSO measured values are considerablylarger than the other values as they will include scatter
from the surroundings and they apply to a range of tubevoltages between 100 kV and 300 kV. The calculated andmeasured scatter from the aerated concrete block is largerthan the calculated values from the concrete barrier asthey include scatter from the DAP meter. There is verygood agreement between the measured and calculatedvalues for scatter from the aerated concrete block.
Variation of scatter from a concrete barrier with field
size
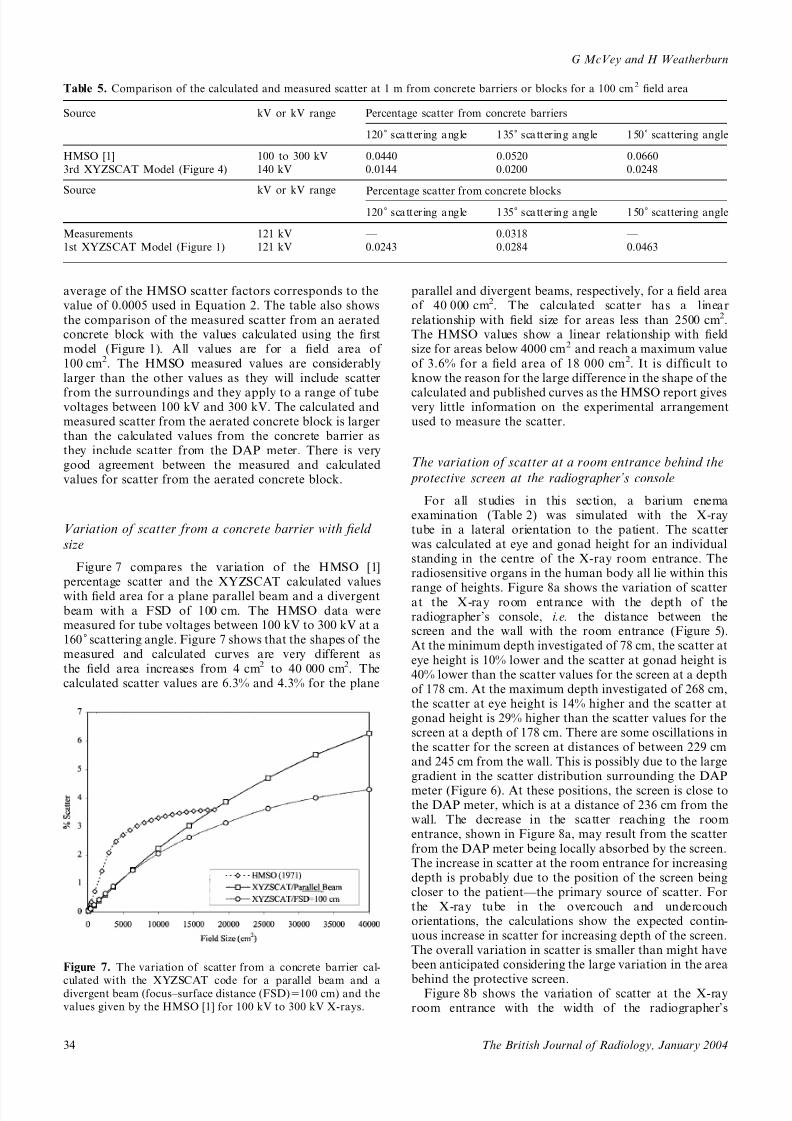
Figure 7 compares the variation of the HMSO [1]percentage scatter and the XYZSCAT calculated valueswith field area for a plane parallel beam and a divergent
beam with a FSD of 100 cm. The HMSO data weremeasured for tube voltages between 100 kV to 300 kV at a160˚ scattering angle. Figure 7 shows that the shapes of themeasured and calculated curves are very different as
the field area increases from 4 cm2 to 40 000 cm2. Thecalculated scatter values are 6.3% and 4.3% for the plane
parallel and divergent beams, respectively, for a field areaof 40 000 cm2. The calculated scatter has a linear
relationship with field size for areas less than 2500 cm2.The HMSO values show a linear relationship with fieldsize for areas below 4000 cm2 and reach a maximum value
of 3.6% for a field area of 18 000 cm2. It is difficult toknow the reason for the large difference in the shape of the
calculated and published curves as the HMSO report givesvery little information on the experimental arrangementused to measure the scatter.
The variation of scatter at a room entrance behind the
protective screen at the radiographer’s console
For all studies in this section, a barium enemaexamination (Table 2) was simulated with the X-raytube in a lateral orientation to the patient. The scatterwas calculated at eye and gonad height for an individualstanding in the centre of the X-ray room entrance. Theradiosensitive organs in the human body all lie within this
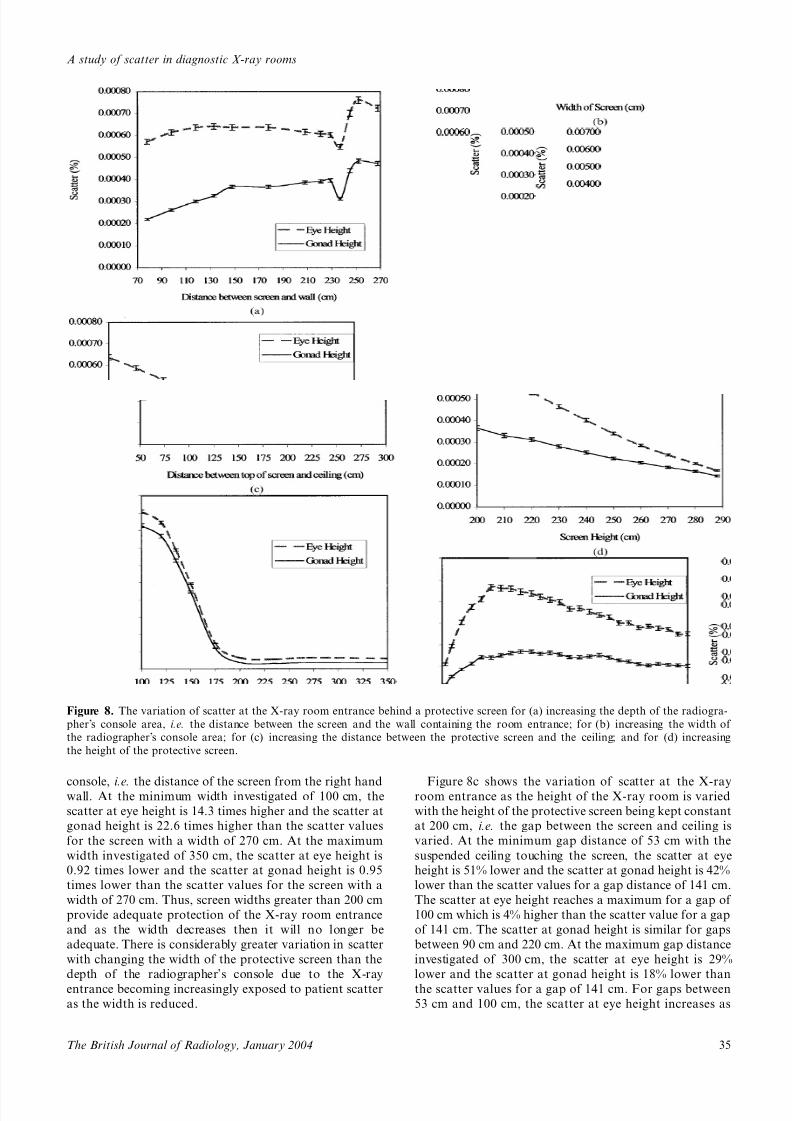
range of heights. Figure 8a shows the variation of scatterat the X-ray room entrance with the depth of theradiographer’s console, i.e. the distance between thescreen and the wall with the room entrance (Figure 5).At the minimum depth investigated of 78 cm, the scatter at
eye height is 10% lower and the scatter at gonad height is40% lower than the scatter values for the screen at a depthof 178 cm. At the maximum depth investigated of 268 cm,the scatter at eye height is 14% higher and the scatter atgonad height is 29% higher than the scatter values for thescreen at a depth of 178 cm. There are some oscillations inthe scatter for the screen at distances of between 229 cmand 245 cm from the wall. This is possibly due to the largegradient in the scatter distribution surrounding the DAP
meter (Figure 6). At these positions, the screen is close tothe DAP meter, which is at a distance of 236 cm from thewall. The decrease in the scatter reaching the roomentrance, shown in Figure 8a, may result from the scatter
from the DAP meter being locally absorbed by the screen.The increase in scatter at the room entrance for increasingdepth is probably due to the position of the screen beingcloser to the patient—the primary source of scatter. Forthe X-ray tube in the overcouch and undercouchorientations, the calculations show the expected contin-uous increase in scatter for increasing depth of the screen.The overall variation in scatter is smaller than might havebeen anticipated considering the large variation in the area
behind the protective screen.Figure 8b shows the variation of scatter at the X-ray
room entrance with the width of the radiographer’s
Figure 7. The variation of scatter from a concrete barrier cal-
culated with the XYZSCAT code for a parallel beam and adivergent beam (focus–surface distance (FSD)5100 cm) and the
values given by the HMSO [1] for 100 kV to 300 kV X-rays.
Table 5. Comparison of the calculated and measured scatter at 1 m from concrete barriers or blocks for a 100 cm2 field area
Source kV or kV range Percentage scatter from concrete barriers
120˚ scattering angle 135˚ scattering angle 150˚ scattering angle
HMSO [1] 100 to 300 kV 0.0440 0.0520 0.0660
3rd XYZSCAT Model (Figure 4) 140 kV 0.0144 0.0200 0.0248
Percentage scatter from concrete blocksSource kV or kV range
120˚ scattering angle 135˚ scattering angle 150˚ scattering angle
Measurements 121 kV — 0.0318 —
1st XYZSCAT Model (Figure 1) 121 kV 0.0243 0.0284 0.0463
G McVey and H Weatherburn
34 The British Journal of Radiology, January 2004
7/28/2019 Scatter Xray Radiation in Concrete
http://slidepdf.com/reader/full/scatter-xray-radiation-in-concrete 8/11
console, i.e. the distance of the screen from the right handwall. At the minimum width investigated of 100 cm, the
scatter at eye height is 14.3 times higher and the scatter at
gonad height is 22.6 times higher than the scatter values
for the screen with a width of 270 cm. At the maximum
width investigated of 350 cm, the scatter at eye height is
0.92 times lower and the scatter at gonad height is 0.95
times lower than the scatter values for the screen with a
width of 270 cm. Thus, screen widths greater than 200 cm
provide adequate protection of the X-ray room entrance
and as the width decreases then it will no longer be
adequate. There is considerably greater variation in scatter
with changing the width of the protective screen than the
depth of the radiographer’s console due to the X-ray
entrance becoming increasingly exposed to patient scatter
as the width is reduced.
Figure 8c shows the variation of scatter at the X-rayroom entrance as the height of the X-ray room is varied
with the height of the protective screen being kept constant
at 200 cm, i.e. the gap between the screen and ceiling is
varied. At the minimum gap distance of 53 cm with the
suspended ceiling touching the screen, the scatter at eye
height is 51% lower and the scatter at gonad height is 42%
lower than the scatter values for a gap distance of 141 cm.
The scatter at eye height reaches a maximum for a gap of
100 cm which is 4% higher than the scatter value for a gap
of 141 cm. The scatter at gonad height is similar for gaps
between 90 cm and 220 cm. At the maximum gap distance
investigated of 300 cm, the scatter at eye height is 29%
lower and the scatter at gonad height is 18% lower than
the scatter values for a gap of 141 cm. For gaps between
53 cm and 100 cm, the scatter at eye height increases as
Figure 8. The variation of scatter at the X-ray room entrance behind a protective screen for (a) increasing the depth of the radiogra-
pher’s console area, i.e. the distance between the screen and the wall containing the room entrance; for (b) increasing the width of
the radiographer’s console area; for (c) increasing the distance between the protective screen and the ceiling; and for (d) increasing
the height of the protective screen.
A study of scatter in diagnostic X-ray rooms
35The British Journal of Radiology, January 2004
7/28/2019 Scatter Xray Radiation in Concrete
http://slidepdf.com/reader/full/scatter-xray-radiation-in-concrete 9/11
the area on the ceiling from which the scatter can reachthis position increases more rapidly than the square of thedistance from the ceiling. For gaps between 100 cm and300 cm, the scatter decreases as the area on the ceilingincreases less rapidly than the square of the distance fromthe ceiling.
Figure 8d shows the variation of scatter at the X-ray
room entrance when the height of the protective screen isincreased from a minimum height of 200 cm [4] until ittouches the suspended ceiling at a height of 288 cm. With
the protective screen touching the suspended ceiling, thescatter at eye height is 74% lower and the scatter at gonadheight 61% lower than the scatter values for a screenheight of 200 cm. The scatter values at eye and gonadheight tend to converge for increasing screen height. Thisimplies that the solid angle into which the scatter from theceiling can reach both the eyes and the gonads is similarfor a screen height of 288 cm.
Scatter dose at a room entrance behind the protective
screen at the radiographer’s console
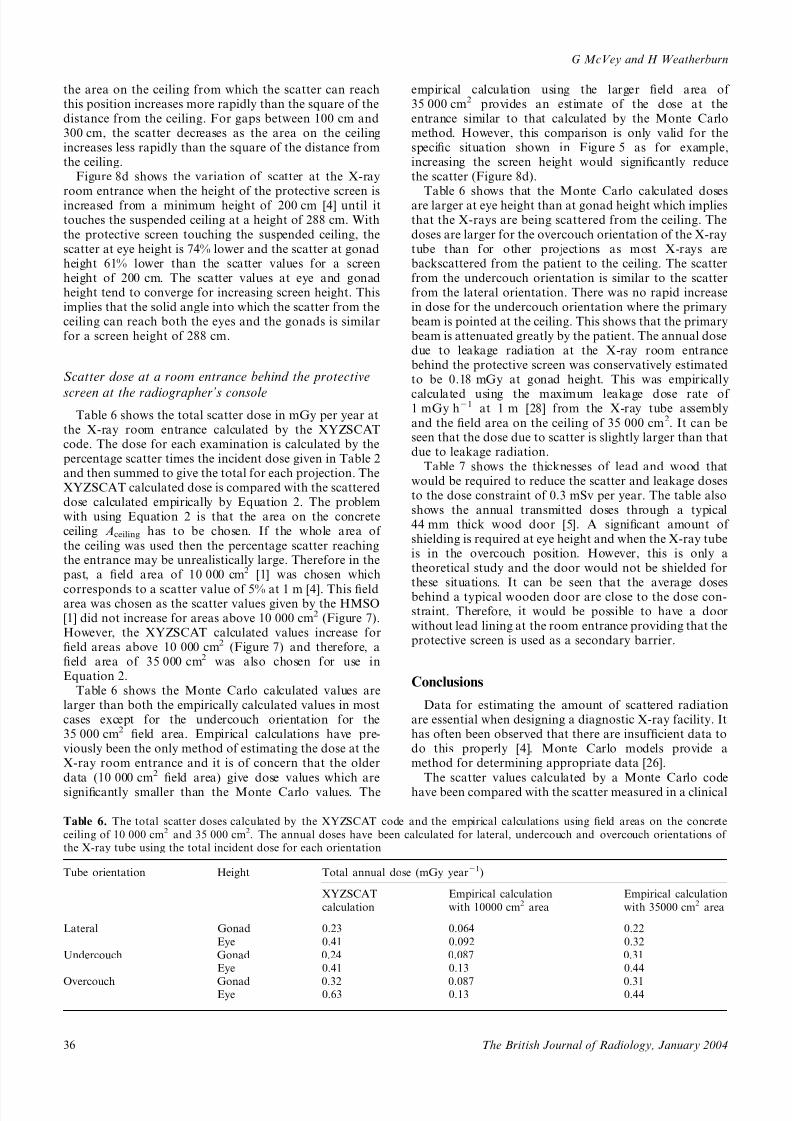
Table 6 shows the total scatter dose in mGy per year atthe X-ray room entrance calculated by the XYZSCATcode. The dose for each examination is calculated by thepercentage scatter times the incident dose given in Table 2and then summed to give the total for each projection. TheXYZSCAT calculated dose is compared with the scattereddose calculated empirically by Equation 2. The problemwith using Equation 2 is that the area on the concreteceiling Aceiling has to be chosen. If the whole area of
the ceiling was used then the percentage scatter reachingthe entrance may be unrealistically large. Therefore in thepast, a field area of 10 000 cm2 [1] was chosen which
corresponds to a scatter value of 5% at 1 m [4]. This fieldarea was chosen as the scatter values given by the HMSO[1] did not increase for areas above 10 000 cm2 (Figure 7).However, the XYZSCAT calculated values increase forfield areas above 10 000 cm2 (Figure 7) and therefore, afield area of 35 000 cm2 was also chosen for use inEquation 2.
Table 6 shows the Monte Carlo calculated values arelarger than both the empirically calculated values in mostcases except for the undercouch orientation for the35 000 cm2 field area. Empirical calculations have pre-viously been the only method of estimating the dose at theX-ray room entrance and it is of concern that the older
data (10 000 cm2 field area) give dose values which aresignificantly smaller than the Monte Carlo values. The
empirical calculation using the larger field area of 35 000 cm2 provides an estimate of the dose at theentrance similar to that calculated by the Monte Carlomethod. However, this comparison is only valid for thespecific situation shown in Figure 5 as for example,increasing the screen height would significantly reducethe scatter (Figure 8d).
Table 6 shows that the Monte Carlo calculated dosesare larger at eye height than at gonad height which impliesthat the X-rays are being scattered from the ceiling. The
doses are larger for the overcouch orientation of the X-raytube than for other projections as most X-rays arebackscattered from the patient to the ceiling. The scatterfrom the undercouch orientation is similar to the scatterfrom the lateral orientation. There was no rapid increasein dose for the undercouch orientation where the primarybeam is pointed at the ceiling. This shows that the primarybeam is attenuated greatly by the patient. The annual dosedue to leakage radiation at the X-ray room entrancebehind the protective screen was conservatively estimatedto be 0.18 mGy at gonad height. This was empirically
calculated using the maximum leakage dose rate of 1 mGy h21 at 1 m [28] from the X-ray tube assembly
and the field area on the ceiling of 35 000 cm2. It can beseen that the dose due to scatter is slightly larger than thatdue to leakage radiation.
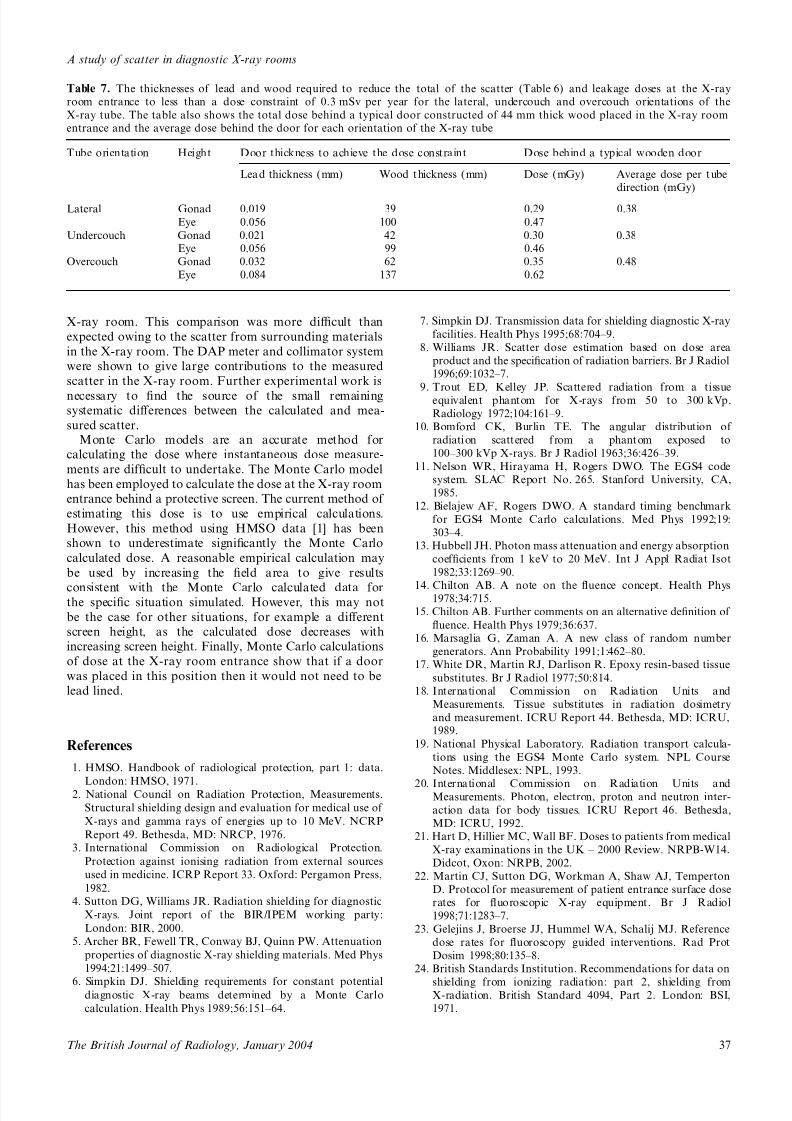
Table 7 shows the thicknesses of lead and wood thatwould be required to reduce the scatter and leakage dosesto the dose constraint of 0.3 mSv per year. The table alsoshows the annual transmitted doses through a typical44 mm thick wood door [5]. A significant amount of shielding is required at eye height and when the X-ray tubeis in the overcouch position. However, this is only atheoretical study and the door would not be shielded forthese situations. It can be seen that the average dosesbehind a typical wooden door are close to the dose con-straint. Therefore, it would be possible to have a doorwithout lead lining at the room entrance providing that theprotective screen is used as a secondary barrier.
Conclusions
Data for estimating the amount of scattered radiationare essential when designing a diagnostic X-ray facility. Ithas often been observed that there are insufficient data todo this properly [4]. Monte Carlo models provide amethod for determining appropriate data [26].
The scatter values calculated by a Monte Carlo codehave been compared with the scatter measured in a clinical
Table 6. The total scatter doses calculated by the XYZSCAT code and the empirical calculations using field areas on the concrete
ceiling of 10 000 cm2 and 35 000 cm2. The annual doses have been calculated for lateral, undercouch and overcouch orientations of
the X-ray tube using the total incident dose for each orientation
Tube orientation Height Total annual dose (mGy year21)
XYZSCAT
calculation
Empirical calculation
with 10000 cm2 area
Empirical calculation
with 35000 cm2 area
Lateral Gonad 0.23 0.064 0.22
Eye 0.41 0.092 0.32
Undercouch Gonad 0.24 0.087 0.31
Eye 0.41 0.13 0.44
Overcouch Gonad 0.32 0.087 0.31Eye 0.63 0.13 0.44
G McVey and H Weatherburn
36 The British Journal of Radiology, January 2004
7/28/2019 Scatter Xray Radiation in Concrete
http://slidepdf.com/reader/full/scatter-xray-radiation-in-concrete 10/11
X-ray room. This comparison was more difficult than
expected owing to the scatter from surrounding materials
in the X-ray room. The DAP meter and collimator system
were shown to give large contributions to the measured
scatter in the X-ray room. Further experimental work is
necessary to find the source of the small remainingsystematic differences between the calculated and mea-
sured scatter.Monte Carlo models are an accurate method for
calculating the dose where instantaneous dose measure-
ments are difficult to undertake. The Monte Carlo model
has been employed to calculate the dose at the X-ray room
entrance behind a protective screen. The current method of
estimating this dose is to use empirical calculations.
However, this method using HMSO data [1] has been
shown to underestimate significantly the Monte Carlo
calculated dose. A reasonable empirical calculation may
be used by increasing the field area to give results
consistent with the Monte Carlo calculated data forthe specific situation simulated. However, this may not
be the case for other situations, for example a different
screen height, as the calculated dose decreases with
increasing screen height. Finally, Monte Carlo calculations
of dose at the X-ray room entrance show that if a door
was placed in this position then it would not need to be
lead lined.
References
1. HMSO. Handbook of radiological protection, part 1: data.
London: HMSO, 1971.2. National Council on Radiation Protection, Measurements.
Structural shielding design and evaluation for medical use of
X-rays and gamma rays of energies up to 10 MeV. NCRP
Report 49. Bethesda, MD: NRCP, 1976.
3. International Commission on Radiological Protection.
Protection against ionising radiation from external sources
used in medicine. ICRP Report 33. Oxford: Pergamon Press,
1982.
4. Sutton DG, Williams JR. Radiation shielding for diagnostic
X-rays. Joint report of the BIR/IPEM working party:
London: BIR, 2000.
5. Archer BR, Fewell TR, Conway BJ, Quinn PW. Attenuation
properties of diagnostic X-ray shielding materials. Med Phys
1994;21:1499–507.
6. Simpkin DJ. Shielding requirements for constant potentialdiagnostic X-ray beams determined by a Monte Carlo
calculation. Health Phys 1989;56:151–64.
7. Simpkin DJ. Transmission data for shielding diagnostic X-ray
facilities. Health Phys 1995;68:704–9.
8. Williams JR. Scatter dose estimation based on dose area
product and the specification of radiation barriers. Br J Radiol
1996;69:1032–7.
9. Trout ED, Kelley JP. Scattered radiation from a tissueequivalent phantom for X-rays from 50 to 300 kVp.
Radiology 1972;104:161–9.
10. Bomford CK, Burlin TE. The angular distribution of
radiation scattered from a phantom exposed to
100–300 kVp X-rays. Br J Radiol 1963;36:426–39.
11. Nelson WR, Hirayama H, Rogers DWO. The EGS4 code
system. SLAC Report No. 265. Stanford University, CA,
1985.
12. Bielajew AF, Rogers DWO. A standard timing benchmark
for EGS4 Monte Carlo calculations. Med Phys 1992;19:
303–4.
13. Hubbell JH. Photon mass attenuation and energy absorption
coefficients from 1 keV to 20 MeV. Int J Appl Radiat Isot
1982;33:1269–90.
14. Chilton AB. A note on the fluence concept. Health Phys1978;34:715.
15. Chilton AB. Further comments on an alternative definition of
fluence. Health Phys 1979;36:637.
16. Marsaglia G, Zaman A. A new class of random number
generators. Ann Probability 1991;1:462–80.
17. White DR, Martin RJ, Darlison R. Epoxy resin-based tissue
substitutes. Br J Radiol 1977;50:814.
18. International Commission on Radiation Units and
Measurements. Tissue substitutes in radiation dosimetry
and measurement. ICRU Report 44. Bethesda, MD: ICRU,
1989.
19. National Physical Laboratory. Radiation transport calcula-
tions using the EGS4 Monte Carlo system. NPL Course
Notes. Middlesex: NPL, 1993.
20. International Commission on Radiation Units andMeasurements. Photon, electron, proton and neutron inter-
action data for body tissues. ICRU Report 46. Bethesda,
MD: ICRU, 1992.
21. Hart D, Hillier MC, Wall BF. Doses to patients from medical
X-ray examinations in the UK – 2000 Review. NRPB-W14.
Didcot, Oxon: NRPB, 2002.
22. Martin CJ, Sutton DG, Workman A, Shaw AJ, Temperton
D. Protocol for measurement of patient entrance surface dose
rates for fluoroscopic X-ray equipment. Br J Radiol
1998;71:1283–7.
23. Gelejins J, Broerse JJ, Hummel WA, Schalij MJ. Reference
dose rates for fluoroscopy guided interventions. Rad Prot
Dosim 1998;80:135–8.
24. British Standards Institution. Recommendations for data on
shielding from ionizing radiation: part 2, shielding fromX-radiation. British Standard 4094, Part 2. London: BSI,
1971.
Table 7. The thicknesses of lead and wood required to reduce the total of the scatter (Table 6) and leakage doses at the X-ray
room entrance to less than a dose constraint of 0.3 mSv per year for the lateral, undercouch and overcouch orientations of the
X-ray tube. The table also shows the total dose behind a typical door constructed of 44 mm thick wood placed in the X-ray room
entrance and the average dose behind the door for each orientation of the X-ray tube
Tube orientation Height Door thickness to achieve the dose constraint Dose behind a typical wooden door
Lead thickness (mm) Wood thickness (mm) Dose (mGy) Average dose per tube
direction (mGy)
Lateral Gonad 0.019 39 0.29 0.38
Eye 0.056 100 0.47
Undercouch Gonad 0.021 42 0.30 0.38
Eye 0.056 99 0.46
Overcouch Gonad 0.032 62 0.35 0.48
Eye 0.084 137 0.62
A study of scatter in diagnostic X-ray rooms
37The British Journal of Radiology, January 2004

7/28/2019 Scatter Xray Radiation in Concrete
http://slidepdf.com/reader/full/scatter-xray-radiation-in-concrete 11/11
25. Birch R, Marshall M. Computation of bremsstrahlung X-ray
spectra and comparison with spectra measured with a Ge(Li)
detector. Phys Med Biol 1979;24:505–17.
26. McVey GH. Monte Carlo computing applied to X-ray room
design. D.Phil. Thesis, University of Oxford, 2002.
27. Trout ED, Kelley JP. Scattered radiation in a phantom from
diagnostic quality radiation. Radiology 1965;85:546–54.
28. National Radiological Protection Board. Guidance notes
for the protection of persons against ionising radiations
arising from medical and dental use. London: HMSO, 1988.
G McVey and H Weatherburn
38 The British Journal of Radiology, January 2004