Embed Size (px)
Citation preview

Scenario building for future watermanagement in the Chakir Basin
Professor V.A. Dukhovny14 December, 2006 , Hohenheim

Population
83%
9%8%
Uzbe kistan*Tas.province **Tashke nt city
Export/import in Tashke nt province
56%
44% ExportImport
Gross production vo lume
76%
16%
8%
Uzbe kistan*
Tas.province **Tashke nt city
Agricultura l production
89%
11%
Uzbe kistan*Tas.province **
Industria l production
69%
18%
13%
Uzbe kistan*Tas.province **Tashke nt city
Ele ctric e ne rgy production
55%44%
1%
Uzbe kistan*
Tas.province **Tashke ntcity

Scenarios as
a part of SP
indicator of water sufficiency limitation
information tools requirement
SP
EUFWD MDGs
Analyze Scenarios Plan actions
IWRM principles
Data base
DSS
LAM
H Mod Agrarian
SEM Environment
Priority
Public opinion
Potential of development
Institutions
Law
Governance in water
Monitoring system
MS Ecological
situation and biodiversity
Water – soil - relations
data base
inform. system
modeling
risk analyze

Dependence of population wellbeingon Water Sector
525827Contribution ofwater to generationof national income,%
184073 %
9439100 %
126052 %
Water availabilityby own waterresources,m3/cap/year
0.10.20.3Irrigated area percapita, ha
685332Employment inWater – connectedsphere %
59.66644Rural population, %UzbekistanKyrgyzstanKazakhstanParameter

Analytical survey� assessment of the environment� assessment of present water conditions� identification of destabilizing factors� assessment of existing material,
financial and other resources� evaluation of available water
development� assessment of institutional and legal
aspects� identification of the key challenges of
future development

Growth of population, %

Saldo of migration populationpersons

Dynamic of investment on all sourceson Tashkent province, mln. $

Present environmentallosses:
Toxicological risk – 3.3 mln USD:Fish productivity – 1.05 mln USD;Human health – 10.0 mln USD;Agricultural – 12.5 mln USD.

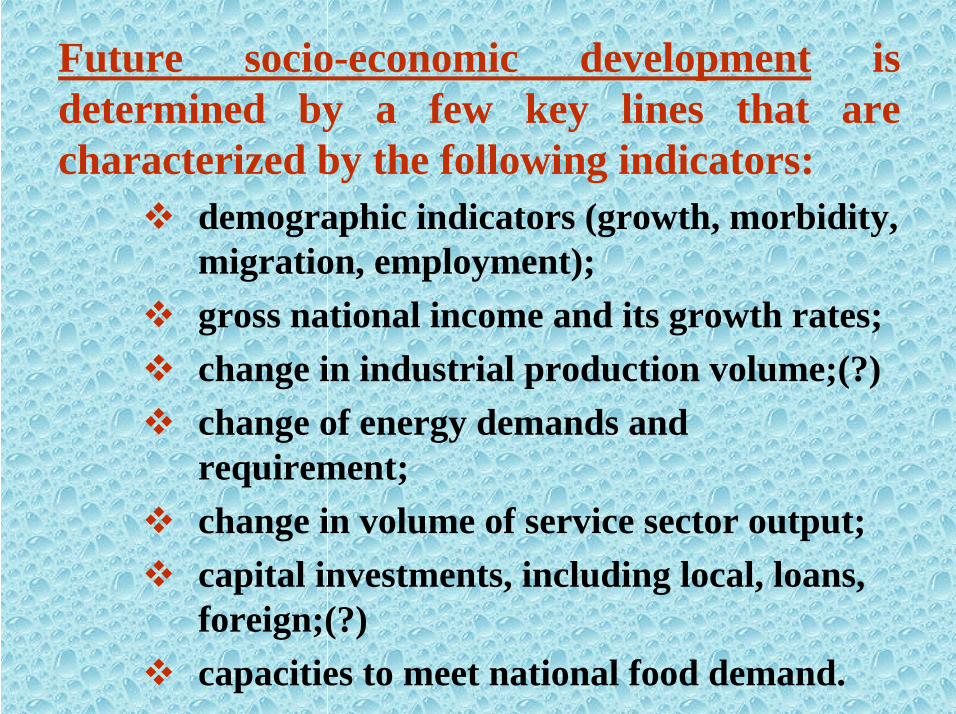
Future socio-economic development isdetermined by a few key lines that arecharacterized by the following indicators:
� demographic indicators (growth, morbidity,migration, employment);
� gross national income and its growth rates;� change in industrial production volume;(?)� change of energy demands and
requirement;� change in volume of service sector output;� capital investments, including local, loans,
foreign;(?)� capacities to meet national food demand.

Dynamics of main crop yields inTashkent province, t/ha
0
5
1 0
1 5
2 0
2 5
3 0
c e r e a ls 2 , 4 2 , 2 1 , 9 2 , 9 3 , 2 4 , 1c o r n 7 , 5 3 , 4 3 , 6 2 , 5 3 , 1 3 , 7r ic e 5 , 5 5 , 3 5 , 1 3 , 4 3 , 7 4r a w c o t t o n 3 , 7 3 , 1 2 , 9 2 , 6 2 , 4 2p o t a t o 1 0 , 5 8 , 7 6 , 5 9 , 2 1 5 , 5 2 1 , 2v e g e t a b le s 2 4 2 2 , 5 2 1 , 8 2 0 , 9 2 2 , 6 2 2 , 5c u c u r b i t s 1 8 , 2 1 7 , 6 1 6 , 2 1 3 1 6 , 9 1 7
1 9 8 1 1 9 8 5 1 9 9 0 1 9 9 5 2 0 0 0 2 0 0 3

Specific driving forces for countries intransition (1)
� Socio-economic scenario
� Demography:
� Transnational migration of population;� Internal migration – urban - rural;� Internal zonal migration;� Resettlement of qualified staff.
� Macroeconomics:
� State priorities;� Industrial decline and available non-used capacities;� Transport availability;� Investment possibilities;

� Foreign investments;� Investment climate;� Internal market and internal prices.
c) agricultural development
� Public policy on restructurization and planning;� Agricultural support;� Water and irrigation priorities;� Possibility and wish to reclaim and develop irrigated
lands;� Family support;� Service and market infrastructure establishment;� Extension service;� Price and tax system;� Link with the world food market;� Ratio between market and purchasing prices.

Relationship between yield of land incooperative and private farms, tn/ha on2003
1.4129.921.10Potato
1.775.73.21Fruits
2.054.92.38Grape
1.3430.322.48Vegetable
1.194.63.84Corn
RatioPrivatefarms
Cooperativefarms
Crop
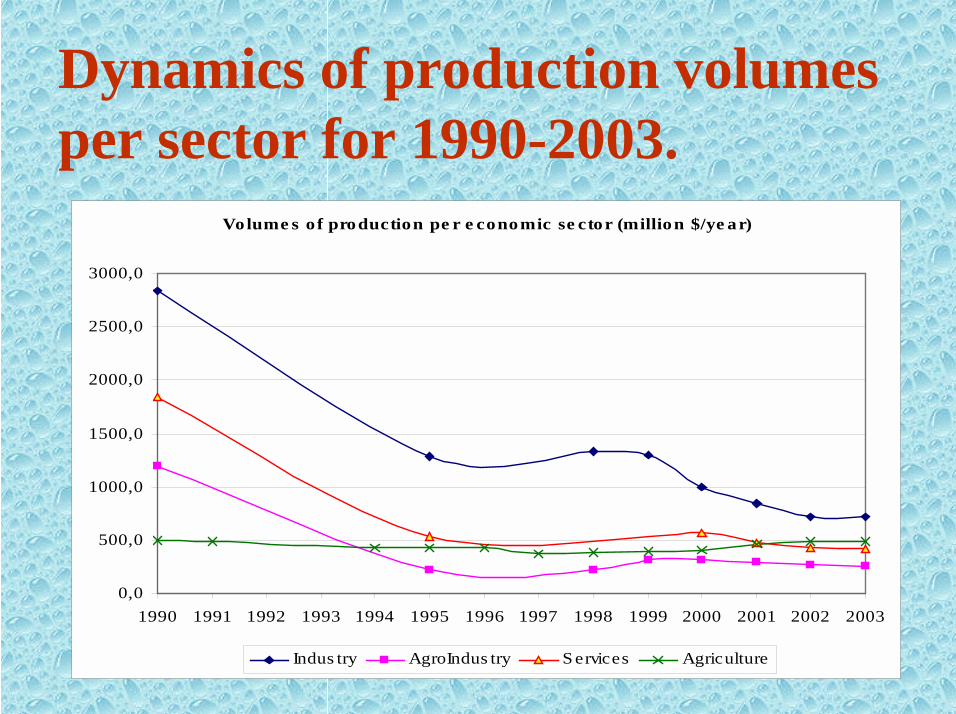
Dynamics of production volumesper sector for 1990-2003.
Volume s of production pe r e conomic se ctor (million $/ye ar)
0,0
500,0
1000,0
1500,0
2000,0
2500,0
3000,0
1990 1991 1992 1993 1994 1995 1996 1997 1998 1999 2000 2001 2002 2003
Indus try AgroIndus try S ervices Agriculture

Sequence of combination ofScenarios
�Water resource (regime, quantity) arecreated by combination of four options –two climatic and two water farming
C 2 WoptC 2 W02C 1 WoptC 1 W01
WoptW0
Water developmentscenarios
ClimaticScenarios

��Water demand is defined on the basisWater demand is defined on the basisof building boundary curves for social-of building boundary curves for social-economic and agricultural scenarioseconomic and agricultural scenarios(BAU and optimistic) by the(BAU and optimistic) by thecomparison of needed and requiredcomparison of needed and requiredinvestments. Combination balanceinvestments. Combination balancebetween Water resources and waterbetween Water resources and waterdemands will permit to checkdemands will permit to checkrequirement of environmentalrequirement of environmentalscenarios.scenarios.
• Population growth trend is at the same level (forboth rural and urban population)
• Economic growth at current level (2003-2005)• Economic structure without changes• Industry and services without changes• Capital investment amount at the same level• Extension of private farming, gradual transition to
free market economy.• As to irrigated agriculture, no changes in:
� institutional aspects of water management and actual waterdelivery regime;
� costs for rehabilitation and maintenance of inter- and on-farmirrigation and drainage systems.
� machinery maintenance costs.
Business as usual scenario

Stable population
• Moderate, sustainable economicgrowth.
• Gradual sustainable industrialdevelopment, full use of potential.
• Increased role of private small andmedium scale business.
• In irrigated agriculture:� speeded up privatization of farms, with
appropriate raise in farmers’ income;� institutional changes, implementation of IWRM;
Optimistic scenario

Socia l economic and agriculture scenarius
22002600
4800
460 5201058
1900
480
2800
0
500
1000
1500
2000
2500
3000
3500
4000
4500
5000
2003 2010 2020 2030
Optim is tic SE Optim is tic a gricultura l BAU SE BAU a griculture
F Volum e of production m ln.USD
15000
450
Inv

d i r e c t c o u p l i n g b a c k c o u p l i n g i n f o r m a t i o n p r o v i s i o n i n t e g r a t i o n
D i a g r a m o f r e l a t i o n s b e t w e e n m o d e l s
C l i m a t i c b l o c k a n d W e i m o d e l
H B W – I W S f l o w f o r m a t i o n
z o n e
D B
M o d f l o w ( g r o u n d w a t e r )
W E A P – • i r - s y s t e m m o d e l ; • o t h e r r e q u i r e m e n t s
H B W G A M S -C h i r c h i k m o d e l
• b a l a n c e • r e g u l a t i o n
M o s D e w
S E M
M o n e r i s
Q u a l - C h i r c h i k i n c l u d i n g W a v e
S L Y S Y S - C h i r c h i k

How to find needed scenario ?Sequence of options . .
•• Restructuring of farmsRestructuring of farms•• Increasing input of fertilizersIncreasing input of fertilizers•• Change of crop patternsChange of crop patterns•• Approach to credit lineApproach to credit line•• Reallocation of state investmentsReallocation of state investments•• Rehabilitation of irrigation systemRehabilitation of irrigation system•• Modernization of irrigation techniqueModernization of irrigation technique•• Creation of market infrastructureCreation of market infrastructure•• And othersAnd others
COMPARISON OF INDICATORS FORSELECTION OF SCENARIOS
• Balance of water: resources and demands• Balance of investments in sectors and total• Satisfaction of ecological requirement• Growth of GDP per capita• Growth of employment• Balance of energy: resources and demands• Satisfaction of food basket

Managing system of water resourcesBWO “Syrdarya”Transboundary surface waters
ICWC
Keles irrigation unit
South Kazakhstan
province SCWR26 th. ha
Chichik basinorganization of
irrigation systems,Minagrowater Uz
382 th. ha
Reservoirs and HESJSC “Uzbekpower”2,5km3, 1230 MWt
Ground waters confirmed resources Ministry of
Geology
Irrigation systems and water canals
WUAs shirkats state farms

Transfer to hydro environmentalTransfer to hydro environmentalmanagement (proposal)management (proposal)
Council of CHAKIR subbasin
BWO Syrdarya Water Council
Public council of
KIS
Keles irrigation unit
Reservouirs and HES
Management Board
Chirchik Basin Irrigation System
Federation of WUA
NGOs Chakir
federation
Tashkent province
Sounth Kazakh province
Djalalabad province
En
viro
nmen
tal C
omm
etee
s