Embed Size (px)
Citation preview
International Journal of SME Development 77 78 Scenario of Productivity Measures and Their Applications in Improving Operational Performance of Manufacturing SMEs
Scenario of Productivity Measures and Their
Applications in Improving Operational Performance of
Manufacturing SMEs
M. Muhshin Aziz Khan*1
Md. Ariful Islam**2
Abstract
This study investigated the overall scenario of the application of productivity measures in
manufacturing organizations of Bangladesh. It also verified the applicability of different
productivity measures in strategic decision making, particularly in operational
performance. For this, multiple case studies have been carried out to build up a scenario
of how the manufacturing SMEs in Bangladesh measure their productivity and how the
productivity measures are applied in operational strategy. Finally, a longitudinal in-
depth case study has been conducted to verify what type of productivity measures are
suitable in decision making in terms of improving operational performance. The findings
of the study confirm that the case organizations do not apply any scientific productivity
measures either for strategic decision making or for assessing operational performance.
Rather, they assess their overall business performance solely based on total profit or
loss. The outcomes of the longitudinal case study confirm that a single measure of
productivity alone cannot be appropriate as a strategic decision making tool while
measuring operational or business performance. Rather, the single measure can easily
mislead the decision. The study finds the loopholes in applications of different
productivity measures used in decision making on operational performance. This paper
presents the reasons behind not utilizing productivity measures in case organizations and
highlights the key issues involved in different productivity measures and their
applicability in practice.
Keywords: Productivity, Measurement, Application, Manufacturing Organization
* Professor, Department of Industrial and Production Engineering, Shahjalal University of
Science and Technology, Sylhet, Bangladesh, E-mail: [email protected]
** Corresponding Author. Professor, Department of Industrial and Production Engineering,
Shahjalal University of Science and Technology, Sylhet, Bangladesh. E-mail: arif-
1.0 Introduction
The manufacturing sector contributes significantly to GDP growth in
Bangladesh. This sector recorded an impressive seven percent average annual
growth over the 1991-2005 period, increasing its share in GDP from 13% to
16%, compared with just 5% average growth in the 1980s (World Bank, 2007). It
has more potential to contribute to the increase of GDP. To unleash the full
potential of this sector, there is a necessity of strengthening its competitiveness to
a considerable level. In other words, the sector should work on increasing its
productivity level. At the enterprise level, the major key to sustain global
competitiveness and to achieve a durable industrial success is productivity
growth. Generally, higher productivity decreases unit cost and increases the
firm’s profitability. Although productivity gains are almost automatically
connected with price competitiveness as a result of lower production costs, they
simultaneously reflect and permit greater efficiency (OECD, 1993). Productivity
growth not only improves international competitiveness of an industry but also
contributes to industrial growth. Thus, international competitiveness can be
examined with relative levels of productivity measures (Jorgeson and Kuroda,
1995). Scientific measures of productivity growth can represent inter-firm or
inter-industry operational performance. The word `productivity’ is, therefore,
increasingly important in manufacturing industry due to the background of
increasing world-class standards as a crucial pillar in the performance context.
The accurate measurement of productivity growth plays an important role in
providing the information to management of a company needed to put forth
better policy and operational activities. It is obvious that scientific productivity
measures permit managers to take necessary decision for making input-output
balance in the context of sufficient profit and desired growth. A company can
measure total productivity and/or partial productivity. The question is which one
gives appropriate information regarding operational performance? Moreover,
which one is better for dynamic, multi-period evaluation of the organizational
performance? Total factor productivity growth can reflect on gross measure of
productivity changes. However, it does not distinguish among the sources of
productivity growth. In fact, total factor productivity is an ambiguous concept
either in theory or in practical measurement. Various approaches to this
measurement can lead to different interpretations and empirical results because of
aggregation problems. Despite having some shortcomings, partial productivity
measures can provide useful insights to root causes of high or low productivity.
Thus these provide practical guidance for identifying productivity problems and
thereby to improve operational performance.
International Journal of SME Development
Issue 02 | December 2016
International Journal of SME Development 79 80 Scenario of Productivity Measures and Their Applications in Improving Operational Performance of Manufacturing SMEs
This article reviews the findings of three case studies conducted in export
oriented Ready-made Garments (RMG) sector in Bangladesh. Of the three, one
organization was finally selected for in-depth longitudinal case study with the
following specific research objectives:
i) assessing the productivity level of the company using both total and
partial measures of productivity,
ii) identifying productivity growth of the company over the certain periods,
and
iii) comparing the usefulness of different productivity measures in
identifying underlying problems in productivity.
2.0 Literature Review
Productivity is defined as the ratio of what is produced to what is required to
produce it. It measures the relationship between outputs such as goods and
services produced, and inputs that include labor, capital, material and other
resources (Hill, 1993). To improve productivity, operations managers should
look at improving the technology, interface between departments, organizational
aspect, supply chain as well as people management in a broad and systematic
way. In short, both technical and human aspects play major role for any
productivity improvement program. Commonly, two specific types of
productivity are measured in manufacturing organizations. These are ‘labor
productivity’ and the ‘total factor productivity’. The labor productivity measures
the outputs in terms of hours worked or paid for an employee. On the other hand,
the 'total factor' productivity measures the outputs in terms of the cost involved
with labor, equipment, energy and material. According to Kaydos (1991),
productivity and subsequently performance measurement are regarded as a
prerequisite for continuous improvement. Economists have designed many
approaches such as the total factor productivity (TFP), or Bureau of Labor
Statistics (BLS) multifactor productivity techniques (Duke and Torres, 2005;
Meyer and Harper, 2005; Tsai et al., 2006) at the industries, national, and
international levels. Partial productivity relating total output to one class of input
is also used at the level of an enterprise. Total factor productivity approach,
however, relates total outputs to the sum of all tangible input factors (human,
materials, capital, energy, other expenses, etc.) as stated in Sumanth, 1985 and
provides the company with a holistic perspective of the economic health and the
efficiency of the firm’s assets – its divisions, branches, products, process, etc.
This approach, if used in conjunction with partial productivity measures, focuses
the management’s attention toward the strengths and the weaknesses of
individual plants and firm operations, and the areas of equipment investment,
employee training, and continuous improvement. Regardless of the assessment
method or mix of methodologies selected for integration, productivity
benchmarking is an important aspect for goal setting decision-making and goal
achievement determination. Benchmarking productivity entails the calculation of
a productivity index (PIt) based on a ratio of the current period productivity value
(PVt) to a specified earlier period productivity value (PVo). In most instances,
productivity benchmarking should be integrated into the productivity assessment
methodology or mix of methodologies selected for integration (partial, factor, or
total) using one or more of the following criteria: (i) change in productivity over
a fiscal period (ratio of current fiscal year to previous fiscal year or ratio of 1st
quarter of current year, 2nd quarter of current year, etc to previous fiscal year); (ii)
change in productivity between quarterly periods (ratio of 2nd quarter to 1st
quarter of current year); and (iii) change in productivity before and after a
specific change or improvement (ratio of current period to some earlier period).
The productivity index value less than 1.00 indicates the fact that productivity
decreases as compared to benchmark value. With the increasing recognition that
productivity growth is the key to sustained economic expansion, measuring
productivity is becoming important to any industrial sector. Sumanth (1984)
depicted the whole process of productivity cycles consisting of measuring,
evaluating, planning and improving. The measurement is the first stage in order
to increase the productivity in operations. Moreover, it is vital and can be seen on
the argument raised by Peterson (2000), who said 'what gets measured gets
improved’, and by Chrysostomou (2000) from the British Research
Establishment, who stated that 'to manage, you must measure, if you do not, you
are only practicing’. Evidently, measurement is a vital component in the
productivity improvement agenda and its accuracy of subsequent stages depends
on the accuracy altitude of measurement stage. Broadly, productivity can be
categorized as single factor productivity that links an output measure to a single
measure of input or multifactor productivity, in which a measure of output is
associated with a bundle of inputs (Wazed and Ahmed, 2008). Another
differentiation, of particular relevance at the industry or firm level is between
productivity measures relating some gross output measure to one or several
inputs and those which uses a value-added concept to capture movements of
output. Multifactor productivity measurement helps disentangle the direct growth
contributions of labor, capital, intermediate inputs and technology. Multifactor
productivity measures in manufacturing describe the relationship between output
in real terms and the inputs involved in its production. These exclude
intermediate inputs between manufacturing establishments from both output and
inputs (Bureau of labor Statistics, 2014).
International Journal of SME Development 81 82 Scenario of Productivity Measures and Their Applications in Improving Operational Performance of Manufacturing SMEs
Multifactor productivity measure is not useful to measure individual contribution
of inputs. However, this is an important tool for reviewing past growth patterns
and for assessing the potential for future economic growth. Indeed, productivity
is a measure of effectiveness and efficiency where organizational resources
(inputs) are consumed to produce products and/or services (outputs) (Schroeder,
1985; Slack et al, 2001). This definition is clarified further by indicating that
productivity measurement (change) is aggregated and concerned with measuring
how the ratio Y/X changes over time, where Y measures an aggregate output and
X measures an aggregate input (Sumanth, 1998; Chambers and Pope, 1996; and
Heap, 2007). In this connection, productivity measurement is stated to be both a
measure of input usage and an evaluation concerning whether or not input usage
is growing more rapidly than output production. However, the difficulty of
measuring productivity is how to construct the indexes of inputs and outputs as
each factor possesses a weight corresponding to its individual contribution
(Mohnen and Hall, 2013). That is why it is necessary to know the exact
functional form of the production function to construct exact indexes in
measuring multifactor productivity according to their contribution. Productivity
growth is the key to sustained economic expansion, and therefore, measuring
productivity is becoming important to economists and policy makers alike
irrespective of industrial sectors. The accurate measurement of productivity
growth plays a vital role in providing the information that top management of a
company needs to put forth better policy making and operational strategy
development. The debate lies in determining the acceptable figures of
productivity growth for a company to survive and grow. A study shows that the
average multifactor productivity growth in US manufacturing (from 1949 to
1992) was just above 1, while the growth in Apparel and related products
manufacturing sector is 1.26 (Gullickson, 1995).
The review of the reported literature and experiences on productivity measure
indicates that measures have differential complexity and practical usage. Single
factor productivity (for e.g. labor productivity) measure can address the
performance of the specific factor in connection with output. Whereas ‘Total
factor productivity’ measure mirrors the collective performance of all input
factors in connection with output. However, it does not ensure the performance
of individual factor. So, if an organization wants to verify the performance of
each individual input factor, single factor productivity measure would be a better
option. On the other hand, if it focuses on the overall performance of a business
unit, the total factor measure would be sufficient. Thus, the utilization of
different productivity measures depends on organizational settings and business
strategy. In terms of productivity measures, this research aimed at verifying the
applicability of different measures to improve operational performance.
3.0 Research Methodology
3.1 Tools and techniques for measuring productivity
There are various approaches to measure productivity in manufacturing
organizations. Normally, economists, engineers and managers use different
approaches in measuring productivity at the firm level. The choice of the
productivity approaches depends upon the nature and aims of the study
undertaken. In this study, total productivity model (TPM) approach that considers
the impact of all input factors on the output in a tangible sense has been used as a
total productivity measure and a set of partial productivity measures. Total
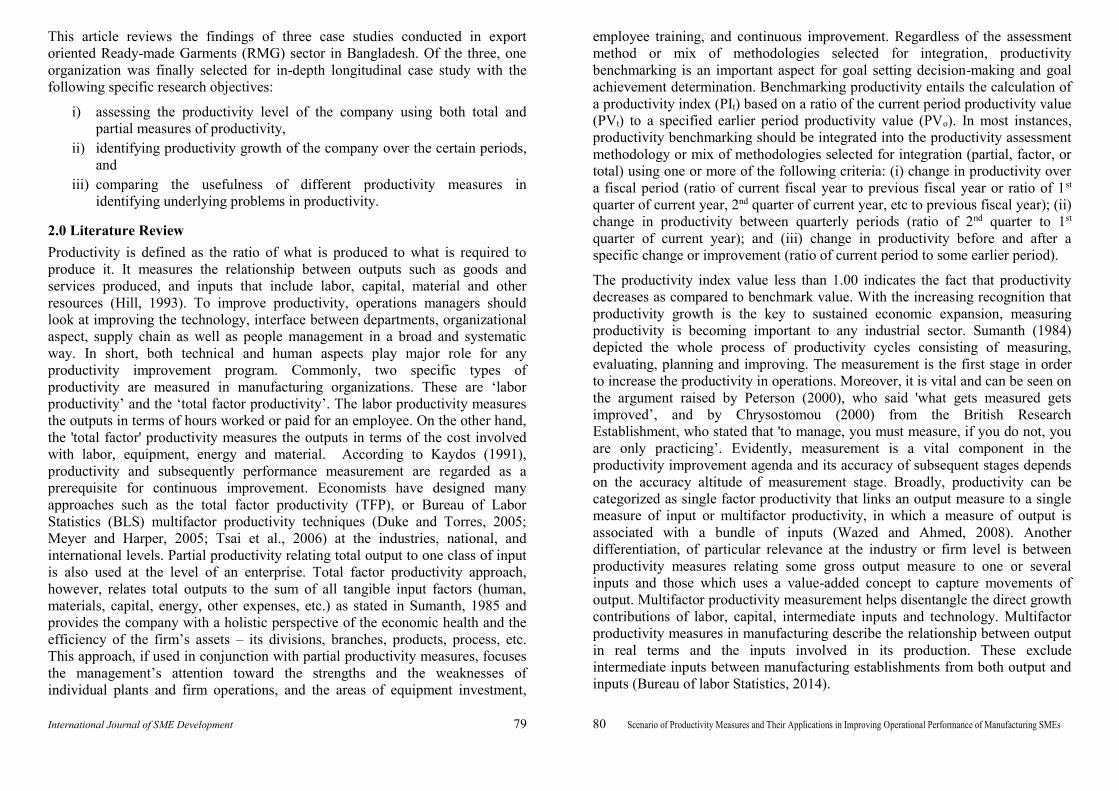
productivity, as defined in the TPM (Sumanth, 1985), is
total tangible output Total productivity =
total tangible input
Where, Total tangible output = value of finished units produced + other income,
and Total tangible input = value of (human + material + machine + energy +
other expense) inputs used.
Fig. 3.1: Total productivity of a firm, F as a ratio of tangible output to
tangible input (Slack et al, 2001).
Total
tangible
input in
period t
IFt
Firm
Total
tangible
output in
period t
OFt
Total Productivity In period t
t
t
t
OFTPF
IF
t it t it
i i
(OF O ; IF I )
International Journal of SME Development 83 84 Scenario of Productivity Measures and Their Applications in Improving Operational Performance of Manufacturing SMEs
Total productivity as a ratio of tangible output to tangible input for the product i
and the button manufacturing industry, F in a time period t have been illustrated
in the Figs 3.1 and 3.2 respectively. Again, the total productivity index for the
button unit in period t (TPIF)t is defined as
tt
0
TPFTPIF
TPF
where,
i0
0 i0
0 i0 ij0
i i
OOF
TPFIF I I
i
i
O 0
it
t it
t it ijt
i i
OOF
TPFIF I I
it
i
O
Similarly, the total productivity index for a product i in period t (TPI)it is defined
as
itit
i0
TP(TPI)
TP
itit
ijtit /
j
OTP
I I
it it
iHt iMt iM Ct iEt iX t
O O
I I I I I
i0i0
ij0i0 /
j
OTP
I I
t i
iH iM iM C iE iX
O O
I I I I I
0 0
0 0 0 0 0
Based on the data and the type of the organization, Total Productivity Model
(TPM) developed by David J. Sumanth (1985) was selected to measure the total
productivity indices for the whole production unit and a set of five partial
productivity indices. It was also used to specify the particular input resources
whose utilization were not at a satisfactory level and therefore, required
corrective actions.
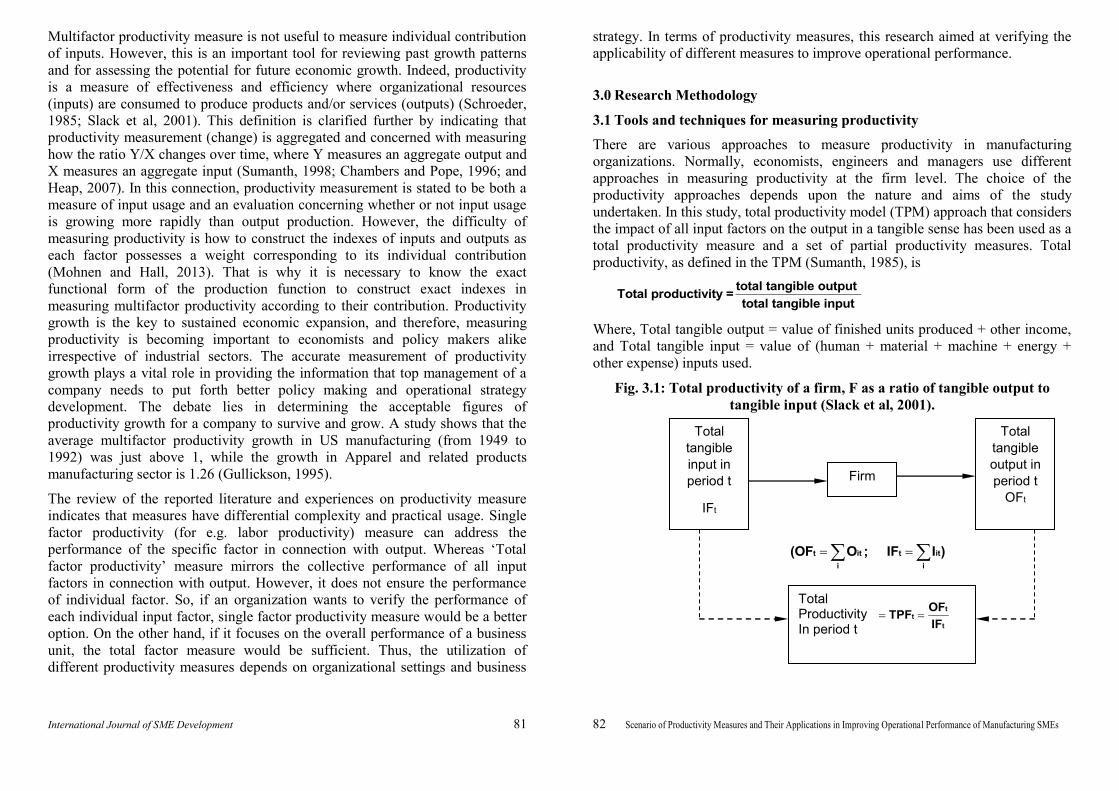
Fig 3.2: Total productivity of product, i as a ratio of total tangible output to
total tangible input.
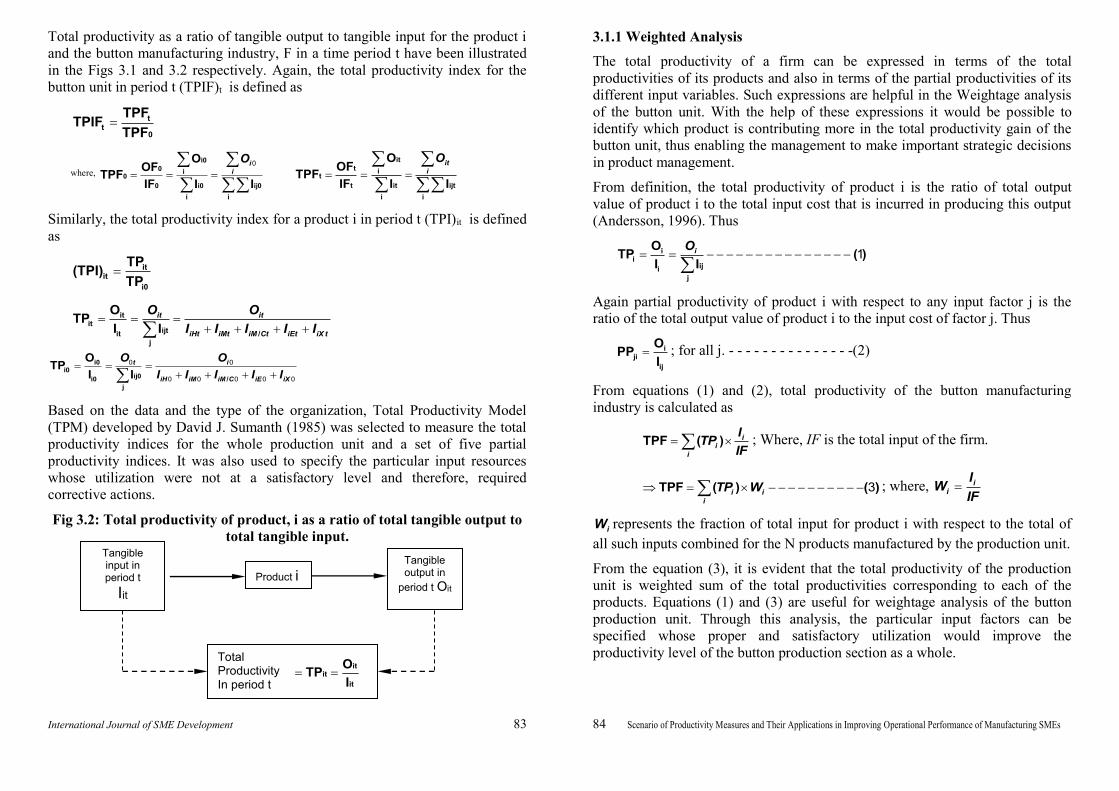
3.1.1 Weighted Analysis
The total productivity of a firm can be expressed in terms of the total
productivities of its products and also in terms of the partial productivities of its
different input variables. Such expressions are helpful in the Weightage analysis
of the button unit. With the help of these expressions it would be possible to
identify which product is contributing more in the total productivity gain of the
button unit, thus enabling the management to make important strategic decisions
in product management.
From definition, the total productivity of product i is the ratio of total output
value of product i to the total input cost that is incurred in producing this output
(Andersson, 1996). Thus
ii
iji
j
OTP ( )
I I
iO 1
Again partial productivity of product i with respect to any input factor j is the
ratio of the total output value of product i to the input cost of factor j. Thus
iji
ij
OPP
I; for all j. - - - - - - - - - - - - - - -(2)
From equations (1) and (2), total productivity of the button manufacturing
industry is calculated as
TPF ( ) ii
i
ITP
IF; Where, IF is the total input of the firm.
TPF ( ) ( )i i
i
TP W 3 ; where, ii
IW
IF
iW represents the fraction of total input for product i with respect to the total of
all such inputs combined for the N products manufactured by the production unit.
From the equation (3), it is evident that the total productivity of the production
unit is weighted sum of the total productivities corresponding to each of the
products. Equations (1) and (3) are useful for weightage analysis of the button
production unit. Through this analysis, the particular input factors can be
specified whose proper and satisfactory utilization would improve the
productivity level of the button production section as a whole.
Tangible input in period t
Iit Product i
Tangible output in
period t Oit
Total Productivity In period t
it
it
it
OTP
I
International Journal of SME Development 85 86 Scenario of Productivity Measures and Their Applications in Improving Operational Performance of Manufacturing SMEs
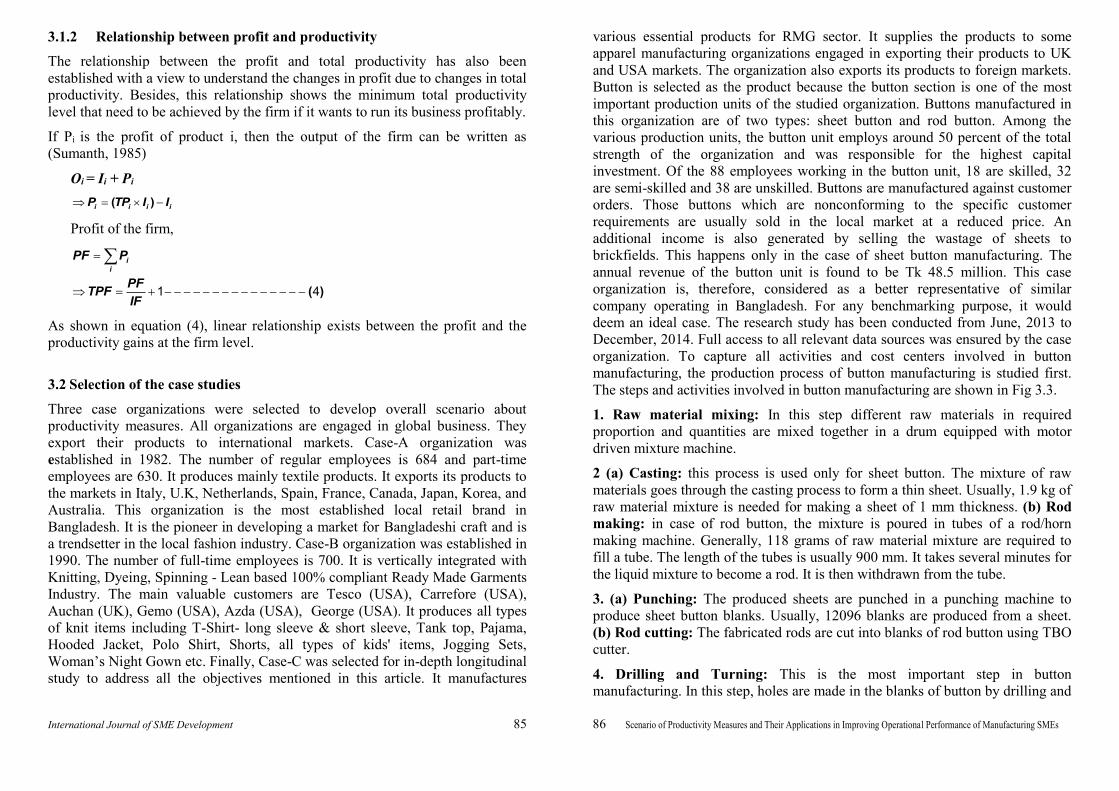
3.1.2 Relationship between profit and productivity
The relationship between the profit and total productivity has also been
established with a view to understand the changes in profit due to changes in total
productivity. Besides, this relationship shows the minimum total productivity
level that need to be achieved by the firm if it wants to run its business profitably.
If Pi is the profit of product i, then the output of the firm can be written as
(Sumanth, 1985)
Oi = Ii + Pi
( )i i i iP TP I I
Profit of the firm,
( )
i
i
PF P
PFTPF
IF
1 4
As shown in equation (4), linear relationship exists between the profit and the
productivity gains at the firm level.
3.2 Selection of the case studies
Three case organizations were selected to develop overall scenario about
productivity measures. All organizations are engaged in global business. They
export their products to international markets. Case-A organization was
established in 1982. The number of regular employees is 684 and part-time
employees are 630. It produces mainly textile products. It exports its products to
the markets in Italy, U.K, Netherlands, Spain, France, Canada, Japan, Korea, and
Australia. This organization is the most established local retail brand in
Bangladesh. It is the pioneer in developing a market for Bangladeshi craft and is
a trendsetter in the local fashion industry. Case-B organization was established in
1990. The number of full-time employees is 700. It is vertically integrated with
Knitting, Dyeing, Spinning - Lean based 100% compliant Ready Made Garments
Industry. The main valuable customers are Tesco (USA), Carrefore (USA),
Auchan (UK), Gemo (USA), Azda (USA), George (USA). It produces all types
of knit items including T-Shirt- long sleeve & short sleeve, Tank top, Pajama,
Hooded Jacket, Polo Shirt, Shorts, all types of kids' items, Jogging Sets,
Woman’s Night Gown etc. Finally, Case-C was selected for in-depth longitudinal
study to address all the objectives mentioned in this article. It manufactures
various essential products for RMG sector. It supplies the products to some
apparel manufacturing organizations engaged in exporting their products to UK
and USA markets. The organization also exports its products to foreign markets.
Button is selected as the product because the button section is one of the most
important production units of the studied organization. Buttons manufactured in
this organization are of two types: sheet button and rod button. Among the
various production units, the button unit employs around 50 percent of the total
strength of the organization and was responsible for the highest capital
investment. Of the 88 employees working in the button unit, 18 are skilled, 32
are semi-skilled and 38 are unskilled. Buttons are manufactured against customer
orders. Those buttons which are nonconforming to the specific customer
requirements are usually sold in the local market at a reduced price. An
additional income is also generated by selling the wastage of sheets to
brickfields. This happens only in the case of sheet button manufacturing. The
annual revenue of the button unit is found to be Tk 48.5 million. This case
organization is, therefore, considered as a better representative of similar
company operating in Bangladesh. For any benchmarking purpose, it would
deem an ideal case. The research study has been conducted from June, 2013 to
December, 2014. Full access to all relevant data sources was ensured by the case
organization. To capture all activities and cost centers involved in button
manufacturing, the production process of button manufacturing is studied first.
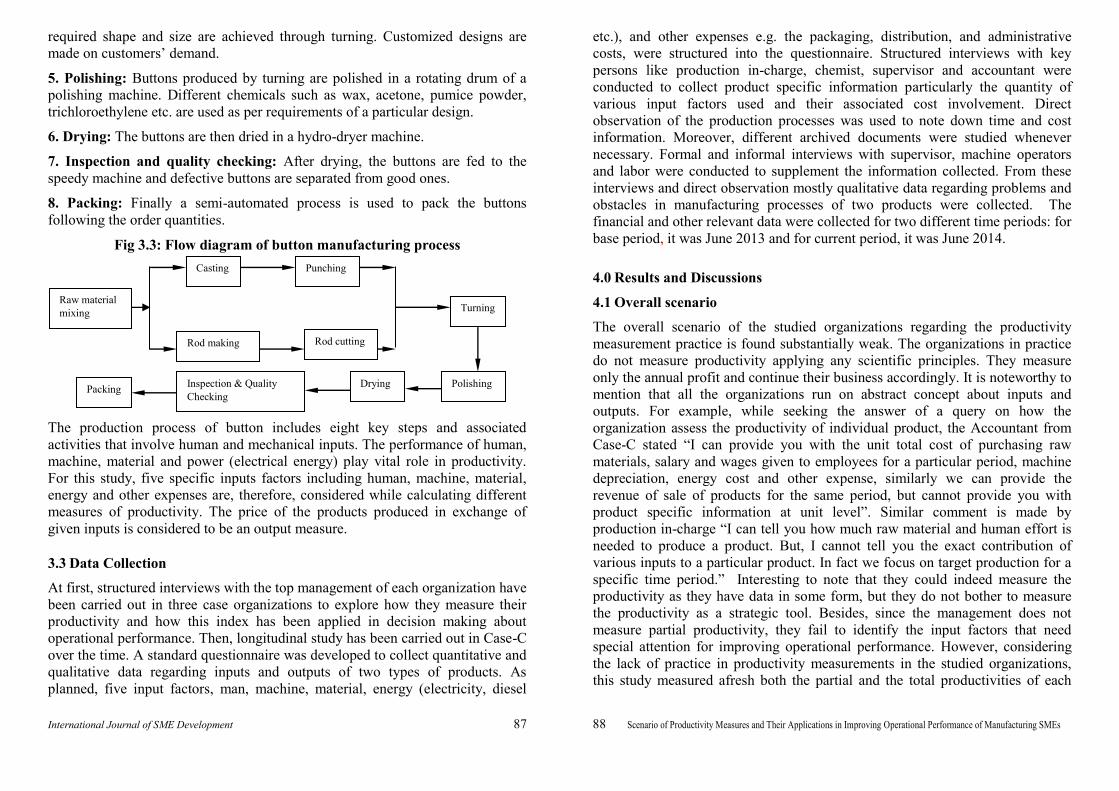
The steps and activities involved in button manufacturing are shown in Fig 3.3.
1. Raw material mixing: In this step different raw materials in required
proportion and quantities are mixed together in a drum equipped with motor
driven mixture machine.
2 (a) Casting: this process is used only for sheet button. The mixture of raw
materials goes through the casting process to form a thin sheet. Usually, 1.9 kg of
raw material mixture is needed for making a sheet of 1 mm thickness. (b) Rod
making: in case of rod button, the mixture is poured in tubes of a rod/horn
making machine. Generally, 118 grams of raw material mixture are required to
fill a tube. The length of the tubes is usually 900 mm. It takes several minutes for
the liquid mixture to become a rod. It is then withdrawn from the tube.
3. (a) Punching: The produced sheets are punched in a punching machine to
produce sheet button blanks. Usually, 12096 blanks are produced from a sheet.
(b) Rod cutting: The fabricated rods are cut into blanks of rod button using TBO
cutter.
4. Drilling and Turning: This is the most important step in button
manufacturing. In this step, holes are made in the blanks of button by drilling and
International Journal of SME Development 87 88 Scenario of Productivity Measures and Their Applications in Improving Operational Performance of Manufacturing SMEs
required shape and size are achieved through turning. Customized designs are
made on customers’ demand.
5. Polishing: Buttons produced by turning are polished in a rotating drum of a
polishing machine. Different chemicals such as wax, acetone, pumice powder,
trichloroethylene etc. are used as per requirements of a particular design.
6. Drying: The buttons are then dried in a hydro-dryer machine.
7. Inspection and quality checking: After drying, the buttons are fed to the
speedy machine and defective buttons are separated from good ones.
8. Packing: Finally a semi-automated process is used to pack the buttons
following the order quantities.
Fig 3.3: Flow diagram of button manufacturing process
The production process of button includes eight key steps and associated
activities that involve human and mechanical inputs. The performance of human,
machine, material and power (electrical energy) play vital role in productivity.
For this study, five specific inputs factors including human, machine, material,
energy and other expenses are, therefore, considered while calculating different
measures of productivity. The price of the products produced in exchange of
given inputs is considered to be an output measure.
3.3 Data Collection
At first, structured interviews with the top management of each organization have
been carried out in three case organizations to explore how they measure their
productivity and how this index has been applied in decision making about
operational performance. Then, longitudinal study has been carried out in Case-C
over the time. A standard questionnaire was developed to collect quantitative and
qualitative data regarding inputs and outputs of two types of products. As
planned, five input factors, man, machine, material, energy (electricity, diesel
etc.), and other expenses e.g. the packaging, distribution, and administrative
costs, were structured into the questionnaire. Structured interviews with key
persons like production in-charge, chemist, supervisor and accountant were
conducted to collect product specific information particularly the quantity of
various input factors used and their associated cost involvement. Direct
observation of the production processes was used to note down time and cost
information. Moreover, different archived documents were studied whenever
necessary. Formal and informal interviews with supervisor, machine operators
and labor were conducted to supplement the information collected. From these
interviews and direct observation mostly qualitative data regarding problems and
obstacles in manufacturing processes of two products were collected. The
financial and other relevant data were collected for two different time periods: for
base period, it was June 2013 and for current period, it was June 2014.
4.0 Results and Discussions
4.1 Overall scenario
The overall scenario of the studied organizations regarding the productivity
measurement practice is found substantially weak. The organizations in practice
do not measure productivity applying any scientific principles. They measure
only the annual profit and continue their business accordingly. It is noteworthy to
mention that all the organizations run on abstract concept about inputs and
outputs. For example, while seeking the answer of a query on how the
organization assess the productivity of individual product, the Accountant from
Case-C stated “I can provide you with the unit total cost of purchasing raw
materials, salary and wages given to employees for a particular period, machine
depreciation, energy cost and other expense, similarly we can provide the
revenue of sale of products for the same period, but cannot provide you with
product specific information at unit level”. Similar comment is made by
production in-charge “I can tell you how much raw material and human effort is
needed to produce a product. But, I cannot tell you the exact contribution of
various inputs to a particular product. In fact we focus on target production for a
specific time period.” Interesting to note that they could indeed measure the
productivity as they have data in some form, but they do not bother to measure
the productivity as a strategic tool. Besides, since the management does not
measure partial productivity, they fail to identify the input factors that need
special attention for improving operational performance. However, considering
the lack of practice in productivity measurements in the studied organizations,
this study measured afresh both the partial and the total productivities of each
Raw material mixing
Casting
Rod making Rod cutting
Punching
Turning
Polishing Drying Inspection & Quality
Checking Packing
International Journal of SME Development 89 90 Scenario of Productivity Measures and Their Applications in Improving Operational Performance of Manufacturing SMEs
product in the base period and current period for Case-C. The following section
presents the specific findings.
4.2 Findings about productivity measures
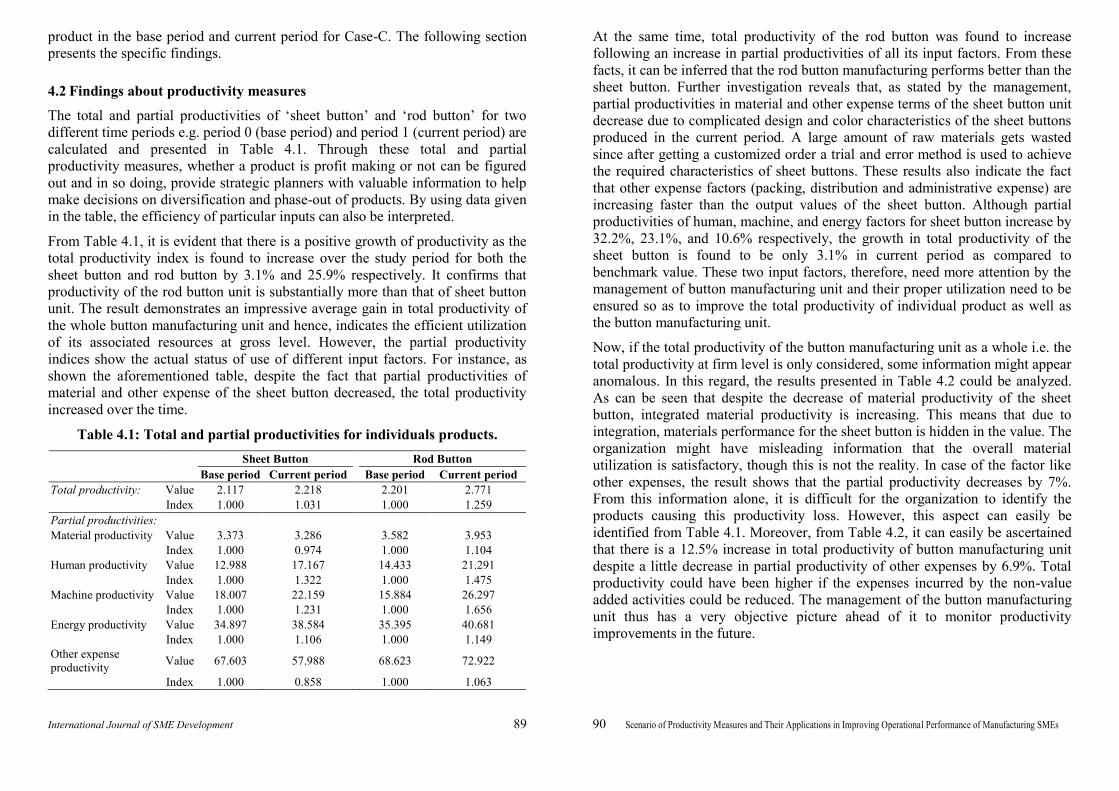
The total and partial productivities of ‘sheet button’ and ‘rod button’ for two
different time periods e.g. period 0 (base period) and period 1 (current period) are
calculated and presented in Table 4.1. Through these total and partial
productivity measures, whether a product is profit making or not can be figured
out and in so doing, provide strategic planners with valuable information to help
make decisions on diversification and phase-out of products. By using data given
in the table, the efficiency of particular inputs can also be interpreted.
From Table 4.1, it is evident that there is a positive growth of productivity as the
total productivity index is found to increase over the study period for both the
sheet button and rod button by 3.1% and 25.9% respectively. It confirms that
productivity of the rod button unit is substantially more than that of sheet button
unit. The result demonstrates an impressive average gain in total productivity of
the whole button manufacturing unit and hence, indicates the efficient utilization
of its associated resources at gross level. However, the partial productivity
indices show the actual status of use of different input factors. For instance, as
shown the aforementioned table, despite the fact that partial productivities of
material and other expense of the sheet button decreased, the total productivity
increased over the time.
Table 4.1: Total and partial productivities for individuals products.
Sheet Button
Rod Button
Base period Current period Base period Current period
Total productivity: Value 2.117 2.218 2.201 2.771
Index 1.000 1.031 1.000 1.259
Partial productivities:
Material productivity Value 3.373 3.286 3.582 3.953
Index 1.000 0.974 1.000 1.104
Human productivity Value 12.988 17.167 14.433 21.291
Index 1.000 1.322 1.000 1.475
Machine productivity Value 18.007 22.159 15.884 26.297
Index 1.000 1.231 1.000 1.656
Energy productivity Value 34.897 38.584 35.395 40.681
Index 1.000 1.106 1.000 1.149
Other expense
productivity Value 67.603 57.988 68.623 72.922
Index 1.000 0.858 1.000 1.063
At the same time, total productivity of the rod button was found to increase
following an increase in partial productivities of all its input factors. From these
facts, it can be inferred that the rod button manufacturing performs better than the
sheet button. Further investigation reveals that, as stated by the management,
partial productivities in material and other expense terms of the sheet button unit
decrease due to complicated design and color characteristics of the sheet buttons
produced in the current period. A large amount of raw materials gets wasted
since after getting a customized order a trial and error method is used to achieve
the required characteristics of sheet buttons. These results also indicate the fact
that other expense factors (packing, distribution and administrative expense) are
increasing faster than the output values of the sheet button. Although partial
productivities of human, machine, and energy factors for sheet button increase by
32.2%, 23.1%, and 10.6% respectively, the growth in total productivity of the
sheet button is found to be only 3.1% in current period as compared to
benchmark value. These two input factors, therefore, need more attention by the
management of button manufacturing unit and their proper utilization need to be
ensured so as to improve the total productivity of individual product as well as
the button manufacturing unit.
Now, if the total productivity of the button manufacturing unit as a whole i.e. the
total productivity at firm level is only considered, some information might appear
anomalous. In this regard, the results presented in Table 4.2 could be analyzed.
As can be seen that despite the decrease of material productivity of the sheet
button, integrated material productivity is increasing. This means that due to
integration, materials performance for the sheet button is hidden in the value. The
organization might have misleading information that the overall material
utilization is satisfactory, though this is not the reality. In case of the factor like
other expenses, the result shows that the partial productivity decreases by 7%.
From this information alone, it is difficult for the organization to identify the
products causing this productivity loss. However, this aspect can easily be
identified from Table 4.1. Moreover, from Table 4.2, it can easily be ascertained
that there is a 12.5% increase in total productivity of button manufacturing unit
despite a little decrease in partial productivity of other expenses by 6.9%. Total
productivity could have been higher if the expenses incurred by the non-value
added activities could be reduced. The management of the button manufacturing
unit thus has a very objective picture ahead of it to monitor productivity
improvements in the future.

International Journal of SME Development 91 92 Scenario of Productivity Measures and Their Applications in Improving Operational Performance of Manufacturing SMEs
Table 4.2: Total and partial productivities of the button manufacturing unit as a whole.
Base period Current period
Total productivity: Value 2.144 2.412
Index 1.000 1.125
Partial productivities:
Material productivity Value 3.439 3.604
Index 1.000 1.048
Human productivity Value 13.432 18.619
Index 1.000 1.386
Machine productivity Value 17.247 23.657
Index 1.000 1.372
Energy productivity Value 35.059 39.401
Index 1.000 1.124
Other expense productivity Value 67.936 63.196
Index 1.000 0.930
It can be said that the organization is running well in terms of its productivity
growth. However, it cannot be confirmed which of the input factors is more
contributory to the total productivity. From the management's point of view it is
important to know which factors should receive more attention. In this context,
further analysis was conducted for weighted contribution. The weighted analysis
has been accomplished by calculating different weightage for the two products-
sheet button and rod button, and for the five input factors – material, human,
machine, energy, and other expense. The goal was to identify the particular input
factor whose proper and satisfactory utilization can improve the productivity
level of the button manufacturing unit as a whole. The overall result of weighted
analysis is presented in Table 4.3.
From Table 4.3, it is evident that raw material is the most weighted factor among
the five input factors for both the individual product and the button unit as a
whole. Weightage of the material input factor is found to be notably greater than
the combined weightage of all other factors. The second most weightage to be
given is the utilization of the human resources. The raw material in combination
with the human factor contributes almost 80% of the total inputs. It can be seen
that the contribution of materials for both products increases over time. These
results indicate the fact that the management should focus more on efficient
utilization of raw material and human resources involved in button production so
as to enhance the total productivity of the button manufacturing unit and to
maintain it. However, a question still remains as to which product the
management should be more concerned with. As a response to this, it can be
stated that the management should work more with sheet button manufacturing.
This can be inferred from the results obtained for relative contribution of each
product to total productivity. The results are shown in Table 4.4.
Table 4.3: Relative weightage of the input factors.
Input factor Weightage
Sheet Button Rod Button Button unit
Base period Current
period Base period
Current
period
Base
period
Current
period
Material (WM) 0.6275 0.6749 0.6146 0.6583 0.6233 0.6691
Human
(WH) 0.1629 0.1292 0.1525 0.1301 0.1596 0.1295
Machine (WM/c) 0.1175 0.1000 0.1385 0.1053 0.1242 0.1019
Energy
(WE) 0.0606 0.0574 0.0621 0.0681 0.1611 0.0612
Other expense (WX) 0.0313 0.0382 0.0320 0.0380 0.0315 0.0381
Table 4.4: Weightage for the individual products
Product Weightage
Base period Current period
Sheet Button 0.6791 0.6495
Rod Button 0.3209 0.3505
From Table 4.4, it is clear that the weightage of sheet button is almost double that
of rod button. This indicates the fact that the organization needs to focus more on
sheet button instead of rod button for further improvement of total factor
productivity of button manufacturing unit. It would even be better if the
organization work with both products. In conclusion, it can be said that the
management should take necessary measures to enhance the performance of
material utilization and the human resource engaged in sheet button
manufacturing with the aim of improving the total productivity of the button unit
to a significant level.
Further analysis has been carried out to find the relationship between
productivity and profit of the organization. The ultimate goal was to figure out
the loss or profit situation in the context of total productivity for each product.
Figs 4.1(a) and (b) illustrate the relationship between the profit and productivity
of the button manufacturing unit for the base and current periods respectively.
From the figures, it is evident that the button manufacturing unit incurs the
maximum financial loss if its productivity becomes zero. The maximum profit
that the manufacturing unit can make is theoretically unlimited depending on the
level of total productivity it can reach. The total productivity gained at the firm
level, however, ought to be greater than unity if the button manufacturing unit
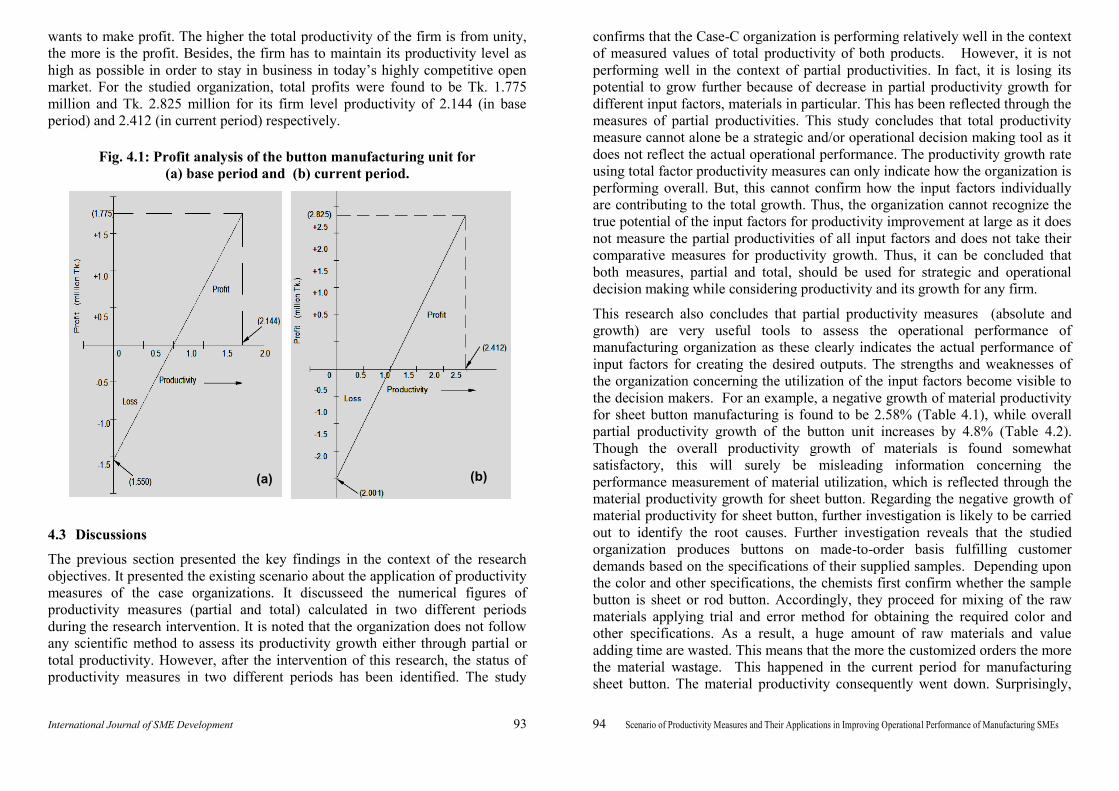
International Journal of SME Development 93 94 Scenario of Productivity Measures and Their Applications in Improving Operational Performance of Manufacturing SMEs
wants to make profit. The higher the total productivity of the firm is from unity,
the more is the profit. Besides, the firm has to maintain its productivity level as
high as possible in order to stay in business in today’s highly competitive open
market. For the studied organization, total profits were found to be Tk. 1.775
million and Tk. 2.825 million for its firm level productivity of 2.144 (in base
period) and 2.412 (in current period) respectively.
Fig. 4.1: Profit analysis of the button manufacturing unit for
(a) base period and (b) current period.
4.3 Discussions
The previous section presented the key findings in the context of the research
objectives. It presented the existing scenario about the application of productivity
measures of the case organizations. It discusseed the numerical figures of
productivity measures (partial and total) calculated in two different periods
during the research intervention. It is noted that the organization does not follow
any scientific method to assess its productivity growth either through partial or
total productivity. However, after the intervention of this research, the status of
productivity measures in two different periods has been identified. The study
confirms that the Case-C organization is performing relatively well in the context
of measured values of total productivity of both products. However, it is not
performing well in the context of partial productivities. In fact, it is losing its
potential to grow further because of decrease in partial productivity growth for
different input factors, materials in particular. This has been reflected through the
measures of partial productivities. This study concludes that total productivity
measure cannot alone be a strategic and/or operational decision making tool as it
does not reflect the actual operational performance. The productivity growth rate
using total factor productivity measures can only indicate how the organization is
performing overall. But, this cannot confirm how the input factors individually
are contributing to the total growth. Thus, the organization cannot recognize the
true potential of the input factors for productivity improvement at large as it does
not measure the partial productivities of all input factors and does not take their
comparative measures for productivity growth. Thus, it can be concluded that
both measures, partial and total, should be used for strategic and operational
decision making while considering productivity and its growth for any firm.
This research also concludes that partial productivity measures (absolute and
growth) are very useful tools to assess the operational performance of
manufacturing organization as these clearly indicates the actual performance of
input factors for creating the desired outputs. The strengths and weaknesses of
the organization concerning the utilization of the input factors become visible to
the decision makers. For an example, a negative growth of material productivity
for sheet button manufacturing is found to be 2.58% (Table 4.1), while overall
partial productivity growth of the button unit increases by 4.8% (Table 4.2).
Though the overall productivity growth of materials is found somewhat
satisfactory, this will surely be misleading information concerning the
performance measurement of material utilization, which is reflected through the
material productivity growth for sheet button. Regarding the negative growth of
material productivity for sheet button, further investigation is likely to be carried
out to identify the root causes. Further investigation reveals that the studied
organization produces buttons on made-to-order basis fulfilling customer
demands based on the specifications of their supplied samples. Depending upon
the color and other specifications, the chemists first confirm whether the sample
button is sheet or rod button. Accordingly, they proceed for mixing of the raw
materials applying trial and error method for obtaining the required color and
other specifications. As a result, a huge amount of raw materials and value
adding time are wasted. This means that the more the customized orders the more
the material wastage. This happened in the current period for manufacturing
sheet button. The material productivity consequently went down. Surprisingly,
(a) (b)
International Journal of SME Development 95 96 Scenario of Productivity Measures and Their Applications in Improving Operational Performance of Manufacturing SMEs
the organization itself has no way to address the issue as it does not measure or
even preserve any documentation regarding the wastages. Thus, it is unaware of
what is happening in terms of productivity. In connection with labor productivity,
it is found that no formal training is provided to supervisors, machine operators,
helpers on their respective jobs. Informal in-house training is provided to few
people. As a result, most employees spend more time than the estimated one for
performing their assigned tasks. Moreover, the quality of work becomes
substandard most of the time. Another issue discovered is that some employees
frequently visit their families at the employee quarters located inside the factory
boundary. This eventually is responsible for losing significant productive labor
hours. It is another indicator of unprofessional attitude of the employees.
Unhygienic and toxic working environment in some workstations are also
responsible for decreasing human productivity.
Turning machines are used to create different designs for buttons. Since, each
design requires special attachment and setup, considerable amount of time is
spent for changeover. Thus, machine productivity growth cannot reach its
potential. Considerable number of defective buttons is observed to be produced
during the studied period that contributed to the loss of partial productivities.
Majority of the machines used in the manufacturing of button are electrical
power driven. The productivity of energy depends largely on the effective
operation time and efficient utilization of the machines. Productivity of other
expenses again depends on effective operational performance of the button
manufacturing unit. It is noted that through the reduction of various wastages, the
productivity of other expenses increases. Productivity growth rate is an important
decision parameter. There is significant relationship with productivity growth and
the total profit. It is found from the study that total profit of the case organization
varies positively with the increase in total productivity. However, the
organization should not be happy with the constant productivity level. Rather, it
should strive to increase its productivity growth, which is what the organization
gains over the period unknowingly and hence, stays in the business.
This article has overviewed the findings of the case study in light of three
research objectives. The practical insights of the productivity measures can
hopefully add value and assist the researchers and the practitioners working in
the field of productivity measures. The overall status of the productivity
measures and practical scenario about the utilization of productivity measures of
the case organization can be taken as true reflection of the leading manufacturing
organizations in Bangladesh. The findings of the study can directly be useful for
the policy and decision makers of the respective sector. Simple tools for
productivity measures and their interpretative applications in operational and
strategic decision making can be very useful for productivity improvement in the
manufacturing sector in Bangladesh. Moreover, the necessity of simultaneous
application of partial and total productivity measures can enrich the knowledge
of existing literature.
4.4 Improvement Strategies
The Case organizations should utilize the productivity measures for both partial
and total productivity. They should focus more on productivity improvement and
productivity growth instead of focusing on total profit, while developing strategic
and operational plans and assessment. In Case-C, although the growth of total
productivity of button manufacturing seems alright currently, there is more
potential to for further increase. In other words, if the organization does not
improve its material utilization in the button manufacturing, especially for sheet
button, it will continuously lose the cost advantage as raw material used for both
the sheet and rod buttons is the most cost consuming input factor. The
organization should take necessary measures to improve the utilization of other
input factors. In this context, some easily implementable recommendations are
discussed. To reduce the wastage of raw materials incurred in the mixing step,
spectrometer machine can be used which, by scanning the sample button, can
directly specify the quantities of raw materials required to achieve its desired
color and other characteristics. This will also reduce the time required in the
mixing step. Proper documentation should be incorporated to account for all the
information regarding material utilization. People are the most important asset of
an organization and their attitudes and motivational drives are a major factor in
any successful organization. Undoubtedly, people are the most important and
promising area of productivity improvement for any organization irrespective of
available technology and resources available at its disposal. From the case
experience, it is found that employees play major role in connection with
increase or decrease in productivity. Appropriate training to the employees
should be provided to increase their respective performance and to make them
skilled. Some motivational techniques can be incorporated to enhance their
loyalty towards the organization. To make the total work force more effective a
“Job Card” system can be helpful. The job card for the studied organization
might contain such information as identification of the worker, identification of
the job to be performed by the worker, target level, time of starting and finishing
each job, and achieved level. As a result, the performance of each worker can be
measured easily and, in case of any faulty production, responsible workers or
staff can be identified and necessary steps can be taken for their performance
improvement. Working environment needs to be improved for the productivity
International Journal of SME Development 97 98 Scenario of Productivity Measures and Their Applications in Improving Operational Performance of Manufacturing SMEs
improvement of people. Proper drainage system and sufficient ventilation should
be the first priority. In the context of increasing machine productivity, production
setup should be effectively planned so as to produce as much buttons as possible
either in a single setup or with a minimal change in setup. This can be done by
grouping the orders of the same or similar design before starting the turning
operation. Moreover, while establishing a new setup for a particular product,
setup time reduction techniques must be implemented. In this way, the
production throughput can be increased minimizing the setup time which, in turn,
would improve the total productivity of the button manufacturing unit.
To increase the performance of two other input factors, the organization needs to
record the root causes of underutilization and thereby take necessary measures.
For instance, if the organization can reduce the total production time for the same
output, it could save energy. At the same time it would reduce the factory
overheads. This would eventually save other expenses. From the case study, it is
clear that there is some room for improvement of energy and other expenses. The
organization can increase its productivity with the increase of the proper
utilization of these input factors. The most important finding of this research is
that an organization should assess its operational performance and effectiveness
through the appropriate measures of productivity. Otherwise, the organization
would develop its business strategy based on misleading information. For
example, total productivity measure can point out the overall performance of an
organization. But, it cannot specify the actual operational performance of the
individual input factors. Therefore, partial productivity measures along with their
relative contribution to input can be very useful tools for productivity
improvement. Like the case organization, other organizations should measure the
partial productivity of all major input factors and take necessary action
accordingly. Major contributory input factor should be given more emphasis as it
has more impact on total productivity.
5.0 Conclusions
Productivity improvement is an important issue of any organization to maintain
required business growth in highly competitive and dynamic business
environment. Therefore, productivity should be planned, measured, improved,
and maintained. This paper elaborates the issues addressed in the research
objectives. Firstly, it presents the existing scenario about the application of
productivity measures (both partial and total) in the case organizations, which
represent the manufacturing SMEs in Bangladesh. Secondly, it discusses the
necessity of partial and total productivity measures for strategic and operation
decision making of a manufacturing firm. It is found that the studied
organizations solely rely on total loss or profit margin while considering overall
business performance. The managers of the organizations possess abstract
knowledge about partial productivity measure even though they do not
scientifically apply this method in practice. They lack expertise manpower for
applying the productivity measures in decision making. The findings from the
longitudinal study in Case-C confirm that inefficient use of raw materials, lack of
sufficient skilled workers, lack of proper communication between various
sections, lack of proper supervision are common. These result in
underperformance. Based on the findings and analysis, this paper highlights some
improvement strategies. The strategies are expected to be fairly useful in
improving the productivity level. These can also be applied by other
organizations involved in similar activities. After measuring both partial and
total productivity of the firm over two periods, this study found that the firm is
operating relatively well with regards to one product. But, it is underperforming
with regards to the other product. Unfortunately, the latter product incurs more
capital investment, has more potential to grow. Firm-wise total productivity
growth is found to be about 12%, in which sheet button contributes 3% and the
rod button contributes about 25%. Since the weightage of input contribution of
sheet button is almost double that of rod button, total productivity growth of the
firm becomes significantly low. The organization needs to focus more on sheet
button to increase its overall firm level productivity. It is noteworthy to mention
that partial productivity value or total productivity value alone cannot reveal the
actual scenario of operational performance of a firm. Individual measure can
sometimes mislead a strategic decision, which is what is reflected in Table 4.1
and Table 4.2. We see that the value of total productivity cannot ensure the exact
contribution of individual inputs in productivity gain, which is otherwise
reflected in partial productivity measures. To identify the potential of individual
input factor, the partial productivity measure is a must. However, to measure the
periodic productivity growth, the total factor productivity measure is the ultimate
option. Again, for an organization that produces a number of products in the
same organizational settings, the total factor productivity would be the good tool
to compare the performance and contribution of individual products. Therefore,
this study concludes that simultaneous application of both productivity measures
(total and partial) should be the best option in the context of assessing the
operational performance of a business unit. The methodology used in this
research to assess and compare different productivity measures can be equally
effective for similar manufacturing organizations.
International Journal of SME Development 99 100 Scenario of Productivity Measures and Their Applications in Improving Operational Performance of Manufacturing SMEs
References
Andersson TD (1996) Traditional key ratio analysis versus data envelopment analysis: a
comparison of various measurements of productivity and efficiency in restaurants. In
Productivity Management in Hospitality and Tourism, N. Johns, Editor. Cassell, London,
p. 209-226.
Bureau of labor Statistics (2014) Multifactor Productivity Trends in Mnaufacturing-2012,
News Release, USDL-14-1549, Bureau of labor Statistics (BLS), U.S. Department of
Labor.
Chambers RG, Pope RD (1996) Aggregate Productivity Measures. American Journal of
Agriculture Economics, 78(5): 1360-1365.
Chrysostomou (2000) CALIBRETM – The UK’s Construction Industry Added Value
Toolkit. International Conference on the Use of Automatic Data Collection in
Construction: March 2000, Las Vegas Nevada, USA
Duke J, Torres V (2005) Multifactor productivity change in the air transportation
industry. Monthly Labor Review, (sponsored by Bureau of Labor Statistics, Department
of Labor, USA), March.
Gullickson W (1995) Measurement of productivity Growth in US manufacturing.
Monthly Labor Review, July.
Harper J (1984) Measuring Business Performance. Institute of Manpower Studies, Gower
Publishing, Aldershot.
Heap J (2007) Stormy productivity weather ahead? International Journal of Productivity
and Performance Measurement, 56(2): 170-177.
Hill, T. (1993) Manufacturing Strategy: The Strategic Management of the Manufacturing
Function, 2nd ed. Open University, Macmillan, London.
Jorgenson DW, Kuroda M (1995) Productivity and International Competitiveness in
Japan and the United States, 1960-1985. In Jorgenson, D.W (ed), Productivity, Vol. 2:
International Comparison of Economic Growth, 387-417.
Kaydos W (1991) Measuring, Managing, and Maximizing Performance. Productivity
Press, Atlanta, GA.
Meyer PB, Harper MJ (2005) Preliminary estimates of multifactor productivity growth.
Monthly Labor Review, (sponsored by Bureau of Labor Statistics, Department of Labor,
USA), June.
Mohnen P, Hall BH (2013) Innovation and productivity: An Update, UNU-MERIT
Working Papers (ISSN 1871-9872), Maastricht Economic and social Research Institute
on Innovation and Technology, UNU-MERIT, Maastricht University, UNU-MERIT,
University of California at Berkeley, and NBER
Organization for Economic Co-operation and Development (OECD) (1993) Small and
Medium-sized Enterprises: Technology and Competitiveness. OECD, Paris.
Peterson (2000) Owner Extranet Application for Construction. International Conference
on the Use of Automatic Data Collection in Construction: United State of America. Las
Vegas Nevada.
Schroeder RG (1985) Operations Management: Decision Making in the Organizations
Function. New York, NY. McGraw-Hill.
Slack N, Chambers S, Johnston R (2001) Operations Management. 3rd ed. Harlow:
Prentice Hall.
Sumanth DJ (1985) Productivity Engineering and Management. McGraw-Hill, New
York, NY.
Sumanth DJ (1998) Total Productivity Management - a systemic and quantitative
approach to compete in quality, price and time. Boca Raton - Florida, St. Lucie Press.
Tsai WH, Hsu PY, Cheng JMS, Chen YW (2006) An AHP approach to assessing the
relative importance weights of ERP performance measures. International Journal of
Management and Enterprise Development, 3(4): 351-75.
Wazed MA, Ahmed S (2008) Multifactor Productivity Measurements Model (MFPMM)
as Effectual Performance Measures in Manufacturing. Australian Journal of Basic and
Applied Sciences, 2(4): 987-996.
World Bank (2007) Firm-Level Productivity in Bangladesh Manufacturing Industries.
Summary Report on Bangladesh Strategy for Sustain Growth, 1:1-14.