Embed Size (px)
Citation preview
Scentre Group Limited ABN 66 001 671 496
Scentre Management Limited ABN 41 001 670 579 AFS Licence No: 230329 as responsible entity of Scentre Group Trust 1 ABN 55 191 750 378 ARSN 090 849 746
RE1 Limited ABN 80 145 743 862 AFS Licence No: 380202 as responsible entity of Scentre Group Trust 2 ABN 66 744 282 872 ARSN 146 934 536
RE2 Limited ABN 41 145 744 065 AFS Licence No: 380203 as responsible entity of Scentre Group Trust 3 ABN 11 517 229 138 ARSN 146 934 652
Level 30, 85 Castlereagh Street Sydney NSW 2000 Australia
GPO Box 4004 Sydney NSW 2001 Australia scentregroup.com
ASX ANNOUNCEMENT 25 August 2020
SCENTRE GROUP REPORTS HALF YEAR OPERATING EARNINGS OF $361 MILLION
Scentre Group (ASX: SCG) today released its results for the six months to 30 June 2020 with Operating Earnings of $361 million (6.94 cents per security) and Funds From Operations (“FFO”) of $362 million (6.96 cents per security). The Statutory result for the six-month period was a loss of ($3,613) million. The Statutory result includes an unrealised non-cash reduction in property valuations of ($4,079) million. Operating Earnings, FFO and the Statutory result are each after expensing an Expected Credit Charge (ECC) of $(232) million related to the financial impact of the COVID-19 pandemic. During the six-month period, the Group achieved gross cash inflow of $1,059 million and a net operating cash surplus (after interest, overheads and tax) of $261 million. Scentre Group CEO Peter Allen said: “I am very proud of our team, particularly how we responded and adapted to the significant changes brought about by the COVID-19 pandemic. Our results, including the ability to generate an operating cash surplus, demonstrate the long-term resilience of our business. “A fundamental strength of our business is the strategic location of the Group’s network of 42 Westfield Living Centres. Our centres are in close proximity to the most densely populated urban areas with more than 16 million people living within a 30-minute drive of one of our centres.
“We remained focussed on providing our customers with the ability to continually meet their needs throughout the period. We did this by remaining open as well as implementing, and communicating, the highest standards of health and safety protocols. “As customers are returning to our centres, more than 93% of retail stores are open across the portfolio (excluding our Victorian centres). Portfolio occupancy was 98.8% at the end of June 2020.
“We accelerated strategic initiatives such as Westfield Direct and Westfield Plus, leveraging the convergence between physical and digital, to facilitate customers connecting and interacting with our retail partners beyond the traditional physical interaction. “We launched Westfield Plus, our membership customer engagement platform, at Westfield Newmarket in New Zealand in late 2019 and recently introduced the program in Australia. We now have more than 500,000 members on Westfield Plus and this continues to grow. “At the onset of the pandemic, we acted quickly to secure additional funding, ensuring we are in a strong financial position to see the Group through and beyond the volatile period.” So far this year, the Group raised or extended $5.8 billion of additional funding, including $3.4 billion of bank facilities and $2.4 billion of long-term bonds. The Group currently has available liquidity of $4.4 billion, sufficient to cover all maturities to January 2023. Interest cover for the period was 3.6 times and balance sheet gearing at 30 June 2020 was 38.4%.
“We led the development of a voluntary code of conduct which was designed to target appropriate assistance and support to small and medium sized retailers (SMEs) during the pandemic. The Code of F
or p
erso
nal u
se o
nly
Page 2
Conduct (the Code) was mandated by governments throughout Australia and we voluntarily applied these principles to conversations with our New Zealand SME retailers,” Mr Allen said.
“We acknowledge that this has been a difficult time for our customers and our retail partners. We have supported our retail partners throughout this period on a case-by-case basis. We have done this without receiving financial assistance from Government.
“The shopping centre industry has provided over $1.6 billion of support for retailers during the pandemic. Our industry is unique in that it has provided, and self-funded, a level of financial support beyond any other industry as well as most government pandemic support packages.
“We have agreed arrangements with 2,438 of our 3,600 retail partners, including 1,624 SME retail partners.
“Importantly, the structure of our leases with our retail partners has not changed and remains based on the mutual agreement to pay a fixed rent.”
SME retail partners represent approximately 30% of the Group’s rental income. Under the SME Code, SMEs are able to reduce the amount of cash rent payable commensurate with the decline in sales they may have experienced during the pandemic and post pandemic (“recovery”) period.
For the six-month period, the Group collected 70% of gross rental billings and for the months of June and July 2020, gross rental billings collections were over 80%. The gross rental billings used in calculating these collection rates have not been adjusted for the impact of applying the Code and its impact in reducing the actual amount of cash rent collectible during the period. In-store sales for our retail partners were impacted by the pandemic and the associated restrictions on people movement. In-store sales for the retail partners that traded throughout the six-month period were 8.1% lower compared to the previous corresponding six-month period in 2019. Specialty in-store sales were 12.1% lower for the six-month period compared to the previous corresponding period.
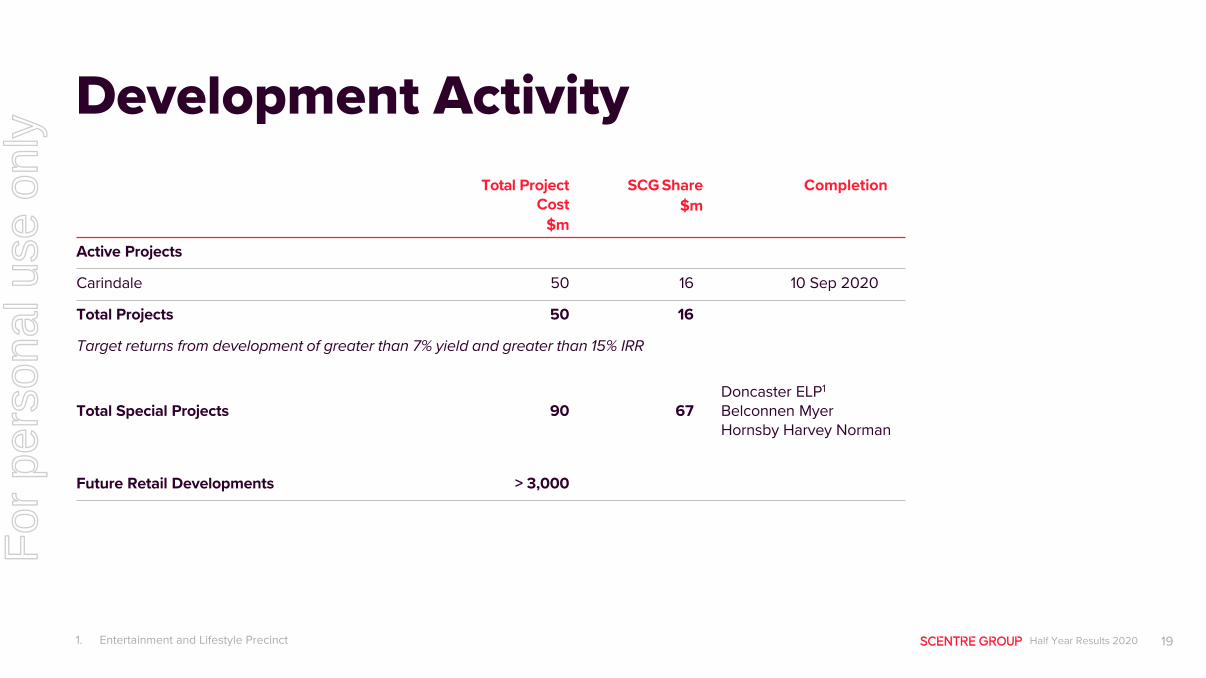
During the half year, we continued to progress the projects that were already underway at Westfield Doncaster (Victoria), Westfield Belconnen (ACT) and Westfield Hornsby (NSW). The $50 million project at Westfield Carindale (Queensland) will complete in September 2020. The Group continues to implement initiatives that support our strategy to operate as a responsible, sustainable business. During the half, we announced our target to achieve Net Zero Carbon Emissions by 2030. The Group recently committed to the Task Force for Climate-Related Financial Disclosures (TCFD). Mr Allen said: “The underlying fundamentals of the Group’s business remain strong and the business is well positioned to deliver long-term sustainable returns for securityholders through economic cycles. “We have a great team of people who are customer obsessed and I am confident that we will continue to be agile in adapting to the inevitable uncertainties during these times. “We own and operate major essential social infrastructure in the best locations close to where people live. We will continue our focus on further developing strategic initiatives that enhance our deep knowledge, relationship and engagement with our customers to deliver what our customers want.” As previously announced the Group will not be providing earnings or distribution guidance. Authorised by the Board.
For
per
sona
l use
onl
y

Page 3
Further information: Company Secretary Investor Relations Corporate Affairs/Media Maureen McGrath Andrew Clarke Alexis Lindsay +61 2 9358 7439 +61 2 9358 7612 +61 2 9358 7739 About Scentre Group: Scentre Group (ASX Code: SCG) is the owner and operator of Westfield in Australia and New Zealand with interests in 42 Westfield Living Centres, encompassing approximately 12,000 outlets. The financial information included in this release is based on Scentre Group’s IFRS financial statements. Non IFRS financial information has not been audited or reviewed. This release contains forward-looking statements, including statements regarding future earnings and distributions that are based on information and assumptions available to us as of the date of this release. Actual results, performance or achievements could be significantly different from those expressed in, or implied by, these forward-looking statements. These forward-looking statements are not guarantees or predictions of future performance, and involve known and unknown risks, uncertainties and other factors, many of which are beyond our control, and which may cause actual results to differ materially from those expressed in the statements contained in this release. You should not place undue reliance on these forward-looking statements. Except as required by law or regulation (including the ASX Listing Rules) we undertake no obligation to update these forward-looking statements.
For
per
sona
l use
onl
y

Half Year Results2020
Westfield Newmarket, NZWestfield Miranda, NSW
For
per
sona
l use
onl
y

Half Year Results 2020 2
All 42 Westfield Living Centres have remained open, safe and trading during the pandemic
- Implementing and communicating the highest levels of health and safety standards
- Providing essential services to communities
We have accelerated our Customer Initiatives
- Westfield Direct, a new drive-through, contactless click and collect service
- Westfield Plus, a mobile-app based membership program, expanded to Australia. We now have more than 500,000 members
Supported our 2,600 SME retail partners, implementing the Commercial Tenancies Code of Conduct
Worked with retail partners to re-open stores, with 93% of stores open and trading (excluding Victoria)
Collected $1,059 million of cash inflow, achieving a net operating cash surplus of $261 million
New and extended funding of $5.8 billion, including $3.4 billion1 of bank facilities and $2.4 billion of long term bonds
- Available liquidity of $4.4 billion2, sufficient to cover all debt maturities to January 2023
Half Year Update
1. Including $900 million of bank loan facility extensions in July 20202. Pro-forma including the repayment of the €600m bond maturity in July 2020
“A fundamental strength of our business is the strategic location of the Group’s network of 42 Westfield Living Centres. Our centres are in close proximity to the most densely populated urban areas with more than 16 million people living within a 30-minute drive of one of our centres”PETER ALLEN CEO
30 June 2020
For
per
sona
l use
onl
y
Half Year Results 2020 3
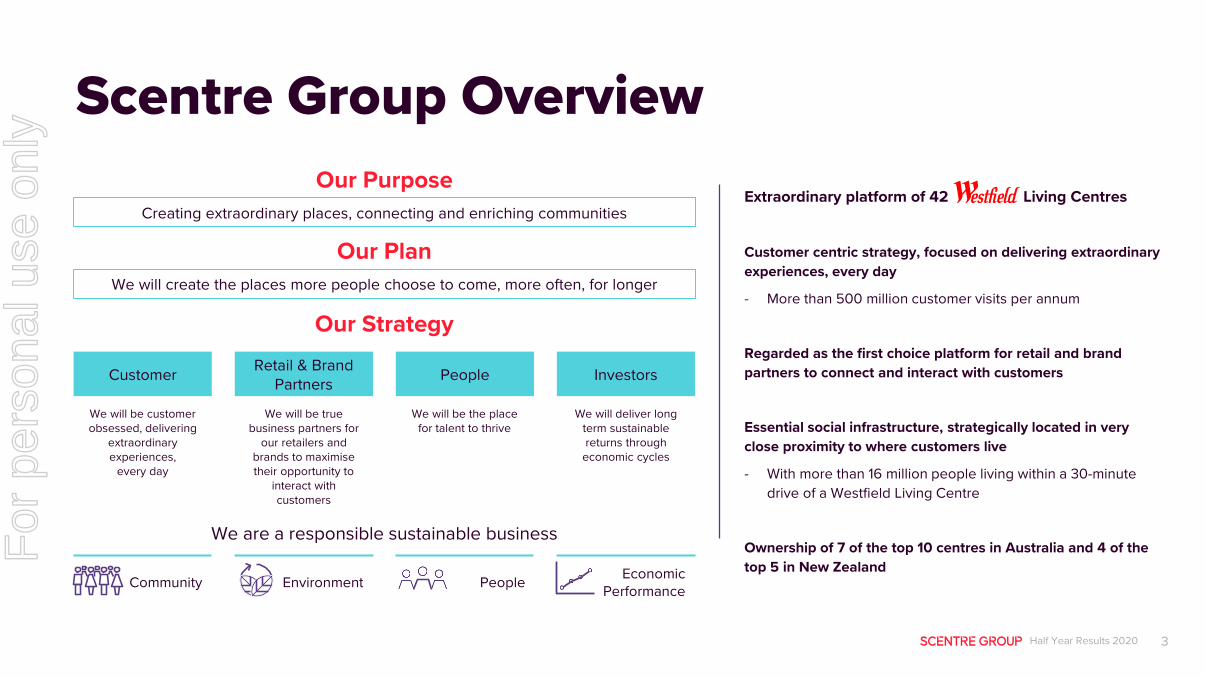
Extraordinary platform of 42 Living Centres
Customer centric strategy, focused on delivering extraordinary experiences, every day
- More than 500 million customer visits per annum
Regarded as the first choice platform for retail and brand partners to connect and interact with customers
Essential social infrastructure, strategically located in very close proximity to where customers live
- With more than 16 million people living within a 30-minute drive of a Westfield Living Centre
Ownership of 7 of the top 10 centres in Australia and 4 of the top 5 in New Zealand
Scentre Group OverviewOur Purpose
Creating extraordinary places, connecting and enriching communities
Our PlanWe will create the places more people choose to come, more often, for longer
Our Strategy
Customer Retail & Brand Partners People Investors
We will be customer obsessed, delivering
extraordinary experiences,
every day
We will be true business partners for
our retailers and brands to maximise their opportunity to
interact with customers
We will deliver long term sustainable returns through
economic cycles
We will be the place for talent to thrive
We are a responsible sustainable business
Community Environment People EconomicPerformance
For
per
sona
l use
onl
y

Half Year Results 2020 4
Half Year Results
“At the onset of the pandemic, we acted quickly to secure additional funding, ensuring we are in a strong financial position to see the Group through and beyond the volatile period”PETER ALLEN CEO
30 June 2020
$mincl-ECC
Cents per security
incl-ECC
Cents per security
excl-ECC1
Operating Earnings (OE)2 $361 million 6.94 11.41
Funds From Operations (FFO) $362 million 6.96 11.43
Receipts in the course of operations (incl GST)3 $1,059 million
Net Operating Cashflow (Surplus)4 $261 million
FFO to Debt1 9.2%
Interest Cover1 3.6 times
1. Excluding the impact of temporary retailer support, the Expected Credit Charge (ECC) relating to COVID-192. Funds From Operations before Project Income (net of tax)3. Consists of gross rent collection of $875 million, management fees, ancillary income and Design & Construction cash receipts4. After Interest, Overheads and Tax. Excludes the timing of GST receipts on outstanding trade debtors
For
per
sona
l use
onl
y
Half Year Results 2020 5
100% 100%
2% 3%
94% 95% 100%
127%120%
92%
16%
60%
119%128%
0%
20%
40%
60%
80%
100%
120%
140%
January February March April May June July
% Stores Trading Customer Visits as % of pcp
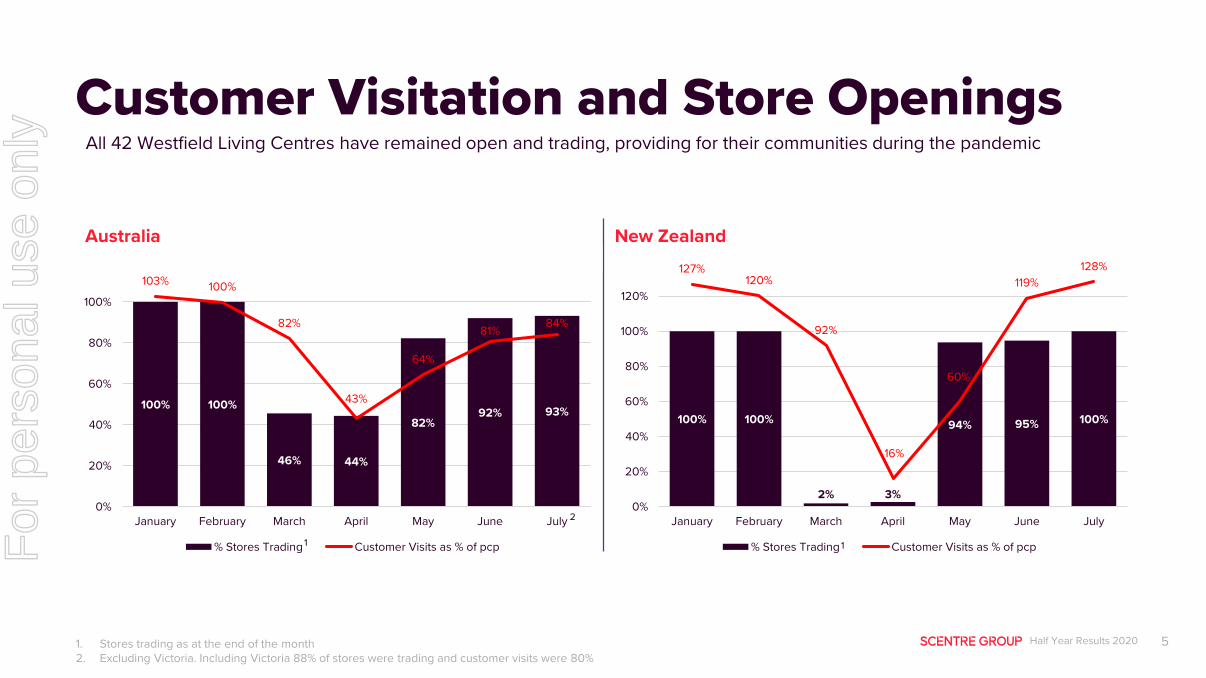
Customer Visitation and Store OpeningsAll 42 Westfield Living Centres have remained open and trading, providing for their communities during the pandemic
1. Stores trading as at the end of the month2. Excluding Victoria. Including Victoria 88% of stores were trading and customer visits were 80%
1
2
Australia New Zealand
1
100% 100%
46% 44%
82%92% 93%
103% 100%
82%
43%
64%
81% 84%
0%
20%
40%
60%
80%
100%
120%
January February March April May June July
% Stores Trading Customer Visits as % of pcpFor
per
sona
l use
onl
y

Half Year Results 2020 6
Gross Rent Cash Collections
94% 94%
82%
28%
35%
80% 82%
0%
20%
40%
60%
80%
100%
120%
January February March April May June July
Q1: 90% or $574m Q2: 48% or $301m
$200m $200m $174m $59m $74m $168m $172m
1H20: 70% or $875m
The Group collected $875 million (70%) of total billings in the first half of 2020, pre application of the SME Code of Conduct
For
per
sona
l use
onl
y
Half Year Results 2020 7
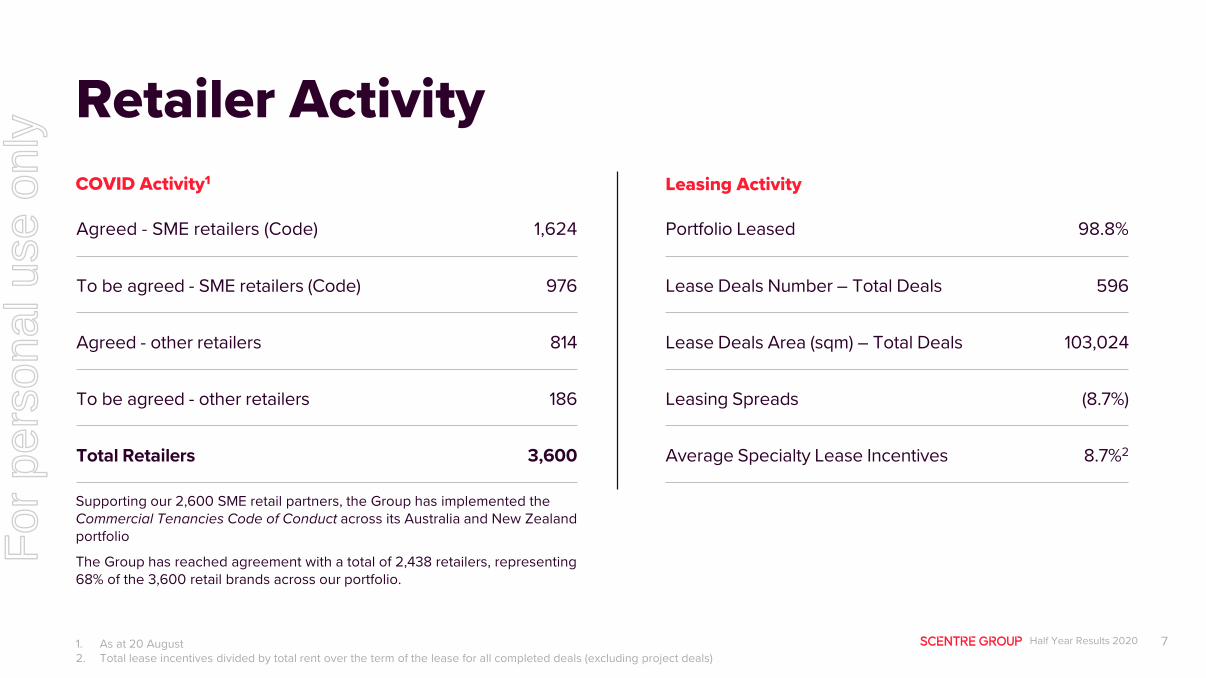
Retailer Activity
Portfolio Leased 98.8%
Lease Deals Number – Total Deals 596
Lease Deals Area (sqm) – Total Deals 103,024
Leasing Spreads (8.7%)
Average Specialty Lease Incentives 8.7%2
COVID Activity1 Leasing Activity
Agreed - SME retailers (Code) 1,624
To be agreed - SME retailers (Code) 976
Agreed - other retailers 814
To be agreed - other retailers 186
Total Retailers 3,600
Supporting our 2,600 SME retail partners, the Group has implemented theCommercial Tenancies Code of Conduct across its Australia and New Zealand portfolio
The Group has reached agreement with a total of 2,438 retailers, representing 68% of the 3,600 retail brands across our portfolio.
1. As at 20 August2. Total lease incentives divided by total rent over the term of the lease for all completed deals (excluding project deals)
For
per
sona
l use
onl
y
Half Year Results 2020 8
Sydney
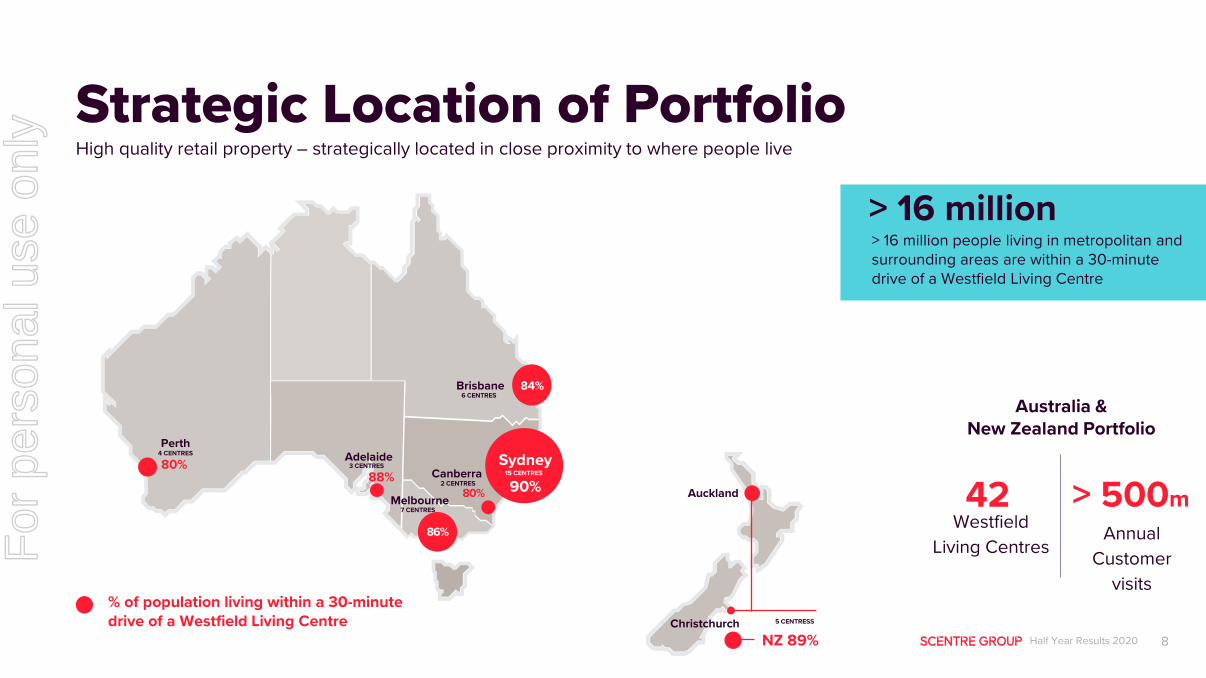
Strategic Location of Portfolio
Australia & New Zealand Portfolio
42Westfield
Living Centres
> 16 million people living in metropolitan and surrounding areas are within a 30-minute drive of a Westfield Living Centre
> 16 million
High quality retail property – strategically located in close proximity to where people live
> 500mAnnual
Customer visits
Brisbane
Canberra
Melbourne
Adelaide
80%
Perth
7 CENTRES
86%
6 CENTRES84%
Sydney
90%80%
88%
4 CENTRES
3 CENTRES
2 CENTRES15 CENTRES
% of population living within a 30-minute drive of a Westfield Living Centre
Auckland
5 CENTRESS
NZ 89%Christchurch
For
per
sona
l use
onl
y

Half Year Results 2020 9
By listening to and understanding what our customers want, we can enhance their experience
We want toRemove friction
AndCreate new opportunities for interaction
BetweenScentre Group, our customers and ourretailers
Customer InitiativesConnected Customer Experience
“We are accelerating the implementation of our Connected Customer Experience”PETER ALLEN CEO
For
per
sona
l use
onl
y

Half Year Results 2020 10
The contactless drive-thru click and collect service was launched in all 42 Westfield Living centres during the peak period of COVID lockdown
Retailers participated across every centre in Australia and New Zealand
14,000+ products available from 590 retailers
Over 10,000 orders serviced
Significant body of learning to inform future marketplace development
Westfield Direct
Half Year Results 2020 10
For
per
sona
l use
onl
y

Half Year Results 2020 11
Introducing Westfield PlusOur membership program.
Designed to drive value for our customers by removing friction in centre, personalising communications & rewarding engaged members with exclusive benefits.
Now live in 12 Westfield Living centres. Rolling out to additional centres in 2020.
500,000+ members joined since launch
Member engagement with communications 60% higher than non-member base.
“This was a bonus and so easy to install. Love the fact that you can now have four hours of free parking which allows more time to spend at the centre”
Westfield Chermside member
“Easy to download and, as well as the extra hour parking, it keeps me updated with Westfield news”
Bondi Junction member
“It was extremely easy to download and register, fabulous idea and love the extra hour for shopping and eating”
Kotara member
Westfield Plus
Half Year Results 2020 11
For
per
sona
l use
onl
y

Half Year Results 2020 12
CommunityConnecting and enriching communities
– Extensive community and government authority engagement has meant we have been able to keep all our Living Centres open throughout the period, implementing approved safety protocols
– In Victoria we have worked with the state government and enabled them to conduct drive-through COVID-testing facilities in our carparks
– We continued to expand the reach and impact of our $1.2 million Westfield Local Heroes program into wider community causes (e.g. sustainability) with nominations up 38% on 2019
EconomicWe will deliver long term sustainable returns through economic cycles
– Scentre Group has received a Sustainalytics ESG ranking of 25th out of 12,250 companies globally. Placing the Group in the top 1 percent globally
– Pre-eminent portfolio of 42 Westfield Living Centres across Australia and New Zealand
– More than 12,000 outlets, more than 3.8 million sqm of retail space, estimated to generate employment of more than 140,000 jobs in retail and logistics
– A future development pipeline in excess of $3 billion
– Our centres stimulate significant local economic activity and improve the quality of local infrastructure and social amenities
EnvironmentalNet zero emissions by 20301
– In August 2020, Scentre Group committed to the Task Force for Climate-Related Financial Disclosures (TCFD)
– Further improvement in our average portfolio NABERS rating to 4.3 stars at the end of June – well on track to meet our target 4.5 stars by 2025
– Further reduced our carbon emission intensity by 33.5% since 2009 – on track to meet our target of 35% by 2025 well ahead of schedule
– Continue our progress towards net zero emissions by 2030, with ongoing energy efficiency initiatives, including LED, building management and energy analytic controls and systems
PeopleWe will be the place for talent to thrive
– The Group has not received any funds from the Australian Government under its JobKeeper scheme
– WGEA Employer of Choice for Gender Equality retained.
– All employees are paid fairly and equitably, without any gender pay gaps for like roles
– Improved our AWEI inclusion recognition and rating from Bronze to Silver
– Continued strong enablement of talent:
– NPS for potential new hires +85%
– Appointments filled internally at +65%
– Gender equity in promotion
We are a Responsible, Sustainable Business
1. All scope 1 and scope 2 emissions, for all wholly owned assets across the portfolio
For
per
sona
l use
onl
y
Half Year Results 2020 13
The health, safety and wellbeing of our customers, retailers and people is our number one priority- We will continue to follow government and health advice
The fundamentals of the Group remain strong and the business is well positioned to deliver long-term sustainable returns through economic cycles
We have a great team of people who are customer obsessed, we own and operate major essential social infrastructure in the best locations within close proximity to where people live
We remain focused in further developing strategic initiatives that enhance our deep knowledge, relationship and engagement with our customers so we can continually provide what they want- Enabling the Group to adapt to immediate needs and innovate for the long-term - Accelerating customer initiatives - Westfield Direct and Westfield Plus, providing more
opportunities to enhance our direct engagement with the consumer- Customers are telling us and demonstrating they want to get out and about again to their
local centres because it’s part of their lives and daily activities
Summary
“We own and operate major essential social infrastructure in the best locations and within close proximity to where people live. We will continue our focus on further developing strategic initiatives that enhance our deep knowledge, relationship and engagement with our customers to deliver what our customers want.”PETER ALLEN CEO
For
per
sona
l use
onl
y

Half Year Results 2020 14
Funds From OperationsFunds From Operations$m
6 months to30 Jun 2020
6 months to30 Jun 2019
Property revenue 1,146.1 1,235.4
Property expenses (249.4) (264.2)
Net Operating Income 896.7 971.2
Management income 20.9 23.4
Income 917.6 994.6
Overheads (41.9) (42.5)
Adjust: Straight lining of rent (6.2) (5.7)
EBIT – Pre Expected Credit Charge 869.5 946.4
Expected Credit Charge (ECC)1 (232.1) 0.0
EBIT 637.4 946.4
Net interest (250.0) (263.6)
Earnings Before Tax 387.4 682.8
Tax (11.6) (19.6)
Minority interest (15.0) (21.7)
Operating Earnings 360.8 641.5
Operating Earnings per Security (cents) 6.94 12.09
Project income 1.6 41.4
Tax on Project income (0.5) (12.4)
Project Income after Tax 1.1 29.0
Funds From Operations 361.9 670.5
Funds From Operations per Security (cents) 6.96 12.64
1. Includes an estimate of temporary rental assistance and debtors provision
For
per
sona
l use
onl
y

Half Year Results 2020 15
Financial PositionBalance Sheet
$m 30 Jun 2020 31 Dec 2019
Total Property Investments 34,186.8 38,172.6
Other Assets 1,275.5 923.6
Total Assets1 35,462.3 39,096.2
Interest Bearing Liabilities2 13,618.1 12,902.3
Other Liabilities 2,105.2 1,957.0
Total Liabilities 15,723.3 14,859.3
Net Assets before Minority Interest 19,739.0 24,236.9
Minority Interest (784.4) (898.3)
Net Assets 18,954.6 23,338.6
1. Total assets excluding cash and currency derivative receivables2. Interest bearing liabilities adjusted for cash and net currency derivatives
For
per
sona
l use
onl
y

Half Year Results 2020 16
Debt Metrics
$4.4bnLiquidity1
3.6xInterest Cover2
30 June 2020
Debt metricsNet Debt $13.6bn
Gearing (look through basis) 38.4%
Weighted average interest rate 4.0%
Weighted average debt maturity1 4.8 years
Liquidity1 $4.4bn
Interest rate exposure hedged percentage 81%
Investment grade credit ratingsStandard & Poor’s A (Negative)
Fitch A (Negative)
Moody’s A2 (Negative)
81%Interest rate hedging
1. Pro-forma including the repayment of the €600m bond maturity in July 2020 and the $900 million of bank loan facility extensions in July 20202. Excluding the impact of temporary retailer support, the Expected Credit Charge (ECC)
For
per
sona
l use
onl
y
Half Year Results 2020 17
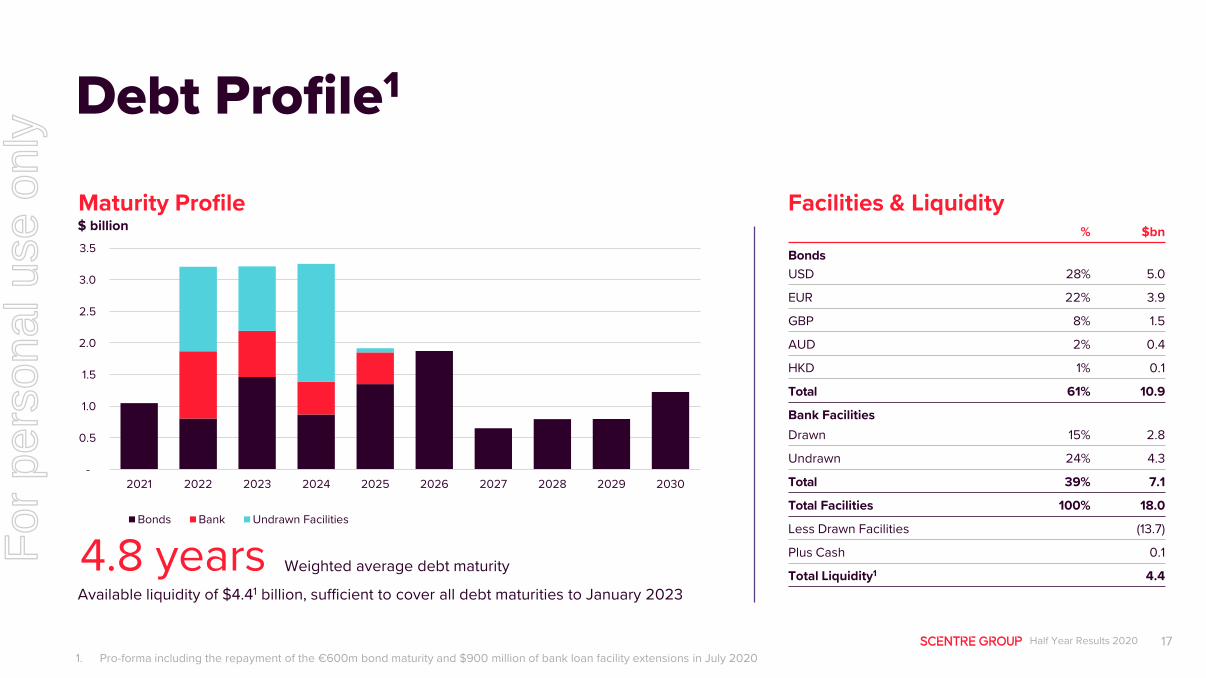
Debt Profile1
Weighted average debt maturity4.8 years
Maturity Profile Facilities & Liquidity% $bn
BondsUSD 28% 5.0
EUR 22% 3.9
GBP 8% 1.5
AUD 2% 0.4
HKD 1% 0.1
Total 61% 10.9
Bank FacilitiesDrawn 15% 2.8
Undrawn 24% 4.3
Total 39% 7.1
Total Facilities 100% 18.0
Less Drawn Facilities (13.7)
Plus Cash 0.1
Total Liquidity1 4.4
$ billion
-
0.5
1.0
1.5
2.0
2.5
3.0
3.5
2021 2022 2023 2024 2025 2026 2027 2028 2029 2030
Bonds Bank Undrawn Facilities
Available liquidity of $4.41 billion, sufficient to cover all debt maturities to January 2023
1. Pro-forma including the repayment of the €600m bond maturity and $900 million of bank loan facility extensions in July 2020
For
per
sona
l use
onl
y
Half Year Results 2020 18
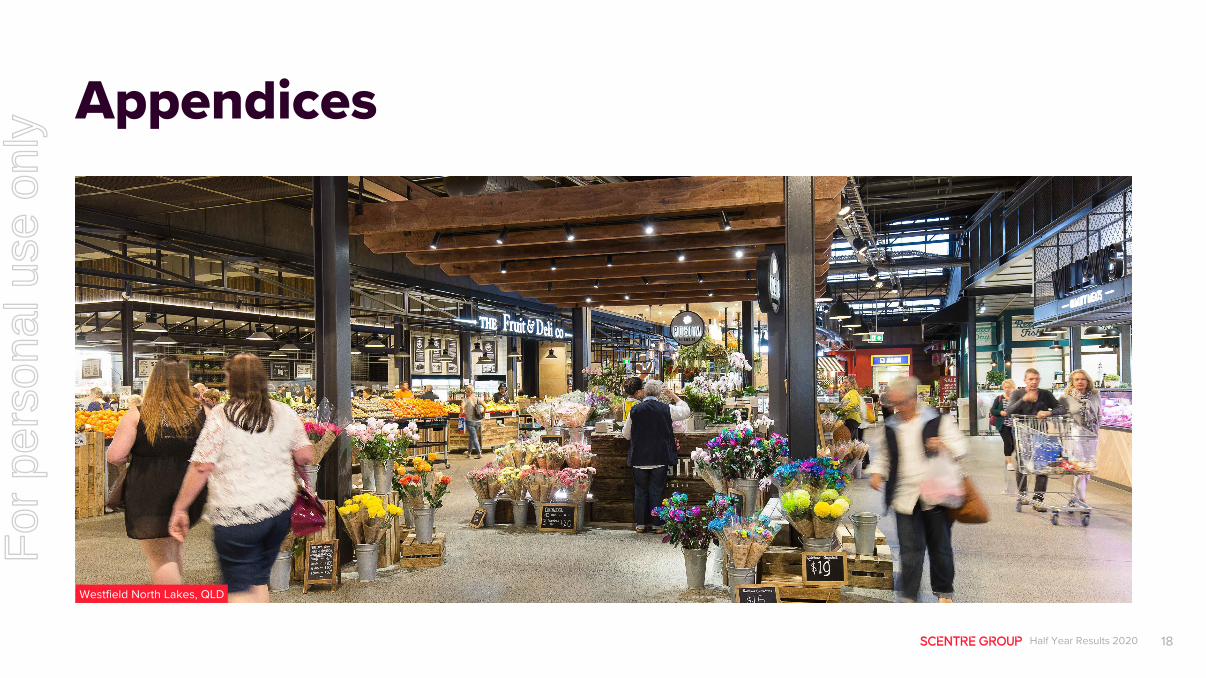
Appendices
Westfield North Lakes, QLD
For
per
sona
l use
onl
y
Half Year Results 2020 19
Development ActivityTotal Project
Cost$m
SCG Share$m
Completion
Active Projects
Carindale 50 16 10 Sep 2020
Total Projects 50 16
Target returns from development of greater than 7% yield and greater than 15% IRR
Total Special Projects 90 67Doncaster ELP1
Belconnen MyerHornsby Harvey Norman
Future Retail Developments > 3,000
1. Entertainment and Lifestyle Precinct
For
per
sona
l use
onl
y
Half Year Results 2020 20
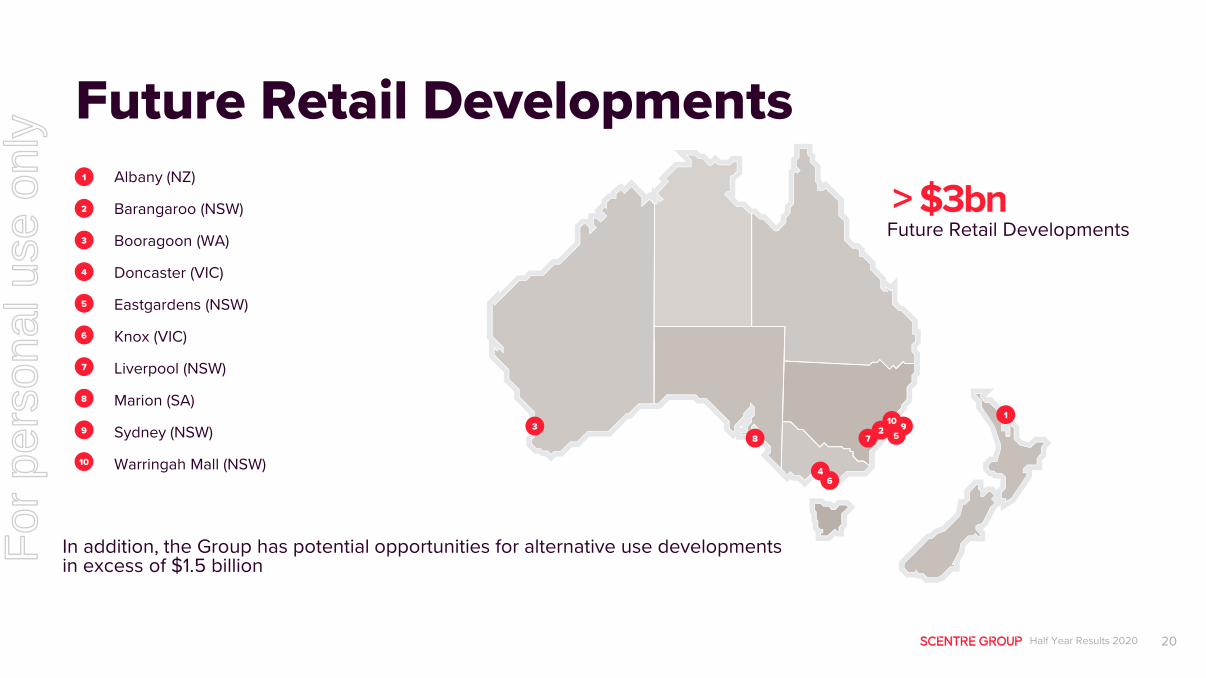
Future Retail Developments> $3bn
Future Retail DevelopmentsAlbany (NZ)
Barangaroo (NSW)
Booragoon (WA)
Doncaster (VIC)
Eastgardens (NSW)
Knox (VIC)
Liverpool (NSW)
Marion (SA)
Sydney (NSW)
Warringah Mall (NSW)
1
2
3
4
5
6
7
8
9
10
193
7
6
1058
2
4
In addition, the Group has potential opportunities for alternative use developments in excess of $1.5 billionF
or p
erso
nal u
se o
nly

Half Year Results 2020 21
Retailer In-Store Sales
1. Total like-for-like retailers representing approximately 40% of all stores – total dollar sales growth
Total in-store sales were 8.1% lower for the half and 3.5% lower for the year
Specialty in-store sales were 12.1% lower for the half and 4.8% lower for the year
Majors in-store sales were 4.5% lower for the half and 2.4% lower for the year
Like-for-like in-store sales1
Specialty Sales by Region
6 months to 30 Jun 2020
12 Months to 30 Jun 2020
NSW (14.2%) (5.4%)
QLD (7.9%) (3.7%)
VIC (14.0%) (5.8%)
WA (7.5%) (1.0%)
SA (9.0%) (3.3%)
ACT (7.1%) (3.1%)
NZ (19.8%) (9.6%)
Total (12.1%) (4.8%)
For
per
sona
l use
onl
y

Half Year Results 2020 22
Cash FlowCash flows from operating activities – proportionate$m Consolidated
Equity Accounted
6 months to 30 Jun 2020
Receipts in the course of operations (including GST) 969.9 89.5 1,059.4
Payments in the course of operations (including GST) (404.4) (27.4) (431.8)
Net operating cash flows from equity accounted entities 41.2 (41.2) —
Income and withholding taxes paid (15.8) (5.3) (21.1)
GST paid1 (75.0) (3.4) (78.4)
Payments of financing costs (excluding interest capitalised) (257.1) (12.2) (269.3)
Interest received 1.9 — 1.9
Net cash flows from operating activities (pre GST on outstanding trade debtors) 260.7 — 260.7
Less: GST paid on outstanding trade debtors – proportionate (32.0) — (32.0)
Net cash flows from operating activities 228.7 — 228.7
1. Excludes GST received/(paid) on outstanding trade debtors
For
per
sona
l use
onl
y
Half Year Results 2020 23
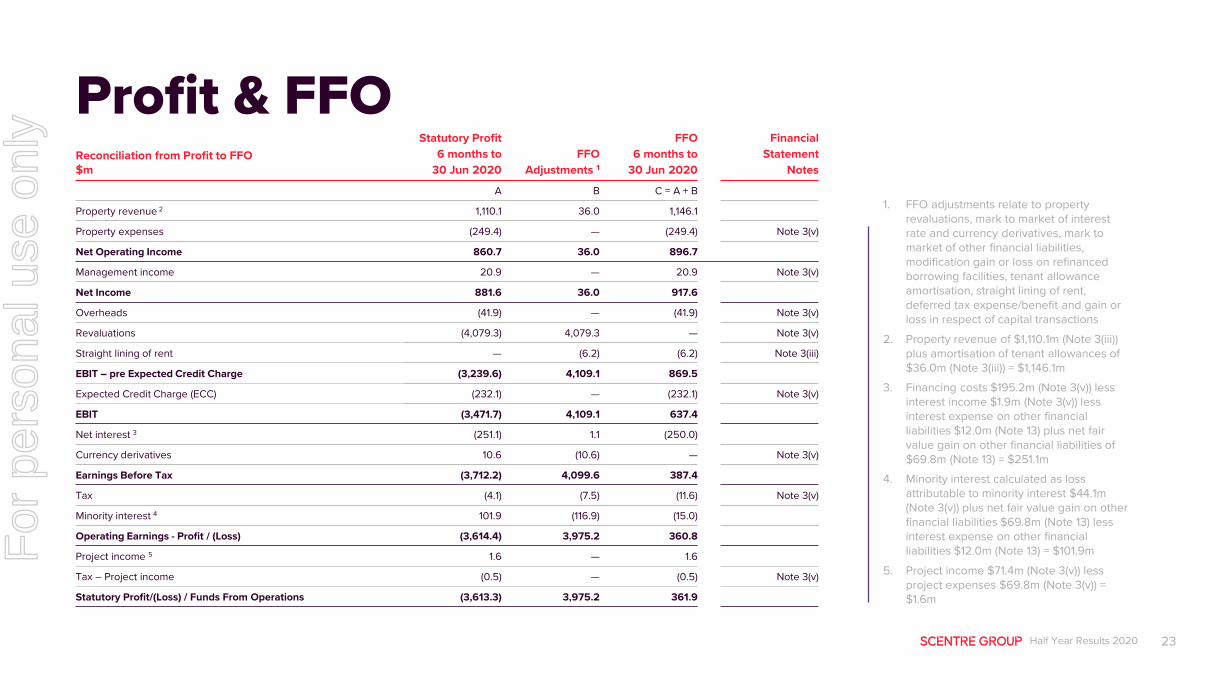
Profit & FFO
1. FFO adjustments relate to property revaluations, mark to market of interest rate and currency derivatives, mark to market of other financial liabilities, modification gain or loss on refinanced borrowing facilities, tenant allowance amortisation, straight lining of rent, deferred tax expense/benefit and gain or loss in respect of capital transactions
2. Property revenue of $1,110.1m (Note 3(iii)) plus amortisation of tenant allowances of $36.0m (Note 3(iii)) = $1,146.1m
3. Financing costs $195.2m (Note 3(v)) less interest income $1.9m (Note 3(v)) less interest expense on other financial liabilities $12.0m (Note 13) plus net fair value gain on other financial liabilities of $69.8m (Note 13) = $251.1m
4. Minority interest calculated as loss attributable to minority interest $44.1m (Note 3(v)) plus net fair value gain on other financial liabilities $69.8m (Note 13) less interest expense on other financial liabilities $12.0m (Note 13) = $101.9m
5. Project income $71.4m (Note 3(v)) less project expenses $69.8m (Note 3(v)) = $1.6m
Reconciliation from Profit to FFO$m
Statutory Profit6 months to
30 Jun 2020FFO
Adjustments 1
FFO 6 months to
30 Jun 2020
FinancialStatement
Notes
A B C = A + B
Property revenue 2 1,110.1 36.0 1,146.1
Property expenses (249.4) — (249.4) Note 3(v)
Net Operating Income 860.7 36.0 896.7
Management income 20.9 — 20.9 Note 3(v)
Net Income 881.6 36.0 917.6
Overheads (41.9) — (41.9) Note 3(v)
Revaluations (4,079.3) 4,079.3 — Note 3(v)
Straight lining of rent — (6.2) (6.2) Note 3(iii)
EBIT – pre Expected Credit Charge (3,239.6) 4,109.1 869.5
Expected Credit Charge (ECC) (232.1) — (232.1) Note 3(v)
EBIT (3,471.7) 4,109.1 637.4
Net interest 3 (251.1) 1.1 (250.0)
Currency derivatives 10.6 (10.6) — Note 3(v)
Earnings Before Tax (3,712.2) 4,099.6 387.4
Tax (4.1) (7.5) (11.6) Note 3(v)
Minority interest 4 101.9 (116.9) (15.0)
Operating Earnings - Profit / (Loss) (3,614.4) 3,975.2 360.8
Project income 5 1.6 — 1.6
Tax – Project income (0.5) — (0.5) Note 3(v)
Statutory Profit/(Loss) / Funds From Operations (3,613.3) 3,975.2 361.9
For
per
sona
l use
onl
y

Half Year Results 2020 24
Balance Sheet
1. Period end AUD/NZD exchange rate 1.0694 at 30 Jun 2020
2. Includes $619.2m of Property Linked Notes shown in minority interest given their equity characteristics, and $165.2m relating to Carindale Property Trust
3. Interest bearing liabilities adjusted for cash and net currency derivatives
4. Total assets excluding cash and currency derivative receivables
Balance Sheet – Proportionate1
$m ConsolidatedEquity
AccountedDebt
Reclassifications 30 Jun 2020
A B C D = A +B + C
Cash 927.2 10.1 (937.3) —
Property Investments– Shopping centres 30,834.3 2,817.7 — 33,652.0
– Development projects and construction in progress 474.3 60.5 — 534.8
Total Property Investments 31,308.6 2,878.2 — 34,186.8
Equity accounted investments 2,762.5 (2,762.5) — —
Deferred tax assets 32.4 1.9 — 34.3
Currency derivative receivables 791.1 — (791.1) —
Other assets 1,218.5 22.7 — 1,241.2
Total Assets 37,040.3 150.4 (1,728.4) 35,462.3
Interest bearing liabilities 15,166.2 — (1,548.1) 13,618.1
Lease liabilities 137.0 0.4 — 137.4
Deferred tax liabilities 96.5 77.3 — 173.8
Currency derivative payables 180.3 — (180.3) —
Other liabilities 1,721.3 72.7 — 1,794.0
Total Liabilities 17,301.3 150.4 (1,728.4) 15,723.3
Net Assets before Minority Interest 19,739.0 — — 19,739.0
Minority interest 2 (784.4) — — (784.4)
Net Assets 18,954.6 — — 18,954.6
Debt 3 13,618.1
Assets4 35,462.3
Gearing 38.4%
For
per
sona
l use
onl
y
Half Year Results 2020 25
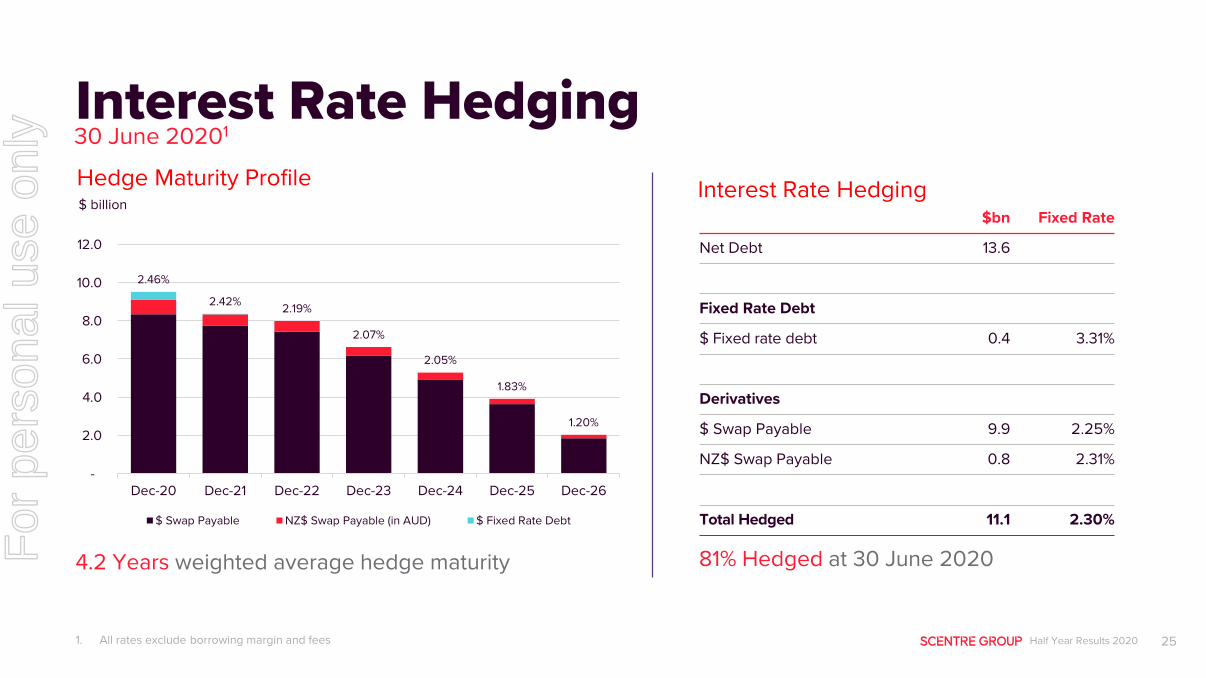
Interest Rate Hedging
1. All rates exclude borrowing margin and fees
81% Hedged at 30 June 2020
$ billion$bn Fixed Rate
Net Debt 13.6
Fixed Rate Debt
$ Fixed rate debt 0.4 3.31%
Derivatives
$ Swap Payable 9.9 2.25%
NZ$ Swap Payable 0.8 2.31%
Total Hedged 11.1 2.30%
4.2 Years weighted average hedge maturity
Hedge Maturity Profile Interest Rate Hedging
30 June 20201
2.46%
2.42% 2.19%
2.07%
2.05%
1.83%
1.20%
-
2.0
4.0
6.0
8.0
10.0
12.0
Dec-20 Dec-21 Dec-22 Dec-23 Dec-24 Dec-25 Dec-26
$ Swap Payable NZ$ Swap Payable (in AUD) $ Fixed Rate Debt
For
per
sona
l use
onl
y

Half Year Results 2020 26
Property Valuations
AUSTRALIA (A$m) Ownership Book Value Retail Cap Rate Economic YieldAUSTRALIAN CAPITAL TERRITORYBelconnen 100% 770.0 5.75% 6.16%Woden 50% 310.0 5.75% 6.57%
NEW SOUTH WALESBondi Junction 100% 3,003.9 4.25% 4.64%Burwood 50% 520.2 4.75% 5.47%Chatswood 100% 1,312.6 4.50% 4.83%Eastgardens 50% 592.5 4.50% 5.13%Hornsby 100% 1,070.2 5.25% 5.63%Hurstville 50% 410.0 5.25% 6.04%Kotara 100% 875.0 5.50% 5.89%Liverpool 50% 500.1 5.38% 6.15%Miranda 50% 1,180.5 4.50% 5.13%Mt Druitt 50% 297.5 5.63% 6.46%Parramatta 50% 1,006.9 4.50% 5.20%Penrith 50% 655.0 5.00% 5.70%Sydney 100% 4,014.8 4.23% 4.56%Tuggerah 100% 740.0 5.63% 6.02%Warringah Mall 50% 850.0 5.13% 5.81%
QUEENSLANDCarindale 50% 724.1 5.00% 5.77%Chermside 100% 2,570.0 4.50% 4.88%Coomera 50% 197.5 5.75% 6.61%Garden City 100% 1,560.0 5.00% 5.37%Helensvale 50% 191.0 6.00% 6.95%North Lakes 50% 455.0 5.00% 5.76%
SOUTH AUSTRALIAMarion 50% 647.5 5.25% 6.12%Tea Tree Plaza 50% 348.6 5.50% 6.54%West Lakes 50% 196.0 6.25% 7.43%
AUSTRALIA (A$m) Ownership Book Value Retail Cap Rate Economic YieldVICTORIAAirport West 50% 180.0 6.00% 6.98%Doncaster 50% 1,138.5 4.50% 5.13%Fountain Gate 100% 1,920.0 4.50% 4.84%Geelong 50% 225.0 6.00% 7.02%Knox 50% 425.0 5.50% 6.55%Plenty Valley 50% 250.0 5.38% 6.27%Southland 50% 720.0 5.00% 5.77%
WESTERN AUSTRALIABooragoon 50% 505.0 5.00% 5.69%Carousel 100% 1,300.0 5.13% 5.40%Innaloo 100% 288.0 6.00% 6.62%Whitford City 50% 250.0 6.00% 7.09%
TOTAL AUSTRALIA 32,200.4 4.85%1 5.35%
NEW ZEALAND (NZ$m)Albany 51% 277.9 6.25% 7.17%Manukau 51% 191.2 6.75% 7.83%Newmarket 51% 588.4 5.38% 5.94%Riccarton 51% 288.2 6.75% 7.73%St Lukes 51% 206.6 6.75% 7.85%
TOTAL NEW ZEALAND (NZ$m) 1,552.3 6.16%1 6.98%
TOTAL SCENTRE GROUP (A$m) 33,652.0 4.91%1 5.43%
30 June 2020
1. Weighted average cap rate including non-retail assets
For
per
sona
l use
onl
y
Half Year Results 2020 27
All amounts in Australian dollars unless otherwise specified. The financial information included inthis document is based on the Scentre Group’s IFRS financial statements. Non IFRS financialinformation included in this document has not been audited or reviewed. This document containsforward-looking statements, including statements regarding future earnings and distributions thatare based on information and assumptions available to us as of the date of this document. Actualresults, performance or achievements could be significantly different from those expressed in, orimplied by, these forward-looking statements. These forward-looking statements are notguarantees or predictions of future performance, and involve known and unknown risks,uncertainties and other factors, many of which are beyond our control, and which may cause actualresults to differ materially from those expressed in the statements contained in this document. Youshould not place undue reliance on these forward-looking statements. Except as required by law orregulation (including the ASX Listing Rules) we undertake no obligation to update these forward-looking statements.
SCENTRE GROUP LIMITED ABN 66 001 671 496
SCENTRE MANAGEMENT LIMITED ABN 41 001 670 579 AFS Licence No: 230329 as responsible entity of Scentre Group Trust 1 ARSN 090 849746
RE1 LIMITEDABN 80 145 743 862 AFS Licence No: 380202as responsible entity of Scentre Group Trust 2ARSN 146 934 536
RE2 LIMITEDABN 41 145 744 065 AFS Licence No: 380203as responsible entity of Scentre Group Trust 3ARSN 146 934 652
Important NoticeF
or p
erso
nal u
se o
nly


![31 December 2018 - Scentre Group · 2019. 2. 20. · SCENTRE GROUP PROPERTY COMPENDIUM 2018 ... Pro forma post sale of four Australian assets, settlement expected Q3 2015] 19% 17%](https://img.pdfslide.net/doc/110x75/601b333ca3073350dd3d5959/31-december-2018-scentre-group-2019-2-20-scentre-group-property-compendium.jpg)