Embed Size (px)
Citation preview
Scheduling
222
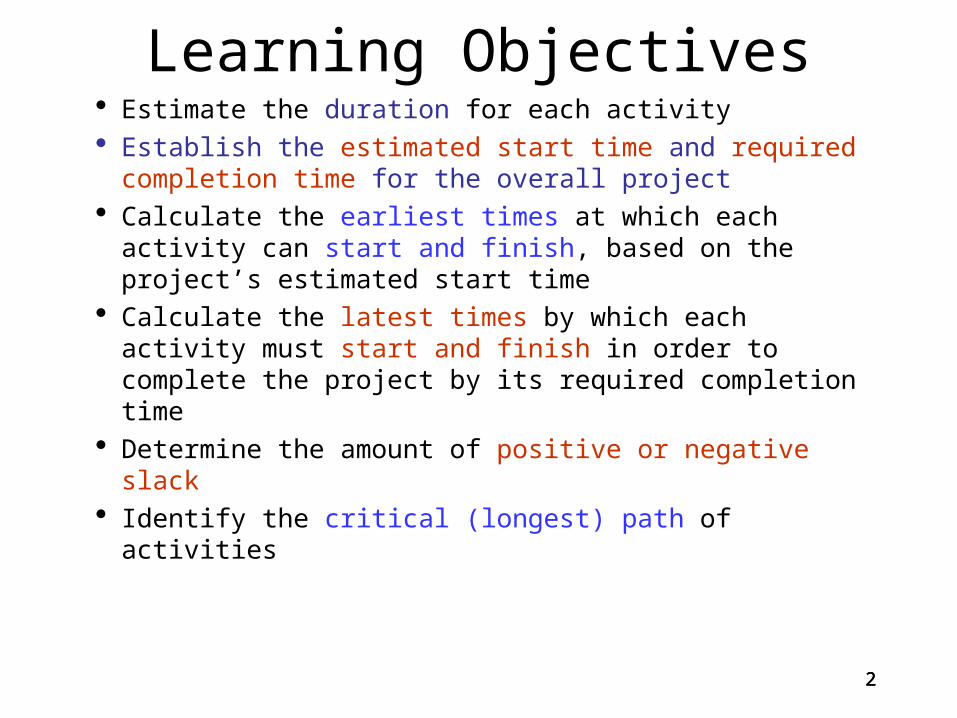
Learning Objectives Estimate the duration for each activity Establish the estimated start time and required
completion time for the overall project Calculate the earliest times at which each activity
can start and finish, based on the project’s estimated start time
Calculate the latest times by which each activity must start and finish in order to complete the project by its required completion time
Determine the amount of positive or negative slack Identify the critical (longest) path of activities
4
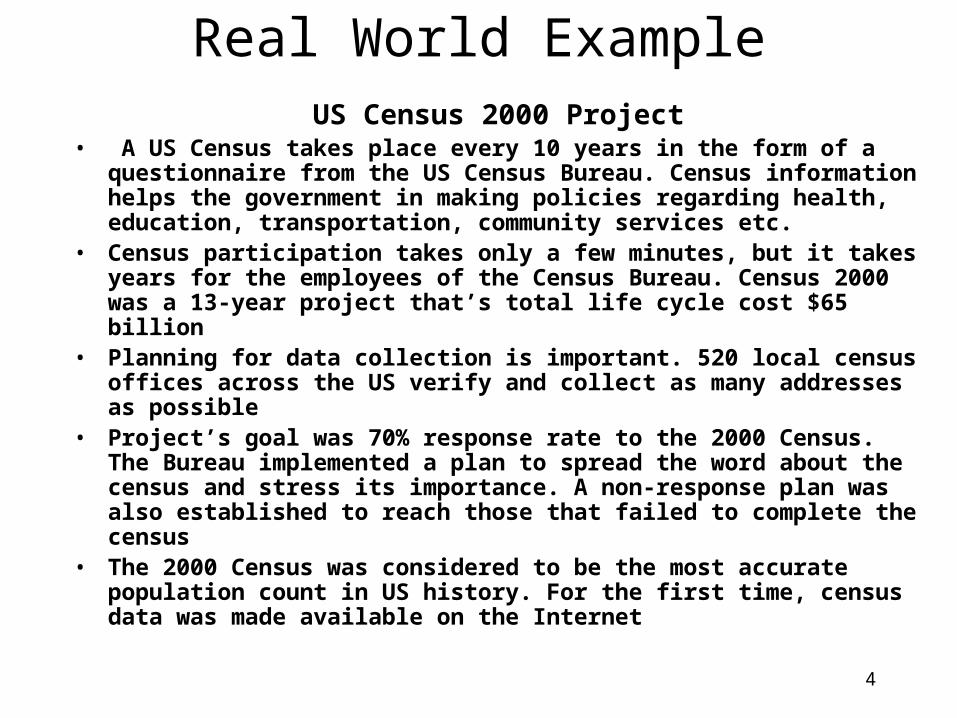
Real World ExampleUS Census 2000 Project
• A US Census takes place every 10 years in the form of a questionnaire from the US Census Bureau. Census information helps the government in making policies regarding health, education, transportation, community services etc.
• Census participation takes only a few minutes, but it takes years for the employees of the Census Bureau. Census 2000 was a 13-year project that’s total life cycle cost $65 billion
• Planning for data collection is important. 520 local census offices across the US verify and collect as many addresses as possible
• Project’s goal was 70% response rate to the 2000 Census. The Bureau implemented a plan to spread the word about the census and stress its importance. A non-response plan was also established to reach those that failed to complete the census
• The 2000 Census was considered to be the most accurate population count in US history. For the first time, census data was made available on the Internet
6
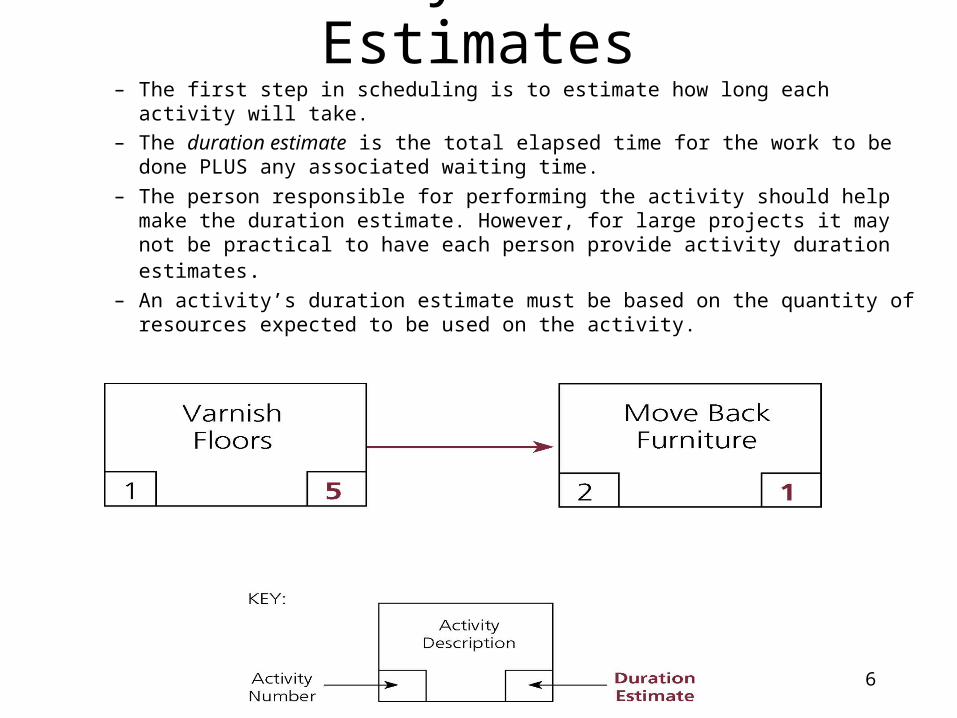
Activity Duration Estimates– The first step in scheduling is to estimate how long each activity will take.
– The duration estimate is the total elapsed time for the work to be done PLUS any associated waiting time.
– The person responsible for performing the activity should help make the duration estimate. However, for large projects it may not be practical to have each person provide activity duration estimates.
– An activity’s duration estimate must be based on the quantity of resources expected to be used on the activity.
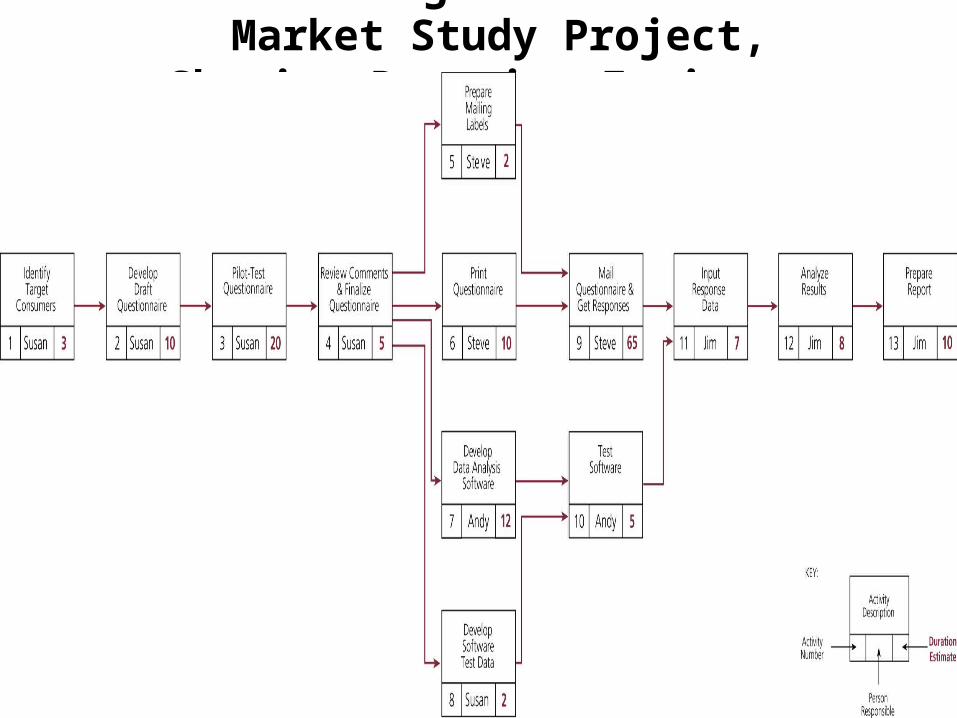
Network Diagram for Consumer Market Study Project,
Showing Duration Estimates
7
Project Start and Finish Times
• It is necessary to select an estimated start time and a required completion time for the overall project.
• The project’s required completion time is normally part of the project objective and stated in the contract.
• If a project must be completed in 130 working days, we define the project’s estimated start time as 0 and its required completion time is day 130.
8
Schedule Calculations• A project schedule includes:
– the earliest times (or dates) at which each activity can start and finish, based on the project's estimated start time (or date)
– the latest times (or dates) by which each activity must start and finish in order to complete the project by its required completion time (or date)
9
Earliest Start and Finish Times
• Earliest start time (ES) is the earliest time at which a particular activity can begin.
• Earliest finish time (EF) is the earliest time by which a particular activity can be completed.
• EF = ES + Duration Estimate• The ES and EF times are determined by calculating
forward through the network diagram.• Rule: 1
– The earliest start time for a particular activity must be the same as or later than the latest of all the earliest finish times of all the activities leading directly into that particular activity

Earliest Start Times
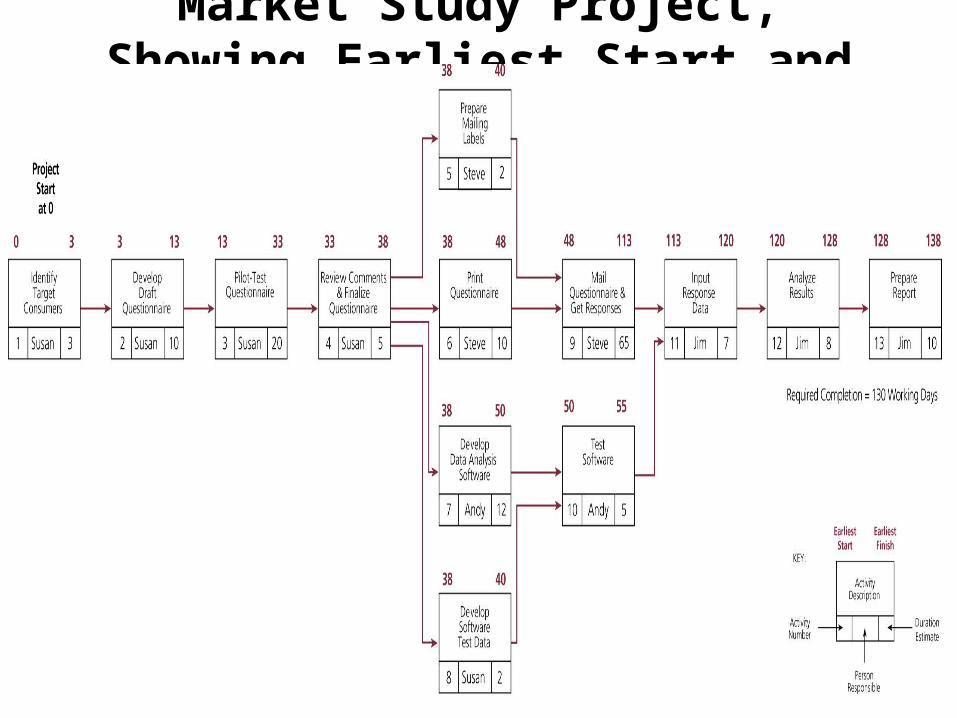
Network Diagram for Consumer Market Study Project,
Showing Earliest Start and Finish Times
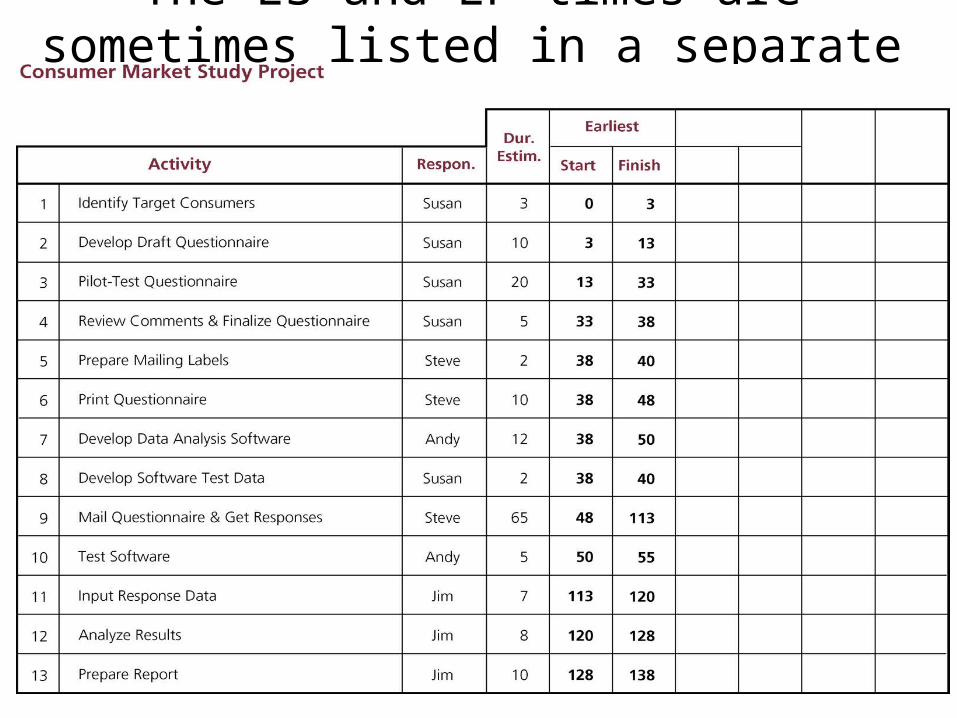
The ES and EF times are sometimes listed in a separate schedule table
11
Latest Start and Finish Times
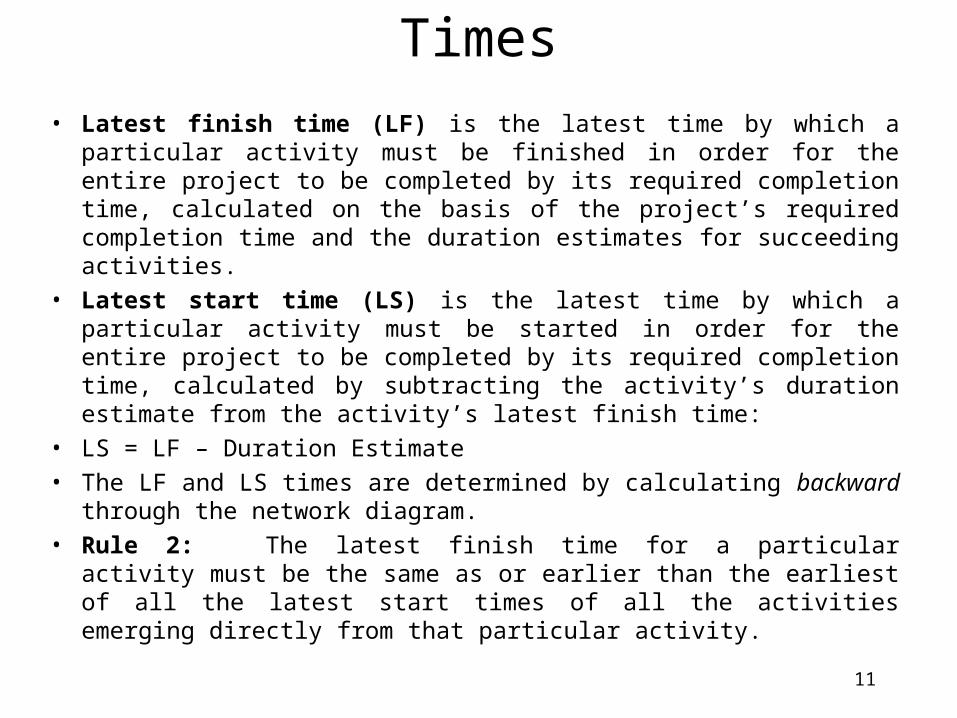
• Latest finish time (LF) is the latest time by which a particular activity must be finished in order for the entire project to be completed by its required completion time, calculated on the basis of the project’s required completion time and the duration estimates for succeeding activities.
• Latest start time (LS) is the latest time by which a particular activity must be started in order for the entire project to be completed by its required completion time, calculated by subtracting the activity’s duration estimate from the activity’s latest finish time:
• LS = LF – Duration Estimate• The LF and LS times are determined by calculating backward
through the network diagram.• Rule 2: The latest finish time for a particular activity must be the
same as or earlier than the earliest of all the latest start times of all the activities emerging directly from that particular activity.

Latest Finish Times
12
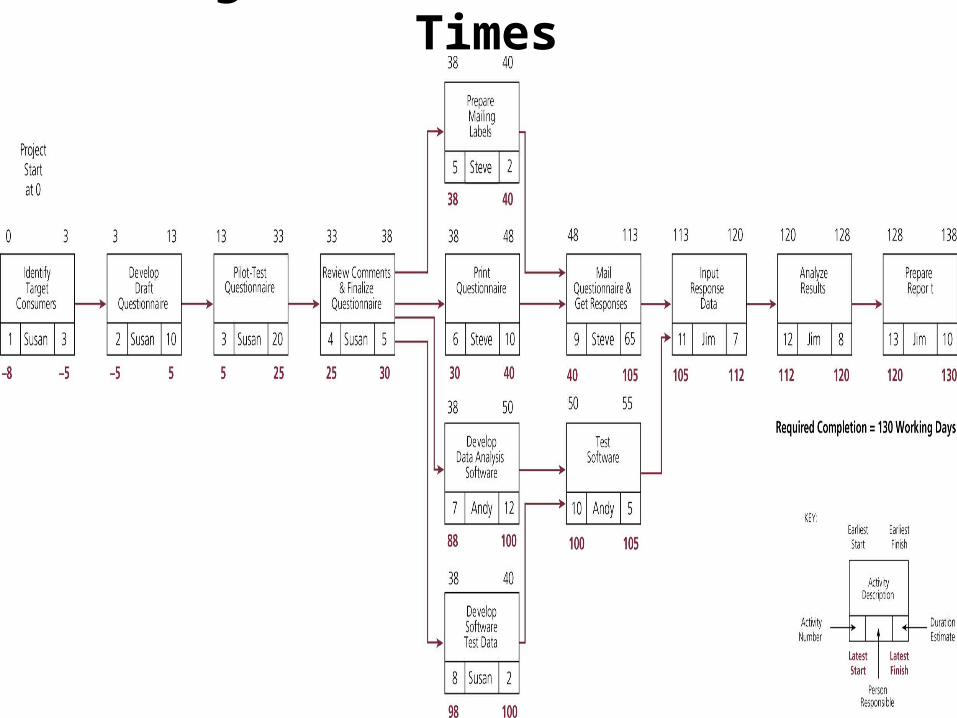
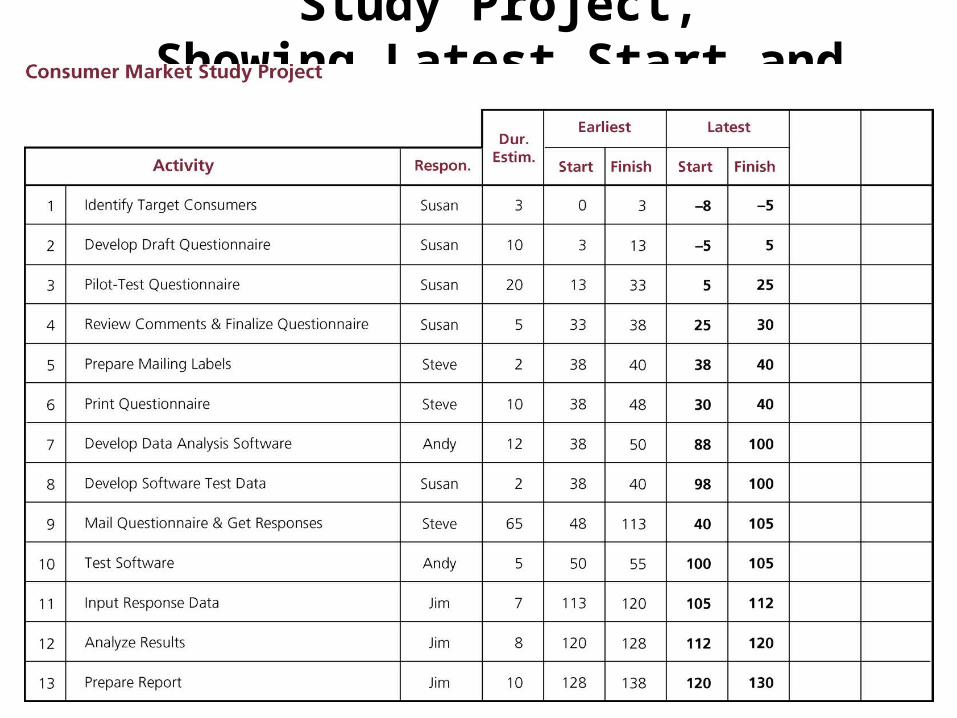
Network Diagram for Consumer Market Study Project,
Showing Latest Start and Finish Times

Latest Start and Finish Times
• The very first activity, “Identify Target Consumers,” has an LS of –8! This means that in order to complete the entire project by its required completion time of 130 days, the project must start 8 days earlier than it is estimated to start.
• Like the earliest start and earliest finish times, the latest start and latest finish times are sometimes shown in a separate schedule table
Schedule for Consumer Market Study Project,
Showing Latest Start and Finish Times

13
Total Slack, Defined• The difference between the calculated earliest finish time of the very
last activity and the project’s required completion time is the total slack (TS), sometimes called float.
• If total slack is positive, it represents the maximum amount of time that the activities on a particular path can be delayed without jeopardizing completion of the project by its required completion time.
• On the other hand, if total slack is negative, it represents the amount of time that the activities on a particular path must be accelerated in order to complete the project by its required completion time.
• Total Slack = LF – EF or Total Slack = LS – ES

14
Critical Path
• This longest path in the overall network diagram is called the critical path.
• One way to determine which activities make up the critical path is to find which ones have the least slack.
• All the activities with this value are on the critical path of activities.
• The values of total slack for the consumer market study project are shown in Figure on next slide
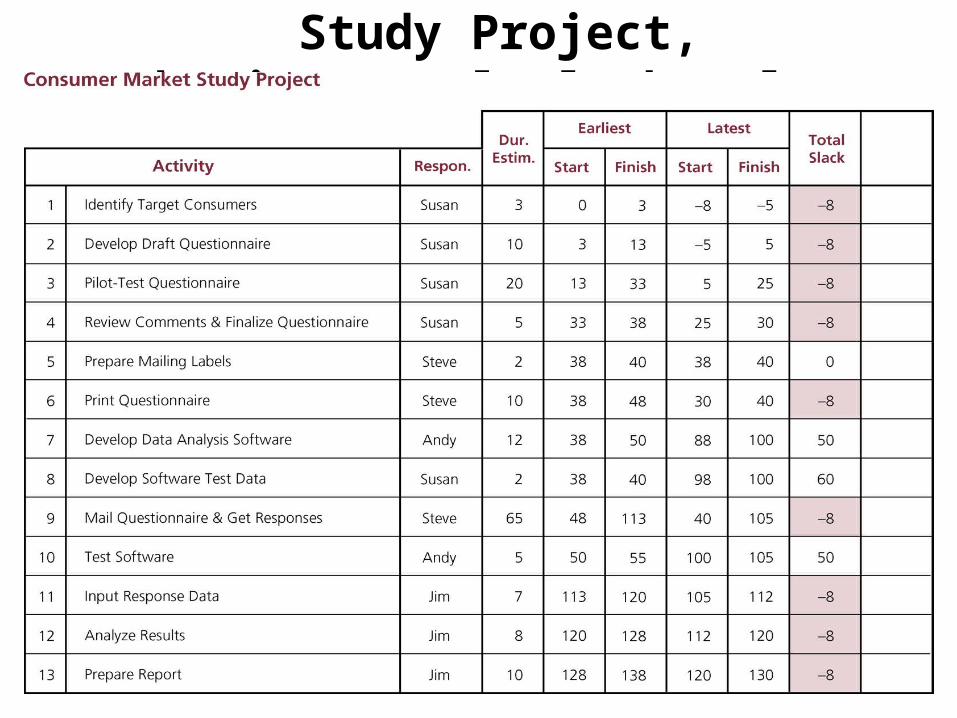
Schedule for Consumer Market Study Project,
Showing Total Slack Values
15
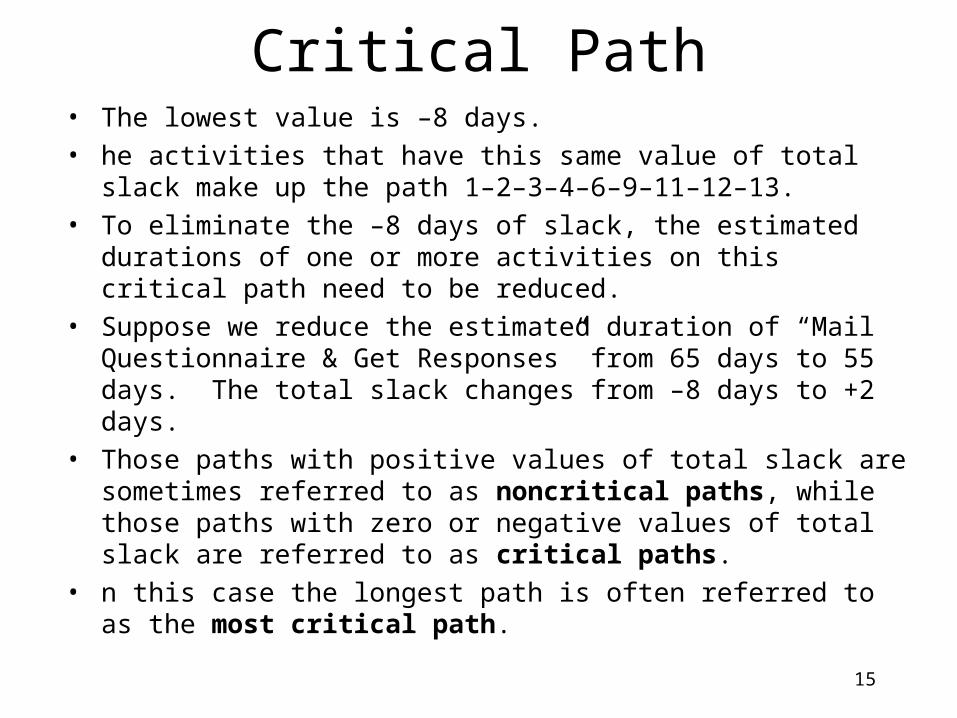
Critical Path• The lowest value is –8 days. • he activities that have this same value of total slack make up the
path 1–2–3–4–6–9–11–12–13. • To eliminate the –8 days of slack, the estimated durations of one or
more activities on this critical path need to be reduced. • Suppose we reduce the estimated duration of “Mail Questionnaire &
Get Responses” from 65 days to 55 days. The total slack changes from –8 days to +2 days.
• Those paths with positive values of total slack are sometimes referred to as noncritical paths, while those paths with zero or negative values of total slack are referred to as critical paths.
• n this case the longest path is often referred to as the most critical path.
16
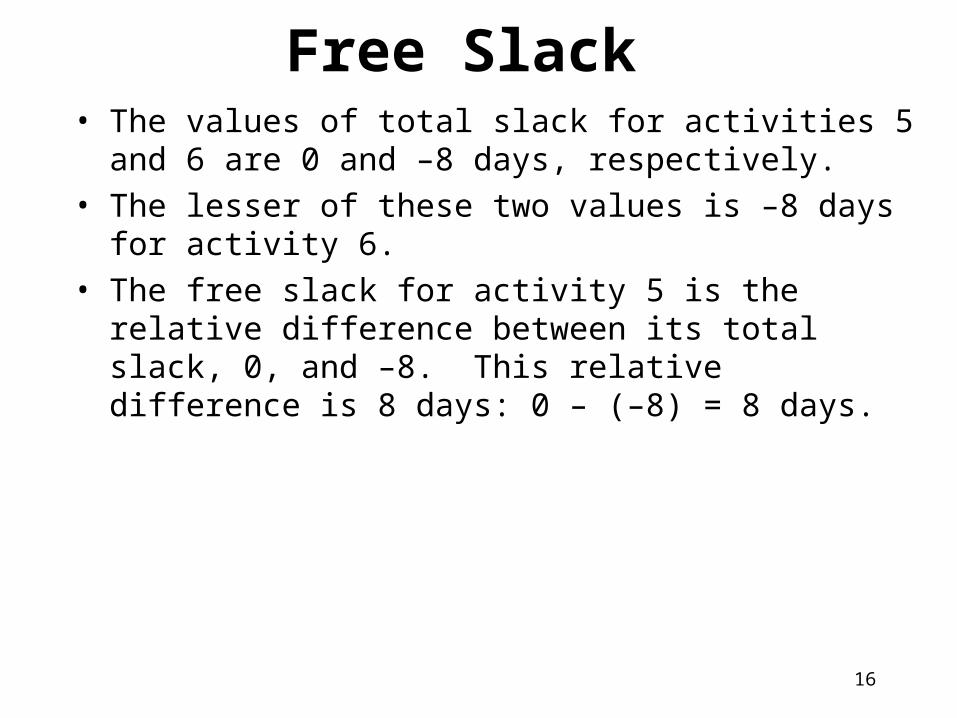
Free Slack • Free slack is the amount of time a particular activity can
be delayed without delaying the earliest start time of its immediately succeeding activities.
• It is the relative difference between the amounts of total slack for activities entering into the same activity.
• It is always a positive value • In the network diagram (Figure on Next slide), there are
three instances where a particular activity has more than one activity entering into it:– Activity 9, “Mail Questionnaire & Get Responses,” has activities 5
and 6 entering into it.– Activity 10, “Test Software,” has activities 7 and 8 entering into it.– Activity 11, “Input Response Data,” has activities 9 and 10
entering into it.

17
Free Slack
16
Free Slack • The values of total slack for activities 5 and 6 are 0 and –
8 days, respectively. • The lesser of these two values is –8 days for activity 6. • The free slack for activity 5 is the relative difference
between its total slack, 0, and –8. This relative difference is 8 days: 0 – (–8) = 8 days.
Scheduling-PERT
20
PERTProgramme Evaluation and Review
Technique
• PERT developed in 1956-58 by a research team to aid in the planning and scheduling of the US Navy’s Polaris Missile Programme which involved over three thousand different contracting organization.
• The objective of the team was to efficiently plan and produce the Polaris missile system.
• Since 1958, PERT has proved to be useful for all jobs or projects which have an element of uncertainty in the matter of estimation of duration, as in the case with new types of projects the like of which have never been taken up before
20
CPM- Critical Path Method
• CPM was developed jointly by E.I DuPont Company and Remington Rand Univac Division.
• The aim behind its development was to have a better planning in controlling the overhaul and maintenance of chemical plants.
PERT and CPM both are based on the network representation of activities and their scheduling that determines the most critical activities to be controlled so as to meet the completion date of the project
20
PERT
• Since PERT was developed in connection with an R&D work, therefore it has to cope with the uncertainties which are associated with R&D activities. In PERT, total project duration is regarded as a random variable and therefore associated probabilities are calculated so as to characterize it.
• It is an event-oriented network because in the analysis of network emphasis is given on important stages of completion of task rather than the activities required to be performed to reach to a particular event or task
• A PERT is normally used for projects involving activities of non-repetitive nature in which time estimates are uncertain.
• It helps in pin pointing critical areas in a project so that necessary adjustment can be made to meet the scheduled completion date of the project.
20
Probability Considerations Activity Duration Estimates
• Optimistic time: time to complete an activity if everything goes perfectly well.
• Most likely time: time to complete an activity under normal conditions.
• Pessimistic time: time to complete an activity under adverse circumstances.
• Probability of these three time estimates are not same, rather they assume beta distribution, which is further estimate of normal distribution
211
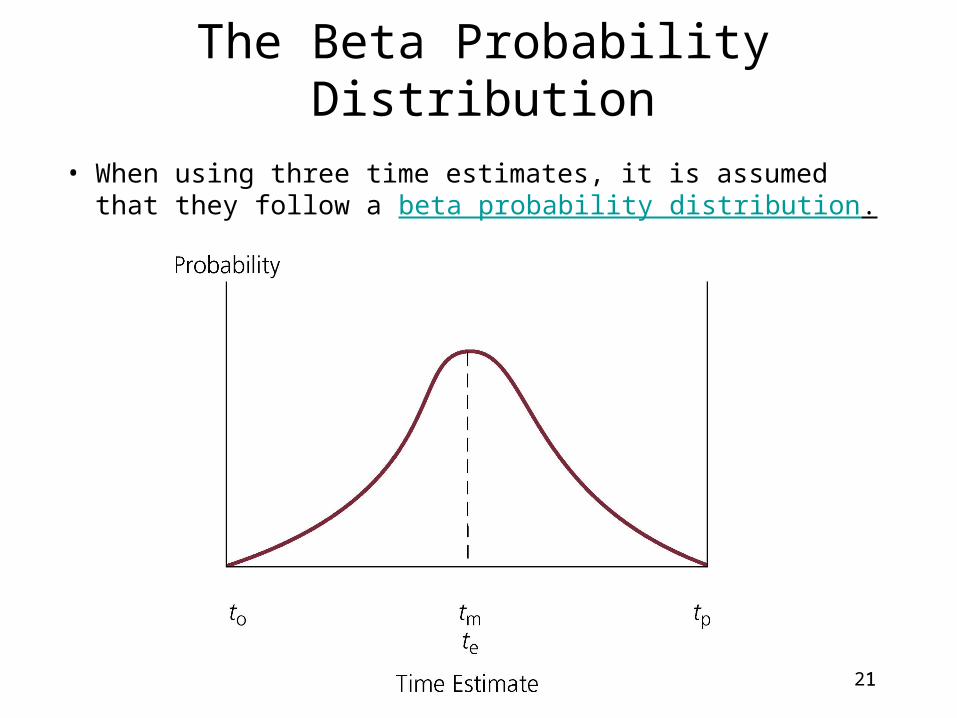
The Beta Probability Distribution
• When using three time estimates, it is assumed that they follow a beta probability distribution.
211
The Beta Probability Distribution
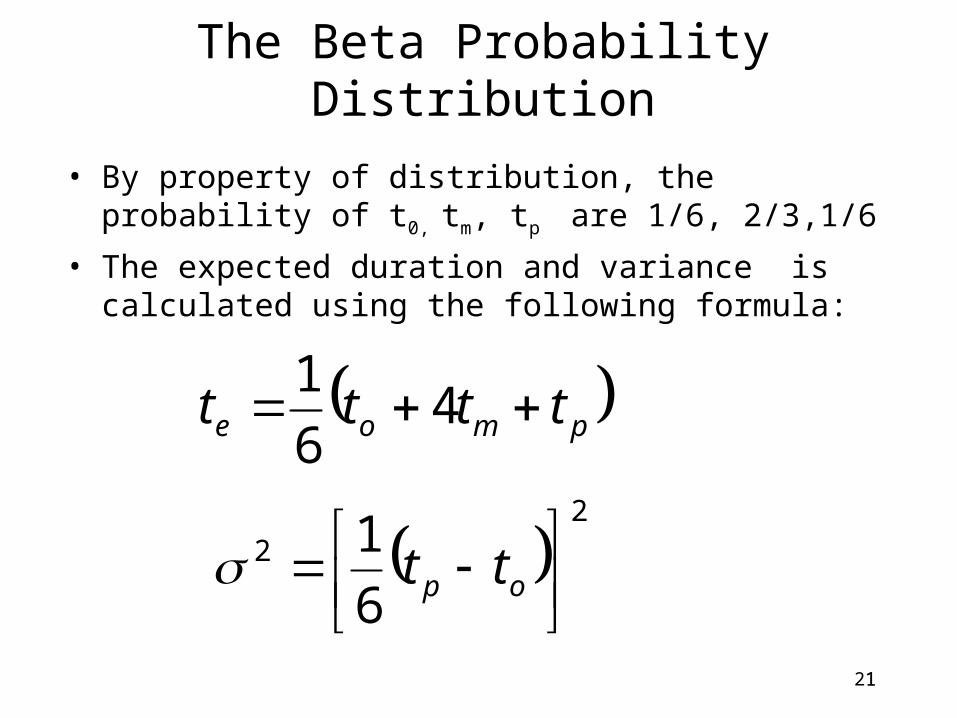
• By property of distribution, the probability of t0, tm, tp are 1/6, 2/3,1/6
• The expected duration and variance is calculated using the following formula:
pmoe tttt 46
1
2
2
6
1
op tt
211
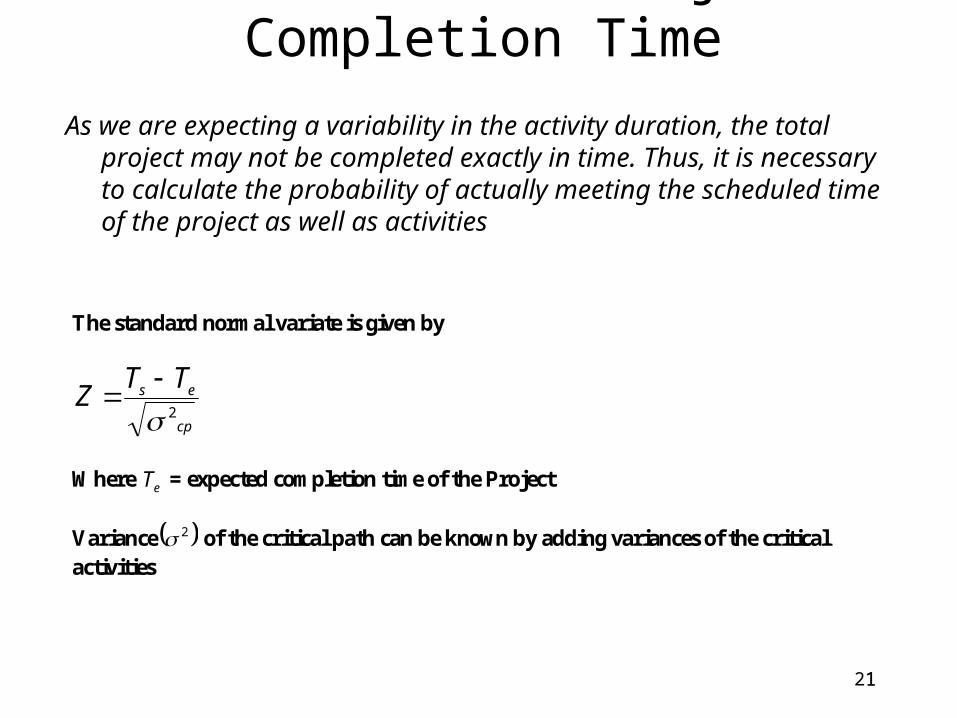
Estimation of Project Completion Time
As we are expecting a variability in the activity duration, the total project may not be completed exactly in time. Thus, it is necessary to calculate the probability of actually meeting the scheduled time of the project as well as activities
The standard normal variate is given by
cp
es TTZ
2
Where eT = expected completion time of the Project
Variance 2 of the critical path can be known by adding variances of the critical activities
22
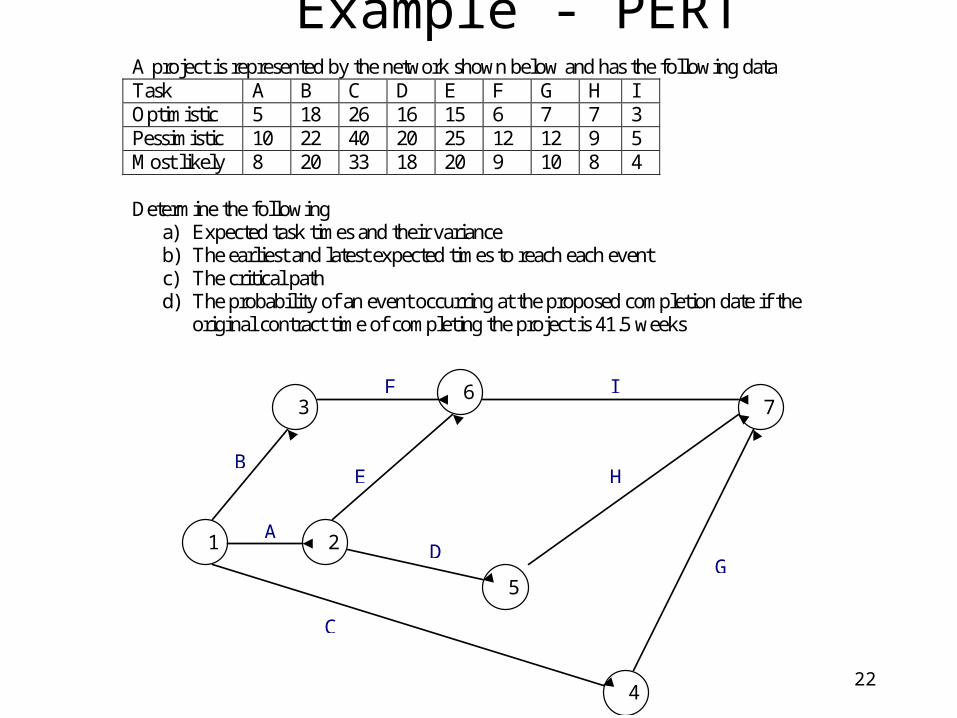
Example - PERTA project is represented by the network shown below and has the following data Task A B C D E F G H I Optimistic 5 18 26 16 15 6 7 7 3 Pessimistic 10 22 40 20 25 12 12 9 5 Most likely 8 20 33 18 20 9 10 8 4 Determine the following
a) Expected task times and their variance b) The earliest and latest expected times to reach each event c) The critical path d) The probability of an event occurring at the proposed completion date if the
original contract time of completing the project is 41.5 weeks
1
3 6
2
5
4
7
E
A
F I
H B
C
D G
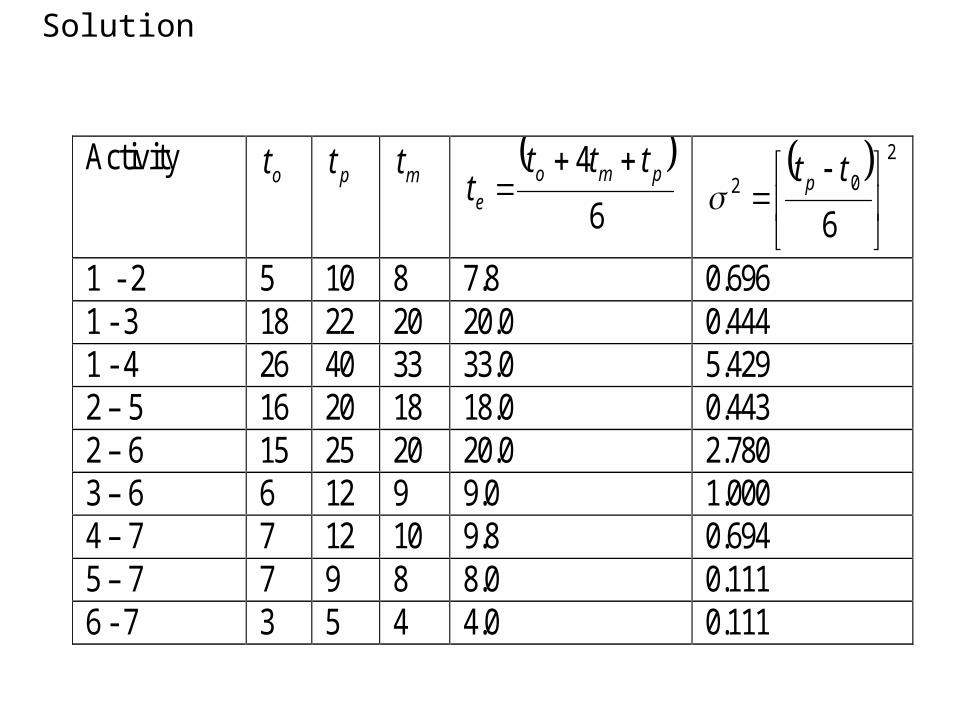
Activity ot pt mt
6
4 pmoe
tttt
2
02
6
tt p
1 - 2 5 10 8 7.8 0.696 1 - 3 18 22 20 20.0 0.444 1 - 4 26 40 33 33.0 5.429 2 – 5 16 20 18 18.0 0.443 2 – 6 15 25 20 20.0 2.780 3 – 6 6 12 9 9.0 1.000 4 – 7 7 12 10 9.8 0.694 5 – 7 7 9 8 8.0 0.111 6 - 7 3 5 4 4.0 0.111
Solution
Solution
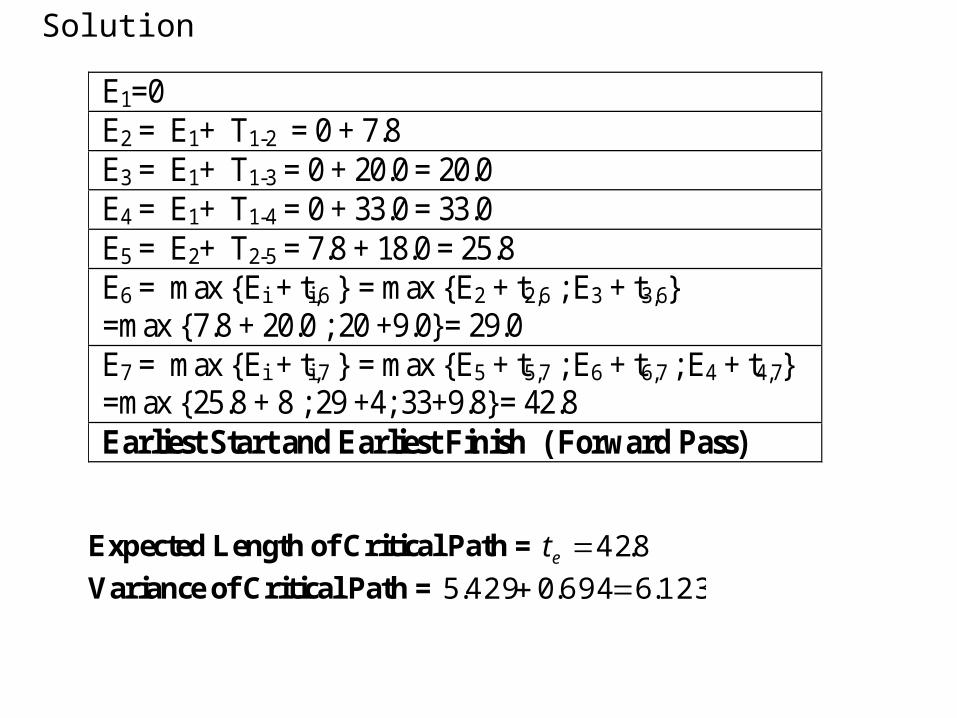
E1=0 E2 = E1+ T1-2 = 0 + 7.8 E3 = E1+ T1-3 = 0 + 20.0 = 20.0 E4 = E1+ T1-4 = 0 + 33.0 = 33.0 E5 = E2+ T2-5 = 7.8 + 18.0 = 25.8 E6 = max {Ei + ti,6 } = max {E2 + t2,6 ; E3 + t3,6} =max {7.8 + 20.0 ; 20 +9.0}= 29.0 E7 = max {Ei + ti,7 } = max {E5 + t5,7 ; E6 + t6,7 ; E4 + t4,7} =max {25.8 + 8 ; 29 +4; 33+9.8}= 42.8 Earliest Start and Earliest Finish ( Forward Pass)
Expected Length of Critical Path = 8.42et
Variance of Critical Path = 123.6694.0429.5
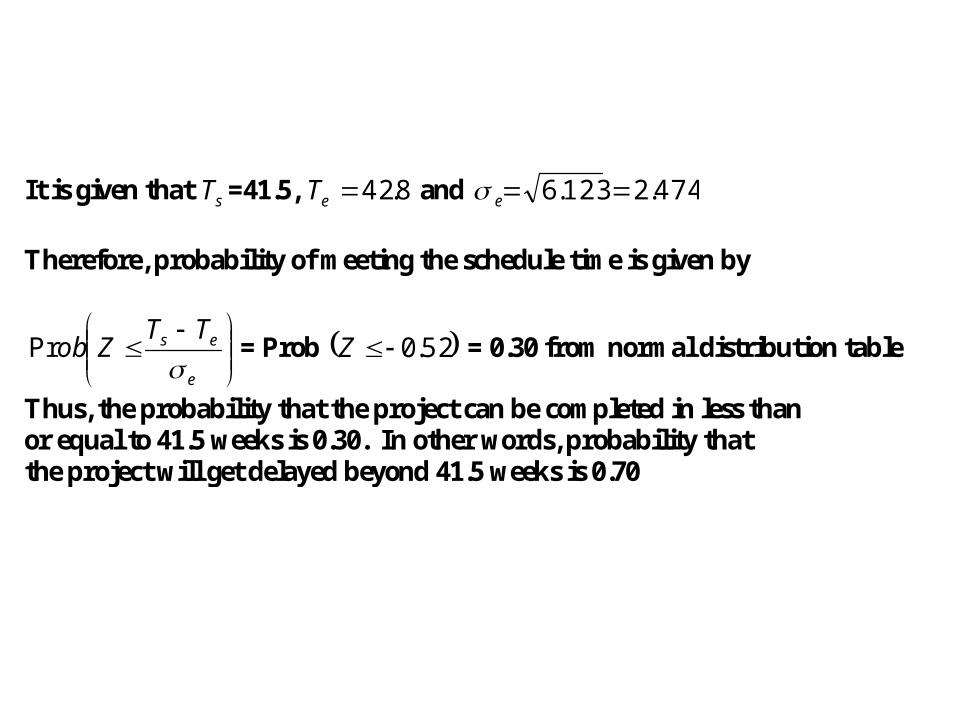
It is given that sT =41.5, 8.42eT and 474.2123.6 e
Therefore, probability of meeting the schedule time is given by
e
es TTZob
Pr = Prob 52.0Z = 0.30 from normal distribution table
Thus, the probability that the project can be completed in less than or equal to 41.5 weeks is 0.30. In other words, probability that the project will get delayed beyond 41.5 weeks is 0.70
Schedule Control
22
Learning Objectives
Perform the steps in the project control process Determine the effects of actual schedule performance
on the project schedule Incorporate project changes into the schedule Calculate an updated project schedule Control the project schedule
Project Control Process
The project control process involves :– Regularly gathering data on project
performance, – Comparing actual performance to planned
performance– Taking corrective actions if actual
performance is behind planned performance

Pro
ject Co
ntro
l Pro
cess
5
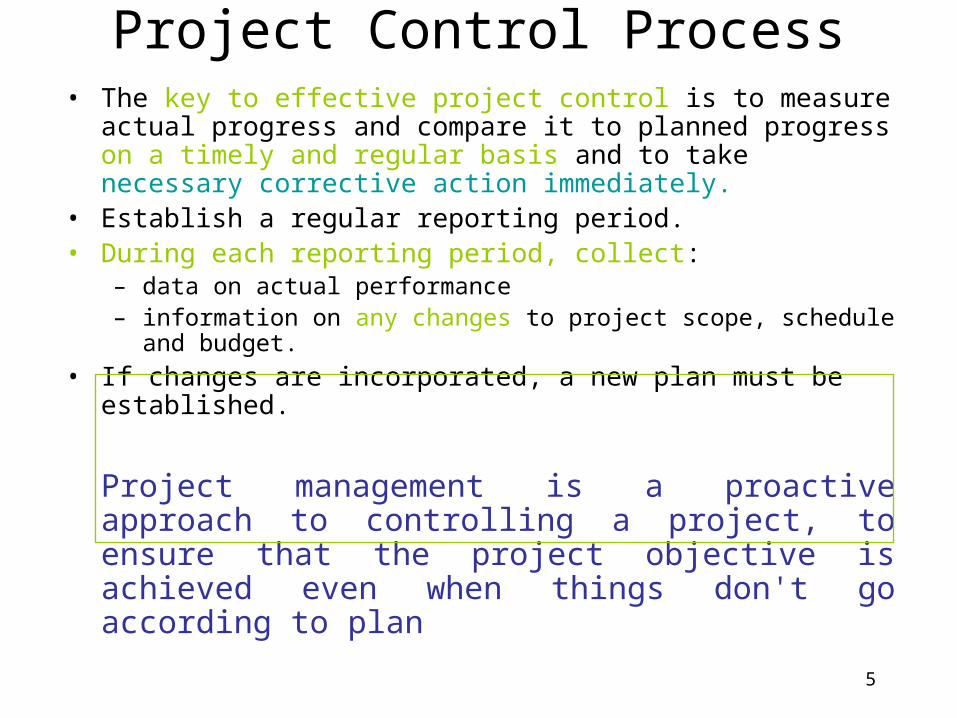
Project Control Process• The key to effective project control is to measure actual progress
and compare it to planned progress on a timely and regular basis and to take necessary corrective action immediately.
• Establish a regular reporting period. • During each reporting period, collect:
– data on actual performance– information on any changes to project scope, schedule and budget.
• If changes are incorporated, a new plan must be established.
Project management is a proactive approach to controlling a project, to ensure that the project objective is achieved even when things don't go according to plan
6
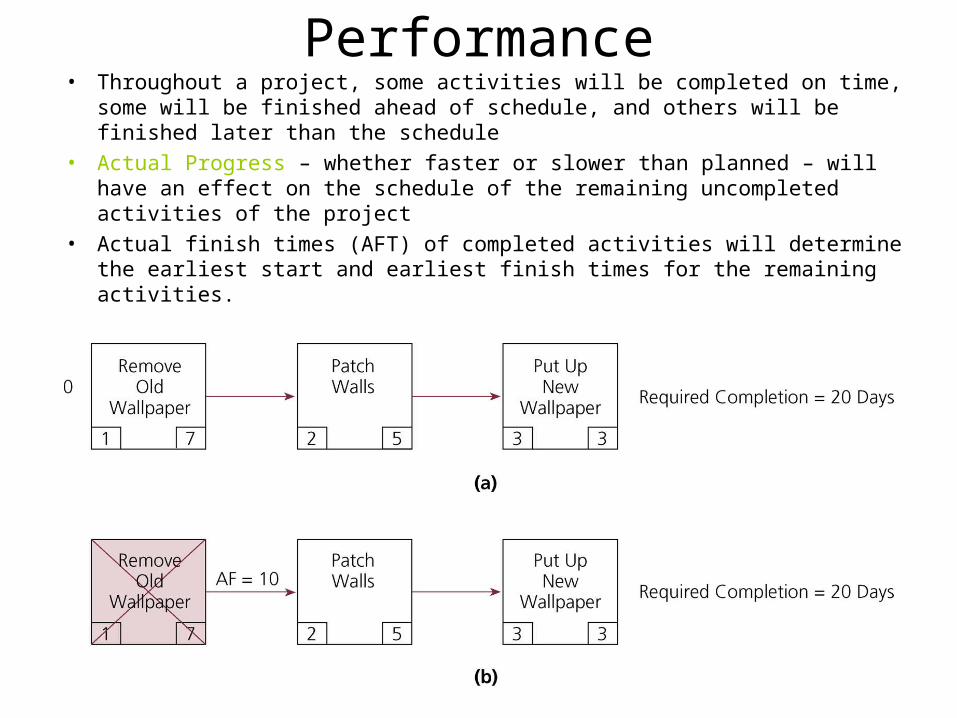
Effects of Actual Schedule Performance
• Throughout a project, some activities will be completed on time, some will be finished ahead of schedule, and others will be finished later than the schedule
• Actual Progress – whether faster or slower than planned – will have an effect on the schedule of the remaining uncompleted activities of the project
• Actual finish times (AFT) of completed activities will determine the earliest start and earliest finish times for the remaining activities.
7
Incorporating Project Changes into the Schedule
• Changes might be initiated by the customer or the project team, or they might be the result of an unanticipated occurrence.
• The degree of impact may depend on when the changes are requested.
• If they’re requested early in the project, they may have less impact on cost and schedule
• When the customer requests a change, additional costs might need to be charged.
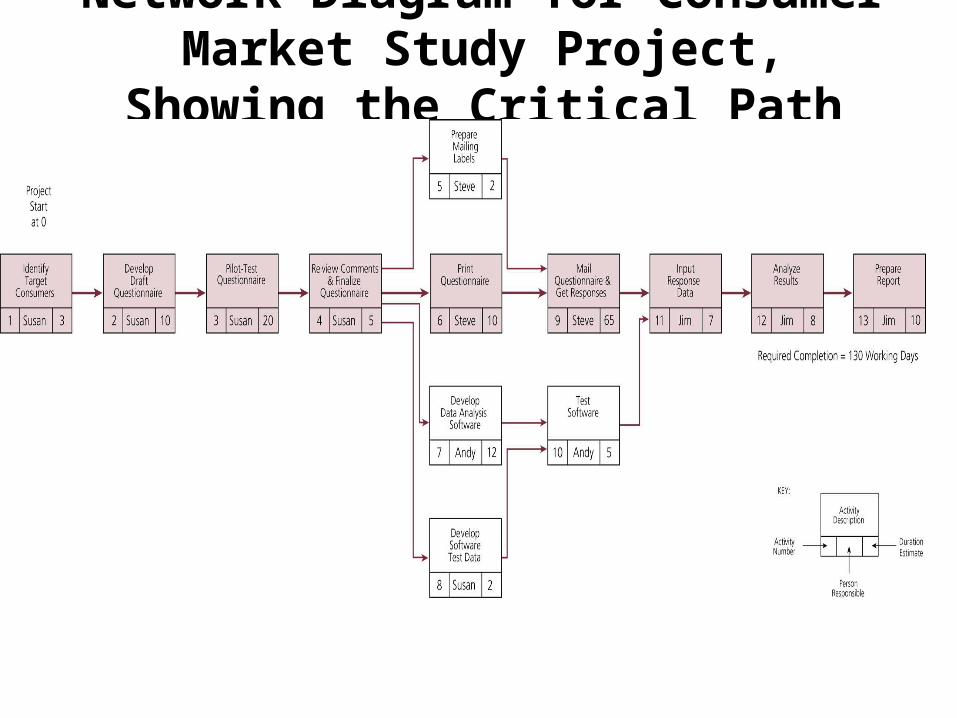
Network Diagram for Consumer Market Study Project,
Showing the Critical Path

Revised Schedule for Consumer Market Study Project
8
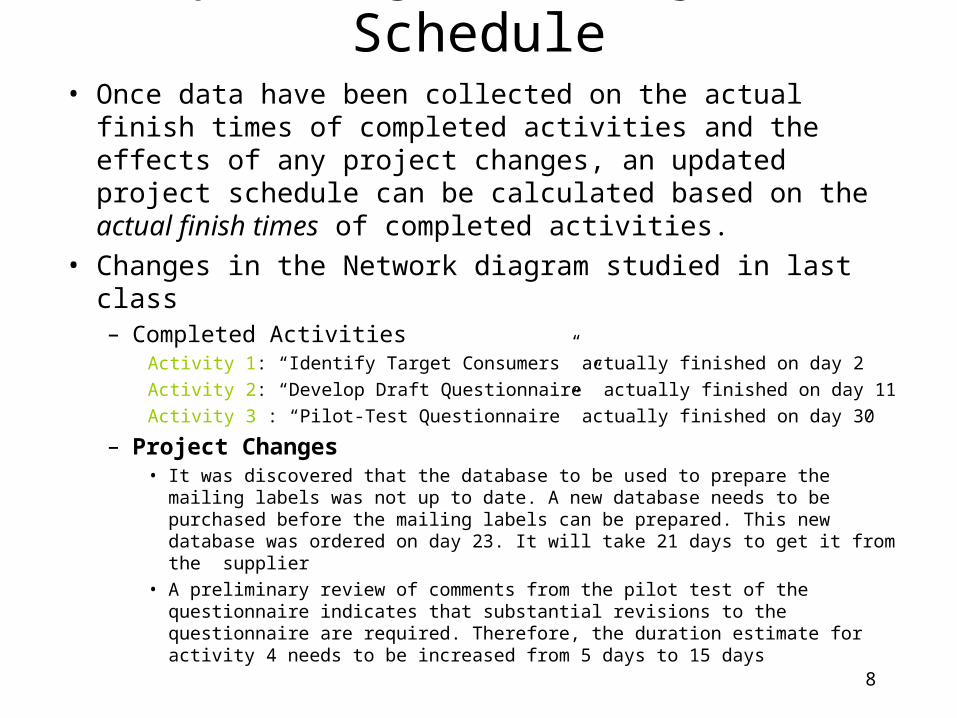
Updating the Project Schedule• Once data have been collected on the actual finish times
of completed activities and the effects of any project changes, an updated project schedule can be calculated based on the actual finish times of completed activities.
• Changes in the Network diagram studied in last class– Completed Activities
Activity 1: “Identify Target Consumers” actually finished on day 2
Activity 2: “Develop Draft Questionnaire” actually finished on day 11
Activity 3 : “Pilot-Test Questionnaire” actually finished on day 30
– Project Changes• It was discovered that the database to be used to prepare the mailing labels
was not up to date. A new database needs to be purchased before the mailing labels can be prepared. This new database was ordered on day 23. It will take 21 days to get it from the supplier
• A preliminary review of comments from the pilot test of the questionnaire indicates that substantial revisions to the questionnaire are required. Therefore, the duration estimate for activity 4 needs to be increased from 5 days to 15 days
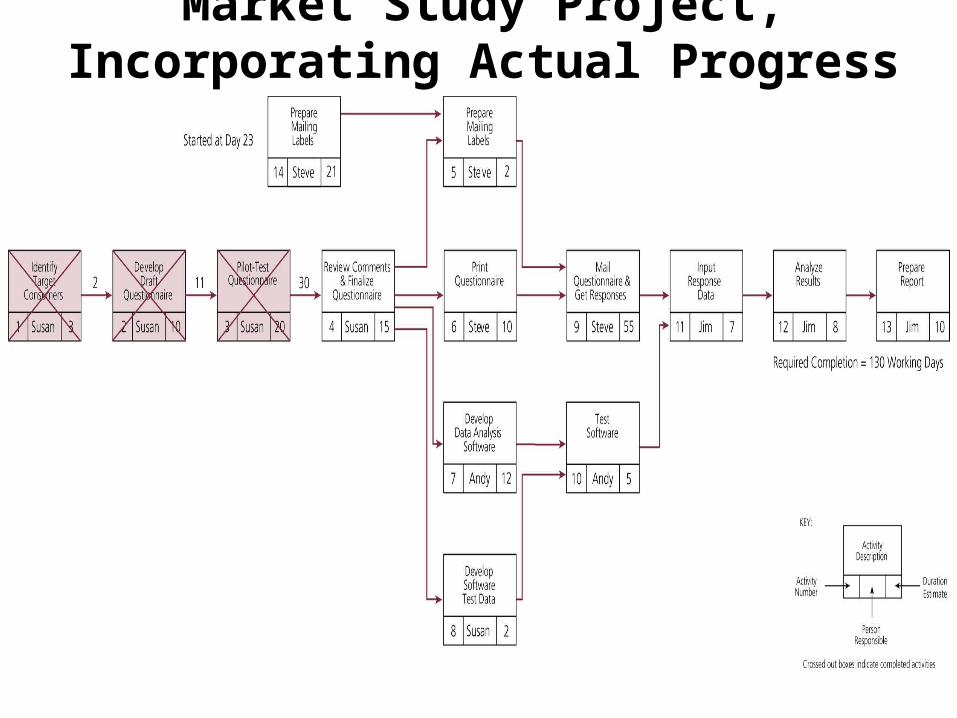
Network Diagram for Consumer Market Study Project, Incorporating
Actual Progress and Changes
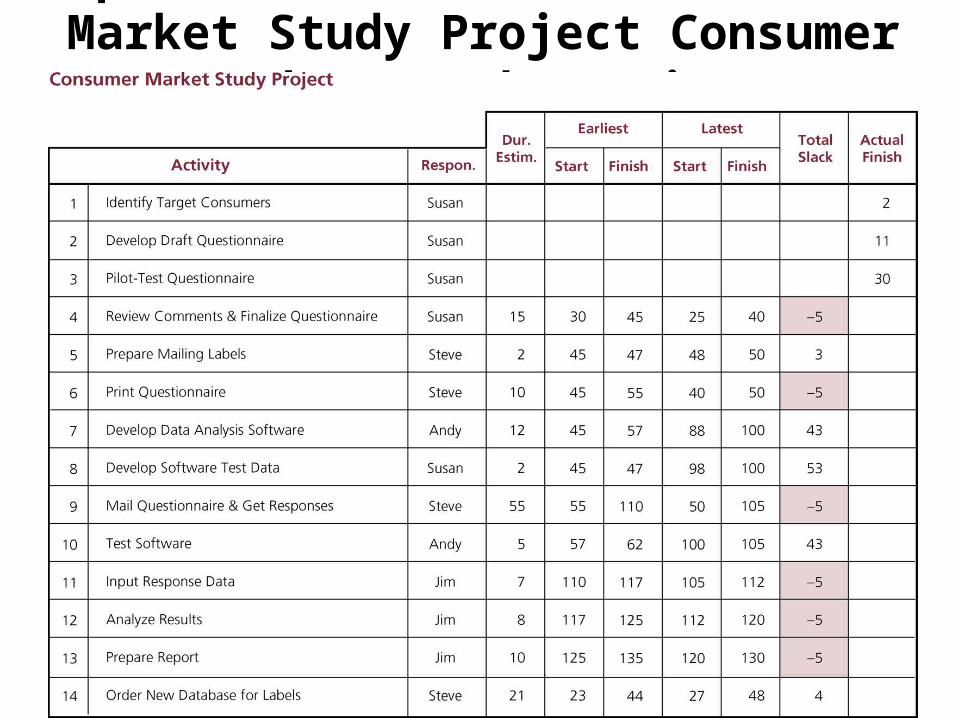
Updated Schedule for Consumer Market Study Project Consumer
Market Study Project
9
Approaches to Schedule Control Four Steps
Schedule control involves four steps:– Analyzing the schedule to determine which areas may need
corrective action– Deciding what specific corrective actions should be taken– Revising the plan to incorporate the chosen corrective actions– Recalculating the schedule to evaluate the effects of the planned
corrective actions
• If the planned corrective actions do not result in an acceptable schedule, these steps need to be repeated

10
Approaches to Schedule Control (Cont.)
• A change in the estimated duration of any activity on that path will cause a corresponding change in the slack for that path.
• When analyzing a path of activities that has negative slack, you should focus on two kinds of activities:– Activities that are near term (that is, in progress or to
be started in the immediate future).– Activities that have long estimated durations
11
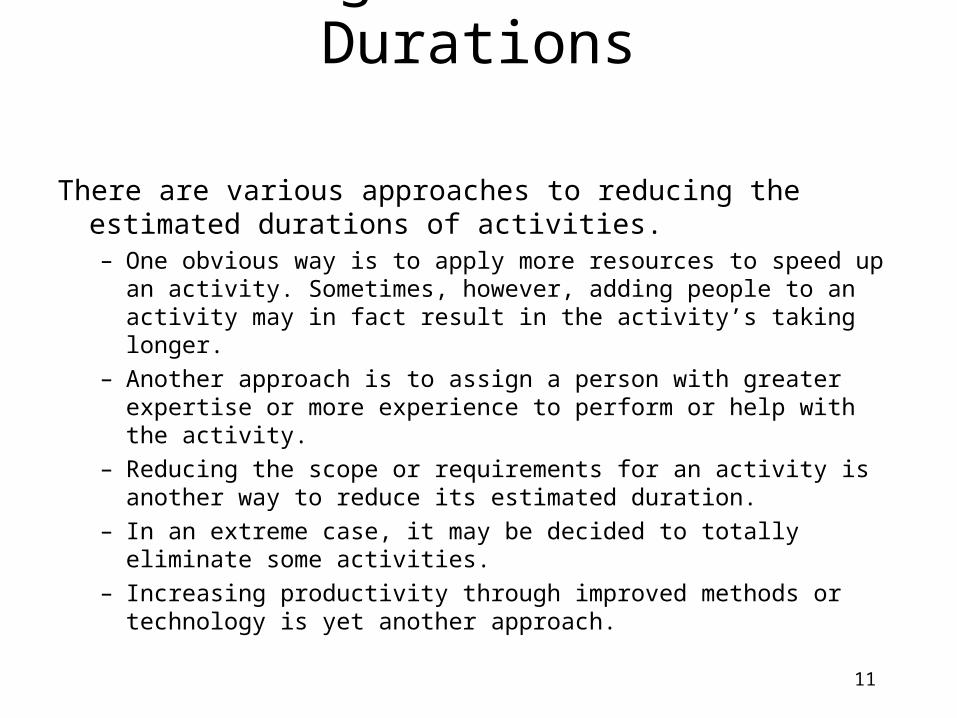
Reducing the Estimated Durations
There are various approaches to reducing the estimated durations of activities. – One obvious way is to apply more resources to speed up an
activity. Sometimes, however, adding people to an activity may in fact result in the activity’s taking longer.
– Another approach is to assign a person with greater expertise or more experience to perform or help with the activity.
– Reducing the scope or requirements for an activity is another way to reduce its estimated duration.
– In an extreme case, it may be decided to totally eliminate some activities.
– Increasing productivity through improved methods or technology is yet another approach.

12
Approaches to Schedule Control (Cont.)
• In most cases, eliminating negative slack by reducing durations of activities will involve a trade-off in the form of an increase in costs or a reduction in scope.
• Some contracts include a bonus provision, whereby the customer will pay the contractor a bonus if the project is completed ahead of schedule.
• Conversely, some contracts include a penalty provision, whereby the customer can reduce final payment to the contractor if the project is not completed on time.
• The key to effective schedule control is to aggressively address any paths with negative or deteriorating slack values as soon as they are identified.
13
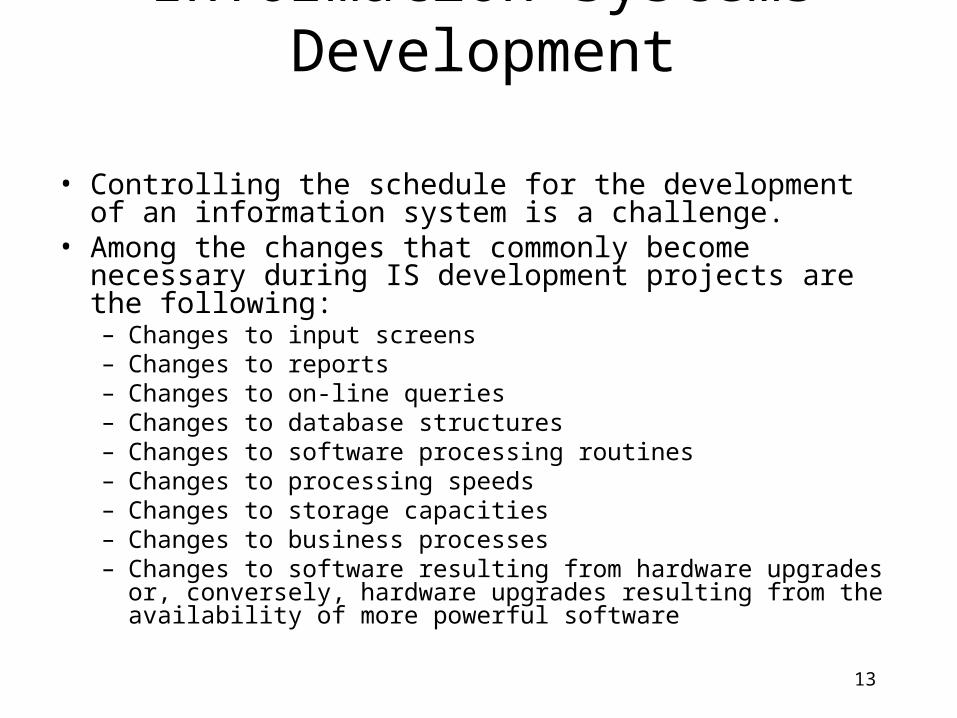
Schedule Control for Information Systems
Development
• Controlling the schedule for the development of an information system is a challenge.
• Among the changes that commonly become necessary during IS development projects are the following:– Changes to input screens– Changes to reports– Changes to on-line queries– Changes to database structures– Changes to software processing routines– Changes to processing speeds– Changes to storage capacities– Changes to business processes– Changes to software resulting from hardware upgrades or,
conversely, hardware upgrades resulting from the availability of more powerful software
14
Project Management Software
• The software allows you to perform various control functions.
• The percent complete for each task can be entered.
• Changes to the duration estimates can be entered.
• The software will automatically revise the project schedule and the corresponding network diagrams.

Resource Considerations

22
Learning Objectives
• Learn how to take resource constraints into account
• Determine the planned resource utilization for a project
• Level the use of resources within the required time frame
• Determine the shortest project schedule with limited resources
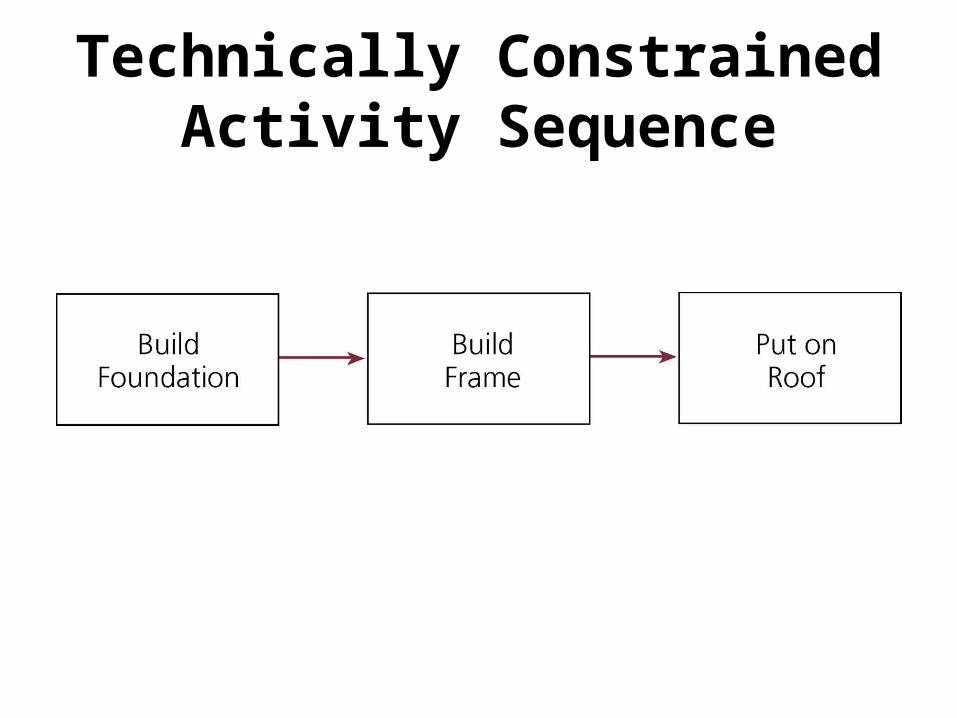
Technically Constrained Activity Sequence
4
Resource-Constrained Planning• Nearly all projects have limits on available
resources.• Project delays often occur due to certain
resources being unavailable. • A network diagram can be drawn to reflect the
availability of a limited number of resources.
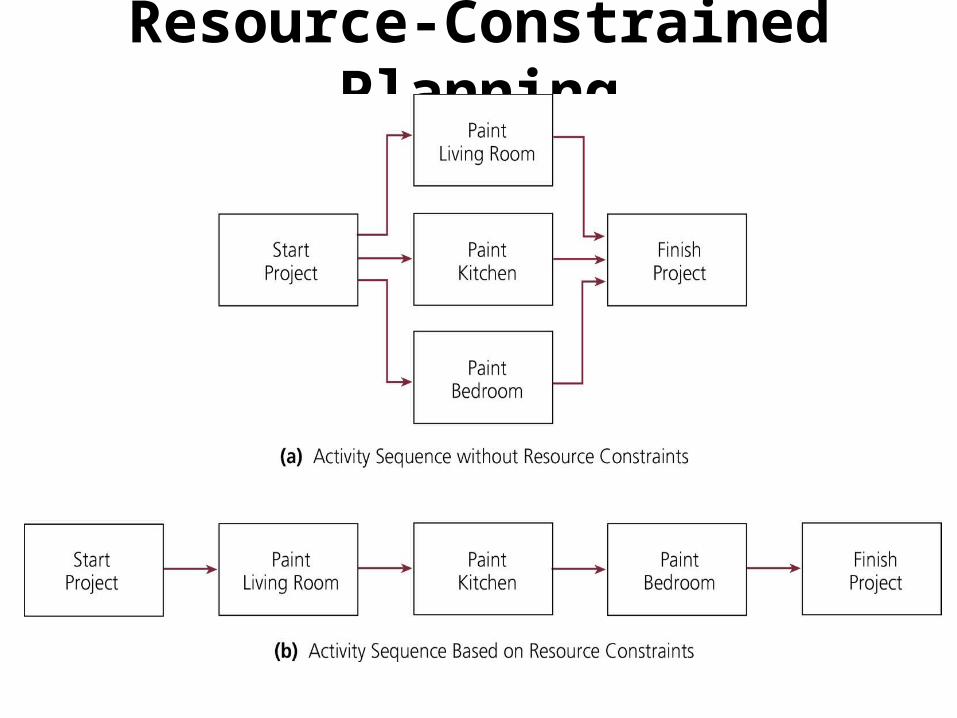
Resource-Constrained Planning
5
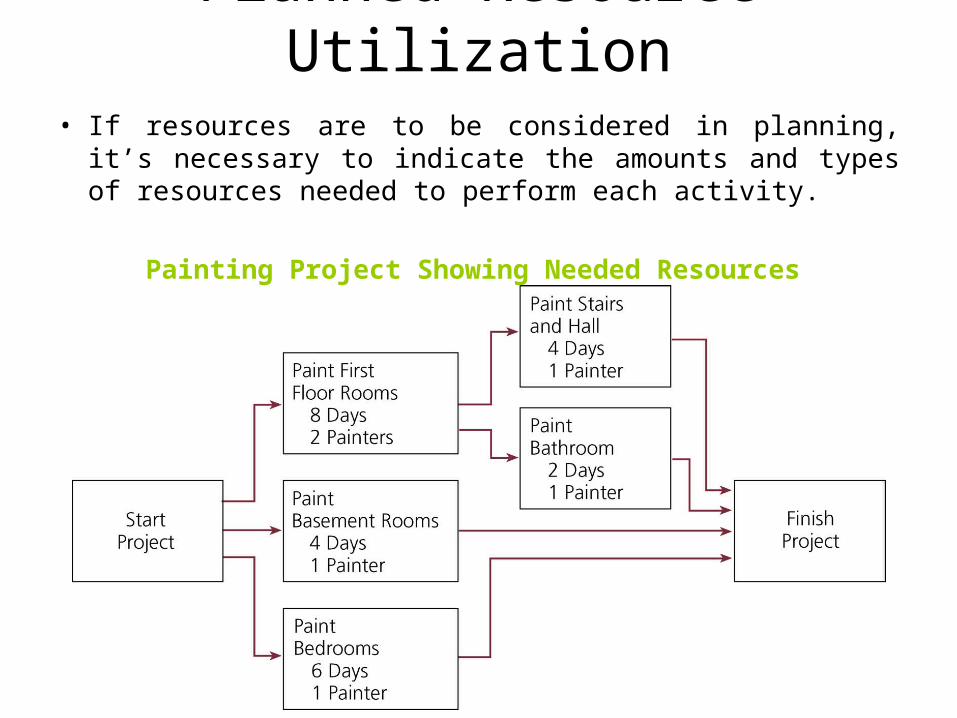
Planned Resource Utilization• If resources are to be considered in planning, it’s
necessary to indicate the amounts and types of resources needed to perform each activity.
Painting Project Showing Needed Resources
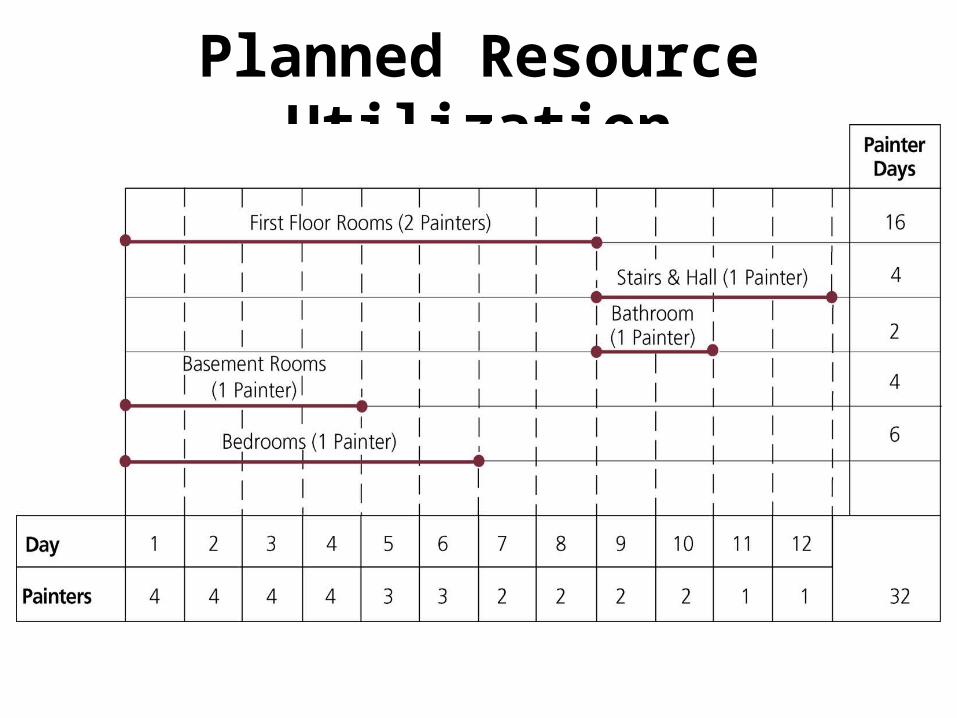
Planned Resource Utilization
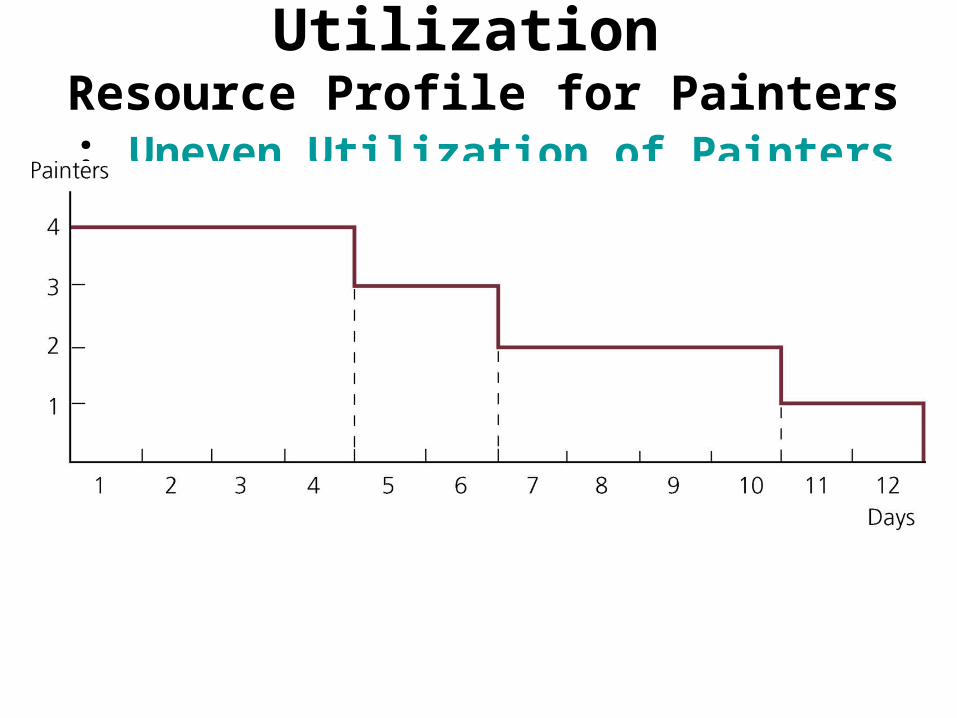
Planned Resource Utilization Resource Profile for Painters :
Uneven Utilization of Painters

5
Planned Resource Utilization
• Sometimes it’s preferable to have a more uniform, or level, application of resources.
• Resource utilization based on each activity’s earliest start time are said to be based on an as-soon-as-possible (ASAP) schedule.
• Resource utilization charts based on each activity’s latest start time are said to be based on an as-late-as-possible (ALAP) schedule.

6
Resource Leveling• Resource leveling, or smoothing, is a method for developing a
schedule that attempts to minimize the fluctuations in requirements for resources.
• This method levels the resources so that they are applied as uniformly as possible without extending the project schedule beyond the required completion time.
• Non critical activities are delayed beyond their earliest start times in order to maintain a uniform level of required resources
• Example : Utilization of PaintersLooking at Figure we can see that “Bathroom” could be delayed up to 2 days, “Basement Rooms” could be delayed up to 8 days, and “Bedrooms” could be delayed up to 6 days—all without extending the project completion time
6
Resource Leveling
Two alternative actions could be taken:– Alternative 1. Delay the activity with the most
positive slack—“Basement Rooms” (+8 days slack)—by 6 days so that it will start after “Bedrooms” is finished.
– Alternative 2. Delay “Bedrooms” so that it will start on day 4, after “Basement Rooms” is completed.
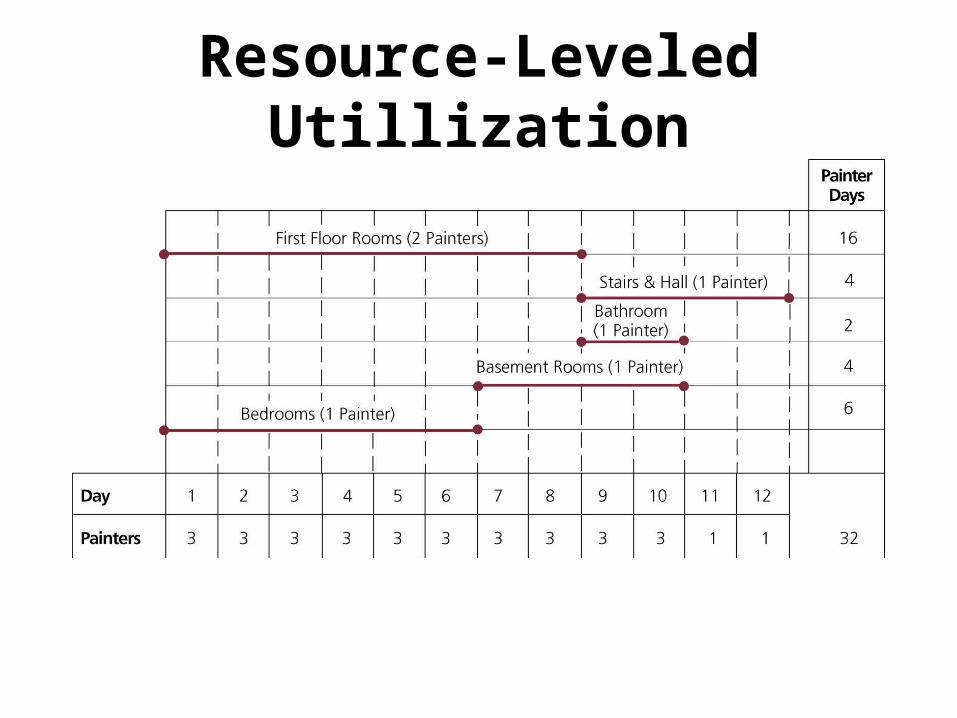
Resource-Leveled Utillization

Resource-Leveled Profile for Painters
7
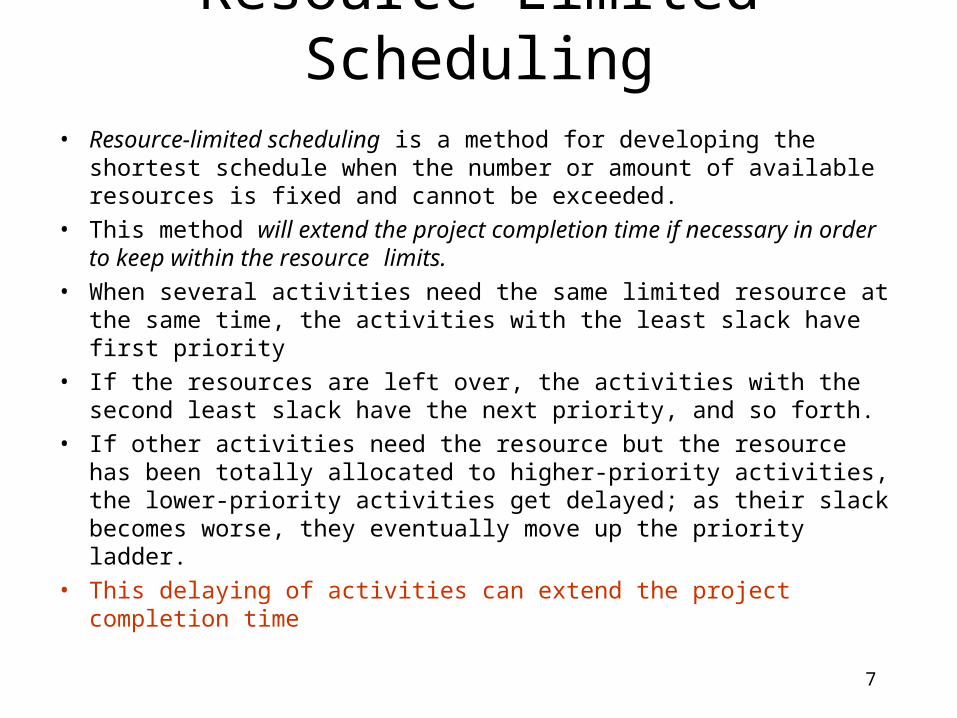
Resource-Limited Scheduling• Resource-limited scheduling is a method for developing the shortest
schedule when the number or amount of available resources is fixed and cannot be exceeded.
• This method will extend the project completion time if necessary in order to keep within the resource limits.
• When several activities need the same limited resource at the same time, the activities with the least slack have first priority
• If the resources are left over, the activities with the second least slack have the next priority, and so forth.
• If other activities need the resource but the resource has been totally allocated to higher-priority activities, the lower-priority activities get delayed; as their slack becomes worse, they eventually move up the priority ladder.
• This delaying of activities can extend the project completion time

Effect of Limited Resource Availability
what would happen if only a limited number of painters—two—were available to do the painting project.
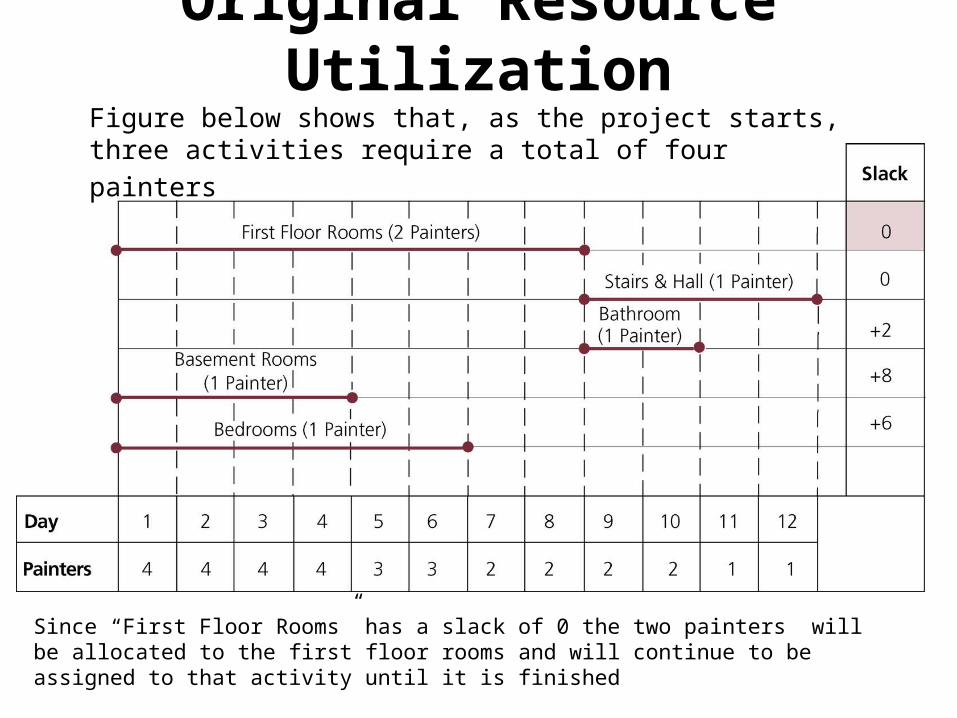
Original Resource UtilizationFigure below shows that, as the project starts, three activities require a total of four painters
Since “First Floor Rooms” has a slack of 0 the two painters will be allocated to the first floor rooms and will continue to be assigned to that activity until it is finished
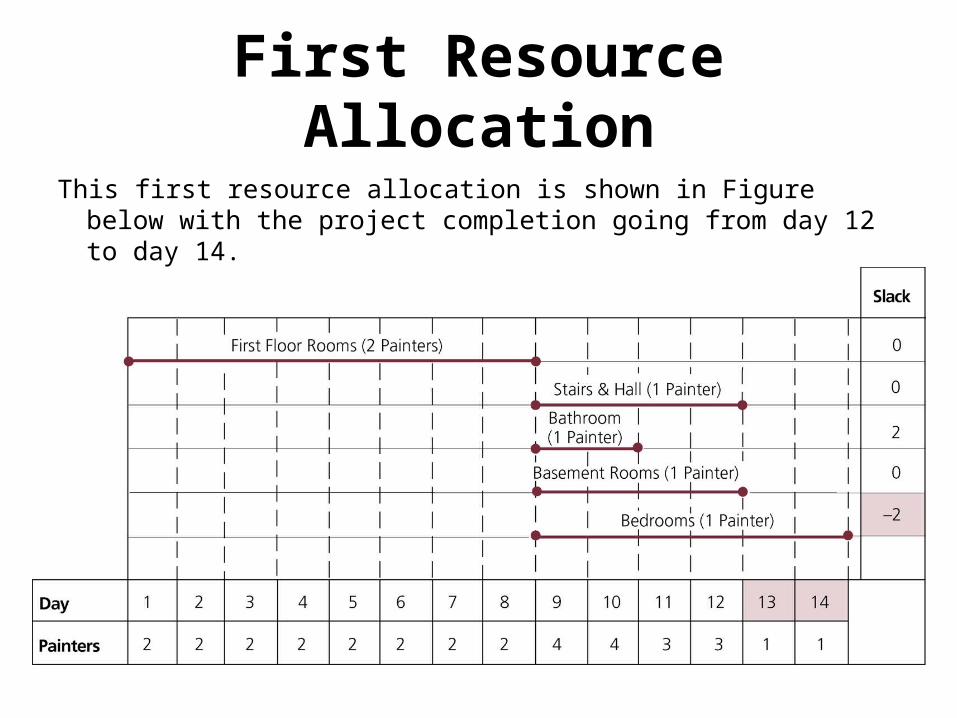
First Resource Allocation
This first resource allocation is shown in Figure below with the project completion going from day 12 to day 14.
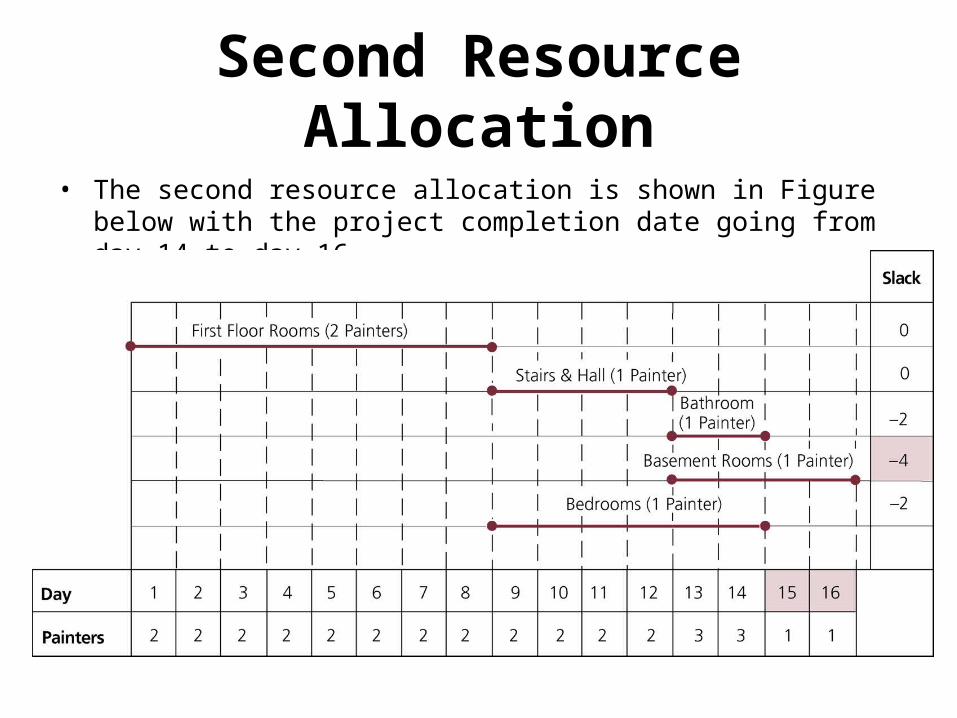
Second Resource Allocation
• The second resource allocation is shown in Figure below with the project completion date going from day 14 to day 16.
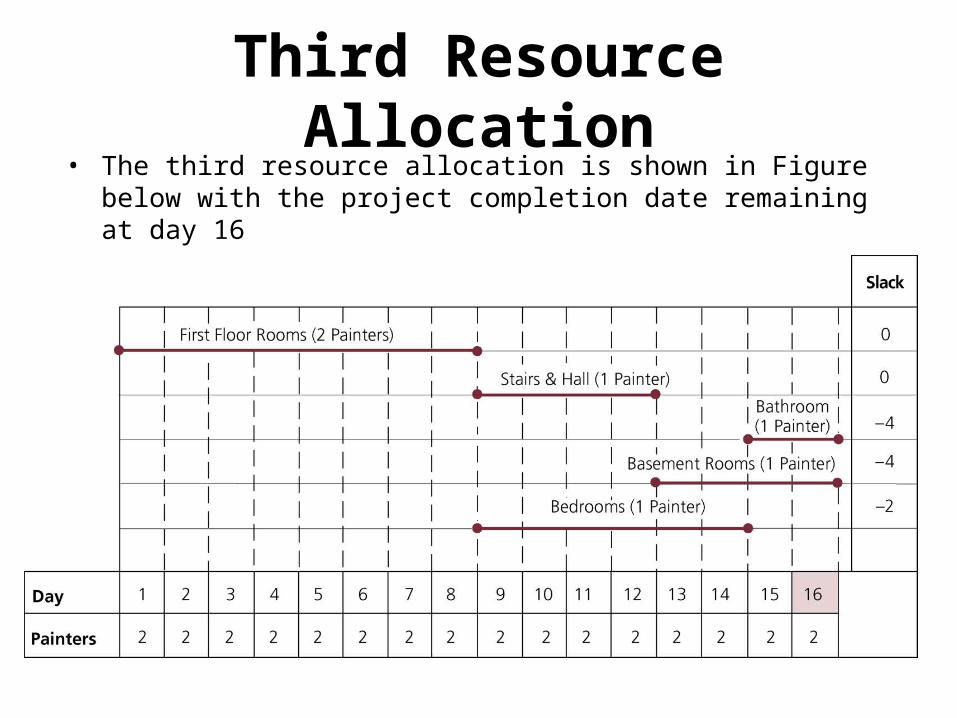
Third Resource Allocation• The third resource allocation is shown in Figure below with the
project completion date remaining at day 16
8
Project Management Software
• Provides excellent features for handling resource considerations within a project.
• Allows you to create and maintain a list of resources.• Resources can be assigned to various tasks within a
project.• The user is informed if any resources have time
conflicts or if they are over-allocated.• Numerous resource allocation reports can be
generated.

![EMH 222 – Fluid Dynamics [Dinamik Bendalir] · 2019. 11. 5. · EMH 222 – Fluid Dynamics [Dinamik Bendalir] Duration : 3 hours [Masa : 3 jam] Please check that this paper contains](https://img.pdfslide.net/doc/110x75/60e5330b1224a937e15bb88b/emh-222-a-fluid-dynamics-dinamik-bendalir-2019-11-5-emh-222-a-fluid-dynamics.jpg)