Embed Size (px)
Citation preview

Omega ∎ (∎∎∎∎) ∎∎∎–∎∎∎
Contents lists available at ScienceDirect
Omega
http://d0305-04
☆Thisn CorrE-m
Pleasequit
journal homepage: www.elsevier.com/locate/omega
Scheduling models for optimal aircraft traffic control at busy airports:Tardiness, priorities, equity and violations considerations$
Marcella Samà, Andrea D’Ariano n, Paolo D’Ariano, Dario PacciarelliUniversità degli Studi Roma Tre, Dipartimento di Ingegneria, via della Vasca Navale, 79, 00146 Rome, Italy
a r t i c l e i n f o
Article history:Received 5 March 2015Accepted 10 April 2016
Keywords:AviationAir traffic optimizationEfficient landing and take-off operationsMicroscopic scheduling modelsMixed integer linear programmingJob shop scheduling
x.doi.org/10.1016/j.omega.2016.04.00383/& 2016 Elsevier Ltd. All rights reserved.
manuscript was processed by Associate Editoesponding author.ail address: [email protected] (A. D’Ari
e cite this article as: Samà M, et al.y and violations considerations. Om
a b s t r a c t
This work addresses the real-time optimization of take-off and landing operations at a busy terminalcontrol area in case of traffic congestion. Terminal areas are becoming the bottleneck of the entire airtraffic control system, in particular in the major European airports, where there is a limited possibility tobuild new infrastructure. The real-time problem of effectively managing aircraft operations is particularlychallenging, since it is necessary to incorporate the safety regulations into the optimization model and toconsider numerous performance indicators that are important to compute good quality solutions.However, in practice there is no well-recognized objective function and traffic controllers often usesimple scheduling rules. In this paper, mixed integer linear programming formulations are proposed toinvestigate the trade-off between various performance indicators of practical interest, while taking intoaccount the safety constraints with a high modeling precision. Experiments are performed for the twomajor Italian airports, Milano Malpensa and Roma Fiumicino, by simulating various sets of randomlanding and take-off aircraft disturbances. Practical-size instances are solved to (near)optimality via acommercial solver. The optimized solutions are also compared with a commonly used scheduling rule. Acomprehensive computational analysis makes possible the selection of those solutions that are able tofind a good compromise among the various indicators and, consequently, the investigation of the mostrepresentative formulation.
& 2016 Elsevier Ltd. All rights reserved.
1. Introduction
The ever growing demand of air transport is increasing thepressure on air traffic controllers, since air traffic in peak hours isgetting closer to the capacity of the Terminal Control Area (TCA), atleast in the major European airports where there is limited pos-sibility of creating new infrastructure. Aviation authorities are thusseeking optimization methods to better use the available infra-structure [4,5,21,27,45]. However, the development and theimplementation of effective optimization methods for suchoperational problems require the consideration of a number ofaspects that are rarely taken into account simultaneously in therelated scheduling theory:
� The optimization model should be able to incorporate alldetailed information that is compliant with the safety regula-tions of the TCA, including information which is not relevant forthe air traffic flow management in large networks with multiple
r B. Kis.
ano).
Scheduling models for optiega (2016), http://dx.doi.org
airports and is therefore neglected in macroscopic models[17,22,48]. In most of the macroscopic models, the character-istics of the airport infrastructure are drastically simplified andthe flight paths are aggregated, so that potential conflictsbetween single aircraft may not be visible, at least at the levelof runways, ground and air segments of the TCA. A potentialconflict occurs whenever aircraft traversing the same resourcedo not respect the minimum required safety distance.
� The time available for developing a new schedule of take-offand landing aircraft in the TCA can be very limited, since acomputerized scheduler should be able to promptly react to anysignificant change occurring during operations.
� To a large extent, air traffic control operations and related issuesare still scheduled by human controllers, who develop feasibleaircraft schedules in the TCA based on their past experience,intuition and some scheduling rules without using any formallydefined performance indicator. Recently, the push from SESARand for CDM compliance [36] is making this less commonthough and airports have at least some automated supportsystems for some of the operations. For example, differentcommercial arrival manager systems are used at various air-ports [42,74]. However, the controllers usually have to fine tunethe arrivals sequencing coming out of the systems themselves at
mal aircraft traffic control at busy airports: Tardiness, priorities,/10.1016/j.omega.2016.04.003i

M. Samà et al. / Omega ∎ (∎∎∎∎) ∎∎∎–∎∎∎2
the moment, since these systems do not usually (fully) take intoaccount the fine details of the aircraft movement required toland in the correct order. Furthermore, we believe that furtherautomated support is required in order to compute alternative(near)optimal ASP solutions and evaluate them in terms of anumber of performance indicators in a short-term. In fact, theexisting arrival manager systems incorporate various perfor-mance indicators that need to be fine tuned across all airports.The lack of a generally recognized performance indicator tooptimize places importance on the definition of acceptableobjective functions. The quality of scheduling aircraft in theTCA typically involves several performance indices reflectingthe interests of the different actors involved in air trafficmanagement, such as the aircraft punctuality, the utilizationlevel of airport resources, the costs incurred by different airlinecompanies in terms of delays, broken flight connections andenergy consumption, and so on. All these indices should betaken into account in the schedule development phase.
This paper addresses the first item by developing mixed integerlinear programming (MILP) formulations, that take into accountthe relevant TCA safety aspects and various performance indica-tors with a high level of detail. As shown in the survey of Bennellet al. [18], the aircraft scheduling literature presents numerousmodels of the independent runway sequencing problem. Thisproblem is modelled as a single machine scheduling problem. Anatural way to model and solve a more accurate and extendedaircraft scheduling problem with interdependent runways and airsegments of the TCA is via job shop scheduling. The latter type ofmodelling approach permits to consider the airspace interactionsbetween aircraft in order to compute better quality aircraft sche-duling solutions in terms of delay management and traffic flowcoordination in the TCA.
The MILP formulations proposed in this paper can be con-sidered as a generalization of existing job shop scheduling modelswith blocking (no-store), no-wait and other additional constraints.These models are known under the name generalized disjunctivegraph or alternative graph. Previous research on those job shopscheduling models has been successfully applied to model andsolve complex benchmark instances on job shop scheduling[39,55–57,62], railway traffic management problems [25,50,52],and air traffic management problems [20,27,28,65,66].
The second item suggests that optimization models with asingle objective function are more suitable than multi-objectiveapproaches, since more efficient tools are available to solve theseproblems. This is also the most common choice in the literature(see, e.g., the reviews in [14,18,24,46,48,61]).
The present paper investigates MILP formulations with singleobjective functions in order to find a good compromise among thedifferent indices listed in the third item. Specifically, we observethat aircraft typically flies at constant speed in the TCA and that atconstant speed the energy consumption is almost proportional tothe flying time. We use the aircraft flow time as a surrogate of theenergy consumption. Also, we adopt makespan-like objectivefunctions in order to minimize the maximum completion time (i.e.the arrival time of the last aircraft), as a common surrogate for thethroughput maximization, or the maximum tardiness (i.e. thelargest aircraft delay). Moreover, we implicitly take into accountthe minimization of broken flight connections by minimizing thenumber of aircraft delayed more than a given threshold. All per-formance indicators can be measured in terms of aircraft arrivaltimes at the entrance of the TCA and at the runways.
The aircraft scheduling problem (ASP), we deal with in thispaper, can be summarized as follows. Given a set of landing/take-off aircraft and for each aircraft its path in the TCA, its currentposition, its scheduled runway occupancy time and the required
Please cite this article as: Samà M, et al. Scheduling models for optiequity and violations considerations. Omega (2016), http://dx.doi.org
time window to accomplish the arriving/departing procedures, theASP is to assign the start time to each aircraft in all the resources itcrosses in its path in such a way that all the potential conflictsituations between aircraft are solved (at a microscopic level) anda suitable objective function is minimized.
This work follows the approach of Bianco et al. [20], based onthe no-wait version of the job shop scheduling problem. However,this paper is based on the alternative graph model introduced byMascis and Pacciarelli [55], that is able to model the ASP with anincreased level of detail. The higher modeling precision includesfurther relevant TCA aspects such as holding circles, waiting inflight before landing, traveling in feasible time windows, hostingmultiple aircraft simultaneously in air segments and individualaircraft simultaneously in runways. Previous works based on thealternative graph model of the ASP have been proposed recently[26–28,65,66]. D'Ariano et al. [26,28] deal with the development ofa branch and bound algorithm for the ASP. D'Ariano et al. [27]extend the ASP to a routing and scheduling problem and solve itwith a tabu search algorithm. Samà et al. [65,66] develop a rollinghorizon approach for the original and extended ASP. However, allthese works deal with the minimization of a makespan-likeobjective function.
The contribution of this work is to generalize the work done onthe ASP modelled via alternative graphs. We investigate micro-scopic MILP formulations of the ASP with different objectivefunctions and examine the differences between the ASP solutionsin terms of various performance indicators. As far as we know, theproposed formulations increase the level of detail regarding themodeling of the constraints in the airspace nearby the TCA com-pared to the existing models, and permit to deal with any kind ofobjective function and constraint. We believe that the investiga-tion of a suitable formulation of the ASP, that takes into accountseveral performance indicators and models the constraints withhigh precision, is still an open problem in the related literature.
A computational study is presented for assessing the practicalapplicability of the proposed formulations. The ASP solutions areanalyzed from the viewpoint of the above described performanceindicators and trade-off between them, while previous researchoften focuses on a single performance indicator, with a myopicview in terms of other possible performance indicators. A proce-dure is proposed to develop a combined formulation with a goodtrade-off performance on several indicators.
The experiments have been carried out on the main Italianairports in terms of passenger flows: Roma Fiumicino (FCO) andMilano Malpensa (MXP). Regarding the air traffic disturbances, 40randomly delayed scenarios are considered for practical-sizeinstances. The resulting problems are solved with a commercialsolver to (near)optimality for each ASP formulation. The optimizedsolutions are also compared with the solutions computed by apractical scheduling rule.
Section 2 reviews the literature most relevant for this work.Section 3 formally describes the modelling of specific ASP con-straints. Section 4 presents the mathematical formulations. Section 5reports the experiments conducted on the FCO and MXP instances.Section 6 summarizes the paper results and outlines future researchdirections. Two appendices illustrate the alternative graph modelingand solving for a numerical ASP example.
2. Literature review
This section briefly reviews recent papers on some aspects ofthe air traffic flow management (ATFM) problem. We presentvarious ATFM literature classifications and discuss our contribu-tion. A more general discussion of the existing literature can befound e.g. in [1,14,18,24,33,46,48,61].
mal aircraft traffic control at busy airports: Tardiness, priorities,/10.1016/j.omega.2016.04.003i

M. Samà et al. / Omega ∎ (∎∎∎∎) ∎∎∎–∎∎∎ 3
A first classification of the ATFM literature is based on thefollowing two basic categories: the traffic control between airports(see e.g. [17,21,22]) and the traffic control in the TCA of an indi-vidual airport (see e.g. [20,26,37,45,51]). For the former category,macroscopic models for large networks with multiple airports andaggregated flight paths are often adopted. For the latter category,microscopic models are proposed with identification and resolu-tion of potential aircraft conflicts at the level of ground and airresources. This paper deals with the development of microscopicmodels for the resolution of potential conflicts in the TCA.
A second classification is based on the type of information.When dealing with static information (see e.g. [26,28,34,63]), theposition and the speed of all aircraft are known in the trafficprediction. The case with dynamic information (see e.g.[15,43,65,75]) requires the computation of an aircraft scheduleevery time a new incoming aircraft is known. This paper studies anASP based on static information, since all the data are knownbefore the optimizer starts the computation of the ASP solution.However, this approach can be inserted in a dynamic system thatiteratively solves an ASP problem with static information (see e.g.[65,66]).
A third classification is based on the algorithmic approaches.Among the heuristic approaches, fast heuristics are proposed in[27,28,34,60]. Exact procedures can be found in [26,28,34,35]. Thispaper does not focus on the investigation of new ASP algorithmicapproaches or mathematical properties. We are interested in thecomparison of (near)optimal ASP solutions in terms of severalperformance indicators. In order to compute a (near)optimalsolution for each performance indicator, we use a specific MILPformulation and a general MILP solver.
We now present a detailed review of some literature mostrelated to our work, with specific reference to the different choiceof the objective functions and constraints in the formulations. Weorganize the discussion based on the type of problem studied.
Allahverdi et al. [3] and Ball et al. [11] present a detailedpanoramic of different solving approaches and objective functionsused in the aircraft scheduling literature. In particular, the mainobjective functions discussed are the minimization of delays andcosts. In fact, the costs are often calculated based on the deviationfrom the nominal schedule, i.e., in terms of aircraft delays.
In the arrival scheduling literature, Hu et al. [43] minimize thesum of the difference between the predicted and the allocatedlanding times of each aircraft. Eun et al. [35] try to limit the aircraftdelays and the deviation from the estimated arrival time, by takinginto account airline preferences. Ernst et al. [34] measure the costassociated with the deviation from the preferred aircraft landingtime. Beasley et al. [15,16] study an aircraft displacement problemand consider the cost of a solution adjustment procedure where, ifan aircraft is further delayed with respect to an initial solution, anadditional penalty has to be paid. Sölveling et al. [73], instead,include in the cost function the environmental impact, in terms offuel and CO2 emissions, when there are deviations from thenominal schedule. Soomer and Franx [72] combine cost functionsdeclared by the airlines for each aircraft typology and rescalethem, making the resulting solution fair.
Artiouchine et al. [6] assign landing times to aircraft for a singlerunway by minimizing the use of holding patterns or by max-imizing the minimum time elapsed between two consecutivelandings. Hu and Di Paolo [44] also consider two objective func-tions: the minimization of the total airborne delay of all aircraftand the maximum length of all arrival queues. The first objectivefunction emphasizes the operating cost of airlines, while the sec-ond objective function focuses more on the efficiency of usingairport capacity. Sabar and Kendall [64] minimize the total landingdeviations from a desired landing time.
Please cite this article as: Samà M, et al. Scheduling models for optiequity and violations considerations. Omega (2016), http://dx.doi.org
Other works on the landing and runway scheduling problemsaim to maximize the use of airport capacity (i.e., the throughput).Bianco et al. [19,20] adopt the minimization of the maximumcompletion time for the throughput maximization, as previouslydescribed in Psaraftis [63]. Balakrishnan and Chandran [10] alsoadopted this objective function and discussed its practical impor-tance in order to manage runway sequencing problems at major U.S.A. airports. Furthermore, they compare it with the minimizationof the maximum aircraft delay and of the sum of aircraft delays.
In the departure scheduling literature, Marin [54] models thetaxi planning problem as a multicommodity flow network pro-blem with link capacities and minimizes total routing time for allthe flights. Atkin et al. [7] focus on the development of an auto-mated advisory system to help the runway controller to increasethe throughput of the departure runway and to reduce the aircraftdelay without negatively affecting safety and other feasibilityconstraints on the aircraft reordering. A weighted sum of delay,penalty and cost factors is minimized. The various factors in theobjective function have an ordered degree of importance. Atkinet al. [8] present an improved automated advisory system in whichfurther aspects of the take-off runway scheduling problem aretaken into account, including a consideration of taxiway capacitycongestion and some measure of the equity of delay. Atkin et al.[9] propose another objective function based on the minimizationof a weighted sum of aircraft delays, equity of delay (division ofthe delay between aircraft), and take-off time re-negotiations.Clare and Richards [23] minimize a weighted combination of thetotal taxi time, the largest taxi time and the total taxi distance for acombined taxi and runway scheduling problem.
Another stream of research focuses on the development of aground delay program. Kotynek and Richetta [47] define the mainobjective of a ground delay program as delaying aircraft beforethey depart from their origin airports, in case of a reduced landingcapacity at the airport of destination. Several authors address theminimization of a weighted combination of ground delays andequity measures [12,13,38,47,58]. A common equity considerationis to generate tactical aircraft schedules via a first scheduled, firstserved rule, since the inequity is often measured as a deviationfrom an ideal (equitable) schedule. A more complex definition ofthe goal of a ground delay program is proposed in other works[49,53], including considerations of airline fuel costs, air trafficcontroller workloads, and passenger comfort, safety and equity.
We next discuss further multi-objective approaches for coor-dinating ATFM decisions. Sherali et al. [69] introduce an MILPformulation to generate flight-plans that satisfy various equity,workload, and safety considerations under different airspace sce-narios. The considerations of the performance indicators areimplemented via the addition of specific constraints and objectivefunction components. In particular, they define equity measuresthat minimize the spread as well as the maximum measure ofeffectiveness over the airline carriers. Sherali et al. [70] present adefinition of equity that takes better account of the distribution ofindividual airline schedule costs. Sherali et al. [71] perform sen-sitivity analysis of various scenarios and model parameters,including a study of the different weights of the objective function.Sherali et al. [68] minimize another weighted objective functionwith consideration of total system fuel, delay, and cancellationcosts. Different equity considerations are introduced based on fueland delay costs. Grushka-Cockayne et al. [40] present a multi-stakeholder, multicriteria decision-making framework for Euro-control in order to maximize an overall performance score,weighted by the stakeholders' importance weights. Andreattaet al. [5] study the trade-off between airborne holding delay andground delay. Their objective function is the minimization of aweighted sum of the number of flights with an airborne holding orground delay. Aktürk et al. [2] propose a conic quadratic
mal aircraft traffic control at busy airports: Tardiness, priorities,/10.1016/j.omega.2016.04.003i

M. Samà et al. / Omega ∎ (∎∎∎∎) ∎∎∎–∎∎∎4
optimization approach to solve an aircraft recovery problem withminimization of the fuel consumption and the aircraft delay.
Most of the literature is based on a simplified model of the TCA.We believe that this paper is a step forward in the definition of aflexible microscopic formulation for the ASP in the TCA, that isable to take into account different performance indicators, eitherin the objective function or in the set of constraints. Our work iscomplementary to the work done in the departure/take-offsequencing literature. We use a detailed modeling of inter-aircraftseparation rules for arrival and departure aircraft. However, ourwork does not deal with the detailed management of groundmovements. Our contribution is the coordinated management ofthe runways and the air segments of TCA. Specifically, our work isnot the classical departure and take-off sequencing problem thatusually schedules aircraft in independent runways, and thus canbe viewed as a set of single machine scheduling problems. We dealwith a problem with interdependent runways and air segments ofthe TCA. As reported in the existing literature (see e.g. the surveypaper [18]), the problem studied in this paper can be viewed as ajob shop scheduling problem, that is by far more complex than theindependent runway scheduling problem.
We think that the traffic controllers should be informed of theexistence of alternative ASP solutions in real-time and of thepotential impact generated by implementing each ASP solution interms of a number of relevant performance indicators. To this end,this paper studies some of the above discussed indices and theircombinations. We evaluate them with special emphasis on extentof the impact of each specific indicator on the others. The eva-luation is performed on MILP formulations based on the alter-native graph model of [55], originally developed for a makespan-like objective function. In fact, previous works dealing with thealternative graph model of the ASP (see e.g. [26–28,65,66]) arefocused on the minimization of the maximum consecutive delay ina busy TCA (i.e. the minimization of the largest delay caused by theresolution of potential conflicts between aircraft traveling in abusy TCA during a given time horizon of traffic optimization). Inthis work, we generalize the alternative graph model of the ASP, inorder to deal with any kind of performance indicator. Practical-sizeinstances are solved by an MILP solver to (near)optimality.
3. Problem description
In the TCA, landing (arriving) aircraft move from an air entrypoint of the TCA to a runway via landing air segments, following astandard descent profile, while maintaining a minimum safetydistance between every pair of consecutive aircraft, depending ontheir type and position (at the same or different altitude). Finalapproach spacing tools can be of support for the computation offeasible sequencing, moving and spacing of landing aircraft in theTCA [31].
Similarly, take-off (departing) aircraft leave the runway flyingtoward the assigned exit point via take-off air segments along astandard ascent profile, still respecting the minimum safety dis-tance (safety separation). The space distance can be translated intoa time distance, setup time, by taking into account the differentaircraft speeds. Setup times are considered sequence-dependent,since the minimum distance between different aircraft categories(heavy, medium, light and others) depends on the relative pro-cessing order of the common resources. For instance, the distancebetween heavy and light aircraft is much larger when light aircraftfollows heavy aircraft than vice versa. Setup times do not onlydepend on the aircraft times but also on the route chosen for eachaircraft.
Each aircraft has an assigned entry time into the TCA, which isthe minimum time, release time, the landing/take-off procedure
Please cite this article as: Samà M, et al. Scheduling models for optiequity and violations considerations. Omega (2016), http://dx.doi.org
can start according to the current aircraft position and speed. Eachaircraft has scheduled times, due date times, to start processingsome TCA resources. Eventually, aircraft can also have a maximumtime, deadline time, to start processing some TCA resources.
The runway is a blocking (no-store) resource [41] since it canonly be occupied by one aircraft at a time, while the air segment isan uncapacitated resource since several aircraft can occupy it atthe same time provided that the required safety separations aresatisfied. Each aircraft has a processing time on each runway sandon the air segments before or after it, according to its landing/take-off profile. On the air segments, the processing time variesbetween a pre-defined time window, due to a limited possibility ofaircraft speed changes.
Once an arriving aircraft enters the TCA, it should proceed tothe runway. However, before entering the airport area, airborneholding time can be used to make aircraft waiting in flight untilthey can be guided through their landing procedure, that meansflying in circles in specific areas named holding circles. On entry toa holding circle, the aircraft must fly at a fixed speed for a numberof half circles, as prescribed by the air traffic controller. We assumethat there are no aircraft sequencing decisions in the holding cir-cle. Therefore, the aircraft can exit in a different order they enter inthe holding circle and each holding circle resource isuncapacitated.
Departing aircraft can be delayed in entering the TCA at groundlevel, i.e. before entering the runway. A departing aircraft is sup-posed to take-off within its assigned time window and is latewhenever it is not able to accomplish the departing procedurewithin its assigned time window. Following the procedure com-monly adopted by air traffic controllers, we consider a time win-dow for take-off between 5 min before and 10 min after theScheduled Take-off Time (STT). A departing aircraft is considereddelayed in exiting the TCA if leaving the runway after 10 min fromits STT. We assume that all take-off aircraft have a take-off timewindow with the same tolerance. Arriving aircraft are late iflanding after their Scheduled Landing Time (SLT).
We use the following notation for the aircraft delays. Entrancedelay is the delay of a landing/take-off aircraft on entry to the TCA.Total exit delay is the delay of a landing/take-off aircraft at theentrance in the runway/take-off air segment resource. The lattervalue is partly a consequence of a possible late entrance, whichcauses an unavoidable delay at the runway/take-off air segment,and partly due to additional delays caused by the resolution ofpotential aircraft conflicts in the TCA, which is named consecutivedelay [25–27].
A landing aircraft can have a consecutive delay at the entranceresource, if it is delayed in entering the TCA due to other aircraftscheduled on its entrance landing air segment. Landing and take-off aircraft can have a consecutive delay on a runway, if they haveto give precedence to other aircraft in one or more TCA resources.These consecutive delays will be used to formulate the objectivefunctions considered in this work.
3.1. Performance indicators
The typical objectives of any real-time scheduling practitionerare (i) to find a good schedule in the short-term while (ii) trying toavoid negative long-term effects of the rescheduling decisions. Inthe air traffic environment under study, these needs correspond toschedule arrivals and departures with the aim of (i) reducingshort-term delays and (ii) trying to recover the off-line plan ofarrivals-departures as quickly as possible, in order to reduce long-term propagation of perturbations.
In this paper, the minimization of the maximum tardiness takesinto account the first goal, while the minimization of the max-imum completion time is a surrogate for the second goal. In
mal aircraft traffic control at busy airports: Tardiness, priorities,/10.1016/j.omega.2016.04.003i
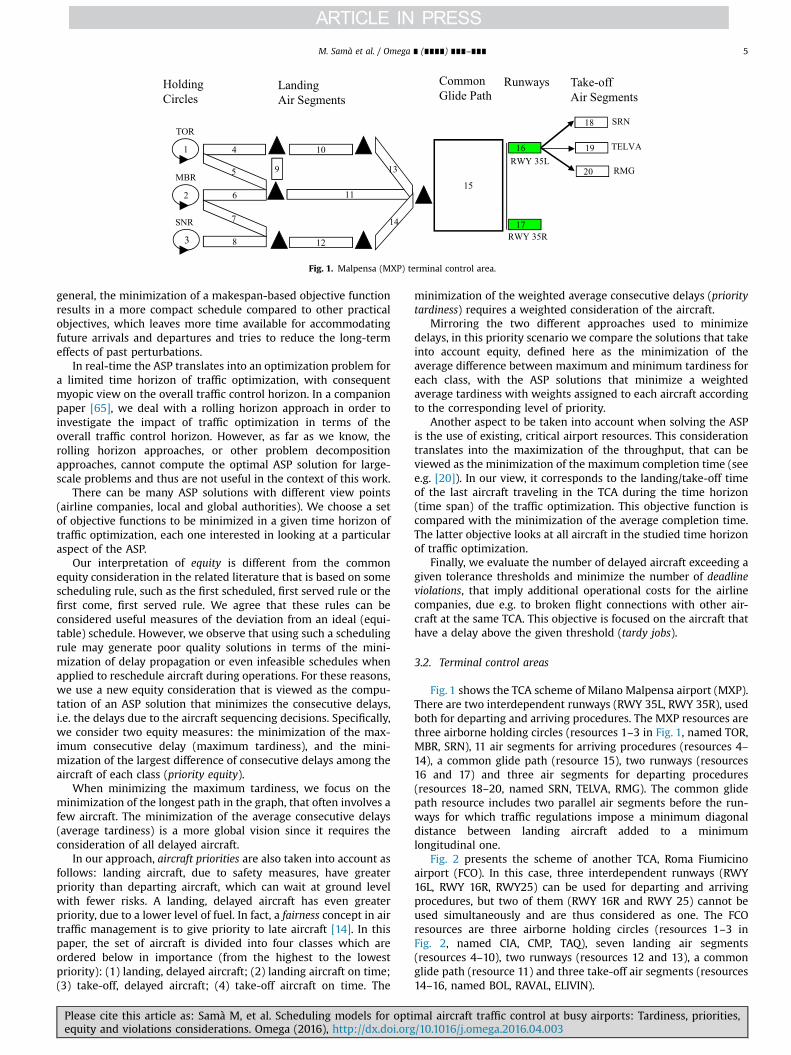
Fig. 1. Malpensa (MXP) terminal control area.
M. Samà et al. / Omega ∎ (∎∎∎∎) ∎∎∎–∎∎∎ 5
general, the minimization of a makespan-based objective functionresults in a more compact schedule compared to other practicalobjectives, which leaves more time available for accommodatingfuture arrivals and departures and tries to reduce the long-termeffects of past perturbations.
In real-time the ASP translates into an optimization problem fora limited time horizon of traffic optimization, with consequentmyopic view on the overall traffic control horizon. In a companionpaper [65], we deal with a rolling horizon approach in order toinvestigate the impact of traffic optimization in terms of theoverall traffic control horizon. However, as far as we know, therolling horizon approaches, or other problem decompositionapproaches, cannot compute the optimal ASP solution for large-scale problems and thus are not useful in the context of this work.
There can be many ASP solutions with different view points(airline companies, local and global authorities). We choose a setof objective functions to be minimized in a given time horizon oftraffic optimization, each one interested in looking at a particularaspect of the ASP.
Our interpretation of equity is different from the commonequity consideration in the related literature that is based on somescheduling rule, such as the first scheduled, first served rule or thefirst come, first served rule. We agree that these rules can beconsidered useful measures of the deviation from an ideal (equi-table) schedule. However, we observe that using such a schedulingrule may generate poor quality solutions in terms of the mini-mization of delay propagation or even infeasible schedules whenapplied to reschedule aircraft during operations. For these reasons,we use a new equity consideration that is viewed as the compu-tation of an ASP solution that minimizes the consecutive delays,i.e. the delays due to the aircraft sequencing decisions. Specifically,we consider two equity measures: the minimization of the max-imum consecutive delay (maximum tardiness), and the mini-mization of the largest difference of consecutive delays among theaircraft of each class (priority equity).
When minimizing the maximum tardiness, we focus on theminimization of the longest path in the graph, that often involves afew aircraft. The minimization of the average consecutive delays(average tardiness) is a more global vision since it requires theconsideration of all delayed aircraft.
In our approach, aircraft priorities are also taken into account asfollows: landing aircraft, due to safety measures, have greaterpriority than departing aircraft, which can wait at ground levelwith fewer risks. A landing, delayed aircraft has even greaterpriority, due to a lower level of fuel. In fact, a fairness concept in airtraffic management is to give priority to late aircraft [14]. In thispaper, the set of aircraft is divided into four classes which areordered below in importance (from the highest to the lowestpriority): (1) landing, delayed aircraft; (2) landing aircraft on time;(3) take-off, delayed aircraft; (4) take-off aircraft on time. The
Please cite this article as: Samà M, et al. Scheduling models for optiequity and violations considerations. Omega (2016), http://dx.doi.org
minimization of the weighted average consecutive delays (prioritytardiness) requires a weighted consideration of the aircraft.
Mirroring the two different approaches used to minimizedelays, in this priority scenario we compare the solutions that takeinto account equity, defined here as the minimization of theaverage difference between maximum and minimum tardiness foreach class, with the ASP solutions that minimize a weightedaverage tardiness with weights assigned to each aircraft accordingto the corresponding level of priority.
Another aspect to be taken into account when solving the ASPis the use of existing, critical airport resources. This considerationtranslates into the maximization of the throughput, that can beviewed as the minimization of the maximum completion time (seee.g. [20]). In our view, it corresponds to the landing/take-off timeof the last aircraft traveling in the TCA during the time horizon(time span) of the traffic optimization. This objective function iscompared with the minimization of the average completion time.The latter objective looks at all aircraft in the studied time horizonof traffic optimization.
Finally, we evaluate the number of delayed aircraft exceeding agiven tolerance thresholds and minimize the number of deadlineviolations, that imply additional operational costs for the airlinecompanies, due e.g. to broken flight connections with other air-craft at the same TCA. This objective is focused on the aircraft thathave a delay above the given threshold (tardy jobs).
3.2. Terminal control areas
Fig. 1 shows the TCA scheme of Milano Malpensa airport (MXP).There are two interdependent runways (RWY 35L, RWY 35R), usedboth for departing and arriving procedures. The MXP resources arethree airborne holding circles (resources 1–3 in Fig. 1, named TOR,MBR, SRN), 11 air segments for arriving procedures (resources 4–14), a common glide path (resource 15), two runways (resources16 and 17) and three air segments for departing procedures(resources 18–20, named SRN, TELVA, RMG). The common glidepath resource includes two parallel air segments before the run-ways for which traffic regulations impose a minimum diagonaldistance between landing aircraft added to a minimumlongitudinal one.
Fig. 2 presents the scheme of another TCA, Roma Fiumicinoairport (FCO). In this case, three interdependent runways (RWY16L, RWY 16R, RWY25) can be used for departing and arrivingprocedures, but two of them (RWY 16R and RWY 25) cannot beused simultaneously and are thus considered as one. The FCOresources are three airborne holding circles (resources 1–3 inFig. 2, named CIA, CMP, TAQ), seven landing air segments(resources 4–10), two runways (resources 12 and 13), a commonglide path (resource 11) and three take-off air segments (resources14–16, named BOL, RAVAL, ELIVIN).
mal aircraft traffic control at busy airports: Tardiness, priorities,/10.1016/j.omega.2016.04.003i

Fig. 2. Fiumicino (FCO) terminal control area.
M. Samà et al. / Omega ∎ (∎∎∎∎) ∎∎∎–∎∎∎6
In the tested ASP instances, the landing aircraft use both run-ways, while the take-off aircraft only used one (interdependent)runway resource for each TCA (i.e. runway resource 16 in Fig. 1 andrunway resource 12 in Fig. 2). We do not perform reroutingmeasures for landing and take-off aircraft. D'Ariano et al. [27] andSamà et al. [66] focus on the combined aircraft reordering andrerouting problem at busy TCAs.
Fig. 3. Alternative graph of a holding circle (a), selected (b) and not selected (c).
4. Problem formulation
In the general job shop scheduling formulation of the ASP, anoperation denotes the traversal of a resource (i.e. air segment,common glide path, runway, holding circle) by a job (i.e. aircraft).The sequence of operations related to an aircraft represents the(pre-defined) route associated with that aircraft. The variables ofthe ASP are the start time ti of each operation i to be performed byan aircraft on a specific resource. A set of route timings is conflict-free if, for each pair of operations associated with the sameresource, the minimum time separation constraints are satisfied.
The ASP is represented by the alternative graph model [55],since this approach permits an accurate and efficient representa-tion of the ASP [26,27,65–67]. Let G¼ ðN; F;AÞ be the graph com-posed of the following sets: N¼ f0;1;…;ng is the set of nodes,where nodes 0 and n represent the start and the end operations ofthe schedule, while the other nodes are related to the start of theother operations; F is the set of fixed directed arcs that model thesequence of operations to be executed by an aircraft; A is the set ofalternative pairs that model the sequencing decision and inter-aircraft safety separations. Each pair is composed of two alter-native directed arcs.
Each node iAN of the graph is associated with the start time tiof operation i, and corresponds to the entrance of the associatedaircraft to the associated resource. By definition, the start time ofthe schedule is a known value, e.g. t0 ¼ 0, and the end time of theschedule is a variable tn.
Each fixed directed arc ði; jÞAF has a length wFij, which is
uniquely determined by i and j. The fixed arc length wFij models a
minimum processing time between the start of i and the start of j,such that tjZtiþwF
ij. In particular, σðiÞ denotes the operation fol-lowing i on its route. It follows that ði;σðiÞÞAF is the directed fixedarc connecting i with σðiÞ and tσðiÞZtiþwF
iσðiÞ.Each alternative pair ðði; jÞ; ðh; kÞÞAA has two arcs with length
wAij and wA
hk. The alternative arc length wAij represents a minimum
separation time between the start of i and the start j. In particular,wA
ij (wAhk) can be sequence-dependent, when nodes i and j (h and k)
are operations of different jobs. Also, there can be multiple alter-native arcs between nodes i and j.
Please cite this article as: Samà M, et al. Scheduling models for optiequity and violations considerations. Omega (2016), http://dx.doi.org
A selection S is a set of alternative arcs, at most one from eachpair. An ASP solution is a complete selection Sc, where an arc foreach alternative pair of the set A is selected, in which the con-nected graph ðN; F; ScÞ has no positive length cycles. Note that apositive length cycle represents an operation preceding itself,which is an infeasibility. Given a feasible schedule Sc, a timing ti foroperation i is the length of a longest path from 0 to i ðlS
c
ð0; iÞÞ.When minimizing a makespan-like objective function, an arc (k,n)between the end node k of each job and node n is added to thealternative graph, and a selection Sc is optimal if lS
c
ð0;nÞ is mini-mum over all the solutions.
The alternative graph can be viewed as a particular disjunctiveprogram. We let X be the set:
X ¼ tZ0; xAf0;1gj Aj :tσðiÞ �tiZwF
iσðiÞ 8ði;σðiÞÞAF with σðiÞan
tj�tiþMð1�xijÞZwAij
tk�thþMxijZwAhk
8ðði; jÞ; ðh; kÞÞAA
8>>><>>>:
9>>>=>>>;
ð1Þ
The variables of the ASP are the following: jNj real variables tiassociated with the start time of each operation iAN and jAjbinary variables xij associated with each alternative pairðði; jÞ; ðh; kÞÞAA. The variable xij is 1 if ði; jÞAS, and xij ¼ 0 if ðh; kÞAS.The constantM is a sufficiently large number, e.g. the sum of all arclengths.
The next subsections describe how the different types of TCAresources are modelled via alternative graphs, and show how eachspecific objective function can be formulated. A numerical ASPexample of a traffic situation is illustrated for the FCO airport. Forthe proposed example, we give the trade-off between a set of non-dominated solutions, each one computed by solving a specificobjective function to optimality. Graphs of the example arereported in Appendices A and B.
mal aircraft traffic control at busy airports: Tardiness, priorities,/10.1016/j.omega.2016.04.003i
M. Samà et al. / Omega ∎ (∎∎∎∎) ∎∎∎–∎∎∎ 7
4.1. Resources in the alternative graph model
The TCA is composed of various types of resources. This sectionillustrates how each of them is modelled in the alternative graph.Fixed arcs are depicted with solid arrows and alternative arcs aredepicted with dotted arrows.
Fig. 3(a) illustrates the formulation of a holding circle resource.We recall that holding circles are used by traffic controllers to letarriving aircraft wait before the start of their landing procedurewhen the TCA is congested. Let i be the entrance of aircraft A to theholding circle and let σðiÞ be the start of the next operation, theholding circle resource is formulated by two fixed arcs ði;σðiÞÞ andðσðiÞ; iÞ (the two solid arrows), respectively of length wF
iσðiÞ ¼ 0 andwFσðiÞi ¼ �δ, where δ is the time required to perform a holding
circle, plus a pair of alternative arcs ðði;σðiÞÞ; ðσðiÞ; iÞÞ (the twodotted arrows) respectively of length wA
iσðiÞ ¼ δ and wAσðiÞi ¼ 0. The
formulation of multiple (half) circles can be easily done in asimilar way.
Fig. 3 (b) shows the decision to perform a holding circle (thedotted arrow ði;σðiÞÞ is selected), while Fig. 3(c) the case with noholding circle (the dotted arrow ðσðiÞ; iÞ is selected). The formula-tion of the holding circle constraints and variables is as follows:
tσðiÞ �tiZwFiσðiÞ ¼ 0
ti�tσðiÞZwFσðiÞi ¼ �δ
tσðiÞ �tiþMð1�xiσðiÞÞZwAiσðiÞ ¼ δ
ti�tσðiÞ þMxiσðiÞZwAσðiÞi ¼ 0
ð2Þ
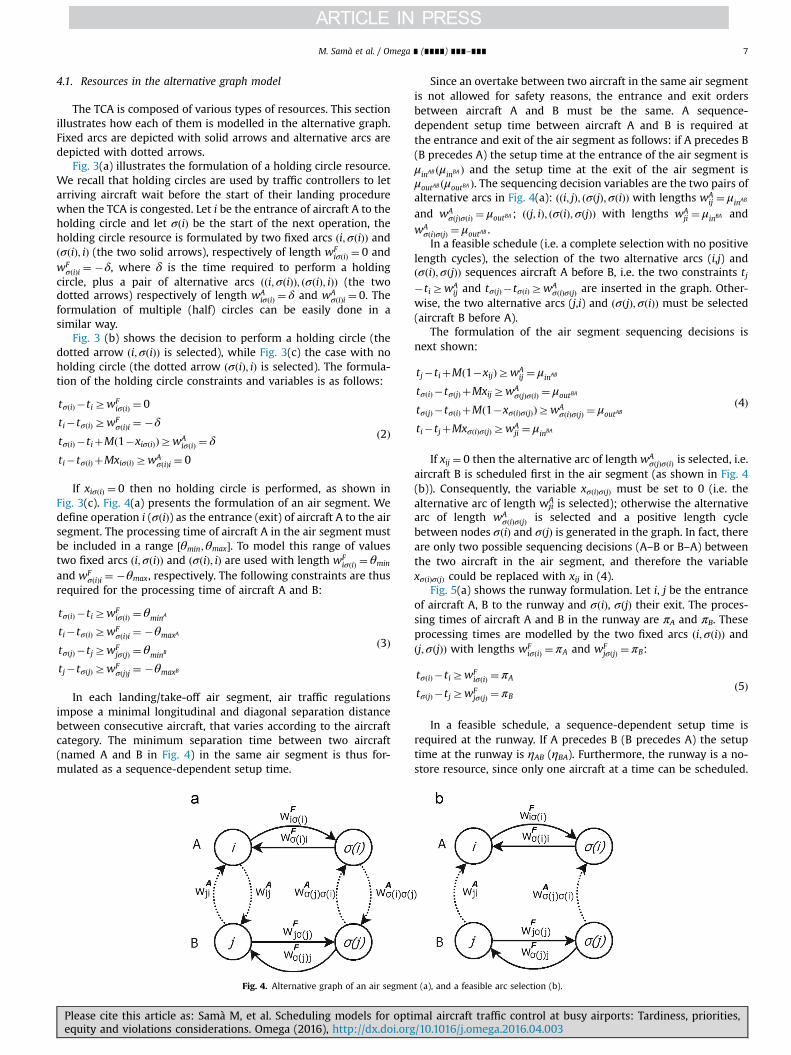
If xiσðiÞ ¼ 0 then no holding circle is performed, as shown inFig. 3(c). Fig. 4(a) presents the formulation of an air segment. Wedefine operation i (σðiÞ) as the entrance (exit) of aircraft A to the airsegment. The processing time of aircraft A in the air segment mustbe included in a range ½θmin;θmax�. To model this range of valuestwo fixed arcs ði;σðiÞÞ and ðσðiÞ; iÞ are used with length wF
iσðiÞ ¼ θmin
and wFσðiÞi ¼ �θmax, respectively. The following constraints are thus
required for the processing time of aircraft A and B:
tσðiÞ �tiZwFiσðiÞ ¼ θminA
ti�tσðiÞZwFσðiÞi ¼ �θmaxA
tσðjÞ �tjZwFjσðjÞ ¼ θminB
tj�tσðjÞZwFσðjÞj ¼ �θmaxB
ð3Þ
In each landing/take-off air segment, air traffic regulationsimpose a minimal longitudinal and diagonal separation distancebetween consecutive aircraft, that varies according to the aircraftcategory. The minimum separation time between two aircraft(named A and B in Fig. 4) in the same air segment is thus for-mulated as a sequence-dependent setup time.
Fig. 4. Alternative graph of an air segmen
Please cite this article as: Samà M, et al. Scheduling models for optiequity and violations considerations. Omega (2016), http://dx.doi.org
Since an overtake between two aircraft in the same air segmentis not allowed for safety reasons, the entrance and exit ordersbetween aircraft A and B must be the same. A sequence-dependent setup time between aircraft A and B is required atthe entrance and exit of the air segment as follows: if A precedes B(B precedes A) the setup time at the entrance of the air segment isμinAB ðμinBA Þ and the setup time at the exit of the air segment isμoutAB ðμoutBA Þ. The sequencing decision variables are the two pairs ofalternative arcs in Fig. 4(a): ðði; jÞ; ðσðjÞ;σðiÞÞ with lengths wA
ij ¼ μinAB
and wAσðjÞσðiÞ ¼ μoutBA ; ððj; iÞ; ðσðiÞ;σðjÞÞ with lengths wA
ji ¼ μinBA andwAσðiÞσðjÞ ¼ μoutAB .In a feasible schedule (i.e. a complete selection with no positive
length cycles), the selection of the two alternative arcs (i,j) andðσðiÞ;σðjÞÞ sequences aircraft A before B, i.e. the two constraints tj�tiZwA
ij and tσðjÞ �tσðiÞZwAσðiÞσðjÞ are inserted in the graph. Other-
wise, the two alternative arcs (j,i) and ðσðjÞ;σðiÞÞ must be selected(aircraft B before A).
The formulation of the air segment sequencing decisions isnext shown:
tj�tiþMð1�xijÞZwAij ¼ μinAB
tσðiÞ �tσðjÞ þMxijZwAσðjÞσðiÞ ¼ μoutBA
tσðjÞ �tσðiÞ þMð1�xσðiÞσðjÞÞZwAσðiÞσðjÞ ¼ μoutAB
ti�tjþMxσðiÞσðjÞZwAji ¼ μinBA
ð4Þ
If xij ¼ 0 then the alternative arc of length wAσðjÞσðiÞ is selected, i.e.
aircraft B is scheduled first in the air segment (as shown in Fig. 4(b)). Consequently, the variable xσðiÞσðjÞ must be set to 0 (i.e. thealternative arc of length wA
ji is selected); otherwise the alternativearc of length wA
σðiÞσðjÞ is selected and a positive length cyclebetween nodes σðiÞ and σðjÞ is generated in the graph. In fact, thereare only two possible sequencing decisions (A–B or B–A) betweenthe two aircraft in the air segment, and therefore the variablexσðiÞσðjÞ could be replaced with xij in (4).
Fig. 5(a) shows the runway formulation. Let i, j be the entranceof aircraft A, B to the runway and σðiÞ, σðjÞ their exit. The proces-sing times of aircraft A and B in the runway are πA and πB. Theseprocessing times are modelled by the two fixed arcs ði;σðiÞÞ andðj;σðjÞÞ with lengths wF
iσðiÞ ¼ πA and wFjσðjÞ ¼ πB:
tσðiÞ �tiZwFiσðiÞ ¼ πA
tσðjÞ �tjZwFjσðjÞ ¼ πB
ð5Þ
In a feasible schedule, a sequence-dependent setup time isrequired at the runway. If A precedes B (B precedes A) the setuptime at the runway is ηAB (ηBA). Furthermore, the runway is a no-store resource, since only one aircraft at a time can be scheduled.
t (a), and a feasible arc selection (b).
mal aircraft traffic control at busy airports: Tardiness, priorities,/10.1016/j.omega.2016.04.003i
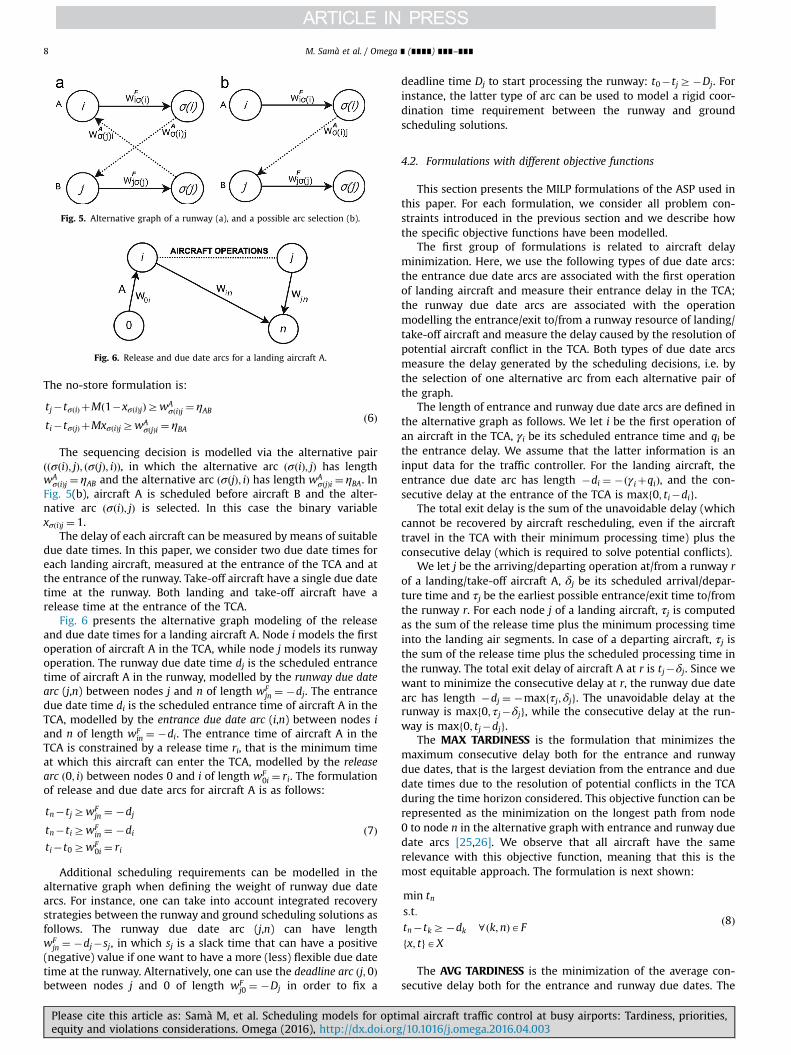
Fig. 5. Alternative graph of a runway (a), and a possible arc selection (b).
Fig. 6. Release and due date arcs for a landing aircraft A.
M. Samà et al. / Omega ∎ (∎∎∎∎) ∎∎∎–∎∎∎8
The no-store formulation is:
tj�tσðiÞ þMð1�xσðiÞjÞZwAσðiÞj ¼ ηAB
ti�tσðjÞ þMxσðiÞjZwAσðjÞi ¼ ηBA
ð6Þ
The sequencing decision is modelled via the alternative pairððσðiÞ; jÞ; ðσðjÞ; iÞÞ, in which the alternative arc ðσðiÞ; jÞ has lengthwAσðiÞj ¼ ηAB and the alternative arc ðσðjÞ; iÞ has length wA
σðjÞi ¼ ηBA. InFig. 5(b), aircraft A is scheduled before aircraft B and the alter-native arc ðσðiÞ; jÞ is selected. In this case the binary variablexσðiÞj ¼ 1.
The delay of each aircraft can be measured by means of suitabledue date times. In this paper, we consider two due date times foreach landing aircraft, measured at the entrance of the TCA and atthe entrance of the runway. Take-off aircraft have a single due datetime at the runway. Both landing and take-off aircraft have arelease time at the entrance of the TCA.
Fig. 6 presents the alternative graph modeling of the releaseand due date times for a landing aircraft A. Node i models the firstoperation of aircraft A in the TCA, while node j models its runwayoperation. The runway due date time dj is the scheduled entrancetime of aircraft A in the runway, modelled by the runway due datearc (j,n) between nodes j and n of length wF
jn ¼ �dj. The entrancedue date time di is the scheduled entrance time of aircraft A in theTCA, modelled by the entrance due date arc (i,n) between nodes iand n of length wF
in ¼ �di. The entrance time of aircraft A in theTCA is constrained by a release time ri, that is the minimum timeat which this aircraft can enter the TCA, modelled by the releasearc ð0; iÞ between nodes 0 and i of length wF
0i ¼ ri. The formulationof release and due date arcs for aircraft A is as follows:
tn�tjZwFjn ¼ �dj
tn�tiZwFin ¼ �di
ti�t0ZwF0i ¼ ri
ð7Þ
Additional scheduling requirements can be modelled in thealternative graph when defining the weight of runway due datearcs. For instance, one can take into account integrated recoverystrategies between the runway and ground scheduling solutions asfollows. The runway due date arc (j,n) can have lengthwF
jn ¼ �dj�sj, in which sj is a slack time that can have a positive(negative) value if one want to have a more (less) flexible due datetime at the runway. Alternatively, one can use the deadline arc ðj;0Þbetween nodes j and 0 of length wF
j0 ¼ �Dj in order to fix a
Please cite this article as: Samà M, et al. Scheduling models for optiequity and violations considerations. Omega (2016), http://dx.doi.org
deadline time Dj to start processing the runway: t0�tjZ�Dj. Forinstance, the latter type of arc can be used to model a rigid coor-dination time requirement between the runway and groundscheduling solutions.
4.2. Formulations with different objective functions
This section presents the MILP formulations of the ASP used inthis paper. For each formulation, we consider all problem con-straints introduced in the previous section and we describe howthe specific objective functions have been modelled.
The first group of formulations is related to aircraft delayminimization. Here, we use the following types of due date arcs:the entrance due date arcs are associated with the first operationof landing aircraft and measure their entrance delay in the TCA;the runway due date arcs are associated with the operationmodelling the entrance/exit to/from a runway resource of landing/take-off aircraft and measure the delay caused by the resolution ofpotential aircraft conflict in the TCA. Both types of due date arcsmeasure the delay generated by the scheduling decisions, i.e. bythe selection of one alternative arc from each alternative pair ofthe graph.
The length of entrance and runway due date arcs are defined inthe alternative graph as follows. We let i be the first operation ofan aircraft in the TCA, γi be its scheduled entrance time and qi bethe entrance delay. We assume that the latter information is aninput data for the traffic controller. For the landing aircraft, theentrance due date arc has length �di ¼ �ðγiþqiÞ, and the con-secutive delay at the entrance of the TCA is maxf0; ti�dig.
The total exit delay is the sum of the unavoidable delay (whichcannot be recovered by aircraft rescheduling, even if the aircrafttravel in the TCA with their minimum processing time) plus theconsecutive delay (which is required to solve potential conflicts).
We let j be the arriving/departing operation at/from a runway rof a landing/take-off aircraft A, δj be its scheduled arrival/depar-ture time and τj be the earliest possible entrance/exit time to/fromthe runway r. For each node j of a landing aircraft, τj is computedas the sum of the release time plus the minimum processing timeinto the landing air segments. In case of a departing aircraft, τj isthe sum of the release time plus the scheduled processing time inthe runway. The total exit delay of aircraft A at r is tj�δj. Since wewant to minimize the consecutive delay at r, the runway due datearc has length �dj ¼ �maxfτj; δjg. The unavoidable delay at therunway is maxf0; τj�δjg, while the consecutive delay at the run-way is maxf0; tj�djg.
The MAX TARDINESS is the formulation that minimizes themaximum consecutive delay both for the entrance and runwaydue dates, that is the largest deviation from the entrance and duedate times due to the resolution of potential conflicts in the TCAduring the time horizon considered. This objective function can berepresented as the minimization on the longest path from node0 to node n in the alternative graph with entrance and runway duedate arcs [25,26]. We observe that all aircraft have the samerelevance with this objective function, meaning that this is themost equitable approach. The formulation is next shown:
min tns:t:tn�tkZ�dk 8ðk;nÞAF
fx; tgAX
ð8Þ
The AVG TARDINESS is the minimization of the average con-secutive delay both for the entrance and runway due dates. The
mal aircraft traffic control at busy airports: Tardiness, priorities,/10.1016/j.omega.2016.04.003i
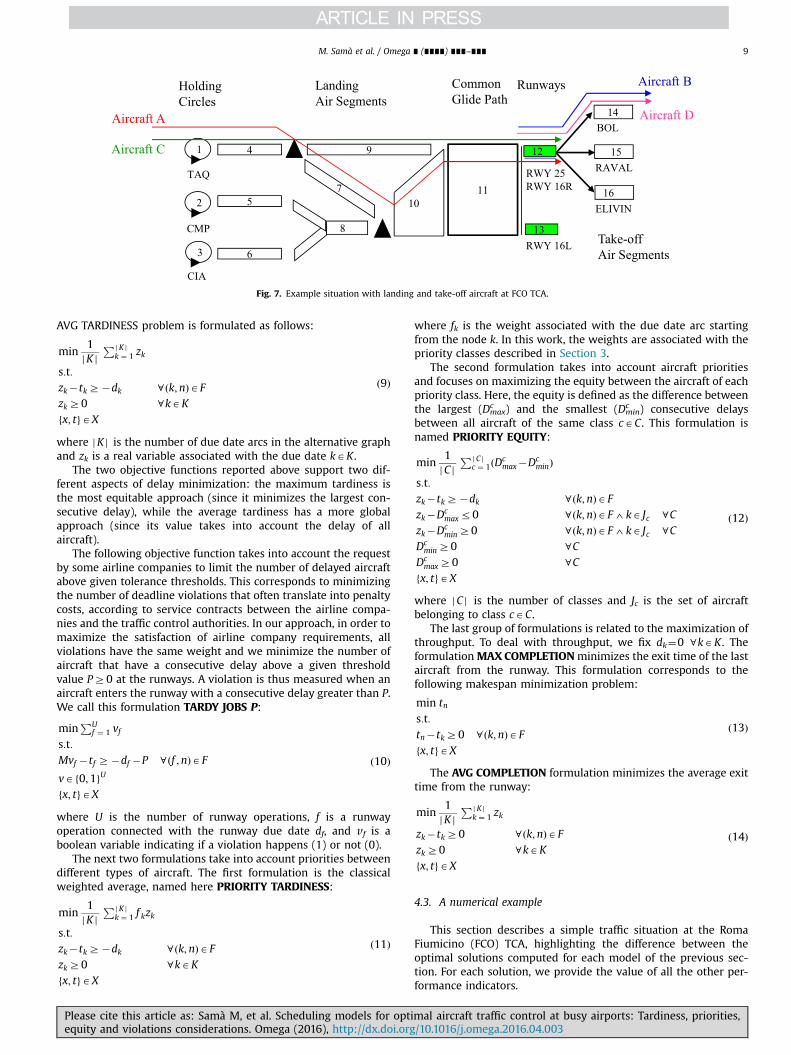
Fig. 7. Example situation with landing and take-off aircraft at FCO TCA.
M. Samà et al. / Omega ∎ (∎∎∎∎) ∎∎∎–∎∎∎ 9
AVG TARDINESS problem is formulated as follows:
min1jK j
Pj K jk ¼ 1 zk
s:t:zk�tkZ�dk 8ðk;nÞAFzkZ0 8kAK
fx; tgAX
ð9Þ
where jK j is the number of due date arcs in the alternative graphand zk is a real variable associated with the due date kAK .
The two objective functions reported above support two dif-ferent aspects of delay minimization: the maximum tardiness isthe most equitable approach (since it minimizes the largest con-secutive delay), while the average tardiness has a more globalapproach (since its value takes into account the delay of allaircraft).
The following objective function takes into account the requestby some airline companies to limit the number of delayed aircraftabove given tolerance thresholds. This corresponds to minimizingthe number of deadline violations that often translate into penaltycosts, according to service contracts between the airline compa-nies and the traffic control authorities. In our approach, in order tomaximize the satisfaction of airline company requirements, allviolations have the same weight and we minimize the number ofaircraft that have a consecutive delay above a given thresholdvalue PZ0 at the runways. A violation is thus measured when anaircraft enters the runway with a consecutive delay greater than P.We call this formulation TARDY JOBS P:
minPU
f ¼ 1 vfs:t:Mvf �tf Z�df �P 8ðf ;nÞAF
vAf0;1gUfx; tgAX
ð10Þ
where U is the number of runway operations, f is a runwayoperation connected with the runway due date df, and vf is aboolean variable indicating if a violation happens (1) or not (0).
The next two formulations take into account priorities betweendifferent types of aircraft. The first formulation is the classicalweighted average, named here PRIORITY TARDINESS:
min1jK j
Pj K jk ¼ 1 f kzk
s:t:zk�tkZ�dk 8ðk;nÞAF
zkZ0 8kAK
fx; tgAX
ð11Þ
Please cite this article as: Samà M, et al. Scheduling models for optiequity and violations considerations. Omega (2016), http://dx.doi.org
where fk is the weight associated with the due date arc startingfrom the node k. In this work, the weights are associated with thepriority classes described in Section 3.
The second formulation takes into account aircraft prioritiesand focuses on maximizing the equity between the aircraft of eachpriority class. Here, the equity is defined as the difference betweenthe largest (Dc
max) and the smallest (Dcmin) consecutive delays
between all aircraft of the same class cAC. This formulation isnamed PRIORITY EQUITY:
min1jC j
Pj C jc ¼ 1ðDc
max�DcminÞ
s:t:zk�tkZ�dk 8ðk;nÞAF
zk�Dcmaxr0 8ðk;nÞAF4kA Jc 8C
zk�DcminZ0 8ðk;nÞAF4kA Jc 8C
DcminZ0 8C
DcmaxZ0 8C
fx; tgAX
ð12Þ
where jC j is the number of classes and Jc is the set of aircraftbelonging to class cAC.
The last group of formulations is related to the maximization ofthroughput. To deal with throughput, we fix dk¼0 8kAK . TheformulationMAX COMPLETIONminimizes the exit time of the lastaircraft from the runway. This formulation corresponds to thefollowing makespan minimization problem:
min tns:t:tn�tkZ0 8ðk;nÞAF
fx; tgAX
ð13Þ
The AVG COMPLETION formulation minimizes the average exittime from the runway:
min1jK j
Pj K jk ¼ 1 zk
zk�tkZ0 8ðk;nÞAF
zkZ0 8kAK
fx; tgAX
ð14Þ
4.3. A numerical example
This section describes a simple traffic situation at the RomaFiumicino (FCO) TCA, highlighting the difference between theoptimal solutions computed for each model of the previous sec-tion. For each solution, we provide the value of all the other per-formance indicators.
mal aircraft traffic control at busy airports: Tardiness, priorities,/10.1016/j.omega.2016.04.003i

Table 1Optimal ASP solutions computed for each formulation of the numerical example.
Objective function Tardiness Completion Tardy Jobs Priority
Max Avg Priority Max Avg P¼0 P¼300 Equity
Max Tardiness 223 93.2 913.3 1728 1601 3 0 111.5Avg Tardiness 225 68.8 701.7 1725 1590.5 2 0 103.3Priority Tardiness 364 85.7 310.7 1822 1613 2 1 123.5Max Completion 225 87.0 1065.0 1725 1590.5 2 0 103.3Avg Completion 225 87.0 1027.5 1725 1590.5 2 0 103.3Tardy Jobs P¼0 256 83.8 454.3 1752 1615.3 2 0 125.8Tardy Jobs P¼300 256 83.8 497.0 1752 1615.3 2 0 125.8Priority Equity 225 68.8 701.7 1725 1590.5 2 0 103.3
M. Samà et al. / Omega ∎ (∎∎∎∎) ∎∎∎–∎∎∎10
Fig. 7 presents a schematic view of the TCA and provides theroute of each aircraft: A and C are landing aircraft, while B and Dare take-off aircraft. A and D are delayed aircraft, i.e. they have anentrance delay that changes their release time. The entrance delayof A is 170 and the one of D is 489. Furthermore, all aircraft have touse the same runway resource (12), since the other one (13) is notavailable. The presence of disturbances causes potential conflict inthe TCA and, therefore, the ASP must be solved. The alternativegraph of the traffic situation is shown in Appendix A.
Table 1 gives the optimal solution value for each objectivefunction (one per row in bold), and the corresponding value for allother performance indicators. The optimal solution is obtained bysolving the ASP formulations of Section 4.2. Regarding the for-mulations with aircraft priorities, we consider a different class foreach aircraft as described in Section 3. According to the aircrafttypes and the delayed aircraft, the adopted weights are: fA¼20,fC¼10, fD¼2 and fB¼1. The bigger the weight, the higher thepriority class.
From the results of Table 1, we observe that, even for thissimple traffic situation with four aircraft, seven different solutionsare obtained by the eight ASP formulations. Only Avg Tardinessand Priority Equity share the same solution. The different ASPsolutions present interesting gaps in terms of the various perfor-mance indicators. For instance, looking at the first row of Table 1,Max Tardiness gives the lowest maximum consecutive delay at thecost of large average consecutive delays and number of tardy jobsP¼0. In fact, the optimal solution obtained for Max Tardinessminimizes the longest path in the graph, that includes operationsof aircraft B and D only. This also explains the high value obtainedfor Priority Tardiness and Priority Equity (B and D are the twoaircraft with lower priorities). Avg Tardiness (second row ofTable 1) gives better results than Max Tardiness in terms of aver-age consecutive delays, number of tardy jobs P¼0 and PriorityEquity, while Priority Tardiness is still far from the optimal value(third row of Table 1). Priority Equity gives a good trade-offbetween Max Tardiness and Avg Tardiness, however its solutionis a poor quality compared to Priority Tardiness. The optimalsolution obtained for Priority Tardiness clearly schedules the air-craft on their order of priorities (A, C, D and B), causing a very largeconsecutive delay for aircraft B (see Columns 2 and 8). The valuesobtained for Max and Avg Completion (fifth and sixth columns ofTable 1) are similar for most of the solutions. Tardy Jobs P¼0outperforms Tardy Jobs P¼300 and represents a compromisesolution in terms of the other indicators. The optimal solution forTardy Jobs P¼0 is shown in Appendix B. Gantt charts of the dif-ferent ASP solutions in Table 1 are also illustrated in Appendix B.
Please cite this article as: Samà M, et al. Scheduling models for optiequity and violations considerations. Omega (2016), http://dx.doi.org
5. Experimental results
This section presents the computational results for the ASPformulations of Section 4.2. The tests have been performed in alaboratory environment. We consider real-world ASP instances forFCO and MXP. The ASP solutions are computed via the solver IBMILOG CPLEX MIP 12.0, with a given time limit of computation. Theexperiments are executed on a processor Intel Dual Core E6550(2.33 GHz), 2 GB of RAM and Windows XP.
5.1. Description of the ASP instances
The assumptions made in the data sets have been inspired bythe current practice at the studied airports. In general, the pro-posed MILP formulations can deal with any routing combination atrunways (i.e. all runways can be eventually modelled in mixed-mode), and any prioritization of take-off and landing aircraft (i.e.different weights can be used in the objective functions).
For each terminal control area (MXP or FCO), we deal withpractical-size instances of 30-min traffic optimization. All trafficoptimizations start at time t0 ¼ 0. The tests have been performedin a laboratory environment by using real-world data from MXPand FCO TCAs. The studied ASP instances are characterized by twotypes of aircraft (named medium and heavy aircraft). Conse-quently, sequence-dependent setup times are modelled in eachASP instance. The processing and setup times are computed foreach aircraft category according to standard descent and ascentprofiles, disregarding the actual aircraft passenger and freight load.The release and due date times are computed from a referencetimetable.
Only one runway is used in a mixed mode for each TCA(resource 16 at MXP and resource 12 at FCO). There are up to 13(12) aircraft scheduled in each runway during half hour trafficoptimization at MXP (FCO). This can be considered a dense trafficwhile comparing the traffic flows at MXP and FCO with the otherItalian airports. The impact of studying a limited time horizon oftraffic optimization is not investigated in this paper.
Table 2 describes the 20 ASP instances that we generated withrandom entrance delays (10 with negative exponential distribu-tion and 10 with Gaussian distribution). The entrance delays arerandomly generated for the first half aircraft entering the TCAaccording to a given distribution. The exit delays are measured as apositive deviation from the scheduled take-off/landing time, thatis derived from the reference timetable. Each row reports averageinformation on a terminal control area. In total, the computationalstudy is based on 40 ASP instances.
Table 2 is organized as follows. Column 1 presents the TCA (FCOand MXP), Columns 2 and 3 the number of landing and take-offaircraft, Columns 4 and 5 the maximum and average entrancedelays (in seconds), Columns 6 and 7 the maximum and averageunavoidable delays (in seconds). The latter delays are significantly
mal aircraft traffic control at busy airports: Tardiness, priorities,/10.1016/j.omega.2016.04.003i

Table 2ASP instances.
TCA Landing Take-off Max entr. Avg entr. Max unavoid. Avg unavoid.aircraft aircraft delay delay delay delay
(s) (s) (s) (s)
MXP 14 6 1792.9 869.6 1476.7 683.5FCO 16 4 1789.0 990.4 1638.9 783.7
Table 3Variables and constraints for each ASP formulation.
ASP instance size Variables Constraints
TCA MXP FCO MXP FCO
Max Tardiness 658 806 1307 1605Avg Tardiness 692 842 1341 1641Priority Equity 700 850 1409 1713Priority Tardiness 692 842 1341 1641Max Completion 658 806 1307 1605Avg Completion 692 842 1341 1641Tardy Jobs P¼0s 678 826 1327 1625Tardy Jobs P¼300s 678 826 1327 1625
Table 4Solutions for the ASP formulations.
TCA MXP FCO MXP FCO
Obj. function Max Tardiness Avg TardinessComp. time (s) 455.4 197.3 3483.0 2749.3No. of optimal sol. 20 20 16 20UB-1 (s) 389.3 324.6 69.0 55.0UB-2 (s) 389.3 324.6 69.0 54.6LB (s) 389.3 324.6 62.3 54.6Gap-1 (%) 0 0 10.7 0.8Gap-2 (%) 0 0 10.7 0
Obj. function Priority Equity Priority TardinessComp. time (s) 11.4 77.5 329.5 1698.4No. of optimal sol. 20 20 20 20UB-1 (s) 129.4 106.9 878.4 658.4UB-2 (s) 129.4 106.9 878.0 652.1LB (s) 129.4 106.9 878.0 652.1Gap-1 (%) 0 0 0.1 0.9Gap-2 (%) 0 0 0 0
Obj. function Max Completion Avg CompletionComp. time (s) 529.7 2143.8 4208.1 2369.0No. of optimal sol. 20 20 15 20UB-1 (s) 3363.3 3485.4 2463.5 2670.9UB-2 (s) 3363.3 3475.3 2463.5 2670.9LB (s) 3363.3 3475.3 2452.1 2670.9Gap-1 (%) 0 0.3 0.5 0Gap-2 (%) 0 0 0.5 0
Obj. function Tardy Jobs P ¼ 0s Tardy Jobs P ¼ 300sComp. time (s) 1.3 18.4 37.6 243.6No. of optimal sol. 20 20 20 20UB-1 (s) 7.5 8.4 1.5 1.2UB-2 (s) 7.5 8.4 1.5 1.2LB (s) 7.5 8.4 1.5 1.2Gap-1 (%) 0 0 0 0Gap-2 (%) 0 0 0 0
M. Samà et al. / Omega ∎ (∎∎∎∎) ∎∎∎–∎∎∎ 11
smaller than the entrance delays, since we compute the free-netprocessing times by letting all landing aircraft travel with theirmaximum allowed speed profile.
Table 3 gives the number of variables and constraints for eachASP formulation. Each row reports average information for the 20ASP instances we considered for each airport (MXP or FCO). TheFCO instances have more variables and constraints than the MXPinstances, since more aircraft are scheduled at FCO and lessalternative air segment resources are available for landing aircraft.
Please cite this article as: Samà M, et al. Scheduling models for optiequity and violations considerations. Omega (2016), http://dx.doi.org
The next subsections will show the computational resultsobtained for the 40 ASP instances. We tested the 8 ASP formula-tions: Max and Avg Tardiness dealing with pure delay minimiza-tion, Priority Tardiness and Priority Equity dealing with aircraftclasses, Max and Avg Completion dealing with throughput mini-mization, Tardy Job P¼0 and Tardy Job P¼300 dealing withdeadline violations. In addition, we tested the 40 ASP instanceswith a practical scheduling rule and a combined formulation. Asdescribed in Section 3, we used four classes of aircraft: (1) landing,delayed aircraft; (2) landing aircraft on time; (3) take-off, delayedaircraft; (4) take-off aircraft on time. Their weights are: f 1 ¼ 20,f 2 ¼ 10, f 3 ¼ 2 and f 4 ¼ 1.
5.2. ASP formulations
Table 4 presents the average computational results obtained foreach ASP formulation. Each column reports the average results onthe 20 ASP instances for a traffic control area. Table 4 is organizedin blocks of eight rows per formulation: Row 1 gives the objectivefunction, Row 2 the average computation time (in seconds), Row3 the number of problems that were solved to optimality byCPLEX, Row 4 the average upper bound value (in seconds, namedUB-1) at up to 60 s, Row 5 the average upper bound value (inseconds, named UB-2) at up to 10,800 s. The experiments with alarge computation time allowed us to get further information onthe optimal solutions. The best known value of upper bounds isreported in bold. Row 6 gives the average best known value oflower bound (in seconds, named LB) obtained with the largestcomputation time, Row 7 the average optimality gap (in percen-tage, named GAP-1) computed as follows: (UB-1� LB)/LB, Row8 the average optimality gap (in percentage, named GAP-2) com-puted as follows: (UB-2�LB)/LB.
From Table 4, we have the following observations. All ASPinstances are solved to (near)optimality (the optimality gap isalways below 1%, except for the average tardiness at MXP airportshowing around 10% optimality gap). The results obtained at 60 sof computation are similar to the ones obtained with largercomputation times (comparing UB-1 versus UB-2). We concludethat the ASP instances can be efficiently solved in a short com-putation time (up to 60 s on a standard processor), compatiblewith real-time application.
Regarding the specific performance of the various objectivefunctions, the Tardy Jobs formulations present the larger numberof optimal solutions, while Avg Tardiness and Avg Completion thelowest number. More optimal solutions are generally obtained forthe objective functions based on a maximum delay minimizationcompared to the ones based on an average delay minimization.Also, Priority Equity presents a larger number of optimal solutionsthan Priority Tardiness. The problem of minimizing the maximumconsecutive delay, even if this is done per priority class, is thuseasier to solve to optimality by CPLEX than the weighted averageconsecutive delay minimization.
5.3. Optimizing an objective and looking at the other objectives
This subsection studies how the optimal ASP solutions com-puted for a specific indicator infer the quality of the other indi-cators. The proposed analysis permits to assess the quality of non-dominated solutions for one objective function in terms of theother performance indicators.
Fig. 8 presents average results on the 35/40 ASP instancessolved to optimality by all ASP formulations. Each plot in thisfigure reports the average optimality gap in terms of all perfor-mance indicators that are not directly optimized in the objectivefunction of the corresponding ASP formulation. The averageoptimality gap is computed for each secondary indicator as
mal aircraft traffic control at busy airports: Tardiness, priorities,/10.1016/j.omega.2016.04.003i
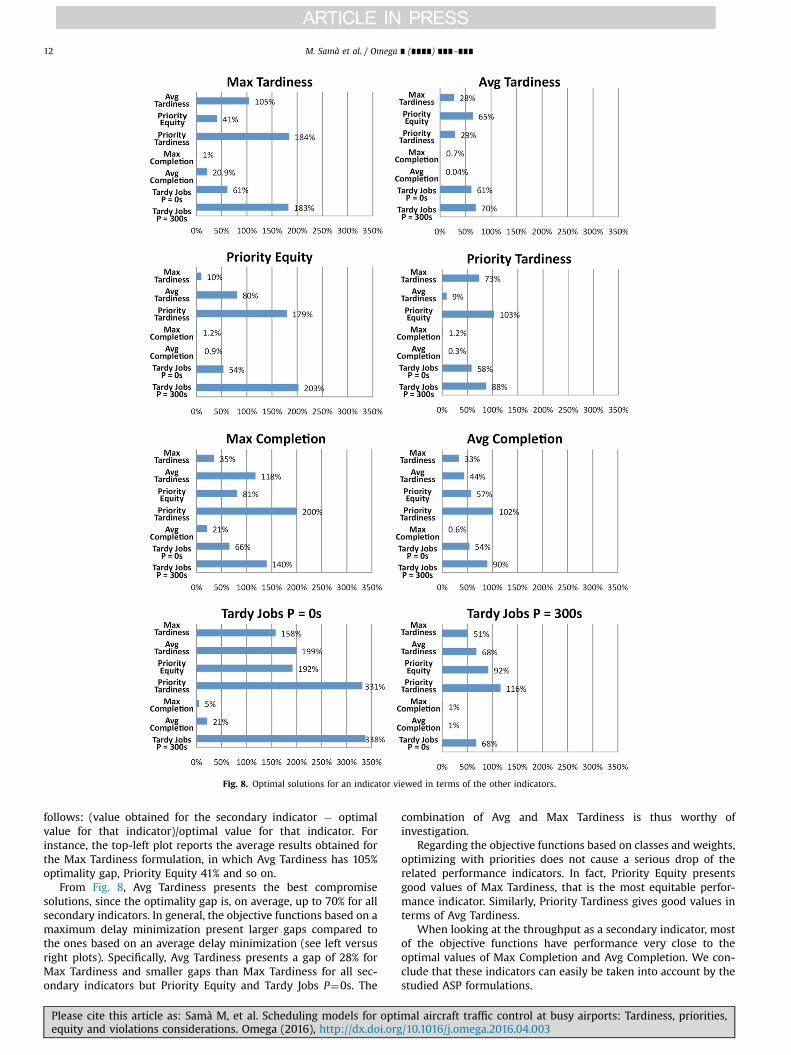
Fig. 8. Optimal solutions for an indicator viewed in terms of the other indicators.
M. Samà et al. / Omega ∎ (∎∎∎∎) ∎∎∎–∎∎∎12
follows: (value obtained for the secondary indicator � optimalvalue for that indicator)/optimal value for that indicator. Forinstance, the top-left plot reports the average results obtained forthe Max Tardiness formulation, in which Avg Tardiness has 105%optimality gap, Priority Equity 41% and so on.
From Fig. 8, Avg Tardiness presents the best compromisesolutions, since the optimality gap is, on average, up to 70% for allsecondary indicators. In general, the objective functions based on amaximum delay minimization present larger gaps compared tothe ones based on an average delay minimization (see left versusright plots). Specifically, Avg Tardiness presents a gap of 28% forMax Tardiness and smaller gaps than Max Tardiness for all sec-ondary indicators but Priority Equity and Tardy Jobs P¼0s. The
Please cite this article as: Samà M, et al. Scheduling models for optiequity and violations considerations. Omega (2016), http://dx.doi.org
combination of Avg and Max Tardiness is thus worthy ofinvestigation.
Regarding the objective functions based on classes and weights,optimizing with priorities does not cause a serious drop of therelated performance indicators. In fact, Priority Equity presentsgood values of Max Tardiness, that is the most equitable perfor-mance indicator. Similarly, Priority Tardiness gives good values interms of Avg Tardiness.
When looking at the throughput as a secondary indicator, mostof the objective functions have performance very close to theoptimal values of Max Completion and Avg Completion. We con-clude that these indicators can easily be taken into account by thestudied ASP formulations.
mal aircraft traffic control at busy airports: Tardiness, priorities,/10.1016/j.omega.2016.04.003i

Table 5Solutions for the ASP when using the FCFS scheduling rule.
Objective MXP TCA FCO TCA
Function UB (sec) N. of Optimal Sol. UB (sec) N. of Optimal Sol.
Max Tardiness 529.4 4 493.6 3Avg Tardiness 128.2 0 115.1 0Priority Equity 212.5 0 148.8 1Priority Tardiness 2302.0 0 2230.2 0Max Completion 3458.1 7 3657.6 9Avg Completion 2990.4 0 2755.3 0Tardy Jobs P¼0 13.2 0 13.4 0Tardy Jobs P¼300 4.9 6 5.3 10
Fig. 9. FCFS solutions in terms of all indicators.
Table 6Solutions for the ASP when using the combined formulation.
Objective function MXP FCO
UB (s) No. of optimal sol. UB (s) No. of optimal sol.
Max Tardiness 470.3 1 389.4 2Avg Tardiness 73.1 6 57.2 5Priority Equity 182.4 0 148.0 0Priority Tardiness 1229.3 0 802.5 2Max Completion 3377.4 7 3529.5 9Avg Completion 2468.3 4 2676.0 4Tardy Jobs P¼0 11.8 0 12.5 0Tardy Jobs P¼300 3.3 5 1.7 14
Fig. 10. Combined formulation solutions in terms of all indicators.
M. Samà et al. / Omega ∎ (∎∎∎∎) ∎∎∎–∎∎∎ 13
Tardy Jobs are among the less equitable objective functions,since they prefer to significantly penalize the behavior of a fewaircraft in order to have the set of tardy aircraft as small as pos-sible. Comparing the two corresponding formulations in terms ofthe other performance indicators, Tardy Jobs P¼300s outperformsTardy Jobs P¼0s. In general, the latter formulation presents theworst values in terms of the various performance indicators.
It is interesting to note that, even if the considered objectivefunctions are based on apparently similar performance indicators,the solutions optimized for a single indicator have the drawback todeteriorate the performance related to some of the other perfor-mance indicators.
5.4. A practical scheduling rule
This subsection studies the quality of the solutions computedby a commonly used scheduling rule: First Come First Served(FCFS). We observe that more elaborated approaches than FCFS,such as algorithms based on max position shifting [10,29,30], canbe a more fairer comparison against real world behavior, sincecontrollers usually modify the FCFS solution by switching groupsof two or more aircraft around in order to improve throughput onsome bottleneck resources.
Table 5 shows the average value (named UB, in seconds) on the40 ASP instances of Section 5.1 obtained for the FCFS rule, and thenumber of optimal solutions for each performance indicator. Theaverage computation time is less than 1 s.
Fig. 9 presents a plot with average results on 35/40 instances ofSection 5.1 for which an optimal ASP solution has been computedfor all performance indicators. The average optimality gap iscomputed for each performance indicator as in Section 5.3.
Overall, FCFS has a significantly larger optimality gap for allperformance indicators compared to Avg Tardiness. This resulthighlights the importance to evaluate the ASP solutions in terms ofseveral performance indicators, and to introduce new decision
Please cite this article as: Samà M, et al. Scheduling models for optiequity and violations considerations. Omega (2016), http://dx.doi.org
support systems for solving the ASP based on the considerationand optimization of a number of performance indicators.
5.5. Combined formulation
When dealing with several performance indicators, we believethat a weighted objectives approach is not reasonable, since itwould be very difficult to identify the right value of the weights.For this reason, we present the following combined formulation.First of all, we identify the ASP formulation of Section 4 that hasthe best trade-off performance. Then, we extend that formulationby introducing a set of additional constraints related to the non-optimized performance indicators. The additional constraints aregenerated via the following constraint generation procedure:
Phase I : A constraint αirβi is added regarding the value αi ofeach non-optimized indicator i in order to limit thedeterioration of its performance up to a given thresholdvalue βi.
Phase II : The resulting ASP formulation is solved to (near)optimality, provided that any ASP solution exists for thegiven additional constraints.
Phase III : If at least a feasible ASP schedule exists, the procedurereturns the best solution computed by the solver (we useCPLEX with a time limit of 10,800 s). Otherwise, the newconstraints introduced in phase I are revised byincreasing the threshold value βi related to the value αi ofeach performance indicator i.
The procedure iterates the three phases till a feasible ASP scheduleis found.
The reason for studying the combined formulation is toinvestigate whether ASP solutions exist with a limited deteriora-tion of the non-optimized indicators. Furthermore, the combinedformulation does not require to set parameters in the objective
mal aircraft traffic control at busy airports: Tardiness, priorities,/10.1016/j.omega.2016.04.003i
M. Samà et al. / Omega ∎ (∎∎∎∎) ∎∎∎–∎∎∎14
function, while it would be difficult to identify the right valuewhen using e.g. parameters in the objective function in order toweight the different performance indicators.
From the results in Section 5.3, Avg Tardiness presents the besttrade-off performance, since it is the only ASP formulation that is,on average, up to 70% from the optimal solution of each perfor-mance indicator. We therefore applied the constraint generationprocedure to this ASP formulation and each of the 40 ASPinstances of Section 5.1. Initially, the threshold value βi has beenfixed equal to the best known value αn
i of each secondary indicatori. At each iteration of the constraint generation procedure, thecurrent threshold value βi is increased of 0.1 αn
i for each secondaryindicator i until a feasible schedule is found. Specifically, the fol-lowing number of feasible schedules is found: 7 for 30% increase ofthe initial threshold value, 10 for 40% increase, 13 for 50% increase,3 for 60% increase, 4 for 70% increase, and 3 for 80% increase. Thecomputation of a trade-off schedule is thus a complex problemand a significant relaxation to the best known value of somesecondary indicator is required to compute a feasible schedule forthe studied ASP instances.
Table 6 presents average results on the 40 ASP instances for thecombined formulation generated by the constraint generationprocedure, in terms of the same information reported in Table 5.
Fig. 10 presents the average optimality gap for each perfor-mance indicator as in Section 5.3. The plot presents the averageresults on 35/40 instances of Section 5.1 for which an optimal ASPsolution has been computed for all performance indicators.
The computational results in Fig. 10 show that the best trade-off solutions are now computed by the solver for the combinedformulation. The average distance from the optimal solution isreduced in the three worst cases (55% for Tardy Jobs P¼0s, 43% forTardy Jobs P¼300s and 39% for Priority Equity) compared to AvgTardiness. However, this improvement is obtained at the cost of alight deterioration the performance of other performance indica-tors, including the one minimized in the objective function (thathas the largest worsening, on average, up to 5%).
6. Conclusions and further research
This paper presents microscopic formulations of the ASP withhigh precision modeling and the evaluation of alternative objec-tive functions. We examine the trade-off between some classicalperformance indicators in the take-off and landing aircraft sche-duling literature, since we believe that there is still not a generallyrecognized objective function for the ASP. We observe that optimalsolutions are very often computed by a commercial solver withinone minute of computation on a standard processor. Furthermore,the solver computes different ASP solutions for the ASP formula-tions with different objective functions. Finally, a pool of (near)optimal ASP solutions is provided to the traffic controller alongwith quantitative information on numerous performanceindicators.
Please cite this article as: Samà M, et al. Scheduling models for optiequity and violations considerations. Omega (2016), http://dx.doi.org
An extensive set of computational experiments shows theexistence of relevant gaps between the ASP solutions computedfocusing on the studied aspects of the ASP. A trade-off between thequality of various performance indicators is found for the ASPsolutions computed via the different formulations. In particular,the Avg Tardiness results to be a good trade-off formulation, andits solutions outperform the FCFS solutions in terms of all perfor-mance indicators. However, better trade-off solutions exist if oneintroduces additional constraints in Avg Tardiness.
In general, the development of an ASP formulation taking intoaccount multiple performance indicators is a challenging problem.The solutions computed for a combined formulation may improvesome indicator, while they may have the drawback to deterioratethe performance related to some other indicator. However, webelieve that this work moves the interest of researchers andpractitioners in paying more attention to the various modelingaspects and performance indicators related to the ASP, and thus onthe inherent multi-objective nature of this problem.
Further research will be concentrated on developing real-timeefficient (eventually heuristic) scheduling algorithms for specificASP formulations that would (1) reduce the optimality gap foundby CPLEX, (2) reduce the time to compute the best solution, (3)solve large-size ASP instances to (near)optimality. Furthermore,we intend to further improve the quality gaps in terms of the bestknown values of each indicator. The latter result can be achievedby investigating ASP formulations with multiple objectives, or byintroducing additional ASP constraints while optimizing a singleindicator (as shown in this paper for the combined formulation).
Other promising research directions should focus on the coor-dination of the ASP solutions with related problems, such as theen-route, ground and gate scheduling problems [32,59]. Additionalfactors should be considered, such as evaluating the impact of adynamic system setting, integrating the ASP solutions with theground scheduling solutions and the en-route scheduling solu-tions, dealing with other objectives, constraints and variables (e.g.aircraft routing and speed control).
Acknowledgment
This work was partially supported by the Italian Ministry ofResearch, Grant number RBIP06BZW8, project FIRB “Advancedtracking system in intermodal freight transportation”. We aregrateful to the associate editor and reviewers for their constructiveand elaborated comments.
Appendix A
The traffic situation of Section 4.3 is modelled by the alter-native graph of Fig. 11. Each node of the alternative graph repre-sents an operation, e.g. A12 is aircraft A entering runway 12. Blacksolid arrows represent fixed directed arcs, while coloured dashed
mal aircraft traffic control at busy airports: Tardiness, priorities,/10.1016/j.omega.2016.04.003i
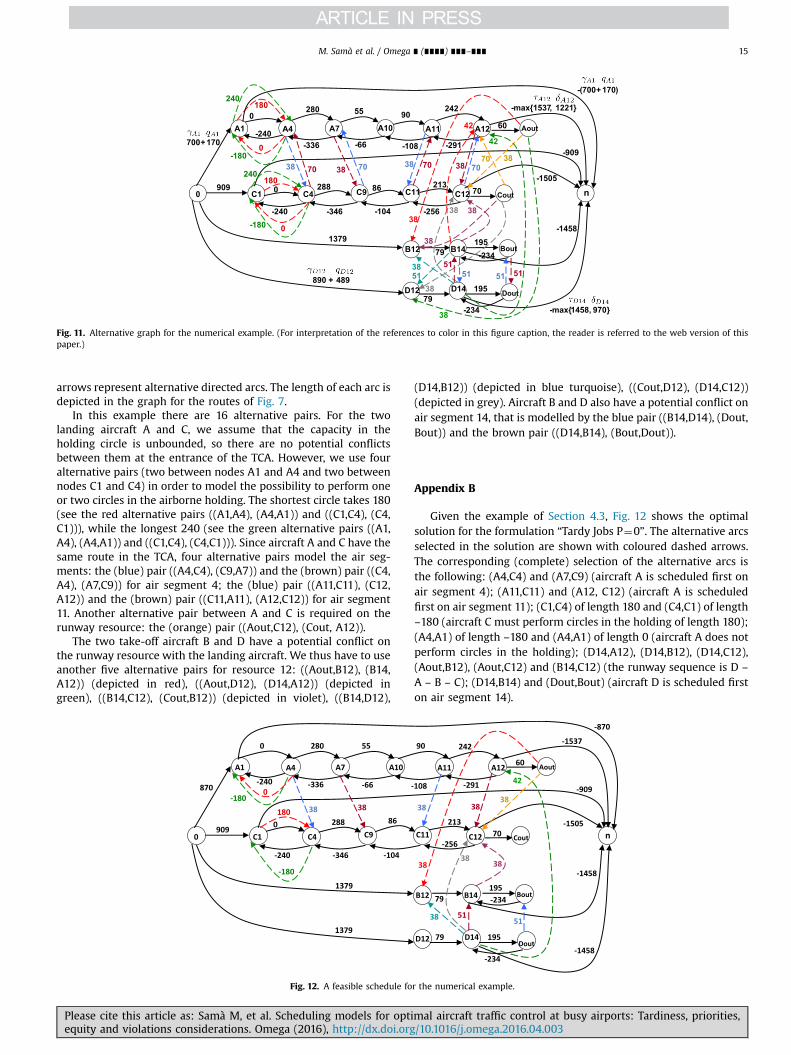
Fig. 11. Alternative graph for the numerical example. (For interpretation of the references to color in this figure caption, the reader is referred to the web version of thispaper.)
M. Samà et al. / Omega ∎ (∎∎∎∎) ∎∎∎–∎∎∎ 15
arrows represent alternative directed arcs. The length of each arc isdepicted in the graph for the routes of Fig. 7.
In this example there are 16 alternative pairs. For the twolanding aircraft A and C, we assume that the capacity in theholding circle is unbounded, so there are no potential conflictsbetween them at the entrance of the TCA. However, we use fouralternative pairs (two between nodes A1 and A4 and two betweennodes C1 and C4) in order to model the possibility to perform oneor two circles in the airborne holding. The shortest circle takes 180(see the red alternative pairs ((A1,A4), (A4,A1)) and ((C1,C4), (C4,C1))), while the longest 240 (see the green alternative pairs ((A1,A4), (A4,A1)) and ((C1,C4), (C4,C1))). Since aircraft A and C have thesame route in the TCA, four alternative pairs model the air seg-ments: the (blue) pair ((A4,C4), (C9,A7)) and the (brown) pair ((C4,A4), (A7,C9)) for air segment 4; the (blue) pair ((A11,C11), (C12,A12)) and the (brown) pair ((C11,A11), (A12,C12)) for air segment11. Another alternative pair between A and C is required on therunway resource: the (orange) pair ((Aout,C12), (Cout, A12)).
The two take-off aircraft B and D have a potential conflict onthe runway resource with the landing aircraft. We thus have to useanother five alternative pairs for resource 12: ((Aout,B12), (B14,A12)) (depicted in red), ((Aout,D12), (D14,A12)) (depicted ingreen), ((B14,C12), (Cout,B12)) (depicted in violet), ((B14,D12),
Fig. 12. A feasible schedule fo
Please cite this article as: Samà M, et al. Scheduling models for optiequity and violations considerations. Omega (2016), http://dx.doi.org
(D14,B12)) (depicted in blue turquoise), ((Cout,D12), (D14,C12))(depicted in grey). Aircraft B and D also have a potential conflict onair segment 14, that is modelled by the blue pair ((B14,D14), (Dout,Bout)) and the brown pair ((D14,B14), (Bout,Dout)).
Appendix B
Given the example of Section 4.3, Fig. 12 shows the optimalsolution for the formulation “Tardy Jobs P¼0”. The alternative arcsselected in the solution are shown with coloured dashed arrows.The corresponding (complete) selection of the alternative arcs isthe following: (A4,C4) and (A7,C9) (aircraft A is scheduled first onair segment 4); (A11,C11) and (A12, C12) (aircraft A is scheduledfirst on air segment 11); (C1,C4) of length 180 and (C4,C1) of length–180 (aircraft C must perform circles in the holding of length 180);(A4,A1) of length –180 and (A4,A1) of length 0 (aircraft A does notperform circles in the holding); (D14,A12), (D14,B12), (D14,C12),(Aout,B12), (Aout,C12) and (B14,C12) (the runway sequence is D –
A – B – C); (D14,B14) and (Dout,Bout) (aircraft D is scheduled firston air segment 14).
r the numerical example.
mal aircraft traffic control at busy airports: Tardiness, priorities,/10.1016/j.omega.2016.04.003i

Fig. 13. Gantt charts for the optimal ASP solutions for the numerical example.
M. Samà et al. / Omega ∎ (∎∎∎∎) ∎∎∎–∎∎∎16
Please cite this article as: Samà M, et al. Scheduling models for optimal aircraft traffic control at busy airports: Tardiness, priorities,equity and violations considerations. Omega (2016), http://dx.doi.org/10.1016/j.omega.2016.04.003i

M. Samà et al. / Omega ∎ (∎∎∎∎) ∎∎∎–∎∎∎ 17
Fig. 13 illustrates the Gantt chart of the 7 optimal ASP solutionsfor the numerical example (we note that the optimal solution forAvg Tardiness and Priority Equity is the same ASP schedule).
References
[1] Adler N, Liebert V, Yazhemsky E. Benchmarking airports from a managerialperspective. Omega 2013;41(2):442–58.
[2] Aktürk MS, Atamtürk A, Gürel S. Aircraft rescheduling with cruise speedcontrol. Operations Research 2014;62(4):829–45.
[3] Allahverdi A, Ng CT, Cheng TCE, Kovalyov MY. A survey of scheduling pro-blems with setup times or costs. European Journal of Operations Research2008;187(3):985–1032.
[4] Andreatta G, Capanna L, De Giovanni L, Monaci M, Righi L. Efficiency androbustness in integrated airport apron, a support platform for intelligent air-port ground handling. Journal of Intelligent Transportation Systems 2014;18(1):121–30.
[5] Andreatta G, Dell'Olmo P, Lulli G. An aggregate stochastic programming modelfor air traffic flow management. European Journal of Operations Research2011;215(3):697–704.
[6] Artiouchine K, Baptiste P, Dürr C. Runway sequencing with holding patterns.European Journal of Operational Research 2008;189(3):1254–66.
[7] Atkin JAD, Burke EK, Greenwood JS, Reeson D. Hybrid metaheuristics to aidrunway scheduling at London Heathrow airport. Transportation Science2007;41(1):90–106.
[8] Atkin JAD, Burke EK, Greenwood JS, Reeson D. On-line decision support fortake-off runway scheduling with uncertain taxi times at London Heathrowairport. Journal of Scheduling 2008;11(1):323–46.
[9] Atkin JAD, Maere GD, Burke EK, Greenwood JS. Addressing the pushback timeallocation problem at Heathrow airport. Transportation Science 2013;47(4):584–602.
[10] Balakrishnan H, Chandran B. Algorithms for scheduling runway operationsunder constrained position shifting. Operations Research 2010;58(6):1650–65.
[11] Ball MO, Barnhart C, Nemhauser G, Odoni A. Air transportation: irregularoperations and control. In: Laporte G, Barnhart C, editors, Handbooks inoperations research and management science, vol. 14; 2007. p. 1-67.
[12] Ball MO, Hoffman R, Mukherjee A. Ground delay program planning underuncertainty based on the ration-by-distance principle. Transportation Science2010;44(1):1–14.
[13] Barnhart C, Bertsimas D, Caramanis C, Fearing D. Equitable and efficientcoordination in traffic flow management. Transportation Science 2012;46(2):262–80.
[14] Barnhart C, Fearing D, Odoni A, Vaze V. Demand and capacity management inair transportation. EURO Journal of Transportation and Logistics 2012;1(1–2):135–55.
[15] Beasley JE, Krishnamoorthy M, Sharaiha YM, Abramson D. Displacementproblem and dynamically scheduling aircraft landings. Journal of OperationalResearch Society 2004;55:54–64.
[16] Beasley JE, Sonander J, Havelock P. Scheduling aircraft landings at LondonHeathrow using a population heuristic. Journal of Operational ResearchSociety 2001;52(1):483–93.
[17] Bertsimas D, Lulli G, Odoni A. An integer optimization approach to large-scaleair traffic flow management. Operations Research 2011;59(1):211–27.
[18] Bennell JA, Mesgarpour M, Potts CN. Airport runway scheduling. 4OR-Quarterly Journal of Operations Research 2011;9(2):115–38.
[19] Bianco L, Dell'Olmo P, Giordani S. Minimizing total completion time subject torelease dates and sequence-dependent processing times. Annals of OperationsResearch 1999;86:393–415.
[20] Bianco L, Dell'Olmo P, Giordani S. Scheduling models for air traffic control interminal areas. Journal of Scheduling 2006;9(3):180–97.
[21] Castelli L, Pesenti R, Ranieri A. The design of a market mechanism to allocateair traffic flow management slots. Transportation Research—Part C 2011;19(5):931–43.
[22] Churchill AM, Lovell DJ, Ball MO. Flight delay propagation impact on strategicair traffic flow management. Transportation Research Records 2010;2177:105–113.
[23] Clare G, Richards AG. Optimization of taxiway routing and runway scheduling.IEEE Transactions on Intelligent Transportation Systems 2011;12(4):1000–13.
[24] Clausen J, Larsen A, Larsen J. Disruption management in the airline industry—concepts, models and methods. Computers and Operations Research 2010;35(5):809–21.
[25] D'Ariano A, Pacciarelli D, Pranzo M. A branch and bound algorithm for sche-duling trains in a railway network. European Journal of Operations Research2007;183(2):643–57.
[26] D'Ariano, A, D'Urgolo, P, Pacciarelli D, Pranzo M. Optimal sequencing of air-crafts take-off and landing at a busy airport. In: Proceedings of the 13thinternational ieee annual conference on intelligent transportation systems,Madeira Island, Portugal; 2010. p. 1569–74.
[27] D'Ariano A, Pistelli M, Pacciarelli D. Aircraft retiming and rerouting in vicinityof airports. IET Intelligent Transport Systems 2012;6(4):433–43.
[28] D'Ariano A, Pacciarelli D, Pistelli M, Pranzo M. Real-time scheduling of aircraftarrivals and departures in a terminal maneuvering area. Networks 2015;65(3):212–27.
Please cite this article as: Samà M, et al. Scheduling models for optiequity and violations considerations. Omega (2016), http://dx.doi.org
[29] Dear, RG. The dynamic scheduling of aircraft in the near terminal area. FlightTransportation Laboratory (FTL) Report R76-9, Massachusetts Institute ofTechnology; 1976.
[30] Dear RG, Sherif YS. An algorithm for computer assisted sequencing andscheduling of terminal area operations. Transportation Research—Part A1991;25(2-3):129–39.
[31] Diffenderfer P, Tao Z, Payton G. Automated integration of arrival/departureschedules. In: Proceedings of the 10th USA/Europe air traffic managementresearch and development seminar (ATM 2013); 2013.
[32] Dorndorf U, Drexl A, Nikulin Y, Pesch E. Flight gate scheduling: state-of-the-art and recent developments. Omega 2007;35(3):326–34.
[33] Duygun M, Prior D, Shaban M, Tortosa-Ausina E. Disentangling the Europeanairlines efficiency puzzle: a network data envelopment analysis approach.Omega 2016;60(1):2–14.
[34] Ernst AT, Krishnamoorthy M, Storer RH. Heuristic and exact algorithms forscheduling aircraft landings. Networks 1999;34(3):229–41.
[35] Eun Y, Hwang I, Bang H. Optimal arrival flight sequencing and schedulingusing discrete airborne delays. IEEE Transactions on Intelligent TransportationSystems 2010;11(2):359–73.
[36] Eurocontrol. Airport collaborative decision-making. Accessed from ⟨http://www.euro-cdm.org/⟩; October 2011.
[37] Furini F, Kidd MP, Persiani CA, Toth P. Improved rolling horizon approaches tothe aircraft sequencing problem. Journal of Scheduling 2015;18(5):435–47.
[38] Glover CN, Ball MO. Stochastic optimization models for ground delay programplanning with equity-efficiency trade-offs. Transportation Research—Part C2013;33(1):196–202.
[39] Gröflin H, Klinkert A. A new neighborhood and tabu search for the blockingjob shop. Discrete Applied Mathematics 2009;157(17):3643–55.
[40] Grushka-Cockayne Y, Reyck BD, Degraeve Z. An integrated decision-makingapproach for improving European air traffic management. Management Sci-ence 2008;54(8):1395–409.
[41] Hall NG, Sriskandarajah C. A survey of machine scheduling problems withblocking and no-wait in process. Operations Research 1996;44(3):510–25.
[42] Hasevoets N, Conroy P. Arrival Manager-Implementation guidelines and les-sons learned. EUROCONTROL, Brussels. Technical report; 2010. p. 1–103.
[43] Hu X-B, Chen W-H. Receding horizon control for aircraft arrival sequencingand scheduling. IEEE Transactions on Intelligent Transportation Systems2005;6(2):189–97.
[44] Hu X-B, Di Paolo E. An efficient genetic algorithm with uniform crossover forair traffic control. Computers and Operations Research 2009;36(1):245–59.
[45] Kim J, Kröller A, Mitchell JSB, Sabhnani GR. Scheduling aircraft to reducecontroller workload. In: Clausen J, Di Stefano G, editors, Proceedings of the 9thworkshop on algorithmic approaches for transportation modeling, optimiza-tion, and systems (ATMOS 2009). Copenhagen, Denmark; 2009.
[46] Kohl N, Larsen A, Larsen J, Ross A, Tiourine S. Airline disruption management—perspectives, experiences and outlook. Journal of Air Transport Management2007;13(3):149–62.
[47] Kotynek B, Richetta O. Equitable models for the stochastic ground-holdingproblem under collaborative decision-making. Transportation Science2006;40(1):133–46.
[48] Kuchar JK, Yang LC. A review of conflict detection and resolution modelingmethods. IEEE Transactions on Intelligent Transportation Systems 2000;4(1):179–89.
[49] Kuhn KD. Ground delay program planning: delay, equity, and computationalcomplexity. Transportation Research Part C 2013;35(1):193–203.
[50] Lamorgese L, Mannino C. An exact decomposition approach for the real-timetrain dispatching problem. Operations Research 2015;63(1):48–64.
[51] Lieder A, Stolletz R. Scheduling aircraft take-offs and landings on inter-dependent and heterogeneous runways. Transportation Research Part E2016;88:167–88.
[52] Liu SQ, Kozan E. Scheduling trains with priorities: a no-wait blocking parallel-machine job-shop scheduling model. Transportation Science 2011;45(2):175–198.
[53] Manley B, Sherry L. Analysis of performance and equity in ground delayprograms. Transportation Research—Part C 2010;18(6):910–20.
[54] Marin AG. Airport management: taxi planning. Annals of Operations Research2006;143(1):191–202.
[55] Mascis A, Pacciarelli D. Job shop scheduling with blocking and no-wait con-straints. European Journal of Operations Research 2002;143(3):498–517.
[56] Mati Y, Xie X. Multiresource shop scheduling with resource flexibility andblocking. IEEE Transactions on Automation Science and Engineering 2011;8(1):175–89.
[57] Meloni C, Pacciarelli D, Pranzo M. A rollout metaheuristic for job shop sche-duling problems. Annals of Operations Research 2004;131(1–4):215–35.
[58] Mukherjee A, Hansen M. A dynamic stochastic model for the single airportground holding problem. Transportation Science 2007;41(1):444–56.
[59] Narciso ME, Piera MA. Robust gate assignment procedures from an airportmanagement perspective. Omega 2015;50(1):82–95.
[60] Pellegrini P, Castelli L, Pesenti R. Metaheuristic algorithms for the simultaneousslot allocation problem. IET Intelligent Transport Systems 2012;6(4):453–62.
[61] Pellegrini P, Rodriguez J. Single European sky and single European railwayarea: a system level analysis of air and rail transportation. TransportationResearch Part A 2013;57(1):64–86.
[62] Pranzo M, Pacciarelli D. An iterated greedy metaheuristic for the blocking jobshop scheduling problem. Journal of Heuristics Article 2016, http://dx.doi.org/10.1007/s10732-014-9279-5 (in press).
mal aircraft traffic control at busy airports: Tardiness, priorities,/10.1016/j.omega.2016.04.003i
M. Samà et al. / Omega ∎ (∎∎∎∎) ∎∎∎–∎∎∎18
[63] Psaraftis HN. A dynamic programming approach for sequencing identicalgroups of jobs. Operations Research 1980;28(6):1347–59.
[64] Sabar NR, Kendall G. An iterated local search with multiple perturbationoperators and time varying perturbation strength for the aircraft landingproblem. Omega 2015;56(1):88–98.
[65] Samà M, D'Ariano A, Pacciarelli D. Rolling horizon approach for aircraftscheduling in the terminal control area of busy airports. TransportationResearch Part E 2013;60(1):140–55.
[66] Samà M, D'Ariano A, D'Ariano P, Pacciarelli D. Optimal aircraft scheduling androuting at a terminal control area during disturbances. TransportationResearch Part C 2014;47(1):61–85.
[67] Samà M, D'Ariano A, D'Ariano P, Pacciarelli D. Air traffic optimization modelsfor aircraft delay and travel time minimization in terminal control areas.Public Transport: Planning and Operations 2015;7(3):321–37.
[68] Sherali HD, Hill JM, McCrea MV, Trani AA. Integrating slot exchange, safety,capacity, and equity mechanisms within an airspace flow program. Trans-portation Science 2011;45(2):271–84.
[69] Sherali HD, Smith JC, Trani AA. An airspace planning model for selecting flight-plans under workload, safety, and equity considerations. Transportation Sci-ence 2002;36(4):378–97.
Please cite this article as: Samà M, et al. Scheduling models for optiequity and violations considerations. Omega (2016), http://dx.doi.org
[70] Sherali HD, Staats RW, Trani AA. An airspace planning and collaborativedecision-making model: Part i—probabilistic conflicts, workload, and equityconsiderations. Transportation Science 2003;37(4):434–56.
[71] Sherali HD, Staats RW, Trani AA. An airspace-planning and collaborativedecision-making model: part ii—cost model, data considerations, and com-putations. Transportation Science 2006;40(2):147–64.
[72] Soomer MJ, Franx GJ. Scheduling aircraft landings using airlines' preferences.European Journal of Operations Research 2008;190(1):277–91.
[73] Sölveling G, Solak S, Clarke JB, Johnson EL. Scheduling of runway operationsfor reduced environmental impact. Transportation Research Part D 2010;16(2):110–20.
[74] Tielrooij M, Borst C, Van Paassen M.M, Mulder M. Predicting arrival timeuncertainty from actual flight information. In: Proceedings of the 11th USA/Europe air traffic management research and development seminar (ATM2015); 2015.
[75] Venkatakrishnan CS, Barnett A, Odoni AM. Landings at Logan airport:describing and increasing airport capacity. Transportation Science 1993;27(3):211–27.
mal aircraft traffic control at busy airports: Tardiness, priorities,/10.1016/j.omega.2016.04.003i


![[Webinar] Scheduling Classes for Optimal Results](https://img.pdfslide.net/doc/110x75/588997c01a28ab330e8b67d5/webinar-scheduling-classes-for-optimal-results.jpg)